Demonstrating the Impact of System Libraries on Student ...
27
Demonstrating the Relationship between Inputs to Academic Libraries in a System and Student Success Anne Cooper Moore, PhD, Dean, J. Murrey Atkins Library Rebecca Croxton, PhD, Head of Assessment, J. Murrey Atkins Library Southeastern Library Assessment Conference, November 7, 2019 https://go.uncc.edu/library_system
-
Upload
khangminh22 -
Category
Documents
-
view
1 -
download
0
Transcript of Demonstrating the Impact of System Libraries on Student ...
Demonstrating the Relationship between Inputs to
Academic Libraries in a System and Student Success Anne Cooper Moore, PhD, Dean, J. Murrey Atkins Library
Rebecca Croxton, PhD, Head of Assessment, J. Murrey Atkins Library
Southeastern Library Assessment Conference, November 7, 2019
https://go.uncc.edu/library_system

Research Questions1. Is there a common set of metrics that are collected across a diverse
academic library system?
2. Is there a source of student success metrics for a diverse academic
library system?
3. What is the relationship between inputs to both individual and groups
of academic libraries in a state system and student success?
4. How might academic libraries use input metrics in relationship to
student success measures?
5. What are the contributions of academic libraries to student success in
a system?
2
Study Goals
● Demonstrate academic library impact at a system level that aligns
with UNC System strategic goals.
● Align and analyze metrics across institutions with measures of
student success.
3

UNC System Peer Groupings4
UNC CharlotteUNC System Schools
UNC Charlotte
Appalachian State
East Carolina
Eliz City State
UNC WilmingtonUNC Pembroke
Fayetteville State
UNC Asheville
Western Carolina Univ.
NC State
NC Central
UNC Chapel Hill
School of Science & Math
NC A & T
UNC GreensboroWinston-Salem State
UNC School of the Arts
4
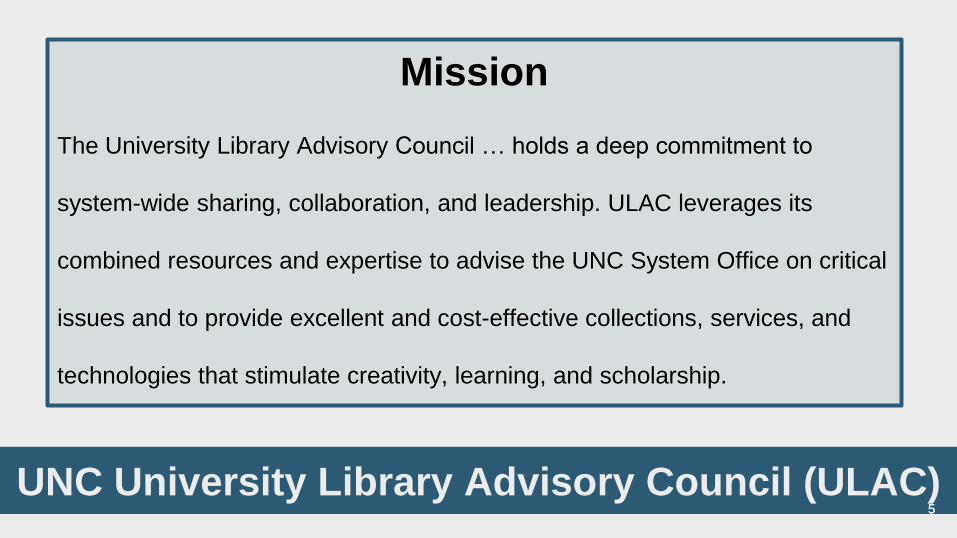
UNC University Library Advisory Council (ULAC)5
Mission
The University Library Advisory Council … holds a deep commitment to
system-wide sharing, collaboration, and leadership. ULAC leverages its
combined resources and expertise to advise the UNC System Office on critical
issues and to provide excellent and cost-effective collections, services, and
technologies that stimulate creativity, learning, and scholarship.
5

UNC System Peer Groupings6
UNC CharlotteUNC System Schools
UNC System
Strategic Goals (2017-2022)
1. Access
2. Affordability and
Efficiency
3. Student Success
4. Economic Impact and
Student Engagement
5. Excellent and Diverse
Institutions
ULAC 2018-2019
Strategic Plan
Goal 3
Enhance our ability to
utilize learning
analytics through the
use of data to
demonstrate the
impact of System
libraries on student
success.
ULAC 2018-2019
Strategic Plan
Goal 3, Obj. 3
Develop a consistent
methodology to
enhance our ability to
utilize learning
analytics through the
use of ACRL and
other data sources to
demonstrate the
impact of System
libraries on student
success.
6

UNC Charlotte Student Engagement & Success Study
Institutional
Research
Student
Affairs
LibrarySpeaking
Center
Writing
CenterCareer
Center
Center for
Academic
Excellence
UNC Charlotte
Student Success &
Engagement Study
7
7
UNC System Peer Groupings8
UNC CharlotteUNC System8
UNC System Peer Groupings9
UNC CharlotteUNC System
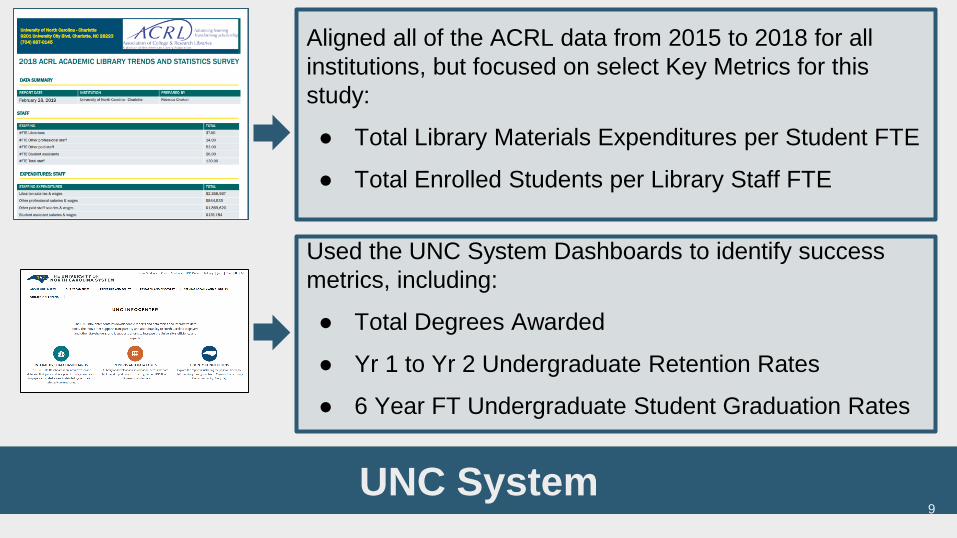
Aligned all of the ACRL data from 2015 to 2018 for all
institutions, but focused on select Key Metrics for this
study:
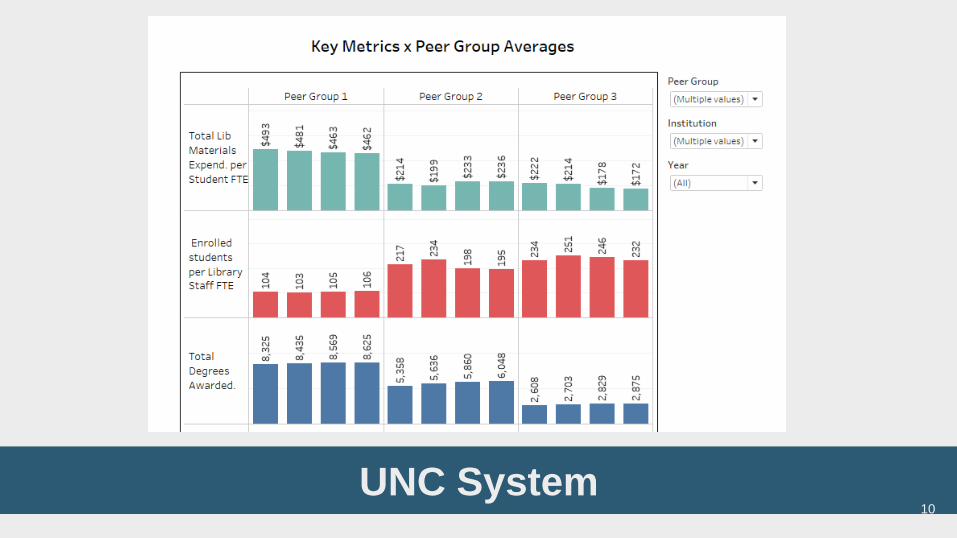
● Total Library Materials Expenditures per Student FTE
● Total Enrolled Students per Library Staff FTE
Used the UNC System Dashboards to identify success
metrics, including:
● Total Degrees Awarded
● Yr 1 to Yr 2 Undergraduate Retention Rates
● 6 Year FT Undergraduate Student Graduation Rates
9
UNC System Peer Groupings10
UNC CharlotteUNC System10

11
UNC Charlotte & Peer Comparisons11
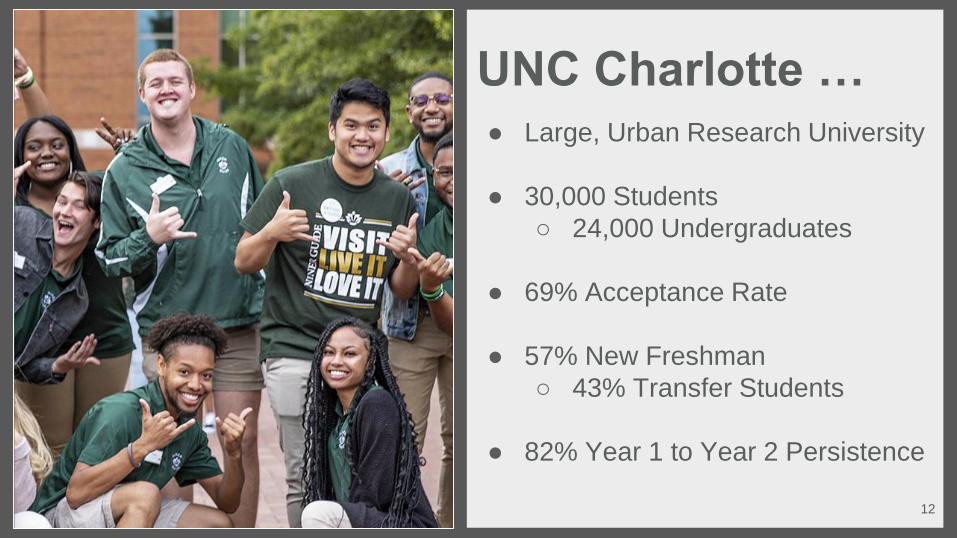
UNC Charlotte …● Large, Urban Research University
● 30,000 Students
○ 24,000 Undergraduates
● 69% Acceptance Rate
● 57% New Freshman
○ 43% Transfer Students
● 82% Year 1 to Year 2 Persistence
12

UNC System Peer Groupings13
UNC Charlotte
2015 2016 2017 2018 % Change
Total Library Materials per
Student FTE
$194 $182 $163 $187 -3.6%
Enrolled Students per Library
Staff FTE
311 308 227 229 -26.4%
Number of Titles (Physical +
Electronic) per Student FTE
111 80 96 85 -23.4%
Total Degrees Awarded 6,228 6,961 6,978 7,241 +16.3%
6-Year Graduation Rate 53.2% 56.7% 53.9% 58.9% +10.7%
Yr 1 to Yr 2 Retention Rates 83.5% 82.5% 83.3% 81.9% -1.9%
Library budgets
have decreased,
while total degrees
awarded, and
graduate rates
have increased.
Library budgets
have decreased,
while total degrees
awarded, and
graduate rates
have increased.
13
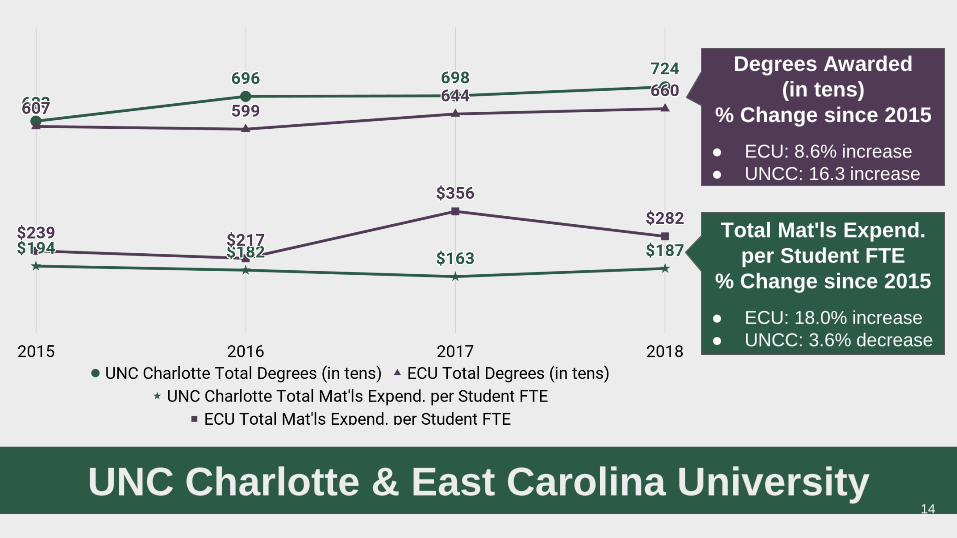
UNC Charlotte & East Carolina University14
Total Mat'ls Expend.
per Student FTE
% Change since 2015
● ECU: 18.0% increase
● UNCC: 3.6% decrease
Degrees Awarded
(in tens)
% Change since 2015
● ECU: 8.6% increase
● UNCC: 16.3 increase
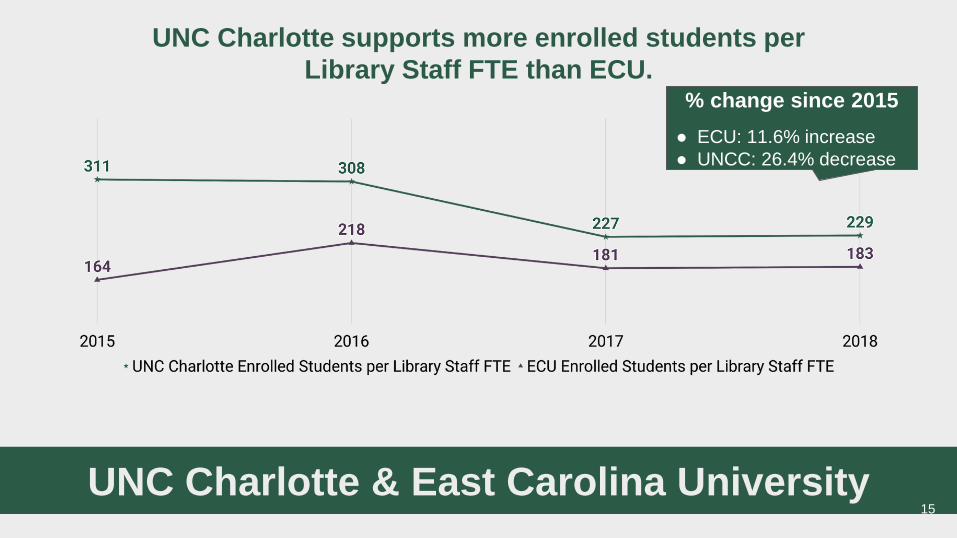
UNC Charlotte & East Carolina University15
UNC Charlotte supports more enrolled students per
Library Staff FTE than ECU.% change since 2015
● ECU: 11.6% increase
● UNCC: 26.4% decrease

16
UNC System Peer Comparisons16

UNC System Peer Groupings17
Group 1 Group 2 Group 3
● NC State University
● UNC Chapel Hill
● East Carolina University
● UNC Charlotte
● UNC Greensboro
● NC A & T♦,*
● Appalachian State Univ.
● NC Central University♦
● UNC Pembroke
● UNC Wilmington
● Western Carolina Univ.
Group 4 Group 5 Group 6
● Fayetteville State*
● Winston Salem St.♦,*
● Elizabeth City State Univ.♦
● UNC Asheville
● UNC School of the Arts
● North Carolina School of
Science and Mathematics
♦HBCU
*Not included in analysis due to missing data.
17
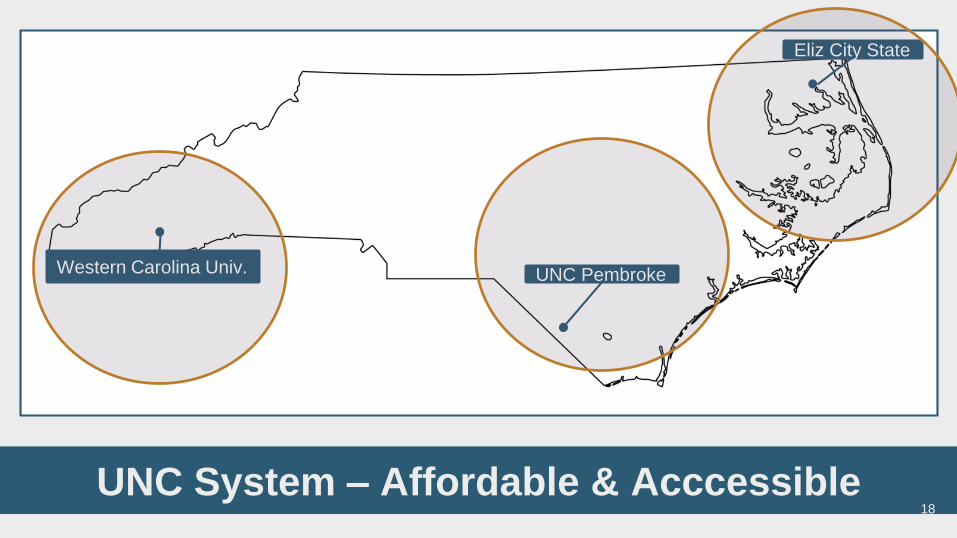
UNC System Peer Groupings18
UNC CharlotteUNC System – Affordable & Acccessible
Eliz City State
UNC PembrokeWestern Carolina Univ.
18
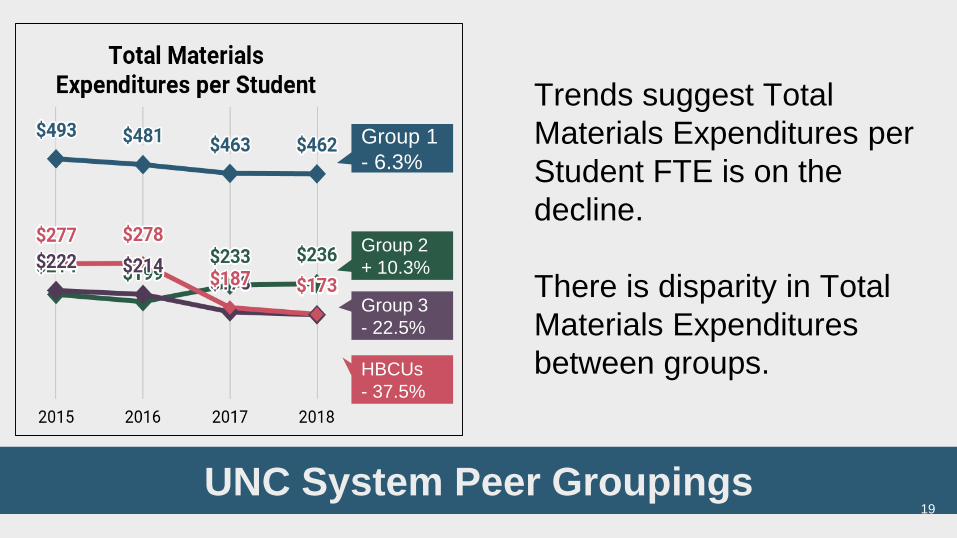
UNC System Peer Groupings19
Group 1
- 6.3%
Group 2
+ 10.3%
Group 3
- 22.5%
Group 1
+ 3.6%
Group 2
+ 12.9%
Group 3
+ 10.2%
HBCUs
- 24.2%HBCUs
- 37.5%
Trends suggest Total
Materials Expenditures per
Student FTE is on the
decline.
There is disparity in Total
Materials Expenditures
between groups.

UNC System Peer Groupings20
Group 1
- 6.3%
Group 2
+ 10.3%
Group 3
- 22.5%
Group 1
+ 3.6%
Group 2
+ 12.9%
Group 3
+ 10.2%
HBCUs
- 24.2%HBCUs
- 37.5%
Total Degrees Awarded is
on the rise across
institutions, particularly for
Groups 2 and 3.
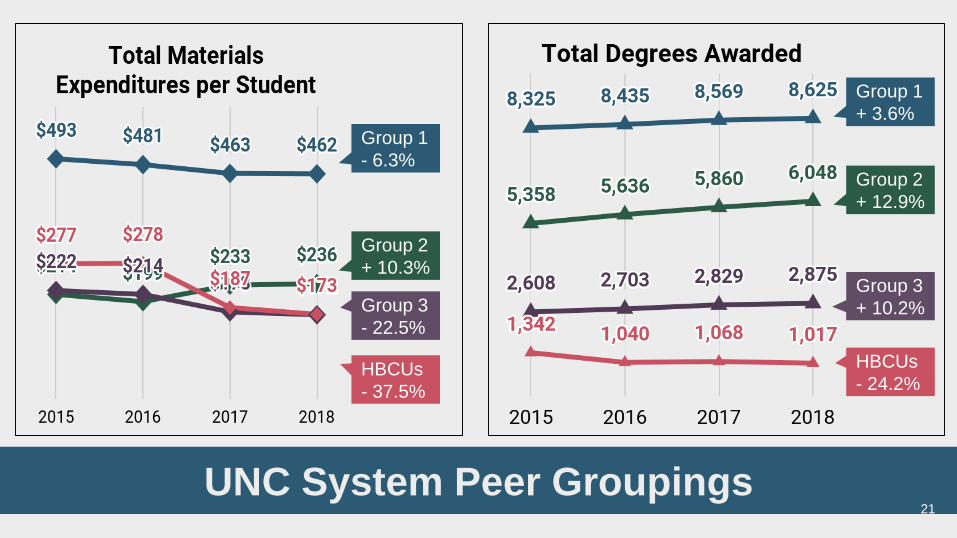
UNC System Peer Groupings21
Group 1
- 6.3%
Group 2
+ 10.3%
Group 3
- 22.5%
Group 1
+ 3.6%
Group 2
+ 12.9%
Group 3
+ 10.2%
HBCUs
- 24.2%HBCUs
- 37.5%

UNC System Peer Groupings22
Group 1
+ 1.9%
Group 2
- 10.1%
Group 3
- 0.9%
Enrolled Students
per Library Staff
FTE has remained
relatively stable.
There is disparity
between Group 1
compared to
Groups 2, 3, &
HBCUs.
Group 3
- 6.1%
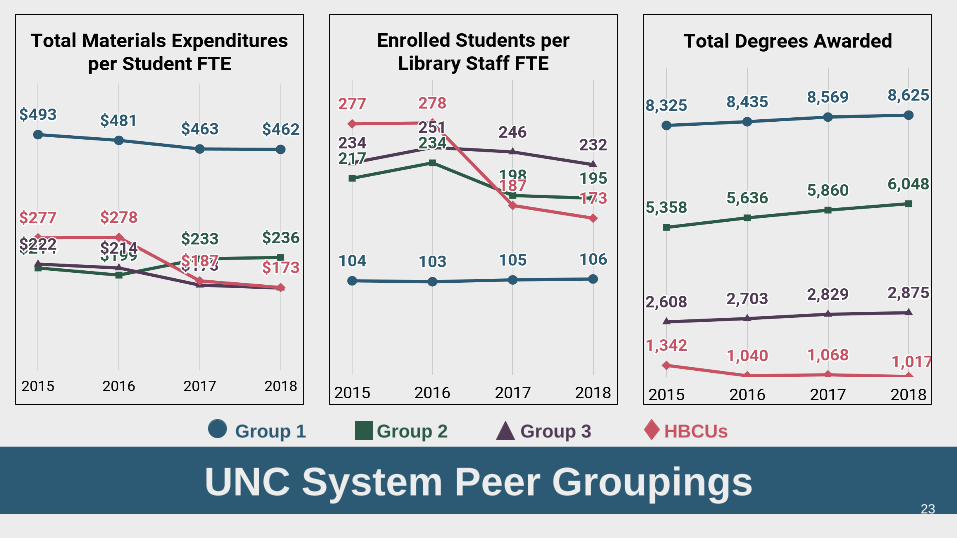
UNC System Peer Groupings23
Group 1 Group 2 Group 3 HBCUs

,
24
How can universities use these findings? 24
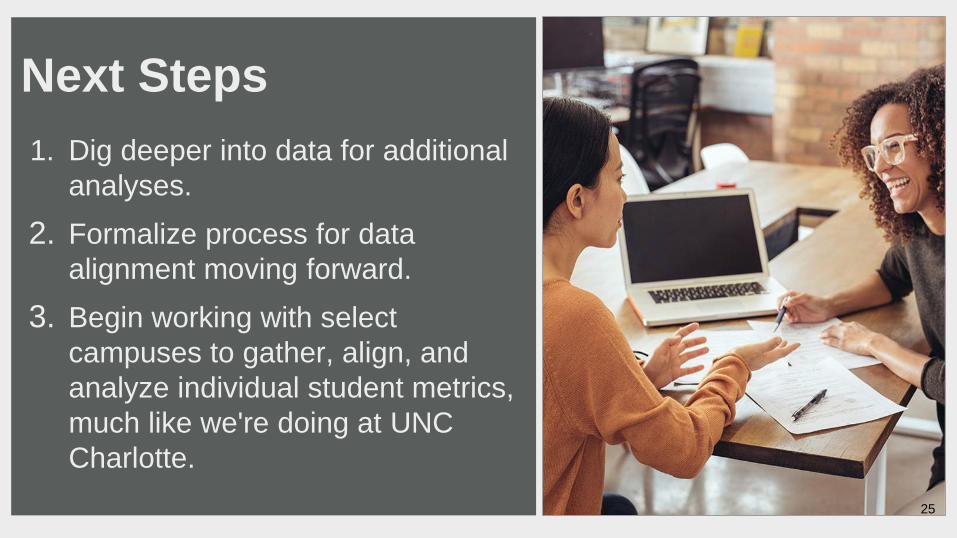
Next Steps
1. Dig deeper into data for additional
analyses.
2. Formalize process for data
alignment moving forward.
3. Begin working with select
campuses to gather, align, and
analyze individual student metrics,
much like we're doing at UNC
Charlotte.
25
ReferencesACRL. (2019). Academic Library Trends and Statistics Survey. Retrieved from
https://acrl.countingopinions.com/
National Center for Education Statistics, Institute of Education Sciences. (2018). Fast facts:
Graduation rates. Retrieved from https://nces.ed.gov/fastfacts/display.asp?id=40
University of North Carolina System. (2019). Affordable Education for All. Retrieved from
https://affordableeducation.org/
University of North Carolina System. (2018). UNC Infocenter. Retrieved from
https://www.northcarolina.edu/infocenter
UNC University Library Advisory Council. (2019). Home. Retrieved from
http://libguides.ecu.edu/ULAC
26

Rebecca Croxton, Head of Assessment
Anne Cooper Moore, Dean
27