DEMAND INFLUENCE ON TOURIST ACCOMMODATION CAPACITY DEVELOPMENT
111
NEGOTIA 4/2010
Transcript of DEMAND INFLUENCE ON TOURIST ACCOMMODATION CAPACITY DEVELOPMENT

NEGOTIA4/2010
The current issue of Studia Negotia is dedicated to the papers presented at
THE INTERNATIONAL CONFERENCE
ENTREPRENEURSHIP IN THE
HOSPITALITY
INDUSTRY
First Edition
2010, October 14 - 15 Cluj-Napoca, România
Organized by the Faculty of Business


ANUL LV 2010
S T U D I A
UNIVERSITATIS BABE Ş-BOLYAI
NEGOTIA
4
Desktop Editing Office: 51ST B.P. Hasdeu, Cluj-Napoca, Romania, Phone + 40 264-40.53.52
CUPRINS – CONTENT – SOMMAIRE – INHALT
SUZANA MARKOVIĆ, SANJA RASPOR, Investigating the Perceived Service Quality in Croatian Restaurant Industry Using Dineserv Model ........................... 5
MEDET YOLAL, Blooming Tulip: A Decade of Turkish Tourism ...................... 15
CARMEN BĂBĂIłĂ, ANDREIA ISPAS, RALUCA FLORENTINA GHENESCU, ALEXANDRA HĂLĂLĂU, E-Tourism – An Important Element Between Hotel and Travel Agency Professional Relationship ........................................ 25
IULIANA POP, ANDREEA MARIN- PANTELESCU, Analyzing the Changes in Reasons for Travel of the Romanian Tourists .............................................. 35
ALEXANDRA ZBUCHEA, MIHAELA DINU, Romanian Students as Cultural Tourists ............................................................................................................. 43
ADINA LETIłIA NEGRUŞA, OANA ADRIANA GICĂ, CARMEN MARIA GUł, Demand Influence on Tourist Accommodation Capacity Development..... 53
OVIDIU I. MOISESCU, An Empirical Investigation of Romania's Country Brand as Tourism Destination................................................................................ 67

CRISTINA BALINT, MIHAELA TUTUNEA, The Online Presence of the Hotel Units: Comparative Study Between Cluj-Napoca and Bucharest........... 77
ALEXANDRA URCAN, SMARANDA COSMA, Benchmarking Elements for Cluj-Napoca Hotel Industry.............................................................................. 85
MIHAI FLORIN TALPOS, Modern Solutions for Online Promotion of Tourism Offers................................................................................................ 103
STUDIA UNIVERSITATIS BABEŞ-BOLYAI, NEGOTIA, LV, 4, 2010
INVESTIGATING THE PERCEIVED SERVICE QUALITY IN CROATIAN RESTAURANT INDUSTRY USING DINESERV MODEL
SUZANA MARKOVIĆ1, SANJA RASPOR2
ABSTRACT. The purpose of this study is to assess perceptions of restaurant customers and to determine the factor structure of perceived restaurant service quality. A modified DINESERV model was applied. The model was tested on the sample of 32 restaurants on the Opatija Riviera (Croatia), resulting with 156 usable questionnaires on which statistical analysis was performed. Results suggest a rather high perceived service quality, explained with two main dimensions, namely “overall dining experience” and “restaurant ambience”. Key words: service quality, DINESERV, statistical analysis, restaurant industry. JEL classification: C49, M31
1. INTRODUCTION As a concept, service quality has received much attention due to its
sustainability as a source of competitive advantage. Moreover, in marketing literature, perceived service quality has been accepted as an antecedent of customer satisfaction (Oliver, 1997). In this context, several researchers have investigated the relationship between service quality and customer satisfaction in restaurant settings (Kim et al., 2009; Liu and Jang, 2009; Wu and Liang, 2009). Based on these studies, the most important restaurant attributes are food, service and environment.
The purpose of this study is to provide an insight to customers’ perceptions of the restaurant service level. It serves as a diagnostic tool for the Croatian restaurant industry. The objectives of this study are to measure customers’ perceptions of service quality based on the modified DINESERV model and to determine specific dimensions of perceived restaurant service quality.
2. PERCEIVED SERVICE QUALITY: CONCEPTUALIZATION AND MEASUREMENT
Discussions of the conceptualization and measurement of perceived service quality center around three constructs: expectations, perceived performance and disconfirmation (Parasuraman et al, 1988; Bolton and Drew, 1991). 1 Ph.D., Associate Professor, Faculty of Tourism and Hospitality Management Opatija, Croatia,
E-mail: [email protected] 2 M.Sc., Assistant, Polytechnic of Rijeka, Croatia, E-mail: [email protected]
SUZANA MARKOVIĆ, SANJA RASPOR
6
Expectations are beliefs about the level of service that will be delivered by a service provider. They provide standards of reference against which the delivered service is compared (Zeithaml et al., 1993). Further, perceived performance represents customers’ subjective views of the level of received service (Parasuraman et al., 1985; Cronin and Taylor, 1992). It has been empirically shown that perceived performance has a strong, positive relationship with perceived service quality (Cronin and Taylor, 1992; Ferrell et al. 2001; Brady and Cronin, 2001). On the other hand, disconfirmation represents the relationship between expectations and perceived performance. This relationship is in the literature usually conceptualized as a gap. In this context, perceived service quality is the extent of discrepancy between customers’ expectations and their perceptions of performance (Zeithaml et al., 1990). This implies that a customer who perceives a positive disconfirmation (e.g. performance was greater than expected) would perceive a service provider as one that delivers higher quality than a customer who perceives a negative disconfirmation.
Perceived service quality can be defined as a global judgment or attitude relating to the superiority of a service relative to competing offerings (Parasuraman et al., 1988). According to Zeithaml et al. (1990), perceived service quality is the extent to which a firm successfully serves the purpose of customers. Several researchers have examined elements that may have an impact on the perceptions of service quality. Among others, customers’ perceived service quality may be influenced by customers’ experience with a particular service (O’Neill and Palmer, 2003; Edvardsson, 2005), customers’ expectations (Ghobadian et al., 1994), the delivery process (Ghobadian et al., 1994; Edvardsson, 2005) and emotions (Edvardsson, 2005). Yoo and Park (2007) found out that employees are a critical element in enhancing perceived service quality.
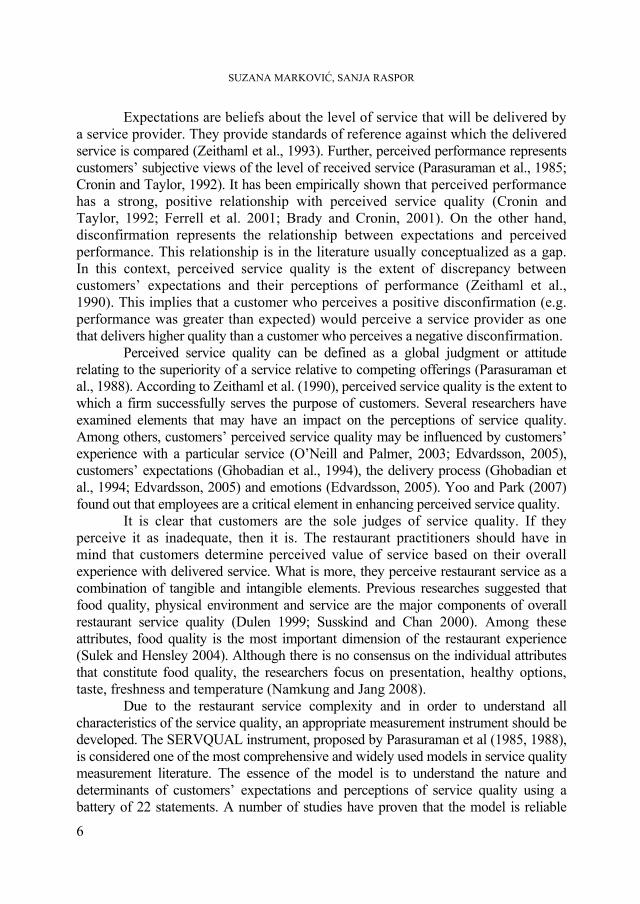
It is clear that customers are the sole judges of service quality. If they perceive it as inadequate, then it is. The restaurant practitioners should have in mind that customers determine perceived value of service based on their overall experience with delivered service. What is more, they perceive restaurant service as a combination of tangible and intangible elements. Previous researches suggested that food quality, physical environment and service are the major components of overall restaurant service quality (Dulen 1999; Susskind and Chan 2000). Among these attributes, food quality is the most important dimension of the restaurant experience (Sulek and Hensley 2004). Although there is no consensus on the individual attributes that constitute food quality, the researchers focus on presentation, healthy options, taste, freshness and temperature (Namkung and Jang 2008).
Due to the restaurant service complexity and in order to understand all characteristics of the service quality, an appropriate measurement instrument should be developed. The SERVQUAL instrument, proposed by Parasuraman et al (1985, 1988), is considered one of the most comprehensive and widely used models in service quality measurement literature. The essence of the model is to understand the nature and determinants of customers’ expectations and perceptions of service quality using a battery of 22 statements. A number of studies have proven that the model is reliable
INVESTIGATING THE PERCEIVED SERVICE QUALITY …
7
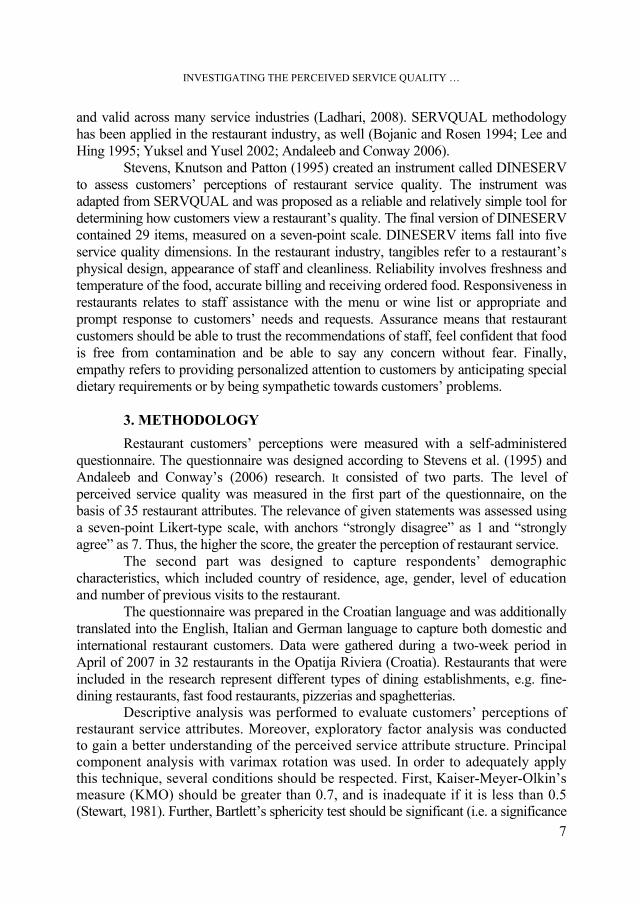
and valid across many service industries (Ladhari, 2008). SERVQUAL methodology has been applied in the restaurant industry, as well (Bojanic and Rosen 1994; Lee and Hing 1995; Yuksel and Yusel 2002; Andaleeb and Conway 2006).
Stevens, Knutson and Patton (1995) created an instrument called DINESERV to assess customers’ perceptions of restaurant service quality. The instrument was adapted from SERVQUAL and was proposed as a reliable and relatively simple tool for determining how customers view a restaurant’s quality. The final version of DINESERV contained 29 items, measured on a seven-point scale. DINESERV items fall into five service quality dimensions. In the restaurant industry, tangibles refer to a restaurant’s physical design, appearance of staff and cleanliness. Reliability involves freshness and temperature of the food, accurate billing and receiving ordered food. Responsiveness in restaurants relates to staff assistance with the menu or wine list or appropriate and prompt response to customers’ needs and requests. Assurance means that restaurant customers should be able to trust the recommendations of staff, feel confident that food is free from contamination and be able to say any concern without fear. Finally, empathy refers to providing personalized attention to customers by anticipating special dietary requirements or by being sympathetic towards customers’ problems.
3. METHODOLOGY Restaurant customers’ perceptions were measured with a self-administered
questionnaire. The questionnaire was designed according to Stevens et al. (1995) and Andaleeb and Conway’s (2006) research. It consisted of two parts. The level of perceived service quality was measured in the first part of the questionnaire, on the basis of 35 restaurant attributes. The relevance of given statements was assessed using a seven-point Likert-type scale, with anchors “strongly disagree” as 1 and “strongly agree” as 7. Thus, the higher the score, the greater the perception of restaurant service.
The second part was designed to capture respondents’ demographic characteristics, which included country of residence, age, gender, level of education and number of previous visits to the restaurant.
The questionnaire was prepared in the Croatian language and was additionally translated into the English, Italian and German language to capture both domestic and international restaurant customers. Data were gathered during a two-week period in April of 2007 in 32 restaurants in the Opatija Riviera (Croatia). Restaurants that were included in the research represent different types of dining establishments, e.g. fine-dining restaurants, fast food restaurants, pizzerias and spaghetterias.
Descriptive analysis was performed to evaluate customers’ perceptions of restaurant service attributes. Moreover, exploratory factor analysis was conducted to gain a better understanding of the perceived service attribute structure. Principal component analysis with varimax rotation was used. In order to adequately apply this technique, several conditions should be respected. First, Kaiser-Meyer-Olkin’s measure (KMO) should be greater than 0.7, and is inadequate if it is less than 0.5 (Stewart, 1981). Further, Bartlett’s sphericity test should be significant (i.e. a significance

SUZANA MARKOVIĆ, SANJA RASPOR
8
value should be less than 0.05) (Leech et al., 2005). Finally, items with eigenvalues equal or greater than 1, factor loadings above 0.4, and factors, which contain at least three items, were retained (Hair et al., 2006). To test the reliability of the scale and to assess the internal consistency of each extracted factor, Cronbach’s alpha coefficients were calculated. Coefficients higher than 0.6 were considered acceptable, indicating reasonable internal consistency reliability (Hair et al., 2006).
4. STUDY RESULTS In order to achieve the study's goals, descriptive analysis, factor analysis, and
reliability analysis were performed. The profile of survey respondents is presented next. The analysis was conducted on 156 valid questionnaires. The sample included
domestic (65.4 per cent) and international customers (34.6 per cent). There were slightly more males (50.6 per cent) than females (49.4 per cent). The majority of them (61.0 per cent) were older than 36. More than half of the respondents had university or college qualifications, and 66 per cent of restaurant customers had visited a particular restaurant two or more times.
The results of descriptive statistical analysis of guests’ perceptions in the restaurants are shown in Table 1.
Table 1. Average scores of customers’ perceptions in restaurant settings
Attributes Mean St. dev.
V1 - Visually attractive parking areas and building exteriors. 4.99 1.81 V2 - Visually attractive dining area. 5.33 1.65 V3 - Clean, neat and appropriately dressed staff. 5.81 1.31 V4 - Restaurant’s decor typical to its image and price range. 5.78 1.34 V5 - Easily readable menu. 5.94 1.08 V6 - Visually attractive menu. 5.69 1.32 V7 - Comfortable dining area. 5.55 1.53 V8 - Clean rest rooms. 5.47 1.68 V9 - Clean dining areas. 5.66 1.60 V10 - Comfortable seats in the dining room. 5.37 1.54 V11 - Service in the promised time. 5.61 1.37 V12 - Quick correction of wrong service. 5.54 1.43 V13 - Dependable and consistent restaurant. 5.57 1.47 V14 - Accurate bill. 6.23 1.12 V15 - Error-free served order (food). 5.92 1.29 V16 - Maintaining speed and quality of service during busy times. 5.19 1.55 V17 - Provision of prompt service. 5.57 1.42 V18 - Extra effort for handling special requests. 5.51 1.51 V19 - Employees can answer questions completely. 5.62 1.52 V20 - Comfortable and confident feeling 5.64 1.50 V21 – Staff provide information about menu items, their ingredients, and method of preparation. 5.61 1.56
V22 - Feeling safe. 5.59 1.49 V23 - Well-trained, competent and experienced staff. 5.65 1.47

INVESTIGATING THE PERCEIVED SERVICE QUALITY …
9
Attributes Mean St. dev. V24 - Restaurant supports the employees. 5.54 1.45 V25 - Employees provide individual attention. 5.62 1.44 V26 - Special feeling. 5.51 1.60 V27 - Anticipation of customers’ individual needs and wants. 5.21 1.67 V28 - Sympathetic and reassuring employees. 5.43 1.44 V29 - Customers' best interests at heart. 5.51 1.50 V30 - Expensive food items. 4.16 1.99 V31 - Paying more than planned. 3.84 1.99 V32 - Overall satisfaction with dining experience. 5.57 1.58 V33 - Returning to the restaurant. 5.58 1.68 V34 - Recommending the restaurant to others. 5.60 1.69 V35 - Excellent quality of service. 5.69 1.55 Overall mean for 35 attributes 5.49 Note: Perceptions mean ranges from 1 to 7; St. dev. – Standard deviation Source: Authors
Customers’ perceptions are measured on a seven point Likert-type scale, where the higher the score, the greater the perception of restaurant service. The mean scores of customers’ perceptions ranged from 3.84 to 6.23. The lowest perception items were “paying more than planned” and “expensive food items”, which indicate that restaurant customers did not pay more than they planned to and that prices in restaurants are not high. On the other hand, customers’ highest perceptions were regarding the “accurate bill”, “easily readable menu”, “error-free served order (food)” and ”clean, neat and appropriately dressed staff”. The overall mean score for service quality perceptions items was 5.49. This score indicates rather high perceptions of restaurant customers regarding service quality.
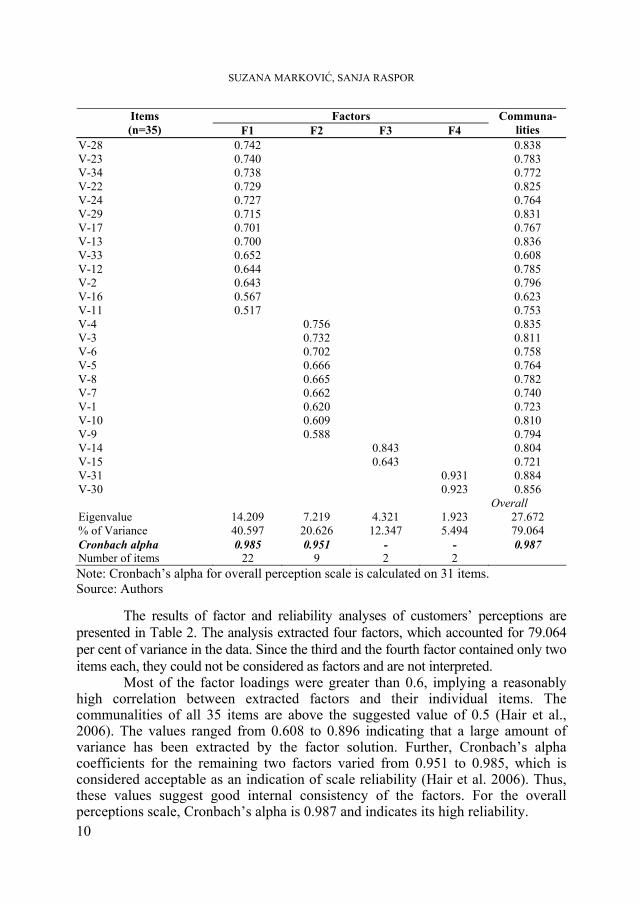
The 35 service attributes were factor analyzed using principal component analysis with varimax rotation. The purpose was to identify the main dimensions of service quality perceptions in restaurant settings. KMO value is high and scores 0.955, indicating sufficient items for each extracted factor. Bartlett’s Test is significant (χ2=7382.684, df=595, Sig.=0.000) meaning that there are strong correlations between the items in each factor. Hence, it is justified to conduct exploratory factor analysis.
Table 2. Factor analysis and reliability analysis results of restaurant customers’ perceptions
Factors Items (n=35) F1 F2 F3 F4
Communa- lities
V-20 0.852 0.896 V-26 0.847 0.834 V-19 0.815 0.794 V-27 0.798 0.797 V-18 0.788 0.815 V-35 0.785 0.863 V-25 0.783 0.804 V-21 0.781 0.781 V-32 0.742 0.827
SUZANA MARKOVIĆ, SANJA RASPOR
10
Factors Items (n=35) F1 F2 F3 F4
Communa- lities
V-28 0.742 0.838 V-23 0.740 0.783 V-34 0.738 0.772 V-22 0.729 0.825 V-24 0.727 0.764 V-29 0.715 0.831 V-17 0.701 0.767 V-13 0.700 0.836 V-33 0.652 0.608 V-12 0.644 0.785 V-2 0.643 0.796 V-16 0.567 0.623 V-11 0.517 0.753 V-4 0.756 0.835 V-3 0.732 0.811 V-6 0.702 0.758 V-5 0.666 0.764 V-8 0.665 0.782 V-7 0.662 0.740 V-1 0.620 0.723 V-10 0.609 0.810 V-9 0.588 0.794 V-14 0.843 0.804 V-15 0.643 0.721 V-31 0.931 0.884 V-30 0.923 0.856 Overall Eigenvalue 14.209 7.219 4.321 1.923 27.672 % of Variance 40.597 20.626 12.347 5.494 79.064 Cronbach alpha 0.985 0.951 - - 0.987 Number of items 22 9 2 2 Note: Cronbach’s alpha for overall perception scale is calculated on 31 items. Source: Authors
The results of factor and reliability analyses of customers’ perceptions are presented in Table 2. The analysis extracted four factors, which accounted for 79.064 per cent of variance in the data. Since the third and the fourth factor contained only two items each, they could not be considered as factors and are not interpreted.
Most of the factor loadings were greater than 0.6, implying a reasonably high correlation between extracted factors and their individual items. The communalities of all 35 items are above the suggested value of 0.5 (Hair et al., 2006). The values ranged from 0.608 to 0.896 indicating that a large amount of variance has been extracted by the factor solution. Further, Cronbach’s alpha coefficients for the remaining two factors varied from 0.951 to 0.985, which is considered acceptable as an indication of scale reliability (Hair et al. 2006). Thus, these values suggest good internal consistency of the factors. For the overall perceptions scale, Cronbach’s alpha is 0.987 and indicates its high reliability.

INVESTIGATING THE PERCEIVED SERVICE QUALITY …
11
The two-factor solution is labeled as follows: Factor 1 - “overall dinning experience”: contains 22 items and is the most
important factor as it explains 40.6 per cent of the total variance. It had an eigenvalue of 14.2. The factor comprises all aspects of restaurant service, including appearance of the dining area, staff knowledge and courtesy, ability of performing error-free service at promised time, providing individual attention, customers’ safety and satisfaction.
Factor 2 - “restaurant ambience”: included nine items explaining 20.6 per cent of the variance. It had an eigenvalue of 7.2. This factor refers to restaurants’ cleanliness, comfort, attractiveness and decoration.
5. CONCLUSION Perceived quality represents customers’ subjective evaluation of the level
of product and service performance. Consumer’s perceptions of individual elements of service are influenced by a broader context in which the service is performed. For example, the perception of meal quality in a restaurant can be, among other things, influenced by restaurant ambience and staff quality. In order to deliver superior quality, value and satisfaction to the customers, restaurant managers should understand customers’ perceptions, needs and preferences.
The present study has attempted to empirically evaluate customers’ perceptions of restaurant service attributes. The overall mean score for service quality perceptions attributes was 5.49. This score indicates that Croatian restaurants, as a whole, performed rather well. The top attributes were “accurate bill”, “easily readable menu“, “error-free served order (food)” and “clean, neat and appropriately dressed staff”.
The findings also revealed that the main dimensions of perceived service quality in restaurant settings are “overall dining experience” and “restaurant ambience”. Thus, restaurant customers assess quality of service based on the physical environment (internal and external), service outcome and on the process of service delivery.
REFERENCES
1. Andaleeb, S. S., Conway C. (2006). Customer satisfaction in the restaurant industry: an examination of the transaction-specific model. Journal of Services Marketing, 20 (1): 3-11.
2. Bojanic, D. C., Rosen, L. D. (1994). Measuring service quality in restaurants: an application of the SERVQUAL instrument. Hospitality Research Journal, 18: 3-14.
3. Brady, M. K., Cronin, J. (2001). Some new thoughts on conceptualizing PSQ: a hierarchical approach. Journal of Marketing, 65: 34-49.
4. Cronin, J. J., Taylor, S. A. (1992). Measuring Service Quality: A Reexamination and Extension. Journal of Marketing, 56 (3): 55-68.
5. Dulen, J. (1999). Quality control. Restaurant & Institutions, 109 (5): 38-52.
SUZANA MARKOVIĆ, SANJA RASPOR
12
6. Edvardsson, B. (2005). Service quality: beyond cognitive assessment. Managing Service Quality, 15 (2): 127-131.
7. Ferrell, A. M., Souchon, A. L., Durden, G. R. (2001). Service encounter conceptualization: employees’ service behaviors and customers’ service quality perceptions. Journal of Marketing Management, 17: 577-593.
8. Ghobadian, A., Speller, S., Jones, M. (1994). Service Quality: Concepts and Models. International Journal of Quality & Reliability Management, 11 (9): 43-66.
9. Hair, J. F., Black, W. C., Babin, B. J., Anderson, R. E., Tatham, R.L. (2006). Multivariate Data Analysis, 6th Edition, New Jersey: Pearson Prentice Hall, Upper Saddle River.
10. Kim, W. G. K., Ng, C. Y. N., Kim, Y. (2009). Influence of institutional DINESERV on customer satisfaction, return intention and word-of-mouth. International Journal of Hospitality Management, 28: 10-17.
11. Ladhari, R. (2008). Alternative measures of service quality: a review. Managing Service Quality, 18 (1): 65-86.
12. Lee, Y. L., Hing, N. (1995). Measuring quality in restaurant operations: an application of the SERVQUAL instrument. International Journal of Hospitality Management, 14 (3-4): 293-310.
13. Leech, N. L., Barrett, K. C., Morgan, G. A. (2005). SPSS for Intermediate Statistics: Use and Interpretation, 2nd Edition, New Jersey: Lawrence Erlbaum Associates Publishers.
14. Liu, Y., Jang. S. (2009). Perceptions of Chinese restaurants in the U. S.: What affects customer satisfaction and behavioral intention? International Journal of Hospitality Management, 28: 338-348.
15. Namkung, Y., Jang, S. (2008). Are highly satisfied restaurant customers really different? A quality perception perspective. Internationa Journal of Contemporary Hospitality Management, 20 (2): 142-155.
16. Oliver, R. L. (1997). Satisfaction: A Behavioral Perspective on the Consumer. New York: McGraw-Hill.
17. O'Neill, M., Palmer, A. (2003). An exploratory study of the effects of experience in consumer perceptions of the service quality construct. Managing Service Quality, 13 (2): 187-196.
18. Parasuraman, A., Berry, L. L., Zeithaml, V. A. (1985). A conceptual model of service quality and its implications for future research. Journal of Marketing, 4: 41-50.
19. Parasuraman, A., Zeithaml, V. A., Berry, L. L. (1988). SERVQUAL: A multiple-item scale for measuring consumer perceptions of service quality. Journal of Retailing, 64 (1): 14-40.
20. Stevens, P., Knutson, B., Patton, M. (1995). DINESERV: A Tool for Measuring Service Quality in Restaurants. The Cornell Hotel and Restaurant Administration Quarterly, 36 (2): 56-60.
21. Stewart, D. W. (1981). The Application and Misapplication of Factor Analysis in Marketing Research. Journal of Marketing Research, 18 (1): 51-62.
22. Sulek, J. M., Hensley, R. L. (2004). The relative importance of food, atmosphere and fairness of wait. The Cornell Hotel and Restaurant Administration Quarterly, 45 (3): 235-247.

INVESTIGATING THE PERCEIVED SERVICE QUALITY …
13
23. Susskind, A. M., Chan, E. K. (2000). How restaurant features affect check averages: a study of the Toronto restaurant market. The Cornell Hotel and Restaurant Administration Quarterly, 41 (6): 56.63.
24. Wu, C. H., Liang, R. (2009). Effect of experiential value on customer satisfaction with service encounters in luxury-hotels restaurants. International Journal of Hospitality Management, 28: 586-593.
25. Yoo, D. K., Park, J. A. (2007). Perceived service quality – Analyzing relationships among employees, customers and financial performance. International Journal of Quality & Reliability Management, 21 (9): 908-926.
26. Yuksel, A., Yuksel, F. (2002). Measurement of tourist satisfaction with restaurant services: a segment-based approach. Journal of Vacation Marketing, 9 (1): 52-68.
27. Zeithaml, A., Berry, L. L., Parasuraman A. (1993). The nature and determinants of customer expectations of service. Journal of the Academy of Marketing Science, 21: 1-12.
28. Zeithaml, V., Parasuraman, A., Berry, L. L. (1990). Delivering Service Quality. New York: The Free Press.


STUDIA UNIVERSITATIS BABEŞ-BOLYAI, NEGOTIA, LV, 4, 2010
BLOOMING TULIP: A DECADE OF TURKISH TOURISM
MEDET YOLAL1
ABSTRACT. Turkey is a vast and varied land boasting incredible landscapes and natural beauties bordered by three different seas. Site of some of the world’s most ancient civilizations, as intricate and colorful as the pattern of an oriental carpet, Turkey is one of the top destinations of the Mediterranean region. Myth and legend interwoven with the history and the heritage of six civilizations shape the background of this vast land. Although Turkey is a newcomer to the tourism industry, compared to other Mediterranean destinations, she has experienced a rapid tourism development in the course of time. In other words the tulip is bloomed. In this vein, the objective of the paper is to make a short summary of tourism development in the country and to analyze the tourism industry in the first decade of the new millennium. The paper ends with a discussion of trends and shortcomings of tourism development in Turkey. Keywords: tourism development, historical perspective, Turkey. JEL Classification: L83 1. INTRODUCTION
Turkey is one of the biggest countries in Europe and the Middle East with an area of a bit less than 800,000 sq km, and is surrounded by 8,333 kilometers of coastline. A cradle of civilizations some authors named it, Turkey is surrounded by three seas, Black Sea in the north, Aegean in the west and Mediterranean in the south and looks like the head of a horse, as a Turkish poet has put it (www.kultur.gov.tr). The peninsula creates natural attractions which include varied and unspoiled landscapes with mountains, forests, rivers, and lakes (Tavmergen and Oral, 1999). Further, variety of archaeological and historical sites, as a result of the country being the land for various civilizations, makes Turkey one of most important heritage sites of the world. Major cultural and historical attractions elsewhere in the country include the sites of Ephesus, Troy, Pergamon, House of Virgin Mary, Pamukkale, Hierapolis, Konya (where the poet Rumi had spent most of his life), Didyma, Church of Antioch, religious places in Mardin, Urfa, Antakya, and the ruined cities and landscapes of Cappodocia.
1 Assistant Professor, PhD, Anadolu University, School of Tourism and Hotel Management, 26470,
Eskisehir, Turkey, [email protected]
MEDET YOLAL
16
Istanbul, the largest city of the country, has a number of major attractions derived from its huge historical status as capital of the Byzantine and Ottoman Empire. These include the Sultan Ahmed Mosque (the Blue Mosque), the Hagia Sophia, the Topkapi Palace and other Ottoman Palaces, Galata Tower, the Basilica Cistern, the Grand Bazaar, Maiden’s Tower, and the Pera Palas. In addition to museums and monuments of Istanbul, places of interest include Aegean ports of Izmir and Bodrum; the ancient cities of Troy, Tarsus, Samsun, Erzurum and Trabzon; Mt. Ararat, traditionally considered the landing of Noah’s Ark, the remains of which some expeditions have tried to find; the ski resort of Uludag, Kartalkaya, and Palandoken (www.turizm.net).
Beach vacations, particularly for Turkish city-dwellers and visitors from Western Europe, are also central to the Turkish tourism industry. Most beach resorts are located along the south-western and southern Aegean coast, especially along the Mediterranean coast near Antalya. For the government and the visitors, Antalya is also accepted as the tourism capital of Turkey. Major resort towns include Bodrum, Fethiye, Marmaris, Kuşadasi, Çeşme, Didim, Side and Alanya. Expectedly, tourism as an important part of the national economy has attracted both interest and intervention of the government for the last fifty years. Turkey saw tourism an easy, effective and relatively cheap instrument to achieve export-led industrialization as a core principle of the free market economy formulated by the international donor agencies such as World Bank and the International Monetary Fund (Tosun, 2001). Results are already apparent when tourism statistics of the past years are examined. For example, 198,841 tourists visited Turkey in 1963. This number increased to 27,347,977 in 2009, coupled with a similar growth in earnings from this industry (Ministry of Culture and Tourism, 2010). In such, the objective of the paper is to make a short history of tourism development in Turkey in the light of statistics and figures, in other words, to display how the tulip is bloomed. The paper ends with a discussion of trends and shortcomings of tourism development in Turkey.
2. HISTORICAL BACKGROUND
Turkey entered planned development era with the 1961 constitution. Tourism had been taken as a subsector in the development plans under the heading of service sector. The objectives of tourism development in the plans in 60s were: to benefit from economic, social and cultural impact of tourism; to contribute to balance of payments; to benefit from its foreign exchange effect as a tool for industrialization (Duzgunoglu and Karabulut, 1999); and to create new jobs; and to provide more holiday opportunities for Turkish citizens. Consequently, The Ministry of Tourism and Publicity was founded in 1963.
In 70s, Turkey adopted encouragement of mass tourism policy in view of the staggering increase of demand in this segment of the market towards the Mediterranean destinations (Duzgunoglu and Karabulut, 1999). As a result, the number of hotels reached to 494 in 1979 from its 192 level in 1970. It is clear that

BLOOMING TULIP: A DECADE OF TURKISH TOURISM
17
the rate of increase in the number of both establishments and tourist beds was slow during these years. This is probably due to market conditions and Turkey’s being a new-comer in the tourism business. It may be claimed that the period starting from early 60s to mid 80s experienced a very low rate of growth, fluctuating due to external and internal factors with a decrease toward 80s, while other Euro-Mediterranean destinations were enjoying remarkable increase in demand (Düzgünoglu and Karabulut, 1999).
On the other hand, for the purpose of developing the travel agency profession in harmony with the country’s economy and tourism sector, and protection of professional ethics and solidarity, the Association of Turkish Travel Agencies was established by law in 1972, as a professional organization having the status of a legal person. In accordance with the Law No.1618, travel agencies are established upon the issue of an operation license by the Ministry of Culture and Tourism, and they are obliged to become members of the Association of Turkish Travel Agencies (www.tursab.org). Travel agency business has flourished in line with the development of Turkish tourism. A great leap in the number of travel agencies has been observed since 90s, reaching a total of 5,795 by 2009.
For many developing countries, including Turkey, the main concern of development has been to build physical amenities such as hotels and restaurants to increase their international tourism revenues without taking into account the resulting socio-cultural, economic, and environmental costs (Tosun, Okumus and Fyall, 2008). In terms of the economical considerations of the governments, tourism was seen as the most effective tool for gaining foreign currency (Tosun, 2001). In search for such a need, Tourism Encouragement Law (law number 2634) came into effect in 1982. Numerous generous incentives were provided for investors which resulted in rapid increases in bed capacity in the south and southwest regions of the country over the years (Tosun, Okumus, Fyall, 2008). The new law envisaged tourism investments to be channeled to priority zones so that scarce resources could be intensified (Goymen 2000). The new law also appropriated state-owned land for tourism development, reduced bureaucratic formalities for tourism investors, relaxed restrictions on the employment of foreigners in the tourism sector, and introduced vocational education and training development projects (Tosun, 2001). Under the new legislation, novel tourism types like yachting, casinos, food and beverage centers, and complexes where several activities were to be integrated, were recognized and codified (Goymen 2000).
Tourism investors, especially the ones who invested in accommodation enterprises were provided public territories with low rates of rents at the southern coasts with various financial opportunities (Yarcan, 1998; Goymen, 2000). Financial incentives were given by 1985 which boosted a sudden growth in tourism investments. The state funds were given between 7-20 percent of the total investment without expecting any return; it contributed to a greater development. In the period of 1987-89, 80 percent of the state incentives were benefited by star
MEDET YOLAL
18
rated hotels, especially the 5 star rated hotels (Cakici, 1996). Additionally, entrepreneurs with scarce resource also invested in tourism businesses, as an easier way to make profits, and they established small hotels pensions etc. in the popular tourist destinations. Even some of them converted their residences into small hotels.
The private investors obtained around US$454 million from the state between 1983 and 1990 in credits and invested a further US$1.1 billion from their own resources during the same period (Turizm Yatırımları Dernegi, 1992). As a result of these efforts the number of ministry licensed establishments which stood at 569 with around 62,000 beds in 1982 increased to 2,084 and 351,000, respectively, in 1998, with an additional 273,000 municipal licensed beds (Ministry of Culture and Tourism 1999). In 1982, about 1.3 million tourists had visited Turkey, leaving revenue of US$300 million. The same numbers jumped to 10 million visitors and US$8 billion revenue in 1998.
Expectedly coastal areas showed more rapid development due to the priority policy for coastal and mass tourism in Turkey. Thus, it is obvious that coastal destination areas have encountered more pressure and more intensive environmental problems (Gezici 2006). During 90s, according to Duzgunoglu and Karabulut (1999), in view of experiences, consideration was given to sustaining both natural and man made values, to ensure proper development. In order to ease the excessive pressure on coastal areas and distribute the activities throughout the country, diversification policies have been adopted. It was indeed a sound judgment since diversification policies was an alternative solution not only to insure sustainability, but also contributing to balanced economic development which enables different parts of the country to benefit from the positive socio-economic impact of tourism. Winter holidays and sports, mountaineering, sub-aqua diving, tracking, golfing, horse riding and all other activity based holidays, cultural tours, special interest tours, spas, conventions, incentive travel and all other tourist activities have been taken as priority issues to utilize the wide range of diverse resources.
However, supporting the larger organizations for the needs of mass tourism, without any concerns of sustainability (Liu, 2003) was abandoned due to the economical crisis experienced in the country in 90s. The state incentives were replaced with fund credits by the state after the Gulf War in 1991. Fund credits were also stopped after the 1994 economic crisis which resulted in high inflation and devaluation. The construction of accommodation enterprises are still being supported by the governments in spite of the crisis experienced in 2001 (Emeksiz, Yolal and Cetinel, 2007).
Surprisingly tourism has flourished in an era of political inconsistency in Turkey. The 90s have become Turkey’s lost decade, during which few structural reforms could take place owing to political instability that has prevented the emergence of a strong government essential for political and economic stability. It is interesting to note that the average term of duty of every government in power was 1.3 years in Turkey (Tosun and Timothy, 2001). Between 1963 and 1996, 30 ministers were appointed to the Ministry of (in some years Culture and) Tourism. The average term of each minister of tourism was 1.1 years.

BLOOMING TULIP: A DECADE OF TURKISH TOURISM
19
3. THE LAST DECADE OF TOURISM IN TURKEY
Although it reveals a success story, Turkish tourism has been facing serious crisis for many years. These include the Gulf war in the early 90s, terrorism in the 90s, the civil war in former Yugoslavia in the early 90s, and an economic crisis in 1994, two earthquakes in the industrial northwest region of Turkey in 1999, the attacks of September 11 on the United States of America, and the war in Iraq in 2003 once more (Okumus and Karamustafa, 2005). Although most of these problems were geographically far from Turkey they had negative impacts in Turkish tourism industry.
The year 1999 was a disastrous year for Turkey. The 1999 Izmit earthquake was a 7.6 magnitude earthquake that struck northwestern Turkey on August 17, 1999. The Düzce earthquake of 1999 was an earthquake that occurred on 12 November 1999 with a moment magnitude of 7.2. In both disasters a total of 18,000 people died and leaving approximately half a million people homeless. These events also hit the economy. According to State Planning Organization these events cost more than US$10 billion. A similar loss was also recorded for the tourism industry. While the number of tourists was 9,752,697 in 1998, this figure decreased to 7,487,285 in 1999 (a decrease of -23%).
The first year of the new millennium was a recovery year for Turkish tourism industry. The number of tourists surpassed the 1999 figures and reached 10 million, and the total tourism receipts were about US$ 7 billion (Table 1). In mid-February 2001, Turkey experienced one of the worst economic crisis in its recent history and as a result, experienced a substantial fall in its Gross National Product from US$201.4 billion in 2000 to US$148 billion in 2001 (Okumus and Karamustafa, 2005). Tourism receipts were much more crucial for that year and a total of US$10 billion was achieved.
2002 witnessed the end of coalition era in Turkey. Turkey's 15th general election was held on November 3, 2002 following the collapse of the DSP-MHP-ANAP coalition. It was won by the Justice and Development Party (AKP) producing a crushing majority in spite of their winning just 34.3 percent of the national vote. The election produced Turkey's first single party government since 1987 and the country's first two-party parliament in 48 years (en.wikipedia.org). The same year the number of visitors increased by 14 percent, and Turkey earned US$ 12 billion of tourism revenue.
Table 1. Distribution of Visitors Arriving in Turkey by Years
Total Foreigner
Years Number of Visitors
Tourism Receipts 1000US$
Number of Foreigners
Tourism Receipts 1000US$
2000 10 428 153 7 300 000 10 412 000 n/a 2001 13 450 121 10 067 155 11 276 532 7 386 246 2002 15 214 516 11 900 925 12 921 981 9 009 677 2003 16 302 050 13 203 144 13 701 418 9 676 623 2004 20 262 640 15 887 699 17 202 996 12 124 059 2005 24 124 501 18 153 504 20 522 621 13 929 300

MEDET YOLAL
20
2006 23 148 669 16 850 947 19 275 948 12 556 829 2007 27 214 988 18 487 008 23 017 081 13 989 952 2008 30 979 979 21 950 807 26 431 124 16 801 618 2009 32 006 149 21 249 334 27 347 977 15 853 074
2010(*) 15 929 702 (*) Provisional (Jan-July period) Gathered from the statistics broadcasted on www.turizm.gov.tr.
Although there was a slight increase of 5 percent in 2003, the year 2004 was a very successful year for Turkish tourism. The number of visitors increased almost 25 percent in 2004 and the tourism receipts increased by 20 percent. The increase rate for 2005 was also about 20 percent. 2006 was the year of FIFA World Cup and it was hosted by Germany, which is the most important tourist generating market for Turkey. Consequently, the number of visitors diminished 6 percent compared to 2005. 2007 was a recovery year for Turkish tourism. An increase of 17 percent in the number of visitors was recorded for that year.
2008 was a disastrous year for the world economy, as a result of an economic recession that began in the United States of America in December 2007. It spread much of the industrialized world, and has caused a pronounced deceleration of economic activity. The global recession has resulted in a sharp drop in international trade, rising unemployment and slumping commodity prices (en.wikipedia.org). According to the World Tourism Organization, international travel suffered a strong slowdown beginning in June 2008, and this declining trend intensified during 2009 resulting in a reduction from 922 million international tourist arrivals in 2008 to 880 million visitors in 2009, representing a worldwide decline of 4.2 percent, and an estimated 6 percent decline in international tourism receipts (UNWTO, 2008). Moreover, the global economic recession aggravated by the uncertainty around the A(H1N1) influenza pandemic turned 2009 into one of the toughest years for the tourism sector. Growth returned in the last quarter of 2009, after 14 months of negative results (www.unwto.org). The first three places in both arrivals and receipts are still occupied by France, Spain and the USA. Both Turkey and Germany climbed one rank in arrivals, occupying the seventh and eighth positions respectively. In receipts, Germany kept its sixth place and Turkey the ninth (www.unwto.org).
Although international arrivals declined 4.2 percent in 2009, the number of visitors to Turkey increased 2.8 percent. This was mostly the result of low price policy employed by the enterprises and the tour operators. At this point, it may be claimed that lowering the price levels is the single tactic used by the tourism industry in Turkey. On the other hand, domination of the international tour operators forces the businesses to lower their prices. The figures of tourism income per capita also prove this trend, i.e. US$ 830 of tourism income per capita in 2008 dropped to US$664 in 2009.
The first six months of 2010 saw international tourist arrivals grow by 7 percent according to the August Interim Update of the UNWTO World Tourism

BLOOMING TULIP: A DECADE OF TURKISH TOURISM
21
Barometer (www.unwto.org). This result confirms the recovery trend beginning in the last quarter of 2009 and is expected to continue in the second half of the year at a somewhat more moderate rate. The same is valid for Turkey, since international arrivals grew 7 percent for the first half of the year. It is expected that the number of visitors will be more than 35 million and the number of foreign visitors will exceed 28 million. Business Monitor International (2010) maintains its annual growth rate forecast for foreign arrivals to Turkey in 2010 at 6 percent, with growth increasing further in 2011. It is explained that the background to these forecasts is economic recovery in Turkey’s major source markets, including the Eurozone –especially Germany- Russia and the UK.
The figures above show that the demand has boomed as families have flocked to Turkey’s large, all-inclusive resorts, and this type of holiday now dominates the country’s tourism industry. In an effort to diversify its tourism offering, the country is focusing on a number of new markets, as it was in the 90s, including winter holidays and sports, mountaineering, golfing, horse riding and activity holidays, cultural tours, special interests tours, spas, and meetings and conferences. For example, in response to a dramatic increase in the number of tourists visiting the country for health reasons, the Ministry of Culture and Tourism initiated a new campaign to increase the number of thermal water facilities used to rehabilitate suffering from chronic diseases such as rheumatism (Business Monitor International, 2010). Further, relatively cheap medical services in hospitals create a demand for health services such as surgeries, dentistry etc. In such, some international tour operators initiated tours to Turkey, especially Istanbul for health purposes.
Investors and industry partners are actively being sought to develop the more remote areas of the country, including an initiative to develop tourism in eastern Anatolia. The move is funded by the EU and organized by the Turkish authorities in a bid to increase visitor numbers to an area that has significant investment potential (Business Monitor International, 2010). Accordingly, in Tourism Strategy of Turkey-2023, The Ministry of Culture and Tourism aims to establish more appealing and stronger alternative destinations and routes that pose significance for health, thermal and plateau tourism, winter and mountain sports and for cultural heritage, distributed throughout the country. In this regard, domestic tourism is more suitable for a socially and economically sustainable regional development, since it does not carry all the problems linked to international mass tourism such as external investment, outflow of the income, seasonal migration, over-commercialization of culture etc. (Seckelmann, 2002). In this sense, starting from 90s and accelerated in 2000s, potential market demand in Turkey for both domestic and outbound travel and tourism has gradually increased. Further growth of wealth and expansion of high-income brackets, change in consumption patterns, and an increase in disposable income of some parts of middle income groups for leisure are among the major factors responsible for increase in potential demand (Duzgunoglu and Karabulut, 1999). The number of people going abroad from
MEDET YOLAL
22
Turkey in 2000 was about 5.2 million, and this number increased to 10.4 million in 2009 (Tourism Statistics, 2009). It is logical to say that more Turkish citizens will travel abroad for vacation purposes, as long as the visa restrictions are abolished.
4. CONCLUSION
Turkey has long been experiencing chronic and severe macro economic problems such as high rates of unemployment as a result of rapid growth of the working-age population, an increasing rate of deficits in the current account of balance of payments, increasing debt and relatively high inflation and interest rates compared to European Union countries. Thus, economic benefits of the tourism industry are pivotal even though it is not compatible with the principles of long-term sustainable development. As a result, Turkey has succeeded a rapid tourism growth in terms of volume, value and physical superstructure. In this vein, this paper attempts to make a general overview of tourism development in Turkey.
Tourism had long been taken as an important subsector in the development plans under the heading of service sector and a ministry responsible for tourism was assigned as early as 1963. However, political inconsistencies, internal unrest, and global and national economic crisis did not allow the development of a healthy tourism industry in Turkey until 80s.
Generous incentives, allocation of public territories for tourism development with low rates of rents, reduced bureaucracy, blurring restrictions on the employment of foreigners, state funds, postponement of taxes, investment allowances and novel tourism types launched by the Tourism Encouragement Law in 1982 heralded a new era in tourism development of the country. In line with investments on infra and super structure and rapid increase in the number tourist beds, Turkey has made considerable investments on communication technologies and transportation. Consequently, Turkey became one of the top ten destinations of the world in 90s. Further, a boom was recorded in 2001; strong growth rates were achieved in 2004 and 2005, tourism market rebounded strongly in 2007 and recorded a healthy performance in 2008 and 2009. It is estimated that the tourism industry would grow 6 percent in 2010 and will continue its steady growth for the coming ten years.
In spite of Turkey’s tremendous potential and competing diversity of resources scattered throughout the vast land, Turkey could not overcome the problem of seasonality. While overall tourist numbers are increasing, the historical profile of seasonality in Turkish tourism underlines the lack of an efficient, comprehensive approach to the problem. Due to the lack of understanding of markets or lack of resources, Turkey could not promote itself well enough in international markets. Intensive marketing strategies are useful for the purpose of promoting rarely known resources and attract new markets (Yolal, 2007). On the other hand cooperative marketing strategies among the countries in the eastern Mediterranean taking into account of special characteristics of each country, the nature of the tourism infrastructure, human resources for employment, and the
BLOOMING TULIP: A DECADE OF TURKISH TOURISM
23
economic, cultural, and social environment (Dieke and Karamustafa, 2000) will help Turkey to mitigate the problem of seasonality.
The above trends and figures justify the efforts to develop tourism industry in Turkey. It was, in a way, succeeded and the tulip has been bloomed. However, keeping it alive and sustainable deserves much more attention. Overcoming strategic advantages and threats require a sound planning approach, which is lacking for decades. In this regard, Tosun and Timothy (2001) list shortcomings of planning approaches to tourism development as: over centralization of tourism planning activities and improper practices of public administration; tourism development planning is rigid and inflexible; plans are not comprehensive enough and not prepared in an integrated manner; lack of a community-based approach; tourism development planning is dominantly supply oriented; tourism development planning is highly driven by the market; lack of consistency and continuity in planning policies; myopic approach to establishing goals of tourism development planning; and, the plans are difficult to implement. Finally, it may be concluded that Turkey will have to address these shortcomings paying due regard to the critical factors of competitiveness. In doing so, sustainability of resources should be the focal point of such development in harmony with economic, social and cultural benefits of the country. Future studies can provide added evidence to analyze the trends and development issues of tourism in Turkey. Such studies conducted on factors that affect the tourism industry and their consequences would help decision-makers to better manage the tourism resources for the well being of the country and the tulip itself.
REFERENCES
1. Business Monitor International (2010). Turkey Tourism Report, Q3 2010. Retrieved 30 August 2010 from http://web.ebscohost.com/ehost/pdfviewer/pdfviewer?vid=3&hid= 104&sid=1d787366-ba9b-4f4e-80fb-cf02d8cc5ff7%40sessionmgr113.
2. Cakici, C. (1996) Turkiye’de otel isletmeciligindeki pazarlama anlayışının gelisimi (Development of marketing approach in accommodation in Turkey). Anatolia: Turizm Araştırmaları Dergisi, 7(3-4), 32-37.
3. Cetinel, F. and Yolal, M. (2010). Public policy and sustainable tourism in Turkey. Tourismos: An International Multidisciplinary Journal of Tourism, (Article in Press).
4. Dieke, P.U.C. and Karamustafa, K. (2000). Cooperative marketing in the accommodation subsector: Southeastern Mediterranean perspectives. Thunderbird International Business Review, 42(4): 467-494.
5. Duzgunoglu, E. and Karabulut, E. (1999). Development of Turkish Tourism. Istanbul: TURSAB.
6. Emeksiz, M., Yolal, M. and Cetinel, F. (2007). Future expectations of SMHEs in Turkey. Asian Journal of Tourism and Hospitality Research, 1(1):128-138.
7. Gezici, F. (2006). Components of sustainability. Annals of Tourism Research, 33(2): 442-455.
MEDET YOLAL
24
8. Goymen, K. (2000). Tourism and governance in Turkey. Annals of Tourism Research, 27(4): 1025-1048.
9. http://en.wikipedia.org/wiki/Late-2000s_recession Retrieved 30 August 2010. 10. http://en.wikipedia.org/wiki/Turkish_general_election,_2002 Retrieved 30 August 2010. 11. http://www.tursab.org.tr/en/tursab/about-tursab_1061.html Retrieved 31 August 2010. 12. http://www.unwto.org/facts/eng/pdf/highlights/UNWTO_Highlights10_en_HR.pd
f Retrieved 31 August 2010. 13. http://www.turizm.gov.tr/TR/Genel/BelgeGoster.aspx?F6E10F8892433CFF2B819
39FD5B60AFA2D9C6AFDB94F017A Retrieved August 2010. 14. www.turizm.net/turkey Retrieved 3 September 2010. 15. Liu, Z. (2003). Sustainable tourism development: A critique. Journal of Sustainable
Tourism, 11(6), 459-475. 16. Okumus, F. and Karamustafa, K. (2005). Impact of an economic crisis: evidence
from Turkey. Annals of tourism Research, 23:942-961. 17. Seckelmann, A. (2002). Domestic tourism-a chance for regional development in
Turkey? Tourism Management, 23: 85-92. 18. Tavmergen, I.P. and Oral, S. (1999). Tourism development in Turkey. Annals of
Tourism Research, 26(2): 451-453. 19. The Ministry of Culture and Tourism (2007). Tourism Strategy of Turkey-2023. Ankara. 20. Tosun, C. (2001). Challenges of sustainable tourism development in the developing
world: the case of Turkey. Tourism Management, 22: 289-303. 21. Tosun, C. and Timothy, D.J. (2001). Shortcomings in planning approaches to
tourism development in developing countries: the case of Turkey. International Journal of Contemporary Hospitality Management, 13(7): 352-359.
22. Tosun, C., Okumus, F. and Fyall, A. (2008). Marketing philosophies: Evidence from Turkey. Annals of Tourism Research, 35(1):127-147.
23. Tourism Statistics 2000-2009. Istanbul: Ekin Kitap. 24. Turizm Yatırımcıları Dernegi (1992). Turizm Yatırımlarının Ekonomiye Katkıları
(Benefits of Tourism Investments on the Economy). Đstanbul: TYD. 25. Yarcan, S. (1998). Turkiye’de Turizm ve Uluslararasilasma (Tourism and
Internationalization in Turkey). Istanbul: Bogazici Universitesi. 26. Yolal, M. (2007). Analysis of seasonality in Turkish tourism. Journal for Theory
and Practice of Hotel Industry, 7(9-10):139-148. 27. UNWTO (2008) World Tourism Barometer June 2008 (PDF).
http://www.tourismroi.com/Content_Attachments/27670/File_633513750035785076.pdf. Retrieved 3 September 2010.
STUDIA UNIVERSITATIS BABEŞ-BOLYAI, NEGOTIA, LV, 4, 2010
E-TOURISM – AN IMPORTANT ELEMENT BETWEEN HOTEL AND TRAVEL AGENCY PROFESSIONAL RELATIONSHIP
CARMEN BĂBĂIŢĂ1, ANDREIA ISPAS2, RALUCA FLORENTINA GHENESCU3, ALEXANDRA HĂLĂLĂU4
ABSTRACT. This paper work presents e-tourism as an alternative for business and tourism promotion travel agencies. In the past 10 years electronic commerce has developed, and travel agencies can join this trend expanding international tourism markets. E-tourism represents the digitization of tourism industry leading to increased competitiveness and to globally expand the tourism agencies. Acceptance of electronic commerce in tourism industry is so large that industry structure and how it operates is changing constantly. The Internet is not only used to obtain information but as a way to command services. Users become their own travel agents and they design their own custom packages. The main objective of this paper is to examine the implications of e-tourism development of tourist industry in the knowledge society. As a secondary objective, the present work aims to provide an accounting of travel agencies in Romania that enables customers to personalize the holiday and facilitate quick search on the site of an offer and give online support. Was also carried out a pilot survey for the hotel market segment 3*, 4* and 5* in Timisoara on the quality of professional relationship between hotels and travel agencies. Key words: e – tourism, eCommerce, web services. JEL Classification: L81, L83, L84
1. Introduction Technological change and tourism have gone hand in hand for many years
(Poona, 1993, Sheldon, 1997). Since the 80s, Communications and Information Technologies (CTI) have turned tourism global. Developments in CTI, have changed, no doubt, both practices and business strategies and industry structure (Porter, 2001). Using computer reservation system (CRS) in 1970 and Global Distribution System (GDS) in the late 80s, followed by development of the Internet in the late 1990s, have dramatically changed the best operational and strategic practices in the tourism industry (Buhalis, 2003; eBusiness W @ tch, 2006, Emmer, Tauck, Wilkinson, & Moore, 1993,
1 Assistant Professor PhD, Department of Economics, Faculty of Economics and Business Administration,
West University of Timisoara 2 Teaching Assistant Phd Candidate, Faculty of Economics and Business Administration, West University of
Timisoara, [email protected] 3 Economist 4 Economist
CARMEN BĂBĂIŢĂ, ANDREIA ISPAS, RALUCA FLORENTINA GHENESCU, ALEXANDRA HĂLĂLĂU
26
O'Connor 1999). If in the past 20 years the focus was on technology itself, since 2000 we witnessed a real transformation of communication technologies. This gave the possibility of developing a wide range of new tools and services that facilitate global interaction between players in the world. Tourism as an international industry as well as the largest provider of jobs on the planet boasts a wider range of heterogeneous stakeholders than many other industries. Increased energy and industrial development are probably reflected by increased CTI. Accelerated and synergistic interaction between technology and tourism has lately made fundamental changes in industry and on our perceptions towards it’s nature. Increasingly, CTI plays a critical role for the competitiveness of tourism organizations and destinations, and the entire industry as a whole (UNWTO, 2001). The evolution of search engines, loading capacity and search speed influenced the number of passengers around the world who use technology to plan trips. CTI have changed the efficiency and effectiveness of tourism organizations, how businesses operate in the tourist market and how customers interact with the travel agencies (Buhalis, 2003). There were many entries among the players on the stage of tourism, changes in the market as well as the power held by these in the tourism market, changes in political perceptions of tourism and a growing recognition of the importance of tourism, by an increasing number of national and regional economies. CTI not only encourages consumers to identify, customize and purchase products of interest, but also supports industry globalization by providing effective tools for suppliers, so that they develop, manage and distribute their offers worldwide (Buhalis, 1998). As a result, a major area of research is developing, because more and more researchers try to understand the significance of new technologies, to investigate and interpret contemporary work, and trying to predict the path to be followed both by industry and technological progress.
2. Material and method(s) E-tourism describes the digitization of processes and value chains to
optimize their effectiveness. To achivie this, CTI’s are implemented for the dis-intermediation of the tourism market. In contrast, virtual tourism is a term for virtual reality which supports holidays.
The conclusion of a seminar held in April 2001 in Russia under the patronage of WTO (World Tourism Organization) was that no other technology, except for television, had so great an impact on passengers as the Internet. This is a support for the fastest revolution in e-tourism’s development through specialized portals and more.
The travel portal brings together the parties involved in tourism activities, namely tourism providers (hostels, hotels, treatment facilities), travel agencies and not least consumers of tourism goods and services in a virtual space, the World Wide Web. Participants play their roles in full transparency through Internet specific tools. So, the e-tourism phenomenon primarily involves e-information, e-booking (hotels,

E-TOURISM – AN IMPORTANT ELEMENT BETWEEN HOTEL …
27
transportation, etc.) and e-payment. Other stages are involved among these, but which depend more on tour operators like e-planning/e-management, etc. Typically these stages are managed by specialized operators such as Worldspan.
E-information stage. E-information stage involves providing information in specialized portal sites, electronic brochures, audio guides, photo albums (still images and panoramas), real-time images or videos, and even travel journals through blogs or even “specialized” virtual communities such as Virtual Tourist, and “guides” offered through “virtual city”. Static and panoramic images offer visitors of tourism themed sites the possibility of taking a “virtual semi-tour” of the services, making them into potential customers. Through these travel agencies sell dreams, dreams that, more than necessary, must have a real basis. For example, an online album with great photos of vacation destinations (hotels, accommodation, attractions, etc.) can convince a customer to book a stay.
E-booking stage. With the development of information technology and electronic commerce, electronic booking (online booking) proved to be one of the most popular ways to facilitate access to goods and services via the Internet. Used mostly in hotels, air transport services and rent-a-car, electronic reservation services comply with legal requirements that derive from the regulations that refer to Internet services, to electronic commerce and conclusion of distance contracts, in particular. Among the advantages of electronic bookings are available online 24 of 24 service hours, saving time, confirmation is sent immediately (if using an automatic reservation, there are cases when confirmation depends, however, a human reservation agent ), flexibility with regard to modification of booking details. Among the disadvantages of electronic bookings are due to human error and computer crime vulnerabilities in reservation systems.
Stage of e-payment. E-payment is a branch of e-commerce transactions, including electronic payment for the purchase or sale of goods and services via the Internet. Usually we think of as electronic payments and online transactions on the Internet, but actually there are several methods of electronic payment. As technology develops, the number of electronic trading tools and processes increase, while the percentage of cash and checks using drops. Online payments place the customer to transfer money or to make a purchase online through the Internet. Businessmen and customers may transfer money to third parties from bank or other accounts or use credit or debit card to buy something online. It is estimated that 80% of online payments for certain purchases are made using a credit or debit card.
As example, we took the case of Brazil which launched a program in June 2004, related to e-tourism that enabled developing countries to benefit more from international tourism and reduce their dependence on tour operators and marketers from developed countries.
This program seeks to: organize local tourism, public and private, by creating an internet network to find information, make reservations online and to make partnerships; encourage small and medium tourism enterprises to link directly with customers; reduce tourism revenues return.

CARMEN BĂBĂIŢĂ, ANDREIA ISPAS, RALUCA FLORENTINA GHENESCU, ALEXANDRA HĂLĂLĂU
28
The initiative was structured around three elements: the right tools, methodology and partnerships.
Instruments: a generator of sites that enables the creation of sites for e-tourism in different countries. By providing information about the country and information on tourism, these local sites will help promote tourism online. The content of these sites is based on business plans executed so as to meet market requirements and needs of that country.
Method: trainings and guidance to help countries identify the necessary information about the tourism industry, standardized and posted on the internet.
Partnerships: to build business relationships, the different sectors of the tourism industry (hotels, restaurants, travel agencies, airlines) are responsible for their share of the business plan. Such cooperation will help developing countries to improve their tourism products, launch new ones, to build their human resources and adopt new information technologies.
To contextualize e-tourism in Romania it is required to review the Electronic Commerce (eCommerce). Electronic commerce has emerged as a global phenomenon that gradually increases its market share.
In the first quarter of 2010, the volume of online credit card transactions in Romania amounted to 31.85 million, up 70% compared to the same period last year, according to data from Romcard. In this period 603,437 transactions were processed. The most spectacular increase in transactions was recorded in tourism – with 270% more than last year. “Tourism is one of the industries on whose growth this year I bet and I am glad that results so far confirm our estimates. This demonstrates that both buyers and tour operators have realized the benefits e-commerce offers in their area of activity.” (www.epayment.ro)
A 2010 survey by Internet World States revealed that Romania ranks number eight in Europe at Internet users.
Millions of users
7
7.3
7.4
13.8
20
27
28.2
40.1
43.2
56.7
0 10 20 30 40 50 60
Belgium
Sweden
Romania
Netherlands
Poland
Spain
Italy
France
Great Britain
Germany
(Source: Internet World States, 2010)
Graph 1. Internet users in Europe

E-TOURISM – AN IMPORTANT ELEMENT BETWEEN HOTEL …
29
Table 1. Number of Internet users in Romania during 2000 – 2009
Year Nr of users Population Penetration Source 2000 800 000 22,217,700 3.6 % ITU 2004 4 000 000 21,377,426 18.7 % ITU 2006 4 940 000 21,154,226 23.4 % C.I. Almanac 2007 5 062 500 21,154,226 23.9 % ITU 2009 7,430,000 22,215,421 33.4 % ITU
(Source: Internet World States, 2010)
Table 2. Number of Internet users in the European Union during 2000 – 2009
European Union
Population (2009)
Nr. Of internet users
Penetration %
Increasing the number of users (2000 - 2009)
Austria 8,210,281 5,936,700 72.3 % 182.7 % Franța 62,150,775 43,100,134 69.3 % 407.1 %
Germania 82,329,758 61,973,100 75.3 % 158.2 % Grecia 10,737,428 4,932,495 45.9 % 393.2 % Italia 58,126,212 30,026,400 51.7 % 127.5 %
România 22,215,421 7,430,000 33.4 % 828.8 % Spania 40,525,002 29,093,984 71.8 % 440.0 %
Marea Britanie 61,113,205 46,683,900 76.4 % 203.1 % (Source: Internet World States, 2010)
Between 2000 - 2009 the number of Internet users in Romania has been a
growing, research results showing an increase of 440% over the nine years studied. Penetration rate increased 6 times between 2000-2004, followed by a slower increase between 2006 and 2009, reaching 33.4% in 2009 according to ITU.
Analyzing the data in Table 2 we see that the number of penetration rate in Romania is relatively small compared to other EU countries, however Romania is in top 10 EU countries at the number of Internet users, placeing our country among the countries with great potential for online commerce and e-tourism default.
Methodology used. This paper work presents e-tourism as an alternative way of business and tourism promotion of travel agencies. In the past 10 years electronic commerce has got size, and travel agencies can join this trend expanding international tourism markets. This includes the following important steps:
The first step was to analyze the literature of e-tourism and the conclusions reached over time. The research analyzed gave us an insight into the development of communications and information technologies in the past 20 years, but the threats they have created with their development, especially on the Internet.

CARMEN BĂBĂIŢĂ, ANDREIA ISPAS, RALUCA FLORENTINA GHENESCU, ALEXANDRA HĂLĂLĂU
30
The second step was to analyze the quality of professional relationship between hoteliers and tourism travel agencies from Timisoara. Thus, the present paper work aims to provide a record of travel agencies in Romania that enables customers to personalize their holiday and facilitate a quick search on a site of a tender offer and last but not least, online support. Was also carried out a pilot survey for the hotel market segment 3*, 4* and 5* in Timisoara on the quality of professional relationship between hoteliers and travel agencies.
3. Results and discussions
3.1. Pilot study on the professional relationship between hoteliers and travel agencies and vice versa from Timisoara Setting sample: 15 hotels were chosen, placed in categories 3, 4 and 5 stars from tourist market existing in Timisoara: 8 hotels of 3 stars, 6 hotels of 4 stars and 1 hotel of 5 stars. Period: June 2010. Criteria observed: checking the existence of cooperation agreements with travel agencies, the assessment in the relationship they have with and the number of contracted agencies. The results are:
- All 15 hotels have cooperation agreements with travel agencies in Timisoara and Romania
- Hoteliers believes that relations and cooperation involving the timely payment of the service contracted are good and very good.
- Thus, 8 from 15 hotels said that was a working relationship, colaboration relationship "good" and 7 hotels "very good". As we can see, there are no major differences on opinions in the subjective expression.
- On average, each hotel has cooperation agreements for various services and prices with 43 travel agencies in Romania. A relatively low number compared with the approximately 800 travel agencies registered in the National Authority of Tourism Agencies (ANAT) Romania. The lowest number of collaborations with travel agencies are in a flock of 15 agencies and 100 largest agencies.
Also applied to this pilot study were the travel agencies from Timisoara to see their perception about the professional relationship with hoteliers. The sample consisted of a 45 travel agencies. They were chosen from www.romturism.ro. Period and the criteria followed in the telephone interview were the same as for hoteliers. Results obtained:
‐ All 45 travel agencies have confirmed that they have cooperation agreements with hoteliers from Timisoara and Romania.
E-TOURISM – AN IMPORTANT ELEMENT BETWEEN HOTEL …
31
‐ Also noted that the relationship between them and the hotel is a mostly "good"
‐ On average, they confirmed that they had contracts with 35 hotels in Romania.
Preferred destinations are the spa and treatment, mountain and sea. Some travel agencies said that they have more contracts with hoteliers abroad than in Romania (the number of foreign contracts is double). Overall both hoteliers and employees of travel agencies responded promptly to the study trying to give us accurate data.
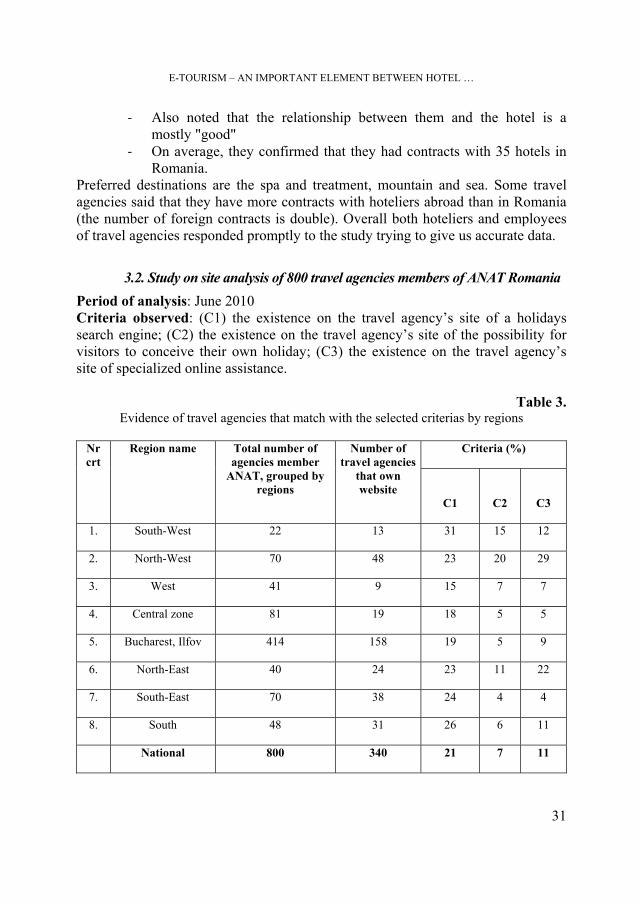
3.2. Study on site analysis of 800 travel agencies members of ANAT Romania Period of analysis: June 2010 Criteria observed: (C1) the existence on the travel agency’s site of a holidays search engine; (C2) the existence on the travel agency’s site of the possibility for visitors to conceive their own holiday; (C3) the existence on the travel agency’s site of specialized online assistance.
Table 3. Evidence of travel agencies that match with the selected criterias by regions
Criteria (%) Nr
crt Region name Total number of
agencies member ANAT, grouped by
regions
Number of travel agencies
that own website
C1
C2
C3
1. South-West 22 13 31 15 12
2. North-West 70 48 23 20 29
3. West 41 9 15 7 7
4. Central zone 81 19 18 5 5
5. Bucharest, Ilfov 414 158 19 5 9
6. North-East 40 24 23 11 22
7. South-East 70 38 24 4 4
8. South 48 31 26 6 11
National 800 340 21 7 11
CARMEN BĂBĂIŢĂ, ANDREIA ISPAS, RALUCA FLORENTINA GHENESCU, ALEXANDRA HĂLĂLĂU
32
This study reveals that the travel agencies in Romania, members ANAT are not affiliated with the new trend, namely e-tourism. As we can see only 21% of them have a search site engine, 11% of agencies provide online support and the lowest rate of 7% of travel agencies members ANAT give their customers the possibility to conceive their own vacantion on web site. Using e-tourism by travel agencies can bring them more benefits. Previous research has shown that tourist who searched the Internet tend to increase the length of stay compared with those who consult other sources of information. Also, the Internet allows their consumers to interact dynamically with travel agencies. Rapid transmission of data over the Internet accelerates the time of response and the result is that both agencies and clients save time and money.
E-tourism has also some disadvantages. Although there are many options available on the Internet, which consumers can choose, there are many psychological barriers that often prevent consumers to make online transactions. According to Wolfe’s, Hsu’s and Kang’s research (2004), the reasons for which the consumers don’t purchase online products are: lack of personal assist, security problems, lack of experience and lack of time. Weber and Roels (1999) found that people who purchase online tourism products are shopping online for 4 years or more, and their trust in the online transactions has been developed by the positive experience of past transactions (Bai, Hu, Elsworth & amp; Countryman, 2004; Bieger, Beritelli, Weinert, & amp; Wittmer, 2005).
4. Conclusions The literature shows that the research in e-tourism is just at the beginning,
and questions about this area are more and more. It is obvious that the future of e-tourism is focalization on technologies that will help the organizations to interact with their customers in a dynamic manner.
Tourists from major tourist generating regions of the world have become more qualified and they can operate in multicultural environments. The development of ITC, and particulary the Internet had transformed the tourists, becoming more sophisticated and looking for saving time and money. They are interested in making their own vacantions, following their own preferences and schedules, instead of following a group into a organized trip. The market share of organized trips it decreases for independent tourism. The contemporary consumer, connected to the Internet is not willing to accept any delays. The key to success is early identification of consumer needs and then selling them new personalized products and services, which satisfy their needs. Those new customers need to interact more with travel agencies, in order to satisfy their own desires.
The development of new ITC force the suppliers to change their communication strategies, in order to be more efficient. Innovative technologies will support interoperability, customization, and permanent networks. These

E-TOURISM – AN IMPORTANT ELEMENT BETWEEN HOTEL …
33
strategies are needed both at the strategic level and the tactical management to ensure that opportunities and challenges brought by the CTI links are to the benefit of tourism organizations, to achieve a maximum level of innovation and competitiveness.
REFERENCES
1. Buhalis, D. & Deimezi, O. (2004) ”E-Tourism Developments in Greece: Information Communication,Technologies adoption for the strategic management of the Greek tourism industry”, School of Management, Center for E-tourism Research, University of Surrey, Grecia
2. Buhalis, D. & Law, R. (2008) ”Progress in information technology and tourism management: 20 years on and 10 years after the Internet—The state of eTourism research” available online at www.sciencedirect.com, accesed on 04 Mai, 2010
3. Cardoso, J. & Lange, C. (2007), ”A framework for assesing strategies and technologies for dymanic packaging applications in e-tourism”, Information Technology & Tourism, vol 9 pp. 27-44
4. www.anat.ro, accesed on June, 2010 5. www.epayment.ro, accesed on May, 2010 6. www.e-turism.ro, accesed on May, 2010 7. www.gdt20.ro, accesed on May, 2010 8. www.internetworldstats.com, accesed on May, 2010 9. www.romturism.ro, accesed on June, 2010

STUDIA UNIVERSITATIS BABEŞ-BOLYAI, NEGOTIA, LV, 4, 2010
ANALYZING THE CHANGES IN REASONS FOR TRAVEL OF THE ROMANIAN TOURISTS
IULIANA POP1, ANDREEA MARIN- PANTELESCU2
ABSTRACT. The paper aims to conduct an analysis regarding the changes registered in the reasons for travel of the tourists in general, and of the Romanian tourists in particular. The analysis aims to present the characteristics of the main categories of tourism by the purpose of trip (holiday, business, VFR, and others) and also to calculate the share of these categories in 2004 and 2008 for better understanding of the transformation in the tourism structure. The paper is important for the hospitality sector because there customer mix is based of these major segments and the changes need to be taken into consideration for the following years. Key words: tourism, holidays, leisure, business, VFR (visiting friends and relatives). JEL classification: L83, L830
1. Introduction According to the World Tourism Organization travel ‘refers to the activity
of travelers. A traveler is someone who moves between different geographic locations, for any purpose and any duration’. In the International Recommendations on Tourism Statistics was established by WTO that a visitor ‘is a traveler taking a trip to a main destination outside his/her usual environment, for less than a year, for any main purpose (business, leisure or other personal purpose) other than to be employed by a resident entity in the country or place visited. These trips taken by visitors qualify as tourism trips’. Tourism refers to the activity of visitors. Tourism is therefore a subset of travel and visitors are a subset of travelers. These distinctions are crucial for the compilation of data on flows of travelers and visitors and for the credibility of tourism statistics.
The purpose of trip raises the main categories of tourism as leisure, business, visiting friends and relatives (VFR) and others.
It is essential to understand these categories because they are associated with differences in levels of daily expenditure (business tourists spend the most per day), length of trip (international leisure tourists and VFRs stay longest), accommodation
1 Academy of Economic Studies Bucharest, Faculty of Business and Economics, Department of
Economic History and Geography, 6, Piaţa Romană, Bucharest, Romania, [email protected] 2 Academy of Economic Studies Bucharest, Faculty of Commerce, Department of Tourism-Services,
6, Piaţa Romană, Bucharest, Romania, [email protected]
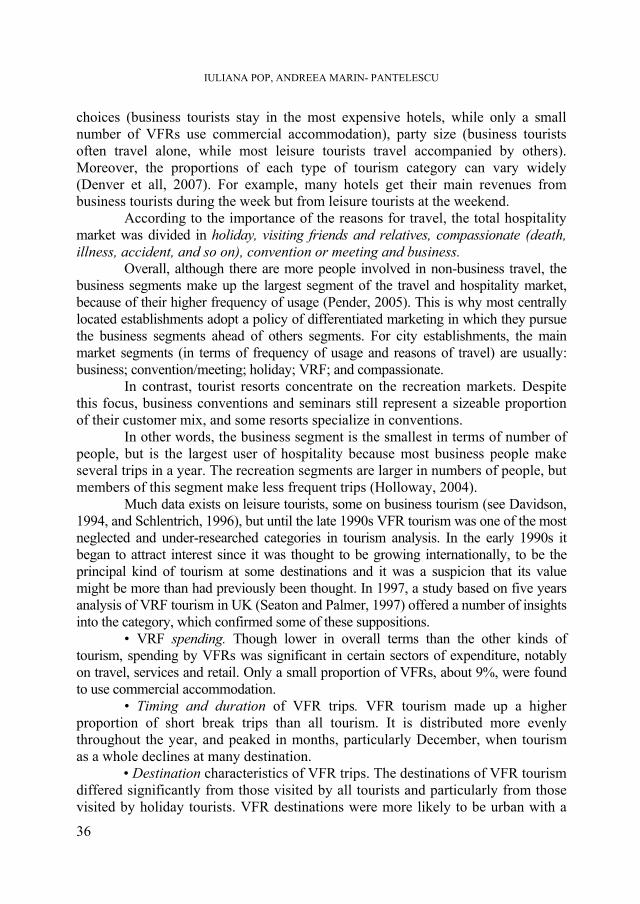
IULIANA POP, ANDREEA MARIN- PANTELESCU
36
choices (business tourists stay in the most expensive hotels, while only a small number of VFRs use commercial accommodation), party size (business tourists often travel alone, while most leisure tourists travel accompanied by others). Moreover, the proportions of each type of tourism category can vary widely (Denver et all, 2007). For example, many hotels get their main revenues from business tourists during the week but from leisure tourists at the weekend.
According to the importance of the reasons for travel, the total hospitality market was divided in holiday, visiting friends and relatives, compassionate (death, illness, accident, and so on), convention or meeting and business.
Overall, although there are more people involved in non-business travel, the business segments make up the largest segment of the travel and hospitality market, because of their higher frequency of usage (Pender, 2005). This is why most centrally located establishments adopt a policy of differentiated marketing in which they pursue the business segments ahead of others segments. For city establishments, the main market segments (in terms of frequency of usage and reasons of travel) are usually: business; convention/meeting; holiday; VRF; and compassionate.
In contrast, tourist resorts concentrate on the recreation markets. Despite this focus, business conventions and seminars still represent a sizeable proportion of their customer mix, and some resorts specialize in conventions.
In other words, the business segment is the smallest in terms of number of people, but is the largest user of hospitality because most business people make several trips in a year. The recreation segments are larger in numbers of people, but members of this segment make less frequent trips (Holloway, 2004).
Much data exists on leisure tourists, some on business tourism (see Davidson, 1994, and Schlentrich, 1996), but until the late 1990s VFR tourism was one of the most neglected and under-researched categories in tourism analysis. In the early 1990s it began to attract interest since it was thought to be growing internationally, to be the principal kind of tourism at some destinations and it was a suspicion that its value might be more than had previously been thought. In 1997, a study based on five years analysis of VRF tourism in UK (Seaton and Palmer, 1997) offered a number of insights into the category, which confirmed some of these suppositions.
• VRF spending. Though lower in overall terms than the other kinds of tourism, spending by VFRs was significant in certain sectors of expenditure, notably on travel, services and retail. Only a small proportion of VFRs, about 9%, were found to use commercial accommodation.
• Timing and duration of VFR trips. VFR tourism made up a higher proportion of short break trips than all tourism. It is distributed more evenly throughout the year, and peaked in months, particularly December, when tourism as a whole declines at many destination.
• Destination characteristics of VFR trips. The destinations of VFR tourism differed significantly from those visited by all tourists and particularly from those visited by holiday tourists. VFR destinations were more likely to be urban with a

ANALYZING THE CHANGES IN REASONS FOR TRAVEL OF THE ROMANIAN TOURISTS
37
high population density and other smaller towns with a comparatively moderate base of holiday tourists. VFR thus tended to reverse the normal patterns of recreational tourism being most common in high density population, urban regions, rather than rural and seaside destinations.
2. Material and method(s) The analysis will consider a five year period (2004-2008) in which significant
changes took place in the tourism market (as 2004 was a year of economic boom and 2008 a year marked by a powerful economic regression). The data was collected from the UNWTO World Tourism Barometer and Tourism Highlights 2009 and 2005 Editions and from Romanian Statistical Yearbook 2009 and 2005. For the calculation we used the annual average rate, percentages, changes, and we compared the segments structured over the years, and between World and Romania. The observation methods also helped us realize the differences between the holidays and business sector and the evolution of the VFR segment over the past five years.
3. Results and discussions World analysis Regarding the World reasons for travel, in 2008, travel for leisure, recreation
and holidays accounted half of all international tourist arrivals (51% or a total of 470 million arrivals). Some 15% of international tourists reported travelling for business and professional purposes and another 27% travelled for other reasons, such as visiting friends and relatives (VFR), religious reasons/pilgrimages, health treatment, etc. The purpose of visit for the remaining 7% of arrivals was not specified.
Table 1. World Arrivals by purpose of visit
International Tourist Arrivals
(million) Share (%)
2004 2008 2004 2008
Average annual
growth (%) ’04-‘08
Total 763.9 922 100 100 4.8 Leisure, recreation and holidays
383.1 470.2 50.1 51 5.2
Business and professional
119.3 138.8 15.6 15 3.9
VFR, health, religion, other
197.7 248.9 25.9 27 5.9
Not specified 63.8 64.1 8.3 7 0.1
Source: Data as collected by UNWTO for TMT 2005 Edition and Tourism Highlights 2009 Edition
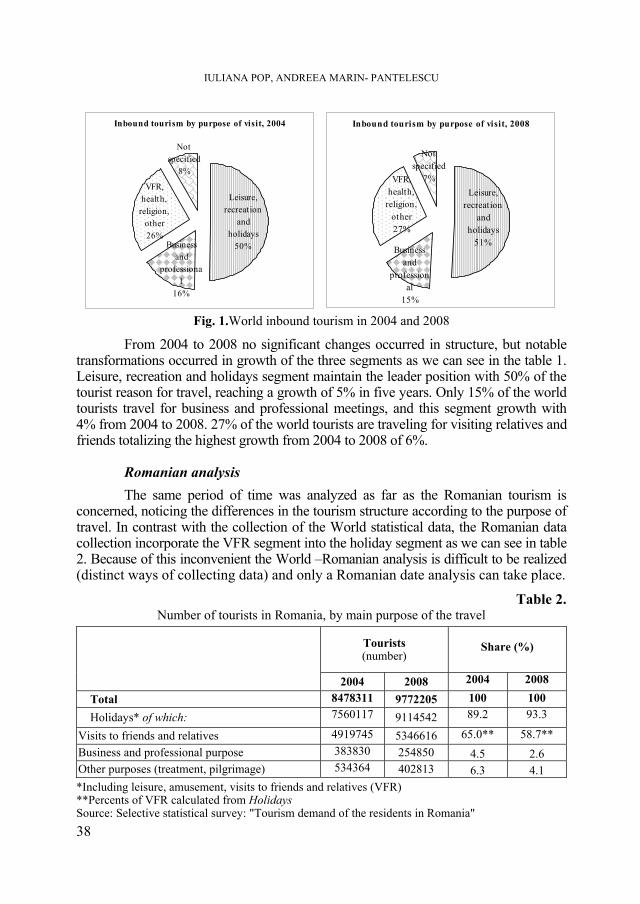
IULIANA POP, ANDREEA MARIN- PANTELESCU
38
Inbound tourism by purpose of visit, 2004
Business and
professional
16%
VFR, health,
religion, other26%
Not specified
8%
Leisure, recreation
and holidays
50%
Inbound tourism by purpose of visit, 2008
Business and
professional
15%
VFR, health,
religion, other27%
Not specified
7%Leisure,
recreation and
holidays51%
Fig. 1.World inbound tourism in 2004 and 2008
From 2004 to 2008 no significant changes occurred in structure, but notable transformations occurred in growth of the three segments as we can see in the table 1. Leisure, recreation and holidays segment maintain the leader position with 50% of the tourist reason for travel, reaching a growth of 5% in five years. Only 15% of the world tourists travel for business and professional meetings, and this segment growth with 4% from 2004 to 2008. 27% of the world tourists are traveling for visiting relatives and friends totalizing the highest growth from 2004 to 2008 of 6%. Romanian analysis The same period of time was analyzed as far as the Romanian tourism is concerned, noticing the differences in the tourism structure according to the purpose of travel. In contrast with the collection of the World statistical data, the Romanian data collection incorporate the VFR segment into the holiday segment as we can see in table 2. Because of this inconvenient the World –Romanian analysis is difficult to be realized (distinct ways of collecting data) and only a Romanian date analysis can take place.
Table 2. Number of tourists in Romania, by main purpose of the travel
Tourists (number)
Share (%)
2004 2008 2004 2008
Total 8478311 9772205 100 100 Holidays* of which: 7560117 9114542 89.2 93.3
Visits to friends and relatives 4919745 5346616 65.0** 58.7** Business and professional purpose 383830 254850 4.5 2.6 Other purposes (treatment, pilgrimage) 534364 402813 6.3 4.1 *Including leisure, amusement, visits to friends and relatives (VFR) **Percents of VFR calculated from Holidays Source: Selective statistical survey: "Tourism demand of the residents in Romania"
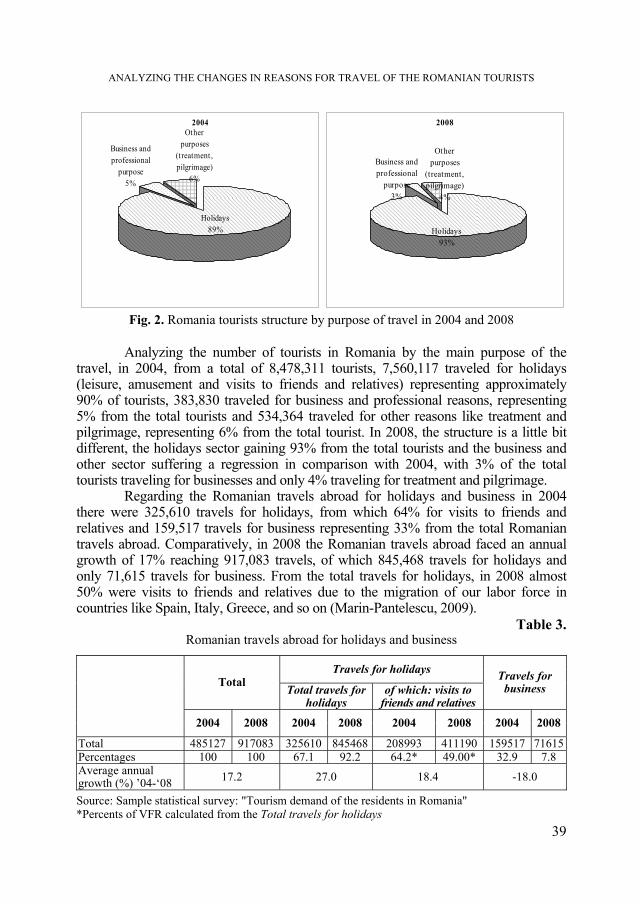
ANALYZING THE CHANGES IN REASONS FOR TRAVEL OF THE ROMANIAN TOURISTS
39
2004
Holidays89%
Other purposes
(treatment, pilgrimage)
6%
Business and professional
purpose5%
2008
Holidays93%
Business and professional
purpose3%
Other purposes
(treatment, pilgrimage)
4%
Fig. 2. Romania tourists structure by purpose of travel in 2004 and 2008
Analyzing the number of tourists in Romania by the main purpose of the travel, in 2004, from a total of 8,478,311 tourists, 7,560,117 traveled for holidays (leisure, amusement and visits to friends and relatives) representing approximately 90% of tourists, 383,830 traveled for business and professional reasons, representing 5% from the total tourists and 534,364 traveled for other reasons like treatment and pilgrimage, representing 6% from the total tourist. In 2008, the structure is a little bit different, the holidays sector gaining 93% from the total tourists and the business and other sector suffering a regression in comparison with 2004, with 3% of the total tourists traveling for businesses and only 4% traveling for treatment and pilgrimage.
Regarding the Romanian travels abroad for holidays and business in 2004 there were 325,610 travels for holidays, from which 64% for visits to friends and relatives and 159,517 travels for business representing 33% from the total Romanian travels abroad. Comparatively, in 2008 the Romanian travels abroad faced an annual growth of 17% reaching 917,083 travels, of which 845,468 travels for holidays and only 71,615 travels for business. From the total travels for holidays, in 2008 almost 50% were visits to friends and relatives due to the migration of our labor force in countries like Spain, Italy, Greece, and so on (Marin-Pantelescu, 2009).
Table 3. Romanian travels abroad for holidays and business
Travels for holidays Total Total travels for
holidays of which: visits to
friends and relatives
Travels for business
2004 2008 2004 2008 2004 2008 2004 2008
Total 485127 917083 325610 845468 208993 411190 159517 71615 Percentages 100 100 67.1 92.2 64.2* 49.00* 32.9 7.8 Average annual growth (%) ’04-‘08 17.2 27.0 18.4 -18.0
Source: Sample statistical survey: "Tourism demand of the residents in Romania" *Percents of VFR calculated from the Total travels for holidays

IULIANA POP, ANDREEA MARIN- PANTELESCU
40
Significant changes can be observed in the structure of the Romanian travels abroad for holidays and business. In 2004 holidays represented 67% of the total travels abroad and in 2008 92%, instead for business in 2004 there were 33% of the total travels abroad and in 2008 only 8% of the total travels abroad. This represents a consequence of the world economic crisis that affected all businesses around the globe. The Romanian travels abroad for business experienced a 18% annual decrease between 2004 and 2008.
2004
holidays67%
business33%
2008
holidays92%
business8%
Fig. 3. The structure of the Romanian travels abroad for holidays and business in 2004 and 2008
We reserved the end for analyzing the VFR Romanian sector. The figures for 2004 and 2008 present an evolution of the leisure sector from 36% in 2004 to 51% in 2008, and a regression of the VFR sector from 64% in 2004 to 49% in 2008. Still the reasons for Romanian travels abroad for visits to friends and relatives remain an important factor for the Romanian tourism market.
2004
Leisure36%
VFR64%
2008
VFR49%
Leisure51%
Fig. 4. The structure of the Romanian travels abroad for leisure and VFR in 2004 and 2008

ANALYZING THE CHANGES IN REASONS FOR TRAVEL OF THE ROMANIAN TOURISTS
41
The hospitality industry needs to take into consideration the size and characteristics of these reasons for travel. For example, the leisure and pleasure travelers include single people, couples, couples with children, the young, the elderly, the wealthy, middle-income earners, and low income earners. Income and the period of available time leave-time are consideration for these travelers (Kotler et all, 2005). The selection of a leisure customer mix depends on the hotel location, its surrounding attractions, tourism infrastructure and the facilities being offered. On the other hand, the accommodation needs of business travelers range from a modest room to a suite of rooms with luxurious, self-contained facilities. The hotels need to provide special meetings rooms, video-conferencing, computers, secretarial assistance, and fax facilities. As Wearne and Baker (2002) said they need to offer a virtual ‘office-away-from-the-office’ to attract the corporate service markets.
4. Conclusions The presented paper conducted an analysis regarding the changes
registered in the reasons for travel of the tourists in general, and of the Romanian tourists in particular. The analysis presented the characteristics of the main categories of tourism by the purpose of trip (holiday, business, VFR, and others) and also calculated the share of these categories in 2004 and 2008 for better understanding of the transformation in the tourism structure. The paper is important for the hospitality sector because there customer mix is based of these major segments and the changes need to be taken into consideration for the following years.
The results indicated not significant changes from 2004 to 2008 in reasons for travel of the world inbound tourism from 2004-2008 but notable transformations in growth of the three segments (holidays, business and others like VFR).
Regarding the Romanian analysis in the same period of time, significant changes can be observed in the structure of the Romanian travels abroad for holidays and business. In 2004 the holidays represented 67% of the total travels abroad and in 2008 92%, instead for business in 2004 there were 33% of the total travels abroad and in 2008 only 8% of the total travels abroad. This represents a consequence of the world economic crisis that affected all businesses around the globe. The Romanian travels abroad for business experienced a diminution of 18% annual between 2004 and 2008.
In respect to the VFR segment the figures for 2004 and 2008 present an evolution of the leisure sector from 36% in 2004 to 51% in 2008, and a regression of the VFR sector from 64% in 2004 to 49% in 2008. Still the reasons for Romanian travels abroad for visits to friends and relatives remain an important factor for the Romanian tourism market.
In the end we can say that travelling is a 'once in a lifetime' experience! No matter how broke you return home (due to the economic crisis) you will have memories, friends and experiences that no one can take away from you. And that is
IULIANA POP, ANDREEA MARIN- PANTELESCU
42
exactly why people set off on trips around the world. They want to see new things, meet new people, learn about different cultures, explore the world in their own pace and actually experience what others only dream about their whole lives. To be sure, it requires serious saving and planning. Moreover, there will be people around you who won't understand or want you to go. Whatever it is, if we are determined, nothing should stop us.
REFERENCES
1. Davidson, R. (1994) Business Travel, Pitman 2. Denver Severt, Youcheng Wang, Po-Ju Chen, Deborah Breiter (2007) Examining the
motivation, perceived performance, and behavioral intentions of convention attendees: Evidence from a regional conference, Tourism Management, Vol.28, Iss. 2
3. Holloway J. Christopher (2004) Marketing for Tourism, Prentice Hall, Fourth Edition, Harlow, England
4. Kotler Philip, Bowen T. John, Makens C. James (2005) Marketing for Hospitality and Tourism, 4th Edition, Prentice Hall Publisher, United Kingdom
5. Marin-Pantelescu Andreea (2009) Diversificarea si personalizarea serviciilor turistice in contextual globalizarii, Editura ASE, Bucuresti
6. Pender Lesley (2005) Marketing Management for Travel and Tourism, Stanley Thorne Publishers, Great Britain
7. Schlentrich, U.A. (1996) Business Travel Marketing, Seaton 8. Seaton and Palmer (1997) Understanding VFR tourism behavior, Tourism Management,
Vol.18, No. 6, pp. 345-55 9. Tourism Highlights (2005, 2009 Edition) Facts & Figures, UNWTO 10. Tourism demand of the residents in Romania (2005, 2009) Romanian Statistical
Yearbook 2005 11. Wearne Neil, Baker Kevin (2002) Hospitality Marketing in the e-Commerce Age,
Second Edition, Hospitality Press

STUDIA UNIVERSITATIS BABEŞ-BOLYAI, NEGOTIA, LV, 4, 2010
ROMANIAN STUDENTS AS CULTURAL TOURISTS
ALEXANDRA ZBUCHEA1, MIHAELA DINU2
ABSTRACT. Students could be important clients for travel agents since they do not have strong family - or even professional - responsibilities, they are more flexible in terms of the available time, they are more dynamic and eager for new experiences. Still, travel agents seem not to target them so much, probably considering that they prefer self-organized travels. In order to attract this special segment of tourists, more exploration is needed, to develop the profile of students as tourists, to uncover their interests in the field. The present study investigates the profile of Romanian students, both undergraduates and master-degree students, as cultural tourists. The research reveals that students are generally interested in all forms of tourism, including cultural tourism, they tend to travel more since their affiliation to the university, including for cultural reasons. The differences among male and female students are not so much related to traveling patterns but to the reasons and context of it. Young cultural tourists tend to be more self-concerned than other student tourists. The interest in traveling abroad for cultural reasons increases with the frequency of cultural travel in Romania as well as with the interest in culture in general. Keywords: students, cultural tourism, tourism patterns, Romania. JEL classification: L83 1. Introduction
There is a long tradition of tourism for students in Romania. During the communist regime, the state offered various packages for different categories of pupils, high-school students, as well as undergraduates: trips from two to several days outside the place of residence, organized one-day visits to different cultural objectives, holiday camps. The first two types of packages were mainly forms of cultural tourism, since most of the visited objectives were monuments and museums. Most of them were organized for pupils and high-school students. They has a strong educational reason, but also ideological.
The holiday camps were mainly part of the recreational tourism, but during the sojourn the participants could develop different types of cultural activities, as well as various sports, and even contests. Generally, the holiday camps for pupils and high-school students were paid for by the families of the participants, while student camps 1 Assistant professor, PhD, College of Communication and Public Relations, National School of Political
and Administrative Studies Bucharest, Romania, [email protected] 2 Professor, PhD, College of Inbound and International Tourism, Romanian American University,
Bucharest, Romania, [email protected]
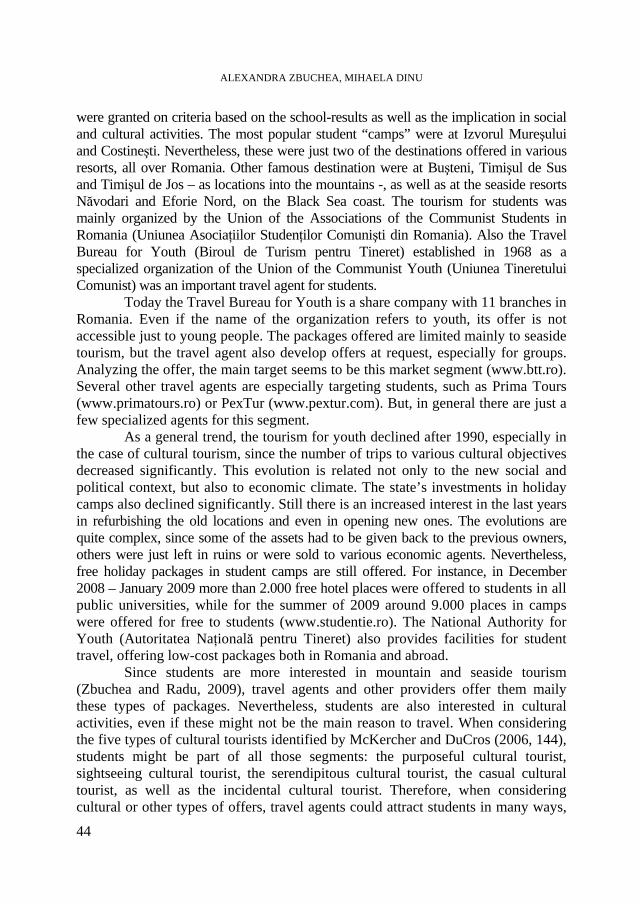
ALEXANDRA ZBUCHEA, MIHAELA DINU
44
were granted on criteria based on the school-results as well as the implication in social and cultural activities. The most popular student “camps” were at Izvorul Mureşului and Costineşti. Nevertheless, these were just two of the destinations offered in various resorts, all over Romania. Other famous destination were at Buşteni, Timişul de Sus and Timişul de Jos – as locations into the mountains -, as well as at the seaside resorts Năvodari and Eforie Nord, on the Black Sea coast. The tourism for students was mainly organized by the Union of the Associations of the Communist Students in Romania (Uniunea AsociaŃiilor StudenŃilor Comunişti din Romania). Also the Travel Bureau for Youth (Biroul de Turism pentru Tineret) established in 1968 as a specialized organization of the Union of the Communist Youth (Uniunea Tineretului Comunist) was an important travel agent for students.
Today the Travel Bureau for Youth is a share company with 11 branches in Romania. Even if the name of the organization refers to youth, its offer is not accessible just to young people. The packages offered are limited mainly to seaside tourism, but the travel agent also develop offers at request, especially for groups. Analyzing the offer, the main target seems to be this market segment (www.btt.ro). Several other travel agents are especially targeting students, such as Prima Tours (www.primatours.ro) or PexTur (www.pextur.com). But, in general there are just a few specialized agents for this segment.
As a general trend, the tourism for youth declined after 1990, especially in the case of cultural tourism, since the number of trips to various cultural objectives decreased significantly. This evolution is related not only to the new social and political context, but also to economic climate. The state’s investments in holiday camps also declined significantly. Still there is an increased interest in the last years in refurbishing the old locations and even in opening new ones. The evolutions are quite complex, since some of the assets had to be given back to the previous owners, others were just left in ruins or were sold to various economic agents. Nevertheless, free holiday packages in student camps are still offered. For instance, in December 2008 – January 2009 more than 2.000 free hotel places were offered to students in all public universities, while for the summer of 2009 around 9.000 places in camps were offered for free to students (www.studentie.ro). The National Authority for Youth (Autoritatea NaŃională pentru Tineret) also provides facilities for student travel, offering low-cost packages both in Romania and abroad.
Since students are more interested in mountain and seaside tourism (Zbuchea and Radu, 2009), travel agents and other providers offer them maily these types of packages. Nevertheless, students are also interested in cultural activities, even if these might not be the main reason to travel. When considering the five types of cultural tourists identified by McKercher and DuCros (2006, 144), students might be part of all those segments: the purposeful cultural tourist, sightseeing cultural tourist, the serendipitous cultural tourist, the casual cultural tourist, as well as the incidental cultural tourist. Therefore, when considering cultural or other types of offers, travel agents could attract students in many ways,
ROMANIAN STUDENTS AS CULTURAL TOURISTS
45
stimulating in the same time their interest in cultural tourism attractions. Travel agents should also consider that maybe students are not as informed in terms of cultural possibilities related to a certain destination, as older adults, but they are conscious that cultural objectives and local culture can increase the tourism experience. Others would just aim to gain a certain personal status though cultural tourism, or just increase their photo collection (Boniface and Fowler, 1993).
Students form a heterogeneous group of people, from every perspective: family background, age, incomes and others. Nevertheless, they also have similarities. In this context, it is important to understand the different segments of students when considering tourism. A study on the adult tourists, developed by Jonsson and Devonish (2008, 407), show that age and nationality are significant factors when choosing the destination, while the gender is not relevant. Does it apply to students? How do they inform on the travel? Are they explorers or planners (Alvarez and Assugman, 2006)? An understanding of the vacation behavior is also important in order to understand the tourists (Bargeman et al, 2009) and to offer what they appreciate. There are a lot of things to take into account by a travel agent in order to successfully develop and promote packages to students.
2. Material and methods Are Romanian students interested in cultural tourism?
Informal interviews, observation and previous research of the Romanian students as travelers suggest that they are more interested in mountain and seaside tourism than in cultural tourism (see also Zbuchea and Radu, 2009). The interest in cultural tourism in the last years, especially in the one abroad, might be related to the economic and political developments. For instance, in the last years, close to the main cultural attractions, accommodation and other tourism facilities were developed. In the same time, compared to a decade ago it is easier for Romanians, including students, to travel. The studies also show a strong interest in traveling abroad, that might include a strong component on cultural tourism. The increased number of travel abroad is also related to economic and political factors. The most important events is the entrance of Romania in the European Union which led to the visa lifting for the Romanians.
Generally, students declare cultural tourism objectives are of interest, but they do not seem to be traveling frequently for cultural reasons. In the same time, as for other types of tourists, even if culture is not scope of travel, student tourists also visit at least the famous cultural attraction at the destination. In the same time the cultural travel and interests of students are manifest during inter-academic exchanges, such as the European Erasmus Scheme, or during other student programs such and Work and Travel or Study and Work in various countries all over the world. Most of the students studying abroad travel for personal reasons rather than academic while at the destination (Michael et al, 2004: 62).
Since students are numerous, interested in tourism, with more free-time as other adults, more dynamic and curious, traveling in different circumstances, they

ALEXANDRA ZBUCHEA, MIHAELA DINU
46
could be important customers for travel agents, including the context of cultural tourism. In order to propose them the most appropriate packages, travel agents should understand students as tourists. The present investigation aims just to set the profile of the Romanian student interested in cultural tourism.
Methodology
The objectives of the present study are to understand the interests of Romanian students regarding tourism, to see the frequency of travel for cultural reasons among students, to understand the reasons why some students if any would prefer cultural tourism compared to other forms of tourism. An online survey was developed since the internet is the most appropriate way to contact students from all the Romanian university centers. The survey is a short one, since the rate of abandon is generally high for longer questionnaires. Therefore, even if the topic investigated is complex, limited objectives are targeted.
The main limits of the survey are also related with the investigation methodology. There is no direct contact with the respondents, no way to persuade them to fully fill in the survey, no way to assure the representativity of the sample. Probably, those who filled in the questionnaire are particularly interested in tourism; probably they travel more than other students. Therefore it is likely that the results reflect a more dynamic phenomenon and stronger interests than the average within the segment investigated.
Respondents
More than 1,000 students started to fill in the questionnaire, but just cca. 62% of them finished it. Almost 48% of the respondents are undergraduates, all the others being master-degree students. More than 90% of the respondents study in a public university, the others being in a private university. In general, respondents are young, 85% of them are less than 25 years old, 9% are between 26 and 30 years old, while around 7% are older than 30 years. Women proved to be more open in answering the survey – almost 85% of the respondents. Around 33% of the respondents do not work, while almost half have full-time jobs. Therefore most of the students do not have so much time for leisure activities, and they have limited vacations than the official breaks allowed by the universities.
In terms of income, the respondents are divided as follows: 46% earn less than 200 euros/month, cca. 25% - 200-350 euros, 21% - 350-750 euro, cca. 7% - more than 750 euros. 70% of the respondents receive additional funds from their parents or other members of their families. This reflects the tradition of the Romanian families. It allows students to concentrate more on their studies. In the same time, some of the students receiving family funds do have additional time for other activities, but studying, including for traveling.
When considering the personal background, 29% of the respondents were born in a town other than Bucharest and 19% spent their childhood in Bucharest.

ROMANIAN STUDENTS AS CULTURAL TOURISTS
47
All the others were born in smaller settlements. 56% of the respondents have a steady relation, even if they are not married. 33% are not involved in a relation. Just 10% of the respondents are married. This data is in concordance with the statistics referring to the increased marriage-age.
Considering their academic background, the responses show the following situation: less than 30% have economic major, more than 20% - communication or public relations, less than 20% - psychology or sociology, more than 10% - humanistic studies, almost 5% - technical studies, around 10% - other studies (law, medicine etc.) Less than 20% of the students answering the survey are registered to forms of distance learning. Almost 2/3 of the respondents are living in large cities (almost 25% in Bucharest). Therefore they are generally familiar with cultural events, since the offer in their residence place should be diverse.
The respondents declared they like new experiences (4.4 points put of 5). They consider themselves to be more likely liberals (3.9 points out of 5) and modern (3.8 points). The respondents also stated they rather love adventure (3.7). They affirmed in a much smaller degree that they love strong emotions (3.4), are non conformists (3.4) or they take risks (3.3).
The profile of the respondents shows that the opinions expressed are representative for unmarried young Romanian students, with small to medium incomes. Women’s opinions are better characterized.
3. Results and discussions
Almost a quarter of the respondents have never practiced cultural tourism, not even in Romania. It does not mean that they do not have cultural experiences, but it shows a strong disinterest in cultural. 10% have been just once in their lifetime in such a vacation. Just 6% could be considered loyal to this form of tourism, since they travel for cultural purposes at least 5 times every year. The percentage of men in this sub-segment is higher.
0 10 20 30 40 50 60 70 80
regular student
distance-learning student
master-degree student
distance-learning master-degree student several times per month
monthly
5-10 times per year
2–4 times per year
once per year
once every several years
once
never
Fig. 1. Interest in cultural tourism in Romania, considering various types
of students (no. of respondents)
ALEXANDRA ZBUCHEA, MIHAELA DINU
48
Data shows that students registered at regular forms of study, both undergraduates and postgraduates as well, are much more interested in cultural tourism. This might be related either to stronger responsibilities that the other students might have, and/or to a more intense inclination towards self development. Master degree students are more active in the field of cultural tourism, as expected. Women also tend to be more involved in cultural tourism than men. Nevertheless, almost 6% of men compared to 1% of women declare that they go in cultural travels at least once monthly.
The most popular form of tourism among the Romanian students is mountain tourism (especially resort tourism) and seaside tourism. Almost 25% of the respondents consider that since they are students they are practicing more cultural tourism than before. The percentage is even more significant in the case of men. We mention that the trends are ascendant in the cases of mountain tourism, of seaside tourism and even of cultural tourism, while they are descendent in the cases of rural tourism, of shopping tourism and of spa tourism. All the data above refers to travels in Romania. There are no special characteristics (such as income, age etc.) identified regarding those who practice cultural tourism. There is a tendency of having smaller incomes and to be unmarried, but it is not statistically significant.
Those who declared to practice cultural tourism often tend to be less price conscious and to inform themselves before the trip more than other students, but again data is not fully relevant from a statistical point of view. When considering the costs, it is important to notice that those interested in cultural tourism are somewhat low income persons. If prices are not very relevant for them, we consider conclude that their desire for cultural tourism is very motivating and they would be ready to make efforts in order to afford cultural travels. They also declare not to be very interested in the high quality of accommodation conditions. Data suggests that they consider the interests and opinions of friends not as important compared to the other students. Therefore the inner resorts and their own judgment are more important.
When considering cultural tourism in foreign countries, the percentage of the respondents who have never experienced it increases to 40%, while a bit more than 25% have been just once every several years. Almost 25% of the respondents travel abroad at least once a year for cultural tourism. Just 2 of the respondents (0.3%) go very often for cultural tourism abroad (at least 5 times every year). The most popular forms of tourism abroad among the Romanian students are seaside tourism and shopping tourism. They prefer to practice mountain tourism in Romania. Those who prefer cultural tourism abroad tend to be master-degree students. This is probably related to their higher incomes and more opportunities to travel abroad. Those who travel abroad more often for cultural reasons are not necessary the most frequent cultural tourists in Romania. All students would like to travel more abroad, but the figures are higher for women (4.6 points out of 5 for women compared to 4.1 for men).
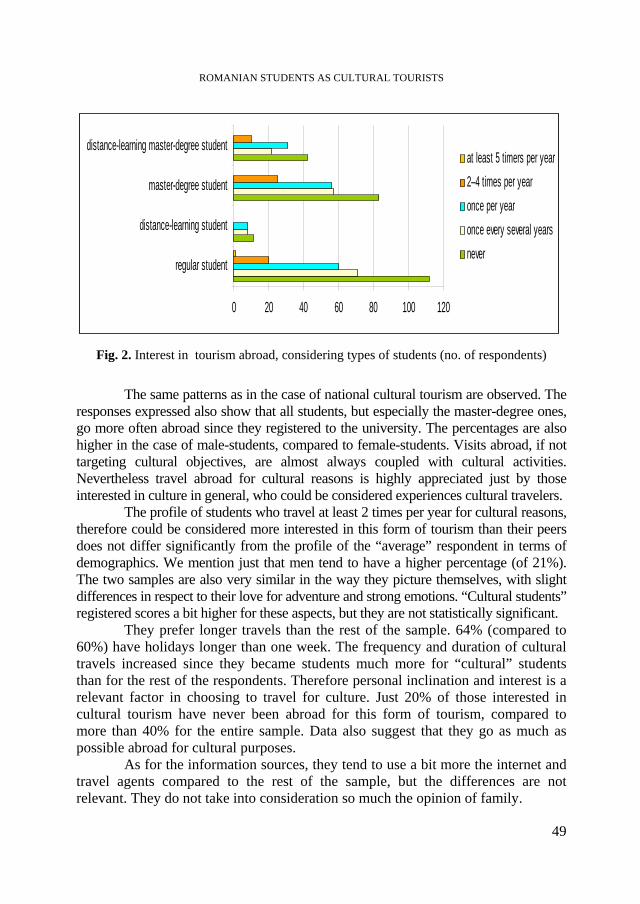
ROMANIAN STUDENTS AS CULTURAL TOURISTS
49
0 20 40 60 80 100 120
regular student
distance-learning student
master-degree student
distance-learning master-degree studentat least 5 timers per year
2–4 times per year
once per year
once every several years
never
Fig. 2. Interest in tourism abroad, considering types of students (no. of respondents)
The same patterns as in the case of national cultural tourism are observed. The
responses expressed also show that all students, but especially the master-degree ones, go more often abroad since they registered to the university. The percentages are also higher in the case of male-students, compared to female-students. Visits abroad, if not targeting cultural objectives, are almost always coupled with cultural activities. Nevertheless travel abroad for cultural reasons is highly appreciated just by those interested in culture in general, who could be considered experiences cultural travelers.
The profile of students who travel at least 2 times per year for cultural reasons, therefore could be considered more interested in this form of tourism than their peers does not differ significantly from the profile of the “average” respondent in terms of demographics. We mention just that men tend to have a higher percentage (of 21%). The two samples are also very similar in the way they picture themselves, with slight differences in respect to their love for adventure and strong emotions. “Cultural students” registered scores a bit higher for these aspects, but they are not statistically significant.
They prefer longer travels than the rest of the sample. 64% (compared to 60%) have holidays longer than one week. The frequency and duration of cultural travels increased since they became students much more for “cultural” students than for the rest of the respondents. Therefore personal inclination and interest is a relevant factor in choosing to travel for culture. Just 20% of those interested in cultural tourism have never been abroad for this form of tourism, compared to more than 40% for the entire sample. Data also suggest that they go as much as possible abroad for cultural purposes.
As for the information sources, they tend to use a bit more the internet and travel agents compared to the rest of the sample, but the differences are not relevant. They do not take into consideration so much the opinion of family.
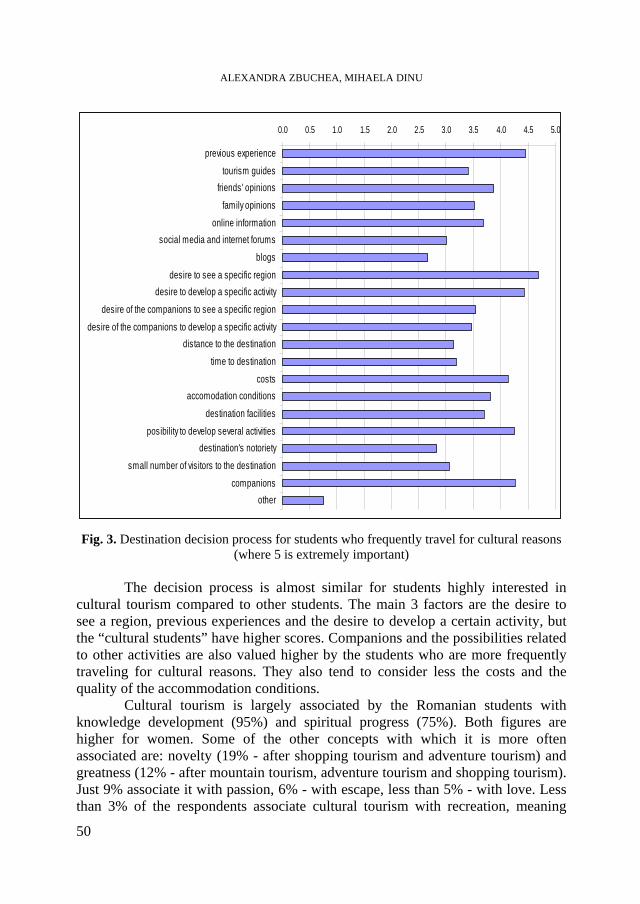
ALEXANDRA ZBUCHEA, MIHAELA DINU
50
0.0 0.5 1.0 1.5 2.0 2.5 3.0 3.5 4.0 4.5 5.0
previous experience
tourism guides
friends' opinions
family opinions
online information
social media and internet forums
blogs
desire to see a specific region
desire to develop a specific activity
desire of the companions to see a specific region
desire of the companions to develop a specific activity
distance to the destination
time to destination
costs
accomodation conditions
destination facilities
posibility to develop several activities
destination's notoriety
small number of visitors to the destination
companions
other
Fig. 3. Destination decision process for students who frequently travel for cultural reasons
(where 5 is extremely important) The decision process is almost similar for students highly interested in
cultural tourism compared to other students. The main 3 factors are the desire to see a region, previous experiences and the desire to develop a certain activity, but the “cultural students” have higher scores. Companions and the possibilities related to other activities are also valued higher by the students who are more frequently traveling for cultural reasons. They also tend to consider less the costs and the quality of the accommodation conditions.
Cultural tourism is largely associated by the Romanian students with knowledge development (95%) and spiritual progress (75%). Both figures are higher for women. Some of the other concepts with which it is more often associated are: novelty (19% - after shopping tourism and adventure tourism) and greatness (12% - after mountain tourism, adventure tourism and shopping tourism). Just 9% associate it with passion, 6% - with escape, less than 5% - with love. Less than 3% of the respondents associate cultural tourism with recreation, meaning

ROMANIAN STUDENTS AS CULTURAL TOURISTS
51
they consider it to be an active form of tourism. Fun is not associated with cultural tourism (except for 1%). Still, it is not boring either (just 3.5% consider it to be more boring than all the other forms of tourism).
More master-degree students, up to 25 years old, tend to associate cultural tourism with novelty. Those who primarily associate cultural tourism with knowledge development prefer active holidays in a wider degree than other students. More women than men are inclined to relate cultural tourism with spiritual progress as mentioned above. Other significant differences observed between women and men are: more women consider cultural tourism to be relaxing, but more men associate it with performance but also with love and passion. Women, on their turn associate it much more with team (almost 9% compared to 0 associations made by men). Women tend to associate it more with fun but also solitude, while men with boredom. Data suggest that men are more romantically involved when considering cultural tourism, while women are oriented more towards personal development and group activities.
The potential interest of the Romanian students for cultural tourism seem to be high, since they prefer active forms of tourism (average of 3.7 points out of 5) and itinerary tourism (3.5 points). They also declare, generally, to favor several shorter vacations instead of a single longer travel to just one destination. Maybe this is related not only with their personal preferences, but also with the distribution of the student holidays.
We also investigated which are the sources of information when traveling. The most reliable ones are considered to be friends (3.95 points out of 5) and family (3.86), followed by travel guides and the internet (websites dedicated to tourism and forums). Paradoxically, even if the internet is viewed as pretty reliable, websites of nonprofits and blogs are considered the least useful sources (2.59 points, respectively 2.67).
The most important elements when choosing a destination are: the desire to visit a certain region (4.6 points out of 5), experiences shared to them (4.4), costs and the desire to undergo some activities (4.3 each), as well as the desires of the persons with whom the students travel (4.2).
4. Conclusions and implications
Cultural tourism is popular among Romanian students, both undergraduates and master-degree students, but not as popular as mountain tourism or seaside tourism. Women are interested in cultural tourism in a wider degree than men. Those who travel more often for cultural reasons tend to be postgraduates, but young persons, unmarried.
Students practicing cultural tourism are more interested in their opinions and desires and are less influenced than other students in choosing the destination or the activities during the travel. They also document more on the voyage, on the destination.
Those who are more fervent cultural tourists are not so interested in the living conditions during the travel. In the same time they tend to be less influenced
ALEXANDRA ZBUCHEA, MIHAELA DINU
52
by the costs and incomes lean not to influence the travel habits or interests. We mention in this context, that cultural tourism is cheaper for students compared to other adults traveling in the same conditions (for instance cultural organizations have smaller entrance-fees for students).
Cultural students are also interested more in active vacations, with which they tend to associate cultural tourism (in a larger degree than the rest of the students). This is also widely associated with spiritual and knowledge development.
The results show that both undergraduate and postgraduate Romanian students, especially unmarried women, are interested in cultural tourism, especially when offered an active, itinerary form of travel. More mature and married students tend to be less active and go more rarely for cultural purposes, but the results are not definite in this respect. It has to be further investigated these aspects and examined if this is the result of an decrease in the interest for cultural tourism, or it is related with lack of time and different social and practical changes in the life of an adult, who might be married and with children.
REFERENCES
1. Alvarez, Maria and Asugman, Gulden (2007), Explorers versus planners – a study of Turkish tourists, Annals of Tourism Research, 33 (2), 319–338.
2. Bargeman, Bertine; Joh, Chang and Timmermans, Harry (2002), Vacation behavior using a sequence alignment method, Annals of Tourism Research, 29 (2), 320–337.
3. Boniface, Priscilla and Fowler, Peter (1993), Heritage and tourism in "the Global Village", London: Routledge.
4. Dinu, Mihaela (2008), Geografia turismului, Bucureşti: Edit. Universitară. 5. Jonsson, Christina and Devonish, Dwayne (2008), Does Nationality, Gender, and
Age Affect Travel Motivation? a Case of Visitors to The Caribbean Island of Barbados, Journal of Travel & Tourism Marketing, 25 (3), 398-408
6. McKercher, Bob and DuCros, Hilary (2003), Testing a cultural tourism typology, International Journal of Tourism Research, 5, 45-58.
7. McKercher, Bob and DuCros, Hilary (2006), Cultural Tourism, Binghampton: Hawort Hospitality Press.
8. Michael, Jan; Armstrong, Anona and King, Brian (2004), The travel behaviour of international students: The relationship between studying abroad and their choice of tourist destination, Journal of Vacation Marketing, 10, 57-66.
9. Zbuchea, Alexandra and Radu, Olivia (2009), Mountain tourism in Romania and its attractiveness on students, Journal of Tourism Challenges and Trends, 2 (1), 43-64.
STUDIA UNIVERSITATIS BABEŞ-BOLYAI, NEGOTIA, LV, 4, 2010
DEMAND INFLUENCE ON TOURIST ACCOMMODATION CAPACITY DEVELOPMENT
ADINA LETIŢIA NEGRUŞA1, OANA ADRIANA GICĂ2, CARMEN MARIA GUŢ3
ABSTRACT. Belonging to the tertiary sector of the national economy, tourism plays the role of a barometer that strictly measures its development, and the changes that occur in the economy bear upon it. Tourism plays a dual role: a direct economic role, which consists in generating revenues and creating receipts that feed the national income and an indirect economic role, that assumes the development of other branches of the national economy. The purpose of our paper is the analysis of the touristic demand and supply in Transylvania, more specific in North-West, Centre and West regions. We used the information provided by the National Institute of Statistics and data were processed using Excel Office. As the data shows the touristic demand growth started with 2002, while it took one year for the supply to respond to this trend. The biggest increase of touristic supply was registered in Centre Region (17.38%), and this seems obvious given that this region has enjoyed the highest demand for tourist services. Key words: tourist arrivals, overnight staying, length of stay, accommodation capacity, touristic demand, touristic supplyy. JEL classification: L83, O18
1. Introduction The tourism sector is probably the only service sector that provides
concrete and strong trading opportunities for all nations, regardless of their level of development. For many developing countries tourism is a fundamental sector of their economy and for other it is only a source of foreign currency and employment. The importance of tourism to national economies is well recognized
1 Senior Lecturer, PhD, Faculty of Business, Babes-Bolyai University, Cluj-Napoca, [email protected]
2 Assistant Lecturer, PhD student, Faculty of Business, Babes-Bolyai University, Cluj-Napoca, [email protected]
3 Assistant Lecturer, PhD, Faculty of Business, Babes-Bolyai University, Cluj-Napoca, [email protected]

ADINA LETIŢIA NEGRUŞA, OANA ADRIANA GICĂ, CARMEN MARIA GUŢ
54
due to its benefits. Many benefits are mentioned in the literature at different level social, cultural, economical, political and environmental. From all of these, economical are the most researched and studied.
According to World Travel and Tourism Council, in 2010 Romania’s Travel and Tourism direct industry is expected to contribute 1.9 % of the GDP and will account for 267.000 jobs (3.2% of total employment). The Travel and Tourism Economy contribution is expected to be 5.1% of total GDP and of 6.1% of total employment.
A variety of methods and analysis techniques were developed, from simple factors association to complex mathematical models, for estimating and measuring economic tourism’s impacts. Businesses and public organizations are increasingly interested in the economic impacts of tourism at national, state and local level. The approached of economic impact of tourism should start with identification of these benefits, which come in seven major groups: income generation, tax revenue generation, balance of payment effects, improvement of economic structure, increasing the employment opportunities and encouragement of entrepreneurial activity.
In evaluating economic impacts the most important approaches are: multiplier analysis, Input-Output analysis and Computable General Equilibrium (CGE) models. Our research has been based on Input-Output analysis (Butler, 1980, Fletcher, 1994, Crompton, Lee &Shuster, 2001) which highlight that a change in tourism spending will lead to additional activity in related industries. These types of models estimate the increase in economic activity associated with some tourism expenditure change, by calculating the increase in output directly, and adding the extra output in related industries. We take into account the conceptual models of Butler and Walker, which provide the possibility to explore the cycle of tourism development and flow-on effects in the industry. The important growth of the tourists’ number in a specific destination determines an increase in the demand for tourist infrastructure (Butler, 1980). The main element of tourism facilities is accommodation sector. For developing tourism flow, accommodation must be available in the right quantity and quality to mach with the demand of travelers who arrived at the destination. In this way a growth of the tourist number determined intensification in business activity and investment flow in hospitality industry. Due to the potential of high revenue in this sector, hospitality industry became attractive for other entrepreneurs which starting new businesses. The outputs completing the loop with a strong and well developed infrastructure, increasing tourism spending, opportunities for other related businesses and sectors of the local economy which lead to tourism growth.
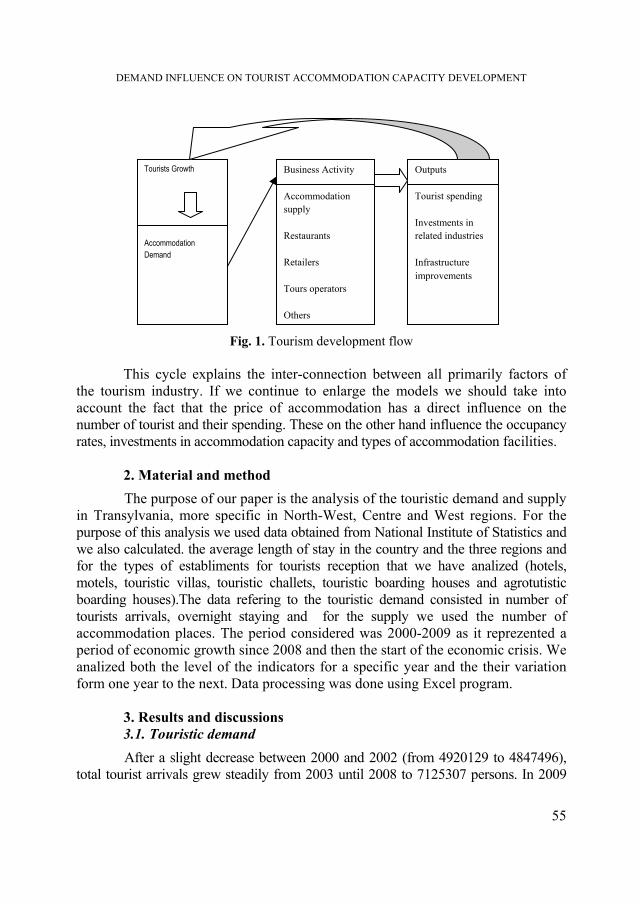
DEMAND INFLUENCE ON TOURIST ACCOMMODATION CAPACITY DEVELOPMENT
55
Fig. 1. Tourism development flow
This cycle explains the inter-connection between all primarily factors of the tourism industry. If we continue to enlarge the models we should take into account the fact that the price of accommodation has a direct influence on the number of tourist and their spending. These on the other hand influence the occupancy rates, investments in accommodation capacity and types of accommodation facilities.
2. Material and method The purpose of our paper is the analysis of the touristic demand and supply
in Transylvania, more specific in North-West, Centre and West regions. For the purpose of this analysis we used data obtained from National Institute of Statistics and we also calculated. the average length of stay in the country and the three regions and for the types of establiments for tourists reception that we have analized (hotels, motels, touristic villas, touristic challets, touristic boarding houses and agrotutistic boarding houses).The data refering to the touristic demand consisted in number of tourists arrivals, overnight staying and for the supply we used the number of accommodation places. The period considered was 2000-2009 as it reprezented a period of economic growth since 2008 and then the start of the economic crisis. We analized both the level of the indicators for a specific year and the their variation form one year to the next. Data processing was done using Excel program.
3. Results and discussions 3.1. Touristic demand
After a slight decrease between 2000 and 2002 (from 4920129 to 4847496), total tourist arrivals grew steadily from 2003 until 2008 to 7125307 persons. In 2009
Tourists Growth
Accommodation Demand
Outputs
Tourist spending
Investments in related industries
Infrastructure improvements
Business Activity
Accommodation supply
Restaurants
Retailers
Tours operators
Others

ADINA LETIŢIA NEGRUŞA, OANA ADRIANA GICĂ, CARMEN MARIA GUŢ
56
tourists’ arrivals decreased with approximately 14% to 6141135 persons. The most important increases were registered in 2004 (11.5%) and 2007 (12.16%). Tourism demand registered a slightly different trend in the three regions analyzed. Thus, in the North West region, the entire period 2000-2008 was a period of growth, the most important (approximately 14%) occurring in 2007, while in 2009 tourist arrivals dropped significantly from the previous year (approximately 20%). Regarding the Centre region, 2001, 2002, 2008 and 2009 brought a decrease in the number of tourists compared to previous years, the biggest drop occurring in 2009 (17%). Between 2003 and 2007 tourist arrivals have increased by percentages ranging from 17% (in 2004) to 8.3% in 2005. In the West region the number of tourists dropped in 2001, 2002, 2005, 2008 and 2009 which represents half of the reported period, with the largest decline, of 14.65% being registered in 2009. The greatest increase, of 14.7% was registered in 2004.
0
200000
400000
600000
800000
1000000
1200000
1400000
2000 2001 2002 2003 2004 2005 2006 2007 2008 2009
North-West Region Centre RegionWest Region
Source: National Institute of Statistics
Fig. 2. Tourist arrivals by region
In conclusion, the most important growth during 2000-2009 was registered in the Centre region and the most significant reduction was recorded in the North West. Of the three regions analyzed, North-West, Centre and West, Centre region is one which enjoyed the highest demand for tourist services.

DEMAND INFLUENCE ON TOURIST ACCOMMODATION CAPACITY DEVELOPMENT
57
Depending on the types of tourist structures, the biggest increase in tourist arrivals in the period 2000-2009, was recorded in 2004 for agroturistic boarding houses (66.5% over 2003). The year 2004 brought the greatest number of tourists’ increases for all forms of structures analyzed, except touristic chalets and hotels, where the biggest growth of 29.5% and respectively, 10.3% were recorded in 2007. The most significant decreases of the reported period were recorded in 2009 for all forms of tourist structures, except touristic villas, where their biggest drop occurred in 2001. The largest decrease, of over 25%, was registered by motels.
010000002000000300000040000005000000600000070000008000000
2000 2001 2002 2003 2004 2005 2006 2007 2008 2009Hotels MotelsTouristic villas Touristic chaletsTouristic boarding houses Agroturistic boarding housesTotal
Source: National Institute of Statistics
Fig. 3. Arrivals of tourists accommodated in the structure of tourists’ reception
In the case of hotels, the biggest increase, in the reported period, of 15.5% was recorded in the West region in 2004, and the most significant reduction, of 18%, occurred in 2009, in the North-West Region. Motels have registered the most significant increase in the number of tourists (33.7%) in 2002 in the Centre region. The same region has recorded also the most significant decrease, in demand, of over 31, in 2009. The North-West region has seen the largest increase in the number of tourists (52.49%) in touristic villas, in 2001. In 2002, the Centre region registered the largest decline in the number of tourists in touristic villas (about 33%). The greatest increase in the number of tourists in touristic chalets (of over 90%), of the three regions in the analyzed period, was recorded in 2007, in the North-West region, while the most significant drop (over 37%), was recorded in the same region in 2001.

ADINA LETIŢIA NEGRUŞA, OANA ADRIANA GICĂ, CARMEN MARIA GUŢ
58
In 2003, the North-West region, has recorded the largest growth (of over 96%) in the number of tourists in touristic boarding houses, while 2009 brought the most significant reduction, of approximately 22%, also in the North-West region. Arrivals of tourists in agroturistic boarding houses rose above 4.55 times in the West region in 2001. In 2009 it was registered the largest drop (approximately 28%) in touristic demand in the boarding houses, in the North-West region.
Variation of overnight staying registered in the establishments of touristic reception was not significant in the period 2000-2009 at the country level, the most significant increase (8.43%), reported to the previous year, being recorded in 2007. The maximum number of overnight staying was recorded in 2008 when it arrived at the amount of 20.7 million, 2009 bringing the biggest drop of the reported period (16.5%).
0
5000000
10000000
15000000
20000000
25000000
2000 2001 2002 2003 2004 2005 2006 2007 2008 2009 NORTH-WEST Region CENTRE RegionWEST Region Series4TOTAL
Source: National Institute of Statistics
Fig. 4. Overnight staying by region
In the North-West region, the largest increase in the number of overnight
staying was recorded in 2001 (8%) and the most significant drop in 2009 (over 17%). In 2007 was recorded the maximum number of overnight staying of the period, 2.5 million.
The largest increase in the number of overnight staying (9.92%) in the Centre Region of the reported period, was registered in 2004, while the most significant reduction was recorded in 2009 (15.5%). The maximum number of overnight staying, 3.17 million, in this region, was reached in 2007.
The most significant increase (9.31%) in the number of overnight staying has been recorded in Western Region, in 2006, and the largest decline (15.5%) took
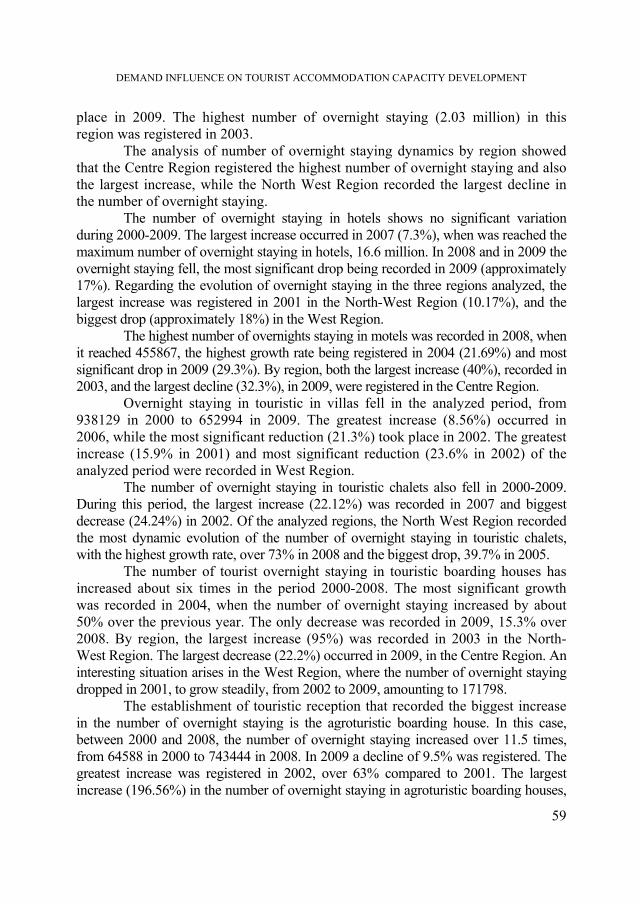
DEMAND INFLUENCE ON TOURIST ACCOMMODATION CAPACITY DEVELOPMENT
59
place in 2009. The highest number of overnight staying (2.03 million) in this region was registered in 2003.
The analysis of number of overnight staying dynamics by region showed that the Centre Region registered the highest number of overnight staying and also the largest increase, while the North West Region recorded the largest decline in the number of overnight staying.
The number of overnight staying in hotels shows no significant variation during 2000-2009. The largest increase occurred in 2007 (7.3%), when was reached the maximum number of overnight staying in hotels, 16.6 million. In 2008 and in 2009 the overnight staying fell, the most significant drop being recorded in 2009 (approximately 17%). Regarding the evolution of overnight staying in the three regions analyzed, the largest increase was registered in 2001 in the North-West Region (10.17%), and the biggest drop (approximately 18%) in the West Region.
The highest number of overnights staying in motels was recorded in 2008, when it reached 455867, the highest growth rate being registered in 2004 (21.69%) and most significant drop in 2009 (29.3%). By region, both the largest increase (40%), recorded in 2003, and the largest decline (32.3%), in 2009, were registered in the Centre Region.
Overnight staying in touristic in villas fell in the analyzed period, from 938129 in 2000 to 652994 in 2009. The greatest increase (8.56%) occurred in 2006, while the most significant reduction (21.3%) took place in 2002. The greatest increase (15.9% in 2001) and most significant reduction (23.6% in 2002) of the analyzed period were recorded in West Region.
The number of overnight staying in touristic chalets also fell in 2000-2009. During this period, the largest increase (22.12%) was recorded in 2007 and biggest decrease (24.24%) in 2002. Of the analyzed regions, the North West Region recorded the most dynamic evolution of the number of overnight staying in touristic chalets, with the highest growth rate, over 73% in 2008 and the biggest drop, 39.7% in 2005.
The number of tourist overnight staying in touristic boarding houses has increased about six times in the period 2000-2008. The most significant growth was recorded in 2004, when the number of overnight staying increased by about 50% over the previous year. The only decrease was recorded in 2009, 15.3% over 2008. By region, the largest increase (95%) was recorded in 2003 in the North-West Region. The largest decrease (22.2%) occurred in 2009, in the Centre Region. An interesting situation arises in the West Region, where the number of overnight staying dropped in 2001, to grow steadily, from 2002 to 2009, amounting to 171798.
The establishment of touristic reception that recorded the biggest increase in the number of overnight staying is the agroturistic boarding house. In this case, between 2000 and 2008, the number of overnight staying increased over 11.5 times, from 64588 in 2000 to 743444 in 2008. In 2009 a decline of 9.5% was registered. The greatest increase was registered in 2002, over 63% compared to 2001. The largest increase (196.56%) in the number of overnight staying in agroturistic boarding houses,

ADINA LETIŢIA NEGRUŞA, OANA ADRIANA GICĂ, CARMEN MARIA GUŢ
60
of the three regions analyzed, was recorded in the West Region in 2001, and the largest decline (28.2%) in the North-West Region, in 2009.
In terms of length of stay in the reported period, an increase occurred only in 2001, when the length of stay increased by 3.6% compared to 2000, reaching 3.7 days. Since 2002 the length of stay decreased from year to year, reaching 2.82 days in 2009. In each of the three regions analyzed, starting with 2003, the length of stay decreased each year, reaching 2.86 days in 2009, in the North-West Region, 2.48 in the Centre Region and to 2.91 days in the West Region.
Table 1. Length of stay by region
Length of stay 2000 2001 2002 2003 2004 2005 2006 2007 2008 2009
North-West Region
3.50 3.55 3.39 3.53 3.18 3.12 3.03 2.87 2.79 2.87
North-West Region (%)
1.01 0.95 1.04 0.90 0.98 0.97 0.95 0.97 1.03
Centre Region
2.95 3.10 3.08 2.88 2.70 2.61 2.52 2.39 2.44 2.48
Centre Region (%)
1.05 0.99 0.94 0.94 0.96 0.97 0.95 1.02 1.02
West Region 3.30 3.57 3.87 3.91 3.62 3.43 3.27 2.98 2.94 2.92
West Region (%)
1.08 1.08 1.01 0.93 0.95 0.95 0.91 0.99 0.99
Total 3.59 3.72 3.56 3.53 3.28 3.16 3.06 2.95 2.91 2.82
Total (%) 1.04 0.96 0.99 0.93 0.96 0.97 0.97 0.98 0.97
Source: own calculations based on data provided by the National Institute of Statistics Between 2000 and 2009 the average length of stay in hotels at country
level declined every year, from 3.68 in 2000 to 3 in 2009, except 2001 when compared to previous year, it increased by 4.87%. The average length of stay in the North-West and Centre Regions had the same trend as the nationwide. Unlike, the West Region increases were registered not only see in 2001 but also in 2002 and 2003, in 2009 the average length of stay (3.08 days) being smaller than in 2000 (3.38 days) as in the other two regions.
The average length of stay in motels increased generally, between 2000-2009, reaching 1.59 days, declines occurring in 2005 and 2006. In the North West Region, the average length of stay increased annually during 2000-2004, from 1.31 to 1.7, for 2005 to 2009 to decrease to 1.58 days. In the Centre Region, the average length of stay decreased from 1.5 days in 2000 to 1.4 days in 2009, the maximum duration of stay (1.81 days) occurring in 2001.In the West Region, the average
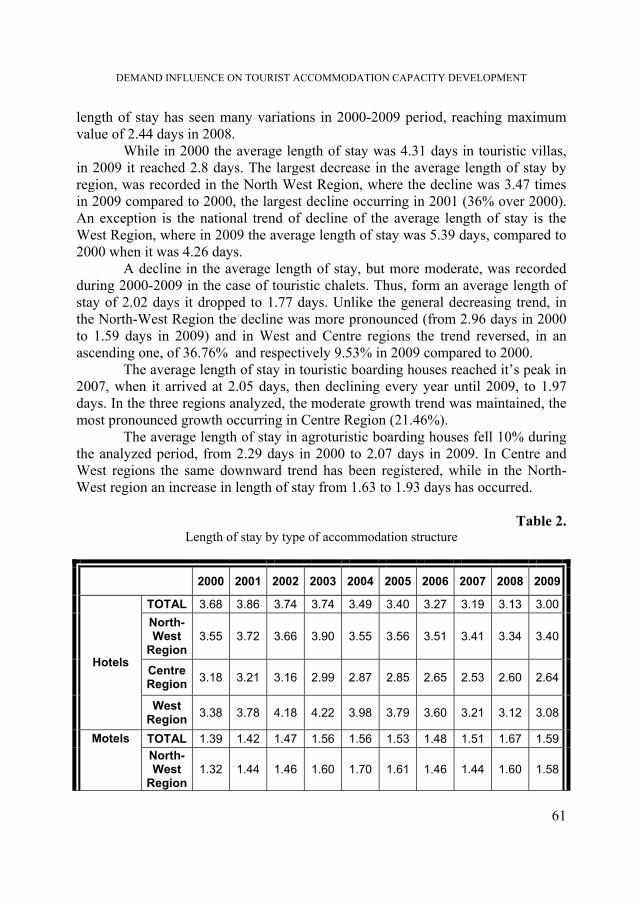
DEMAND INFLUENCE ON TOURIST ACCOMMODATION CAPACITY DEVELOPMENT
61
length of stay has seen many variations in 2000-2009 period, reaching maximum value of 2.44 days in 2008.
While in 2000 the average length of stay was 4.31 days in touristic villas, in 2009 it reached 2.8 days. The largest decrease in the average length of stay by region, was recorded in the North West Region, where the decline was 3.47 times in 2009 compared to 2000, the largest decline occurring in 2001 (36% over 2000). An exception is the national trend of decline of the average length of stay is the West Region, where in 2009 the average length of stay was 5.39 days, compared to 2000 when it was 4.26 days.
A decline in the average length of stay, but more moderate, was recorded during 2000-2009 in the case of touristic chalets. Thus, form an average length of stay of 2.02 days it dropped to 1.77 days. Unlike the general decreasing trend, in the North-West Region the decline was more pronounced (from 2.96 days in 2000 to 1.59 days in 2009) and in West and Centre regions the trend reversed, in an ascending one, of 36.76% and respectively 9.53% in 2009 compared to 2000.
The average length of stay in touristic boarding houses reached it’s peak in 2007, when it arrived at 2.05 days, then declining every year until 2009, to 1.97 days. In the three regions analyzed, the moderate growth trend was maintained, the most pronounced growth occurring in Centre Region (21.46%).
The average length of stay in agroturistic boarding houses fell 10% during the analyzed period, from 2.29 days in 2000 to 2.07 days in 2009. In Centre and West regions the same downward trend has been registered, while in the North-West region an increase in length of stay from 1.63 to 1.93 days has occurred.
Table 2. Length of stay by type of accommodation structure
2000 2001 2002 2003 2004 2005 2006 2007 2008 2009
TOTAL 3.68 3.86 3.74 3.74 3.49 3.40 3.27 3.19 3.13 3.00 North-West
Region 3.55 3.72 3.66 3.90 3.55 3.56 3.51 3.41 3.34 3.40
Centre Region 3.18 3.21 3.16 2.99 2.87 2.85 2.65 2.53 2.60 2.64
Hotels
West Region 3.38 3.78 4.18 4.22 3.98 3.79 3.60 3.21 3.12 3.08
TOTAL 1.39 1.42 1.47 1.56 1.56 1.53 1.48 1.51 1.67 1.59 Motels North-West
Region 1.32 1.44 1.46 1.60 1.70 1.61 1.46 1.44 1.60 1.58

ADINA LETIŢIA NEGRUŞA, OANA ADRIANA GICĂ, CARMEN MARIA GUŢ
62
2000 2001 2002 2003 2004 2005 2006 2007 2008 2009
Centre Region 1.50 1.81 1.60 1.71 1.62 1.49 1.33 1.30 1.42 1.40
West Region 1.57 1.54 1.49 1.67 1.93 1.72 1.79 1.90 2.44 2.20
TOTAL 4.31 4.53 4.38 3.90 3.40 3.13 2.97 2.84 2.94 2.80 North-West
Region 5.42 3.47 3.46 2.05 1.94 1.84 1.97 1.67 1.53 1.56
Centre Region 4.04 4.06 4.00 4.11 3.61 2.80 2.60 2.47 2.86 2.49
Touristic villas
West Region 4.26 4.90 5.56 5.78 3.82 3.91 3.32 3.85 4.19 5.39
TOTAL 2.02 2.03 1.91 1.91 1.93 1.99 1.95 1.84 1.85 1.77
North-West
Region 2.96 2.95 2.22 3.04 2.50 1.84 1.79 1.63 1.69 1.59
Centre Region 1.75 2.04 2.16 2.11 1.92 1.87 1.96 1.74 1.97 1.92
Touristic chalets
West Region 1.74 1.91 2.03 1.82 2.06 2.23 2.48 2.22 2.38 2.38
TOTAL 1.83 1.77 1.84 1.88 1.95 1.94 2.02 2.05 2.01 1.97
North-West
Region 1.62 1.50 1.72 1.70 1.50 1.70 1.68 1.71 1.71 1.70
Centre Region 1.69 1.67 1.84 1.88 2.09 1.95 2.16 2.03 2.08 2.05
Touristic boarding houses
West Region 1.97 1.73 1.59 1.70 1.79 1.83 1.87 1.80 1.95 1.99
TOTAL 2.29 2.12 2.22 2.52 2.15 2.15 2.12 2.05 2.08 2.07
North-West
Region 1.63 1.74 1.90 2.35 2.12 1.99 1.98 1.92 1.95 1.93
Centre Region 2.72 2.51 2.67 3.09 2.25 2.43 2.51 2.39 2.35 2.40
Agroturistic
boarding houses
West Region 2.93 1.91 2.31 1.90 1.81 2.14 2.32 2.12 2.29 2.05
Source: own calculations based on data provided by the National Institute of Statistics

DEMAND INFLUENCE ON TOURIST ACCOMMODATION CAPACITY DEVELOPMENT
63
3.2. Touristic supply During the time span 2000-2009 the number of accommodation places increased by 21.73% across the country. The same trend occurred in the North-West, Centre and West Regions, although the recorded growth level in each region was lower than the national average. The biggest increase of accommodation places was registered in Centre Region (17.38%), and this seems obvious given that this region has enjoyed the highest demand for tourist services. Although in 2009 the number of tourists has decreased compared to previous year on both the country and all the three regions analyzed (North-West, Centre and West), the number of accommodation places has increased every year since 2004, the only exception being North-West Region. As a result of the economic crises and the decrease of the level of income recorded, in Centre Region the number of tourists has decreased in 2009 compared with the previous year by 17%, while the number of accommodation places in the same period increased by 2.26%. The same trend was recorded in West Region where the number of tourist decreased by 14.65% while the number of accommodation places increased by 2.68%. Regarding the North-West Region in 2009 the number of tourists decreased by 20% compared to previous year, while the number of accommodation places decreased by only 2.39%.
0
2000000
4000000
6000000
8000000
10000000
12000000
2000 2001 2002 2003 2004 2005 2006 2007 2008 2009
NORTH-WEST Region CENTRE Region WEST Region
If we analyze the types of tourist structures, during the time span 2000-2009 the highest increase of accommodation capacity has been registered among agro hostels (+487.81%), tourist hostels (+ 467.08%) and hostels (their number increased from 33060 in 2000 to 636131 in 2009). Decreases were recorded for

ADINA LETIŢIA NEGRUŞA, OANA ADRIANA GICĂ, CARMEN MARIA GUŢ
64
inns (-71.38%), tourist cabins (-28.38%), tourist cottages (-62.64%), students and preschool camps (-66.42%), camping (-60.52%). The highest increase in the number of tourists occurred among agro hostels (+66.5% in 2004 as compared to 2003), and this has led to increased supply of tourism services among hostels. Regarding the hotels, their number increased at national level by 20.89% during the time span 2000-2009, the same tendency being registered in Centre (+3.97%) and West Regions (6.80%). Motels, as well as hotels, increased lower compared with other types of tourist structure (only 10.04%). Higher increases for motels were recorded in North-West (+57.97%) and Centre Regions (+39.61%), while in West Region the number of hotels decreased by 23%.
4. Conclusions In terms of touristic demand, the most important growth during 2000-2009
was registered in the Centre region and the most significant reduction was recorded in the North West. Of the three regions analyzed, North-West, Centre and West, Centre region is one which enjoyed the highest demand for tourist services. Depending on the types of tourist structures, the biggest increase in tourist arrivals in the period 2000-2009, was recorded in 2004 for agroturistic boarding houses (66.5% over 2003).
The maximum number of overnight staying was recorded in 2008 when it arrived at the amount of 20.7 million, 2009 bringing the biggest drop of the reported period (16.5%).
The analysis of number of overnight staying dynamics by region showed that the Centre Region registered the highest number of overnight staying and also the largest increase, while the North West Region recorded the largest decline in the number of overnight staying.
The establishment of touristic reception that recorded the biggest increase in the number of overnight staying is the agroturistic boarding house. In this case, between 2000 and 2008, the number of overnight staying increased over 11.5 times, from 64588 in 2000 to 743444 in 2008.
In terms of length of stay in the reported period, an increase occurred only in 2001, while in each of the three regions analyzed, starting with 2003, the length of stay decreased each year, reaching 2.86 days in 2009, in the North-West Region, 2.48 in the Centre Region and to 2.91 days in the West Region. During the time span 2000-2009 the number of accommodation places increased by 21.73% across the country. The biggest increase of accommodation places was registered in Centre Region (17.38%), and this seems obvious given that this region has enjoyed the highest demand for tourist services.

DEMAND INFLUENCE ON TOURIST ACCOMMODATION CAPACITY DEVELOPMENT
65
REFERENCES
1. Butler R.W. (1980) The concept of tourist area cycle of evolution: Implication for Management of Resources, Canadian Geographer, vol.24, pp.5-12.
2. Crompton, J., Lee, S., & Shuster, T. (2001) A guide for understanding economic impact studies: The springfest example. Journal of Travel Research, 40 (1), pp.79-87
3. Fletcher, J. (1994) Input-Output analysis in S. Witt &L. Moutinho Tourism marketing and management handbook, second ed. Uk: Prentice-Hall International, pp.480-484
4. Vorzsak. M., Gut. C. M. (2009), The Place of Religious Tourism in Romania’s Tourist Industry, WSEAS Transactions on Business and Economics, Issue 8, Volume 6, ISSN: 1109-9526, pp. 425-434.
5. Walker, P., Greiner, R., McDonald, D. and Lyne, V. (1998) The Tourism Futures Simulator: A systems thinking approach, Environmental Modelling & Software, vol.14, pp. 59-67.
6. *** World Travel and Tourism Council, 2009 7. *** Tempo-Online, National Institute of Statistics, 2010

STUDIA UNIVERSITATIS BABEŞ-BOLYAI, NEGOTIA, LV, 4, 2010
AN EMPIRICAL INVESTIGATION OF ROMANIA'S COUNTRY BRAND AS TOURISM DESTINATION
OVIDIU I. MOISESCU 1
ABSTRACT. Considering the essential role that country brands as tourism destinations play in generating incoming tourism, this paper reveals useful information for entities concerned with promoting a tourism-based country brand for Romania. The paper represents an exploratory research, data being collected from a sample of Internet users from Netherlands, Spain, Poland and U.S.A., using an on-line questionnaire-based survey. The paper focuses on exploring Romania's country brand association as they reside in the minds of the actual and potential international visitors, their beliefs regarding Romania’s potential tourism resources and attractions, and, respectively, its local factors that may influence travel experiences. Key words: country brand, tourism destination, brand associations, tourism attractions. JEL classification: M31, L83
Introduction
The concept of country branding has received much attention in the international literature during the last years, tourism destination branding being among the most debated issues. Still, the methods currently used for country branding deal with objections and criticism from marketing specialists (Olins, 2002; Anholt, 2008).
Nevertheless, when Simon Anholt (2008) states that nation branding is a “dangerous myth”, he actually tries to emphasize the complexity of branding a country in comparison to classically branding a product (Anholt, 2007), one of the most complex and debated aspects being the way the image of a country as tourism destination is promoted, evaluated and managed.
Branding a country is not the same thing as promoting tourism. The promotion of tourism occupies more common ground with nation-branding than any other aspect of a country’s external affairs, but it is merely a part of the whole (Anholt, 2004).
Considering the increasing importance of country brands as tourism destinations in generating incoming tourism, this paper focuses on exploring actual
1 Lecturer, PhD, Babeş-Bolyai University of Cluj Napoca, Faculty of Economics and Business
Administration, [email protected] & [email protected]
OVIDIU I. MOISESCU
68
and potential international visitors’ perceptions (actual knowledge or just expectations) regarding, on one hand, Romania’s potential tourism attractions, and, on the other hand, Romania’s local factors which could influence travel experiences.
Brief literature review
Basically, a country brand could be described as the total sum of all perceptions about a country or a nation in the mind of international stakeholders (Fan, 2009). Country branding relates to concepts like place or destination branding and country of origin effect (Kotler & al., 1993), public diplomacy (van Ham, 2001) or national identity (Smith, 1991). Actually, country branding comprises all the above.
A country brand may become umbrella brand, ingredient brand or co-brand, intended to endorse certain economic sectors of a country (Dinnie, 2007), including tourism. In a more complex approach, country branding concerns the country’s image, reputation and positioning (Gilmore, 2002), country branding being in some cases similar to corporate branding, implying the usage of similar branding techniques.
Authors have predicted that the future of marketing will be a battle of brands, a competition for brand dominance (de Chernatony, 1993), and that within the tourism industry destinations are emerging as the biggest brands (Morgan and Pritchard, 2004). More and more tourism destinations are looking to establish their brand architecture in order to put themselves ahead of their competitors. When they are whole countries, destinations are often composite brands, being composed of many different places (Morgan and Pritchard, 2004).
It is important to understand that different places attract different tourists (Kotler and Gertner, 2004). For tourism to be successful, a country must be very specific about what it wants to market and to whom. Thus, the tourism market can be segmented by the attractions that tourists seek (such as natural beauty, sun, adventure, gaming, events/sports or culture/history) or by areas, regions or locations, by seasons, by customer’s characteristics or by benefits.
The associations that compound the image of a country brand, in general, and of a tourism destination, in particular, should be measured at regular intervals, as changes in brand perception are only likely to be picked up over time, not instantaneously, some of the main techniques being brand-tracking surveys, online panel surveys, international benchmarking surveys, visitor satisfaction surveys, media monitoring (E.T.C., 2009).
The process of auditing a tourism destination brand implies the assessment of various sources of competitive advantages like (Pike, 2008): natural resources (location, landscape features, climate), cultural resources (history, language, cuisine, music, arts & crafts, traditions, customs), human resources (skills and availability of the region’s labour force; industrial relations; industry service standards; and attitudes of locals), and good will resources (novelty or fashionability of the destination; levels of previous visitation and satisfaction; perceived value).
AN EMPIRICAL INVESTIGATION OF ROMANIA'S COUNTRY BRAND AS TOURISM DESTINATION
69
Research methodology
The research on which this paper is based on is basically exploratory, empirical, and was implemented using the on-line survey method. An on-line questionnaire was designed and distributed among potential respondents by email and messages within on-line social and professional networks, data being collected for a period of one month, at the beginning of 2010. After responses’ validation, the investigated sample included a total of 75 Internet users from Netherlands (18), Poland (6), Spain (26) and U.S.A. (25), among which, considering their experience in visiting Romania, 20 persons had never been to Romania before, 23 persons had been to Romania once, and, respectively, 32 respondents stated that they had been to Romania several times.
The questionnaire included two open questions meant to assess the unaided awareness of aspects associated to Romania as a country brand, in general, and as a tourism destination, in particular, and several closed questions intended to quantify respondents’ perceptions regarding 19 items related to Romania’s potential tourism attractions (“beaches”, “spas”, “fishing and boating“, “outdoor adventure activities like parachuting, rock climbing, rafting etc.“, “nightlife considering cafes, pubs, and clubs etc. “,“shopping facilities“, “historical places”, “archaeological and historic sites etc.”, “castles, palaces etc.”, “museums, art galleries etc.”, “cathedrals, churches, temples etc.”, “theatres, opera houses, cinemas etc.”, “festivals, special events etc.”, “lakes, rivers, waterfalls etc.”, “wildlife sanctuaries like forests, parklands, flora, fauna etc.”, “skiing facilities”, “other sporting facilities”, “spectacular landscapes”, “beautiful nature sceneries etc.”, “handicrafts”, “gastronomy”), and, respectively, 19 items related to the local factors which could influence the travel experience (“good accessibility”, “hospitable/friendly people”, “multi-languages speaking people”, “interesting/arousing people”, “many and diversified accommodation facilities”, “high level service in accommodation facilities”, “many and diversified cafes/restaurants”, “high level service in cafes/restaurants”, “good infrastructure and roads”, “safe country/destination”, “pleasant climate”, “clean country/destination”, “low cost”, “high level of tourist/visitor/traveler information availability”, “good parking facilities”, “good car rental services”, “good public transportation services”, “uncrowdedness”, “good value for money”).
Results and discussions
The first step of the study consisted in assessing the unaided awareness of Romania’s country brand general associations, namely the first things (facts, characteristics, images, places, persons, events etc.) that would come to respondents’ minds when they thought about Romania (Table 1, 1st part). The most frequently recalled and mentioned aspect was related to Dracula, while other important associations of Romania as a country brand turned out to be related to gastronomy, people and the personality of the former communist dictator Ceauşescu. Other important mentioned associations were related to natural aspects (landscapes, sea, mountains), sports (gymnastics, the gymnast Nadia, the football player Hagi), traditions,
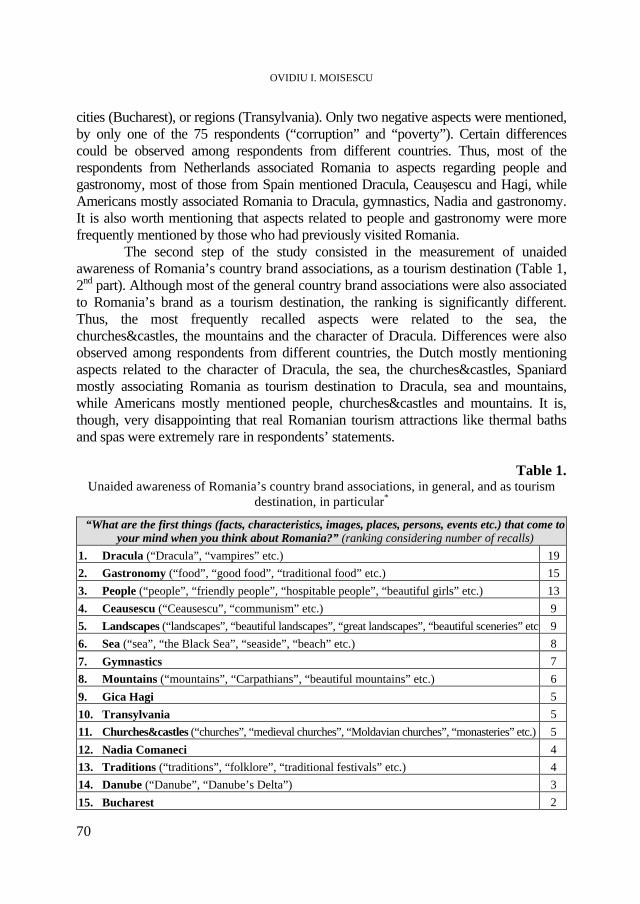
OVIDIU I. MOISESCU
70
cities (Bucharest), or regions (Transylvania). Only two negative aspects were mentioned, by only one of the 75 respondents (“corruption” and “poverty”). Certain differences could be observed among respondents from different countries. Thus, most of the respondents from Netherlands associated Romania to aspects regarding people and gastronomy, most of those from Spain mentioned Dracula, Ceauşescu and Hagi, while Americans mostly associated Romania to Dracula, gymnastics, Nadia and gastronomy. It is also worth mentioning that aspects related to people and gastronomy were more frequently mentioned by those who had previously visited Romania.
The second step of the study consisted in the measurement of unaided awareness of Romania’s country brand associations, as a tourism destination (Table 1, 2nd part). Although most of the general country brand associations were also associated to Romania’s brand as a tourism destination, the ranking is significantly different. Thus, the most frequently recalled aspects were related to the sea, the churches&castles, the mountains and the character of Dracula. Differences were also observed among respondents from different countries, the Dutch mostly mentioning aspects related to the character of Dracula, the sea, the churches&castles, Spaniard mostly associating Romania as tourism destination to Dracula, sea and mountains, while Americans mostly mentioned people, churches&castles and mountains. It is, though, very disappointing that real Romanian tourism attractions like thermal baths and spas were extremely rare in respondents’ statements.
Table 1.
Unaided awareness of Romania’s country brand associations, in general, and as tourism destination, in particular*
“What are the first things (facts, characteristics, images, places, persons, events etc.) that come to your mind when you think about Romania?” (ranking considering number of recalls)
1. Dracula (“Dracula”, “vampires” etc.) 19
2. Gastronomy (“food”, “good food”, “traditional food” etc.) 15
3. People (“people”, “friendly people”, “hospitable people”, “beautiful girls” etc.) 13
4. Ceausescu (“Ceausescu”, “communism” etc.) 9
5. Landscapes (“landscapes”, “beautiful landscapes”, “great landscapes”, “beautiful sceneries” etc.)9
6. Sea (“sea”, “the Black Sea”, “seaside”, “beach” etc.) 8
7. Gymnastics 7
8. Mountains (“mountains”, “Carpathians”, “beautiful mountains” etc.) 6
9. Gica Hagi 5
10. Transylvania 5
11. Churches&castles (“churches”, “medieval churches”, “Moldavian churches”, “monasteries” etc.) 5
12. Nadia Comaneci 4
13. Traditions (“traditions”, “folklore”, “traditional festivals” etc.) 4
14. Danube (“Danube”, “Danube’s Delta”) 3
15. Bucharest 2
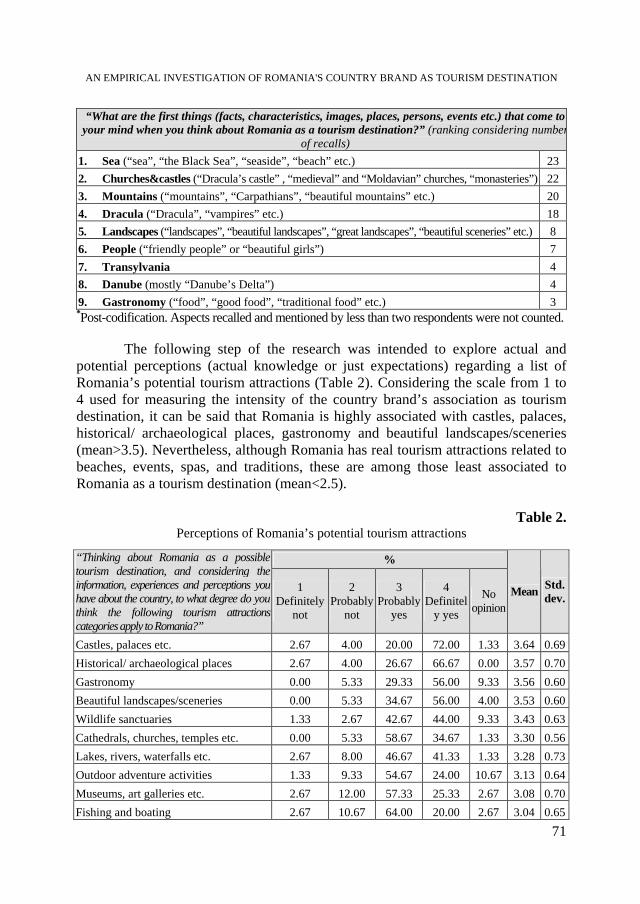
AN EMPIRICAL INVESTIGATION OF ROMANIA'S COUNTRY BRAND AS TOURISM DESTINATION
71
“What are the first things (facts, characteristics, images, places, persons, events etc.) that come to your mind when you think about Romania as a tourism destination?” (ranking considering number
of recalls)
1. Sea (“sea”, “the Black Sea”, “seaside”, “beach” etc.) 23
2. Churches&castles (“Dracula’s castle” , “medieval” and “Moldavian” churches, “monasteries”) 22
3. Mountains (“mountains”, “Carpathians”, “beautiful mountains” etc.) 20
4. Dracula (“Dracula”, “vampires” etc.) 18
5. Landscapes (“landscapes”, “beautiful landscapes”, “great landscapes”, “beautiful sceneries” etc.) 8
6. People (“friendly people” or “beautiful girls”) 7
7. Transylvania 4
8. Danube (mostly “Danube’s Delta”) 4
9. Gastronomy (“food”, “good food”, “traditional food” etc.) 3 *Post-codification. Aspects recalled and mentioned by less than two respondents were not counted.
The following step of the research was intended to explore actual and
potential perceptions (actual knowledge or just expectations) regarding a list of Romania’s potential tourism attractions (Table 2). Considering the scale from 1 to 4 used for measuring the intensity of the country brand’s association as tourism destination, it can be said that Romania is highly associated with castles, palaces, historical/ archaeological places, gastronomy and beautiful landscapes/sceneries (mean>3.5). Nevertheless, although Romania has real tourism attractions related to beaches, events, spas, and traditions, these are among those least associated to Romania as a tourism destination (mean<2.5).
Table 2.
Perceptions of Romania’s potential tourism attractions
% “Thinking about Romania as a possible tourism destination, and considering the information, experiences and perceptions you have about the country, to what degree do you think the following tourism attractions categories apply to Romania?”
1 Definitely
not
2 Probably
not
3 Probably
yes
4 Definitel
y yes
No opinion
Mean Std. dev.
Castles, palaces etc. 2.67 4.00 20.00 72.00 1.33 3.64 0.69
Historical/ archaeological places 2.67 4.00 26.67 66.67 0.00 3.57 0.70
Gastronomy 0.00 5.33 29.33 56.00 9.33 3.56 0.60
Beautiful landscapes/sceneries 0.00 5.33 34.67 56.00 4.00 3.53 0.60
Wildlife sanctuaries 1.33 2.67 42.67 44.00 9.33 3.43 0.63
Cathedrals, churches, temples etc. 0.00 5.33 58.67 34.67 1.33 3.30 0.56
Lakes, rivers, waterfalls etc. 2.67 8.00 46.67 41.33 1.33 3.28 0.73
Outdoor adventure activities 1.33 9.33 54.67 24.00 10.67 3.13 0.64
Museums, art galleries etc. 2.67 12.00 57.33 25.33 2.67 3.08 0.70
Fishing and boating 2.67 10.67 64.00 20.00 2.67 3.04 0.65

OVIDIU I. MOISESCU
72
Nightlife (cafes, pubs, clubs etc.) 2.67 17.33 45.33 26.67 8.00 3.04 0.77
Handicrafts 1.33 9.33 54.67 14.67 20.00 3.03 0.61
Theatres, opera, cinemas etc. 2.67 12.00 61.33 16.00 8.00 2.99 0.65
Festivals, special events etc. 4.00 22.67 40.00 20.00 13.33 2.88 0.82
Beaches 8.00 24.00 49.33 14.67 4.00 2.74 0.82
Other sporting facilities 5.33 22.67 57.33 6.67 8.00 2.71 0.68
Skiing facilities 4.00 34.67 32.00 14.67 14.67 2.67 0.81
Shopping facilities 8.00 42.67 20.00 12.00 17.33 2.44 0.86
Spas 16.00 34.67 18.67 6.67 24.00 2.21 0.88
Given the fact that the statistical variables reflecting the previous associations were ordinal, Anova tests were used in order to test the complex hypothesis: “The mean perceptions of Romania’s potential tourism attractions depend on country of residence, visiting experience, age, gender, relative income and level of education” (Table 3). Given the investigated sample, all the independent variables seem to have significant influences on several aspects related Romania’s potential tourism attractions (p<0.05).
Thus, in comparison to the others, respondents from Poland stronger associate Romania with beaches, shopping facilities and handicrafts, Spaniards with spas, cathedrals, churches, skiing and spectacular landscapes, Americans with historical and archaeological places, castles, palaces, lakes, rivers, waterfalls and wildlife sanctuaries, while Dutch respondents were almost each time those who least associated Romania with any of the previous potential tourism attractions. As expected, those who previously visited Romania stronger associate the country with tourism attractions like spas, cathedrals, churches, festivals, special events and handicrafts. Still, in all the other cases, the associations don’t significantly depend on previous visiting experiences. It is also worth mentioning that those between 20-30 years stronger associate Romania with beautiful landscapes and gastronomy, males stronger associate Romania with spas, and lesser with historical/ archaeological places, while, in comparison to other income categories, those who declare themselves as being rich, associate Romania, in a stronger manner, with outdoor adventure, historical places, castles, palaces and wildlife sanctuaries, and, respectively, lesser with spas, museums, art galleries, cathedrals, churches, festivals, special events and handicrafts.
Table 3. Variations of mean perceptions* of potential tourism attractions (Anova)
Country Visiting
experience Age Gender
Relative income
F p F p F p F p F p Beaches 4,50 0,01 2,53 0,09 2,43 0,07 1,86 0,18 1,38 0,26 Spas 9,59 0,00 7,23 0,00 0,34 0,80 8,99 0,00 5,65 0,00 Fishing and boating 0,24 0,87 3,13 0,05 0,37 0,77 0,04 0,84 1,79 0,16 Outdoor adventure activities 1,03 0,38 1,37 0,26 2,28 0,09 1,83 0,18 5,03 0,00

AN EMPIRICAL INVESTIGATION OF ROMANIA'S COUNTRY BRAND AS TOURISM DESTINATION
73
Nightlife 2,74 0,05 2,26 0,11 0,40 0,76 0,57 0,45 0,77 0,51 Shopping facilities 6,02 0,00 0,57 0,57 0,78 0,51 0,37 0,55 1,67 0,18 Historical/ archaeological places 3,31 0,02 0,68 0,51 0,04 0,99 4,19 0,04 14,41 0,00 Castles, palaces etc. 3,19 0,03 1,70 0,19 0,67 0,57 0,01 0,94 6,35 0,00 Museums, art galleries etc. 1,66 0,18 0,45 0,64 0,47 0,70 2,62 0,11 4,40 0,01 Cathedrals, churches, temples etc. 3,56 0,02 4,02 0,02 1,03 0,38 1,65 0,20 6,36 0,00 Theatres, opera houses, cinemas etc. 1,06 0,37 1,56 0,22 1,55 0,21 0,29 0,59 0,82 0,49 Festivals, special events etc. 1,68 0,18 3,54 0,03 0,30 0,83 0,13 0,72 3,14 0,03 Lakes, rivers, waterfalls etc. 4,75 0,00 0,96 0,39 2,66 0,05 0,71 0,40 1,41 0,25 Wildlife sanctuaries 4,61 0,01 1,74 0,18 0,23 0,87 0,63 0,43 7,42 0,00 Skiing facilities 5,54 0,00 1,11 0,34 0,77 0,51 0,75 0,39 1,58 0,20 Other sporting facilities 0,30 0,82 0,97 0,38 2,07 0,11 1,46 0,23 0,91 0,44 Beautiful landscapes/ sceneries 9,20 0,00 1,40 0,25 4,54 0,01 0,68 0,41 0,61 0,61 Handicrafts 1,35 0,27 2,89 0,06 1,29 0,29 0,80 0,38 1,40 0,26 Gastronomy 6,65 0,00 1,00 0,37 3,30 0,03 0,01 0,93 0,27 0,77 *Measured as: 1=”Definitely not”, 2=”Probably not”, 3=”Probably yes”, 4=”Definitely yes”
Furthermore, the knowledge or expectations regarding a list of Romania’s local factors which could influence travel experiences were investigated (Table 4). Considering the scale from 1 to 4 used for measuring the intensity of these association, although the results show that Romania is somehow associated with hospitable/friendly people, interesting/arousing people, a pleasant climate and many and diversified cafes/restaurants (mean>3), many important aspects are not quite perceived as being realities in Romania, some of them, like a high level service in cafes/restaurants, a high level service in accommodation, good parking facilities or good infrastructure (roads), being actually perceived by most of the respondents as missing (mean<2.5). Another important aspect is that good value for money and low costs were not associated to Romania as stronlgy as expected.
Table 4.
Perceptions of Romanian local factors influencing travel experiences
% “Think about Romania as a tourist destination. Considering the information, experiences and perceptions you have about the country, to what degree do you think the following attributes apply to Romania?”
1 Definitely
not
2 Probably
not
3 Probably
yes
4 Definitely
yes
No opinion
Mean Std. dev.
Hospitable/friendly people 2.70 5.30 36.00 49.30 6.70 3.41 0.73
Interesting/arousing people 0.00 6.70 62.70 20.00 10.70 3.15 0.53
Pleasant climate 1.30 2.70 76.00 17.30 2.70 3.12 0.50
Many and diversified cafes/restaurants 1.30 8.00 65.30 17.30 8.00 3.07 0.58
Diversified accommodation facilities 0.00 24.00 58.70 12.00 5.30 2.87 0.61
Uncrowded 5.30 14.70 62.70 4.00 13.30 2.75 0.64
Safe country/destination 5.30 22.70 49.30 8.00 14.70 2.70 0.73
Good value for money 6.70 24.00 44.00 9.30 16.00 2.67 0.78

OVIDIU I. MOISESCU
74
Low cost 2.70 37.30 34.70 10.70 14.70 2.63 0.75
Availability of traveler information 4.00 21.30 38.70 4.00 32.00 2.63 0.69
Good accessibility 10.70 22.70 57.30 6.70 2.70 2.62 0.78
Good public transportation services 6.70 18.70 53.30 1.30 20.00 2.62 0.67
Multi-languages speaking people 4.00 41.30 26.70 14.70 13.30 2.60 0.83
Good car rental services 4.00 25.30 38.70 2.70 29.30 2.57 0.67
Clean country/destination 10.70 25.30 53.30 5.30 5.30 2.56 0.77
High level service in cafes/restaurants 4.00 44.00 34.70 4.00 13.30 2.45 0.66
High level service in accommodation 5.30 56.00 18.70 1.30 18.70 2.20 0.57
Good parking facilities 12.00 48.00 21.30 2.70 16.00 2.17 0.71
Good infrastructure (roads) 33.30 41.30 9.30 4.00 12.00 1.82 0.80
The ordinal type of the statistical variables reflecting the previous
associations allowed Anova tests to be run in order to test the complex hypothesis: “The mean perceptions of Romania’s local factors influencing travel experiences depend on country, visiting experience, age, gender, relative income and level of education” (Table 5). Although the gender of the respondents within the given sample doesn’t significantly influence the previously listed associations, all the other independent variables have significant influences on the perception of several aspects related Romania’s local factors affecting travel experiences (p<0.05).
Thus, in comparison to the others, respondents from Poland stronger associate Romania with hospitable/friendly people and good value for money, Spaniards with multi-languages speaking people and pleasant climate, Americans with clean country/destination and good public transportation services, while Dutch stronger associate Romania with good infrastructure (roads) and good car rental services. On the other hand, Spaniards least associated Romania with good infrastructure (roads), clean country/destination, good car rental services, good public transportation services or good value for money, while the Dutch least associate Romania with hospitable/friendly people, multi-languages speaking people and pleasant climate. Also, those who previously visited Romania stronger associate the country with a pleasant climate, but lesser with a good infrastructure (roads) – the reality was probably worse than expected. Other findings worth mentioning were that those between 31-40 years old stronger associate Romania with good infrastructure and low cost, while, in comparison to other income categories, those who declare themselves as being rich, associate Romania more intensively with good infrastructure (roads), safe country/destination, good public transportation services and uncrowdedness, and, respectively, less intensively with interesting/arousing people and pleasant climate.

AN EMPIRICAL INVESTIGATION OF ROMANIA'S COUNTRY BRAND AS TOURISM DESTINATION
75
Table 5. Variations of mean perceptions* of local factors influencing travel experiences (Anova)
Country Visiting
experience Age Gender
Relative income
F p F p F p F p F p Good accessibility 2,47 0,07 0,95 0,39 0,39 0,76 0,16 0,69 3,26 0,03 Hospitable/friendly people 6,32 0,00 2,48 0,09 1,45 0,24 1,45 0,23 1,74 0,17 Multi-languages speaking people 6,98 0,00 1,47 0,24 1,14 0,34 1,31 0,26 2,83 0,05 Interesting/arousing people 1,91 0,14 0,26 0,77 1,34 0,27 0,24 0,62 3,71 0,02 Diversified accommodation facilities 2,01 0,12 0,34 0,71 0,88 0,46 0,21 0,65 0,58 0,63 High level service in accommodation 0,62 0,60 0,42 0,66 2,22 0,10 0,58 0,45 1,72 0,17 Many and diversified cafes/restaurants 1,43 0,24 1,30 0,28 2,55 0,06 0,03 0,87 0,03 0,99 High level service in cafes/restaurants 2,36 0,08 0,32 0,73 2,74 0,05 3,93 0,05 0,74 0,53 Good infrastructure (roads) 5,26 0,00 4,39 0,02 5,14 0,00 0,04 0,85 7,68 0,00 Safe country/destination 2,14 0,10 0,30 0,74 2,60 0,06 0,00 0,95 3,97 0,01 Pleasant climate 2,92 0,04 3,95 0,02 2,39 0,08 1,07 0,31 3,66 0,02 Clean country/destination 10,97 0,00 2,78 0,07 2,72 0,05 0,24 0,63 1,12 0,35 Low cost 4,40 0,01 0,26 0,77 3,56 0,02 1,29 0,26 1,29 0,28 Availability of traveler information 2,79 0,05 0,21 0,81 1,39 0,26 0,02 0,90 0,81 0,50 Good parking facilities 2,15 0,10 3,05 0,05 1,25 0,30 0,07 0,79 2,90 0,04 Good car rental services 7,04 0,00 1,94 0,15 1,45 0,24 0,22 0,64 1,61 0,20 Good public transportation services 4,88 0,00 0,74 0,48 1,15 0,34 0,94 0,34 3,08 0,03 Uncrowded 1,70 0,18 2,45 0,09 0,76 0,52 0,39 0,53 5,06 0,00 Good value for money 5,39 0,00 0,60 0,55 0,73 0,54 0,01 0,92 1,88 0,14 *Measured as: 1=”Definitely not”, 2=”Probably not”, 3=”Probably yes”, 4=”Definitely yes”
Conclusions and future research directions
The research revealed interesting and extremely useful information for any entity interested in promoting a tourism-based country brand for Romania.
The unaided awareness investigation regarding the country brand’s association which reside in the minds of the actual or potential international visitors, emphasized the fact that many of Romania’s brand association, in general, are very similar to its associations as a tourism destination, in particular, and, therefore, the country’s brand could and should rely on its tourism potential. Among the aspects unaided recalled, some were expected (Dracula, castles, churches, sea, landscape, mountains etc.), but some were unexpected and pleasantly surprising: gastronomy and friendly people etc.
The beliefs of actual and potential international visitors regarding Romania’s potential tourism resources and attractions revealed a set of items that are insufficiently known and promoted, although Romania has an enormous potential: beaches, spas, festivals and skiing.
OVIDIU I. MOISESCU
76
In what concerns the beliefs regarding the local factors that may influence travel experiences, the situation is negative, radical and urgent measures being necessary, both from authorities and players of the hospitality industry: better service level in cafes/restaurants and accommodation facilities, better parking facilities, better infrastructure and roads, and better value for money, in general.
Finally, the research showed significant variations in perceptions depending on respondents’ country of residence, visiting experience, age, gender, and relative income. Still, given the exploratory nature of the research, its empirical sampling method and the small-sized sample investigated, the accepted hypotheses should further be developed and tested within a larger-sized sample and a probabilistic sampling procedure.
REFERENCES
1) Anholt, S. (2004) “Nation-brands and the value of provenance” in Morgan, N., Pritchard, A., Pride, R. (eds), Destination Branding – Creating the Unique Destination Proposition (2nd ed.), Butterworth-Heinemann, p.26-39
2) Anholt, S. (2007) “Competitive identity: the new brand management for nations, cities & regions”, Macmillan
3) Anholt, S. (2008) “Why nation branding does not exist?”, available at www.cosmoworlds.com
4) de Chernatony, L. (1993) “Categorizing brands: Evolutionary processes underpinned by two key dimensions”, Journal of Marketing Management, Vol.9, p.173-188
5) Dinnie, K. (2007) “Nation branding: concepts, issues, practice”, Butterworth Heinemann 6) ETC & UNWTO (2009) “Handbook on Tourism Destination Branding”, available
at www.unwto.org 7) Gilmore, F. (2002) “A country - can it be repositioned?”, Journal of Brand
Management, 9(4-5) 8) Kotler, P., Gertner, D. (2004) “Country as brand, product and beyond: a place
marketing and brand management perspective” in Morgan, N., Pritchard, A., Pride, R. (eds), Destination Branding – Creating the Unique Destination Proposition (2nd ed.), Butterworth-Heinemann, p.40-56
9) Kotler, P., Haider, D.H., Rein I. (1993) “Marketing Places”, The Free Press, New York 10) Morgan, N., Pritchard, A. (2004) “Meeting the destination branding challenge” in
Morgan, N., Pritchard, A., Pride, R. (eds), Destination Branding – Creating the Unique Destination Proposition (2nd ed.), Butterworth-Heinemann, p.59-78
11) Olins W. (2002) “Branding the nation - the historical context”, Journal of Brand Management, 9(4-5)
12) Pike, S. (2008) “Destination Marketing. An Integrated Marketing Communication Approach” (2nd ed.), Butterworth-Heinemann
13) Smith, A. D., (1991) “National Identity”, Penguin Books, London 14) Van Ham, P. (2001) “The Rise of the Brand State”, Foreign Affairs, October
STUDIA UNIVERSITATIS BABEŞ-BOLYAI, NEGOTIA, LV, 4, 2010
THE ONLINE PRESENCE OF THE HOTEL UNITS: COMPARATIVE STUDY BETWEEN CLUJ-NAPOCA AND BUCHAREST
CRISTINA BALINT1, MIHAELA TUTUNEA2
ABSTRACT. The starting point of this study represents the observation and the analyses of the hotel units’ websites within different cities in Romania. In the first part of the study it is presented the analyze of the hotel web presences from Cluj-Napoca, in order to obtain a general image of the digital supply, followed by the comparative study made between Cluj-Napoca and Bucharest, for the digital presences from the hotel industry. Finally, the result and the conclusions of the research conducted are presented. Keywords: Tourism, supply, online tourism. JEL Classification: L83
1. Introduction
The tourism became nowadays an activity as important as the one held in other key sectors from the global economy. The tourism phenomenon is extremely difficult to distinguish because, as any other human activity, it falls within the interdisciplinary study, rendering economists, geographers, psychologists and sociologists. Against the backdrop of an already existing crisis, the Romanian tourism has undergone many changes, so that starting with this year the hotels began to be less populated, and the things started to become worse. The starting point of this study is the web observation of the digital presences of the hotel units situated in different cities of Romania and the identification of the hoteliers’ perception regarding the need and the profitability of the extension of this industry’s specific services, towards the business digital environment; for the beginning the study has focused on comparing the hoteliers’ web presences from two Romanian cities, Cluj-Napoca and Bucharest, following that the analysis to be extended to other Romanian and foreign cities.
1 Teaching Assistant, PhD candidate, Babes-Bolyai University Cluj-Napoca, Faculty of Business,
[email protected] 2 Lecturer, Ph D, Babes-Bolyai University Cluj-Napoca, Faculty of Business, [email protected]

CRISTINA BALINT, MIHAELA TUTUNEA
78
2. Material and methods
In elaborating this study, both primary and secondary information resources were employed, so that this research would offer an overview closer to reality.
As primary data collection method was used the investigation and it was also designed a questionnaire. The questionnaire was developed according the study’s objectives and contains 10 questions. These are structured questions (dichotomous, multihotomous), with closed answers. For their formulations, simple and understandable words were used, avoiding questions that suggest or imply certain answers and their formulations was made in a direct manner in order to facilitate the subjects’ answers and to avoid misinterpretations. The questionnaire was designed and launched both online and offline.
The secondary data were collected by web observation, by visiting hotels websites, analyzing a series of attributes and by using a specialized software instrument to analyze the gathered data. For each website we took into consideration the following elements: the presentation manner, web design elements, utility, professional layout and complexity.
Several web browsers were used in order for the web research to be conducted ( Internet Explorer, Mozilla FireFox, Opera, Netscape, etc.), and the data were processed with MS-Excel.
The first part of the study aimed to identify the digital corporal identities within Cluj-Napoca hospitality industry and to conduct a research that would point out both the expansion tendencies of traditional activities (offline) of hotel units towards the online activity with display of web presences (web sites), and the analysis and comparison of their display online. The studied population is represented by the hotel offer from Cluj-Napoca. The study was made on the entire studied population, and the sample had the same size as the reference population, namely the 40 hotels that currently exist in Cluj-Napoca.
In the second part of the study a research was conducted in order to compare the digital presence of 20 websites belonging to Cluj-Napoca with the 20 websites belonging to Bucharest hotels.
This comparative study was achieved by observing the hotel units websites, by assessing and analyzing them. Also, the similarities and differences between sections of the websites were identified.
The purpose of this comparative study was to provide useful information both for the websites’ developers and for the hotel products (services) providers, but also for their clients, as recipients.
3. Results and discussions 3.1. The study results made on the Cluj-Napoca hotel units
Following both the primary and secondary analysis, it was observed that Cluj-Napoca’s hotel units own in a 92% proportion an online presence, and their
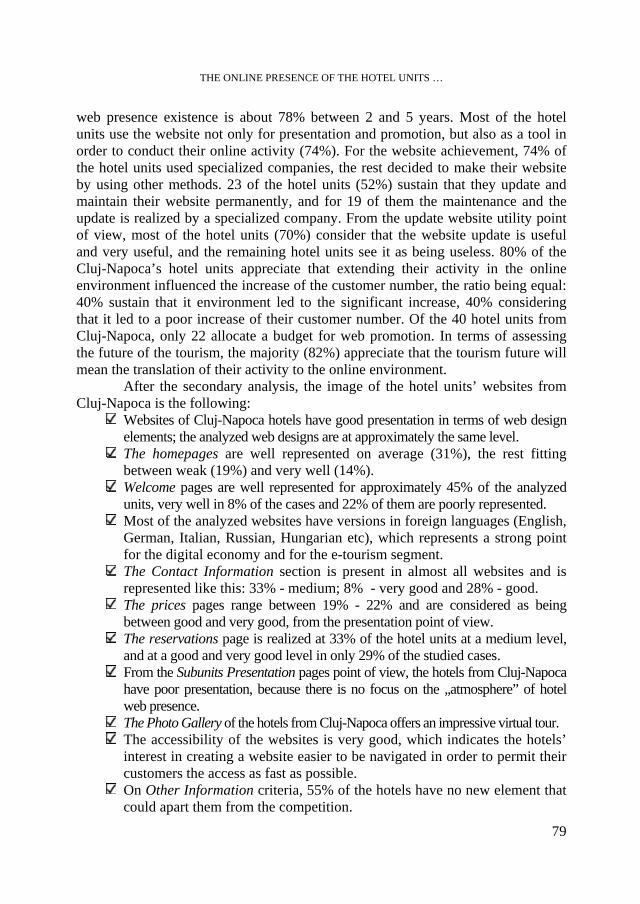
THE ONLINE PRESENCE OF THE HOTEL UNITS …
79
web presence existence is about 78% between 2 and 5 years. Most of the hotel units use the website not only for presentation and promotion, but also as a tool in order to conduct their online activity (74%). For the website achievement, 74% of the hotel units used specialized companies, the rest decided to make their website by using other methods. 23 of the hotel units (52%) sustain that they update and maintain their website permanently, and for 19 of them the maintenance and the update is realized by a specialized company. From the update website utility point of view, most of the hotel units (70%) consider that the website update is useful and very useful, and the remaining hotel units see it as being useless. 80% of the Cluj-Napoca’s hotel units appreciate that extending their activity in the online environment influenced the increase of the customer number, the ratio being equal: 40% sustain that it environment led to the significant increase, 40% considering that it led to a poor increase of their customer number. Of the 40 hotel units from Cluj-Napoca, only 22 allocate a budget for web promotion. In terms of assessing the future of the tourism, the majority (82%) appreciate that the tourism future will mean the translation of their activity to the online environment.
After the secondary analysis, the image of the hotel units’ websites from Cluj-Napoca is the following:
Websites of Cluj-Napoca hotels have good presentation in terms of web design elements; the analyzed web designs are at approximately the same level.
The homepages are well represented on average (31%), the rest fitting between weak (19%) and very well (14%).
Welcome pages are well represented for approximately 45% of the analyzed units, very well in 8% of the cases and 22% of them are poorly represented.
Most of the analyzed websites have versions in foreign languages (English, German, Italian, Russian, Hungarian etc), which represents a strong point for the digital economy and for the e-tourism segment.
The Contact Information section is present in almost all websites and is represented like this: 33% - medium; 8% - very good and 28% - good.
The prices pages range between 19% - 22% and are considered as being between good and very good, from the presentation point of view.
The reservations page is realized at 33% of the hotel units at a medium level, and at a good and very good level in only 29% of the studied cases.
From the Subunits Presentation pages point of view, the hotels from Cluj-Napoca have poor presentation, because there is no focus on the „atmosphere” of hotel web presence.
The Photo Gallery of the hotels from Cluj-Napoca offers an impressive virtual tour. The accessibility of the websites is very good, which indicates the hotels’ interest in creating a website easier to be navigated in order to permit their customers the access as fast as possible.
On Other Information criteria, 55% of the hotels have no new element that could apart them from the competition.
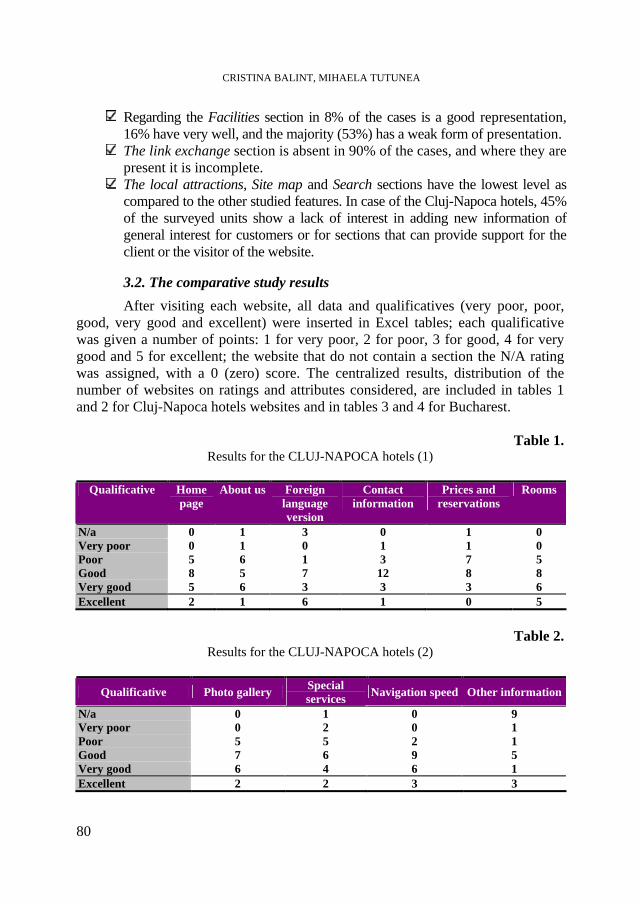
CRISTINA BALINT, MIHAELA TUTUNEA
80
Regarding the Facilities section in 8% of the cases is a good representation, 16% have very well, and the majority (53%) has a weak form of presentation.
The link exchange section is absent in 90% of the cases, and where they are present it is incomplete.
The local attractions, Site map and Search sections have the lowest level as compared to the other studied features. In case of the Cluj-Napoca hotels, 45% of the surveyed units show a lack of interest in adding new information of general interest for customers or for sections that can provide support for the client or the visitor of the website.
3.2. The comparative study results
After visiting each website, all data and qualificatives (very poor, poor, good, very good and excellent) were inserted in Excel tables; each qualificative was given a number of points: 1 for very poor, 2 for poor, 3 for good, 4 for very good and 5 for excellent; the website that do not contain a section the N/A rating was assigned, with a 0 (zero) score. The centralized results, distribution of the number of websites on ratings and attributes considered, are included in tables 1 and 2 for Cluj-Napoca hotels websites and in tables 3 and 4 for Bucharest.
Table 1. Results for the CLUJ-NAPOCA hotels (1)
Qualificative Home
page About us Foreign
language version
Contact information
Prices and reservations
Rooms
N/a 0 1 3 0 1 0 Very poor 0 1 0 1 1 0 Poor 5 6 1 3 7 5 Good 8 5 7 12 8 8 Very good 5 6 3 3 3 6 Excellent 2 1 6 1 0 5
Table 2.
Results for the CLUJ-NAPOCA hotels (2)
Qualificative Photo gallery Special services Navigation speed Other information
N/a 0 1 0 9 Very poor 0 2 0 1 Poor 5 5 2 1 Good 7 6 9 5 Very good 6 4 6 1 Excellent 2 2 3 3
THE ONLINE PRESENCE OF THE HOTEL UNITS …
81
Tabel 3. Results for the BUCHAREST hotels (1)
Qualificative Home page About us
Foreign language version
Contact information
Prices and reservations Rooms
N/a 0 1 2 1 1 1 Very poor 0 0 0 0 0 1 Poor 3 7 0 5 5 2 Good 9 4 11 11 9 7 Very good 4 6 2 0 4 6 Excellent 4 2 5 3 1 3
Tabel 4.
Results for the BUCHAREST hotels (2)
Qualificative Photo gallery
Special services
Navigation speed Other information
N/a 1 1 1 5 Very poor 0 1 0 1 Poor 0 5 1 5 Good 11 7 6 3 Very good 6 3 10 2 Excellent 2 3 2 4
The results of the hotels’ websites comparative study between Cluj-Napoca
and Bucharest are the following:
CLUJ-NAPOCA BUCHAREST Home page
10% - excellent represented, 25% - very good, 40% - good
distributed between poor ( 15%) and excellent ( 20%)
About Us very good 30%, poor 30%, good 25%, excellent only 5%
poor approximately 35% of the cases, 30% very well structured
Foreign Language Version 35% exist and are well done, 15% do not exist
55% exist and are well done, 25% excellent, 10% do not exist
Contact Information 5% - excellent, 15% - very good, 60% -good
distributed between poor - 25% and good - 55%
Prices and Reservations 35% - 40% considered to be between poor and good
25% - very good , 45% - good
Rooms exist in 100% of the studied hotels, 33% - good level
exist in 95% of the hotels studied, 35% good level, 30% - very good
CRISTINA BALINT, MIHAELA TUTUNEA
82
Photo Gallery exist in 98% of the cases, most of the hotels are classified between a good and a very good level
exist in 95% of the cases, most of the hotels are classified between a good (55%) and a very good level (30%)
Special Services 30% - good level, 10% - excellent, 25% - poor
distributed between very poor and excellent, 5% do not exist
Navigation easiness distributed between good and very good, 30% - 45%
concentrated around good and very good (30% - 50%)
Other Information 45% of the hotels have no elements of differentiation
25% of the hotels have no elements of differentiation
4. Conclusions
The realized analysis allows drawing a picture of the compared hotels web presences, from Cluj-Napoca and Bucharest:
The websites of Bucharest hotels have a superior presentation manner as compared to those of Cluj-Napoca.
From the web design point of view, the analyzed websites have approximately the same level; the elements of the Other Information and Special Services sections belonging to Bucharest websites are better realized.
The vast majority of analyzed websites both from Cluj-Napoca and Bucharest have foreign languages versions (English, German, Italian, Russian, Hungarian etc).
The visitors of Bucharest websites are offered well represented Home page, About Us and Prices and Reservations sections.
The Rooms and Photo Gallery sections, for the Bucharest hotels have superior presentation manners as compared to those from Cluj-Napoca. In the Bucharest hotel industry there is more emphasis on creating a unique web presence “atmosphere”. The Photo Galleries presented by the Bucharest hotels offer an impressive virtual tour.
The studied websites’ accessibility is similar among the two cities, which indicates the hotels’ interest in creating web presences easy to browse, in order to offer to the customers a quick access.
The Other Information element has the lowest level as compared to the other studied features; so, in the case of the Cluj-Napoca hotels, 45%, show a lack of interest in adding new elements of general interest and help for the website customer or visitor. The results of the realized studies can be a very useful basis for both the
hotel providers from the two cities that were the subject of the studies, and the e-marketers that can easily identify the weak points, but also the opportunities of the digital development of this sector; considering that any hotel web bidder meets his online request towards the web presence, the results of the studies can offer them stakes in generating web presences that can realize the real competitive differentiation
THE ONLINE PRESENCE OF THE HOTEL UNITS …
83
and the attraction of a growing number of clients; we must not neglect the software industry representatives, who can identify, between the obtain results, important elements for designing and developing performing hotel web presences and for correlating them with the profile and the online touristic demand tendency.
REFERENCES
1. http://www.allhotels.com 2. http://epp.eurostat.ec.europa.eu/portal/page/portal/tourism/ 3. http://www.hotelstravel.com 4. http://www.hoteluriromania.ro 5. http://www.infotravels.ro 6. http://www.infoturism.ro 7. http://www.insse.ro 8. http://www.top-ro.ro 9. http://www.tourneo.ro 10. http://www.trafic.ro

STUDIA UNIVERSITATIS BABEŞ-BOLYAI, NEGOTIA, LV, 4, 2010
BENCHMARKING ELEMENTS FOR CLUJ-NAPOCA HOTEL INDUSTRY
ALEXANDRA URCAN1, SMARANDA COSMA2
ABTRACT. Seen from the perspective of tourism potential, Cluj-Napoca, one of the main cities in Romania, taking into account several factors such as economics, education, recreational opportunities, green space, trade, healthcare and climate, has a comparative advantage because of the varied landscape and geographical position. The city also has a rich historical and cultural heritage, materialized in monuments, museums, memorial houses, medieval churches and cathedrals, monuments, architecture, etc. In this manner, Cluj-Napoca gained a significant competitive advantage and so, the city is considered the center of tourist development in its region, a starting point to target tourist areas.
The paper focuses on the development of the city's competitive advantage by implementing elements of the benchmarking process to identify local best practices, operational policies and marketing activities leading to improved quality of hotel’s services and hence the formation of differentiation strategies.
In conclusion, the research stresses the importance of knowing what kind of connections can be developed between tourism and hotel industry and why is necessary its inclusion as an essential part in shaping the brand of the country. Hospitality, service quality accommodation are some of the elements that may influence not only the dynamic of tourism as an industry, but also its efficiency. Experienced travelers know the importance of the role that quality plays in strengthening the tourism infrastructure of the country's image. Identifying some examples of good practice in hotels, using benchmarking process could encourage the formation of a competitive domestic environment, that is open to changes for improving national tourism infrastructure, but also targeting the tourist and setting internal policies on meeting its expectations and not least, to differentiate and get to a high level of inter-regional competitiveness.
Keywords: benchmarking, quality, tourism infrastructure, country brand, hotel industry. JEL Classification: L83, M31
Introduction International tourism has become a contemporary phenomenon that manifests
a remarkable development and spread. Even if we are talking about positive or negative effects, tourism impact can be felt in a considerable proportion of the global society 1 Master student, Babeş-Bolyai University Cluj-Napoca, Faculty of Business, [email protected] 2 Assoc. Prof. PhD., Babeş-Bolyai University Cluj-Napoca, Faculty of Business, [email protected]
ALEXANDRA URCAN, SMARANDA COSMA
86
in various forms: impact on national economy, cultural or social impact, environmental impact, etc. Thereby, the tourism industry puts a decisive mark on the world’s economy, as proof being the considerable revenues by participating with 9.2% to global GDP and by offering approximately 8.1% of the world’s employment (one job from 12.3 jobs in the world are offered in the tourism sector, WTTC 2010).
As part of world trade, international tourism represents about 8% of this economic sector. Viewed from the perspective of number of customers (real customers) to the global scale, tourism industry has attracted more than 700 million tourists resulting a value of total receipts that reaches the threshold of 476 billion USD. According to the World’s Travel&Tourism Council report from 2010 are estimated about 936 million arrivals and receipts of 897 billion USD, this means an increase of about 3%-4%, by the end of 2010 (WTTC, 2010).
If we are talking on the case of Romanian tourism, it is still charged as an ongoing phenomenon of promotion and development. Romania as a tourist destination has a valuable natural and cultural potential (one of the benefits identified by the WEF in 2010), but it can be identified certain lacks of synchronization on distribution of tourism demand and other, so called “negative factors”, that might determined ranking Romania on position 66 of 133 countries that were included in the international top of tourist destinations (WEF 2010, WTTC 2009-2010).
Romania faces strong competition primarily from neighboring countries, but its competitive position is not strengthened. After processing the data provided by the WEF in its report on the measurement of competitiveness of tourist destinations, we can emphasize that Romanian tourism competitiveness is showing modest. Moreover, the main advantage of Romanian tourism seems to be the high level of safety and protection that Romania can provide tourists. At the same time, it should be taken into consideration the natural and cultural potential distributed uniformly across the country, which make it possible to practice different types of tourism (advantage mentioned in the previous paragraph).
Focusing on tourism infrastructure, it is increasing but needs a better qualitative and quantitative development so that the tourism resources can be exploited. In this way Romania may increase the number of tourists, their length of residence and profits obtained from tourism, so that Romanian tourism to become internationally competitive.
To achieve the research objectives, our attention turned to the Romanian hotel industry, recognized as a component of the economy and represented by a specific group of accommodation services.
The first step was to follow the features and the evolution of this segment. The results spoke for themselves. Until 2007, the investment in tourism infrastructure development and modernization has gradually increased, reaching a threshold of 1.600 billion lei, an 81.96% increase from the average of the '90s, to 288.65 billion lei.

BENCHMARKING ELEMENTS FOR CLUJ-NAPOCA HOTEL INDUSTRY
87
The investment effect was felt on the number of accommodations, from 3213 units recorded in 1990 to 4694 hospitality units in 2007. This means an increase of 31.55% but a decreased of accommodation capacity of approximately 20% compared to 1990. Arrivals of foreign tourists in Romania in 1994 decreased by 30% in 1999 but since 2000 there have been slight increases, reaching an increase by the end of 2007 by 37%. Moreover, the number of Romanian tourists that spent their holidays on the Romanian territory has continued to decline. If in 1990 there were 12.297 million arrivals in 2007 the value was almost halved, dropping by 43.30% - 6.972 million Romanian tourists in 2007.
Fig.1. The evolution of Romanian accommodation establishments between 1990-2007
Regarding the level of comfort provided by the units receiving tourists in 2007, only a percentage of 23.60% were classified as 3 stars category and 44.18% were classified as 2 stars. On the other hand, we can see an evolution of classified accommodation, so a 70.27% decrease from 1990 of unclassified accommodations (Fig.2.).

ALEXANDRA URCAN, SMARANDA COSMA
88
Fig.2. The evolution of Romanian accommodation establishments according
to comfort categories (1994-2007) The accommodation total capacity by type of tourism has shown a decrease
compared to the ‘90s on the following segments: (1) seaside, with 0.4% (2) spa with 26% and 14%, mountain tourism. Furthermore, tourism in Danube Delta, urban tourism and tourism in other cities, have increased as follows: (1) Delta - 4% (2), Urban tourism - 17% and (3) Other forms of tourism - 1.7% (Fig. 3).
Fig. 3. The evolution of accommodation establishments according to the main types of
tourist destination from Romania (1994-2007)

BENCHMARKING ELEMENTS FOR CLUJ-NAPOCA HOTEL INDUSTRY
89
In Romania, the number of hotel establishments increased with the rate of net investments that were oriented to tourism sector. If in 1990 there were 830 hotel units in Romania, in 2007 there were registered 1231 hotels and so the hotel market held in 2009, 20.73% of total accommodation structures at national level. From this segment, three and four stars hotels dominate the Romanian hotel market, representing 60% of the total hotel accommodation facilities.
Also, hotels and motels represent 26.22% from the total of Romanian accommodation establishments and have a capacity of 61.50%. According to NIS, 81.93% of tourists in Romania prefer hotel units and only 6.99% opts for accommodation services offered by urban and rural pensions. These are a series of arguments which led us to focus on the hotel component.
Actions under regional tourism development program entailed the dynamism of all four Romanian macro regions so that to begin expressing their competitive potential. Also, the cooperation between regions led to the formation of economic and financial levers that allowed the investment incentives to sustain the tourism development.
At the macro level, 51% of hotels are located in the Northeast and Southeast (macro region 2), 20% in the Northwest and Central (macro region 1), 15% in the South, Ilfov county and Bucharest (macro region 3) and 14% in the Southwest and West (macro region 4). The largest accommodation capacity in the hotel structure is held by North-East and Southeast regions (Table 1).
Table 1. Inter-regional classification of accommodation establishments in Romania in 2009
Classification
Macro regions
Geographical positioning
1 2 3 4 5 Number of rooms
Accommodation capacity
Macro region 1
North-West, Central
17 80 185 53 5 17516 34879
Macro region 2
North-East, South-East
39 207 240 50 6 43906 90640
Macro region 3
Bucharest, Ilfov county, South
12 52 81 48 11 13237 25830
Macro region 4
West, South-West 10 74 115 27 1 12418 24265
TOTAL 78 413 621 178 23 87077 175614
Source: Ministry Regional Development and Tourism Cluj-Napoca, considered the historical capital of Transylvania, is located in Northwestern Romania. Seen by its tourism potential, Cluj-Napoca has an advantage because of varied landscape and its geographical position. The city has a rich historical

ALEXANDRA URCAN, SMARANDA COSMA
90
and cultural heritage, materialized in monuments, museums, memorial houses, medieval churches and cathedrals, monuments, architecture, etc. This might be one of the important reasons why Cluj-Napoca is considered a tourist center, a starting point to areas from macro region 1. To face the increasing demand for accommodation services, in the last years have opened many accommodation establishments. Currently there are 231 classified accommodations and 89 are city-level accommodation. Of the number mentioned above at the county level, 49.94% are hotel-type accommodation which recorded 62.59% of total arrivals and 64,30% of overnight stays in the county. Hotels play an important role in the local market in terms of facilities and services: held 75% from the total available rooms at city level and 74% of total accommodation capacity. In terms of competitiveness at the macro region, Cluj county ranks second after Brasov county, considering the number of arrivals and number of overnight stays of tourists, with an net index of utilization the accommodation capacity of 21.66%, twice less than that provided in Bihor county, that reached the level of 42.12%.
Most accommodation units were opened after 2000 and so the local and inter-regional competition on the hotel market increased. Differentiation became the only item allowed to maintain or improve hotels’ position on the market.
Benchmarking is such a process that encourages differentiation and maintains a high standard of quality. Identifying and understanding best practices within your organization and other organizations is one of the ways for continuously improving and for enhancing organizational performance3. This involves evaluating and comparing the results of your own activity and processes with the organizations which have a better development in the area where they operate, in terms of practices they used, in order to achieve internal performance.
The implementation of several benchmarking elements is not constrained by the activity, industry or economic sector in which the organization operates. Therefore, its application to the hospitality industry is not new. There, according to the professional literature, can be used several methodologies for benchmarking, which varies according to "subject" on which the study is applied:
1. Benchmarking conducted on organizations who obtain profit or who performs various economic activities;
2. Benchmarking used on non-profit organizations; 3. Benchmarking on tourist destination. Benchmarking applied in this research focuses on the first category,
namely, the companies active in the hospitality industry. With a growing number of establishments offering quality accommodation, many tourism companies have considered a priority in maintaining competitiveness. To 3 European Benchmarking Code of Ethic, http://www.efqm.org/en/PdfResources/Benchmarking%20
Code%20of%20Conduct%202009.pdf

BENCHMARKING ELEMENTS FOR CLUJ-NAPOCA HOTEL INDUSTRY
91
reach this level, hospitality management often needs to develop reliable service quality standards. Perhaps one of the best ways to develop such standards is to compare their performance with the service provided by the unit market leader in that field and then to reassess its service performance continuously by applying a competitive benchmarking.
Material and Methods The ideas discussed within this paper resulted by using descriptive and
exploratory research. Primary and secondary data were collected through the following methods and tools: personal interview, interview by mail (e-mail or fax), questionnaire with 37 structured and unstructured questions (dichotomous, contingency and scale responses) to the consignation of hotels’ management teams, official statistics, official hotel sites or specialized sites in tourism, official reports.
The sample includes all the hotels from Cluj-Napoca, including the total number of available rooms in the city. Of the 40 hotels inaugurated by 2010, two hotels were excluded from the study, for being in renewing process. The final number of units that accepted to participate to the study was 22 hotels, representing 60% of all hotels and 63% of the total number of available rooms in Cluj-Napoca hotels. 37 hotels received the questionnaire or the management boards were directly contacted.
Thus to the research participated the hotels presented in Table 2.
Tabel 2.
Hotel Classification Nr. rooms Hotel Classification Nr. rooms
Beta 2 23 Topaz 3 44
Cristian 2 13 Victoria 3 74
Liliacul 2 25 Agape 4 53
Pax 2 23 Ary 4 39
Sport 2 136 Belvedere 4 156
Zimbru 2 23 City Plaza 4 85
ApartHotel Gutinului
3 6 Granata 4 59
Capitolina 3 24 Opal 4 33
Capitol 3 20 Premier 4 50
Cristal 3 20 Royal Classic 4 56
Olimp 3 39 Total 1010
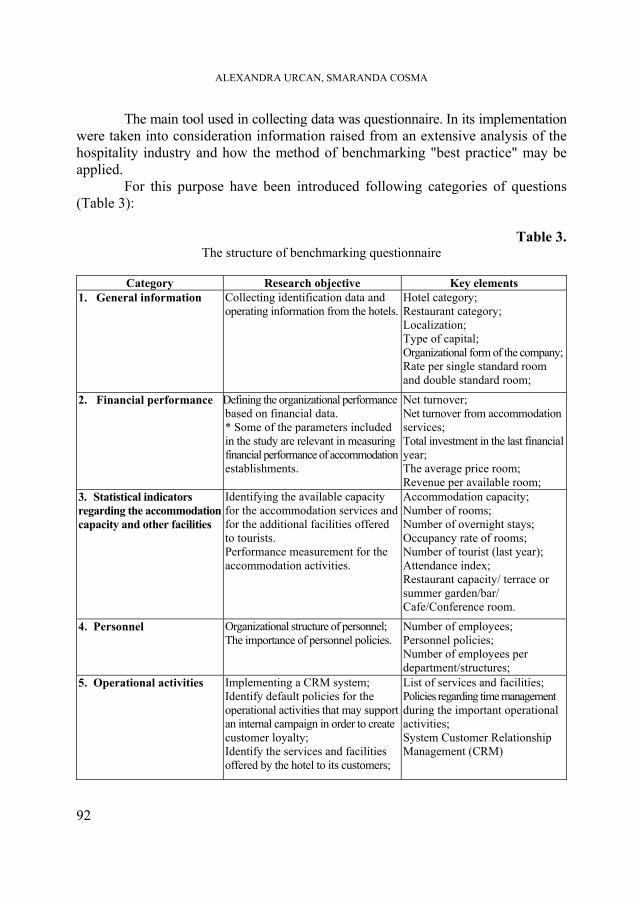
ALEXANDRA URCAN, SMARANDA COSMA
92
The main tool used in collecting data was questionnaire. In its implementation were taken into consideration information raised from an extensive analysis of the hospitality industry and how the method of benchmarking "best practice" may be applied.
For this purpose have been introduced following categories of questions (Table 3):
Table 3.
The structure of benchmarking questionnaire
Category Research objective Key elements 1. General information Collecting identification data and
operating information from the hotels.
Hotel category; Restaurant category; Localization; Type of capital; Organizational form of the company; Rate per single standard room and double standard room;
2. Financial performance Defining the organizational performance based on financial data. * Some of the parameters included in the study are relevant in measuring financial performance of accommodation establishments.
Net turnover; Net turnover from accommodation services; Total investment in the last financial year; The average price room; Revenue per available room;
3. Statistical indicators regarding the accommodation capacity and other facilities
Identifying the available capacity for the accommodation services and for the additional facilities offered to tourists. Performance measurement for the accommodation activities.
Accommodation capacity; Number of rooms; Number of overnight stays; Occupancy rate of rooms; Number of tourist (last year); Attendance index; Restaurant capacity/ terrace or summer garden/bar/ Cafe/Conference room.
4. Personnel Organizational structure of personnel; The importance of personnel policies.
Number of employees; Personnel policies; Number of employees per department/structures;
5. Operational activities Implementing a CRM system; Identify default policies for the operational activities that may supportan internal campaign in order to create customer loyalty; Identify the services and facilities offered by the hotel to its customers;
List of services and facilities; Policies regarding time management during the important operational activities; System Customer Relationship Management (CRM)

BENCHMARKING ELEMENTS FOR CLUJ-NAPOCA HOTEL INDUSTRY
93
Category Research objective Key elements 6. Marketing activities Identify marketing activities
implemented for strengthen the market position of the hotel and also for leading to differentiation on hotel market.
Basic elements of communication (internal and external channels); Media promotion; Differentiation; Corporate Social Responsibility;
7. Reservation systems Identify procedures for booking that are available for the clients (focus on diversity and accessibility);
Global reservation systems, online booking, through travel agents, telephone, etc.
8. The payment system for hotel services
Identify methods of payment for the customer services (the focus on diversityand accessibility);
Cash, bank transfer, credit card, barter, travelers checks, etc.
9. E-tourism The degree of adaptation to informing the customer through electronic tourism;
E-informing methods for promoting the hotel offer and services to potential clients.
10. Grid of general objectives
Identify a correlation between the overall objectives of two of the best hotels in Bucharest, JW Marriot Bucharest Grand Hotel (international chain) and Carol Park Boutique Hotel (Romanian capital), and overall objectives of Cluj hotels.
The rate of concern for achieving performance on the local and national hospitality industry or suitable strategies for the hotel market dynamics.
Interviewed subjects responded to these questions in order to benchmark the best practices, innovative ideas and operational procedures the may lead the hotels to performance.
After processing the data provided by the 22 hotels to pursue a comparative study, the study will be completed with the identification of best practices among hotels involved in research. Analysis and processing will be done in two stages:
- Comparative evaluation based on classification of the hotels: It aims to identify best practices in the light of an official classification of hotels. Three different reports were accomplished for each classification in part: 2 stars, 3 stars and 4 stars classification.
- Final Comparative Assessment: It will compare best practices of each classification in order to provide final
conclusions and recommendations.
Results and Discussions The study also aimed to establish the total offer of hotels in Cluj-Napoca.
To determine the sample size, were analyzed the following data: official classification of hotels, market entry (year), hotel location, number of rooms available, average tariff for double standard room.

ALEXANDRA URCAN, SMARANDA COSMA
94
Based on secondary data we have collected, we present the results on each criterion and subsequently will expose the results obtained from implementing the benchmarking process.
A. Official classification By early 2010, in Cluj-Napoca city, were opened 40 hotels, from which 9
of two stars hotels, 19 hotels of three stars, 11 four star hotels and one five star hotel. As is apparent, Cluj hotel market is dominated by 3 star hotels representing 47% of the local hotel market (Fig. 4.) and then the four-star hotels with 28%.
Fig. 4. The official classification of Cluj-Napoca hotels
B. Market entry (year) Most hotels were built after 2000 (73%) and only 10% in 1990-1999 (Fig. 5.).
The dynamic of the hospitality industry since 2000 can be linked to certain economic and social changes designed to facilitate the integration of Romania into the European Union and also with a decisive role in influencing and attracting a new wave of investments in various areas of the Romanian economy. Hospitality is one of the attractive areas and Cluj-Napoca in terms of the tourism potential has attracted many investors, both Romanian and foreign.
We can also take into consideration the lending policies offered by banks for co-financing the investment projects or to support medium or long term financial part of projects deemed reliable at that time.
A number of other significant factors could influence the increasing level of investments in this sector: standard of living of the local community, developing
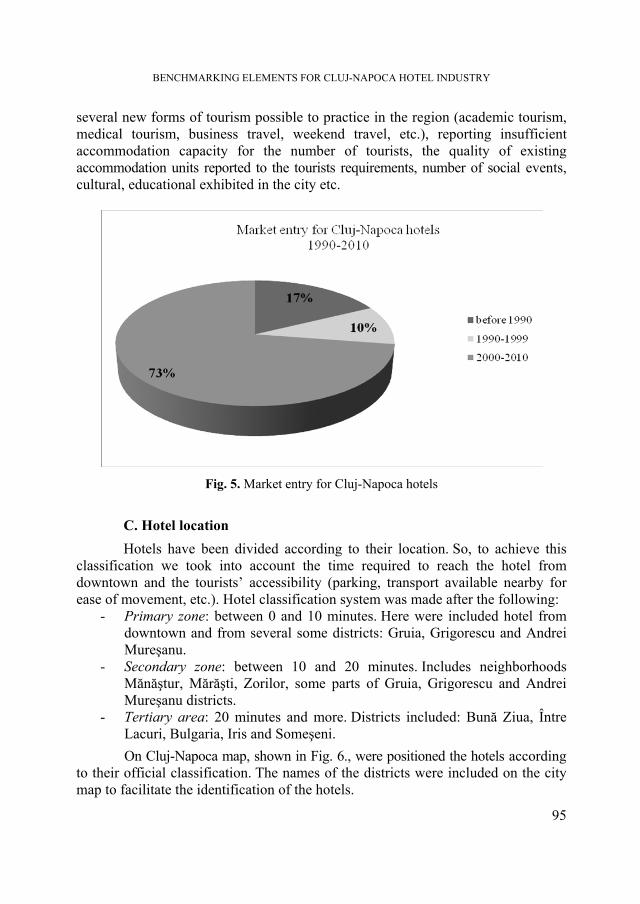
BENCHMARKING ELEMENTS FOR CLUJ-NAPOCA HOTEL INDUSTRY
95
several new forms of tourism possible to practice in the region (academic tourism, medical tourism, business travel, weekend travel, etc.), reporting insufficient accommodation capacity for the number of tourists, the quality of existing accommodation units reported to the tourists requirements, number of social events, cultural, educational exhibited in the city etc.
Fig. 5. Market entry for Cluj-Napoca hotels
C. Hotel location Hotels have been divided according to their location. So, to achieve this
classification we took into account the time required to reach the hotel from downtown and the tourists’ accessibility (parking, transport available nearby for ease of movement, etc.). Hotel classification system was made after the following:
- Primary zone: between 0 and 10 minutes. Here were included hotel from downtown and from several some districts: Gruia, Grigorescu and Andrei Mureşanu.
- Secondary zone: between 10 and 20 minutes. Includes neighborhoods Mănăştur, Mărăşti, Zorilor, some parts of Gruia, Grigorescu and Andrei Mureşanu districts.
- Tertiary area: 20 minutes and more. Districts included: Bună Ziua, Între Lacuri, Bulgaria, Iris and Someşeni. On Cluj-Napoca map, shown in Fig. 6., were positioned the hotels according
to their official classification. The names of the districts were included on the city map to facilitate the identification of the hotels.

ALEXANDRA URCAN, SMARANDA COSMA
96
Fig.6. Positioning the hotels on Cluj-Napoca city map
D. Number of rooms available From Fig.7. can be observed an orientation of the current holders to a
lower hotel capacity (less than 30 rooms), so 45% of the total number of hotels available in the city, have a number of rooms between 30 and 60 rooms.
Fig.7. The structure of the hotels according to the number of available rooms

BENCHMARKING ELEMENTS FOR CLUJ-NAPOCA HOTEL INDUSTRY
97
E. The average price per available room The price was calculated according to the classification of the hotel. The
reason that this criterion was taken into consideration was to identify the average rate between hotels prices fluctuates around for determining the final charge (assuming that the competition was taking into account). The results presented in Fig. 8 suggests an average difference between the reported rates for the next classification of 80 to 90 lei (each classification was reported to the following one: classification for two-star reported to three-star classification, three-star classification to four-star classification). However, if we analyze the differences on the same classification and we supposed the highest and lowest average tariff rate, we can see the following: - Two-star hotel classification: tariff difference of +/- 17%. - Three-star hotel classification 3 star: tariff difference of +/- 55%. - Four-star hotel classification: tariff difference of +/- 73% - Five-star hotel classification: five-star hotel has been taken into account in
determining the Cluj-Napoca hotels supply even if there is no direct competitor in the same classification. But it can compete with four-star hotels that practice similar or even higher rates and offer a wide variety of features comparable to those of five-star hotel. For example, the highest average tariff classification of four-star is increased by 3% over the average price charged by the five-star hotel.
Fig. 8. The average price per available room in Cluj-Napoca hotels

ALEXANDRA URCAN, SMARANDA COSMA
98
Fig. 9. The dynamics of average prices charged by Cluj-Napoca hotels
The analysis and data processing was done on all three hotel classifications,
taking into account the degree of completion of the questionnaire so that for each hotel can be compared the same set of questions. We must take into account that for reasons of confidentiality, in the following categories of questions from all hotels involved in the study, responded:
- Financial performance: 55% of hotels; - Statistical indicators regarding the accommodation capacity and other
facilities: 73% of hotels; - Personnel: 90% of hotels; - Operational activities - policies to achieve predetermined time (minutes) of
operational activities: 60%. In this category of question we should mention that there are hotels that do not have established such policies usually needed for streamlining the organizational activity. So, for the study to be consider representative in terms of its qualitative
and quantitative side, some questions will be excluded from the benchmarking analyze and will assay only those types of questions that have been fully completed and their processing can provide a conclusive result for each subject of the sample.
Information presented only from some members of the sample will be analyzed separately in other benchmarking reports, to form a detailed picture of the hotel market in Cluj-Napoca.
The report was divided into nine parts as follows: 1. General information 2. Statistical indicators regarding the accommodation capacity and other facilities

BENCHMARKING ELEMENTS FOR CLUJ-NAPOCA HOTEL INDUSTRY
99
3. Personnel 4. Operational activities 5. Marketing activities 6. Reservation systems 7. The payment system for hotel services 8. E-tourism 9. Grid of general objectives After examining the three reports according to the hotel classification, was
chosen by cumulative scores (was scored on a scale of 0-3 points), “best practices” hotel from the sample to whom has been compared.
At the two-star classification, the highest score was obtained by Sport Hotel, which has registered the maximum score at the following categories of questions:
- Statistical indicators regarding the accommodation capacity and other facilities (accommodation capacity, number of seats in the restaurant, number of seats in the conference room, number of seats in the bar/cafe, number of seats in the summer garden);
- Personnel (number of employees, efficiency, personnel policies); - Operational activities (number of services and facilities); - Marketing activities (basic elements of communication, advertising); - Reservation systems; - E-tourism.
At the three-star classification, the highest score was obtained by Best Western Topaz, which registered the maximum score in the following categories of questions:
- Location; - Personnel (number employees, efficiency, personnel policies); - Operational activities (diversity of services and facilities, implementation
of the customer relationship management); - Marketing activities (basic elements of communication, advertising, sales
promotion, public relations, differentiation); - Reservation systems; - The payment systems for hotel services; - Grid of general assessments (strengths).
At the four-star classification, the highest score was obtained by City Plaza hotel, which recorded maximum score at the following categories of questions:
- Category hotel, location, category restaurant; - Accommodation capacity, number of seats in the restaurant, number of seats
available in the conference rooms); - Personnel (number of employees, efficiency, personnel policies); - Operational activities (diversity of services and facilities, implementation
of the customer relationship management);
ALEXANDRA URCAN, SMARANDA COSMA
100
- Marketing activities (basic elements of communication, advertising, sales promotion, corporate social responsibility, differentiation);
- Reservation systems; - The payment for hotel services; - E-tourism.
Conclusions Superior capitalization of tourism potential by attracting in the economic circuit
of different regions, represents an intake side of the hospitality industry to tourism development and, indirectly, to the whole economy. Tourist areas rich in attractions may remain outside the interest because of the improper “fitting” for tourists or even for reasons like, lack of minimum conditions for camping. On the other hand, areas that are less endowed with tourist attractions may receive requests from tourists, because of comfort and quality of services that they can offer. The knowledge of this aspect of tourism, has a particular value for improving the relationship between tourism and its main component, the hospitality industry, because it can guide the investments to this segment, involving the rapid development of the hospitality industry. Also, hotel services not commensurate with the size of the demand or improper quality, show negative effects on the rest and recreation of the consumers and moreover will lead to changes in availability of revenue and overnight stays and, indirectly, decrease in tourist traffic.
Hospitality industry, the quality of hotel services and accommodation may influence not only the dynamics of tourism, but also its efficiency. Thus, through its own attraction, the hotel accommodation services promotes better use of the potential, human resources and its technical and material capacity, leading to the achievement of superior operating factors. Moreover, the complexity of accommodation, its level of quality, diversity, are components of prestige, the reputation of a product or a business travel, contributing significantly to increased marketing effectiveness of the holiday.
In developing a tourist identity that can contribute to forming and defining a tourist brand, Romania should take into account competitive factors and not just the comparative ones (cultural elements, natural, social, elements of fauna, flora and climate, etc.). These factors are emphasized on current promotional campaigns but can not be improves through major changes because they cause only primary tourism supply. But if we focus on competitive factors relating to secondary tourism supply, they may pass by a large number of changes and improvements with the help of a proactive involvement from companies or even with a government policy intervention. Thus, competitive advantage is related to tourism infrastructure, quality management, workforce qualifications, and government policy. Both sets of factors involved in shaping and defining competitive tourist destinations and emerging positive image for the country but we must keep in mind that there is a segment of customers who are very well informed and want to form a realistic picture of the intended target.
BENCHMARKING ELEMENTS FOR CLUJ-NAPOCA HOTEL INDUSTRY
101
In a particular way, with reference only to the Romanian hotel industry, we see that there is a discrepancy between the value of investments, which increased substantially over previous years (with 81.96% compared to the '90s) and convenience provided (45% of hotels in Romania are as two-star hotel classification), service quality relative to price paid by tourists and accommodation capacity (investment in small hotels with a capacity under 50 rooms) and recent government policies.
At local level, and here we refer to the hotel industry from Cluj-Napoca, hotel investment in accommodation establishments increased by 73% since 2000, while taking into account the fact that Cluj county is second in terms of the number of arrivals and number of overnight stays after Braşov county, but differentiation strategies are nonexistent or very slightly different: 77% of surveyed hotels claim that differs by their quality services and personnel policies, while 82% claim that they offer different facilities and ancillary services while 73% did not focus on differentiation by factors of internal and external communication.
Research that was carried out at Cluj-Napoca hotels aimed to identify best practices, innovative ideas and operational procedures that tend towards the concept of performance in hospitality activity and towards differentiation. Identifying good practices in the area that are worth to be followed in the local hotel industry can encourage the formation of a competitive domestic environment, open to change, in which employees are encouraged to achieve their own performance. Default result would be to improve the secondary tourist offer, which would lead to the formation of competitive advantages, easily differentiated from the competition.
REFERENCES
1. Bogan C., English M. (2001), Benchmarking for best practices, R.R. Donnelley&Sons Company.
2. Cosma S. (2006), Tourist destination Cluj-Napoca, Romania, Studia Negotia, vol.2., p.51-72.
3. Kotler P., Keller K.L. (2006), Marketing-Management, Pearson Prentice Hall. 4. Kotler P., Bowen J.T., Makens J.C. (2010), Marketing for hospitality and tourism, Pearson. 5. Kozak M., Remmington M.,(1998), Benchmarking: destination attractiveness and
small hospitality business performance available on-line at: http://www.emeraldinsight.com/journals.htm?articleid=867248&show=abstract, accessed on 22.03.2010.
6. Lennon J. (2001), Tourism statistics – international perspective and current issues, Continuum.
7. Lockwood A., Medlik S. (2001), Tourism and hospitality in the 21st century, Butterworth-Heinemann.
8. Pop C., Cosma S., Negruşa A., Ionescu C., Marinescu N. (2007), Romania as a tourist destination and the Romanian hotel industry, Cambridge Scholars Publishing.
9. Reid R., Bojanic D.C (2010), Hospitality marketing management, Wiley.

ALEXANDRA URCAN, SMARANDA COSMA
102
10. Theobald W.T. (2001), Global Tourism, Butterworth-Heinemann. 11. Tomescu A.M. (2005), The quality of tourist services and EU regulations, available on-
line at: http://steconomice.uoradea.ro/anale/volume/2005/turism-durabil/9.pdf, accesat în data de 19.04.2010.
12. Zairi M., Leonard P. (1994), Practical benchmarking: the complete guide, Chapman and Hall.
13. www.eoq.org: European Organization for Quality 14. www.insse.ro: National Institute of Statistics 15. http://www.mdrl.ro/index.php?p=4403: Ministry of Regional Development and Tourism 16. http://www.unwto.org/quality/std/en/std_01.php?op=1&subop=1: 17. http://www.weforum.org/en/initiatives/gcp/TravelandTourismReport/index.htm:
World Economic Forum 18. http://www.wttc.org/eng/Tourism_Research/Policy_Research/Annual_Reports,_Progress_
and_Priorities/index.php: World Travel and Tourism Council 19. http://www.abihotel.ro 20. http://www.hotelagape.ro 21. http://www.hotelary.ro 22. http://www.hotel-athos.ro 23. http://www.bestwesterntopaz.ro/ 24. http://www.hotelbeta-cluj.ro 25. http://www.hotel-capitolina.ro/ 26. http://www.centralmelody.com/ 27. http://www.cityhotels.ro/CityCentral/ 28. http://www.cityhotels.ro/CityPlaza/ 29. http://www.hotelconfort.ro 30. http://www.hotel-cristal.ro/ 31. http://www.hotelcristian.ro 32. http://www.hoteldelaf.ro 33. http://www.fullton.ro/ 34. http://www.goldentulipanadome.com/ 35. http://www.ncounter.ro 36. http://www.hotel-olimp.ro 37. http://www.hotelonix.ro 38. www.opalhotel.ro 39. http://www.operaplaza.ro/ 40. http://www.hoteloscar.ro 41. http://www.hotelpami.ro 42. http://ww.hotelparadis.ro 43. http://www.hotelpremiercluj.com/ 44. http://www.hotelseven.ro/ 45. http://www.hoteltransilvaniacluj.ro 46. http://hotelvictoria.apps.ro 47. http://www.hotelzimbru.ro 48. http://www.unita-turism.ro/ro/hotel/cluj-napoca/sport.html 49. http://www.unita-turism.ro/en/hotel/cluj-napoca/belvedere.html

STUDIA UNIVERSITATIS BABEŞ-BOLYAI, NEGOTIA, LV, 4, 2010
MODERN SOLUTIONS FOR ONLINE PROMOTION OF TOURISM OFFERS
MIHAI FLORIN TALPOS1
ABSTRACT. The paper highlights a set of actions that should help hospitality industry managers implement and maintain online promotion techniques and strategies in order to positively influence the rate of clients’ adoption. Some of these suggestions, namely using artificial intelligence software to alert Internet Banking users that they can find better tourism deals than the ones they are about to pay or using similar software to notify online buyers of different products (egg: bags) that they can benefit from great tourism offers, are new approaches to modern and really interactive online marketing. Efficiently integrating online marketing in the general marketing strategies of the companies within the tourism sector is a challenge for all hospitality industry managers, even if Internet marketing is a complementary part of the classic marketing. Therefore, hospitality industry managers should pay special attention to creating permanent harmony between the classical marketing and the online one, in terms of company identity, marketing instruments or clients’ attraction impact. The companies within the tourism sector must develop their marketing strategies in a modern manner and the role and importance assigned to each type of marketing instruments - classical or virtual – should be seen exclusively through the total efficiency indicator. The main objective of the paper is to identify possible solutions to efficiently promoting tourism offers online. The approach proceeds from advancing the main ad-ons that online marketing can bring in terms of marketing mix, followed by concrete suggestions and examples, supported by a consistent literature survey, over the possible modern online promotion solutions to be considered by the managers (Pay-Per-Click, Pay-Per-Lead, Pay-Per-Sale, Google AdSense etc). As a result, the paper can represent a fresh and innovative perspective on the online promotion techniques and strategies, which might be of interest to hospitality industry managers, Internet Banking providers, academics and researchers. Some of the solutions offered by the author are original. Key words: tourism, online promotion, clients’ adoption rate, high efficiency. JEL classification: L83
1 Ph.D. student, Technical University of Cluj-Napoca, Romania, [email protected]

MIHAI FLORIN TALPOS
104
Introduction Theorists might say: marketing is the same, regardless of the environment
in which it is practiced. However, the unprecedented influence of the IT & C (Information and Communication) technologies is generally recognized, as a part of the phenomenon of modern marketing.
Internet marketing really is different: it is fast, constantly changing, it implies the use of new instruments and it addresses to a rapidly increasing number of users [1].
If managed properly, online marketing can bring important ad-ons to the marketing mix of a company:
• Costs reductions. The costs of producing printed brochures, product sheets or
catalogs are not negligible. Besides that, the distribution of those advertising printed materials implies costs and efforts (mailing taxes and preparing customized envelopes etc). Those costs can be consistently reduced by posting the same information on the Internet.
• Time savings. Traditional marketing activities can be time intensive processes. Elaborating advertising texts, correcting and reviewing those texts are processes that involve a lot of time and attention. This transposes into long periods of time between deciding to publish an ad and its actual publication in the press. In case of an on-line ad, things can happen almost instantly. The ad, as soon as it is conceived, can be posted in a matter of seconds.
• Increased interactivity. Online marketing allows clients to quickly search and locate the information they need, or even start a cost effective dialog with the tourism company when supplementary details are necessary. This improves the quality of the company-client relationship and contributes to the establishment of a more alive and convincing dialogue. It also brings an improved rate of activism between the clients, which transposes into an excellent rate of advertising information storage among the clients, due to the fact that arguments can’t be deformed in an Internet ad because the client always has the permission to go to essential sequences, jumping over the ones that are not of interest to him.
• Global coverage. Online marketing removes barriers of time and distance, thus it can offer companies the possibility to easily enter diverse markets.
• Continuous availability. Probably the best attribute of an online server is the fact that it has around the clock availability, 24 hours per day, 365 days per year. Such an “employee” never goes in vacation, never “gets seek” and never loses precious time with personal calls. The “online seller” never sleeps so it can sell even if the rest of the company is sleeping [1].
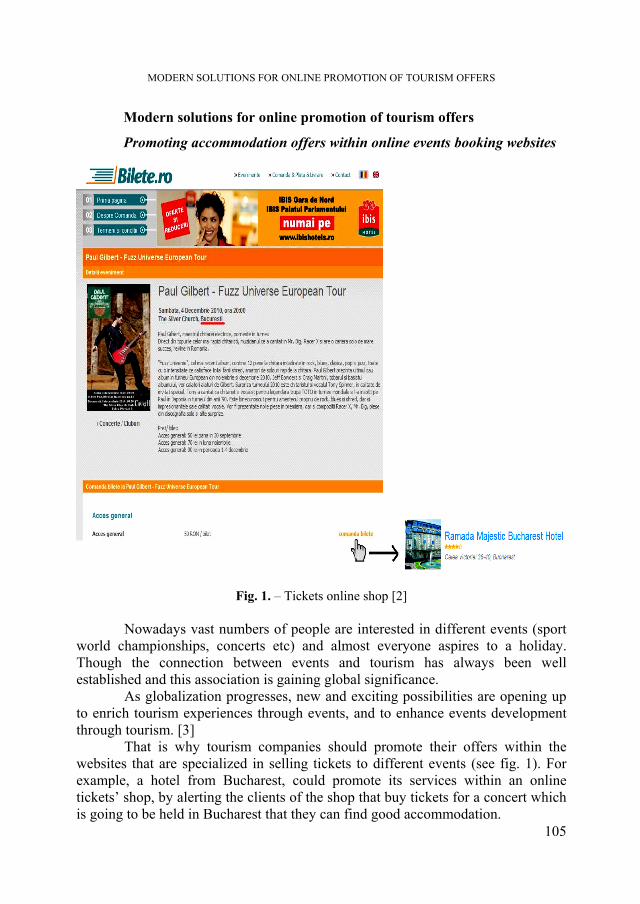
MODERN SOLUTIONS FOR ONLINE PROMOTION OF TOURISM OFFERS
105
Modern solutions for online promotion of tourism offers
Promoting accommodation offers within online events booking websites
Fig. 1. – Tickets online shop [2]
Nowadays vast numbers of people are interested in different events (sport world championships, concerts etc) and almost everyone aspires to a holiday. Though the connection between events and tourism has always been well established and this association is gaining global significance.
As globalization progresses, new and exciting possibilities are opening up to enrich tourism experiences through events, and to enhance events development through tourism. [3]
That is why tourism companies should promote their offers within the websites that are specialized in selling tickets to different events (see fig. 1). For example, a hotel from Bucharest, could promote its services within an online tickets’ shop, by alerting the clients of the shop that buy tickets for a concert which is going to be held in Bucharest that they can find good accommodation.

MIHAI FLORIN TALPOS
106
Promoting tourism offers among the Internet Banking users
Fig. 2. – ING Internet Banking platform [4]
The number of Internet Banking users increases day by day. As such,
collaborating with banks in promoting tourism offers among those users should be a priority for the hospitality industry managers.
For example, if an Internet Banking user pays a holiday ticket by using the Internet Banking application, he can be alerted about the existence of a similar / better deal (see fig. 2), before sending the payment order to the bank.
This can be done by using artificial intelligence software that parses the applications’ forms for presetted key words (egg. Tunisia, sejur etc). This way, the user can be alerted each time he completes the application’s forms and uses certain words.
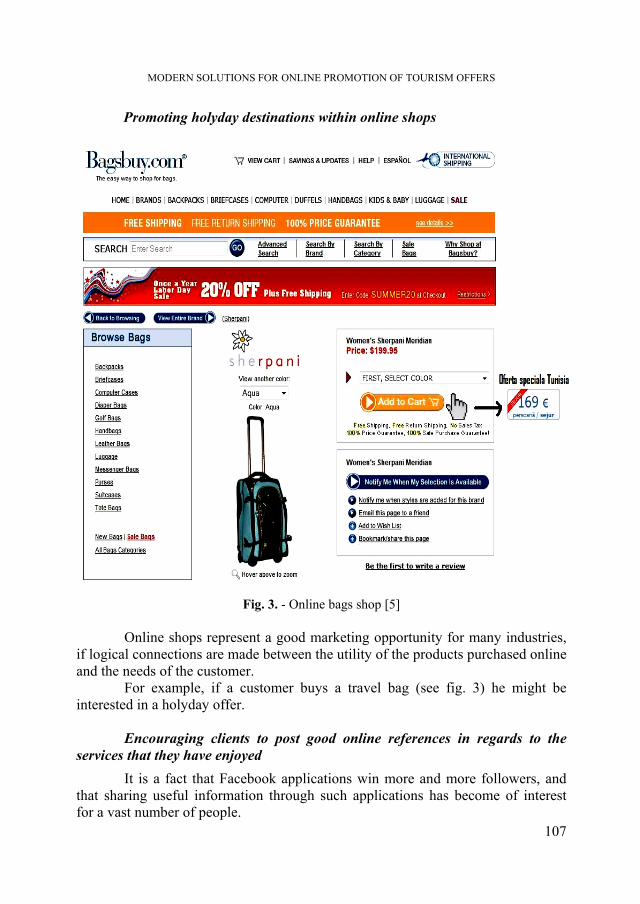
MODERN SOLUTIONS FOR ONLINE PROMOTION OF TOURISM OFFERS
107
Promoting holyday destinations within online shops
Fig. 3. - Online bags shop [5]
Online shops represent a good marketing opportunity for many industries,
if logical connections are made between the utility of the products purchased online and the needs of the customer.
For example, if a customer buys a travel bag (see fig. 3) he might be interested in a holyday offer.
Encouraging clients to post good online references in regards to the
services that they have enjoyed It is a fact that Facebook applications win more and more followers, and
that sharing useful information through such applications has become of interest for a vast number of people.
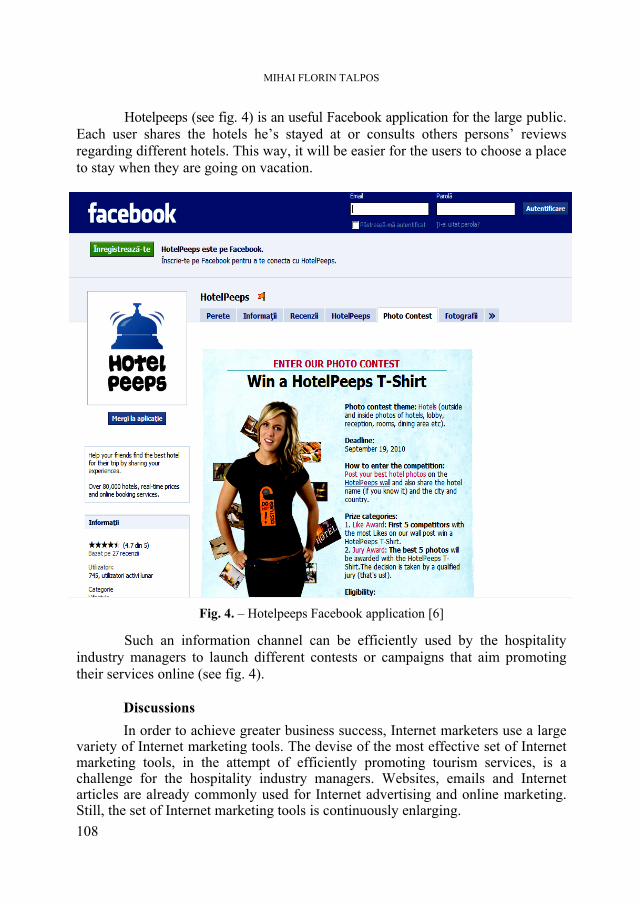
MIHAI FLORIN TALPOS
108
Hotelpeeps (see fig. 4) is an useful Facebook application for the large public. Each user shares the hotels he’s stayed at or consults others persons’ reviews regarding different hotels. This way, it will be easier for the users to choose a place to stay when they are going on vacation.
Fig. 4. – Hotelpeeps Facebook application [6]
Such an information channel can be efficiently used by the hospitality industry managers to launch different contests or campaigns that aim promoting their services online (see fig. 4).
Discussions In order to achieve greater business success, Internet marketers use a large
variety of Internet marketing tools. The devise of the most effective set of Internet marketing tools, in the attempt of efficiently promoting tourism services, is a challenge for the hospitality industry managers. Websites, emails and Internet articles are already commonly used for Internet advertising and online marketing. Still, the set of Internet marketing tools is continuously enlarging.
MODERN SOLUTIONS FOR ONLINE PROMOTION OF TOURISM OFFERS
109
Besides the above presented marketing solutions, there are some other effective Internet marketing tools that came with the most recent wave, as a part of the so called “affiliate marketing”, such as:
‐ Pay-Per-Click: It refers to an Internet advertising model wherein an advertiser pays if a user clicks on an advertisement. In this advertising technique, advertisements relevant to the web page content are displayed along with the content. This increases the chances of web users clicking on the advertisements. Depending on the number of clicks an advertisement receives, websites charge the advertisers.
‐ Pay-Per-Lead: In this form of affiliate marketing, whenever a client registers at a merchant’s website as a result of an advertisement on the affiliate’s website, a stipulated amount of money is given to the affiliate.
‐ Pay-Per-Sale: In this method of affiliate marketing, for every sale resulting from the advertisements featured on an affiliate’s website, a share of the profit is given to the affiliate.
‐ Google AdSense: AdSense is an application run by Google and can be used as an Internet marketing tool by website owners. They can enroll to Google AdSense, whereby they can host text, image or video ads on their websites. The advertisers are charged based on the number of times an advertisement is clicked or on the number of times it appears on the website. [1]
Conclusions Like in many other fields, research and lessons learned from experience are
key factors for hospitality industry managers in their attempt to achieve better clients’ adoption rates. Under such circumstances, implementing innovative practices in terms of the diversification of the information channels, contributes to improving brand awareness and clients’ interest in tourism services.
The benefits of using modern practices in online marketing, like: promoting accommodation offers within online events booking websites; promoting tourism offers among the Internet Banking users; promoting holyday destinations within online shops; encouraging clients to post good online references in regards to the services that they have enjoyed etc can separate any entrepreneur from the rest of the competition.
In fact, a commitment to using the modern practices in a field such online marketing is a commitment to using all the knowledge and Internet based technology at one's disposal to ensure good results.
If hospitality industry managers will make such commitments, they can provide means for the tourism companies to develop and maintain ongoing relationships with their customers, by offering easy access to a broad array of services, through which the companies will build customer loyalty, cross sell, and enhance repeated business.

MIHAI FLORIN TALPOS
110
REFERENCES
1. Dan Candea & Mihai Talpos (2009). Contemporary challenges in Internet Banking, The Proceedings of the International Conference: Managerial challenges of the contemporary society, Risosprint – Cluj Napoca, 2009
2. Source: http://www.bilete.ro/comanda.asp?eveniment=Paul+Gilbert+Fuzz+Universe+European+Tour (11.05.2010)
3. P. De Knop, Sport and events tourism, Online article, Source: http://www.download-it.org/free_files/filePages%20from%2014%20Sport%20and%20events%20tourism.pdf (12.05.2010)
4. Source: https://www.homebank.ro/homebank/HomeBank/Request (12.05.2010) 5. Source: http://www.bagsbuy.com/sherpani-meridian/361578/769903?cm_mmc=cj-feed-
bb-_-none-_-none-_-none (11.05.2010) 6. Source: http://www.facebook.com/HotelPeeps (12.05.2010)