Demand for Price Insurance among Farmers in India: A Choice Experiment-based Approach
34
lR;eso ijeks /eZ% IEG Working Paper No. 340 2014 Thiagu Ranganathan Sarthak Gaurav Ashish Singh Demand for Price Insurance among Farmers in India: A Choice Experiment-based Approach
Transcript of Demand for Price Insurance among Farmers in India: A Choice Experiment-based Approach

lR;eso ijeks /eZ% IEG Working Paper No. 340 2014
Thiagu Ranganathan
Sarthak Gaurav
Ashish Singh
Demand for Price Insurance among
Farmers in India: A Choice
Experiment-based Approach

lR;eso ijeks /eZ% IEG Working Paper No. 340 2014
Thiagu Ranganathan
Sarthak Gaurav
Ashish Singh
Demand for Price Insurance among
Farmers in India: A Choice
Experiment-based Approach
ACKNOWLEDGMENT
We would like to acknowledge the research grant from ILO Microinsurance InnovationFacility for taking up this study. Thanks are in place to Tatiana Goetghebuer of Facultésuniversitaires Notre-Dame de la Paix (FUNDP), Namur for facilitating the study. We are alsothankful to Natu Macwana of Sajjata Sangh and staff at the field offices (Shikshan ane SamajKalyan Kendra (SSKK), Khambha and Daheda Sangh Khambhat) for collaborating with us.Further, we acknowledge the organisational assistance from Centre for Microfinance,Institute for Financial Management and Research (IFMR), Chennai. Ilesh Shah providedexcellent survey assistance.
Thiagu Ranganathan is Assistant Professor at Institute of Economic Growth, Delhiemail: [email protected]
Sarthak Gaurav is Post Doctoral Researcher, Asia Research Centre, London School ofEconomics
Ashish Singh is Assistant Professor, Shailesh J Mehta School of Management, Indian Instituteof Technology Bombay
Demand for Price Insurance among
Farmers in India: A Choice
Experiment-based Approach
ABSTRACT
Using choice experiments, we estimate the willingness to pay for price insurance amongcotton and paddy farmers in the Indian state of Gujarat. We also identify the interactionsbetween the demand for price insurance and the existing informal and formal insurancemechanisms. Our results indicate that cotton farmers value price insurance more than paddyfarmers. Also, most of the existing informal risk management strategies of farmers seem tohave a positive effect on the demand for price insurance, suggesting potentialcomplementarities. Important policy implications on the design and bundling of innovativefinancial products follow from our findings.
Willingness to pay, price insurance, choice experiments, India
D81, D01, G13
Keywords:
JEL classification:


1 INTRODUCTION
2 PRICE RISKS, EFFECTS OF UNMITIGATED PRICES RISKS, AND PRICEINSURANCE
Agriculture is an intrinsically risky economic activity. Farmers face a multitude of risks, suchas production risks, on account of weather variations, and price risks, associated with fallingoutput prices (Newbery and Stiglitz 1981; Walker and Ryan 1990; Kurosaki 1998; Harwood
. 1999; Hardaker . 2004). While farmers all over the world are vulnerable, farmers inthe developing world are more susceptible to such risks because the markets for credit andinsurance are either absent or incomplete (Rosenzweig and Binswanger 1993). To mitigatethese risks, farmers rely on a number of informal risk management strategies, such as spatialand variety diversification; staggered plantation; and support from informal risk sharingnetworks (Alderman and Paxson 1992; Rosenzweig and Wolpin 1993; Townsend 1994;Dercon 1996; Skees 2002). However, while these informal mechanisms may be effectiveagainst idiosyncratic and low-magnitude shocks, they may fail in the eventuality of systemicor covariate shocks that affect a large number of farmers in a specific region simultaneously(Townsend 1995). Given the inadequacy of informal risk management mechanisms in thedeveloping world to mitigate systematic and covariate risks, there have been attempts atdeveloping efficient formal or market-based risk transfer instruments. But most availableinstruments focus on insuring production risks of farmers through either multi-peril cropinsurance (Hazell . 1986; Mishra 1995) or through index-based weather insurance(Manuamorn 2007; Barrett . 2007; Barnett . 2008; Cole . 2012), and lay littleemphasis on insuring farmers' price risks that could impact farm revenues considerably(Ramaswami . 2004). Although pilot revenue insurance programmes have previouslytried to address the issue of price risk, individual farm-level price risk is left unmitigated inthese programmes, primarily because of the aggregated estimates of yield and price used in
such programmes (Mahul and Wright 2003).
Though yield risk is important for farmers, the uncertainty in harvest prices and the downsiderisks in output prices is sometimes a larger concern, particularly for cash crop farmers whostand to lose substantially if they receive lower-than-expected prices (Harwood . 1999;Sarris . 2006). Moreover, during times of very low prices, farmers in developing countriesare prone to distress sale of their produce as credit and storage facilities in these countries areimperfect (Sahu . 2004; Poulton . 2006). Harvest price risks are managed primarily by
et al et al
et alet al et al et al
et al
et alet al
et al et al
1
2.1 Price Risks: Larger Concern
1 Revenue insurance products make a payout based on the revenue index, which is generally a product of yield in ahomogeneous area (county, state, or other smaller division) and the futures price. This index might not actuallyreflect the individual farmer's income risk in all cases.
3
the state's institutional arrangements. Failures in these arrangements expose farmers toconsiderable price volatility. For example, the system of minimum support prices (MSP) inIndia guarantees floor prices for different commodities, and promises procurement by thegovernment if market prices crash, but the system has not effectively insured prices realised
by farmers. Moreover, while market-based risk management options (such as hedging in thefutures or options markets) provide farmers in the developed world ample strategies to hedgeprice risk (Berg and Schmitz 2008), developing world farmers have few such options.
The effects of unmitigated price risk can be seen in both ex post and ex ante decision-makingof agents in an economy (Dehn 2000). In a seminal work, Sandmo (1971) explores the effectof price risk on ex ante decision making and shows that a risk-averse firm would produce lessif the output price were uncertain than if it were deterministic. In the context of a farmhousehold, Finkelshtain and Chalfant (1991) show that the same may not be true for farmhouseholds when they produce commodities that they consume a part of. But Sandmo's(1971) hypothesis can be held true for farm households that produce cash crops, and we havereasons to believe that generally risk-averse farmers would produce less under priceuncertainty than if prices were certain. It has also been argued that unmitigated price risk cansignificantly impact farmers' revenue and their short-term labour allocation, crop choices,and long-term investment decisions (Dercon 1996; Hill 2009, 2010).
For food crop growers and subsistence farmers, volatile harvest prices are a majorconcern. The impact of food price volatility on farm household welfare depends on whethersuch households are net buyers of the food crop or net sellers (Bellemare . 2011).Moreover, the price risk associated with these crops is found to have a differential impact onrich and poor farmers (Barrett 1996), and could have important welfare consequences in thedeveloping world.
The aforementioned studies suggest that while the price risk associated with crops couldadversely affect farmers' decision-making and welfare, farmers' options to insure these risksare limited. Given this conjecture, there is strong motivation to believe that farmers might bewilling to pay for market-based insurance to insure against price risk, namely 'priceinsurance'.
Accordingly, threethingsbecomerelevant inunderstandingthedemandforprice insurance.
1. The willingness to pay (WTP) for price insurance might be different for cash cropcultivators than for food crop cultivators.
2
2.2 Effects of Unmitigated Price Risk
2.3 Price Insurance
et al
2 At present, the MSP is announced for 25 major agricultural commodities (all-important cereals; and pulses,oilseeds, cotton, jute, sugarcane, and tobacco).
4

2. The demand for such price insurance might depend on the farmer's risk attitudes and theexistence of informal risk mitigation strategies.
3. The demand for price insurance could also depend on the availability of alternative'price discovery' and formal risk management instruments to hedge income risk.
These demand side issues are critical and need to be understood, especially in thecontext of developing countries, but no systematic studies address the issue of price risk forfarmers in India. The implementation of government MSP programmes for various crops hasnot been very effective (Government of India 2006; Basu 2010), and farmer participation in
the nascent commodity futures markets is very low. Trading in commodity options has beenbanned; even if the ban is lifted, farmer participation might be low because of complexitieslike minimum lot size and margin money involved while trading in exchanges (Simmons2002; Pannell . 2008). Given this scenario, it is critical to understand the value of priceinsurance for farmers. This issue has not been explored in the Indian context and this paperattempts to address this gap.
Using the methodology of choice experiments involving 480 farmers in two talukas ofthe state of Gujarat, our study addresses the following questions:
Do farmers have the willingness to pay (WTP) for price insurance?
What attributes of price insurance products do farmers value?
What are the factors that influence the sum farmers are willing to pay for price insurance?
How does the existence or usage of informal risk management mechanisms and rainfallinsurance products (a formal mechanism of risk mitigation) affect the WTP?
Are there heterogeneous effects in the WTP and factors affecting WTP for cash cropfarmers (cotton) and food crop farmers (paddy)?
The remaining paper is organised as follows. Section 3 reviews the literature on thedemand for price insurance in different country settings. Section 4 explains the choiceexperiment approach in detail. Section 5 presents the description of the experimental design,survey, and the data used in our analysis. Section 6 presents our main findings, and Section 7concludes our study.
The literature on demand for price insurance is nascent. A few authors have used differentmethodologies to study the demand for price insurance and identify factors of demand for
3
et al
3 DEMAND FOR PRICE INSURANCE
n
n
n
n
n
3 A 2007 survey by the Ministry of Consumer Affairs, Food and Distribution of 2714 farmers found that only 1.3 percent of the farmers knew of futures markets (Government of India 2008).
5

hypothetical price insurance products. For example, Hill (2006) estimates Ugandan coffeefarmers' WTP for price insurance and finds substantial demand, and that a major factor of thatdemand is the perception of price variations. Sarris . (2006) estimate Tanzanian coffeeand cashew nut farmers' WTP and find that the usage of informal risk coping mechanismsnegatively impacts demand. More recently, Kouame and Komenan (2012) estimate the WTPfor minimum price insurance among cocoa farmers in Cote D'Ivoire and establish that apartfrom various household and demographic characteristics, risk aversion has a significantnegative impact on the demand for price insurance. These studies seem to demonstrate alatent demand for formal price insurance among farmers in least developed countries (LDCs).These studies also demonstrate that risk attitudes and existing informal mechanisms (apartfrom other factors) could significantly impact the WTP for such insurance.
In the absence of actual insurance products, the WTP for insurance has been estimated byusing 'stated preference' methods such as contingent valuation and 'revealed preference'
methods. The contingent valuation methods use one of two methods: (1) the farmer's directresponses on WTP for insurance (Sarris . 2006; Kouame and Komenan 2012) or the (2)indirect method, which uses farm household data and risk preference data, and measures WTPas the difference between utility of the household with and without insurance (Sarris 2002; Hill2006). The revealed preferences method uses farmer's household behaviour data and estimatestheWTPbyassumingan expected utility maximisingbehaviour (Gautam .1994).
Each of these methods has their own advantages and disadvantages, and has been usedin various circumstances accordingly. Strikingly, none of these methods considers thefeatures or attributes of price insurance products while calculating the WTP for farmers, eventhough these features or attributes could have a significant impact on farmers' WTP.
Attributes like level of coverage (amount of insurance provided) could be considered animportant feature that could affect farmers' WTP. Other features like coverage period andclaim settlement time are also of practical importance. A priori, we expect that farmers wouldwant to pay more for a price insurance product with a shorter claim settlement time, earlycoverage start time or a later coverage end time. A choice experiment design to estimating theWTP helps us to understand the effects of these features on the demand for price insurance. Tothe best of our search, we have not come across any study that has used such an approach toestimate the WTP for a price insurance product.
Choice experiments have been widely used in the consumer demand literature to understandthe demand for intangible products or products not yet offered in the market (Alpizar .
et al
et al
et al
et al
4
4 CHOICE EXPERIMENT DESIGN: AN APPROACH FOR UNDERSTANDING THEDEMAND FOR NON-MARKETED PRODUCTS
4 For a discussion on stated preference and revealed preference techniques to elicit WTP, see Carson . (1994) andMcFadden . (2005).
et alet al
6

2003; Hu . 2004; Birol and Das 2010; Rigby 2010; Chiang . 2012). Most of theusage of choice experiments has taken place in the developed world, and mainly in the fieldof marketing, transportation, environmental valuation (Louviere . 2000), and healtheconomics (De Bekker-Grob . 2012)
The use of choice experiments to assess the valuation and demand of products in thedevelopingworld has also increased in recent times.Valuation ordemand has been assessed for
pig breeds and cattle breeds in Kenya (Scarpa . 2003a, 2003b);
biodiversity conservation and scenicbeauty in CoteD' Ivoire (Bienabeand Hearne2006);
water policy scenarios in South Africa (Hope 2006);
colour and nutritional quality of maize in Kenya ( De Groote and Kimenju 2008);
eco-tourism in Rwanda (Bush . 2009);
intercropping systems and GM crops in Mexico (Birol . 2009);
improved wastewater treatment in India (Birol and Das 2010); and
bio-fortified orange maize in Kenya (Meenakshi . 2012).
These studies show a shift from the simple contingent valuation method to the choiceexperiment method for valuing non-market and intangible goods. Since price insurance is notmarketed currently, our analysis uses the choice experiment design.
Choice theory draws its fundamentals from the work of Lancaster (1966 and 1971), whopostulated that the consumer derives utility from the attributes (features) of the product, andnot the product itself. Thus, when a consumer chooses a product over another, the trade-off isnot just between two products but between different attributes of the two products. Therefore,it is necessary not only to understand how much a consumer values the product but also howmuch s/he values its different attributes.
et al et al. et al
et alet al
et al
et al
et al
et al
The econometric foundation for the choice experiments are derived from the 'randomutility theory' following Luce (1959) and McFadden (1974), who proposed a 'conditionallogit model', which is useful in determining the impact of a particular feature on the demandfor a particular product. According to random utility theory, a customer derives utility (U )
from a particular alternative. This alternative can be broken down into a systematiccomponent (V ), which will be determined by the product's features (what Lancaster calls
'consumption technology') and a random component ( ), which will depend on the
individual's tastes and which is unobserved, as we cannot 'peep into the head' of anindividual (Louviere . 2000, 5). Based on this theory, the linear choice model isrepresented by the equation:
ij
i
ije
et al
n
n
n
n
n
n
n
n
ijijij VU e+=
nnij XXXV bbb +++= ...2211
(1)
(2)
7
where b s are the utility parameters assumed initially to be constant across all theindividuals.
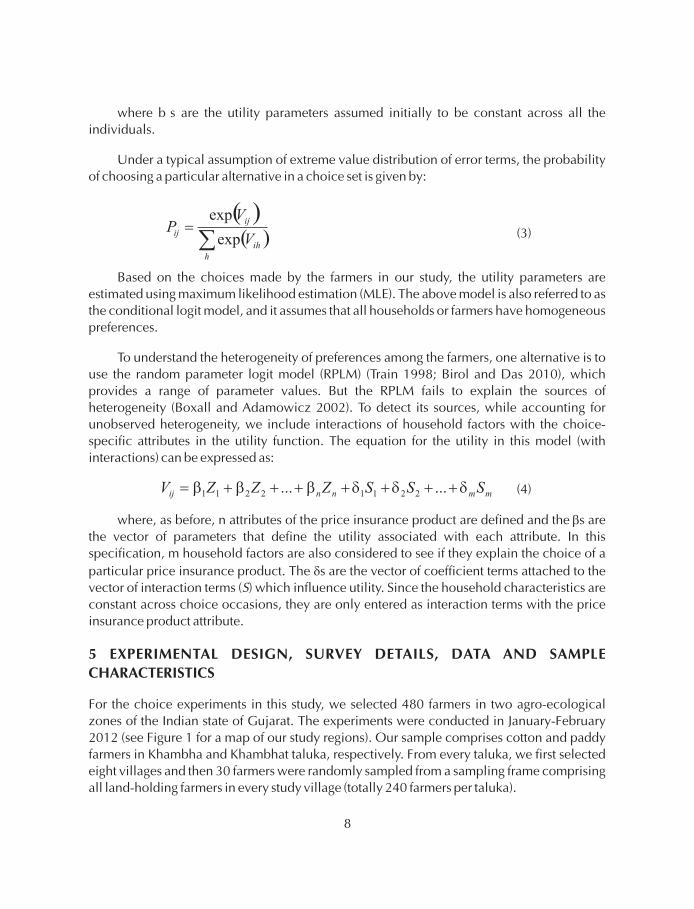
Under a typical assumption of extreme value distribution of error terms, the probabilityof choosing a particular alternative in a choice set is given by:
Based on the choices made by the farmers in our study, the utility parameters areestimated using maximum likelihood estimation (MLE). The above model is also referred to asthe conditional logit model, and it assumes that all households or farmers have homogeneouspreferences.
To understand the heterogeneity of preferences among the farmers, one alternative is touse the random parameter logit model (RPLM) (Train 1998; Birol and Das 2010), whichprovides a range of parameter values. But the RPLM fails to explain the sources ofheterogeneity (Boxall and Adamowicz 2002). To detect its sources, while accounting forunobserved heterogeneity, we include interactions of household factors with the choice-specific attributes in the utility function. The equation for the utility in this model (withinteractions) can be expressed as:
where, as before, n attributes of the price insurance product are defined and the s arethe vector of parameters that define the utility associated with each attribute. In thisspecification, m household factors are also considered to see if they explain the choice of a
particular price insurance product. The s are the vector of coefficient terms attached to thevector of interaction terms ( ) which influence utility. Since the household characteristics areconstant across choice occasions, they are only entered as interaction terms with the priceinsurance product attribute.
For the choice experiments in this study, we selected 480 farmers in two agro-ecologicalzones of the Indian state of Gujarat. The experiments were conducted in January-February2012 (see Figure 1 for a map of our study regions). Our sample comprises cotton and paddyfarmers in Khambha and Khambhat taluka, respectively. From every taluka, we first selectedeight villages and then 30 farmers were randomly sampled from a sampling frame comprisingall land-holding farmers in every study village (totally 240 farmers per taluka).
b
d
S
5 EXPERIMENTAL DESIGN, SURVEY DETAILS, DATA AND SAMPLECHARACTERISTICS
(3)
(4)
( )( )å
=
h
ih
ij
ijV
VP
exp
exp
mmnnij SSSZZZV dddbbb +++++++= ...... 22112211
8

The choice of study region (and the villages) was influenced by our objective to study theWTP for price insurance under different agro-climatic conditions, variable social systems,and cropping patterns. In June 2011, our field partners had marketed rainfall insurance topaddy farmers in Khambhat taluka in Anand district and to cotton farmers in Khambha talukain Amreli district; this was another motivation for our focus on these regions. The harvest andsale of the produce grown in the major cropping season of 2011 was completed by the timeour choice experiments (survey) were conducted. The survey gathered detailed informationon demographics, financial savings, credit, household consumption, income sources, farmcharacteristics, risk attitudes, crop production, informal risk management strategies, andrainfall insurance adoption.
Map of the Indian state of Gujarat indicating our study districtsFigure 1
Source:
Note:
India Meteorology Department (www.imd.gov.in)
The solid dots indicate the approximate location of our study talukas: Khambhat in Anand district andKhambha in Amreli district.
9

5.1 Choice Experiment Data
Table 1
As mentioned earlier, we collected data for WTP for price insurance using choiceexperiments. The design of products offered to the farmers using appropriate attributes andlevels is very critical to get appropriate WTP estimates, as these could be biased by cognitivebiases and heuristics if all appropriate attributes are not considered (see Hensher et al. (2012)and Hensher and Rose (2012) for issues with inappropriate attribute selection). In our study,the definitions of attributes and levels were based on unstructured interviews with farmers inthe region and members of the field organization, who were instrumental in marketingrainfall insurance in our study regions in the previous years. Though the idea of a priceinsurance product is novel, the issues raised by partners regarding index-based rainfallinsurance were considered while developing the attributes needed to define the priceinsurance product. Finally, we came up with five attributes having three levels each to designthe choice sets.
Also, as the survey sample consisted of both paddy and cotton farmers, we had todevelop attributes that involved prices specific to the crops. We also considered bundlingweather insurance as one of the attributes, but an actual weather insurance product wasalready being marketed, and so we thought that this attribute might confuse farmers—is a realproduct being offered, or a hypothetical product is being considered. Therefore, we avoidedbundling weather insurance as one of the attributes. The attributes and levels considered forthe choice experiments design are presented in Table 1.
Attribute and levels for choice experiments
Sr. No Attribute Crop Levels
1 Sum Insured Paddy Rs.1100Rs.1300Rs.1500
Cotton Rs.4000Rs. 4500Rs.5000
2 Premium 6% of sum insured12% of sum insured15% of sum insured
3 Coverage Start Date June 15, 2012July 15, 2012
August 15, 20124 Coverage End Date January 15, 2013
February 15, 2013March 15, 2013
5 Claim Settlement Time 7 days15 days30 days
10
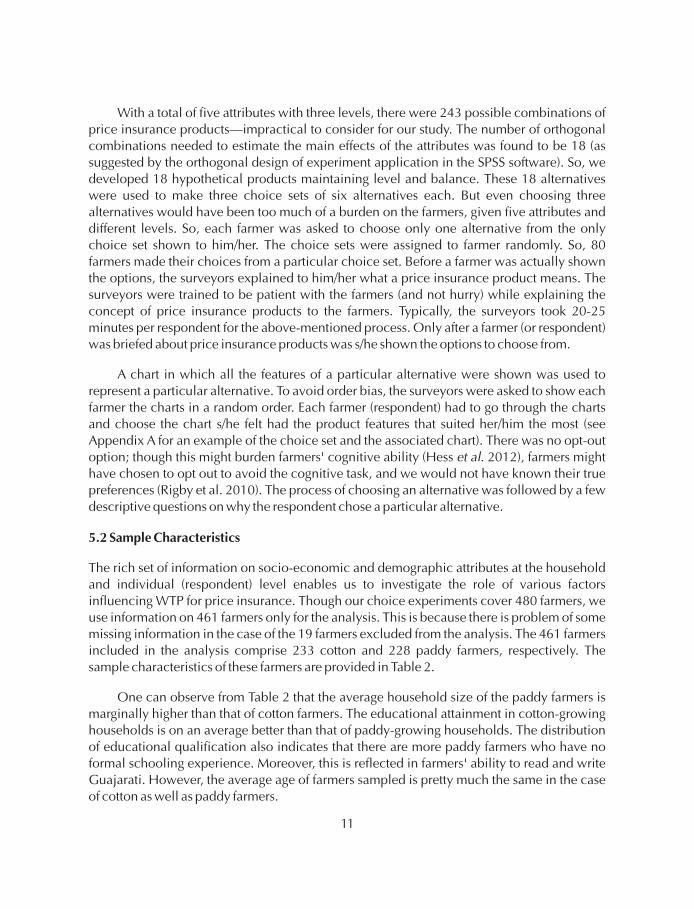
With a total of five attributes with three levels, there were 243 possible combinations ofprice insurance products—impractical to consider for our study. The number of orthogonalcombinations needed to estimate the main effects of the attributes was found to be 18 (assuggested by the orthogonal design of experiment application in the SPSS software). So, wedeveloped 18 hypothetical products maintaining level and balance. These 18 alternativeswere used to make three choice sets of six alternatives each. But even choosing threealternatives would have been too much of a burden on the farmers, given five attributes anddifferent levels. So, each farmer was asked to choose only one alternative from the onlychoice set shown to him/her. The choice sets were assigned to farmer randomly. So, 80farmers made their choices from a particular choice set. Before a farmer was actually shownthe options, the surveyors explained to him/her what a price insurance product means. Thesurveyors were trained to be patient with the farmers (and not hurry) while explaining theconcept of price insurance products to the farmers. Typically, the surveyors took 20-25minutes per respondent for the above-mentioned process. Only after a farmer (or respondent)was briefed about price insurance products was s/he shown the options to choose from.
A chart in which all the features of a particular alternative were shown was used torepresent a particular alternative. To avoid order bias, the surveyors were asked to show eachfarmer the charts in a random order. Each farmer (respondent) had to go through the chartsand choose the chart s/he felt had the product features that suited her/him the most (seeAppendix A for an example of the choice set and the associated chart). There was no opt-outoption; though this might burden farmers' cognitive ability (Hess . 2012), farmers mighthave chosen to opt out to avoid the cognitive task, and we would not have known their truepreferences (Rigby et al. 2010). The process of choosing an alternative was followed by a fewdescriptive questions on why the respondent chose a particular alternative.
The rich set of information on socio-economic and demographic attributes at the householdand individual (respondent) level enables us to investigate the role of various factorsinfluencing WTP for price insurance. Though our choice experiments cover 480 farmers, weuse information on 461 farmers only for the analysis. This is because there is problem of somemissing information in the case of the 19 farmers excluded from the analysis. The 461 farmersincluded in the analysis comprise 233 cotton and 228 paddy farmers, respectively. Thesample characteristics of these farmers are provided in Table 2.
One can observe from Table 2 that the average household size of the paddy farmers ismarginally higher than that of cotton farmers. The educational attainment in cotton-growinghouseholds is on an average better than that of paddy-growing households. The distributionof educational qualification also indicates that there are more paddy farmers who have noformal schooling experience. Moreover, this is reflected in farmers' ability to read and writeGuajarati. However, the average age of farmers sampled is pretty much the same in the caseof cotton as well as paddy farmers.
et al
5.2 Sample Characteristics
11

Table 2
5.3 Farmers' Financial Portfolio
Sample characteristics
A basic look at income, land holdings, and consumption shows some salient differencesbetween cotton-growing households and paddy-growing households; cotton-growinghouseholds earn more annually on average than paddy-growing households despite havingnot only less land but also less land under irrigation. Unsurprisingly, therefore, the averagemonthly per capita consumption expenditure is also less for paddy farmers.
We gathered detailed information on the current financial portfolio of farm households interms of their formal and informal credit and savings values (Table 3).
The savings, credit, and insurance portfolios are also different among paddy and cottonfarmers in the two regions. One very interesting finding is that more paddy farmers thancotton farmers have some savings, but the value of cotton farmers' savings is substantiallyhigher. Also, more paddy farmers than cotton farmers have savings in every form other thanbank savings. But the value of cotton farmers' savings is higher in all forms of savings exceptwith self help groups (SHG)
Household Size 5.86 1.84 6.31 3.15
Household Head's Year of Schooling 7.71 2.87 6.59 3.53
Household Head's Father's Years of Schooling 6.17 4.32 5.61 4.33
Household head's Mother's Years of Schooling 3.13 3.3 2.63 2.76
Respondent's Characteristics
Age 44.78 8.63 45.99 9.61
No Formal Schooling 2 13
Schooling: < =5 Years 22 24
Schooling: >5 and < = 10 Years 68 57
Schooling: > 10 Years 8 6
Able to Read Gujarati 98 87
Able to Write Gujarati 94 84
Household level Factors
Annual Household Income (INR) 228441 112124 180393 116869
Per Capita Consumption Expenditure (INR) 2825 1239 2116 1122
Total Land Holding (Acres) 4.67 3.14 8.5 8.1
Percentage of Irrigated Land 95.65 19.25 93.06 24.69
Authors' computations based upon a primary survey.
Cotton Farmers (N=233) Paddy Farmers (N=228)Mean/ Standard Mean/ Standard
Proportion Deviation Proportion Deviation(%) (%)
Household Characteristics
Source:
12
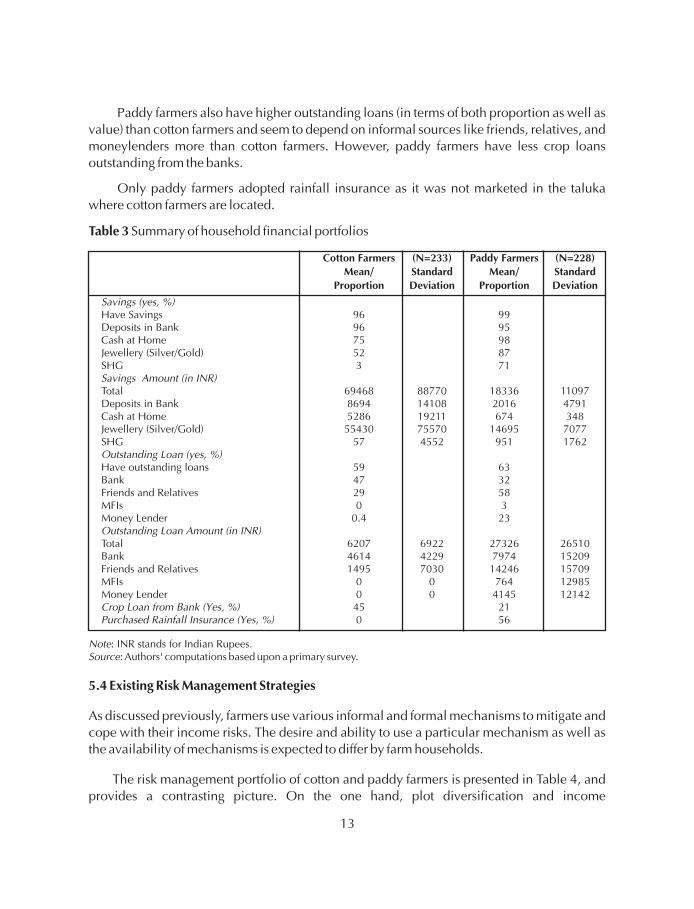
Paddy farmers also have higher outstanding loans (in terms of both proportion as well asvalue) than cotton farmers and seem to depend on informal sources like friends, relatives, andmoneylenders more than cotton farmers. However, paddy farmers have less crop loansoutstanding from the banks.
Only paddy farmers adopted rainfall insurance as it was not marketed in the talukawhere cotton farmers are located.
Summary of household financial portfolios
As discussed previously, farmers use various informal and formal mechanisms to mitigate andcope with their income risks. The desire and ability to use a particular mechanism as well asthe availability of mechanisms is expected to differ by farm households.
The risk management portfolio of cotton and paddy farmers is presented in Table 4, andprovides a contrasting picture. On the one hand, plot diversification and income
Table 3
5.4 Existing Risk Management Strategies
Cotton Farmers (N=233) Paddy Farmers (N=228)Mean/ Standard Mean/ Standard
Proportion Deviation Proportion Deviation
Savings (yes, %)
Savings Amount (in INR)
Outstanding Loan (yes, %)
Outstanding Loan Amount (in INR)
Crop Loan from Bank (Yes, %)Purchased Rainfall Insurance (Yes, %)
NoteSource
Have Savings 96 99Deposits in Bank 96 95Cash at Home 75 98Jewellery (Silver/Gold) 52 87SHG 3 71
Total 69468 88770 18336 11097Deposits in Bank 8694 14108 2016 4791Cash at Home 5286 19211 674 348Jewellery (Silver/Gold) 55430 75570 14695 7077SHG 57 4552 951 1762
Have outstanding loans 59 63Bank 47 32Friends and Relatives 29 58MFIs 0 3Money Lender 0.4 23
Total 6207 6922 27326 26510Bank 4614 4229 7974 15209Friends and Relatives 1495 7030 14246 15709MFIs 0 0 764 12985Money Lender 0 0 4145 12142
45 210 56
: INR stands for Indian Rupees.: Authors' computations based upon a primary survey.
13

diversification is not very different between cotton and paddy farmers, with cotton farmershaving 1.33 plots on average and 61 per cent of their total income from farming, and paddyfarmers having 1.67 plots on average and 65 per cent of their incomes from farming. On theother hand, the general strategies that cotton and paddy farmers prefer to mitigate financialdistress or shocks are quite different.
Many cotton farmers (93 per cent) prefer saving money for bad times, which is not thecase with the paddy farmers (25 per cent). About 34 per cent of cotton farmers prefer plantinga variety of crops, while only 20 per cent of the paddy farmers prefer this measure for riskmanagement. More paddy farmers (83 per cent) are ready to seek off-farm employmentcompared to cotton farmers (31 per cent). The least preferred strategy among both cottonfarmers (4 per cent) as well as paddy farmers (1 per cent) is to sell off the household assets.Also, both cotton (12 per cent) and paddy farmers (27 per cent) are reluctant to reduceinvestment in seeds and fertilisers for managing the risk. This would indicate that farmersunderstand that there are positive returns to investment, and that reducing it for mitigating riskmight just plunge them into further distress. Interestingly, 55 per cent of cotton farmers and 73per cent of paddy farmers are ready to reduce their household consumption in case of shocks.Farmers (69 per cent of cotton farmers and 83 per cent of paddy farmers) prefer borrowingfrom friends and relatives rather than taking non-loan financial assistance from them (13 percent of cotton farmers and 11 per cent of paddy farmers), probably because of the stigmaattached to it and social status. This reflects the tensions in informal risk managementstrategies where apart from financial considerations, the social status and social pressuresalso become relevant (Morduch 1999). For loans, more cotton farmers prefer moneylenders(29 per cent) and banks (55 per cent) than paddy farmers (18 per cent and 15 per cent,respectively).
The information on risk coping strategies used by farmers also provides us someinteresting insights into their social networks and informal risk management mechanisms.Most cotton farmers (94 per cent) use more of the saving to cope with risk while most paddyfarmers work more in the village (90 per cent). This is consistent with the preferences of riskmitigation strategies they had mentioned in their responses. The proportion of paddy farmershaving household members working outside their villages (79 per cent) is substantially higherthan cotton farmers (44 per cent). The proportion of paddy farmers receiving help, gifts, andmoney from informal sources is also more than cotton farmers. However, the proportion ofcotton farmers (26 per cent) receiving credit from formal sources is substantially larger thanthe paddy farmers (7 per cent). In addition, the prevalence of selling assets is also significantlylarger in the case of cotton farmers (28 per cent) than for paddy farmers (4 per cent).
Unfortunately, many paddy farmers (78 per cent) and cotton farmers (73 per cent) reducetheir consumption expenditure to cope with risk. Last but not the least, paddy farmers aremore actively involved in both giving and receiving transfers in kind and cash than cottonfarmers.
14
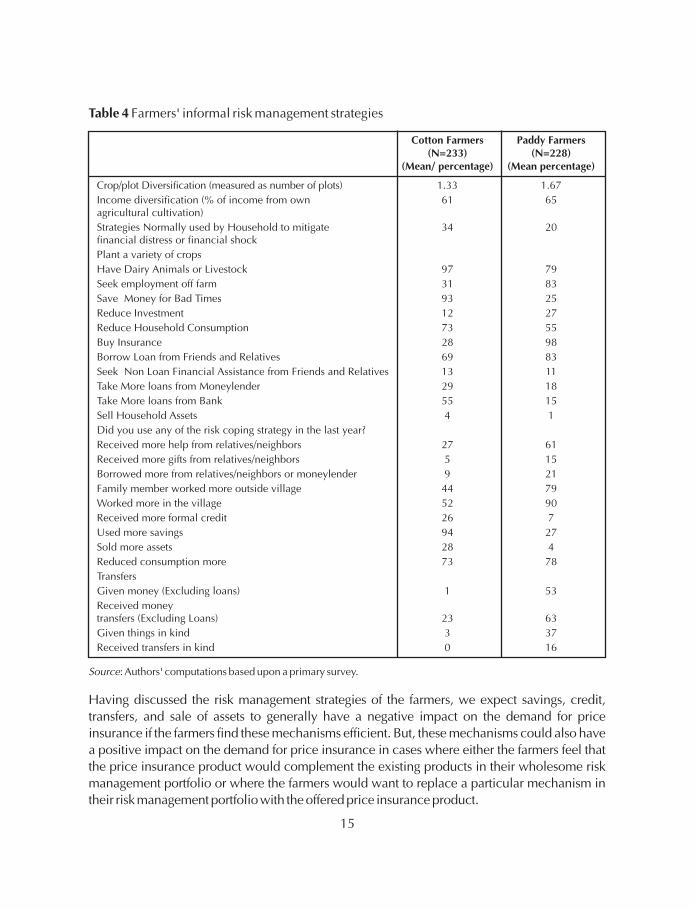
Table 4 Farmers' informal risk management strategies
Having discussed the risk management strategies of the farmers, we expect savings, credit,transfers, and sale of assets to generally have a negative impact on the demand for priceinsurance if the farmers find these mechanisms efficient. But, these mechanisms could also havea positive impact on the demand for price insurance in cases where either the farmers feel thatthe price insurance product would complement the existing products in their wholesome riskmanagement portfolio or where the farmers would want to replace a particular mechanism intheir riskmanagementportfolio with theoffered price insuranceproduct.
Cotton Farmers Paddy Farmers(N=233) (N=228)
(Mean/ percentage) (Mean percentage)
Crop/plot Diversification (measured as number of plots) 1.33 1.67
Income diversification (% of income from own 61 65agricultural cultivation)
Strategies Normally used by Household to mitigate 34 20financial distress or financial shock
Plant a variety of crops
Have Dairy Animals or Livestock 97 79
Seek employment off farm 31 83
Save Money for Bad Times 93 25
Reduce Investment 12 27
Reduce Household Consumption 73 55
Buy Insurance 28 98
Borrow Loan from Friends and Relatives 69 83
Seek Non Loan Financial Assistance from Friends and Relatives 13 11
Take More loans from Moneylender 29 18
Take More loans from Bank 55 15
Sell Household Assets 4 1
Did you use any of the risk coping strategy in the last year?
Received more help from relatives/neighbors 27 61
Received more gifts from relatives/neighbors 5 15
Borrowed more from relatives/neighbors or moneylender 9 21
Family member worked more outside village 44 79
Worked more in the village 52 90
Received more formal credit 26 7
Used more savings 94 27
Sold more assets 28 4
Reduced consumption more 73 78
Transfers
Given money (Excluding loans) 1 53
Received moneytransfers (Excluding Loans) 23 63
Given things in kind 3 37
Received transfers in kind 0 16
: Authors' computations based upon a primary survey.Source
15

6. RESULTS
Since we find that the socio-economic and agricultural characteristics of the cotton andpaddy farmers as well as the features of the hypothetical price insurance products for cottonand paddy differ substantially, we analyse the choice experiments for the cotton and thepaddy farmers separately.
The results of the conditional logit model (of utility derived from the price insurance product)for cotton farmers are provided in Table 5. The overall goodness of fit of the model excludingthe interactions is high (Louviere et al. 2000), and the model is significant at 5 per cent level ofsignificance. The model results indicate that cotton farmers are concerned with only threeproduct attributes: sum insured; premium; and coverage start date. Their choice of product issignificantly affected by neither the coverage end date nor the claim settlement period. Theattribute sum insured has a positive impact on the choice of the product, which meansfarmers prefer 'more sum insured' than 'less sum insured'. They also prefer a product withlesser premium and an earlier coverage start period. The early coverage period is highlysignificant (at 1 per cent level of significance), and it indicates the farmer's willingness to getrid of price uncertainty as early as possible. This finding is in line with the literature on theusage of price risk management products by farmers where various authors have presumedthat if farmers use price risk management instruments, like futures or options, they wouldwant to buy them just before sowing time (McKinnon 1967; Rolfo 1980; Lapan and Moschini1994).
Estimates of the conditional logit model (without interactions) of the utility derivedfrom the price insurance product: cotton farmers
6.1 Conditional Logit Model Results for Cotton Farmers
Table 5
Variable Parameter EstimatesModel (1), Without Interactions
Sum Insured 0.19**(0.08)
Premium -0.15*(0.08)
Coverage Start Date -0.25***(0.08)
Coverage End Date 0.07(0.08)
Claim Settlement Time 0.03(0.08)
Sample Size 233X6=1398Likelihood Ratio 18.67McFadden's LRI 0.0224
: Figures in parenthesis are standard errors; ***p < 0.01, **p < 0.05, *p < 0.10: Authors' computations from a primary survey.
NotesSource
16
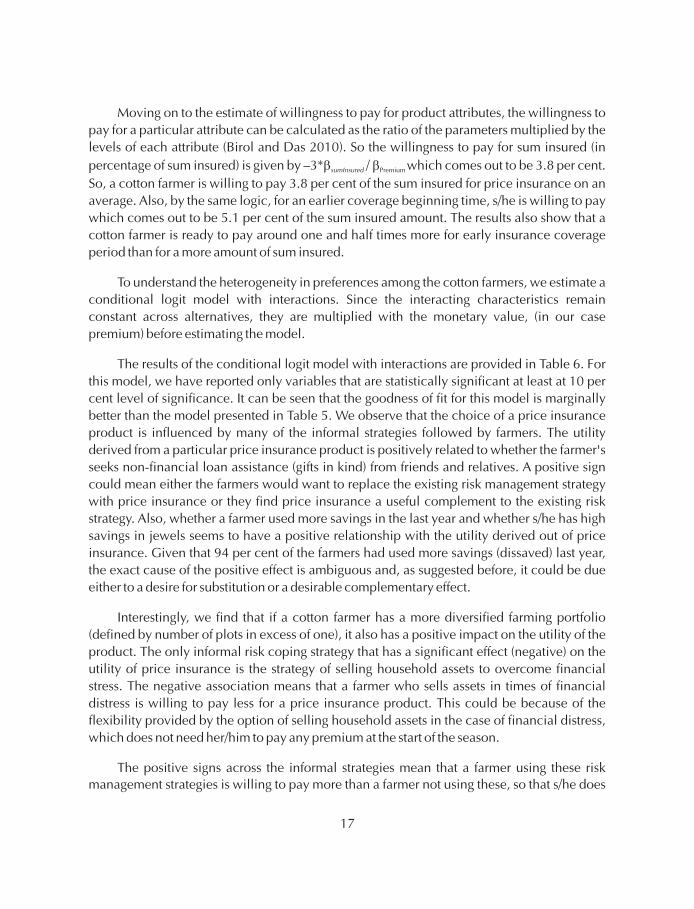
Moving on to the estimate of willingness to pay for product attributes, the willingness to
pay for a particular attribute can be calculated as the ratio of the parameters multiplied by the
levels of each attribute (Birol and Das 2010). So the willingness to pay for sum insured (in
percentage of sum insured) is given by –3* / which comes out to be 3.8 per cent.
So, a cotton farmer is willing to pay 3.8 per cent of the sum insured for price insurance on an
average. Also, by the same logic, for an earlier coverage beginning time, s/he is willing to pay
which comes out to be 5.1 per cent of the sum insured amount. The results also show that a
cotton farmer is ready to pay around one and half times more for early insurance coverage
period than for a more amount of sum insured.
To understand the heterogeneity in preferences among the cotton farmers, we estimate a
conditional logit model with interactions. Since the interacting characteristics remain
constant across alternatives, they are multiplied with the monetary value, (in our case
premium) before estimating the model.
The results of the conditional logit model with interactions are provided in Table 6. For
this model, we have reported only variables that are statistically significant at least at 10 per
cent level of significance. It can be seen that the goodness of fit for this model is marginally
better than the model presented in Table 5. We observe that the choice of a price insurance
product is influenced by many of the informal strategies followed by farmers. The utility
derived from a particular price insurance product is positively related to whether the farmer's
seeks non-financial loan assistance (gifts in kind) from friends and relatives. A positive sign
could mean either the farmers would want to replace the existing risk management strategy
with price insurance or they find price insurance a useful complement to the existing risk
strategy. Also, whether a farmer used more savings in the last year and whether s/he has high
savings in jewels seems to have a positive relationship with the utility derived out of price
insurance. Given that 94 per cent of the farmers had used more savings (dissaved) last year,
the exact cause of the positive effect is ambiguous and, as suggested before, it could be due
either to a desire for substitution or a desirable complementary effect.
Interestingly, we find that if a cotton farmer has a more diversified farming portfolio
(defined by number of plots in excess of one), it also has a positive impact on the utility of the
product. The only informal risk coping strategy that has a significant effect (negative) on the
utility of price insurance is the strategy of selling household assets to overcome financial
stress. The negative association means that a farmer who sells assets in times of financial
distress is willing to pay less for a price insurance product. This could be because of the
flexibility provided by the option of selling household assets in the case of financial distress,
which does not need her/him to pay any premium at the start of the season.
The positive signs across the informal strategies mean that a farmer using these riskmanagement strategies is willing to pay more than a farmer not using these, so that s/he does
b bsumInsured Premium
17

not have to use informal risk mitigation strategies or because using a price insurance productalong with these strategies mitigates risk better.
Estimates of the conditional logit model (with interactions) of the utility derived fromthe price insurance product: cotton farmers
Sum Insured 0.22***
(0.08)
Premium -1.16***
(0.39)
Coverage Start Date -0.27***
(0.08)
Plots >1 0.57***
(0.21)
Seeks Non-Loan FinancialAssistance from Friends and Relatives 0.45*
(0.25)
Sell Household Assets -1.38**
(0.58)
Used more savings last year 0.84**
(0.40)
Has high savings in Jewels(Greater than median of Rs.90000) 0.35*
(0.19)
Sample Size 233X6=1398
Likelihood Ratio 43.79
McFadden's LRI 0.0524
Figures in parenthesis are standard errors; ***p < 0.01, **p < 0.05, *p < 0.10
Authors' computations based on a primary survey.
We estimate similar models for the sub-sample of paddy farmers and the results of thesemodels are reported in Tables 7 (without interactions) and 8 (with interactions), respectively.
The results presented in Table 7 show that the sum insured of the product does not affectthe utility (derived from the product) of the farmer significantly. However, the farmer is moreconcerned with the period of time in which s/he would receive the claim.
Table 6
Variable Parameter Estimate
6.2 Conditional Logit Model for Paddy Farmers
Notes:
Source:
18

If we calculate an approximate WTP for price insurance from this result, we find it to be 1
per cent less than the corresponding figure for the price insurance for cotton. However, paddy
farmers are willing to pay 4.92 per cent more for 15 days lesser claim settlement time.
Estimates of the conditional logit model (without interactions) of the utility derived
from the price insurance product: paddy farmers
Sum Insured 0.12
(0.09)
Premium -0.36***
(0.09)
Coverage Start Date 0.01
(0.08)
Coverage End Date 0.00
(0.09)
Claim Settlement Time -0.59***
(0.09)
Sample Size 228X6=1368
Likelihood Ratio 68.49
McFadden's LRI 0.0838
: Figures in parenthesis are standard errors; ***p < 0.01, **p < 0.05, *p < 0.10
: Authors' computations based on a primary survey.
The estimates of model with interactions (Table 8) reveal that apart from the savings in
jewellery (which is the only common factor and has a significant positive effect on the WTP of
all farmers), factors of the WTP for price insurance for paddy farmers are quite different from
that of cotton farmers. If one of the farmer's used risk strategy is to take more loans from banks,
the farmer is willing to pay more for the insurance product. Also, if s/he has coped with a risk
by borrowing from informal sources in the previous year, s/he is willing to pay more for the
product. Having a bank loan has a negative effect on the paddy farmer's WTP for price
insurance. However, risk aversion has a positive effect on the WTP for price insurance. This
finding is in line with the existing literature (Hill, 2009).
Table 7
Variable Parameter Estimate
Notes
Source
19
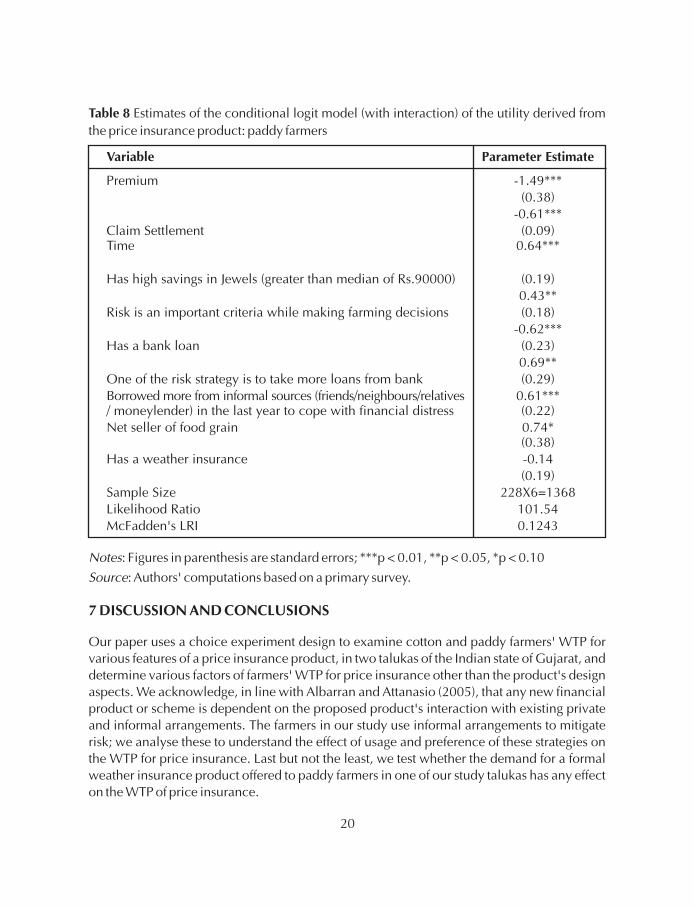
Table 8
Variable Parameter Estimate
Estimates of the conditional logit model (with interaction) of the utility derived from
the price insurance product: paddy farmers
Premium -1.49***(0.38)
-0.61***Claim Settlement (0.09)Time 0.64***
Has high savings in Jewels (greater than median of Rs.90000) (0.19)0.43**
Risk is an important criteria while making farming decisions (0.18)-0.62***
Has a bank loan (0.23)0.69**
One of the risk strategy is to take more loans from bank (0.29)Borrowed more from informal sources (friends/neighbours/relatives 0.61***/ moneylender) in the last year to cope with financial distress (0.22)Net seller of food grain 0.74*
(0.38)Has a weather insurance -0.14
(0.19)Sample Size 228X6=1368Likelihood Ratio 101.54McFadden's LRI 0.1243
: Figures in parenthesis are standard errors; ***p < 0.01, **p < 0.05, *p < 0.10
: Authors' computations based on a primary survey.
Our paper uses a choice experiment design to examine cotton and paddy farmers' WTP forvarious features of a price insurance product, in two talukas of the Indian state of Gujarat, anddetermine various factors of farmers' WTP for price insurance other than the product's designaspects. We acknowledge, in line with Albarran and Attanasio (2005), that any new financialproduct or scheme is dependent on the proposed product's interaction with existing privateand informal arrangements. The farmers in our study use informal arrangements to mitigaterisk; we analyse these to understand the effect of usage and preference of these strategies onthe WTP for price insurance. Last but not the least, we test whether the demand for a formalweather insurance product offered to paddy farmers in one of our study talukas has any effecton the WTP of price insurance.
Notes
Source
7 DISCUSSION AND CONCLUSIONS
20

Our results indicate that cotton farmers' choice depend on the sum insured, premium,and coverage start date of the price insurance product, while paddy farmers are concernedwith the premium and claim settlement time. Cotton farmers are willing to pay up to 3 percent of the sum insured for price insurance, while paddy farmers are indifferent to the suminsured. This difference could be due to the way farmers cope with price risk and theeffectiveness of competing informal risk management mechanisms. These interactions wereanalysed, and the usage/preference of various strategies was found to have a significantassociation with paddy and cotton farmers' demand for price insurance. For example, cottonfarmers' WTP depended largely on informal risk management strategies related to savings,while paddy farmers' WTP depended largely on informal risk management strategies relatedto credit/borrowings; most of these strategies seemed to have a positive impact on the WTPfor price insurance. This means that the features of these informal strategies could be bundledat different levels to meet farmers' risk management needs.
Three important implications follow from our research.
First, though the amount and cost of insurance is an important aspect for farmers, otherdesign aspects, like coverage start date and claim settlement time, also play an important rolein determining farmers' acceptance of a new product.
Second, informal risk management strategies are important to every farmer; tradeoffsexist between formal and informal risk management mechanisms, and understanding thesetradeoffs is vital.
Third, a formal risk management product should not aim to 'crowd out' existing formalor informal risk management strategies but instead understand and incorporate linkages sothat farmers may manage risk better.
In the post-World Trade Organization era, when international price fluctuations exposedeveloping world-farmers to considerable price risks, this study is especially relevant. Sincefutures markets either do not exist in the developing world or are underdeveloped, and formalmarkets to manage risk are nascent, farmers' ability to hedge price risks is limited. Byrecognising the positive demand for price insurance and the attributes that farmers prefer, ourfindings open up avenues for research on price insurance to protect the incomes of farmers indeveloping countries.
21
REFERENCES
Alderman, H. and C.H. Paxson. 1992. 'No. WPS 1008, World Bank.
Albarran, P. and O.P. Attanasio. 2005. 'Do public transfers crowd out private transfers?Evidence from a randomized experiment in Mexico.' 281–305. In
, edited by S. Dercon. New York: Oxford University Press.
Alpizar, F., F. Carlsson and P. Martinsson. 2003. 'Using Choice Experiments for Non-marketValuation.' 8 (1): 83–110.
Barnett, B.J., C.B. Barrett and J.R. Skees. 2008. 'Poverty Traps and Index-based Risk TransferProducts.' 36 (10): 1766–85.
Barrett, C.B. 1996. 'On Price Risk and the Inverse Farm Size-Productivity Relationship.'51 (2): 193–215.
Barrett, C. B., B.J. Barnett, M.R. Carter, S. Chantarat, J.W. Hansen, A.G. Mude, D. Osgood, J.R.Skees, C.G. Turvey and M.N. Ward. 2007. 'Poverty Traps and Climate Risk: Limitationsand Opportunities of Index-based Risk Financing.'
Basu, K. 2010. . New Delhi: Ministry ofFinance, Government of India.
Bellemare, M.F., C.B. Barrett and D.R. Just. 2011. 'The Welfare Impacts of Commodity PriceV o l a t i l i t y : E v i d e n c e f r o m R u r a l E t h i o p i a . ' A v a i l a b l e a thttps://economics.adelaide.edu.au/research/seminars/20130405-bellemare-barrett.pdf.
Berg, E. and B. Schmitz. 2008. 'Weather-based Instruments in the context of Whole-farm RiskManagement.' 68 (1): 119–33.
Bienabe, E. and R.R. Hearne. 2006. 'Public Preferences for Biodiversity Conservation andScenic Beauty within a Framework of Environmental Services Payments.'
9 (4): 335–48.
Birol, E. and S. Das. 2010. 'Estimating the Value of Improved Wastewater Treatment: The Caseof River Ganga, India.' 91 (11): 2163–71.
Birol, E., E.R. Villalba and M. Smale. 2009. 'Farmer Preferences for Milpa Diversity andGenetically Modified Maize in Mexico: A Latent Class Approach.'
14 (4): 521–40.
Do the poor insure? A synthesis of the literature on riskand consumption in developing countries.' Working Paper
Insurance againstPoverty
Economic Issues-Stoke on Trent
World Development
Journal of Development Economics
Technical Report, ColumbiaUniversity.
The Economics of Food Grain Management in India
Agricultural Finance Review
Forest Policyand Economics
Journal of Environmental Management
Environment andDevelopment Economics
22

Boxall, P.C. and W.L. Adamowicz. 2002. 'Understanding Heterogeneous Preferences inRandom Utility Models: A Latent Class Approach.'
23 (4): 421–46.
Bush, G., S. Colombo and N. Hanley. 2009. 'Should all choices count? Using the cut-offsapproach to edit responses in a choice experiment.'
44 (3): 397–414.
Carson, R.T., J.J. Louviere, D.A. Anderson, P. Arabie, D.S. Bunch, D.A. Hensher, R.M.Johnson, W.F. Kuhfeld, D. Steinberg, J. Swait, H. Timmermans and J.B. Wiley. 1994.
5 (4): 351–67.
Chiang, J.T., C.Y. Lin, T.T. Fu and C.H. Chen. 2012. 'Using Stated Preference and PriorPurchase Intention in the Estimation of willingness to Pay a Premium for GeneticallyModified Foods.' 28 (1): 103–17.
Cole, S., X. Gine, J. Tobacman, R. Townsend, P. Topalova and J. Vickery. 2012. 'Working Paper, Harvard Business
School.
De Bekker-Grob, E.W., M. Ryan and K. Gerard. 2012. 'Discrete Choice Experiments in HealthEconomics: AReview of the Literature.' Health Economics 21 (2): 145–72.
De Groote, H. and S.C. Kimenju. 2008. 'Comparing Consumer Preferences for Color andNutritional Quality in Maize: Application of a Semi-double-bound Logistic Model onUrban Consumers in Kenya.' 33 (4): 362–70.
Dehn, J. 2000. 'The Effects on Growth of Commodity Price Uncertainty and Shocks.'
Dercon, S. 1996. 'Risk, Crop Choice, and Savings: Evidence from Tanzania.'44 (3): 485–513.
Finkelshtain, I. and J.A. Chalfant. 1991. 'Marketed Surplus under Risk: Do peasants agreewith Sandmo?' 73 (3): 557–67.
Gautam, M., P. Hazell and H. Alderman. 1994. 'Management of Drought Risks in RuralAreas.' Working Paper, The World Bank.
Government of India. 2006. . Report submitted by a WorkingGroup for XI five year plan (2007 – 2012).
Government of India. 2008.. Report submitted by an Expert Committee to Ministry of Consumer Affairs, Food
& Public Distribution.
Environmental and ResourceEconomics
Environmental and ResourceEconomics
Experimental Analysis of Choice. Marketing Letters
Agribusiness
Barriers toHousehold Risk Management: Evidence from India.'
Food Policy
Working Paper, The World Bank.
EconomicDevelopment and Cultural Change
American Journal of Agricultural Economics
Risk Management in Agriculture
The Impact of Futures Trading on Agricultural CommodityPrices
23

Hardaker, J.B., R.B.M. Huirne, J.R. Anderson and G. Lien. 2004.
. Oxford: CABI Publishing.
Harwood, J., R. Heifner, K. Coble, J. Perry and A. Somwaru. 1999.
Agricultural Economic Report, U.S. Department of
Agriculture.
Hazell, P.B.R., C. Pomareda and A. Valdes. 1986.
. Baltimore: The Johns Hopkins University Press.
Hensher, D.A. and J.M. Rose. 2012. 'The Influence of Alternative Acceptability, Attribute
Thresholds and Choice Response Certainty on Automobile Purchase Preferences.'
46 (3): 451–68.
Hensher, D.A., J.M. Rose and W.H. Greene. 2012. 'Inferring Attribute Non-attendance from
Stated Choice Data: Implications for willingness to Pay Estimates and a Warning for
Stated Choice Experiment Design. 39 (2): 235–45.
Hess H., D.A. Hensher and A. Daly. 2012. 'Not bored yet – Revisiting Respondent Fatigue in
Stated Choice Experiments'. 46 (3):
626–44.
Hill, R.V. 2006. 'Coffee Price Risk in the Market: Exporter, Trader and Producer.' Working
Paper, Global Poverty Research Group.
Hill, R.V.. 2009. 'Using Stated Preferences and Beliefs to identify the Impact of Risk on Poor
Households.' 45 (2): 151–71.
Hill, R.V.. 2010. 'Liberalisation and Producer Price Risk: Examining Subjective Expectations
in the Ugandan Coffee Market.' 19 (4): 433–58.
Hope, R.A. 2006. 'Evaluating Water Policy Scenarios against the Priorities of the Rural Poor.'
34 (1): 167–79.
Hu, W., A. Hünnemeyer, M. Veeman, W. Adamowicz and L. Srivastava. 2004. 'Trading off
Health, Environmental and Genetic Modification Attributes in Food.'
31: 389–408.
Kouame, E.B.H. and A.N. Komenan. 2012. 'Risk Preferences and Demand for Insurance
Under Price Uncertainty: An Experimental Approach for Cocoa Farmers in Cote
D'Ivoire.' Research Paper No.13, Micro Insurance Innovation Facility, International
Labor Organization.
Coping with Risk in
Agriculture
Managing Risk in Farming:
Concepts, Research, and Analysis.
Crop Insurance for Agricultural
Development: Issues and Experience
Journal of Transport Economics and Policy
Transportation
Transportation Research Part A: Policy and Practice
The Journal of Development Studies
Journal of African Economies
World Development
European Review
of Agricultural Economics
24

Kurosaki, T. 1998. ' .' OccasionalPaper Series, Institute of Developing Economies.
Lancaster, K.J. 1966. 'A New Approach to Consumer Theory.'74 (2): 132–57.
Lancaster, K.J.. 1971. New York: Columbia UniversityPress.
Lapan, H. and G. Moschini. 1994. 'Futures Hedging under Price, Basis, and Production Risk.'76 (3): 465–77.
Louviere, J.J., D.A. Hensher and J.D. Swait. 2000.Cambridge: Cambridge University Press.
Luce, R.D. 1959. . New York: John Wiley Publications.
Mahul, O. and B.D. Wright. 2003. 'Designing Optimal Crop Revenue Insurance.'85 (3): 580–89.
Manuamorn, O.P. 2007. 'Scaling up Microinsurance: The Case of Weather Insurance forSmallholders in India.' Agriculture
McFadden, D. 1974. 'Conditional Logit Analysis of Qualitative Choice Behavior.' Inedited by P. Zarembka 105-42. New York: Academic Press.
McFadden, D.L., A.C. Bemmaor, F.G. Caro, J. Dominitz, B. Jun, A. Lewbel, R.L. Matzkin, F.Molinari, N. Schwarz, R.J. Willis and J.K. Winter. 2005. 'Statistical Analysis of ChoiceExperiments and Surveys.' 16 (3–4): 183–96.
McKinnon, R.I. 1967. 'Futures Markets, Buffer Stocks, and Income Stability for PrimaryProducers.' 75(6): 844-61.
Meenakshi, J.V., A. Banerji, V. Manyong, K. Tomlins, N. Mittal and P. Hamukwala. 2012.'Using a Discrete Choice Experiment to elicit the Demand for a Nutritious Food:Willingness-to-pay for Orange Maize in Rural Zambia.' 31(1): 62–71.
Mishra, P.K. 1995. 'Is rainfall insurance a new idea? Pioneering work revisited.'30 (25): A84–88.
Morduch, J. 1999. 'The Microfinance Promise.' 37(4): 1569-614.
Risk and Household Behavior in Pakistan's Agriculture
The Journal of PoliticalEconomy
Consumer Demand: A New Approach.
American Journal of Agricultural Economics
Stated Choice Methods: Analysis andApplications.
Individual Choice Behavior
AmericanJournal of Agricultural Economics
and Rural Development Discussion Paper, TheWorld Bank.
Frontiersin Econometrics,
Marketing Letters
Journal of Political Economy
Journal of Health Economics
Economicand Political Weekly
Journal of Economic Literature
25

The Theory of Commodity Price Stabilization: A
Study in the Economics of Risk
Agricultural Economics
Food Policy
Risk Management tate of
the Indian Farmer: A Millennium Study
European Review of Agricultural Economics
Journal of Political Economy
The Economic Journal
Journal of Political Economy
Journal of Peasant Studies
The
American Economic Review
Newbery, D.M.G. and J.E. Stiglitz. 1981.
. Oxford: Clarendon Press.
Pannell, D.J., G. Hailu, A. Weersink and A. Burt. 2008. 'More reasons why farmers have so
little interest in futures markets.' 39 (1):41–50.
Poulton, C., J. Kydd, S. Wiggins and A. Dorward. 2006. 'State Intervention for Food Price
Stabilisation in Africa: Can it work?' 31 (4): 342–56.
Ramaswami, B., S. Ravi and S.D. Chopra. 2004. ' 22.' pp 1-158In S
. Department of Agriculture and Cooperation,
Ministry of Agriculture, India, New Delhi. Published by Academic Foundation.
Rigby, D., F. Alcon and M. Burton. 2010. 'Supply Uncertainty and the Economic Value of
Irrigation Water.' 37 (1): 97–117.
Rolfo, J. 1980. 'Optimal Hedging under Price and Quantity Uncertainty: The Case of a Cocoa
Producer.' 88(1): 100-16.
Rosenzweig, M.R. and H.P. Binswanger. 1993. 'Wealth, Weather Risk and the Composition
and Profitability of Agricultural Investments.' 103 (416): 56–78.
Rosenzweig, M.R. and K.I. Wolpin. 1993. 'Credit Market Constraints, Consumption
Smoothing, and the Accumulation of Durable Production Assets in Low-income
Countries: Investments in Bullocks in India.' 101 (2):
223–44.
Sahu, G. B., S. Madheswaran and D. Rajasekhar. 2004. 'Credit Constraints and Distress Sales
in Rural India: Evidence from Kalahandi District, Orissa.' 31
(2): 210–41.
Sandmo, A. 1971. 'On the Theory of the Competitive Firm under Price Uncertainty.'
61 (1): 65–73.
Sarris, A. 2002. 'The Demand for Commodity Insurance by Developing Country Agricultural
Producers: Theory and an Application to Cocoa in Ghana.' Working Paper, The World
Bank.
Sarris, A., P. Karfakis and L. Christiaensen. 2006. 'Producer Demand and Welfare Benefits of
Minimum Price Insurance for Export Crops in Tanzania.' Paper presented at the CSAE
Conference 2006: Reducing Poverty and Inequality: How can Africa be included? held
on 19-21 March 2006, at St Catherine's College, Oxford England
26
Scarpa, R., A.G. Drucker, S. Anderson, N. Ferraes-Ehuan, V. Gomez, C.R. Risopatron and O.Rubio-Leonel. 2003. 'Valuing Genetic Resources in Peasant Economies: The Case ofHairless Creole Pigs in Yucatan.' 45 (3): 427–43.
Scarpa, R., E.S.K. Ruto, P. Kristjanson, M. Radeny, A.G. Drucker and J.E.O. Rege. 2003.'Valuing Indigenous Cattle Breeds in Kenya: An Empirical Comparison of Stated andRevealed Preference Value Estimates.' 45 (3): 409–26.
Simmons, P. 2002. 'Why do farmers have so little interest in futures markets?'27 (1): 1–6.
Skees, J.R. 2002. '
Townsend, R.M. 1994. 'Risk and Insurance in Village India.' 62 (3): 539–91.
Townsend, R.M. 1995. 'Consumption Insurance: An Evaluation of Risk-bearing Systems inLow-income Economies.' 9 (3): 83–102.
Train, K.E. 1998. 'Recreation Demand Models with Taste Differences over People.'230–39.
Walker, T.S. and J.G. Ryan. 1990.Baltimore: The Johns Hopkins University Press.
Ecological Economics
Ecological Economics
AgriculturalEconomics
Can financial markets be tapped to help poor people cope with weatherrisks?' Working Paper, UNU/WIDER.
Econometrica
The Journal of Economic Perspectives
LandEconomics 74 (2):
Village and Household Economics in India's Semi-aridTropics.
27

APPENDIX A
We want to understand your demand for a price insurance product. We would offer you six
different price insurance products, which will have different features. You have to choose the
one you would buy if given a choice.
Before we provide you with the choices, I would like to describe to you the basics of a
price insurance product. It offers you insurance for your agricultural produce against a low
price. You would insure with us the sale of your produce for a particular predefined price at a
particular predefined time. On buying the insurance, you have an option to sell the crop
produce to us for the insured price at the predefined time. If you feel that the market price is
higher, you could sell in the market on or before the time or, if you feel the market prices will
rise high at a later stage, you may not sell the crop produce to us at that predefined time. We
will define a few terms for clarity.
This is the price in rupees per quintal that you are insured for. For example,
if you buy an insurance product, and the sum insured is Rs 5,000, it means you have an option
to sell your produce at Rs 5,000 per quintal.
This is the premium for one unit of insurance you buy. For example, if the
premium of a product is Rs 300, it means you have to pay us Rs 300 to buy insurance for a
quintal of the crop.
Your coverage will start on, and your insurance will be effective
from, this date.
If you would want to sell the produce to us at the sum insured, you
will have to sell on this mentioned date.
this is the number of days we will take to pay you the money for
your produce.
We will now show you six products with different features. Please indicate which one of these
products you would buy and also indicate how many units you would want to buy of that
particular product. Please take your time in evaluating the products before you make the
decision. Interviewer checkpoint: please make sure the respondent chooses only one of the
options. He should also indicate the number of units only for that option.
An example choice set shown to the farmer
Interviewer Readout:
Sum insured:
Premium:
Coverage start date:
Coverage end date:
Claim settlement period:
28

1. BUY /
NOT BUY
2. IF
BUYING
INDICATE
NUMBER
OF UNITS
Contents of the chart describing one of the hypothetical products
Set I - Product 1
Claim 5000
Premium 600
Coverage Start Date 15 July, 2012
Coverage End Date 15 February, 2013
Claim Settlement Time 7 Days
29

Does Exchange Rate Intervention
Trigger Volatility?
A Vadivel
Nimai Das
M Ramachandran
E/328/2013
E/329/2013Subnational-level Fiscal Health:
Nira Ramachandran E/330/2013Are Women’s Issues Synonymous withGender in India? Looking AcrossGeographic Space
Bimal Kishore Sahoo E/331/2013Total Factor Productivity of theSoftware Industry in India
Stability and sustainability implicationsfor Kerala, Punjab, and West Bengal
Sabyasachi KarLant PritchettSelim RaihanKunal Sen
E/332/2013Looking for a Break: Identifyingtransitions in growth regimes
E/333/2013Determinants of India's ServicesExports
Pradeep AgrawalSeema Sangita
E/334/2013India and Central Asia: Trade Routesand Trade Potential
Bishwanath GoldarBasanta K PradhanAkhilesh K Sharma
E/335/2014Elasticity of Substitution betweenCapital and Labour in Major Sectorsof the Indian Economy
E/336/2014Changing Livelihoods in Delhi'sPeriphery, circa 1930–2012
Devesh Vijay
E/337/2014Socioeconomic BackwardnessIncreases Vulnerability to ClimateChange: Evidence from Uttar Pradesh
Amarnath Tripathi
RECENT WORKING PAPERS
Title Name of Author(s) Paper No.
Heat Waves Decrease Labour Supply:
Evidence on low-income urban
workers in weather-exposed occupations
E/339/2014
E/338/2014Saudamini Das
Pravakar SahooRanjan Kumar DashPrabhu Prasad Mishra
The Reserve Bank of India's Reaction
to Exchange Rate Variation: A time-
varying parametric approach
A Vadivel
M Ramachandran

lR;eso ijeks /eZ%
Institute of Economic Growth
University Enclave, University of Delhi
Delhi 110007, India
Tel: 27667101/288/424; Fax : 27667410
Website : www.iegindia.org