Virtual Rounds: Simulation-based education in procedural medicine
DP2012-14
Demand for Nutrients in India An Analysis Based on the 50th 61st and
66th Rounds of the NSS
Raghav GAIHA Nidhi KAICKER Katsushi S IMAI Ganesh THAPA
June 6 2012
The Discussion Papers are a series of research papers in their draft form circulated to encourage discussion and comment Citation and use of such a paper should take account of its provisional character In some cases a written consent of the author may be required
1
Edited on 6th
June 2012
Demand for Nutrients in India An Analysis Based on the 50th
61st and 66
th
Rounds of the NSS
Raghav Gaiha
Formerly Faculty of Management Studies University of Delhi
Nidhi Kaicker
School of Business Public Policy and Social Entrepreneurship Ambedkar University Delhi
Katsushi S Imai
School of Social Sciences the University of Manchester amp RIEB Kobe University
Ganesh Thapa
International Fund for Agricultural Development Rome
Abstract
In response to the Deaton and Dreze (2009) explanation of a downward shift in the calorie Engel
curve in terms of lower requirements due to health improvements and lower activity levels in
India we develop an alternative explanation embedded in a standard demand theory framework
with food price and expenditure effects and shifting food and expenditure elasticities The
analysis is carried out with unit record data for three NSS rounds over the period 1993-2009 50th
61st and 66
th There are shifts in demands due to factors other than lower requirements While an
earlier analysis with the 50th
and 61st rounds of the NSS over the period 1993-2004 (Gaiha et
al2012) corroborated in part the Deaton-Dreze conjecture of lower requirements the extended
analysis for 1993-2009 reported here undermines this conjecture as time effects weaken over the
more recent period (2004-2009) But there is also weakening of food price and expenditure
elasticities over this period Closer scrutiny of food preferences and taste for variety is necessary
to understand better nutritional deprivation as also to design more effective policies to ameliorate
it
Key words calories protein fat food prices expenditure India
JEL codes C21 D12 I31 I32
Corresponding Author
Katsushi Imai (Dr)
Economics School of Social Sciences University of Manchester Arthur Lewis Building
Oxford Road Manchester M13 9PL UK Phone +44-(0)161-275-4827 Fax +44-(0)161-275-4928
E-mail KatsushiImaimanchesteracuk
2
Demand for Nutrients in India An Analysis Based on the 50th
61st and 66
th
Rounds of the NSS1
Introduction
Various studies point to a puzzle In India despite rising incomes there has been a sustained
decline in per capita calorie intake In an important contribution Deaton and Dreze (2009)
offer a detailed analysis of the decline in calorie intake over the period 1983 to 2004 Their
principal findings are summarised below
Average calorie consumption was about 10 per cent lower in rural areas in 2004ndash05 than in
1983 The proportionate decline was larger among the more affluent sections of the
population and about 0 for the bottom quartile of the per capita expenditure scale In urban
areas there was a slight change in average calorie intake over this period
The decline of per capita consumption is not confined to calories It also applies to proteins
and other nutrients with the exception of fats whose consumption has increased in both rural
and urban areas over this period
As incomes rose over this period these declines are puzzling A more contentious view
offered by Deaton and Dreze (2009) is that the latter are not attributable to changes in relative
prices as an aggregate measure of the price of food mdash treated synonymous with the price of
calories mdash changed little during the period in question So the puzzle is essentially this per
capita calorie consumption is lower at a given level of per capita household expenditure
across the expenditure scale at low levels of per capita expenditure as well as high In other
words there is a steady downward shift of the calorie Engel curve
Deaton and Dreze (2009) hereafter DD are emphatic that the downward shift of the calorie
Engel curve is due to lower calorie requirements associated mainly with better health and
lower activity levels As the evidence offered is fragmentary and patchy this explanation is
largely conjectural
The present study builds on an earlier critique of DD by developing a demand theory based
explanation of calories and proteins but over a longer period 1993-20092 The most recent
1 We are grateful to T Elhaut for guidance in the initial stage Anil Deolalikar and Raghbendra Jha for valuable
advice and Raj Bhatia for competent data analysis Although this study was funded by the Asia and Pacific
Division of IFAD the views expressed are personal 2 For details see Gaiha et al (2012)
3
round (66th round corresponding to the year 2009-10) of the National Sample Survey (NSS)
provides new insights on the consumption and expenditure behaviour of households This
round throws new light on the trends in nutrient intake in the past two decades The analysis
is based mostly on unit record data collected for the 50th 61
st and 66
th rounds of the NSS
(corresponding to 1993ndash94 2004ndash05 and 2009-10 respectively)
11 Nutrient Intakes
Calories
In rural areas the mean calorie intake reduced from 2156 in 1993 to 2047 in 2004 a decline
of about 5 per cent The reduction in calorie intake was slower between 2004 and 2009 ndash only
1 per cent In urban areas the mean calorie intake reduced from 2074 in 1993 to 2021 in 2004
and 1982 in 2009 ie a 3 per cent decline in the first period and a 2 per cent decline in the
second
Until recently a calorie intake of 2400 per day was considered adequate for a typical adult
engaged in physically strenuous work of a certain duration in rural India More recent
Fig 1 Calorie Distribution in Rural India
Fig 2 Calorie Distribution in Urban India
31 37 35
40
43 46
19 15 15
9 5 4
0
20
40
60
80
100
1993-94 2004-05 2009-10
Pro
po
rtio
n o
f P
op
ula
tio
n (
)
Calorie Intake Distribution Rural India
lt1800 1801ndash2400 2401ndash3000 gt3000 calories
28 29 30
30 35 35
26 25 24
16 11 10
0
20
40
60
80
100
1993-94 2004-05 2009-10
Pro
po
rtio
n o
f P
op
ula
tio
n (
)
Calorie Intake Distribution Urban India
lt1700 1701ndash2100 2101ndash2600 gt2600 calories
4
assessments have used lower calorie lsquorequirementsrsquo (1800 calories)3 Figures 1 amp 2 show the
distribution of calories in rural and urban India between 1993 and 2009 Detailed tables
containing the mean calorie intakes are given in the annexure
Using the higher calorie requirement of 2400 over 71 of the rural households were calorie
deprived or more generally undernourished in 19934 With the lower norm of 1800 this
proportion falls sharply to about 31 implying a large concentration of households in the
calorie intake range of 1800ndash2400 The proportion of undernourished rises from 71 to
nearly 80 in 2004 and 2009 The proportion below the lower cut-off rose from about 31
in 1993 to close to 37 in 2004 indicating high levels of calorie deprivation It declined only
marginally between 2004 and 2009 The mean calorie intake reduced from 2156 in 1993 to
2047 in 2004 to 2020 in 2009
In urban India assuming lower calorie norms of 1700 and 2100 (given less strenuous
physical activity in urban areas) about 28 consumed less than 1700 calories in 1993
About 58 were below the higher calorie norm of 2100 Worse this proportion rose to about
64 in 2004 The proportion of people below the lower cut-off changed only slightly The
proportion of people below the lower and the higher calorie norm changed only slightly
between 2004 and 2009 While the mean calorie intake (overall) decreased between 2004 and
2009 it increased for those below the lower calorie norm Although less alarming than the
calorie deprivation increase in rural India it is nevertheless worrying
DD drew attention to the downward shift in the calorie Engel curve over the period 1983ndash
2004 We find that for the period 1993-2009 the calorie Engel curves for rural India display a
downward shift-especially above extremely low levels of monthly per capita expenditure
(MPCE) at 2004 prices (Figures 3 and 4) The proportionate reduction in calorie intake is
much higher at higher MPCE The calorie Engel curve in urban India for 2004 lies above
1993 at lower levels of MPCE At MPCE gtRs 500 calorie intake was higher in 1993 than in
2004 The proportionate reduction in calorie intake at higher MPCE was larger Similarly the
calorie Engel curve for 2009 lies above that for 2004 at lower levels and the crossover occurs
3 Srinivasan (1992 ) is deeply sceptical of such requirements on the ground that energy expenditure adjusts to
intake within a range 4 Although calorie deprivation is an aspect of undernutrition we sometimes use them interchangeably for
expositional convenience
5
at MPCE of Rs 500 Thus there is evidence of a downward shift of the calorie Engel curve
in both rural and urban India especially at higher levels of MPCE
Fig 3 Calorie Engel Curve for Rural India
Fig 4 Calorie Engel Curve for Urban India
Protein
The mean protein intakes reduced from 603 gms in 1993 to 558 gms in 2004 ie by 7 per
cent The reduction was slower in the second period ndash by 3 per cent with mean intake of 541
gms in 2009 In urban areas the mean protein intake reduced from 573 gms in 1993 to 554
gms in 2004 and 534 gms in 2009 ie a reduction of about 3-4 per cent in both periods
To assess the proportion of people who are protein-deprived a cut-off of 60 (gms) of protein
Fig 5 Protein Intake Distribution in Rural India
Fig 6 Protein Intake Distribution in Urban India
24 29 29
34
38 41
23
21 21
20 12 9
0
10
20
30
40
50
60
70
80
90
100
1993-94 2004-05 2009-10
Pro
po
rtio
n o
f P
op
ula
tio
n (
)
Protein Intake Distribution Rural India
lt45 46ndash60 61ndash75 gt75 gms
25 29 29
38 35
44
23 25 20
14 11 7
0
10
20
30
40
50
60
70
80
90
100
1993-94 2004-05 2009-10
Pro
po
rtio
n o
f P
op
ula
tio
n (
)
Protein Intake Distribution Urban India
lt45 46ndash60 61ndash75 gt75 gms
6
intake is used5 Figures 5 and 6 show the distribution of protein in rural and urban India
between 1993 and 2010 Detailed tables containing the mean protein intakes are given in the
annexure
While protein deficiency is in large measure linked to calorie deficiency we note that well
over 57 of rural households consumed fewer than the required protein intake in 1993 Just
under a quarter of the households consumed lt45 (gms) of protein Within both ranges of
protein intake the proportions rose more than moderately (eg in the lower range the
proportion of households rose from about 24 in 1993 to about 29 in 2004 in the higher
range the proportion rose from 57 in 1993 to 66 in 2004 to 70 in 2009) Although the
mean intake of protein for households in the lower range remained unchanged it reduced
from 60 gms in 1993 to 56 gms in 2004 and 54 gms in 2009
The share of protein-deficient households in urban India (considering the 60 gm cut-off)
remained unchanged between 1993 and 2004 but increased substantially between 2004 and
2009 Overall mean protein intakes however reduced
Figures 7 and 8 report protein Engel curves for rural and urban India between 1993ndash2009
The ruralndashurban contrast in protein intake is striking In the rural areas protein intake was
consistently lower across expenditure classes in 2009 than in 2004 which in turn was lower
than in 1993 The gap between 1993 and 2004 intakes widens considerably at higher MPCE
Fig 7 Protein Engel Curves for Rural India
Fig 8 Protein Engel Curves for Urban India
5 For details see Gopalan et al (1971 1992) and ICMR (1990)
7
In urban areas the 2004 curve was above the 1993 curve at low levels of MPCE and after the
cross-over expenditure of about Rs 500 the former lay below the 1993 curve The 2009 curve
lies above the 2004 curve at lower levels of MPCE and below the 2004 curve at higher levels
Fats
Mean fat intake increased substantially between 1993-94 and 2004-05 In rural areas the
mean fat intake increased by 12 per cent from 315 gms in 1993 to 354 gms in 2004 In
urban areas the mean fat intake increased by 13 per cent from 421 gms in 1993 to 475 gms
in 2004 The increase in fat intakes in the second period ie 2004-05 and 2009-10 were more
moderate Mean fat intakes increased to 382 gms (increase of 8 per cent) in rural areas and
489 gms (increase of 3 per cent) in urban areas
Although a precise range for fat requirements cannot be specified a range of 40ndash60 (gms) of
fat intake is desirable6 Figures 9 and 10 show the distribution of fat in rural and urban India
between 1993 and 2009 Detailed tables containing the mean fat intakes are given in the
annexure
Fig 9 Fat Intake Distributions for Rural India
Fig 10 Fat Intake Distributions for Urban India
6 Gopalan et al (1971) observe lsquoThe quantity of fat that should be included in a well balanced diet is not known
with any degree of certainty However it appears desirable in the present state of knowledge that the daily
intake of fat should be such that it contributes no more than 15 to 20 of the calories in the diet A total of
about 40 to 60 gms of fat can therefore be safely consumed daily and in order to obtain the necessary amounts
of essential fatty acids the fat intake should include at least 15 gms of vegetable oilsrsquo (pg 8) Also see ICMR
(1990)
34 23
14
25
27
24
26 34
40
15 17 21
0
10
20
30
40
50
60
70
80
90
100
1993 2004 2010
Pro
po
rtio
n o
f P
op
ula
tio
n (
)
Fat Intake Distribution Rural India
lt20 21ndash30 31ndash50 gt50 gms
25 15 10
30
31 28
26 32
37
19 22 25
0
10
20
30
40
50
60
70
80
90
100
1993 2004 2010
Pro
po
rtio
n o
f P
op
ula
tio
n (
)
Fat Intake Distribution Urban India
lt25 26ndash40 41ndash60 gt60 gms
8
Even considering the first three ranges of fat intake an astonishingly high estimate for fat
deficient households for rural India (over 85) is obtained for 1993 Well over one-third of
households were under the lowest range of lt20 (gms) The corresponding household share
with fat intakes lt50 gms fell to over 83 in 2004 and 79 in 2009 The share of households
consuming lt20 gms of fat fell sharply (from over 34 in 1993 to well over 22 in 2004 and
14 in 2009) Mean fat intakes increased over the period 1993 to 2009
Using higher ranges of fat intake for urban areas fat deprivation was pervasive (about 81 of
the households consumed lt60 gms of fats in 1993) About a quarter consumed lt25 gms
Over the period 1993ndash2009 the reduction in the proportion of fat- deprived was slight (from
81 in 1993 to 78 in 2004 to 75 in 2009) However as in rural India the proportion
consuming fats lt25 gms fell sharply Mean fat intake increased
Figures 11 and 12 show the Engel curves for fat In rural areas the fat Engel curves for 1993
lay below that for 2004 at lower levels of MPCE The 2009 curve lies above the 2004 curve
at lower levels of MPCE The crossover is at approximately Rs650 In urban areas the
crossover is at Rs1000 The curves converge beyond this
Fig 11 Fat Engel Curves for Rural India
Fig 12 Fat Engel Curves for Urban India
Thus taking nutritional norms as valid the overall picture of nutritional deprivation
worsened considerably over the period 1993ndash2009 The following Kernel density functions
(figure 13) clearly show a leftward shift in calorie and protein intake distributions and a
rightward shift in the fat intake distribution in both rural and urban areas between 1993 and
20097
7 For an admirably clear exposition of kernel density functions see Deaton (1995)
9
Fig 13 Kernel Density Functions for Calories Proteins and Fats consumed ndash Rural and
Urban India (1993 ndash 2009)
12 Factors Underlying Changes in Diets and Nutrition
We build on the DD analysis (2009) of food commodities that contributed to reduction in
calories protein and increase in fat consumption
10
Figure 14 shows the distribution of calorie protein and fat intake by food commodities for
rural and urban areas between 1993 and 2009 Detailed tables containing mean per capita
intake of nutrients from the various food items are given in the annexure
In rural India calorie intakes declined between 1993 and 2009 Most of it is attributable to
the decline in calories from cereals and pulses to some extent Calories from cereals reduced
from 1530 in 1993 to 1383 in 2004 and 1296 in 2009 The contribution of milkmilk
products sugar fruits and vegetables remained largely unchanged between 1993 and 2009
The contribution of vanaspati oil to the calorie intake increased substantially Calories
obtained from oil increased from 111 in 1993 to 145 in 2004 and 169 in 2009
Similar results are found for urban areas as well The reduction in the contribution of pulses
to calorie intakes was more drastic in urban areas between 2004 and 2009
71
68
64
58
56
54
6
7
7
9
9
10
5
7
8
8
10
11
5
5
5
6
6
6
1
1
1
1
1
1
7
8
4
11
12
5
1
1
1
2
2
2
4
4
4
5
5
4
0 10 20 30 40 50 60 70 80 90 100
1993-94
2004-05
2009-10
1993-94
2004-05
2009-10
Fig 14 Calorie Intake by Food Commodities 1993 2004 and 2009
Cereals Milk Vanaspati-Oil Sugar Eggs amp Meats Pulses Fruits Vegetables
RU
RA
L U
RB
AN
11
In both rural and urban areas protein intake declined between 1993 and 2009 (Figure 15)
Much of it is reflected in a reduction in protein intake from cereals and pulses In rural areas
the protein intake from these commodities decreased from 50 gms in 1993 to 45 gms in 2004
and 40 gms in 2009 The corresponding numbers for urban areas are 44 gms (1993) 42 gms
(2004) and 37 gms (2009) Intake from dairy products (milk eggs and meats) increased
moderately Proteins from other sources are a very small fraction and largely remained
unchanged between 1993 and 2009
Between 1993-2009 fat intake rose in both rural and urban areas Vanaspati-oil has the
maximum share in total fat intakes and its contribution rose over the period 1993 and 2009
In rural areas fat intake from vanaspati-oil rose from 12 gms in 1993 to 16 gms in 2004 and
19 gms in 2009 In urban areas the share of vanaspati-oil rose from 19 gms in 1993 to 22
gms in 2004 and 24 gms in 2009 The other significant contributor to fat intake are cereals
pulses and milk products (including ghee and butter) but their contribution reduced between
1993 and 2009 Declining intake of fats from these commodities were more than offset by the
increased intake of fat from vanaspati-oil
69
68
66
60
58
57
9
9
10
12
13
14
4
5
5
6
6
6
13
13
10
17
18
12
5
6
5
6
7
6
0 10 20 30 40 50 60 70 80 90 100
1993-94
2004-05
2009-10
1993-94
2004-05
2009-10
Fig 15 Protein Intake by Food Commodities 1993 2004 and 2009
Cereals Milk Eggs amp Meats Pulses Fruits amp Vegetables
RU
RA
L U
RB
AN
12
13 Demand Theory Based Explanation of Changes in Nutrient Intake
In response to the DeatonndashDreze (2009) explanation of a downward shift in the calorie Engel
curve in terms of lower lsquorequirementsrsquo due to health improvements and less strenuous
activity levels and more sedentary life-styles we have developed an alternative explanation
of changes in the consumption of calories protein and fats over the period 1993ndash2009 This
explanation is embedded in a standard demand theory framework with food prices8 and
expenditure (as a proxy for income) cast in a pivotal role Based on different experiments
robust demand functions are estimated for each of the three nutrients viz calories protein and
fats (Tables 1-3) Our results show consistently robust food price and expenditure effects
thus raising further doubts about the adequacy of the DD explanation The analysis is based
8 An important point to bear in mind is that the price effects capture both own and cross-price effects through
substitutions between food commodities Briefly as prices change demands for commodities change and
consequently calorie (and other nutrientsrsquo) intakes Underlying this is a presumption that food choices are
informed by their nutritional content As Deaton and Dreze (2009) emphasise people do not buy calories and
other nutrients but food commodities However if food choices are informed by their nutritional values it is
meaningful to talk about demands for calories and other nutrients
17
14
11
10
8
7
31
27
26
31
29
30
39
46
49
44
47
49
2
1
1
2
2
1
8
9
3
10
12
3
4
3
3
4
3
3
0 10 20 30 40 50 60 70 80 90 100
1993-94
2004-05
2009-10
1993-94
2004-05
2009-10
Fig 16 Fat Intake by Food Commodities 1993 2004 and 2009
Cereals Milk Vanaspati-Oil Eggs amp Meats Pulses Fruits amp Vegetables
RU
RA
L U
RB
AN
13
on unit record data collected for the 50th
61st and 66
th rounds of the NSS (corresponding to
the years 1993ndash94 2004ndash05 and 2009-10 respectively) We will discuss separately the
results for rural and urban samples
(a) Demand Function
A basic demand equation for nutrients (calories protein fats) in rural and urban India with
pooled data for 1993 2004 and 2009 is given below
(1)
where the dependent variable is log of nutrient consumed by ith household in time t jtP is a
vector of food prices computed from the NSS at the village level (j) and time t E it is
household per capita expenditure for ith household in time t itX is a vector of household
characteristics (eg number of adult males females household size ) and a few others
specified as dummy variables (caste) D1t is a dummy variable that takes the value 1 for 2004
and 0 otherwise (to allow for changes in factors other than food prices and expenditure over
time) D2t+k is the second time dummy that takes the value 1 for 2009 and 0 otherwise and
it is the error term This equation is estimated using robust regression Although a Chow test
for a structural shift is not feasible with robust regression we have employed two
refinements one is the use of a time dummy that could potentially capture the health
improvements and less strenuous activity patterns (associated with easier access to drinking
water better transportation facilities) and the other is interactions of food price variables
with the time dummy to allow for different price and expenditure effects over time9
An important point to bear in mind is that the price effects capture both own and cross-price
effects through substitutions between food commodities Briefly as prices change demands
for commodities change and consequently for example calorie (and other nutrientsrsquo) intakes
9 While these effects yield insights into changing consumer demands a more detailed analysis along the lines of
Behrman and Deolalikar (1989) and Jha et al (2009) would further deepen our understanding consumer
preferences and tastes for variety
14
(b) Results
We first consider the calorie demand function For both rural and urban areas each of the
price effects has a significant negative coefficient with the exception of price of fruits and
vegetables whose coefficient in not significant Moreover the price effects on the demand for
calories have in many cases weakened as captured by the coefficients of the interaction term
(ie interaction between the price and the time dummies) A case in point is price of cereals
and pulses Rising incomes have a positive impact on calorie demand and so does the
proportion of adults in the household The former effect however weakened over time As
household size increases calorie demand decreases Education of adult female has a negative
impact on calorie demand as this may be attributed to consumption of a more balanced diet
rich in protein and vitamins and reduced dependence on cereals which is a major source of
calories By contrast education of adult male is not significant in rural areas but positive in
urban areas SCs have lower demands for calories in both rural and urban areas while that of
Others is positive in rural areas and negative in urban areas relative to STs The effect of time
alone is reduced consumption of calorie between 1993 and 2004 However somewhat
surprisingly the residual time effect is not significant between 2004-09 That this undermines
the DD explanation emphasising lower calorie requirements due to improvements in the
epidemiology of the disease environment less strenuous physical activities and more
sedentary life styles cannot be ruled out
In case of protein demand in both rural and urban areas there is a positive influence of the
price of fruits and vegetables whereas the elasticity of protein demand with respect to all
other food prices is negative As in the case of calorie demand several price effects
weakened over over time as captured by the interaction term (between food prices and the
time dummies) A case in point is price of milk and milk products eggs and meats Higher
incomeexpenditure increase protein demand but less so over time Increasing household size
reduces protein demand whereas rising proportion of adults in the household increases it
The impact of education of adult female is negative and that of education of adult male is
not significant SCs have lower demand for protein while Others have higher demand relative
to STs The residual effect of time after accounting for the interaction is significant with a
negative coefficient suggesting a lower demand for protein in 2009 and 2004 as compared to
1993
15
In case of fats too in both rural and urban areas there are significant price and expenditure
effects ndash positive in the case of price of cereals oil and fruits and vegetables and negative in
case of milk products and sugar The positive price elasticity of fats with respect to edible oil
price is somewhat surprising although the price effect has weakened over time MPCE has
positive Unlike in the case of calorie and protein highest education of adult female has a
positive impact on fat demand suggesting that households with females having higher than
middle level of education tend to eat diets rich in fats shifting away from diets rich in
calories and proteins Moreover highest education of adult male also has a positive and
significant effect As in the case of calorie and protein household size has a negative impact
and proportion of adults in a household has a positive impact on demand for fats SCs and
Others have higher demands relative to STs The effect of time alone is to increase the fat
demand in 2009 and 2004 as compared to 1993
2 Concluding Observations
The main findings of our analysis are summarised below from a policy perspective
An important insight from the comparison of three rounds of the NSS over the period 1993-
2009 points to a slowing down of the reduction in the calorie intake in both rural and urban
areas in 2004-09 relative to 1993-2004 A similar slowing down occurred in protein intake
over the more recent period (2004-09) While fat intake continued to rise over this period but
at a lower rate
A demand theory based explanation of changes in demands for these nutrients reaffirmed the
important roles of food price and expenditure changes A new insight however is that in
several cases food price effects weakened over time as also expenditure effects While the
residual time effect weakened for both calories and protein over the period 1993-2004 it
slowed down over the more recent period The effect of time on fat demand was however
positive and strengthened over the more recent period Altogether thus the DD explanation of
lower calorie and protein demands over time as a result of lower requirements is further
undermined
From a policy perspective the important roles of food price stabilisation and expansion of
livelihood opportunities remain key to ameliorating nutritional deprivation despite lowering
of nutritional requirements A closer scrutiny of dietary preferences and tastes is crucial for
16
both understanding sources of nutritional deprivation and for designing effective policies for
mitigating it
17
Table 1 Robust Regression Estimates Demand for Calories 1993-2009
RURAL URBAN
Dependent Variable Log of Per capita consumption
of calories
No of Obs = 193785 No of Obs = 124481
F(60193724) = 1192631 F(60124420) = 370511
Prob gt F = 0 Prob gt F = 0
Coefficient Elasticity Coefficient Elasticity
Price Cereals amp Pulses -0012 (-2524) -0166 (-2524) -0006 (-102) -0090 (-102)
---interaction T1 (2004) 0011 (2072) 0049 (2072) 0001 (096) - 0003 (096) -
---interaction T2 (2009) 0010 (2005) 0071 (2005) 0004 (699) 0037 (699)
Price Milk Milk Products Eggs amp Meats
-0003 (-6421) -0098 (-6421) -0001 (-1253) -0035 (-1253)
---interaction T1 (2004) 0002 (4288) 0026 (4288) 0000 (329) 0003 (329)
---interaction T2 (2009) 0002 (4983) 0040 (4983) 0001 (904) 0013 (904)
Price Oil -0008 (-2667) -0086 (-2667) -0004 (-101) -0048 (-101)
---interaction T1 (2004) 0004 (1175) 0015 (1175) 0001 (189) 0003 (189)
---interaction T2 (2009) 0006 (1934) 0031 (1934) 0004 (994) 0024 (994)
Price Sugar -0002 (-127) -0124 (-127) -0004 (-1209) -0183 (-1209)
---interaction T1 (2004) 0002 (1136) 0050 (1136) 0003 (1029) 0061 (1029)
---interaction T2 (2009) 0001 (704) 0027 (704) 0002 (516) 0033 (516)
Price Fruits amp Vegetables
-0001 (-116) - -0010 (-116) - 0001 (194) 0026 (194)
---interaction T1 (2004) 0001 (275) 0010 (275) 0000 (026) - 0001 (026) -
---interaction T2 (2009) -0001 (-174) -0007 (-174) -0003 (-392) -0027 (-392)
Monthly per capita expenditure
0001 (40195) 0418 (40195) 0000 (22549) 0240 (22549)
---interaction T1 (2004) 0000 (-1160) -0054 (-1160) 0000 (-2386) -0011 (-2386)
---interaction T2 (2009) 0000 (-1712) -0063 (-1712) 0000 (-5097) -0022 (-5097)
Household Size -0006 (-3076) -0033 (-3076) -0021 (-684) -0096 (-684)
Proportion of Adults in the household
0202 (9139) 0137 (9139) 0235 (8183) 0169 (8183)
Education Dummy Males 0000 (-023) - 0000 (-023) - 0012 (805) 0008 (805)
Education Dummy Females
-0025 (-215) -0008 (-215) -0013 (-952) -0007 (-952)
Time Dummy (2004) -0159 (-1893) -0061 (-1893) -0105 (-829) -0036 (-829)
Time Dummy (2009) -0007 (-069) - -0002 (-069) - 0006 (045) - 0002 (045) -
Caste Dummy (SC) -0011 (-586) -0002 (-586) -0017 (-498) -0002 (-498)
Caste Dummy (Others) 0010 (616) 0006 (616) -0005 (-177) -0004 (-177)
Constant 7569 (89023)
7712 (59282)
and refer to significance at the 1 5 and 10 level respectively
State Dummies are omitted and details will be furnished on request Education Dummy If highest level of education is middle or lower then dummy = 0 else=1 Omitted Time period 1993 Omitted caste ST
18
Table 2 Robust Regression Estimates Demand for Protein 1993-2009
RURAL URBAN
Dependent Variable
Log of Per capita consumption of protein
No of Obs = 193784 No of Obs = 124481
F(60193723) = 1144586 F(60124420) = 391491
Prob gt F = 0 Prob gt F = 0
Coefficient Elasticity Coefficient Elasticity
Price Cereals amp Pulses -0013 (-2392) -0169 (-2392) -0009 (-1508) -0144 (-1508)
---interaction T1 (2004) 0013 (2153) 0055 (2153) 0005 (662) 0019 (662)
---interaction T2 (2009) 0012 (2187) 0084 (2187) 0009 (1386) 0079 (1386)
Price Milk Milk Products Eggs amp Meats
-0003 (-7497) -0123 (-7497) 0000 (-373) -0011 (-373)
---interaction T1 (2004) 0002 (4993) 0032 (4993) 0000 (-196) -0002 (-196)
---interaction T2 (2009) 0003 (5815) 0050 (5815) 0000 (264) 0004 (264)
Price Oil -0010 (-3216) -0112 (-3216) -0007 (-1709) -0088 (-1709)
---interaction T1 (2004) 0005 (1623) 0022 (1623) 0003 (658) 0012 (658)
---interaction T2 (2009) 0007 (2218) 0038 (2218) 0006 (1562) 0041 (1562)
Price Sugar -0002 (-1085) -0114 (-1085) -0003 (-844) -0139 (-844)
---interaction T1 (2004) 0002 (941) 0045 (941) 0001 (337) 0022 (337)
---interaction T2 (2009) 0001 (249) 0010 (249) 0000 (082) - 0006 (082) -
Price Fruits amp Vegetables
0002 (42) 0040 (42) 0002 (244) 0036 (244)
---interaction T1 (2004) 0000 (084) - 0003 (084) - -0001 (-081) - -0004 (-081) -
---interaction T2 (2009) -0003 (-652) -0030 (-652) -0003 (-366) -0027 (-366)
Monthly per capita expenditure
0001 (39184) 0438 (39184) 0000 (21912) 0254 (21912)
---interaction T1 (2004) 0000 (-1004) -0051 (-1004) 0000 (-1527) -0008 (-1527)
---interaction T2 (2009) 0000 (-1389) -0058 (-1389) 0000 (-3705) -0017 (-3705)
Household Size -0005 (-2368) -0027 (-2368) -0018 (-5526) -0084 (-5526)
Proportion of Adults in the household
0198 (8293) 0134 (8293) 0226 (7247) 0163 (7247)
Education Dummy
Males 0001 (116) - 0001 (116) - 0012 (743) 0008 (743)
Education Dummy Females
-0025 (-2031) -0008 (-2031) -0014 (-947) -0008 (-947)
Time Dummy (2004) -0210 (-2315) -0081 (-2315) -0050 (-36) -0017 (-36)
Time Dummy (2009) -0031 (-284) -0009 (-284) -0047 (-307) -0015 (-307)
Caste Dummy (SC) -0007 (-364) -0001 (-364) -0007 (-187) -0001 (-187)
Caste Dummy (Others) 0011 (623) 0007 (623) 0005 (143) - 0004 (143) -
Constant 3952 (43144)
4101 (28987)
and refer to significance at the 1 5 and 10 level respectively
State Dummies are omitted and details will be furnished on request Education Dummy If highest level of education is middle or lower then dummy = 0 else=1 Omitted Time period 1993 Omitted caste ST
19
Table 3 Robust Regression Estimates Demand for Fats 1993- 2009
RURAL URBAN
Dependent Variable Log of Per capita
consumption of Fats
No of Obs = 193784 No of Obs = 124481
F(60193723) = 1895778 F(60124420) = 766201
Prob gt F = 0 Prob gt F = 0
Coefficient Elasticity Coefficient Elasticity
Price Cereals amp Pulses 0016 (2033) 0218 (2033) 0012 (1462) 0193 (1462)
---interaction T1 (2004) -0005 (-598) -0023 (-598) -0008 (-871) -0035 (-871)
---interaction T2 (2009) -0009 (-1067) -0062 (-1067) -0006 (-661) -0052 (-661)
Price Milk Milk Products Eggs amp Meats
-0013 (-1924) -0478 (-1924) -0009 (-7698) -0327 (-7698)
---interaction T1 (2004) 0008 (10509) 0106 (10509) 0005 (3537) 0056 (3537)
---interaction T2 (2009) 0010 (13313) 0172 (13313) 0007 (5587) 0121 (5587)
Price Oil 0002 (445) 0023 (445) 0007 (1364) 0097 (1364)
---interaction T1 (2004) -0001 (-251) -0005 (-251) -0003 (-571) -0014 (-571)
---interaction T2 (2009) -0002 (-429) -0011 (-429) -0004 (-801) -0029 (-801)
Price Sugar -0004 (-1365) -0217 (-1365) -0003 (-75) -0170 (-75)
---interaction T1 (2004) 0001 (306) 0022 (306) 0001 (123) - 0011 (123) -
---interaction T2 (2009) -0001 (-169) -0011 (-169) -0002 (-42) -0040 (-42)
Price Fruits amp Vegetables
0011 (1418) 0206 (1418) 0006 (615) 0125 (615)
---interaction T1 (2004) -0010 (-1227) -0070 (-1227) -0006 (-556) -0037 (-556)
---interaction T2 (2009) -0011 (-1392) -0097 (-1392) -0008 (-74) -0076 (-74)
Monthly per capita expenditure
0001 (44365) 0753 (44365) 0000 (28858) 0462 (28858)
---interaction T1 (2004) 0000 (-1279) -0098 (-127) 0000 (-1896) -0014 (-1896)
---interaction T2 (2009) -0001 (-2100) -0126 (-2100) 0000 (-8414) -0054 (-8414)
Household Size -0019 (-5556) -0097 (-5556) -0039 (-8497) -0179 (-8497)
Proportion of Adults in the household
0165 (4584) 0112 (4584) 0188 (4368) 0135 (4368)
Education Dummy Males
0056 (3204) 0029 (3204) 0086 (3825) 0060 (3825)
Education Dummy Females
0031 (167) 0010 (167) 0086 (4086) 0048 (4086)
Time Dummy (2004) 0299 (2175) 0115 (2175) 0161 (845) 0055 (845)
Time Dummy (2009) 0564 (3391) 0165 (3391) 0360 (1697) 0114 (1697)
Caste Dummy (SC) 0052 (174) 0009 (174) 0040 (764) 0005 (764)
Caste Dummy (Others) 0135 (5278) 0090 (5278) 0108 (2307) 0086 (2307)
Constant 3023 (21787)
3474 (17776)
and refer to significance at the 1 5 and 10 level respectively
State Dummies are omitted and details will be furnished on request Education Dummy If highest level of education is middle or lower then dummy = 0 else=1 Omitted Time period 1993 Omitted caste ST
20
Annexure 1 Distribution of Nutrient Intake (1993 ndash 2009)
The following tables show the distribution of nutrient intake (proportion of population in
each category) in rural and urban areas between 1993 and 2009 Figures in parenthesis
indicate the mean nutrient intake in each range
Table 1 Calorie Intake Distributions in Rural India 1993 2004 and 2009
Year Range of Calorie Intake Per Capita Per Day
Total lt1800 1801ndash2400 2401ndash3000 gt3000
1993 3109 (1491)
4007 (2084)
1942 (2650)
942 (3636)
100 (2156)
2004 3668
(1516)
4311
(2071)
1507
(2629)
514
(3925)
100
(2047)
2010 3528
(1531)
4591
(2071)
1492
(2622)
389
(3545)
100
(2020)
Table 2 Calorie Intake Distributions in Urban India 1993 2004 and 2009
Year
Range of Calorie Intake Per Capita Per Day
Total lt1700 1701ndash2100 2101ndash2600 gt2600
1993 2812
(1426)
2962
(1900)
2576
(2320)
1649
(3107)
100
(2074)
2004 2940
(1440)
3452
(1900)
2467
(2313)
1141
(3252)
100
(2021)
2010 3010
(1456)
3534
(1896)
2436
(2312)
1019
(3043)
100
(1982)
Table 3 Protein Intake Distributions in Rural India 1993 2004 and 2009
Year Range of Protein Intake Per Capita Per Day (Gms)
Total lt45 46ndash60 61ndash75 gt75
1993 2381
(371)
3379
(524)
2279
(668)
1961
(944)
100
(603)
2004 2881
(374)
3805
(522)
2146
(663)
1168
(939)
100
(558)
2010 2935
(380)
4081
(521)
2105
(661)
879
(892)
100
(541)
21
Table 4 Protein Intake Distributions in Urban India 1993 2004 and 2009
Year Range of Protein Intake Per Capita Per Day (Gms)
Total lt45 46ndash60 61ndash75 gt75
1993 2490
(371)
3777
(524)
2311
(665)
1423
(907)
100
(573)
2004 2940
(378)
3450
(523)
2469
(662)
1140
(949)
100
(554)
2010 2944
(383)
4366
(521)
1961
(661)
729
(876)
100
(534)
Table 5 Fat Intake Distributions in Rural India 1993 2004 and 2009
Year Range of Fat Intake Per Capita Per Day (Gms)
Total lt20 21ndash30 31ndash50 gt50
1993 3430
(140)
2508
(247)
2609
(383)
1454
(721)
100
(315)
2004 2259
(150)
2721
(249)
3358
(383)
1662
(746)
100
(354)
2010 1420
(154)
2405
(251)
4049
(388)
2125
(672)
100
(382)
Table 6 Fat Intake Distributions in Urban India 1993 2004 and 2009
Year Range of Fat Intake Per Capita Per Day (Gms)
Total lt25 26ndash40 41ndash60 gt60
1993 2504
(182)
2984
(323)
2615
(486)
1897
(802)
100
(421)
2004 1539
(194)
3102
(326)
3156
(489)
2204
(858)
100
(474)
2010 1032
(198)
2788
(330)
3661
(490)
2519
(781)
100
(489)
Source Authorsrsquo calculations based on the 50th 61
st and 66
th rounds of the NSS
22
Annexure 2 Distribution of Nutrient Intake by Food Commodities (1993 -2009)
The following tables show the distribution of nutrient (calorie protein and fat) intake from
nine food commodity groups for rural and urban areas between 1993 and 2009
Table 1 Mean Per Capita Calorie Intake by Food Commodities 1993 2004 and 2009
Year Cereals Milk
Products GheeButter
Vanaspati-Oil
Sugar Eggs MeatFish Poultry
PulsesNuts Dry Fruits
Fruits Vegetables Total
Rural India
1993-94 1530 137 111 103 2 12 151 20 89 2156
Share 710 64 51 48 01 06 70 09 41
2004-05 1383 137 145 98 3 12 156 23 90 2047
Share 676 67 71 48 01 06 76 11 44
2009-10 1296 141 169 93 3 12 84 20 83 2020
Share 642 70 84 46 01 06 42 10 41
Urban India
1993-94 1213 181 168 129 5 16 231 37 94 2074
Share 585 87 81 62 02 08 111 18 45
2004-05 1133 189 199 115 6 16 235 36 92 2021
Share 561 94 98 57 03 08 116 18 46
2009-
10 1071 199 217 110 5 14 106 33 83 1982
Share 540 100 109 55 03 07 53 17 42
Table 2 Mean Per Capita Protein Intake by Food Commodities 1993 2004 and 2009
Year Cereals Milk
Products GheeButter
Vanaspati-Oil
Sugar Eggs MeatFish Poultry
PulsesNuts Dry Fruits
Fruits Vegetables Total
Rural India
1993-94 418 53 0 0 02 2 78 02 29 603
Share 693 88 00 00 03 33 129 03 48
2004-05 379 53 0 0 03 2 73 03 28 558
Share 679 95 00 00 05 36 131 05 50
2009-10 356 55 0 0 03 2 53 02 25 541
Share 658 102 00 00 06 37 98 04 46
Urban India
1993-94 341 67 0 0 04 26 10 04 31 573
Share 595 117 00 00 07 45 175 07 54
2004-05 32 7 0 0 05 27 98 04 31 554
Share 578 126 00 00 09 49 177 07 56
2009-
10 302 74 0 0 04 26 65 04 27 534
Share 566 139 00 00 07 49 122 07 51
23
Table 3 Mean Per Capita Fat Intake by Food Commodities 1993 2004 and 2009
Year Cereals Milk
Products GheeButter
Vanaspati-Oil
Sugar Eggs MeatFish Poultry
PulsesNuts Dry Fruits
Fruits Vegetables Total
Rural India
1993-94 54 97 123 0 02 03 24 07 04 315
Share 171 308 390 00 06 10 76 22 13
2004-05 48 97 162 0 03 02 31 08 04 354
Share 136 274 458 00 08 06 88 23 11
2009-10 43 10 187 0 03 02 11 08 03 382
Share 113 262 490 00 08 05 29 21 08
Urban India
1993-94 4 132 186 0 04 04 4 11 04 421
Share 95 314 442 00 10 10 95 26 10
2004-05 37 138 221 0 05 03 56 11 04 475
Share 78 291 465 00 11 06 118 23 08
2009-
10 35 145 241 0 04 02 15 11 04 489
Share 72 297 493 00 08 04 31 22 08
Source Authorsrsquo calculations based on the 50th 61
st and 66
th rounds of the NSS
24
References
Behrman J and A Deolalikar (1989) ldquoIs Variety the Spice of life Implications for Calorie
Intakerdquo Review of Economics and Statistics vol 71
Deaton A (1995) The Analysis of Household Surveys A Microeconomic approach to
Development Policy Baltimore MD The Johns Hopkins University Press
Deaton A and J Dreze (2009) lsquoFood and Nutrition in India Facts and Interpretationsrsquo
Economic and Political Weekly XLIV(7) 42ndash65
Gaiha R R Jha and Vani S Kulkarni (2012) ldquoDemand for Nutrients in India 1993 to
2004rdquo Applied Economics available online 1 February 2012
Gopalan C B Sastri and S Balasubramanian (1971) Nutritive Value of Indian Foods
National institute of Nutrition Indian Council of Medical Research Hyderabad
Indian Council of Medical Research (ICMR 1990) Nutrient Requirements and
Recommended Dietary Allowances for Indians New Delhi ICMR
Jha R R Gaiha and A Sharma (2009) ldquo Modelling Variety in Consumption Expenditure on
Food in Indiardquo International Review of Applied Economics online publication 1
July 2009
Srinivasan TN (1992) lsquoUndernutrition Concepts Measurements and Policy Implicationsrsquo
in SR Osmani (ed) Nutrition and Poverty Clarendon Press Oxford pp 97ndash120
1
Edited on 6th
June 2012
Demand for Nutrients in India An Analysis Based on the 50th
61st and 66
th
Rounds of the NSS
Raghav Gaiha
Formerly Faculty of Management Studies University of Delhi
Nidhi Kaicker
School of Business Public Policy and Social Entrepreneurship Ambedkar University Delhi
Katsushi S Imai
School of Social Sciences the University of Manchester amp RIEB Kobe University
Ganesh Thapa
International Fund for Agricultural Development Rome
Abstract
In response to the Deaton and Dreze (2009) explanation of a downward shift in the calorie Engel
curve in terms of lower requirements due to health improvements and lower activity levels in
India we develop an alternative explanation embedded in a standard demand theory framework
with food price and expenditure effects and shifting food and expenditure elasticities The
analysis is carried out with unit record data for three NSS rounds over the period 1993-2009 50th
61st and 66
th There are shifts in demands due to factors other than lower requirements While an
earlier analysis with the 50th
and 61st rounds of the NSS over the period 1993-2004 (Gaiha et
al2012) corroborated in part the Deaton-Dreze conjecture of lower requirements the extended
analysis for 1993-2009 reported here undermines this conjecture as time effects weaken over the
more recent period (2004-2009) But there is also weakening of food price and expenditure
elasticities over this period Closer scrutiny of food preferences and taste for variety is necessary
to understand better nutritional deprivation as also to design more effective policies to ameliorate
it
Key words calories protein fat food prices expenditure India
JEL codes C21 D12 I31 I32
Corresponding Author
Katsushi Imai (Dr)
Economics School of Social Sciences University of Manchester Arthur Lewis Building
Oxford Road Manchester M13 9PL UK Phone +44-(0)161-275-4827 Fax +44-(0)161-275-4928
E-mail KatsushiImaimanchesteracuk
2
Demand for Nutrients in India An Analysis Based on the 50th
61st and 66
th
Rounds of the NSS1
Introduction
Various studies point to a puzzle In India despite rising incomes there has been a sustained
decline in per capita calorie intake In an important contribution Deaton and Dreze (2009)
offer a detailed analysis of the decline in calorie intake over the period 1983 to 2004 Their
principal findings are summarised below
Average calorie consumption was about 10 per cent lower in rural areas in 2004ndash05 than in
1983 The proportionate decline was larger among the more affluent sections of the
population and about 0 for the bottom quartile of the per capita expenditure scale In urban
areas there was a slight change in average calorie intake over this period
The decline of per capita consumption is not confined to calories It also applies to proteins
and other nutrients with the exception of fats whose consumption has increased in both rural
and urban areas over this period
As incomes rose over this period these declines are puzzling A more contentious view
offered by Deaton and Dreze (2009) is that the latter are not attributable to changes in relative
prices as an aggregate measure of the price of food mdash treated synonymous with the price of
calories mdash changed little during the period in question So the puzzle is essentially this per
capita calorie consumption is lower at a given level of per capita household expenditure
across the expenditure scale at low levels of per capita expenditure as well as high In other
words there is a steady downward shift of the calorie Engel curve
Deaton and Dreze (2009) hereafter DD are emphatic that the downward shift of the calorie
Engel curve is due to lower calorie requirements associated mainly with better health and
lower activity levels As the evidence offered is fragmentary and patchy this explanation is
largely conjectural
The present study builds on an earlier critique of DD by developing a demand theory based
explanation of calories and proteins but over a longer period 1993-20092 The most recent
1 We are grateful to T Elhaut for guidance in the initial stage Anil Deolalikar and Raghbendra Jha for valuable
advice and Raj Bhatia for competent data analysis Although this study was funded by the Asia and Pacific
Division of IFAD the views expressed are personal 2 For details see Gaiha et al (2012)
3
round (66th round corresponding to the year 2009-10) of the National Sample Survey (NSS)
provides new insights on the consumption and expenditure behaviour of households This
round throws new light on the trends in nutrient intake in the past two decades The analysis
is based mostly on unit record data collected for the 50th 61
st and 66
th rounds of the NSS
(corresponding to 1993ndash94 2004ndash05 and 2009-10 respectively)
11 Nutrient Intakes
Calories
In rural areas the mean calorie intake reduced from 2156 in 1993 to 2047 in 2004 a decline
of about 5 per cent The reduction in calorie intake was slower between 2004 and 2009 ndash only
1 per cent In urban areas the mean calorie intake reduced from 2074 in 1993 to 2021 in 2004
and 1982 in 2009 ie a 3 per cent decline in the first period and a 2 per cent decline in the
second
Until recently a calorie intake of 2400 per day was considered adequate for a typical adult
engaged in physically strenuous work of a certain duration in rural India More recent
Fig 1 Calorie Distribution in Rural India
Fig 2 Calorie Distribution in Urban India
31 37 35
40
43 46
19 15 15
9 5 4
0
20
40
60
80
100
1993-94 2004-05 2009-10
Pro
po
rtio
n o
f P
op
ula
tio
n (
)
Calorie Intake Distribution Rural India
lt1800 1801ndash2400 2401ndash3000 gt3000 calories
28 29 30
30 35 35
26 25 24
16 11 10
0
20
40
60
80
100
1993-94 2004-05 2009-10
Pro
po
rtio
n o
f P
op
ula
tio
n (
)
Calorie Intake Distribution Urban India
lt1700 1701ndash2100 2101ndash2600 gt2600 calories
4
assessments have used lower calorie lsquorequirementsrsquo (1800 calories)3 Figures 1 amp 2 show the
distribution of calories in rural and urban India between 1993 and 2009 Detailed tables
containing the mean calorie intakes are given in the annexure
Using the higher calorie requirement of 2400 over 71 of the rural households were calorie
deprived or more generally undernourished in 19934 With the lower norm of 1800 this
proportion falls sharply to about 31 implying a large concentration of households in the
calorie intake range of 1800ndash2400 The proportion of undernourished rises from 71 to
nearly 80 in 2004 and 2009 The proportion below the lower cut-off rose from about 31
in 1993 to close to 37 in 2004 indicating high levels of calorie deprivation It declined only
marginally between 2004 and 2009 The mean calorie intake reduced from 2156 in 1993 to
2047 in 2004 to 2020 in 2009
In urban India assuming lower calorie norms of 1700 and 2100 (given less strenuous
physical activity in urban areas) about 28 consumed less than 1700 calories in 1993
About 58 were below the higher calorie norm of 2100 Worse this proportion rose to about
64 in 2004 The proportion of people below the lower cut-off changed only slightly The
proportion of people below the lower and the higher calorie norm changed only slightly
between 2004 and 2009 While the mean calorie intake (overall) decreased between 2004 and
2009 it increased for those below the lower calorie norm Although less alarming than the
calorie deprivation increase in rural India it is nevertheless worrying
DD drew attention to the downward shift in the calorie Engel curve over the period 1983ndash
2004 We find that for the period 1993-2009 the calorie Engel curves for rural India display a
downward shift-especially above extremely low levels of monthly per capita expenditure
(MPCE) at 2004 prices (Figures 3 and 4) The proportionate reduction in calorie intake is
much higher at higher MPCE The calorie Engel curve in urban India for 2004 lies above
1993 at lower levels of MPCE At MPCE gtRs 500 calorie intake was higher in 1993 than in
2004 The proportionate reduction in calorie intake at higher MPCE was larger Similarly the
calorie Engel curve for 2009 lies above that for 2004 at lower levels and the crossover occurs
3 Srinivasan (1992 ) is deeply sceptical of such requirements on the ground that energy expenditure adjusts to
intake within a range 4 Although calorie deprivation is an aspect of undernutrition we sometimes use them interchangeably for
expositional convenience
5
at MPCE of Rs 500 Thus there is evidence of a downward shift of the calorie Engel curve
in both rural and urban India especially at higher levels of MPCE
Fig 3 Calorie Engel Curve for Rural India
Fig 4 Calorie Engel Curve for Urban India
Protein
The mean protein intakes reduced from 603 gms in 1993 to 558 gms in 2004 ie by 7 per
cent The reduction was slower in the second period ndash by 3 per cent with mean intake of 541
gms in 2009 In urban areas the mean protein intake reduced from 573 gms in 1993 to 554
gms in 2004 and 534 gms in 2009 ie a reduction of about 3-4 per cent in both periods
To assess the proportion of people who are protein-deprived a cut-off of 60 (gms) of protein
Fig 5 Protein Intake Distribution in Rural India
Fig 6 Protein Intake Distribution in Urban India
24 29 29
34
38 41
23
21 21
20 12 9
0
10
20
30
40
50
60
70
80
90
100
1993-94 2004-05 2009-10
Pro
po
rtio
n o
f P
op
ula
tio
n (
)
Protein Intake Distribution Rural India
lt45 46ndash60 61ndash75 gt75 gms
25 29 29
38 35
44
23 25 20
14 11 7
0
10
20
30
40
50
60
70
80
90
100
1993-94 2004-05 2009-10
Pro
po
rtio
n o
f P
op
ula
tio
n (
)
Protein Intake Distribution Urban India
lt45 46ndash60 61ndash75 gt75 gms
6
intake is used5 Figures 5 and 6 show the distribution of protein in rural and urban India
between 1993 and 2010 Detailed tables containing the mean protein intakes are given in the
annexure
While protein deficiency is in large measure linked to calorie deficiency we note that well
over 57 of rural households consumed fewer than the required protein intake in 1993 Just
under a quarter of the households consumed lt45 (gms) of protein Within both ranges of
protein intake the proportions rose more than moderately (eg in the lower range the
proportion of households rose from about 24 in 1993 to about 29 in 2004 in the higher
range the proportion rose from 57 in 1993 to 66 in 2004 to 70 in 2009) Although the
mean intake of protein for households in the lower range remained unchanged it reduced
from 60 gms in 1993 to 56 gms in 2004 and 54 gms in 2009
The share of protein-deficient households in urban India (considering the 60 gm cut-off)
remained unchanged between 1993 and 2004 but increased substantially between 2004 and
2009 Overall mean protein intakes however reduced
Figures 7 and 8 report protein Engel curves for rural and urban India between 1993ndash2009
The ruralndashurban contrast in protein intake is striking In the rural areas protein intake was
consistently lower across expenditure classes in 2009 than in 2004 which in turn was lower
than in 1993 The gap between 1993 and 2004 intakes widens considerably at higher MPCE
Fig 7 Protein Engel Curves for Rural India
Fig 8 Protein Engel Curves for Urban India
5 For details see Gopalan et al (1971 1992) and ICMR (1990)
7
In urban areas the 2004 curve was above the 1993 curve at low levels of MPCE and after the
cross-over expenditure of about Rs 500 the former lay below the 1993 curve The 2009 curve
lies above the 2004 curve at lower levels of MPCE and below the 2004 curve at higher levels
Fats
Mean fat intake increased substantially between 1993-94 and 2004-05 In rural areas the
mean fat intake increased by 12 per cent from 315 gms in 1993 to 354 gms in 2004 In
urban areas the mean fat intake increased by 13 per cent from 421 gms in 1993 to 475 gms
in 2004 The increase in fat intakes in the second period ie 2004-05 and 2009-10 were more
moderate Mean fat intakes increased to 382 gms (increase of 8 per cent) in rural areas and
489 gms (increase of 3 per cent) in urban areas
Although a precise range for fat requirements cannot be specified a range of 40ndash60 (gms) of
fat intake is desirable6 Figures 9 and 10 show the distribution of fat in rural and urban India
between 1993 and 2009 Detailed tables containing the mean fat intakes are given in the
annexure
Fig 9 Fat Intake Distributions for Rural India
Fig 10 Fat Intake Distributions for Urban India
6 Gopalan et al (1971) observe lsquoThe quantity of fat that should be included in a well balanced diet is not known
with any degree of certainty However it appears desirable in the present state of knowledge that the daily
intake of fat should be such that it contributes no more than 15 to 20 of the calories in the diet A total of
about 40 to 60 gms of fat can therefore be safely consumed daily and in order to obtain the necessary amounts
of essential fatty acids the fat intake should include at least 15 gms of vegetable oilsrsquo (pg 8) Also see ICMR
(1990)
34 23
14
25
27
24
26 34
40
15 17 21
0
10
20
30
40
50
60
70
80
90
100
1993 2004 2010
Pro
po
rtio
n o
f P
op
ula
tio
n (
)
Fat Intake Distribution Rural India
lt20 21ndash30 31ndash50 gt50 gms
25 15 10
30
31 28
26 32
37
19 22 25
0
10
20
30
40
50
60
70
80
90
100
1993 2004 2010
Pro
po
rtio
n o
f P
op
ula
tio
n (
)
Fat Intake Distribution Urban India
lt25 26ndash40 41ndash60 gt60 gms
8
Even considering the first three ranges of fat intake an astonishingly high estimate for fat
deficient households for rural India (over 85) is obtained for 1993 Well over one-third of
households were under the lowest range of lt20 (gms) The corresponding household share
with fat intakes lt50 gms fell to over 83 in 2004 and 79 in 2009 The share of households
consuming lt20 gms of fat fell sharply (from over 34 in 1993 to well over 22 in 2004 and
14 in 2009) Mean fat intakes increased over the period 1993 to 2009
Using higher ranges of fat intake for urban areas fat deprivation was pervasive (about 81 of
the households consumed lt60 gms of fats in 1993) About a quarter consumed lt25 gms
Over the period 1993ndash2009 the reduction in the proportion of fat- deprived was slight (from
81 in 1993 to 78 in 2004 to 75 in 2009) However as in rural India the proportion
consuming fats lt25 gms fell sharply Mean fat intake increased
Figures 11 and 12 show the Engel curves for fat In rural areas the fat Engel curves for 1993
lay below that for 2004 at lower levels of MPCE The 2009 curve lies above the 2004 curve
at lower levels of MPCE The crossover is at approximately Rs650 In urban areas the
crossover is at Rs1000 The curves converge beyond this
Fig 11 Fat Engel Curves for Rural India
Fig 12 Fat Engel Curves for Urban India
Thus taking nutritional norms as valid the overall picture of nutritional deprivation
worsened considerably over the period 1993ndash2009 The following Kernel density functions
(figure 13) clearly show a leftward shift in calorie and protein intake distributions and a
rightward shift in the fat intake distribution in both rural and urban areas between 1993 and
20097
7 For an admirably clear exposition of kernel density functions see Deaton (1995)
9
Fig 13 Kernel Density Functions for Calories Proteins and Fats consumed ndash Rural and
Urban India (1993 ndash 2009)
12 Factors Underlying Changes in Diets and Nutrition
We build on the DD analysis (2009) of food commodities that contributed to reduction in
calories protein and increase in fat consumption
10
Figure 14 shows the distribution of calorie protein and fat intake by food commodities for
rural and urban areas between 1993 and 2009 Detailed tables containing mean per capita
intake of nutrients from the various food items are given in the annexure
In rural India calorie intakes declined between 1993 and 2009 Most of it is attributable to
the decline in calories from cereals and pulses to some extent Calories from cereals reduced
from 1530 in 1993 to 1383 in 2004 and 1296 in 2009 The contribution of milkmilk
products sugar fruits and vegetables remained largely unchanged between 1993 and 2009
The contribution of vanaspati oil to the calorie intake increased substantially Calories
obtained from oil increased from 111 in 1993 to 145 in 2004 and 169 in 2009
Similar results are found for urban areas as well The reduction in the contribution of pulses
to calorie intakes was more drastic in urban areas between 2004 and 2009
71
68
64
58
56
54
6
7
7
9
9
10
5
7
8
8
10
11
5
5
5
6
6
6
1
1
1
1
1
1
7
8
4
11
12
5
1
1
1
2
2
2
4
4
4
5
5
4
0 10 20 30 40 50 60 70 80 90 100
1993-94
2004-05
2009-10
1993-94
2004-05
2009-10
Fig 14 Calorie Intake by Food Commodities 1993 2004 and 2009
Cereals Milk Vanaspati-Oil Sugar Eggs amp Meats Pulses Fruits Vegetables
RU
RA
L U
RB
AN
11
In both rural and urban areas protein intake declined between 1993 and 2009 (Figure 15)
Much of it is reflected in a reduction in protein intake from cereals and pulses In rural areas
the protein intake from these commodities decreased from 50 gms in 1993 to 45 gms in 2004
and 40 gms in 2009 The corresponding numbers for urban areas are 44 gms (1993) 42 gms
(2004) and 37 gms (2009) Intake from dairy products (milk eggs and meats) increased
moderately Proteins from other sources are a very small fraction and largely remained
unchanged between 1993 and 2009
Between 1993-2009 fat intake rose in both rural and urban areas Vanaspati-oil has the
maximum share in total fat intakes and its contribution rose over the period 1993 and 2009
In rural areas fat intake from vanaspati-oil rose from 12 gms in 1993 to 16 gms in 2004 and
19 gms in 2009 In urban areas the share of vanaspati-oil rose from 19 gms in 1993 to 22
gms in 2004 and 24 gms in 2009 The other significant contributor to fat intake are cereals
pulses and milk products (including ghee and butter) but their contribution reduced between
1993 and 2009 Declining intake of fats from these commodities were more than offset by the
increased intake of fat from vanaspati-oil
69
68
66
60
58
57
9
9
10
12
13
14
4
5
5
6
6
6
13
13
10
17
18
12
5
6
5
6
7
6
0 10 20 30 40 50 60 70 80 90 100
1993-94
2004-05
2009-10
1993-94
2004-05
2009-10
Fig 15 Protein Intake by Food Commodities 1993 2004 and 2009
Cereals Milk Eggs amp Meats Pulses Fruits amp Vegetables
RU
RA
L U
RB
AN
12
13 Demand Theory Based Explanation of Changes in Nutrient Intake
In response to the DeatonndashDreze (2009) explanation of a downward shift in the calorie Engel
curve in terms of lower lsquorequirementsrsquo due to health improvements and less strenuous
activity levels and more sedentary life-styles we have developed an alternative explanation
of changes in the consumption of calories protein and fats over the period 1993ndash2009 This
explanation is embedded in a standard demand theory framework with food prices8 and
expenditure (as a proxy for income) cast in a pivotal role Based on different experiments
robust demand functions are estimated for each of the three nutrients viz calories protein and
fats (Tables 1-3) Our results show consistently robust food price and expenditure effects
thus raising further doubts about the adequacy of the DD explanation The analysis is based
8 An important point to bear in mind is that the price effects capture both own and cross-price effects through
substitutions between food commodities Briefly as prices change demands for commodities change and
consequently calorie (and other nutrientsrsquo) intakes Underlying this is a presumption that food choices are
informed by their nutritional content As Deaton and Dreze (2009) emphasise people do not buy calories and
other nutrients but food commodities However if food choices are informed by their nutritional values it is
meaningful to talk about demands for calories and other nutrients
17
14
11
10
8
7
31
27
26
31
29
30
39
46
49
44
47
49
2
1
1
2
2
1
8
9
3
10
12
3
4
3
3
4
3
3
0 10 20 30 40 50 60 70 80 90 100
1993-94
2004-05
2009-10
1993-94
2004-05
2009-10
Fig 16 Fat Intake by Food Commodities 1993 2004 and 2009
Cereals Milk Vanaspati-Oil Eggs amp Meats Pulses Fruits amp Vegetables
RU
RA
L U
RB
AN
13
on unit record data collected for the 50th
61st and 66
th rounds of the NSS (corresponding to
the years 1993ndash94 2004ndash05 and 2009-10 respectively) We will discuss separately the
results for rural and urban samples
(a) Demand Function
A basic demand equation for nutrients (calories protein fats) in rural and urban India with
pooled data for 1993 2004 and 2009 is given below
(1)
where the dependent variable is log of nutrient consumed by ith household in time t jtP is a
vector of food prices computed from the NSS at the village level (j) and time t E it is
household per capita expenditure for ith household in time t itX is a vector of household
characteristics (eg number of adult males females household size ) and a few others
specified as dummy variables (caste) D1t is a dummy variable that takes the value 1 for 2004
and 0 otherwise (to allow for changes in factors other than food prices and expenditure over
time) D2t+k is the second time dummy that takes the value 1 for 2009 and 0 otherwise and
it is the error term This equation is estimated using robust regression Although a Chow test
for a structural shift is not feasible with robust regression we have employed two
refinements one is the use of a time dummy that could potentially capture the health
improvements and less strenuous activity patterns (associated with easier access to drinking
water better transportation facilities) and the other is interactions of food price variables
with the time dummy to allow for different price and expenditure effects over time9
An important point to bear in mind is that the price effects capture both own and cross-price
effects through substitutions between food commodities Briefly as prices change demands
for commodities change and consequently for example calorie (and other nutrientsrsquo) intakes
9 While these effects yield insights into changing consumer demands a more detailed analysis along the lines of
Behrman and Deolalikar (1989) and Jha et al (2009) would further deepen our understanding consumer
preferences and tastes for variety
14
(b) Results
We first consider the calorie demand function For both rural and urban areas each of the
price effects has a significant negative coefficient with the exception of price of fruits and
vegetables whose coefficient in not significant Moreover the price effects on the demand for
calories have in many cases weakened as captured by the coefficients of the interaction term
(ie interaction between the price and the time dummies) A case in point is price of cereals
and pulses Rising incomes have a positive impact on calorie demand and so does the
proportion of adults in the household The former effect however weakened over time As
household size increases calorie demand decreases Education of adult female has a negative
impact on calorie demand as this may be attributed to consumption of a more balanced diet
rich in protein and vitamins and reduced dependence on cereals which is a major source of
calories By contrast education of adult male is not significant in rural areas but positive in
urban areas SCs have lower demands for calories in both rural and urban areas while that of
Others is positive in rural areas and negative in urban areas relative to STs The effect of time
alone is reduced consumption of calorie between 1993 and 2004 However somewhat
surprisingly the residual time effect is not significant between 2004-09 That this undermines
the DD explanation emphasising lower calorie requirements due to improvements in the
epidemiology of the disease environment less strenuous physical activities and more
sedentary life styles cannot be ruled out
In case of protein demand in both rural and urban areas there is a positive influence of the
price of fruits and vegetables whereas the elasticity of protein demand with respect to all
other food prices is negative As in the case of calorie demand several price effects
weakened over over time as captured by the interaction term (between food prices and the
time dummies) A case in point is price of milk and milk products eggs and meats Higher
incomeexpenditure increase protein demand but less so over time Increasing household size
reduces protein demand whereas rising proportion of adults in the household increases it
The impact of education of adult female is negative and that of education of adult male is
not significant SCs have lower demand for protein while Others have higher demand relative
to STs The residual effect of time after accounting for the interaction is significant with a
negative coefficient suggesting a lower demand for protein in 2009 and 2004 as compared to
1993
15
In case of fats too in both rural and urban areas there are significant price and expenditure
effects ndash positive in the case of price of cereals oil and fruits and vegetables and negative in
case of milk products and sugar The positive price elasticity of fats with respect to edible oil
price is somewhat surprising although the price effect has weakened over time MPCE has
positive Unlike in the case of calorie and protein highest education of adult female has a
positive impact on fat demand suggesting that households with females having higher than
middle level of education tend to eat diets rich in fats shifting away from diets rich in
calories and proteins Moreover highest education of adult male also has a positive and
significant effect As in the case of calorie and protein household size has a negative impact
and proportion of adults in a household has a positive impact on demand for fats SCs and
Others have higher demands relative to STs The effect of time alone is to increase the fat
demand in 2009 and 2004 as compared to 1993
2 Concluding Observations
The main findings of our analysis are summarised below from a policy perspective
An important insight from the comparison of three rounds of the NSS over the period 1993-
2009 points to a slowing down of the reduction in the calorie intake in both rural and urban
areas in 2004-09 relative to 1993-2004 A similar slowing down occurred in protein intake
over the more recent period (2004-09) While fat intake continued to rise over this period but
at a lower rate
A demand theory based explanation of changes in demands for these nutrients reaffirmed the
important roles of food price and expenditure changes A new insight however is that in
several cases food price effects weakened over time as also expenditure effects While the
residual time effect weakened for both calories and protein over the period 1993-2004 it
slowed down over the more recent period The effect of time on fat demand was however
positive and strengthened over the more recent period Altogether thus the DD explanation of
lower calorie and protein demands over time as a result of lower requirements is further
undermined
From a policy perspective the important roles of food price stabilisation and expansion of
livelihood opportunities remain key to ameliorating nutritional deprivation despite lowering
of nutritional requirements A closer scrutiny of dietary preferences and tastes is crucial for
16
both understanding sources of nutritional deprivation and for designing effective policies for
mitigating it
17
Table 1 Robust Regression Estimates Demand for Calories 1993-2009
RURAL URBAN
Dependent Variable Log of Per capita consumption
of calories
No of Obs = 193785 No of Obs = 124481
F(60193724) = 1192631 F(60124420) = 370511
Prob gt F = 0 Prob gt F = 0
Coefficient Elasticity Coefficient Elasticity
Price Cereals amp Pulses -0012 (-2524) -0166 (-2524) -0006 (-102) -0090 (-102)
---interaction T1 (2004) 0011 (2072) 0049 (2072) 0001 (096) - 0003 (096) -
---interaction T2 (2009) 0010 (2005) 0071 (2005) 0004 (699) 0037 (699)
Price Milk Milk Products Eggs amp Meats
-0003 (-6421) -0098 (-6421) -0001 (-1253) -0035 (-1253)
---interaction T1 (2004) 0002 (4288) 0026 (4288) 0000 (329) 0003 (329)
---interaction T2 (2009) 0002 (4983) 0040 (4983) 0001 (904) 0013 (904)
Price Oil -0008 (-2667) -0086 (-2667) -0004 (-101) -0048 (-101)
---interaction T1 (2004) 0004 (1175) 0015 (1175) 0001 (189) 0003 (189)
---interaction T2 (2009) 0006 (1934) 0031 (1934) 0004 (994) 0024 (994)
Price Sugar -0002 (-127) -0124 (-127) -0004 (-1209) -0183 (-1209)
---interaction T1 (2004) 0002 (1136) 0050 (1136) 0003 (1029) 0061 (1029)
---interaction T2 (2009) 0001 (704) 0027 (704) 0002 (516) 0033 (516)
Price Fruits amp Vegetables
-0001 (-116) - -0010 (-116) - 0001 (194) 0026 (194)
---interaction T1 (2004) 0001 (275) 0010 (275) 0000 (026) - 0001 (026) -
---interaction T2 (2009) -0001 (-174) -0007 (-174) -0003 (-392) -0027 (-392)
Monthly per capita expenditure
0001 (40195) 0418 (40195) 0000 (22549) 0240 (22549)
---interaction T1 (2004) 0000 (-1160) -0054 (-1160) 0000 (-2386) -0011 (-2386)
---interaction T2 (2009) 0000 (-1712) -0063 (-1712) 0000 (-5097) -0022 (-5097)
Household Size -0006 (-3076) -0033 (-3076) -0021 (-684) -0096 (-684)
Proportion of Adults in the household
0202 (9139) 0137 (9139) 0235 (8183) 0169 (8183)
Education Dummy Males 0000 (-023) - 0000 (-023) - 0012 (805) 0008 (805)
Education Dummy Females
-0025 (-215) -0008 (-215) -0013 (-952) -0007 (-952)
Time Dummy (2004) -0159 (-1893) -0061 (-1893) -0105 (-829) -0036 (-829)
Time Dummy (2009) -0007 (-069) - -0002 (-069) - 0006 (045) - 0002 (045) -
Caste Dummy (SC) -0011 (-586) -0002 (-586) -0017 (-498) -0002 (-498)
Caste Dummy (Others) 0010 (616) 0006 (616) -0005 (-177) -0004 (-177)
Constant 7569 (89023)
7712 (59282)
and refer to significance at the 1 5 and 10 level respectively
State Dummies are omitted and details will be furnished on request Education Dummy If highest level of education is middle or lower then dummy = 0 else=1 Omitted Time period 1993 Omitted caste ST
18
Table 2 Robust Regression Estimates Demand for Protein 1993-2009
RURAL URBAN
Dependent Variable
Log of Per capita consumption of protein
No of Obs = 193784 No of Obs = 124481
F(60193723) = 1144586 F(60124420) = 391491
Prob gt F = 0 Prob gt F = 0
Coefficient Elasticity Coefficient Elasticity
Price Cereals amp Pulses -0013 (-2392) -0169 (-2392) -0009 (-1508) -0144 (-1508)
---interaction T1 (2004) 0013 (2153) 0055 (2153) 0005 (662) 0019 (662)
---interaction T2 (2009) 0012 (2187) 0084 (2187) 0009 (1386) 0079 (1386)
Price Milk Milk Products Eggs amp Meats
-0003 (-7497) -0123 (-7497) 0000 (-373) -0011 (-373)
---interaction T1 (2004) 0002 (4993) 0032 (4993) 0000 (-196) -0002 (-196)
---interaction T2 (2009) 0003 (5815) 0050 (5815) 0000 (264) 0004 (264)
Price Oil -0010 (-3216) -0112 (-3216) -0007 (-1709) -0088 (-1709)
---interaction T1 (2004) 0005 (1623) 0022 (1623) 0003 (658) 0012 (658)
---interaction T2 (2009) 0007 (2218) 0038 (2218) 0006 (1562) 0041 (1562)
Price Sugar -0002 (-1085) -0114 (-1085) -0003 (-844) -0139 (-844)
---interaction T1 (2004) 0002 (941) 0045 (941) 0001 (337) 0022 (337)
---interaction T2 (2009) 0001 (249) 0010 (249) 0000 (082) - 0006 (082) -
Price Fruits amp Vegetables
0002 (42) 0040 (42) 0002 (244) 0036 (244)
---interaction T1 (2004) 0000 (084) - 0003 (084) - -0001 (-081) - -0004 (-081) -
---interaction T2 (2009) -0003 (-652) -0030 (-652) -0003 (-366) -0027 (-366)
Monthly per capita expenditure
0001 (39184) 0438 (39184) 0000 (21912) 0254 (21912)
---interaction T1 (2004) 0000 (-1004) -0051 (-1004) 0000 (-1527) -0008 (-1527)
---interaction T2 (2009) 0000 (-1389) -0058 (-1389) 0000 (-3705) -0017 (-3705)
Household Size -0005 (-2368) -0027 (-2368) -0018 (-5526) -0084 (-5526)
Proportion of Adults in the household
0198 (8293) 0134 (8293) 0226 (7247) 0163 (7247)
Education Dummy
Males 0001 (116) - 0001 (116) - 0012 (743) 0008 (743)
Education Dummy Females
-0025 (-2031) -0008 (-2031) -0014 (-947) -0008 (-947)
Time Dummy (2004) -0210 (-2315) -0081 (-2315) -0050 (-36) -0017 (-36)
Time Dummy (2009) -0031 (-284) -0009 (-284) -0047 (-307) -0015 (-307)
Caste Dummy (SC) -0007 (-364) -0001 (-364) -0007 (-187) -0001 (-187)
Caste Dummy (Others) 0011 (623) 0007 (623) 0005 (143) - 0004 (143) -
Constant 3952 (43144)
4101 (28987)
and refer to significance at the 1 5 and 10 level respectively
State Dummies are omitted and details will be furnished on request Education Dummy If highest level of education is middle or lower then dummy = 0 else=1 Omitted Time period 1993 Omitted caste ST
19
Table 3 Robust Regression Estimates Demand for Fats 1993- 2009
RURAL URBAN
Dependent Variable Log of Per capita
consumption of Fats
No of Obs = 193784 No of Obs = 124481
F(60193723) = 1895778 F(60124420) = 766201
Prob gt F = 0 Prob gt F = 0
Coefficient Elasticity Coefficient Elasticity
Price Cereals amp Pulses 0016 (2033) 0218 (2033) 0012 (1462) 0193 (1462)
---interaction T1 (2004) -0005 (-598) -0023 (-598) -0008 (-871) -0035 (-871)
---interaction T2 (2009) -0009 (-1067) -0062 (-1067) -0006 (-661) -0052 (-661)
Price Milk Milk Products Eggs amp Meats
-0013 (-1924) -0478 (-1924) -0009 (-7698) -0327 (-7698)
---interaction T1 (2004) 0008 (10509) 0106 (10509) 0005 (3537) 0056 (3537)
---interaction T2 (2009) 0010 (13313) 0172 (13313) 0007 (5587) 0121 (5587)
Price Oil 0002 (445) 0023 (445) 0007 (1364) 0097 (1364)
---interaction T1 (2004) -0001 (-251) -0005 (-251) -0003 (-571) -0014 (-571)
---interaction T2 (2009) -0002 (-429) -0011 (-429) -0004 (-801) -0029 (-801)
Price Sugar -0004 (-1365) -0217 (-1365) -0003 (-75) -0170 (-75)
---interaction T1 (2004) 0001 (306) 0022 (306) 0001 (123) - 0011 (123) -
---interaction T2 (2009) -0001 (-169) -0011 (-169) -0002 (-42) -0040 (-42)
Price Fruits amp Vegetables
0011 (1418) 0206 (1418) 0006 (615) 0125 (615)
---interaction T1 (2004) -0010 (-1227) -0070 (-1227) -0006 (-556) -0037 (-556)
---interaction T2 (2009) -0011 (-1392) -0097 (-1392) -0008 (-74) -0076 (-74)
Monthly per capita expenditure
0001 (44365) 0753 (44365) 0000 (28858) 0462 (28858)
---interaction T1 (2004) 0000 (-1279) -0098 (-127) 0000 (-1896) -0014 (-1896)
---interaction T2 (2009) -0001 (-2100) -0126 (-2100) 0000 (-8414) -0054 (-8414)
Household Size -0019 (-5556) -0097 (-5556) -0039 (-8497) -0179 (-8497)
Proportion of Adults in the household
0165 (4584) 0112 (4584) 0188 (4368) 0135 (4368)
Education Dummy Males
0056 (3204) 0029 (3204) 0086 (3825) 0060 (3825)
Education Dummy Females
0031 (167) 0010 (167) 0086 (4086) 0048 (4086)
Time Dummy (2004) 0299 (2175) 0115 (2175) 0161 (845) 0055 (845)
Time Dummy (2009) 0564 (3391) 0165 (3391) 0360 (1697) 0114 (1697)
Caste Dummy (SC) 0052 (174) 0009 (174) 0040 (764) 0005 (764)
Caste Dummy (Others) 0135 (5278) 0090 (5278) 0108 (2307) 0086 (2307)
Constant 3023 (21787)
3474 (17776)
and refer to significance at the 1 5 and 10 level respectively
State Dummies are omitted and details will be furnished on request Education Dummy If highest level of education is middle or lower then dummy = 0 else=1 Omitted Time period 1993 Omitted caste ST
20
Annexure 1 Distribution of Nutrient Intake (1993 ndash 2009)
The following tables show the distribution of nutrient intake (proportion of population in
each category) in rural and urban areas between 1993 and 2009 Figures in parenthesis
indicate the mean nutrient intake in each range
Table 1 Calorie Intake Distributions in Rural India 1993 2004 and 2009
Year Range of Calorie Intake Per Capita Per Day
Total lt1800 1801ndash2400 2401ndash3000 gt3000
1993 3109 (1491)
4007 (2084)
1942 (2650)
942 (3636)
100 (2156)
2004 3668
(1516)
4311
(2071)
1507
(2629)
514
(3925)
100
(2047)
2010 3528
(1531)
4591
(2071)
1492
(2622)
389
(3545)
100
(2020)
Table 2 Calorie Intake Distributions in Urban India 1993 2004 and 2009
Year
Range of Calorie Intake Per Capita Per Day
Total lt1700 1701ndash2100 2101ndash2600 gt2600
1993 2812
(1426)
2962
(1900)
2576
(2320)
1649
(3107)
100
(2074)
2004 2940
(1440)
3452
(1900)
2467
(2313)
1141
(3252)
100
(2021)
2010 3010
(1456)
3534
(1896)
2436
(2312)
1019
(3043)
100
(1982)
Table 3 Protein Intake Distributions in Rural India 1993 2004 and 2009
Year Range of Protein Intake Per Capita Per Day (Gms)
Total lt45 46ndash60 61ndash75 gt75
1993 2381
(371)
3379
(524)
2279
(668)
1961
(944)
100
(603)
2004 2881
(374)
3805
(522)
2146
(663)
1168
(939)
100
(558)
2010 2935
(380)
4081
(521)
2105
(661)
879
(892)
100
(541)
21
Table 4 Protein Intake Distributions in Urban India 1993 2004 and 2009
Year Range of Protein Intake Per Capita Per Day (Gms)
Total lt45 46ndash60 61ndash75 gt75
1993 2490
(371)
3777
(524)
2311
(665)
1423
(907)
100
(573)
2004 2940
(378)
3450
(523)
2469
(662)
1140
(949)
100
(554)
2010 2944
(383)
4366
(521)
1961
(661)
729
(876)
100
(534)
Table 5 Fat Intake Distributions in Rural India 1993 2004 and 2009
Year Range of Fat Intake Per Capita Per Day (Gms)
Total lt20 21ndash30 31ndash50 gt50
1993 3430
(140)
2508
(247)
2609
(383)
1454
(721)
100
(315)
2004 2259
(150)
2721
(249)
3358
(383)
1662
(746)
100
(354)
2010 1420
(154)
2405
(251)
4049
(388)
2125
(672)
100
(382)
Table 6 Fat Intake Distributions in Urban India 1993 2004 and 2009
Year Range of Fat Intake Per Capita Per Day (Gms)
Total lt25 26ndash40 41ndash60 gt60
1993 2504
(182)
2984
(323)
2615
(486)
1897
(802)
100
(421)
2004 1539
(194)
3102
(326)
3156
(489)
2204
(858)
100
(474)
2010 1032
(198)
2788
(330)
3661
(490)
2519
(781)
100
(489)
Source Authorsrsquo calculations based on the 50th 61
st and 66
th rounds of the NSS
22
Annexure 2 Distribution of Nutrient Intake by Food Commodities (1993 -2009)
The following tables show the distribution of nutrient (calorie protein and fat) intake from
nine food commodity groups for rural and urban areas between 1993 and 2009
Table 1 Mean Per Capita Calorie Intake by Food Commodities 1993 2004 and 2009
Year Cereals Milk
Products GheeButter
Vanaspati-Oil
Sugar Eggs MeatFish Poultry
PulsesNuts Dry Fruits
Fruits Vegetables Total
Rural India
1993-94 1530 137 111 103 2 12 151 20 89 2156
Share 710 64 51 48 01 06 70 09 41
2004-05 1383 137 145 98 3 12 156 23 90 2047
Share 676 67 71 48 01 06 76 11 44
2009-10 1296 141 169 93 3 12 84 20 83 2020
Share 642 70 84 46 01 06 42 10 41
Urban India
1993-94 1213 181 168 129 5 16 231 37 94 2074
Share 585 87 81 62 02 08 111 18 45
2004-05 1133 189 199 115 6 16 235 36 92 2021
Share 561 94 98 57 03 08 116 18 46
2009-
10 1071 199 217 110 5 14 106 33 83 1982
Share 540 100 109 55 03 07 53 17 42
Table 2 Mean Per Capita Protein Intake by Food Commodities 1993 2004 and 2009
Year Cereals Milk
Products GheeButter
Vanaspati-Oil
Sugar Eggs MeatFish Poultry
PulsesNuts Dry Fruits
Fruits Vegetables Total
Rural India
1993-94 418 53 0 0 02 2 78 02 29 603
Share 693 88 00 00 03 33 129 03 48
2004-05 379 53 0 0 03 2 73 03 28 558
Share 679 95 00 00 05 36 131 05 50
2009-10 356 55 0 0 03 2 53 02 25 541
Share 658 102 00 00 06 37 98 04 46
Urban India
1993-94 341 67 0 0 04 26 10 04 31 573
Share 595 117 00 00 07 45 175 07 54
2004-05 32 7 0 0 05 27 98 04 31 554
Share 578 126 00 00 09 49 177 07 56
2009-
10 302 74 0 0 04 26 65 04 27 534
Share 566 139 00 00 07 49 122 07 51
23
Table 3 Mean Per Capita Fat Intake by Food Commodities 1993 2004 and 2009
Year Cereals Milk
Products GheeButter
Vanaspati-Oil
Sugar Eggs MeatFish Poultry
PulsesNuts Dry Fruits
Fruits Vegetables Total
Rural India
1993-94 54 97 123 0 02 03 24 07 04 315
Share 171 308 390 00 06 10 76 22 13
2004-05 48 97 162 0 03 02 31 08 04 354
Share 136 274 458 00 08 06 88 23 11
2009-10 43 10 187 0 03 02 11 08 03 382
Share 113 262 490 00 08 05 29 21 08
Urban India
1993-94 4 132 186 0 04 04 4 11 04 421
Share 95 314 442 00 10 10 95 26 10
2004-05 37 138 221 0 05 03 56 11 04 475
Share 78 291 465 00 11 06 118 23 08
2009-
10 35 145 241 0 04 02 15 11 04 489
Share 72 297 493 00 08 04 31 22 08
Source Authorsrsquo calculations based on the 50th 61
st and 66
th rounds of the NSS
24
References
Behrman J and A Deolalikar (1989) ldquoIs Variety the Spice of life Implications for Calorie
Intakerdquo Review of Economics and Statistics vol 71
Deaton A (1995) The Analysis of Household Surveys A Microeconomic approach to
Development Policy Baltimore MD The Johns Hopkins University Press
Deaton A and J Dreze (2009) lsquoFood and Nutrition in India Facts and Interpretationsrsquo
Economic and Political Weekly XLIV(7) 42ndash65
Gaiha R R Jha and Vani S Kulkarni (2012) ldquoDemand for Nutrients in India 1993 to
2004rdquo Applied Economics available online 1 February 2012
Gopalan C B Sastri and S Balasubramanian (1971) Nutritive Value of Indian Foods
National institute of Nutrition Indian Council of Medical Research Hyderabad
Indian Council of Medical Research (ICMR 1990) Nutrient Requirements and
Recommended Dietary Allowances for Indians New Delhi ICMR
Jha R R Gaiha and A Sharma (2009) ldquo Modelling Variety in Consumption Expenditure on
Food in Indiardquo International Review of Applied Economics online publication 1
July 2009
Srinivasan TN (1992) lsquoUndernutrition Concepts Measurements and Policy Implicationsrsquo
in SR Osmani (ed) Nutrition and Poverty Clarendon Press Oxford pp 97ndash120
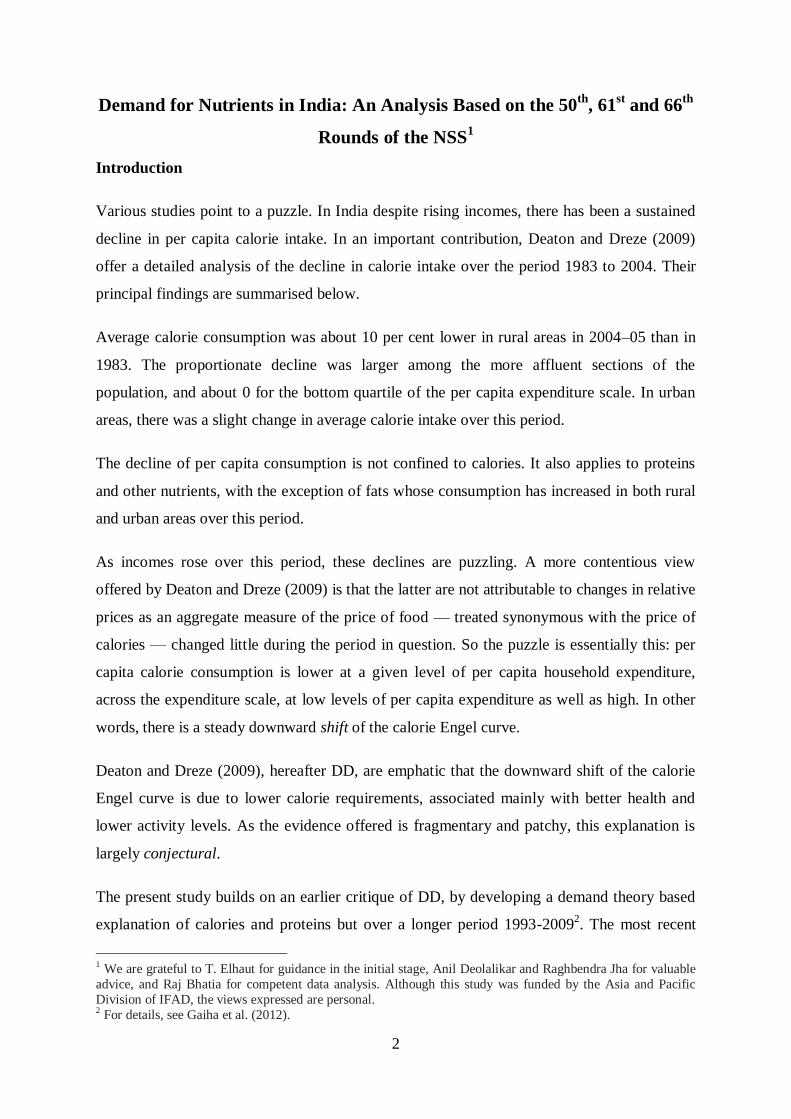
2
Demand for Nutrients in India An Analysis Based on the 50th
61st and 66
th
Rounds of the NSS1
Introduction
Various studies point to a puzzle In India despite rising incomes there has been a sustained
decline in per capita calorie intake In an important contribution Deaton and Dreze (2009)
offer a detailed analysis of the decline in calorie intake over the period 1983 to 2004 Their
principal findings are summarised below
Average calorie consumption was about 10 per cent lower in rural areas in 2004ndash05 than in
1983 The proportionate decline was larger among the more affluent sections of the
population and about 0 for the bottom quartile of the per capita expenditure scale In urban
areas there was a slight change in average calorie intake over this period
The decline of per capita consumption is not confined to calories It also applies to proteins
and other nutrients with the exception of fats whose consumption has increased in both rural
and urban areas over this period
As incomes rose over this period these declines are puzzling A more contentious view
offered by Deaton and Dreze (2009) is that the latter are not attributable to changes in relative
prices as an aggregate measure of the price of food mdash treated synonymous with the price of
calories mdash changed little during the period in question So the puzzle is essentially this per
capita calorie consumption is lower at a given level of per capita household expenditure
across the expenditure scale at low levels of per capita expenditure as well as high In other
words there is a steady downward shift of the calorie Engel curve
Deaton and Dreze (2009) hereafter DD are emphatic that the downward shift of the calorie
Engel curve is due to lower calorie requirements associated mainly with better health and
lower activity levels As the evidence offered is fragmentary and patchy this explanation is
largely conjectural
The present study builds on an earlier critique of DD by developing a demand theory based
explanation of calories and proteins but over a longer period 1993-20092 The most recent
1 We are grateful to T Elhaut for guidance in the initial stage Anil Deolalikar and Raghbendra Jha for valuable
advice and Raj Bhatia for competent data analysis Although this study was funded by the Asia and Pacific
Division of IFAD the views expressed are personal 2 For details see Gaiha et al (2012)
3
round (66th round corresponding to the year 2009-10) of the National Sample Survey (NSS)
provides new insights on the consumption and expenditure behaviour of households This
round throws new light on the trends in nutrient intake in the past two decades The analysis
is based mostly on unit record data collected for the 50th 61
st and 66
th rounds of the NSS
(corresponding to 1993ndash94 2004ndash05 and 2009-10 respectively)
11 Nutrient Intakes
Calories
In rural areas the mean calorie intake reduced from 2156 in 1993 to 2047 in 2004 a decline
of about 5 per cent The reduction in calorie intake was slower between 2004 and 2009 ndash only
1 per cent In urban areas the mean calorie intake reduced from 2074 in 1993 to 2021 in 2004
and 1982 in 2009 ie a 3 per cent decline in the first period and a 2 per cent decline in the
second
Until recently a calorie intake of 2400 per day was considered adequate for a typical adult
engaged in physically strenuous work of a certain duration in rural India More recent
Fig 1 Calorie Distribution in Rural India
Fig 2 Calorie Distribution in Urban India
31 37 35
40
43 46
19 15 15
9 5 4
0
20
40
60
80
100
1993-94 2004-05 2009-10
Pro
po
rtio
n o
f P
op
ula
tio
n (
)
Calorie Intake Distribution Rural India
lt1800 1801ndash2400 2401ndash3000 gt3000 calories
28 29 30
30 35 35
26 25 24
16 11 10
0
20
40
60
80
100
1993-94 2004-05 2009-10
Pro
po
rtio
n o
f P
op
ula
tio
n (
)
Calorie Intake Distribution Urban India
lt1700 1701ndash2100 2101ndash2600 gt2600 calories
4
assessments have used lower calorie lsquorequirementsrsquo (1800 calories)3 Figures 1 amp 2 show the
distribution of calories in rural and urban India between 1993 and 2009 Detailed tables
containing the mean calorie intakes are given in the annexure
Using the higher calorie requirement of 2400 over 71 of the rural households were calorie
deprived or more generally undernourished in 19934 With the lower norm of 1800 this
proportion falls sharply to about 31 implying a large concentration of households in the
calorie intake range of 1800ndash2400 The proportion of undernourished rises from 71 to
nearly 80 in 2004 and 2009 The proportion below the lower cut-off rose from about 31
in 1993 to close to 37 in 2004 indicating high levels of calorie deprivation It declined only
marginally between 2004 and 2009 The mean calorie intake reduced from 2156 in 1993 to
2047 in 2004 to 2020 in 2009
In urban India assuming lower calorie norms of 1700 and 2100 (given less strenuous
physical activity in urban areas) about 28 consumed less than 1700 calories in 1993
About 58 were below the higher calorie norm of 2100 Worse this proportion rose to about
64 in 2004 The proportion of people below the lower cut-off changed only slightly The
proportion of people below the lower and the higher calorie norm changed only slightly
between 2004 and 2009 While the mean calorie intake (overall) decreased between 2004 and
2009 it increased for those below the lower calorie norm Although less alarming than the
calorie deprivation increase in rural India it is nevertheless worrying
DD drew attention to the downward shift in the calorie Engel curve over the period 1983ndash
2004 We find that for the period 1993-2009 the calorie Engel curves for rural India display a
downward shift-especially above extremely low levels of monthly per capita expenditure
(MPCE) at 2004 prices (Figures 3 and 4) The proportionate reduction in calorie intake is
much higher at higher MPCE The calorie Engel curve in urban India for 2004 lies above
1993 at lower levels of MPCE At MPCE gtRs 500 calorie intake was higher in 1993 than in
2004 The proportionate reduction in calorie intake at higher MPCE was larger Similarly the
calorie Engel curve for 2009 lies above that for 2004 at lower levels and the crossover occurs
3 Srinivasan (1992 ) is deeply sceptical of such requirements on the ground that energy expenditure adjusts to
intake within a range 4 Although calorie deprivation is an aspect of undernutrition we sometimes use them interchangeably for
expositional convenience
5
at MPCE of Rs 500 Thus there is evidence of a downward shift of the calorie Engel curve
in both rural and urban India especially at higher levels of MPCE
Fig 3 Calorie Engel Curve for Rural India
Fig 4 Calorie Engel Curve for Urban India
Protein
The mean protein intakes reduced from 603 gms in 1993 to 558 gms in 2004 ie by 7 per
cent The reduction was slower in the second period ndash by 3 per cent with mean intake of 541
gms in 2009 In urban areas the mean protein intake reduced from 573 gms in 1993 to 554
gms in 2004 and 534 gms in 2009 ie a reduction of about 3-4 per cent in both periods
To assess the proportion of people who are protein-deprived a cut-off of 60 (gms) of protein
Fig 5 Protein Intake Distribution in Rural India
Fig 6 Protein Intake Distribution in Urban India
24 29 29
34
38 41
23
21 21
20 12 9
0
10
20
30
40
50
60
70
80
90
100
1993-94 2004-05 2009-10
Pro
po
rtio
n o
f P
op
ula
tio
n (
)
Protein Intake Distribution Rural India
lt45 46ndash60 61ndash75 gt75 gms
25 29 29
38 35
44
23 25 20
14 11 7
0
10
20
30
40
50
60
70
80
90
100
1993-94 2004-05 2009-10
Pro
po
rtio
n o
f P
op
ula
tio
n (
)
Protein Intake Distribution Urban India
lt45 46ndash60 61ndash75 gt75 gms
6
intake is used5 Figures 5 and 6 show the distribution of protein in rural and urban India
between 1993 and 2010 Detailed tables containing the mean protein intakes are given in the
annexure
While protein deficiency is in large measure linked to calorie deficiency we note that well
over 57 of rural households consumed fewer than the required protein intake in 1993 Just
under a quarter of the households consumed lt45 (gms) of protein Within both ranges of
protein intake the proportions rose more than moderately (eg in the lower range the
proportion of households rose from about 24 in 1993 to about 29 in 2004 in the higher
range the proportion rose from 57 in 1993 to 66 in 2004 to 70 in 2009) Although the
mean intake of protein for households in the lower range remained unchanged it reduced
from 60 gms in 1993 to 56 gms in 2004 and 54 gms in 2009
The share of protein-deficient households in urban India (considering the 60 gm cut-off)
remained unchanged between 1993 and 2004 but increased substantially between 2004 and
2009 Overall mean protein intakes however reduced
Figures 7 and 8 report protein Engel curves for rural and urban India between 1993ndash2009
The ruralndashurban contrast in protein intake is striking In the rural areas protein intake was
consistently lower across expenditure classes in 2009 than in 2004 which in turn was lower
than in 1993 The gap between 1993 and 2004 intakes widens considerably at higher MPCE
Fig 7 Protein Engel Curves for Rural India
Fig 8 Protein Engel Curves for Urban India
5 For details see Gopalan et al (1971 1992) and ICMR (1990)
7
In urban areas the 2004 curve was above the 1993 curve at low levels of MPCE and after the
cross-over expenditure of about Rs 500 the former lay below the 1993 curve The 2009 curve
lies above the 2004 curve at lower levels of MPCE and below the 2004 curve at higher levels
Fats
Mean fat intake increased substantially between 1993-94 and 2004-05 In rural areas the
mean fat intake increased by 12 per cent from 315 gms in 1993 to 354 gms in 2004 In
urban areas the mean fat intake increased by 13 per cent from 421 gms in 1993 to 475 gms
in 2004 The increase in fat intakes in the second period ie 2004-05 and 2009-10 were more
moderate Mean fat intakes increased to 382 gms (increase of 8 per cent) in rural areas and
489 gms (increase of 3 per cent) in urban areas
Although a precise range for fat requirements cannot be specified a range of 40ndash60 (gms) of
fat intake is desirable6 Figures 9 and 10 show the distribution of fat in rural and urban India
between 1993 and 2009 Detailed tables containing the mean fat intakes are given in the
annexure
Fig 9 Fat Intake Distributions for Rural India
Fig 10 Fat Intake Distributions for Urban India
6 Gopalan et al (1971) observe lsquoThe quantity of fat that should be included in a well balanced diet is not known
with any degree of certainty However it appears desirable in the present state of knowledge that the daily
intake of fat should be such that it contributes no more than 15 to 20 of the calories in the diet A total of
about 40 to 60 gms of fat can therefore be safely consumed daily and in order to obtain the necessary amounts
of essential fatty acids the fat intake should include at least 15 gms of vegetable oilsrsquo (pg 8) Also see ICMR
(1990)
34 23
14
25
27
24
26 34
40
15 17 21
0
10
20
30
40
50
60
70
80
90
100
1993 2004 2010
Pro
po
rtio
n o
f P
op
ula
tio
n (
)
Fat Intake Distribution Rural India
lt20 21ndash30 31ndash50 gt50 gms
25 15 10
30
31 28
26 32
37
19 22 25
0
10
20
30
40
50
60
70
80
90
100
1993 2004 2010
Pro
po
rtio
n o
f P
op
ula
tio
n (
)
Fat Intake Distribution Urban India
lt25 26ndash40 41ndash60 gt60 gms
8
Even considering the first three ranges of fat intake an astonishingly high estimate for fat
deficient households for rural India (over 85) is obtained for 1993 Well over one-third of
households were under the lowest range of lt20 (gms) The corresponding household share
with fat intakes lt50 gms fell to over 83 in 2004 and 79 in 2009 The share of households
consuming lt20 gms of fat fell sharply (from over 34 in 1993 to well over 22 in 2004 and
14 in 2009) Mean fat intakes increased over the period 1993 to 2009
Using higher ranges of fat intake for urban areas fat deprivation was pervasive (about 81 of
the households consumed lt60 gms of fats in 1993) About a quarter consumed lt25 gms
Over the period 1993ndash2009 the reduction in the proportion of fat- deprived was slight (from
81 in 1993 to 78 in 2004 to 75 in 2009) However as in rural India the proportion
consuming fats lt25 gms fell sharply Mean fat intake increased
Figures 11 and 12 show the Engel curves for fat In rural areas the fat Engel curves for 1993
lay below that for 2004 at lower levels of MPCE The 2009 curve lies above the 2004 curve
at lower levels of MPCE The crossover is at approximately Rs650 In urban areas the
crossover is at Rs1000 The curves converge beyond this
Fig 11 Fat Engel Curves for Rural India
Fig 12 Fat Engel Curves for Urban India
Thus taking nutritional norms as valid the overall picture of nutritional deprivation
worsened considerably over the period 1993ndash2009 The following Kernel density functions
(figure 13) clearly show a leftward shift in calorie and protein intake distributions and a
rightward shift in the fat intake distribution in both rural and urban areas between 1993 and
20097
7 For an admirably clear exposition of kernel density functions see Deaton (1995)
9
Fig 13 Kernel Density Functions for Calories Proteins and Fats consumed ndash Rural and
Urban India (1993 ndash 2009)
12 Factors Underlying Changes in Diets and Nutrition
We build on the DD analysis (2009) of food commodities that contributed to reduction in
calories protein and increase in fat consumption
10
Figure 14 shows the distribution of calorie protein and fat intake by food commodities for
rural and urban areas between 1993 and 2009 Detailed tables containing mean per capita
intake of nutrients from the various food items are given in the annexure
In rural India calorie intakes declined between 1993 and 2009 Most of it is attributable to
the decline in calories from cereals and pulses to some extent Calories from cereals reduced
from 1530 in 1993 to 1383 in 2004 and 1296 in 2009 The contribution of milkmilk
products sugar fruits and vegetables remained largely unchanged between 1993 and 2009
The contribution of vanaspati oil to the calorie intake increased substantially Calories
obtained from oil increased from 111 in 1993 to 145 in 2004 and 169 in 2009
Similar results are found for urban areas as well The reduction in the contribution of pulses
to calorie intakes was more drastic in urban areas between 2004 and 2009
71
68
64
58
56
54
6
7
7
9
9
10
5
7
8
8
10
11
5
5
5
6
6
6
1
1
1
1
1
1
7
8
4
11
12
5
1
1
1
2
2
2
4
4
4
5
5
4
0 10 20 30 40 50 60 70 80 90 100
1993-94
2004-05
2009-10
1993-94
2004-05
2009-10
Fig 14 Calorie Intake by Food Commodities 1993 2004 and 2009
Cereals Milk Vanaspati-Oil Sugar Eggs amp Meats Pulses Fruits Vegetables
RU
RA
L U
RB
AN
11
In both rural and urban areas protein intake declined between 1993 and 2009 (Figure 15)
Much of it is reflected in a reduction in protein intake from cereals and pulses In rural areas
the protein intake from these commodities decreased from 50 gms in 1993 to 45 gms in 2004
and 40 gms in 2009 The corresponding numbers for urban areas are 44 gms (1993) 42 gms
(2004) and 37 gms (2009) Intake from dairy products (milk eggs and meats) increased
moderately Proteins from other sources are a very small fraction and largely remained
unchanged between 1993 and 2009
Between 1993-2009 fat intake rose in both rural and urban areas Vanaspati-oil has the
maximum share in total fat intakes and its contribution rose over the period 1993 and 2009
In rural areas fat intake from vanaspati-oil rose from 12 gms in 1993 to 16 gms in 2004 and
19 gms in 2009 In urban areas the share of vanaspati-oil rose from 19 gms in 1993 to 22
gms in 2004 and 24 gms in 2009 The other significant contributor to fat intake are cereals
pulses and milk products (including ghee and butter) but their contribution reduced between
1993 and 2009 Declining intake of fats from these commodities were more than offset by the
increased intake of fat from vanaspati-oil
69
68
66
60
58
57
9
9
10
12
13
14
4
5
5
6
6
6
13
13
10
17
18
12
5
6
5
6
7
6
0 10 20 30 40 50 60 70 80 90 100
1993-94
2004-05
2009-10
1993-94
2004-05
2009-10
Fig 15 Protein Intake by Food Commodities 1993 2004 and 2009
Cereals Milk Eggs amp Meats Pulses Fruits amp Vegetables
RU
RA
L U
RB
AN
12
13 Demand Theory Based Explanation of Changes in Nutrient Intake
In response to the DeatonndashDreze (2009) explanation of a downward shift in the calorie Engel
curve in terms of lower lsquorequirementsrsquo due to health improvements and less strenuous
activity levels and more sedentary life-styles we have developed an alternative explanation
of changes in the consumption of calories protein and fats over the period 1993ndash2009 This
explanation is embedded in a standard demand theory framework with food prices8 and
expenditure (as a proxy for income) cast in a pivotal role Based on different experiments
robust demand functions are estimated for each of the three nutrients viz calories protein and
fats (Tables 1-3) Our results show consistently robust food price and expenditure effects
thus raising further doubts about the adequacy of the DD explanation The analysis is based
8 An important point to bear in mind is that the price effects capture both own and cross-price effects through
substitutions between food commodities Briefly as prices change demands for commodities change and
consequently calorie (and other nutrientsrsquo) intakes Underlying this is a presumption that food choices are
informed by their nutritional content As Deaton and Dreze (2009) emphasise people do not buy calories and
other nutrients but food commodities However if food choices are informed by their nutritional values it is
meaningful to talk about demands for calories and other nutrients
17
14
11
10
8
7
31
27
26
31
29
30
39
46
49
44
47
49
2
1
1
2
2
1
8
9
3
10
12
3
4
3
3
4
3
3
0 10 20 30 40 50 60 70 80 90 100
1993-94
2004-05
2009-10
1993-94
2004-05
2009-10
Fig 16 Fat Intake by Food Commodities 1993 2004 and 2009
Cereals Milk Vanaspati-Oil Eggs amp Meats Pulses Fruits amp Vegetables
RU
RA
L U
RB
AN
13
on unit record data collected for the 50th
61st and 66
th rounds of the NSS (corresponding to
the years 1993ndash94 2004ndash05 and 2009-10 respectively) We will discuss separately the
results for rural and urban samples
(a) Demand Function
A basic demand equation for nutrients (calories protein fats) in rural and urban India with
pooled data for 1993 2004 and 2009 is given below
(1)
where the dependent variable is log of nutrient consumed by ith household in time t jtP is a
vector of food prices computed from the NSS at the village level (j) and time t E it is
household per capita expenditure for ith household in time t itX is a vector of household
characteristics (eg number of adult males females household size ) and a few others
specified as dummy variables (caste) D1t is a dummy variable that takes the value 1 for 2004
and 0 otherwise (to allow for changes in factors other than food prices and expenditure over
time) D2t+k is the second time dummy that takes the value 1 for 2009 and 0 otherwise and
it is the error term This equation is estimated using robust regression Although a Chow test
for a structural shift is not feasible with robust regression we have employed two
refinements one is the use of a time dummy that could potentially capture the health
improvements and less strenuous activity patterns (associated with easier access to drinking
water better transportation facilities) and the other is interactions of food price variables
with the time dummy to allow for different price and expenditure effects over time9
An important point to bear in mind is that the price effects capture both own and cross-price
effects through substitutions between food commodities Briefly as prices change demands
for commodities change and consequently for example calorie (and other nutrientsrsquo) intakes
9 While these effects yield insights into changing consumer demands a more detailed analysis along the lines of
Behrman and Deolalikar (1989) and Jha et al (2009) would further deepen our understanding consumer
preferences and tastes for variety
14
(b) Results
We first consider the calorie demand function For both rural and urban areas each of the
price effects has a significant negative coefficient with the exception of price of fruits and
vegetables whose coefficient in not significant Moreover the price effects on the demand for
calories have in many cases weakened as captured by the coefficients of the interaction term
(ie interaction between the price and the time dummies) A case in point is price of cereals
and pulses Rising incomes have a positive impact on calorie demand and so does the
proportion of adults in the household The former effect however weakened over time As
household size increases calorie demand decreases Education of adult female has a negative
impact on calorie demand as this may be attributed to consumption of a more balanced diet
rich in protein and vitamins and reduced dependence on cereals which is a major source of
calories By contrast education of adult male is not significant in rural areas but positive in
urban areas SCs have lower demands for calories in both rural and urban areas while that of
Others is positive in rural areas and negative in urban areas relative to STs The effect of time
alone is reduced consumption of calorie between 1993 and 2004 However somewhat
surprisingly the residual time effect is not significant between 2004-09 That this undermines
the DD explanation emphasising lower calorie requirements due to improvements in the
epidemiology of the disease environment less strenuous physical activities and more
sedentary life styles cannot be ruled out
In case of protein demand in both rural and urban areas there is a positive influence of the
price of fruits and vegetables whereas the elasticity of protein demand with respect to all
other food prices is negative As in the case of calorie demand several price effects
weakened over over time as captured by the interaction term (between food prices and the
time dummies) A case in point is price of milk and milk products eggs and meats Higher
incomeexpenditure increase protein demand but less so over time Increasing household size
reduces protein demand whereas rising proportion of adults in the household increases it
The impact of education of adult female is negative and that of education of adult male is
not significant SCs have lower demand for protein while Others have higher demand relative
to STs The residual effect of time after accounting for the interaction is significant with a
negative coefficient suggesting a lower demand for protein in 2009 and 2004 as compared to
1993
15
In case of fats too in both rural and urban areas there are significant price and expenditure
effects ndash positive in the case of price of cereals oil and fruits and vegetables and negative in
case of milk products and sugar The positive price elasticity of fats with respect to edible oil
price is somewhat surprising although the price effect has weakened over time MPCE has
positive Unlike in the case of calorie and protein highest education of adult female has a
positive impact on fat demand suggesting that households with females having higher than
middle level of education tend to eat diets rich in fats shifting away from diets rich in
calories and proteins Moreover highest education of adult male also has a positive and
significant effect As in the case of calorie and protein household size has a negative impact
and proportion of adults in a household has a positive impact on demand for fats SCs and
Others have higher demands relative to STs The effect of time alone is to increase the fat
demand in 2009 and 2004 as compared to 1993
2 Concluding Observations
The main findings of our analysis are summarised below from a policy perspective
An important insight from the comparison of three rounds of the NSS over the period 1993-
2009 points to a slowing down of the reduction in the calorie intake in both rural and urban
areas in 2004-09 relative to 1993-2004 A similar slowing down occurred in protein intake
over the more recent period (2004-09) While fat intake continued to rise over this period but
at a lower rate
A demand theory based explanation of changes in demands for these nutrients reaffirmed the
important roles of food price and expenditure changes A new insight however is that in
several cases food price effects weakened over time as also expenditure effects While the
residual time effect weakened for both calories and protein over the period 1993-2004 it
slowed down over the more recent period The effect of time on fat demand was however
positive and strengthened over the more recent period Altogether thus the DD explanation of
lower calorie and protein demands over time as a result of lower requirements is further
undermined
From a policy perspective the important roles of food price stabilisation and expansion of
livelihood opportunities remain key to ameliorating nutritional deprivation despite lowering
of nutritional requirements A closer scrutiny of dietary preferences and tastes is crucial for
16
both understanding sources of nutritional deprivation and for designing effective policies for
mitigating it
17
Table 1 Robust Regression Estimates Demand for Calories 1993-2009
RURAL URBAN
Dependent Variable Log of Per capita consumption
of calories
No of Obs = 193785 No of Obs = 124481
F(60193724) = 1192631 F(60124420) = 370511
Prob gt F = 0 Prob gt F = 0
Coefficient Elasticity Coefficient Elasticity
Price Cereals amp Pulses -0012 (-2524) -0166 (-2524) -0006 (-102) -0090 (-102)
---interaction T1 (2004) 0011 (2072) 0049 (2072) 0001 (096) - 0003 (096) -
---interaction T2 (2009) 0010 (2005) 0071 (2005) 0004 (699) 0037 (699)
Price Milk Milk Products Eggs amp Meats
-0003 (-6421) -0098 (-6421) -0001 (-1253) -0035 (-1253)
---interaction T1 (2004) 0002 (4288) 0026 (4288) 0000 (329) 0003 (329)
---interaction T2 (2009) 0002 (4983) 0040 (4983) 0001 (904) 0013 (904)
Price Oil -0008 (-2667) -0086 (-2667) -0004 (-101) -0048 (-101)
---interaction T1 (2004) 0004 (1175) 0015 (1175) 0001 (189) 0003 (189)
---interaction T2 (2009) 0006 (1934) 0031 (1934) 0004 (994) 0024 (994)
Price Sugar -0002 (-127) -0124 (-127) -0004 (-1209) -0183 (-1209)
---interaction T1 (2004) 0002 (1136) 0050 (1136) 0003 (1029) 0061 (1029)
---interaction T2 (2009) 0001 (704) 0027 (704) 0002 (516) 0033 (516)
Price Fruits amp Vegetables
-0001 (-116) - -0010 (-116) - 0001 (194) 0026 (194)
---interaction T1 (2004) 0001 (275) 0010 (275) 0000 (026) - 0001 (026) -
---interaction T2 (2009) -0001 (-174) -0007 (-174) -0003 (-392) -0027 (-392)
Monthly per capita expenditure
0001 (40195) 0418 (40195) 0000 (22549) 0240 (22549)
---interaction T1 (2004) 0000 (-1160) -0054 (-1160) 0000 (-2386) -0011 (-2386)
---interaction T2 (2009) 0000 (-1712) -0063 (-1712) 0000 (-5097) -0022 (-5097)
Household Size -0006 (-3076) -0033 (-3076) -0021 (-684) -0096 (-684)
Proportion of Adults in the household
0202 (9139) 0137 (9139) 0235 (8183) 0169 (8183)
Education Dummy Males 0000 (-023) - 0000 (-023) - 0012 (805) 0008 (805)
Education Dummy Females
-0025 (-215) -0008 (-215) -0013 (-952) -0007 (-952)
Time Dummy (2004) -0159 (-1893) -0061 (-1893) -0105 (-829) -0036 (-829)
Time Dummy (2009) -0007 (-069) - -0002 (-069) - 0006 (045) - 0002 (045) -
Caste Dummy (SC) -0011 (-586) -0002 (-586) -0017 (-498) -0002 (-498)
Caste Dummy (Others) 0010 (616) 0006 (616) -0005 (-177) -0004 (-177)
Constant 7569 (89023)
7712 (59282)
and refer to significance at the 1 5 and 10 level respectively
State Dummies are omitted and details will be furnished on request Education Dummy If highest level of education is middle or lower then dummy = 0 else=1 Omitted Time period 1993 Omitted caste ST
18
Table 2 Robust Regression Estimates Demand for Protein 1993-2009
RURAL URBAN
Dependent Variable
Log of Per capita consumption of protein
No of Obs = 193784 No of Obs = 124481
F(60193723) = 1144586 F(60124420) = 391491
Prob gt F = 0 Prob gt F = 0
Coefficient Elasticity Coefficient Elasticity
Price Cereals amp Pulses -0013 (-2392) -0169 (-2392) -0009 (-1508) -0144 (-1508)
---interaction T1 (2004) 0013 (2153) 0055 (2153) 0005 (662) 0019 (662)
---interaction T2 (2009) 0012 (2187) 0084 (2187) 0009 (1386) 0079 (1386)
Price Milk Milk Products Eggs amp Meats
-0003 (-7497) -0123 (-7497) 0000 (-373) -0011 (-373)
---interaction T1 (2004) 0002 (4993) 0032 (4993) 0000 (-196) -0002 (-196)
---interaction T2 (2009) 0003 (5815) 0050 (5815) 0000 (264) 0004 (264)
Price Oil -0010 (-3216) -0112 (-3216) -0007 (-1709) -0088 (-1709)
---interaction T1 (2004) 0005 (1623) 0022 (1623) 0003 (658) 0012 (658)
---interaction T2 (2009) 0007 (2218) 0038 (2218) 0006 (1562) 0041 (1562)
Price Sugar -0002 (-1085) -0114 (-1085) -0003 (-844) -0139 (-844)
---interaction T1 (2004) 0002 (941) 0045 (941) 0001 (337) 0022 (337)
---interaction T2 (2009) 0001 (249) 0010 (249) 0000 (082) - 0006 (082) -
Price Fruits amp Vegetables
0002 (42) 0040 (42) 0002 (244) 0036 (244)
---interaction T1 (2004) 0000 (084) - 0003 (084) - -0001 (-081) - -0004 (-081) -
---interaction T2 (2009) -0003 (-652) -0030 (-652) -0003 (-366) -0027 (-366)
Monthly per capita expenditure
0001 (39184) 0438 (39184) 0000 (21912) 0254 (21912)
---interaction T1 (2004) 0000 (-1004) -0051 (-1004) 0000 (-1527) -0008 (-1527)
---interaction T2 (2009) 0000 (-1389) -0058 (-1389) 0000 (-3705) -0017 (-3705)
Household Size -0005 (-2368) -0027 (-2368) -0018 (-5526) -0084 (-5526)
Proportion of Adults in the household
0198 (8293) 0134 (8293) 0226 (7247) 0163 (7247)
Education Dummy
Males 0001 (116) - 0001 (116) - 0012 (743) 0008 (743)
Education Dummy Females
-0025 (-2031) -0008 (-2031) -0014 (-947) -0008 (-947)
Time Dummy (2004) -0210 (-2315) -0081 (-2315) -0050 (-36) -0017 (-36)
Time Dummy (2009) -0031 (-284) -0009 (-284) -0047 (-307) -0015 (-307)
Caste Dummy (SC) -0007 (-364) -0001 (-364) -0007 (-187) -0001 (-187)
Caste Dummy (Others) 0011 (623) 0007 (623) 0005 (143) - 0004 (143) -
Constant 3952 (43144)
4101 (28987)
and refer to significance at the 1 5 and 10 level respectively
State Dummies are omitted and details will be furnished on request Education Dummy If highest level of education is middle or lower then dummy = 0 else=1 Omitted Time period 1993 Omitted caste ST
19
Table 3 Robust Regression Estimates Demand for Fats 1993- 2009
RURAL URBAN
Dependent Variable Log of Per capita
consumption of Fats
No of Obs = 193784 No of Obs = 124481
F(60193723) = 1895778 F(60124420) = 766201
Prob gt F = 0 Prob gt F = 0
Coefficient Elasticity Coefficient Elasticity
Price Cereals amp Pulses 0016 (2033) 0218 (2033) 0012 (1462) 0193 (1462)
---interaction T1 (2004) -0005 (-598) -0023 (-598) -0008 (-871) -0035 (-871)
---interaction T2 (2009) -0009 (-1067) -0062 (-1067) -0006 (-661) -0052 (-661)
Price Milk Milk Products Eggs amp Meats
-0013 (-1924) -0478 (-1924) -0009 (-7698) -0327 (-7698)
---interaction T1 (2004) 0008 (10509) 0106 (10509) 0005 (3537) 0056 (3537)
---interaction T2 (2009) 0010 (13313) 0172 (13313) 0007 (5587) 0121 (5587)
Price Oil 0002 (445) 0023 (445) 0007 (1364) 0097 (1364)
---interaction T1 (2004) -0001 (-251) -0005 (-251) -0003 (-571) -0014 (-571)
---interaction T2 (2009) -0002 (-429) -0011 (-429) -0004 (-801) -0029 (-801)
Price Sugar -0004 (-1365) -0217 (-1365) -0003 (-75) -0170 (-75)
---interaction T1 (2004) 0001 (306) 0022 (306) 0001 (123) - 0011 (123) -
---interaction T2 (2009) -0001 (-169) -0011 (-169) -0002 (-42) -0040 (-42)
Price Fruits amp Vegetables
0011 (1418) 0206 (1418) 0006 (615) 0125 (615)
---interaction T1 (2004) -0010 (-1227) -0070 (-1227) -0006 (-556) -0037 (-556)
---interaction T2 (2009) -0011 (-1392) -0097 (-1392) -0008 (-74) -0076 (-74)
Monthly per capita expenditure
0001 (44365) 0753 (44365) 0000 (28858) 0462 (28858)
---interaction T1 (2004) 0000 (-1279) -0098 (-127) 0000 (-1896) -0014 (-1896)
---interaction T2 (2009) -0001 (-2100) -0126 (-2100) 0000 (-8414) -0054 (-8414)
Household Size -0019 (-5556) -0097 (-5556) -0039 (-8497) -0179 (-8497)
Proportion of Adults in the household
0165 (4584) 0112 (4584) 0188 (4368) 0135 (4368)
Education Dummy Males
0056 (3204) 0029 (3204) 0086 (3825) 0060 (3825)
Education Dummy Females
0031 (167) 0010 (167) 0086 (4086) 0048 (4086)
Time Dummy (2004) 0299 (2175) 0115 (2175) 0161 (845) 0055 (845)
Time Dummy (2009) 0564 (3391) 0165 (3391) 0360 (1697) 0114 (1697)
Caste Dummy (SC) 0052 (174) 0009 (174) 0040 (764) 0005 (764)
Caste Dummy (Others) 0135 (5278) 0090 (5278) 0108 (2307) 0086 (2307)
Constant 3023 (21787)
3474 (17776)
and refer to significance at the 1 5 and 10 level respectively
State Dummies are omitted and details will be furnished on request Education Dummy If highest level of education is middle or lower then dummy = 0 else=1 Omitted Time period 1993 Omitted caste ST
20
Annexure 1 Distribution of Nutrient Intake (1993 ndash 2009)
The following tables show the distribution of nutrient intake (proportion of population in
each category) in rural and urban areas between 1993 and 2009 Figures in parenthesis
indicate the mean nutrient intake in each range
Table 1 Calorie Intake Distributions in Rural India 1993 2004 and 2009
Year Range of Calorie Intake Per Capita Per Day
Total lt1800 1801ndash2400 2401ndash3000 gt3000
1993 3109 (1491)
4007 (2084)
1942 (2650)
942 (3636)
100 (2156)
2004 3668
(1516)
4311
(2071)
1507
(2629)
514
(3925)
100
(2047)
2010 3528
(1531)
4591
(2071)
1492
(2622)
389
(3545)
100
(2020)
Table 2 Calorie Intake Distributions in Urban India 1993 2004 and 2009
Year
Range of Calorie Intake Per Capita Per Day
Total lt1700 1701ndash2100 2101ndash2600 gt2600
1993 2812
(1426)
2962
(1900)
2576
(2320)
1649
(3107)
100
(2074)
2004 2940
(1440)
3452
(1900)
2467
(2313)
1141
(3252)
100
(2021)
2010 3010
(1456)
3534
(1896)
2436
(2312)
1019
(3043)
100
(1982)
Table 3 Protein Intake Distributions in Rural India 1993 2004 and 2009
Year Range of Protein Intake Per Capita Per Day (Gms)
Total lt45 46ndash60 61ndash75 gt75
1993 2381
(371)
3379
(524)
2279
(668)
1961
(944)
100
(603)
2004 2881
(374)
3805
(522)
2146
(663)
1168
(939)
100
(558)
2010 2935
(380)
4081
(521)
2105
(661)
879
(892)
100
(541)
21
Table 4 Protein Intake Distributions in Urban India 1993 2004 and 2009
Year Range of Protein Intake Per Capita Per Day (Gms)
Total lt45 46ndash60 61ndash75 gt75
1993 2490
(371)
3777
(524)
2311
(665)
1423
(907)
100
(573)
2004 2940
(378)
3450
(523)
2469
(662)
1140
(949)
100
(554)
2010 2944
(383)
4366
(521)
1961
(661)
729
(876)
100
(534)
Table 5 Fat Intake Distributions in Rural India 1993 2004 and 2009
Year Range of Fat Intake Per Capita Per Day (Gms)
Total lt20 21ndash30 31ndash50 gt50
1993 3430
(140)
2508
(247)
2609
(383)
1454
(721)
100
(315)
2004 2259
(150)
2721
(249)
3358
(383)
1662
(746)
100
(354)
2010 1420
(154)
2405
(251)
4049
(388)
2125
(672)
100
(382)
Table 6 Fat Intake Distributions in Urban India 1993 2004 and 2009
Year Range of Fat Intake Per Capita Per Day (Gms)
Total lt25 26ndash40 41ndash60 gt60
1993 2504
(182)
2984
(323)
2615
(486)
1897
(802)
100
(421)
2004 1539
(194)
3102
(326)
3156
(489)
2204
(858)
100
(474)
2010 1032
(198)
2788
(330)
3661
(490)
2519
(781)
100
(489)
Source Authorsrsquo calculations based on the 50th 61
st and 66
th rounds of the NSS
22
Annexure 2 Distribution of Nutrient Intake by Food Commodities (1993 -2009)
The following tables show the distribution of nutrient (calorie protein and fat) intake from
nine food commodity groups for rural and urban areas between 1993 and 2009
Table 1 Mean Per Capita Calorie Intake by Food Commodities 1993 2004 and 2009
Year Cereals Milk
Products GheeButter
Vanaspati-Oil
Sugar Eggs MeatFish Poultry
PulsesNuts Dry Fruits
Fruits Vegetables Total
Rural India
1993-94 1530 137 111 103 2 12 151 20 89 2156
Share 710 64 51 48 01 06 70 09 41
2004-05 1383 137 145 98 3 12 156 23 90 2047
Share 676 67 71 48 01 06 76 11 44
2009-10 1296 141 169 93 3 12 84 20 83 2020
Share 642 70 84 46 01 06 42 10 41
Urban India
1993-94 1213 181 168 129 5 16 231 37 94 2074
Share 585 87 81 62 02 08 111 18 45
2004-05 1133 189 199 115 6 16 235 36 92 2021
Share 561 94 98 57 03 08 116 18 46
2009-
10 1071 199 217 110 5 14 106 33 83 1982
Share 540 100 109 55 03 07 53 17 42
Table 2 Mean Per Capita Protein Intake by Food Commodities 1993 2004 and 2009
Year Cereals Milk
Products GheeButter
Vanaspati-Oil
Sugar Eggs MeatFish Poultry
PulsesNuts Dry Fruits
Fruits Vegetables Total
Rural India
1993-94 418 53 0 0 02 2 78 02 29 603
Share 693 88 00 00 03 33 129 03 48
2004-05 379 53 0 0 03 2 73 03 28 558
Share 679 95 00 00 05 36 131 05 50
2009-10 356 55 0 0 03 2 53 02 25 541
Share 658 102 00 00 06 37 98 04 46
Urban India
1993-94 341 67 0 0 04 26 10 04 31 573
Share 595 117 00 00 07 45 175 07 54
2004-05 32 7 0 0 05 27 98 04 31 554
Share 578 126 00 00 09 49 177 07 56
2009-
10 302 74 0 0 04 26 65 04 27 534
Share 566 139 00 00 07 49 122 07 51
23
Table 3 Mean Per Capita Fat Intake by Food Commodities 1993 2004 and 2009
Year Cereals Milk
Products GheeButter
Vanaspati-Oil
Sugar Eggs MeatFish Poultry
PulsesNuts Dry Fruits
Fruits Vegetables Total
Rural India
1993-94 54 97 123 0 02 03 24 07 04 315
Share 171 308 390 00 06 10 76 22 13
2004-05 48 97 162 0 03 02 31 08 04 354
Share 136 274 458 00 08 06 88 23 11
2009-10 43 10 187 0 03 02 11 08 03 382
Share 113 262 490 00 08 05 29 21 08
Urban India
1993-94 4 132 186 0 04 04 4 11 04 421
Share 95 314 442 00 10 10 95 26 10
2004-05 37 138 221 0 05 03 56 11 04 475
Share 78 291 465 00 11 06 118 23 08
2009-
10 35 145 241 0 04 02 15 11 04 489
Share 72 297 493 00 08 04 31 22 08
Source Authorsrsquo calculations based on the 50th 61
st and 66
th rounds of the NSS
24
References
Behrman J and A Deolalikar (1989) ldquoIs Variety the Spice of life Implications for Calorie
Intakerdquo Review of Economics and Statistics vol 71
Deaton A (1995) The Analysis of Household Surveys A Microeconomic approach to
Development Policy Baltimore MD The Johns Hopkins University Press
Deaton A and J Dreze (2009) lsquoFood and Nutrition in India Facts and Interpretationsrsquo
Economic and Political Weekly XLIV(7) 42ndash65
Gaiha R R Jha and Vani S Kulkarni (2012) ldquoDemand for Nutrients in India 1993 to
2004rdquo Applied Economics available online 1 February 2012
Gopalan C B Sastri and S Balasubramanian (1971) Nutritive Value of Indian Foods
National institute of Nutrition Indian Council of Medical Research Hyderabad
Indian Council of Medical Research (ICMR 1990) Nutrient Requirements and
Recommended Dietary Allowances for Indians New Delhi ICMR
Jha R R Gaiha and A Sharma (2009) ldquo Modelling Variety in Consumption Expenditure on
Food in Indiardquo International Review of Applied Economics online publication 1
July 2009
Srinivasan TN (1992) lsquoUndernutrition Concepts Measurements and Policy Implicationsrsquo
in SR Osmani (ed) Nutrition and Poverty Clarendon Press Oxford pp 97ndash120
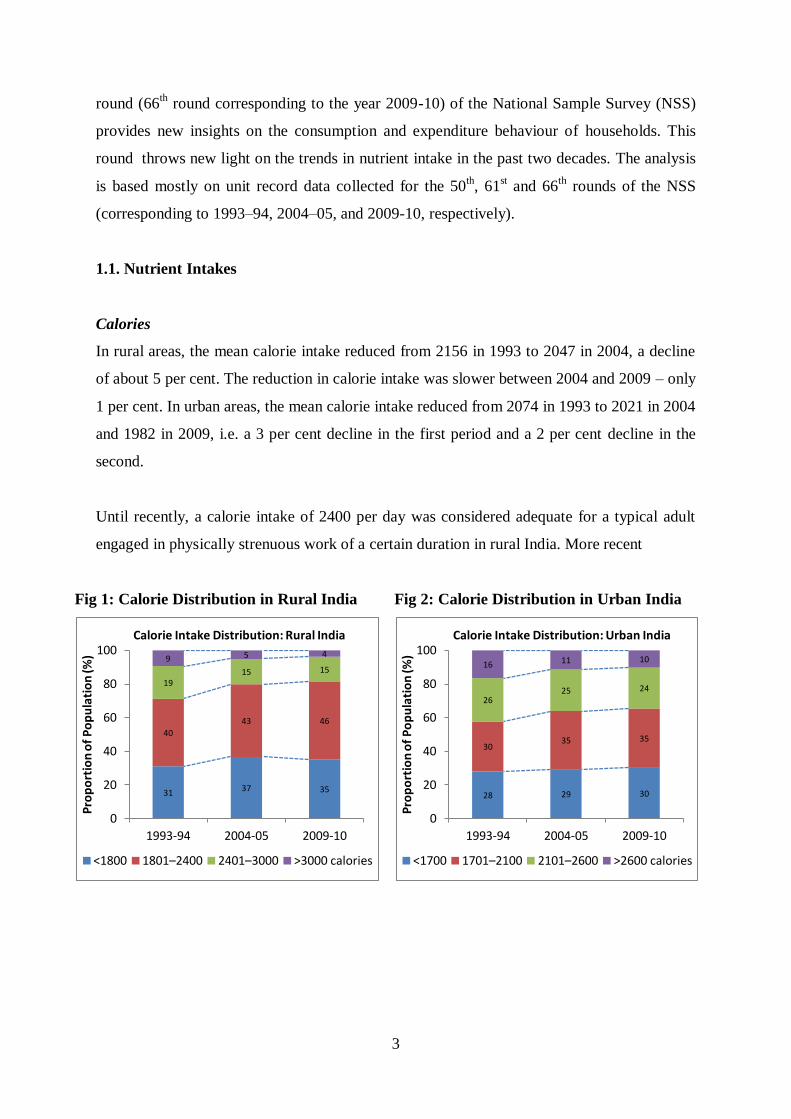
3
round (66th round corresponding to the year 2009-10) of the National Sample Survey (NSS)
provides new insights on the consumption and expenditure behaviour of households This
round throws new light on the trends in nutrient intake in the past two decades The analysis
is based mostly on unit record data collected for the 50th 61
st and 66
th rounds of the NSS
(corresponding to 1993ndash94 2004ndash05 and 2009-10 respectively)
11 Nutrient Intakes
Calories
In rural areas the mean calorie intake reduced from 2156 in 1993 to 2047 in 2004 a decline
of about 5 per cent The reduction in calorie intake was slower between 2004 and 2009 ndash only
1 per cent In urban areas the mean calorie intake reduced from 2074 in 1993 to 2021 in 2004
and 1982 in 2009 ie a 3 per cent decline in the first period and a 2 per cent decline in the
second
Until recently a calorie intake of 2400 per day was considered adequate for a typical adult
engaged in physically strenuous work of a certain duration in rural India More recent
Fig 1 Calorie Distribution in Rural India
Fig 2 Calorie Distribution in Urban India
31 37 35
40
43 46
19 15 15
9 5 4
0
20
40
60
80
100
1993-94 2004-05 2009-10
Pro
po
rtio
n o
f P
op
ula
tio
n (
)
Calorie Intake Distribution Rural India
lt1800 1801ndash2400 2401ndash3000 gt3000 calories
28 29 30
30 35 35
26 25 24
16 11 10
0
20
40
60
80
100
1993-94 2004-05 2009-10
Pro
po
rtio
n o
f P
op
ula
tio
n (
)
Calorie Intake Distribution Urban India
lt1700 1701ndash2100 2101ndash2600 gt2600 calories
4
assessments have used lower calorie lsquorequirementsrsquo (1800 calories)3 Figures 1 amp 2 show the
distribution of calories in rural and urban India between 1993 and 2009 Detailed tables
containing the mean calorie intakes are given in the annexure
Using the higher calorie requirement of 2400 over 71 of the rural households were calorie
deprived or more generally undernourished in 19934 With the lower norm of 1800 this
proportion falls sharply to about 31 implying a large concentration of households in the
calorie intake range of 1800ndash2400 The proportion of undernourished rises from 71 to
nearly 80 in 2004 and 2009 The proportion below the lower cut-off rose from about 31
in 1993 to close to 37 in 2004 indicating high levels of calorie deprivation It declined only
marginally between 2004 and 2009 The mean calorie intake reduced from 2156 in 1993 to
2047 in 2004 to 2020 in 2009
In urban India assuming lower calorie norms of 1700 and 2100 (given less strenuous
physical activity in urban areas) about 28 consumed less than 1700 calories in 1993
About 58 were below the higher calorie norm of 2100 Worse this proportion rose to about
64 in 2004 The proportion of people below the lower cut-off changed only slightly The
proportion of people below the lower and the higher calorie norm changed only slightly
between 2004 and 2009 While the mean calorie intake (overall) decreased between 2004 and
2009 it increased for those below the lower calorie norm Although less alarming than the
calorie deprivation increase in rural India it is nevertheless worrying
DD drew attention to the downward shift in the calorie Engel curve over the period 1983ndash
2004 We find that for the period 1993-2009 the calorie Engel curves for rural India display a
downward shift-especially above extremely low levels of monthly per capita expenditure
(MPCE) at 2004 prices (Figures 3 and 4) The proportionate reduction in calorie intake is
much higher at higher MPCE The calorie Engel curve in urban India for 2004 lies above
1993 at lower levels of MPCE At MPCE gtRs 500 calorie intake was higher in 1993 than in
2004 The proportionate reduction in calorie intake at higher MPCE was larger Similarly the
calorie Engel curve for 2009 lies above that for 2004 at lower levels and the crossover occurs
3 Srinivasan (1992 ) is deeply sceptical of such requirements on the ground that energy expenditure adjusts to
intake within a range 4 Although calorie deprivation is an aspect of undernutrition we sometimes use them interchangeably for
expositional convenience
5
at MPCE of Rs 500 Thus there is evidence of a downward shift of the calorie Engel curve
in both rural and urban India especially at higher levels of MPCE
Fig 3 Calorie Engel Curve for Rural India
Fig 4 Calorie Engel Curve for Urban India
Protein
The mean protein intakes reduced from 603 gms in 1993 to 558 gms in 2004 ie by 7 per
cent The reduction was slower in the second period ndash by 3 per cent with mean intake of 541
gms in 2009 In urban areas the mean protein intake reduced from 573 gms in 1993 to 554
gms in 2004 and 534 gms in 2009 ie a reduction of about 3-4 per cent in both periods
To assess the proportion of people who are protein-deprived a cut-off of 60 (gms) of protein
Fig 5 Protein Intake Distribution in Rural India
Fig 6 Protein Intake Distribution in Urban India
24 29 29
34
38 41
23
21 21
20 12 9
0
10
20
30
40
50
60
70
80
90
100
1993-94 2004-05 2009-10
Pro
po
rtio
n o
f P
op
ula
tio
n (
)
Protein Intake Distribution Rural India
lt45 46ndash60 61ndash75 gt75 gms
25 29 29
38 35
44
23 25 20
14 11 7
0
10
20
30
40
50
60
70
80
90
100
1993-94 2004-05 2009-10
Pro
po
rtio
n o
f P
op
ula
tio
n (
)
Protein Intake Distribution Urban India
lt45 46ndash60 61ndash75 gt75 gms
6
intake is used5 Figures 5 and 6 show the distribution of protein in rural and urban India
between 1993 and 2010 Detailed tables containing the mean protein intakes are given in the
annexure
While protein deficiency is in large measure linked to calorie deficiency we note that well
over 57 of rural households consumed fewer than the required protein intake in 1993 Just
under a quarter of the households consumed lt45 (gms) of protein Within both ranges of
protein intake the proportions rose more than moderately (eg in the lower range the
proportion of households rose from about 24 in 1993 to about 29 in 2004 in the higher
range the proportion rose from 57 in 1993 to 66 in 2004 to 70 in 2009) Although the
mean intake of protein for households in the lower range remained unchanged it reduced
from 60 gms in 1993 to 56 gms in 2004 and 54 gms in 2009
The share of protein-deficient households in urban India (considering the 60 gm cut-off)
remained unchanged between 1993 and 2004 but increased substantially between 2004 and
2009 Overall mean protein intakes however reduced
Figures 7 and 8 report protein Engel curves for rural and urban India between 1993ndash2009
The ruralndashurban contrast in protein intake is striking In the rural areas protein intake was
consistently lower across expenditure classes in 2009 than in 2004 which in turn was lower
than in 1993 The gap between 1993 and 2004 intakes widens considerably at higher MPCE
Fig 7 Protein Engel Curves for Rural India
Fig 8 Protein Engel Curves for Urban India
5 For details see Gopalan et al (1971 1992) and ICMR (1990)
7
In urban areas the 2004 curve was above the 1993 curve at low levels of MPCE and after the
cross-over expenditure of about Rs 500 the former lay below the 1993 curve The 2009 curve
lies above the 2004 curve at lower levels of MPCE and below the 2004 curve at higher levels
Fats
Mean fat intake increased substantially between 1993-94 and 2004-05 In rural areas the
mean fat intake increased by 12 per cent from 315 gms in 1993 to 354 gms in 2004 In
urban areas the mean fat intake increased by 13 per cent from 421 gms in 1993 to 475 gms
in 2004 The increase in fat intakes in the second period ie 2004-05 and 2009-10 were more
moderate Mean fat intakes increased to 382 gms (increase of 8 per cent) in rural areas and
489 gms (increase of 3 per cent) in urban areas
Although a precise range for fat requirements cannot be specified a range of 40ndash60 (gms) of
fat intake is desirable6 Figures 9 and 10 show the distribution of fat in rural and urban India
between 1993 and 2009 Detailed tables containing the mean fat intakes are given in the
annexure
Fig 9 Fat Intake Distributions for Rural India
Fig 10 Fat Intake Distributions for Urban India
6 Gopalan et al (1971) observe lsquoThe quantity of fat that should be included in a well balanced diet is not known
with any degree of certainty However it appears desirable in the present state of knowledge that the daily
intake of fat should be such that it contributes no more than 15 to 20 of the calories in the diet A total of
about 40 to 60 gms of fat can therefore be safely consumed daily and in order to obtain the necessary amounts
of essential fatty acids the fat intake should include at least 15 gms of vegetable oilsrsquo (pg 8) Also see ICMR
(1990)
34 23
14
25
27
24
26 34
40
15 17 21
0
10
20
30
40
50
60
70
80
90
100
1993 2004 2010
Pro
po
rtio
n o
f P
op
ula
tio
n (
)
Fat Intake Distribution Rural India
lt20 21ndash30 31ndash50 gt50 gms
25 15 10
30
31 28
26 32
37
19 22 25
0
10
20
30
40
50
60
70
80
90
100
1993 2004 2010
Pro
po
rtio
n o
f P
op
ula
tio
n (
)
Fat Intake Distribution Urban India
lt25 26ndash40 41ndash60 gt60 gms
8
Even considering the first three ranges of fat intake an astonishingly high estimate for fat
deficient households for rural India (over 85) is obtained for 1993 Well over one-third of
households were under the lowest range of lt20 (gms) The corresponding household share
with fat intakes lt50 gms fell to over 83 in 2004 and 79 in 2009 The share of households
consuming lt20 gms of fat fell sharply (from over 34 in 1993 to well over 22 in 2004 and
14 in 2009) Mean fat intakes increased over the period 1993 to 2009
Using higher ranges of fat intake for urban areas fat deprivation was pervasive (about 81 of
the households consumed lt60 gms of fats in 1993) About a quarter consumed lt25 gms
Over the period 1993ndash2009 the reduction in the proportion of fat- deprived was slight (from
81 in 1993 to 78 in 2004 to 75 in 2009) However as in rural India the proportion
consuming fats lt25 gms fell sharply Mean fat intake increased
Figures 11 and 12 show the Engel curves for fat In rural areas the fat Engel curves for 1993
lay below that for 2004 at lower levels of MPCE The 2009 curve lies above the 2004 curve
at lower levels of MPCE The crossover is at approximately Rs650 In urban areas the
crossover is at Rs1000 The curves converge beyond this
Fig 11 Fat Engel Curves for Rural India
Fig 12 Fat Engel Curves for Urban India
Thus taking nutritional norms as valid the overall picture of nutritional deprivation
worsened considerably over the period 1993ndash2009 The following Kernel density functions
(figure 13) clearly show a leftward shift in calorie and protein intake distributions and a
rightward shift in the fat intake distribution in both rural and urban areas between 1993 and
20097
7 For an admirably clear exposition of kernel density functions see Deaton (1995)
9
Fig 13 Kernel Density Functions for Calories Proteins and Fats consumed ndash Rural and
Urban India (1993 ndash 2009)
12 Factors Underlying Changes in Diets and Nutrition
We build on the DD analysis (2009) of food commodities that contributed to reduction in
calories protein and increase in fat consumption
10
Figure 14 shows the distribution of calorie protein and fat intake by food commodities for
rural and urban areas between 1993 and 2009 Detailed tables containing mean per capita
intake of nutrients from the various food items are given in the annexure
In rural India calorie intakes declined between 1993 and 2009 Most of it is attributable to
the decline in calories from cereals and pulses to some extent Calories from cereals reduced
from 1530 in 1993 to 1383 in 2004 and 1296 in 2009 The contribution of milkmilk
products sugar fruits and vegetables remained largely unchanged between 1993 and 2009
The contribution of vanaspati oil to the calorie intake increased substantially Calories
obtained from oil increased from 111 in 1993 to 145 in 2004 and 169 in 2009
Similar results are found for urban areas as well The reduction in the contribution of pulses
to calorie intakes was more drastic in urban areas between 2004 and 2009
71
68
64
58
56
54
6
7
7
9
9
10
5
7
8
8
10
11
5
5
5
6
6
6
1
1
1
1
1
1
7
8
4
11
12
5
1
1
1
2
2
2
4
4
4
5
5
4
0 10 20 30 40 50 60 70 80 90 100
1993-94
2004-05
2009-10
1993-94
2004-05
2009-10
Fig 14 Calorie Intake by Food Commodities 1993 2004 and 2009
Cereals Milk Vanaspati-Oil Sugar Eggs amp Meats Pulses Fruits Vegetables
RU
RA
L U
RB
AN
11
In both rural and urban areas protein intake declined between 1993 and 2009 (Figure 15)
Much of it is reflected in a reduction in protein intake from cereals and pulses In rural areas
the protein intake from these commodities decreased from 50 gms in 1993 to 45 gms in 2004
and 40 gms in 2009 The corresponding numbers for urban areas are 44 gms (1993) 42 gms
(2004) and 37 gms (2009) Intake from dairy products (milk eggs and meats) increased
moderately Proteins from other sources are a very small fraction and largely remained
unchanged between 1993 and 2009
Between 1993-2009 fat intake rose in both rural and urban areas Vanaspati-oil has the
maximum share in total fat intakes and its contribution rose over the period 1993 and 2009
In rural areas fat intake from vanaspati-oil rose from 12 gms in 1993 to 16 gms in 2004 and
19 gms in 2009 In urban areas the share of vanaspati-oil rose from 19 gms in 1993 to 22
gms in 2004 and 24 gms in 2009 The other significant contributor to fat intake are cereals
pulses and milk products (including ghee and butter) but their contribution reduced between
1993 and 2009 Declining intake of fats from these commodities were more than offset by the
increased intake of fat from vanaspati-oil
69
68
66
60
58
57
9
9
10
12
13
14
4
5
5
6
6
6
13
13
10
17
18
12
5
6
5
6
7
6
0 10 20 30 40 50 60 70 80 90 100
1993-94
2004-05
2009-10
1993-94
2004-05
2009-10
Fig 15 Protein Intake by Food Commodities 1993 2004 and 2009
Cereals Milk Eggs amp Meats Pulses Fruits amp Vegetables
RU
RA
L U
RB
AN
12
13 Demand Theory Based Explanation of Changes in Nutrient Intake
In response to the DeatonndashDreze (2009) explanation of a downward shift in the calorie Engel
curve in terms of lower lsquorequirementsrsquo due to health improvements and less strenuous
activity levels and more sedentary life-styles we have developed an alternative explanation
of changes in the consumption of calories protein and fats over the period 1993ndash2009 This
explanation is embedded in a standard demand theory framework with food prices8 and
expenditure (as a proxy for income) cast in a pivotal role Based on different experiments
robust demand functions are estimated for each of the three nutrients viz calories protein and
fats (Tables 1-3) Our results show consistently robust food price and expenditure effects
thus raising further doubts about the adequacy of the DD explanation The analysis is based
8 An important point to bear in mind is that the price effects capture both own and cross-price effects through
substitutions between food commodities Briefly as prices change demands for commodities change and
consequently calorie (and other nutrientsrsquo) intakes Underlying this is a presumption that food choices are
informed by their nutritional content As Deaton and Dreze (2009) emphasise people do not buy calories and
other nutrients but food commodities However if food choices are informed by their nutritional values it is
meaningful to talk about demands for calories and other nutrients
17
14
11
10
8
7
31
27
26
31
29
30
39
46
49
44
47
49
2
1
1
2
2
1
8
9
3
10
12
3
4
3
3
4
3
3
0 10 20 30 40 50 60 70 80 90 100
1993-94
2004-05
2009-10
1993-94
2004-05
2009-10
Fig 16 Fat Intake by Food Commodities 1993 2004 and 2009
Cereals Milk Vanaspati-Oil Eggs amp Meats Pulses Fruits amp Vegetables
RU
RA
L U
RB
AN
13
on unit record data collected for the 50th
61st and 66
th rounds of the NSS (corresponding to
the years 1993ndash94 2004ndash05 and 2009-10 respectively) We will discuss separately the
results for rural and urban samples
(a) Demand Function
A basic demand equation for nutrients (calories protein fats) in rural and urban India with
pooled data for 1993 2004 and 2009 is given below
(1)
where the dependent variable is log of nutrient consumed by ith household in time t jtP is a
vector of food prices computed from the NSS at the village level (j) and time t E it is
household per capita expenditure for ith household in time t itX is a vector of household
characteristics (eg number of adult males females household size ) and a few others
specified as dummy variables (caste) D1t is a dummy variable that takes the value 1 for 2004
and 0 otherwise (to allow for changes in factors other than food prices and expenditure over
time) D2t+k is the second time dummy that takes the value 1 for 2009 and 0 otherwise and
it is the error term This equation is estimated using robust regression Although a Chow test
for a structural shift is not feasible with robust regression we have employed two
refinements one is the use of a time dummy that could potentially capture the health
improvements and less strenuous activity patterns (associated with easier access to drinking
water better transportation facilities) and the other is interactions of food price variables
with the time dummy to allow for different price and expenditure effects over time9
An important point to bear in mind is that the price effects capture both own and cross-price
effects through substitutions between food commodities Briefly as prices change demands
for commodities change and consequently for example calorie (and other nutrientsrsquo) intakes
9 While these effects yield insights into changing consumer demands a more detailed analysis along the lines of
Behrman and Deolalikar (1989) and Jha et al (2009) would further deepen our understanding consumer
preferences and tastes for variety
14
(b) Results
We first consider the calorie demand function For both rural and urban areas each of the
price effects has a significant negative coefficient with the exception of price of fruits and
vegetables whose coefficient in not significant Moreover the price effects on the demand for
calories have in many cases weakened as captured by the coefficients of the interaction term
(ie interaction between the price and the time dummies) A case in point is price of cereals
and pulses Rising incomes have a positive impact on calorie demand and so does the
proportion of adults in the household The former effect however weakened over time As
household size increases calorie demand decreases Education of adult female has a negative
impact on calorie demand as this may be attributed to consumption of a more balanced diet
rich in protein and vitamins and reduced dependence on cereals which is a major source of
calories By contrast education of adult male is not significant in rural areas but positive in
urban areas SCs have lower demands for calories in both rural and urban areas while that of
Others is positive in rural areas and negative in urban areas relative to STs The effect of time
alone is reduced consumption of calorie between 1993 and 2004 However somewhat
surprisingly the residual time effect is not significant between 2004-09 That this undermines
the DD explanation emphasising lower calorie requirements due to improvements in the
epidemiology of the disease environment less strenuous physical activities and more
sedentary life styles cannot be ruled out
In case of protein demand in both rural and urban areas there is a positive influence of the
price of fruits and vegetables whereas the elasticity of protein demand with respect to all
other food prices is negative As in the case of calorie demand several price effects
weakened over over time as captured by the interaction term (between food prices and the
time dummies) A case in point is price of milk and milk products eggs and meats Higher
incomeexpenditure increase protein demand but less so over time Increasing household size
reduces protein demand whereas rising proportion of adults in the household increases it
The impact of education of adult female is negative and that of education of adult male is
not significant SCs have lower demand for protein while Others have higher demand relative
to STs The residual effect of time after accounting for the interaction is significant with a
negative coefficient suggesting a lower demand for protein in 2009 and 2004 as compared to
1993
15
In case of fats too in both rural and urban areas there are significant price and expenditure
effects ndash positive in the case of price of cereals oil and fruits and vegetables and negative in
case of milk products and sugar The positive price elasticity of fats with respect to edible oil
price is somewhat surprising although the price effect has weakened over time MPCE has
positive Unlike in the case of calorie and protein highest education of adult female has a
positive impact on fat demand suggesting that households with females having higher than
middle level of education tend to eat diets rich in fats shifting away from diets rich in
calories and proteins Moreover highest education of adult male also has a positive and
significant effect As in the case of calorie and protein household size has a negative impact
and proportion of adults in a household has a positive impact on demand for fats SCs and
Others have higher demands relative to STs The effect of time alone is to increase the fat
demand in 2009 and 2004 as compared to 1993
2 Concluding Observations
The main findings of our analysis are summarised below from a policy perspective
An important insight from the comparison of three rounds of the NSS over the period 1993-
2009 points to a slowing down of the reduction in the calorie intake in both rural and urban
areas in 2004-09 relative to 1993-2004 A similar slowing down occurred in protein intake
over the more recent period (2004-09) While fat intake continued to rise over this period but
at a lower rate
A demand theory based explanation of changes in demands for these nutrients reaffirmed the
important roles of food price and expenditure changes A new insight however is that in
several cases food price effects weakened over time as also expenditure effects While the
residual time effect weakened for both calories and protein over the period 1993-2004 it
slowed down over the more recent period The effect of time on fat demand was however
positive and strengthened over the more recent period Altogether thus the DD explanation of
lower calorie and protein demands over time as a result of lower requirements is further
undermined
From a policy perspective the important roles of food price stabilisation and expansion of
livelihood opportunities remain key to ameliorating nutritional deprivation despite lowering
of nutritional requirements A closer scrutiny of dietary preferences and tastes is crucial for
16
both understanding sources of nutritional deprivation and for designing effective policies for
mitigating it
17
Table 1 Robust Regression Estimates Demand for Calories 1993-2009
RURAL URBAN
Dependent Variable Log of Per capita consumption
of calories
No of Obs = 193785 No of Obs = 124481
F(60193724) = 1192631 F(60124420) = 370511
Prob gt F = 0 Prob gt F = 0
Coefficient Elasticity Coefficient Elasticity
Price Cereals amp Pulses -0012 (-2524) -0166 (-2524) -0006 (-102) -0090 (-102)
---interaction T1 (2004) 0011 (2072) 0049 (2072) 0001 (096) - 0003 (096) -
---interaction T2 (2009) 0010 (2005) 0071 (2005) 0004 (699) 0037 (699)
Price Milk Milk Products Eggs amp Meats
-0003 (-6421) -0098 (-6421) -0001 (-1253) -0035 (-1253)
---interaction T1 (2004) 0002 (4288) 0026 (4288) 0000 (329) 0003 (329)
---interaction T2 (2009) 0002 (4983) 0040 (4983) 0001 (904) 0013 (904)
Price Oil -0008 (-2667) -0086 (-2667) -0004 (-101) -0048 (-101)
---interaction T1 (2004) 0004 (1175) 0015 (1175) 0001 (189) 0003 (189)
---interaction T2 (2009) 0006 (1934) 0031 (1934) 0004 (994) 0024 (994)
Price Sugar -0002 (-127) -0124 (-127) -0004 (-1209) -0183 (-1209)
---interaction T1 (2004) 0002 (1136) 0050 (1136) 0003 (1029) 0061 (1029)
---interaction T2 (2009) 0001 (704) 0027 (704) 0002 (516) 0033 (516)
Price Fruits amp Vegetables
-0001 (-116) - -0010 (-116) - 0001 (194) 0026 (194)
---interaction T1 (2004) 0001 (275) 0010 (275) 0000 (026) - 0001 (026) -
---interaction T2 (2009) -0001 (-174) -0007 (-174) -0003 (-392) -0027 (-392)
Monthly per capita expenditure
0001 (40195) 0418 (40195) 0000 (22549) 0240 (22549)
---interaction T1 (2004) 0000 (-1160) -0054 (-1160) 0000 (-2386) -0011 (-2386)
---interaction T2 (2009) 0000 (-1712) -0063 (-1712) 0000 (-5097) -0022 (-5097)
Household Size -0006 (-3076) -0033 (-3076) -0021 (-684) -0096 (-684)
Proportion of Adults in the household
0202 (9139) 0137 (9139) 0235 (8183) 0169 (8183)
Education Dummy Males 0000 (-023) - 0000 (-023) - 0012 (805) 0008 (805)
Education Dummy Females
-0025 (-215) -0008 (-215) -0013 (-952) -0007 (-952)
Time Dummy (2004) -0159 (-1893) -0061 (-1893) -0105 (-829) -0036 (-829)
Time Dummy (2009) -0007 (-069) - -0002 (-069) - 0006 (045) - 0002 (045) -
Caste Dummy (SC) -0011 (-586) -0002 (-586) -0017 (-498) -0002 (-498)
Caste Dummy (Others) 0010 (616) 0006 (616) -0005 (-177) -0004 (-177)
Constant 7569 (89023)
7712 (59282)
and refer to significance at the 1 5 and 10 level respectively
State Dummies are omitted and details will be furnished on request Education Dummy If highest level of education is middle or lower then dummy = 0 else=1 Omitted Time period 1993 Omitted caste ST
18
Table 2 Robust Regression Estimates Demand for Protein 1993-2009
RURAL URBAN
Dependent Variable
Log of Per capita consumption of protein
No of Obs = 193784 No of Obs = 124481
F(60193723) = 1144586 F(60124420) = 391491
Prob gt F = 0 Prob gt F = 0
Coefficient Elasticity Coefficient Elasticity
Price Cereals amp Pulses -0013 (-2392) -0169 (-2392) -0009 (-1508) -0144 (-1508)
---interaction T1 (2004) 0013 (2153) 0055 (2153) 0005 (662) 0019 (662)
---interaction T2 (2009) 0012 (2187) 0084 (2187) 0009 (1386) 0079 (1386)
Price Milk Milk Products Eggs amp Meats
-0003 (-7497) -0123 (-7497) 0000 (-373) -0011 (-373)
---interaction T1 (2004) 0002 (4993) 0032 (4993) 0000 (-196) -0002 (-196)
---interaction T2 (2009) 0003 (5815) 0050 (5815) 0000 (264) 0004 (264)
Price Oil -0010 (-3216) -0112 (-3216) -0007 (-1709) -0088 (-1709)
---interaction T1 (2004) 0005 (1623) 0022 (1623) 0003 (658) 0012 (658)
---interaction T2 (2009) 0007 (2218) 0038 (2218) 0006 (1562) 0041 (1562)
Price Sugar -0002 (-1085) -0114 (-1085) -0003 (-844) -0139 (-844)
---interaction T1 (2004) 0002 (941) 0045 (941) 0001 (337) 0022 (337)
---interaction T2 (2009) 0001 (249) 0010 (249) 0000 (082) - 0006 (082) -
Price Fruits amp Vegetables
0002 (42) 0040 (42) 0002 (244) 0036 (244)
---interaction T1 (2004) 0000 (084) - 0003 (084) - -0001 (-081) - -0004 (-081) -
---interaction T2 (2009) -0003 (-652) -0030 (-652) -0003 (-366) -0027 (-366)
Monthly per capita expenditure
0001 (39184) 0438 (39184) 0000 (21912) 0254 (21912)
---interaction T1 (2004) 0000 (-1004) -0051 (-1004) 0000 (-1527) -0008 (-1527)
---interaction T2 (2009) 0000 (-1389) -0058 (-1389) 0000 (-3705) -0017 (-3705)
Household Size -0005 (-2368) -0027 (-2368) -0018 (-5526) -0084 (-5526)
Proportion of Adults in the household
0198 (8293) 0134 (8293) 0226 (7247) 0163 (7247)
Education Dummy
Males 0001 (116) - 0001 (116) - 0012 (743) 0008 (743)
Education Dummy Females
-0025 (-2031) -0008 (-2031) -0014 (-947) -0008 (-947)
Time Dummy (2004) -0210 (-2315) -0081 (-2315) -0050 (-36) -0017 (-36)
Time Dummy (2009) -0031 (-284) -0009 (-284) -0047 (-307) -0015 (-307)
Caste Dummy (SC) -0007 (-364) -0001 (-364) -0007 (-187) -0001 (-187)
Caste Dummy (Others) 0011 (623) 0007 (623) 0005 (143) - 0004 (143) -
Constant 3952 (43144)
4101 (28987)
and refer to significance at the 1 5 and 10 level respectively
State Dummies are omitted and details will be furnished on request Education Dummy If highest level of education is middle or lower then dummy = 0 else=1 Omitted Time period 1993 Omitted caste ST
19
Table 3 Robust Regression Estimates Demand for Fats 1993- 2009
RURAL URBAN
Dependent Variable Log of Per capita
consumption of Fats
No of Obs = 193784 No of Obs = 124481
F(60193723) = 1895778 F(60124420) = 766201
Prob gt F = 0 Prob gt F = 0
Coefficient Elasticity Coefficient Elasticity
Price Cereals amp Pulses 0016 (2033) 0218 (2033) 0012 (1462) 0193 (1462)
---interaction T1 (2004) -0005 (-598) -0023 (-598) -0008 (-871) -0035 (-871)
---interaction T2 (2009) -0009 (-1067) -0062 (-1067) -0006 (-661) -0052 (-661)
Price Milk Milk Products Eggs amp Meats
-0013 (-1924) -0478 (-1924) -0009 (-7698) -0327 (-7698)
---interaction T1 (2004) 0008 (10509) 0106 (10509) 0005 (3537) 0056 (3537)
---interaction T2 (2009) 0010 (13313) 0172 (13313) 0007 (5587) 0121 (5587)
Price Oil 0002 (445) 0023 (445) 0007 (1364) 0097 (1364)
---interaction T1 (2004) -0001 (-251) -0005 (-251) -0003 (-571) -0014 (-571)
---interaction T2 (2009) -0002 (-429) -0011 (-429) -0004 (-801) -0029 (-801)
Price Sugar -0004 (-1365) -0217 (-1365) -0003 (-75) -0170 (-75)
---interaction T1 (2004) 0001 (306) 0022 (306) 0001 (123) - 0011 (123) -
---interaction T2 (2009) -0001 (-169) -0011 (-169) -0002 (-42) -0040 (-42)
Price Fruits amp Vegetables
0011 (1418) 0206 (1418) 0006 (615) 0125 (615)
---interaction T1 (2004) -0010 (-1227) -0070 (-1227) -0006 (-556) -0037 (-556)
---interaction T2 (2009) -0011 (-1392) -0097 (-1392) -0008 (-74) -0076 (-74)
Monthly per capita expenditure
0001 (44365) 0753 (44365) 0000 (28858) 0462 (28858)
---interaction T1 (2004) 0000 (-1279) -0098 (-127) 0000 (-1896) -0014 (-1896)
---interaction T2 (2009) -0001 (-2100) -0126 (-2100) 0000 (-8414) -0054 (-8414)
Household Size -0019 (-5556) -0097 (-5556) -0039 (-8497) -0179 (-8497)
Proportion of Adults in the household
0165 (4584) 0112 (4584) 0188 (4368) 0135 (4368)
Education Dummy Males
0056 (3204) 0029 (3204) 0086 (3825) 0060 (3825)
Education Dummy Females
0031 (167) 0010 (167) 0086 (4086) 0048 (4086)
Time Dummy (2004) 0299 (2175) 0115 (2175) 0161 (845) 0055 (845)
Time Dummy (2009) 0564 (3391) 0165 (3391) 0360 (1697) 0114 (1697)
Caste Dummy (SC) 0052 (174) 0009 (174) 0040 (764) 0005 (764)
Caste Dummy (Others) 0135 (5278) 0090 (5278) 0108 (2307) 0086 (2307)
Constant 3023 (21787)
3474 (17776)
and refer to significance at the 1 5 and 10 level respectively
State Dummies are omitted and details will be furnished on request Education Dummy If highest level of education is middle or lower then dummy = 0 else=1 Omitted Time period 1993 Omitted caste ST
20
Annexure 1 Distribution of Nutrient Intake (1993 ndash 2009)
The following tables show the distribution of nutrient intake (proportion of population in
each category) in rural and urban areas between 1993 and 2009 Figures in parenthesis
indicate the mean nutrient intake in each range
Table 1 Calorie Intake Distributions in Rural India 1993 2004 and 2009
Year Range of Calorie Intake Per Capita Per Day
Total lt1800 1801ndash2400 2401ndash3000 gt3000
1993 3109 (1491)
4007 (2084)
1942 (2650)
942 (3636)
100 (2156)
2004 3668
(1516)
4311
(2071)
1507
(2629)
514
(3925)
100
(2047)
2010 3528
(1531)
4591
(2071)
1492
(2622)
389
(3545)
100
(2020)
Table 2 Calorie Intake Distributions in Urban India 1993 2004 and 2009
Year
Range of Calorie Intake Per Capita Per Day
Total lt1700 1701ndash2100 2101ndash2600 gt2600
1993 2812
(1426)
2962
(1900)
2576
(2320)
1649
(3107)
100
(2074)
2004 2940
(1440)
3452
(1900)
2467
(2313)
1141
(3252)
100
(2021)
2010 3010
(1456)
3534
(1896)
2436
(2312)
1019
(3043)
100
(1982)
Table 3 Protein Intake Distributions in Rural India 1993 2004 and 2009
Year Range of Protein Intake Per Capita Per Day (Gms)
Total lt45 46ndash60 61ndash75 gt75
1993 2381
(371)
3379
(524)
2279
(668)
1961
(944)
100
(603)
2004 2881
(374)
3805
(522)
2146
(663)
1168
(939)
100
(558)
2010 2935
(380)
4081
(521)
2105
(661)
879
(892)
100
(541)
21
Table 4 Protein Intake Distributions in Urban India 1993 2004 and 2009
Year Range of Protein Intake Per Capita Per Day (Gms)
Total lt45 46ndash60 61ndash75 gt75
1993 2490
(371)
3777
(524)
2311
(665)
1423
(907)
100
(573)
2004 2940
(378)
3450
(523)
2469
(662)
1140
(949)
100
(554)
2010 2944
(383)
4366
(521)
1961
(661)
729
(876)
100
(534)
Table 5 Fat Intake Distributions in Rural India 1993 2004 and 2009
Year Range of Fat Intake Per Capita Per Day (Gms)
Total lt20 21ndash30 31ndash50 gt50
1993 3430
(140)
2508
(247)
2609
(383)
1454
(721)
100
(315)
2004 2259
(150)
2721
(249)
3358
(383)
1662
(746)
100
(354)
2010 1420
(154)
2405
(251)
4049
(388)
2125
(672)
100
(382)
Table 6 Fat Intake Distributions in Urban India 1993 2004 and 2009
Year Range of Fat Intake Per Capita Per Day (Gms)
Total lt25 26ndash40 41ndash60 gt60
1993 2504
(182)
2984
(323)
2615
(486)
1897
(802)
100
(421)
2004 1539
(194)
3102
(326)
3156
(489)
2204
(858)
100
(474)
2010 1032
(198)
2788
(330)
3661
(490)
2519
(781)
100
(489)
Source Authorsrsquo calculations based on the 50th 61
st and 66
th rounds of the NSS
22
Annexure 2 Distribution of Nutrient Intake by Food Commodities (1993 -2009)
The following tables show the distribution of nutrient (calorie protein and fat) intake from
nine food commodity groups for rural and urban areas between 1993 and 2009
Table 1 Mean Per Capita Calorie Intake by Food Commodities 1993 2004 and 2009
Year Cereals Milk
Products GheeButter
Vanaspati-Oil
Sugar Eggs MeatFish Poultry
PulsesNuts Dry Fruits
Fruits Vegetables Total
Rural India
1993-94 1530 137 111 103 2 12 151 20 89 2156
Share 710 64 51 48 01 06 70 09 41
2004-05 1383 137 145 98 3 12 156 23 90 2047
Share 676 67 71 48 01 06 76 11 44
2009-10 1296 141 169 93 3 12 84 20 83 2020
Share 642 70 84 46 01 06 42 10 41
Urban India
1993-94 1213 181 168 129 5 16 231 37 94 2074
Share 585 87 81 62 02 08 111 18 45
2004-05 1133 189 199 115 6 16 235 36 92 2021
Share 561 94 98 57 03 08 116 18 46
2009-
10 1071 199 217 110 5 14 106 33 83 1982
Share 540 100 109 55 03 07 53 17 42
Table 2 Mean Per Capita Protein Intake by Food Commodities 1993 2004 and 2009
Year Cereals Milk
Products GheeButter
Vanaspati-Oil
Sugar Eggs MeatFish Poultry
PulsesNuts Dry Fruits
Fruits Vegetables Total
Rural India
1993-94 418 53 0 0 02 2 78 02 29 603
Share 693 88 00 00 03 33 129 03 48
2004-05 379 53 0 0 03 2 73 03 28 558
Share 679 95 00 00 05 36 131 05 50
2009-10 356 55 0 0 03 2 53 02 25 541
Share 658 102 00 00 06 37 98 04 46
Urban India
1993-94 341 67 0 0 04 26 10 04 31 573
Share 595 117 00 00 07 45 175 07 54
2004-05 32 7 0 0 05 27 98 04 31 554
Share 578 126 00 00 09 49 177 07 56
2009-
10 302 74 0 0 04 26 65 04 27 534
Share 566 139 00 00 07 49 122 07 51
23
Table 3 Mean Per Capita Fat Intake by Food Commodities 1993 2004 and 2009
Year Cereals Milk
Products GheeButter
Vanaspati-Oil
Sugar Eggs MeatFish Poultry
PulsesNuts Dry Fruits
Fruits Vegetables Total
Rural India
1993-94 54 97 123 0 02 03 24 07 04 315
Share 171 308 390 00 06 10 76 22 13
2004-05 48 97 162 0 03 02 31 08 04 354
Share 136 274 458 00 08 06 88 23 11
2009-10 43 10 187 0 03 02 11 08 03 382
Share 113 262 490 00 08 05 29 21 08
Urban India
1993-94 4 132 186 0 04 04 4 11 04 421
Share 95 314 442 00 10 10 95 26 10
2004-05 37 138 221 0 05 03 56 11 04 475
Share 78 291 465 00 11 06 118 23 08
2009-
10 35 145 241 0 04 02 15 11 04 489
Share 72 297 493 00 08 04 31 22 08
Source Authorsrsquo calculations based on the 50th 61
st and 66
th rounds of the NSS
24
References
Behrman J and A Deolalikar (1989) ldquoIs Variety the Spice of life Implications for Calorie
Intakerdquo Review of Economics and Statistics vol 71
Deaton A (1995) The Analysis of Household Surveys A Microeconomic approach to
Development Policy Baltimore MD The Johns Hopkins University Press
Deaton A and J Dreze (2009) lsquoFood and Nutrition in India Facts and Interpretationsrsquo
Economic and Political Weekly XLIV(7) 42ndash65
Gaiha R R Jha and Vani S Kulkarni (2012) ldquoDemand for Nutrients in India 1993 to
2004rdquo Applied Economics available online 1 February 2012
Gopalan C B Sastri and S Balasubramanian (1971) Nutritive Value of Indian Foods
National institute of Nutrition Indian Council of Medical Research Hyderabad
Indian Council of Medical Research (ICMR 1990) Nutrient Requirements and
Recommended Dietary Allowances for Indians New Delhi ICMR
Jha R R Gaiha and A Sharma (2009) ldquo Modelling Variety in Consumption Expenditure on
Food in Indiardquo International Review of Applied Economics online publication 1
July 2009
Srinivasan TN (1992) lsquoUndernutrition Concepts Measurements and Policy Implicationsrsquo
in SR Osmani (ed) Nutrition and Poverty Clarendon Press Oxford pp 97ndash120

4
assessments have used lower calorie lsquorequirementsrsquo (1800 calories)3 Figures 1 amp 2 show the
distribution of calories in rural and urban India between 1993 and 2009 Detailed tables
containing the mean calorie intakes are given in the annexure
Using the higher calorie requirement of 2400 over 71 of the rural households were calorie
deprived or more generally undernourished in 19934 With the lower norm of 1800 this
proportion falls sharply to about 31 implying a large concentration of households in the
calorie intake range of 1800ndash2400 The proportion of undernourished rises from 71 to
nearly 80 in 2004 and 2009 The proportion below the lower cut-off rose from about 31
in 1993 to close to 37 in 2004 indicating high levels of calorie deprivation It declined only
marginally between 2004 and 2009 The mean calorie intake reduced from 2156 in 1993 to
2047 in 2004 to 2020 in 2009
In urban India assuming lower calorie norms of 1700 and 2100 (given less strenuous
physical activity in urban areas) about 28 consumed less than 1700 calories in 1993
About 58 were below the higher calorie norm of 2100 Worse this proportion rose to about
64 in 2004 The proportion of people below the lower cut-off changed only slightly The
proportion of people below the lower and the higher calorie norm changed only slightly
between 2004 and 2009 While the mean calorie intake (overall) decreased between 2004 and
2009 it increased for those below the lower calorie norm Although less alarming than the
calorie deprivation increase in rural India it is nevertheless worrying
DD drew attention to the downward shift in the calorie Engel curve over the period 1983ndash
2004 We find that for the period 1993-2009 the calorie Engel curves for rural India display a
downward shift-especially above extremely low levels of monthly per capita expenditure
(MPCE) at 2004 prices (Figures 3 and 4) The proportionate reduction in calorie intake is
much higher at higher MPCE The calorie Engel curve in urban India for 2004 lies above
1993 at lower levels of MPCE At MPCE gtRs 500 calorie intake was higher in 1993 than in
2004 The proportionate reduction in calorie intake at higher MPCE was larger Similarly the
calorie Engel curve for 2009 lies above that for 2004 at lower levels and the crossover occurs
3 Srinivasan (1992 ) is deeply sceptical of such requirements on the ground that energy expenditure adjusts to
intake within a range 4 Although calorie deprivation is an aspect of undernutrition we sometimes use them interchangeably for
expositional convenience
5
at MPCE of Rs 500 Thus there is evidence of a downward shift of the calorie Engel curve
in both rural and urban India especially at higher levels of MPCE
Fig 3 Calorie Engel Curve for Rural India
Fig 4 Calorie Engel Curve for Urban India
Protein
The mean protein intakes reduced from 603 gms in 1993 to 558 gms in 2004 ie by 7 per
cent The reduction was slower in the second period ndash by 3 per cent with mean intake of 541
gms in 2009 In urban areas the mean protein intake reduced from 573 gms in 1993 to 554
gms in 2004 and 534 gms in 2009 ie a reduction of about 3-4 per cent in both periods
To assess the proportion of people who are protein-deprived a cut-off of 60 (gms) of protein
Fig 5 Protein Intake Distribution in Rural India
Fig 6 Protein Intake Distribution in Urban India
24 29 29
34
38 41
23
21 21
20 12 9
0
10
20
30
40
50
60
70
80
90
100
1993-94 2004-05 2009-10
Pro
po
rtio
n o
f P
op
ula
tio
n (
)
Protein Intake Distribution Rural India
lt45 46ndash60 61ndash75 gt75 gms
25 29 29
38 35
44
23 25 20
14 11 7
0
10
20
30
40
50
60
70
80
90
100
1993-94 2004-05 2009-10
Pro
po
rtio
n o
f P
op
ula
tio
n (
)
Protein Intake Distribution Urban India
lt45 46ndash60 61ndash75 gt75 gms
6
intake is used5 Figures 5 and 6 show the distribution of protein in rural and urban India
between 1993 and 2010 Detailed tables containing the mean protein intakes are given in the
annexure
While protein deficiency is in large measure linked to calorie deficiency we note that well
over 57 of rural households consumed fewer than the required protein intake in 1993 Just
under a quarter of the households consumed lt45 (gms) of protein Within both ranges of
protein intake the proportions rose more than moderately (eg in the lower range the
proportion of households rose from about 24 in 1993 to about 29 in 2004 in the higher
range the proportion rose from 57 in 1993 to 66 in 2004 to 70 in 2009) Although the
mean intake of protein for households in the lower range remained unchanged it reduced
from 60 gms in 1993 to 56 gms in 2004 and 54 gms in 2009
The share of protein-deficient households in urban India (considering the 60 gm cut-off)
remained unchanged between 1993 and 2004 but increased substantially between 2004 and
2009 Overall mean protein intakes however reduced
Figures 7 and 8 report protein Engel curves for rural and urban India between 1993ndash2009
The ruralndashurban contrast in protein intake is striking In the rural areas protein intake was
consistently lower across expenditure classes in 2009 than in 2004 which in turn was lower
than in 1993 The gap between 1993 and 2004 intakes widens considerably at higher MPCE
Fig 7 Protein Engel Curves for Rural India
Fig 8 Protein Engel Curves for Urban India
5 For details see Gopalan et al (1971 1992) and ICMR (1990)
7
In urban areas the 2004 curve was above the 1993 curve at low levels of MPCE and after the
cross-over expenditure of about Rs 500 the former lay below the 1993 curve The 2009 curve
lies above the 2004 curve at lower levels of MPCE and below the 2004 curve at higher levels
Fats
Mean fat intake increased substantially between 1993-94 and 2004-05 In rural areas the
mean fat intake increased by 12 per cent from 315 gms in 1993 to 354 gms in 2004 In
urban areas the mean fat intake increased by 13 per cent from 421 gms in 1993 to 475 gms
in 2004 The increase in fat intakes in the second period ie 2004-05 and 2009-10 were more
moderate Mean fat intakes increased to 382 gms (increase of 8 per cent) in rural areas and
489 gms (increase of 3 per cent) in urban areas
Although a precise range for fat requirements cannot be specified a range of 40ndash60 (gms) of
fat intake is desirable6 Figures 9 and 10 show the distribution of fat in rural and urban India
between 1993 and 2009 Detailed tables containing the mean fat intakes are given in the
annexure
Fig 9 Fat Intake Distributions for Rural India
Fig 10 Fat Intake Distributions for Urban India
6 Gopalan et al (1971) observe lsquoThe quantity of fat that should be included in a well balanced diet is not known
with any degree of certainty However it appears desirable in the present state of knowledge that the daily
intake of fat should be such that it contributes no more than 15 to 20 of the calories in the diet A total of
about 40 to 60 gms of fat can therefore be safely consumed daily and in order to obtain the necessary amounts
of essential fatty acids the fat intake should include at least 15 gms of vegetable oilsrsquo (pg 8) Also see ICMR
(1990)
34 23
14
25
27
24
26 34
40
15 17 21
0
10
20
30
40
50
60
70
80
90
100
1993 2004 2010
Pro
po
rtio
n o
f P
op
ula
tio
n (
)
Fat Intake Distribution Rural India
lt20 21ndash30 31ndash50 gt50 gms
25 15 10
30
31 28
26 32
37
19 22 25
0
10
20
30
40
50
60
70
80
90
100
1993 2004 2010
Pro
po
rtio
n o
f P
op
ula
tio
n (
)
Fat Intake Distribution Urban India
lt25 26ndash40 41ndash60 gt60 gms
8
Even considering the first three ranges of fat intake an astonishingly high estimate for fat
deficient households for rural India (over 85) is obtained for 1993 Well over one-third of
households were under the lowest range of lt20 (gms) The corresponding household share
with fat intakes lt50 gms fell to over 83 in 2004 and 79 in 2009 The share of households
consuming lt20 gms of fat fell sharply (from over 34 in 1993 to well over 22 in 2004 and
14 in 2009) Mean fat intakes increased over the period 1993 to 2009
Using higher ranges of fat intake for urban areas fat deprivation was pervasive (about 81 of
the households consumed lt60 gms of fats in 1993) About a quarter consumed lt25 gms
Over the period 1993ndash2009 the reduction in the proportion of fat- deprived was slight (from
81 in 1993 to 78 in 2004 to 75 in 2009) However as in rural India the proportion
consuming fats lt25 gms fell sharply Mean fat intake increased
Figures 11 and 12 show the Engel curves for fat In rural areas the fat Engel curves for 1993
lay below that for 2004 at lower levels of MPCE The 2009 curve lies above the 2004 curve
at lower levels of MPCE The crossover is at approximately Rs650 In urban areas the
crossover is at Rs1000 The curves converge beyond this
Fig 11 Fat Engel Curves for Rural India
Fig 12 Fat Engel Curves for Urban India
Thus taking nutritional norms as valid the overall picture of nutritional deprivation
worsened considerably over the period 1993ndash2009 The following Kernel density functions
(figure 13) clearly show a leftward shift in calorie and protein intake distributions and a
rightward shift in the fat intake distribution in both rural and urban areas between 1993 and
20097
7 For an admirably clear exposition of kernel density functions see Deaton (1995)
9
Fig 13 Kernel Density Functions for Calories Proteins and Fats consumed ndash Rural and
Urban India (1993 ndash 2009)
12 Factors Underlying Changes in Diets and Nutrition
We build on the DD analysis (2009) of food commodities that contributed to reduction in
calories protein and increase in fat consumption
10
Figure 14 shows the distribution of calorie protein and fat intake by food commodities for
rural and urban areas between 1993 and 2009 Detailed tables containing mean per capita
intake of nutrients from the various food items are given in the annexure
In rural India calorie intakes declined between 1993 and 2009 Most of it is attributable to
the decline in calories from cereals and pulses to some extent Calories from cereals reduced
from 1530 in 1993 to 1383 in 2004 and 1296 in 2009 The contribution of milkmilk
products sugar fruits and vegetables remained largely unchanged between 1993 and 2009
The contribution of vanaspati oil to the calorie intake increased substantially Calories
obtained from oil increased from 111 in 1993 to 145 in 2004 and 169 in 2009
Similar results are found for urban areas as well The reduction in the contribution of pulses
to calorie intakes was more drastic in urban areas between 2004 and 2009
71
68
64
58
56
54
6
7
7
9
9
10
5
7
8
8
10
11
5
5
5
6
6
6
1
1
1
1
1
1
7
8
4
11
12
5
1
1
1
2
2
2
4
4
4
5
5
4
0 10 20 30 40 50 60 70 80 90 100
1993-94
2004-05
2009-10
1993-94
2004-05
2009-10
Fig 14 Calorie Intake by Food Commodities 1993 2004 and 2009
Cereals Milk Vanaspati-Oil Sugar Eggs amp Meats Pulses Fruits Vegetables
RU
RA
L U
RB
AN
11
In both rural and urban areas protein intake declined between 1993 and 2009 (Figure 15)
Much of it is reflected in a reduction in protein intake from cereals and pulses In rural areas
the protein intake from these commodities decreased from 50 gms in 1993 to 45 gms in 2004
and 40 gms in 2009 The corresponding numbers for urban areas are 44 gms (1993) 42 gms
(2004) and 37 gms (2009) Intake from dairy products (milk eggs and meats) increased
moderately Proteins from other sources are a very small fraction and largely remained
unchanged between 1993 and 2009
Between 1993-2009 fat intake rose in both rural and urban areas Vanaspati-oil has the
maximum share in total fat intakes and its contribution rose over the period 1993 and 2009
In rural areas fat intake from vanaspati-oil rose from 12 gms in 1993 to 16 gms in 2004 and
19 gms in 2009 In urban areas the share of vanaspati-oil rose from 19 gms in 1993 to 22
gms in 2004 and 24 gms in 2009 The other significant contributor to fat intake are cereals
pulses and milk products (including ghee and butter) but their contribution reduced between
1993 and 2009 Declining intake of fats from these commodities were more than offset by the
increased intake of fat from vanaspati-oil
69
68
66
60
58
57
9
9
10
12
13
14
4
5
5
6
6
6
13
13
10
17
18
12
5
6
5
6
7
6
0 10 20 30 40 50 60 70 80 90 100
1993-94
2004-05
2009-10
1993-94
2004-05
2009-10
Fig 15 Protein Intake by Food Commodities 1993 2004 and 2009
Cereals Milk Eggs amp Meats Pulses Fruits amp Vegetables
RU
RA
L U
RB
AN
12
13 Demand Theory Based Explanation of Changes in Nutrient Intake
In response to the DeatonndashDreze (2009) explanation of a downward shift in the calorie Engel
curve in terms of lower lsquorequirementsrsquo due to health improvements and less strenuous
activity levels and more sedentary life-styles we have developed an alternative explanation
of changes in the consumption of calories protein and fats over the period 1993ndash2009 This
explanation is embedded in a standard demand theory framework with food prices8 and
expenditure (as a proxy for income) cast in a pivotal role Based on different experiments
robust demand functions are estimated for each of the three nutrients viz calories protein and
fats (Tables 1-3) Our results show consistently robust food price and expenditure effects
thus raising further doubts about the adequacy of the DD explanation The analysis is based
8 An important point to bear in mind is that the price effects capture both own and cross-price effects through
substitutions between food commodities Briefly as prices change demands for commodities change and
consequently calorie (and other nutrientsrsquo) intakes Underlying this is a presumption that food choices are
informed by their nutritional content As Deaton and Dreze (2009) emphasise people do not buy calories and
other nutrients but food commodities However if food choices are informed by their nutritional values it is
meaningful to talk about demands for calories and other nutrients
17
14
11
10
8
7
31
27
26
31
29
30
39
46
49
44
47
49
2
1
1
2
2
1
8
9
3
10
12
3
4
3
3
4
3
3
0 10 20 30 40 50 60 70 80 90 100
1993-94
2004-05
2009-10
1993-94
2004-05
2009-10
Fig 16 Fat Intake by Food Commodities 1993 2004 and 2009
Cereals Milk Vanaspati-Oil Eggs amp Meats Pulses Fruits amp Vegetables
RU
RA
L U
RB
AN
13
on unit record data collected for the 50th
61st and 66
th rounds of the NSS (corresponding to
the years 1993ndash94 2004ndash05 and 2009-10 respectively) We will discuss separately the
results for rural and urban samples
(a) Demand Function
A basic demand equation for nutrients (calories protein fats) in rural and urban India with
pooled data for 1993 2004 and 2009 is given below
(1)
where the dependent variable is log of nutrient consumed by ith household in time t jtP is a
vector of food prices computed from the NSS at the village level (j) and time t E it is
household per capita expenditure for ith household in time t itX is a vector of household
characteristics (eg number of adult males females household size ) and a few others
specified as dummy variables (caste) D1t is a dummy variable that takes the value 1 for 2004
and 0 otherwise (to allow for changes in factors other than food prices and expenditure over
time) D2t+k is the second time dummy that takes the value 1 for 2009 and 0 otherwise and
it is the error term This equation is estimated using robust regression Although a Chow test
for a structural shift is not feasible with robust regression we have employed two
refinements one is the use of a time dummy that could potentially capture the health
improvements and less strenuous activity patterns (associated with easier access to drinking
water better transportation facilities) and the other is interactions of food price variables
with the time dummy to allow for different price and expenditure effects over time9
An important point to bear in mind is that the price effects capture both own and cross-price
effects through substitutions between food commodities Briefly as prices change demands
for commodities change and consequently for example calorie (and other nutrientsrsquo) intakes
9 While these effects yield insights into changing consumer demands a more detailed analysis along the lines of
Behrman and Deolalikar (1989) and Jha et al (2009) would further deepen our understanding consumer
preferences and tastes for variety
14
(b) Results
We first consider the calorie demand function For both rural and urban areas each of the
price effects has a significant negative coefficient with the exception of price of fruits and
vegetables whose coefficient in not significant Moreover the price effects on the demand for
calories have in many cases weakened as captured by the coefficients of the interaction term
(ie interaction between the price and the time dummies) A case in point is price of cereals
and pulses Rising incomes have a positive impact on calorie demand and so does the
proportion of adults in the household The former effect however weakened over time As
household size increases calorie demand decreases Education of adult female has a negative
impact on calorie demand as this may be attributed to consumption of a more balanced diet
rich in protein and vitamins and reduced dependence on cereals which is a major source of
calories By contrast education of adult male is not significant in rural areas but positive in
urban areas SCs have lower demands for calories in both rural and urban areas while that of
Others is positive in rural areas and negative in urban areas relative to STs The effect of time
alone is reduced consumption of calorie between 1993 and 2004 However somewhat
surprisingly the residual time effect is not significant between 2004-09 That this undermines
the DD explanation emphasising lower calorie requirements due to improvements in the
epidemiology of the disease environment less strenuous physical activities and more
sedentary life styles cannot be ruled out
In case of protein demand in both rural and urban areas there is a positive influence of the
price of fruits and vegetables whereas the elasticity of protein demand with respect to all
other food prices is negative As in the case of calorie demand several price effects
weakened over over time as captured by the interaction term (between food prices and the
time dummies) A case in point is price of milk and milk products eggs and meats Higher
incomeexpenditure increase protein demand but less so over time Increasing household size
reduces protein demand whereas rising proportion of adults in the household increases it
The impact of education of adult female is negative and that of education of adult male is
not significant SCs have lower demand for protein while Others have higher demand relative
to STs The residual effect of time after accounting for the interaction is significant with a
negative coefficient suggesting a lower demand for protein in 2009 and 2004 as compared to
1993
15
In case of fats too in both rural and urban areas there are significant price and expenditure
effects ndash positive in the case of price of cereals oil and fruits and vegetables and negative in
case of milk products and sugar The positive price elasticity of fats with respect to edible oil
price is somewhat surprising although the price effect has weakened over time MPCE has
positive Unlike in the case of calorie and protein highest education of adult female has a
positive impact on fat demand suggesting that households with females having higher than
middle level of education tend to eat diets rich in fats shifting away from diets rich in
calories and proteins Moreover highest education of adult male also has a positive and
significant effect As in the case of calorie and protein household size has a negative impact
and proportion of adults in a household has a positive impact on demand for fats SCs and
Others have higher demands relative to STs The effect of time alone is to increase the fat
demand in 2009 and 2004 as compared to 1993
2 Concluding Observations
The main findings of our analysis are summarised below from a policy perspective
An important insight from the comparison of three rounds of the NSS over the period 1993-
2009 points to a slowing down of the reduction in the calorie intake in both rural and urban
areas in 2004-09 relative to 1993-2004 A similar slowing down occurred in protein intake
over the more recent period (2004-09) While fat intake continued to rise over this period but
at a lower rate
A demand theory based explanation of changes in demands for these nutrients reaffirmed the
important roles of food price and expenditure changes A new insight however is that in
several cases food price effects weakened over time as also expenditure effects While the
residual time effect weakened for both calories and protein over the period 1993-2004 it
slowed down over the more recent period The effect of time on fat demand was however
positive and strengthened over the more recent period Altogether thus the DD explanation of
lower calorie and protein demands over time as a result of lower requirements is further
undermined
From a policy perspective the important roles of food price stabilisation and expansion of
livelihood opportunities remain key to ameliorating nutritional deprivation despite lowering
of nutritional requirements A closer scrutiny of dietary preferences and tastes is crucial for
16
both understanding sources of nutritional deprivation and for designing effective policies for
mitigating it
17
Table 1 Robust Regression Estimates Demand for Calories 1993-2009
RURAL URBAN
Dependent Variable Log of Per capita consumption
of calories
No of Obs = 193785 No of Obs = 124481
F(60193724) = 1192631 F(60124420) = 370511
Prob gt F = 0 Prob gt F = 0
Coefficient Elasticity Coefficient Elasticity
Price Cereals amp Pulses -0012 (-2524) -0166 (-2524) -0006 (-102) -0090 (-102)
---interaction T1 (2004) 0011 (2072) 0049 (2072) 0001 (096) - 0003 (096) -
---interaction T2 (2009) 0010 (2005) 0071 (2005) 0004 (699) 0037 (699)
Price Milk Milk Products Eggs amp Meats
-0003 (-6421) -0098 (-6421) -0001 (-1253) -0035 (-1253)
---interaction T1 (2004) 0002 (4288) 0026 (4288) 0000 (329) 0003 (329)
---interaction T2 (2009) 0002 (4983) 0040 (4983) 0001 (904) 0013 (904)
Price Oil -0008 (-2667) -0086 (-2667) -0004 (-101) -0048 (-101)
---interaction T1 (2004) 0004 (1175) 0015 (1175) 0001 (189) 0003 (189)
---interaction T2 (2009) 0006 (1934) 0031 (1934) 0004 (994) 0024 (994)
Price Sugar -0002 (-127) -0124 (-127) -0004 (-1209) -0183 (-1209)
---interaction T1 (2004) 0002 (1136) 0050 (1136) 0003 (1029) 0061 (1029)
---interaction T2 (2009) 0001 (704) 0027 (704) 0002 (516) 0033 (516)
Price Fruits amp Vegetables
-0001 (-116) - -0010 (-116) - 0001 (194) 0026 (194)
---interaction T1 (2004) 0001 (275) 0010 (275) 0000 (026) - 0001 (026) -
---interaction T2 (2009) -0001 (-174) -0007 (-174) -0003 (-392) -0027 (-392)
Monthly per capita expenditure
0001 (40195) 0418 (40195) 0000 (22549) 0240 (22549)
---interaction T1 (2004) 0000 (-1160) -0054 (-1160) 0000 (-2386) -0011 (-2386)
---interaction T2 (2009) 0000 (-1712) -0063 (-1712) 0000 (-5097) -0022 (-5097)
Household Size -0006 (-3076) -0033 (-3076) -0021 (-684) -0096 (-684)
Proportion of Adults in the household
0202 (9139) 0137 (9139) 0235 (8183) 0169 (8183)
Education Dummy Males 0000 (-023) - 0000 (-023) - 0012 (805) 0008 (805)
Education Dummy Females
-0025 (-215) -0008 (-215) -0013 (-952) -0007 (-952)
Time Dummy (2004) -0159 (-1893) -0061 (-1893) -0105 (-829) -0036 (-829)
Time Dummy (2009) -0007 (-069) - -0002 (-069) - 0006 (045) - 0002 (045) -
Caste Dummy (SC) -0011 (-586) -0002 (-586) -0017 (-498) -0002 (-498)
Caste Dummy (Others) 0010 (616) 0006 (616) -0005 (-177) -0004 (-177)
Constant 7569 (89023)
7712 (59282)
and refer to significance at the 1 5 and 10 level respectively
State Dummies are omitted and details will be furnished on request Education Dummy If highest level of education is middle or lower then dummy = 0 else=1 Omitted Time period 1993 Omitted caste ST
18
Table 2 Robust Regression Estimates Demand for Protein 1993-2009
RURAL URBAN
Dependent Variable
Log of Per capita consumption of protein
No of Obs = 193784 No of Obs = 124481
F(60193723) = 1144586 F(60124420) = 391491
Prob gt F = 0 Prob gt F = 0
Coefficient Elasticity Coefficient Elasticity
Price Cereals amp Pulses -0013 (-2392) -0169 (-2392) -0009 (-1508) -0144 (-1508)
---interaction T1 (2004) 0013 (2153) 0055 (2153) 0005 (662) 0019 (662)
---interaction T2 (2009) 0012 (2187) 0084 (2187) 0009 (1386) 0079 (1386)
Price Milk Milk Products Eggs amp Meats
-0003 (-7497) -0123 (-7497) 0000 (-373) -0011 (-373)
---interaction T1 (2004) 0002 (4993) 0032 (4993) 0000 (-196) -0002 (-196)
---interaction T2 (2009) 0003 (5815) 0050 (5815) 0000 (264) 0004 (264)
Price Oil -0010 (-3216) -0112 (-3216) -0007 (-1709) -0088 (-1709)
---interaction T1 (2004) 0005 (1623) 0022 (1623) 0003 (658) 0012 (658)
---interaction T2 (2009) 0007 (2218) 0038 (2218) 0006 (1562) 0041 (1562)
Price Sugar -0002 (-1085) -0114 (-1085) -0003 (-844) -0139 (-844)
---interaction T1 (2004) 0002 (941) 0045 (941) 0001 (337) 0022 (337)
---interaction T2 (2009) 0001 (249) 0010 (249) 0000 (082) - 0006 (082) -
Price Fruits amp Vegetables
0002 (42) 0040 (42) 0002 (244) 0036 (244)
---interaction T1 (2004) 0000 (084) - 0003 (084) - -0001 (-081) - -0004 (-081) -
---interaction T2 (2009) -0003 (-652) -0030 (-652) -0003 (-366) -0027 (-366)
Monthly per capita expenditure
0001 (39184) 0438 (39184) 0000 (21912) 0254 (21912)
---interaction T1 (2004) 0000 (-1004) -0051 (-1004) 0000 (-1527) -0008 (-1527)
---interaction T2 (2009) 0000 (-1389) -0058 (-1389) 0000 (-3705) -0017 (-3705)
Household Size -0005 (-2368) -0027 (-2368) -0018 (-5526) -0084 (-5526)
Proportion of Adults in the household
0198 (8293) 0134 (8293) 0226 (7247) 0163 (7247)
Education Dummy
Males 0001 (116) - 0001 (116) - 0012 (743) 0008 (743)
Education Dummy Females
-0025 (-2031) -0008 (-2031) -0014 (-947) -0008 (-947)
Time Dummy (2004) -0210 (-2315) -0081 (-2315) -0050 (-36) -0017 (-36)
Time Dummy (2009) -0031 (-284) -0009 (-284) -0047 (-307) -0015 (-307)
Caste Dummy (SC) -0007 (-364) -0001 (-364) -0007 (-187) -0001 (-187)
Caste Dummy (Others) 0011 (623) 0007 (623) 0005 (143) - 0004 (143) -
Constant 3952 (43144)
4101 (28987)
and refer to significance at the 1 5 and 10 level respectively
State Dummies are omitted and details will be furnished on request Education Dummy If highest level of education is middle or lower then dummy = 0 else=1 Omitted Time period 1993 Omitted caste ST
19
Table 3 Robust Regression Estimates Demand for Fats 1993- 2009
RURAL URBAN
Dependent Variable Log of Per capita
consumption of Fats
No of Obs = 193784 No of Obs = 124481
F(60193723) = 1895778 F(60124420) = 766201
Prob gt F = 0 Prob gt F = 0
Coefficient Elasticity Coefficient Elasticity
Price Cereals amp Pulses 0016 (2033) 0218 (2033) 0012 (1462) 0193 (1462)
---interaction T1 (2004) -0005 (-598) -0023 (-598) -0008 (-871) -0035 (-871)
---interaction T2 (2009) -0009 (-1067) -0062 (-1067) -0006 (-661) -0052 (-661)
Price Milk Milk Products Eggs amp Meats
-0013 (-1924) -0478 (-1924) -0009 (-7698) -0327 (-7698)
---interaction T1 (2004) 0008 (10509) 0106 (10509) 0005 (3537) 0056 (3537)
---interaction T2 (2009) 0010 (13313) 0172 (13313) 0007 (5587) 0121 (5587)
Price Oil 0002 (445) 0023 (445) 0007 (1364) 0097 (1364)
---interaction T1 (2004) -0001 (-251) -0005 (-251) -0003 (-571) -0014 (-571)
---interaction T2 (2009) -0002 (-429) -0011 (-429) -0004 (-801) -0029 (-801)
Price Sugar -0004 (-1365) -0217 (-1365) -0003 (-75) -0170 (-75)
---interaction T1 (2004) 0001 (306) 0022 (306) 0001 (123) - 0011 (123) -
---interaction T2 (2009) -0001 (-169) -0011 (-169) -0002 (-42) -0040 (-42)
Price Fruits amp Vegetables
0011 (1418) 0206 (1418) 0006 (615) 0125 (615)
---interaction T1 (2004) -0010 (-1227) -0070 (-1227) -0006 (-556) -0037 (-556)
---interaction T2 (2009) -0011 (-1392) -0097 (-1392) -0008 (-74) -0076 (-74)
Monthly per capita expenditure
0001 (44365) 0753 (44365) 0000 (28858) 0462 (28858)
---interaction T1 (2004) 0000 (-1279) -0098 (-127) 0000 (-1896) -0014 (-1896)
---interaction T2 (2009) -0001 (-2100) -0126 (-2100) 0000 (-8414) -0054 (-8414)
Household Size -0019 (-5556) -0097 (-5556) -0039 (-8497) -0179 (-8497)
Proportion of Adults in the household
0165 (4584) 0112 (4584) 0188 (4368) 0135 (4368)
Education Dummy Males
0056 (3204) 0029 (3204) 0086 (3825) 0060 (3825)
Education Dummy Females
0031 (167) 0010 (167) 0086 (4086) 0048 (4086)
Time Dummy (2004) 0299 (2175) 0115 (2175) 0161 (845) 0055 (845)
Time Dummy (2009) 0564 (3391) 0165 (3391) 0360 (1697) 0114 (1697)
Caste Dummy (SC) 0052 (174) 0009 (174) 0040 (764) 0005 (764)
Caste Dummy (Others) 0135 (5278) 0090 (5278) 0108 (2307) 0086 (2307)
Constant 3023 (21787)
3474 (17776)
and refer to significance at the 1 5 and 10 level respectively
State Dummies are omitted and details will be furnished on request Education Dummy If highest level of education is middle or lower then dummy = 0 else=1 Omitted Time period 1993 Omitted caste ST
20
Annexure 1 Distribution of Nutrient Intake (1993 ndash 2009)
The following tables show the distribution of nutrient intake (proportion of population in
each category) in rural and urban areas between 1993 and 2009 Figures in parenthesis
indicate the mean nutrient intake in each range
Table 1 Calorie Intake Distributions in Rural India 1993 2004 and 2009
Year Range of Calorie Intake Per Capita Per Day
Total lt1800 1801ndash2400 2401ndash3000 gt3000
1993 3109 (1491)
4007 (2084)
1942 (2650)
942 (3636)
100 (2156)
2004 3668
(1516)
4311
(2071)
1507
(2629)
514
(3925)
100
(2047)
2010 3528
(1531)
4591
(2071)
1492
(2622)
389
(3545)
100
(2020)
Table 2 Calorie Intake Distributions in Urban India 1993 2004 and 2009
Year
Range of Calorie Intake Per Capita Per Day
Total lt1700 1701ndash2100 2101ndash2600 gt2600
1993 2812
(1426)
2962
(1900)
2576
(2320)
1649
(3107)
100
(2074)
2004 2940
(1440)
3452
(1900)
2467
(2313)
1141
(3252)
100
(2021)
2010 3010
(1456)
3534
(1896)
2436
(2312)
1019
(3043)
100
(1982)
Table 3 Protein Intake Distributions in Rural India 1993 2004 and 2009
Year Range of Protein Intake Per Capita Per Day (Gms)
Total lt45 46ndash60 61ndash75 gt75
1993 2381
(371)
3379
(524)
2279
(668)
1961
(944)
100
(603)
2004 2881
(374)
3805
(522)
2146
(663)
1168
(939)
100
(558)
2010 2935
(380)
4081
(521)
2105
(661)
879
(892)
100
(541)
21
Table 4 Protein Intake Distributions in Urban India 1993 2004 and 2009
Year Range of Protein Intake Per Capita Per Day (Gms)
Total lt45 46ndash60 61ndash75 gt75
1993 2490
(371)
3777
(524)
2311
(665)
1423
(907)
100
(573)
2004 2940
(378)
3450
(523)
2469
(662)
1140
(949)
100
(554)
2010 2944
(383)
4366
(521)
1961
(661)
729
(876)
100
(534)
Table 5 Fat Intake Distributions in Rural India 1993 2004 and 2009
Year Range of Fat Intake Per Capita Per Day (Gms)
Total lt20 21ndash30 31ndash50 gt50
1993 3430
(140)
2508
(247)
2609
(383)
1454
(721)
100
(315)
2004 2259
(150)
2721
(249)
3358
(383)
1662
(746)
100
(354)
2010 1420
(154)
2405
(251)
4049
(388)
2125
(672)
100
(382)
Table 6 Fat Intake Distributions in Urban India 1993 2004 and 2009
Year Range of Fat Intake Per Capita Per Day (Gms)
Total lt25 26ndash40 41ndash60 gt60
1993 2504
(182)
2984
(323)
2615
(486)
1897
(802)
100
(421)
2004 1539
(194)
3102
(326)
3156
(489)
2204
(858)
100
(474)
2010 1032
(198)
2788
(330)
3661
(490)
2519
(781)
100
(489)
Source Authorsrsquo calculations based on the 50th 61
st and 66
th rounds of the NSS
22
Annexure 2 Distribution of Nutrient Intake by Food Commodities (1993 -2009)
The following tables show the distribution of nutrient (calorie protein and fat) intake from
nine food commodity groups for rural and urban areas between 1993 and 2009
Table 1 Mean Per Capita Calorie Intake by Food Commodities 1993 2004 and 2009
Year Cereals Milk
Products GheeButter
Vanaspati-Oil
Sugar Eggs MeatFish Poultry
PulsesNuts Dry Fruits
Fruits Vegetables Total
Rural India
1993-94 1530 137 111 103 2 12 151 20 89 2156
Share 710 64 51 48 01 06 70 09 41
2004-05 1383 137 145 98 3 12 156 23 90 2047
Share 676 67 71 48 01 06 76 11 44
2009-10 1296 141 169 93 3 12 84 20 83 2020
Share 642 70 84 46 01 06 42 10 41
Urban India
1993-94 1213 181 168 129 5 16 231 37 94 2074
Share 585 87 81 62 02 08 111 18 45
2004-05 1133 189 199 115 6 16 235 36 92 2021
Share 561 94 98 57 03 08 116 18 46
2009-
10 1071 199 217 110 5 14 106 33 83 1982
Share 540 100 109 55 03 07 53 17 42
Table 2 Mean Per Capita Protein Intake by Food Commodities 1993 2004 and 2009
Year Cereals Milk
Products GheeButter
Vanaspati-Oil
Sugar Eggs MeatFish Poultry
PulsesNuts Dry Fruits
Fruits Vegetables Total
Rural India
1993-94 418 53 0 0 02 2 78 02 29 603
Share 693 88 00 00 03 33 129 03 48
2004-05 379 53 0 0 03 2 73 03 28 558
Share 679 95 00 00 05 36 131 05 50
2009-10 356 55 0 0 03 2 53 02 25 541
Share 658 102 00 00 06 37 98 04 46
Urban India
1993-94 341 67 0 0 04 26 10 04 31 573
Share 595 117 00 00 07 45 175 07 54
2004-05 32 7 0 0 05 27 98 04 31 554
Share 578 126 00 00 09 49 177 07 56
2009-
10 302 74 0 0 04 26 65 04 27 534
Share 566 139 00 00 07 49 122 07 51
23
Table 3 Mean Per Capita Fat Intake by Food Commodities 1993 2004 and 2009
Year Cereals Milk
Products GheeButter
Vanaspati-Oil
Sugar Eggs MeatFish Poultry
PulsesNuts Dry Fruits
Fruits Vegetables Total
Rural India
1993-94 54 97 123 0 02 03 24 07 04 315
Share 171 308 390 00 06 10 76 22 13
2004-05 48 97 162 0 03 02 31 08 04 354
Share 136 274 458 00 08 06 88 23 11
2009-10 43 10 187 0 03 02 11 08 03 382
Share 113 262 490 00 08 05 29 21 08
Urban India
1993-94 4 132 186 0 04 04 4 11 04 421
Share 95 314 442 00 10 10 95 26 10
2004-05 37 138 221 0 05 03 56 11 04 475
Share 78 291 465 00 11 06 118 23 08
2009-
10 35 145 241 0 04 02 15 11 04 489
Share 72 297 493 00 08 04 31 22 08
Source Authorsrsquo calculations based on the 50th 61
st and 66
th rounds of the NSS
24
References
Behrman J and A Deolalikar (1989) ldquoIs Variety the Spice of life Implications for Calorie
Intakerdquo Review of Economics and Statistics vol 71
Deaton A (1995) The Analysis of Household Surveys A Microeconomic approach to
Development Policy Baltimore MD The Johns Hopkins University Press
Deaton A and J Dreze (2009) lsquoFood and Nutrition in India Facts and Interpretationsrsquo
Economic and Political Weekly XLIV(7) 42ndash65
Gaiha R R Jha and Vani S Kulkarni (2012) ldquoDemand for Nutrients in India 1993 to
2004rdquo Applied Economics available online 1 February 2012
Gopalan C B Sastri and S Balasubramanian (1971) Nutritive Value of Indian Foods
National institute of Nutrition Indian Council of Medical Research Hyderabad
Indian Council of Medical Research (ICMR 1990) Nutrient Requirements and
Recommended Dietary Allowances for Indians New Delhi ICMR
Jha R R Gaiha and A Sharma (2009) ldquo Modelling Variety in Consumption Expenditure on
Food in Indiardquo International Review of Applied Economics online publication 1
July 2009
Srinivasan TN (1992) lsquoUndernutrition Concepts Measurements and Policy Implicationsrsquo
in SR Osmani (ed) Nutrition and Poverty Clarendon Press Oxford pp 97ndash120
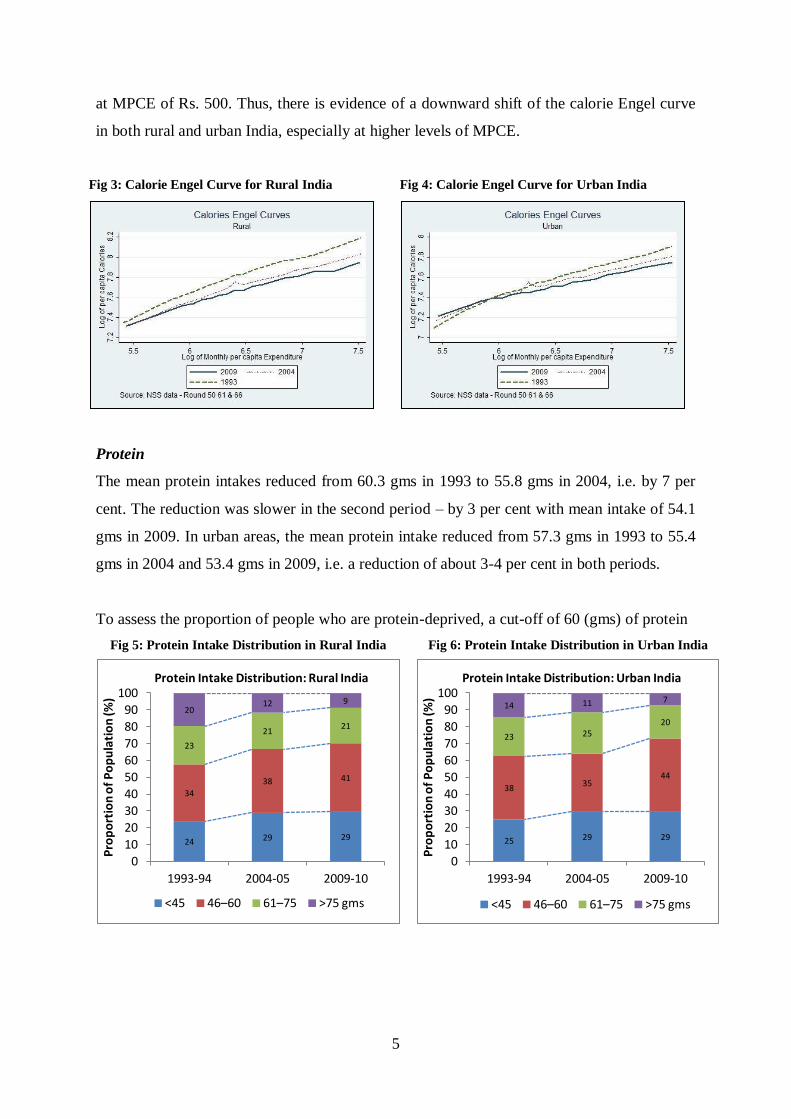
5
at MPCE of Rs 500 Thus there is evidence of a downward shift of the calorie Engel curve
in both rural and urban India especially at higher levels of MPCE
Fig 3 Calorie Engel Curve for Rural India
Fig 4 Calorie Engel Curve for Urban India
Protein
The mean protein intakes reduced from 603 gms in 1993 to 558 gms in 2004 ie by 7 per
cent The reduction was slower in the second period ndash by 3 per cent with mean intake of 541
gms in 2009 In urban areas the mean protein intake reduced from 573 gms in 1993 to 554
gms in 2004 and 534 gms in 2009 ie a reduction of about 3-4 per cent in both periods
To assess the proportion of people who are protein-deprived a cut-off of 60 (gms) of protein
Fig 5 Protein Intake Distribution in Rural India
Fig 6 Protein Intake Distribution in Urban India
24 29 29
34
38 41
23
21 21
20 12 9
0
10
20
30
40
50
60
70
80
90
100
1993-94 2004-05 2009-10
Pro
po
rtio
n o
f P
op
ula
tio
n (
)
Protein Intake Distribution Rural India
lt45 46ndash60 61ndash75 gt75 gms
25 29 29
38 35
44
23 25 20
14 11 7
0
10
20
30
40
50
60
70
80
90
100
1993-94 2004-05 2009-10
Pro
po
rtio
n o
f P
op
ula
tio
n (
)
Protein Intake Distribution Urban India
lt45 46ndash60 61ndash75 gt75 gms
6
intake is used5 Figures 5 and 6 show the distribution of protein in rural and urban India
between 1993 and 2010 Detailed tables containing the mean protein intakes are given in the
annexure
While protein deficiency is in large measure linked to calorie deficiency we note that well
over 57 of rural households consumed fewer than the required protein intake in 1993 Just
under a quarter of the households consumed lt45 (gms) of protein Within both ranges of
protein intake the proportions rose more than moderately (eg in the lower range the
proportion of households rose from about 24 in 1993 to about 29 in 2004 in the higher
range the proportion rose from 57 in 1993 to 66 in 2004 to 70 in 2009) Although the
mean intake of protein for households in the lower range remained unchanged it reduced
from 60 gms in 1993 to 56 gms in 2004 and 54 gms in 2009
The share of protein-deficient households in urban India (considering the 60 gm cut-off)
remained unchanged between 1993 and 2004 but increased substantially between 2004 and
2009 Overall mean protein intakes however reduced
Figures 7 and 8 report protein Engel curves for rural and urban India between 1993ndash2009
The ruralndashurban contrast in protein intake is striking In the rural areas protein intake was
consistently lower across expenditure classes in 2009 than in 2004 which in turn was lower
than in 1993 The gap between 1993 and 2004 intakes widens considerably at higher MPCE
Fig 7 Protein Engel Curves for Rural India
Fig 8 Protein Engel Curves for Urban India
5 For details see Gopalan et al (1971 1992) and ICMR (1990)
7
In urban areas the 2004 curve was above the 1993 curve at low levels of MPCE and after the
cross-over expenditure of about Rs 500 the former lay below the 1993 curve The 2009 curve
lies above the 2004 curve at lower levels of MPCE and below the 2004 curve at higher levels
Fats
Mean fat intake increased substantially between 1993-94 and 2004-05 In rural areas the
mean fat intake increased by 12 per cent from 315 gms in 1993 to 354 gms in 2004 In
urban areas the mean fat intake increased by 13 per cent from 421 gms in 1993 to 475 gms
in 2004 The increase in fat intakes in the second period ie 2004-05 and 2009-10 were more
moderate Mean fat intakes increased to 382 gms (increase of 8 per cent) in rural areas and
489 gms (increase of 3 per cent) in urban areas
Although a precise range for fat requirements cannot be specified a range of 40ndash60 (gms) of
fat intake is desirable6 Figures 9 and 10 show the distribution of fat in rural and urban India
between 1993 and 2009 Detailed tables containing the mean fat intakes are given in the
annexure
Fig 9 Fat Intake Distributions for Rural India
Fig 10 Fat Intake Distributions for Urban India
6 Gopalan et al (1971) observe lsquoThe quantity of fat that should be included in a well balanced diet is not known
with any degree of certainty However it appears desirable in the present state of knowledge that the daily
intake of fat should be such that it contributes no more than 15 to 20 of the calories in the diet A total of
about 40 to 60 gms of fat can therefore be safely consumed daily and in order to obtain the necessary amounts
of essential fatty acids the fat intake should include at least 15 gms of vegetable oilsrsquo (pg 8) Also see ICMR
(1990)
34 23
14
25
27
24
26 34
40
15 17 21
0
10
20
30
40
50
60
70
80
90
100
1993 2004 2010
Pro
po
rtio
n o
f P
op
ula
tio
n (
)
Fat Intake Distribution Rural India
lt20 21ndash30 31ndash50 gt50 gms
25 15 10
30
31 28
26 32
37
19 22 25
0
10
20
30
40
50
60
70
80
90
100
1993 2004 2010
Pro
po
rtio
n o
f P
op
ula
tio
n (
)
Fat Intake Distribution Urban India
lt25 26ndash40 41ndash60 gt60 gms
8
Even considering the first three ranges of fat intake an astonishingly high estimate for fat
deficient households for rural India (over 85) is obtained for 1993 Well over one-third of
households were under the lowest range of lt20 (gms) The corresponding household share
with fat intakes lt50 gms fell to over 83 in 2004 and 79 in 2009 The share of households
consuming lt20 gms of fat fell sharply (from over 34 in 1993 to well over 22 in 2004 and
14 in 2009) Mean fat intakes increased over the period 1993 to 2009
Using higher ranges of fat intake for urban areas fat deprivation was pervasive (about 81 of
the households consumed lt60 gms of fats in 1993) About a quarter consumed lt25 gms
Over the period 1993ndash2009 the reduction in the proportion of fat- deprived was slight (from
81 in 1993 to 78 in 2004 to 75 in 2009) However as in rural India the proportion
consuming fats lt25 gms fell sharply Mean fat intake increased
Figures 11 and 12 show the Engel curves for fat In rural areas the fat Engel curves for 1993
lay below that for 2004 at lower levels of MPCE The 2009 curve lies above the 2004 curve
at lower levels of MPCE The crossover is at approximately Rs650 In urban areas the
crossover is at Rs1000 The curves converge beyond this
Fig 11 Fat Engel Curves for Rural India
Fig 12 Fat Engel Curves for Urban India
Thus taking nutritional norms as valid the overall picture of nutritional deprivation
worsened considerably over the period 1993ndash2009 The following Kernel density functions
(figure 13) clearly show a leftward shift in calorie and protein intake distributions and a
rightward shift in the fat intake distribution in both rural and urban areas between 1993 and
20097
7 For an admirably clear exposition of kernel density functions see Deaton (1995)
9
Fig 13 Kernel Density Functions for Calories Proteins and Fats consumed ndash Rural and
Urban India (1993 ndash 2009)
12 Factors Underlying Changes in Diets and Nutrition
We build on the DD analysis (2009) of food commodities that contributed to reduction in
calories protein and increase in fat consumption
10
Figure 14 shows the distribution of calorie protein and fat intake by food commodities for
rural and urban areas between 1993 and 2009 Detailed tables containing mean per capita
intake of nutrients from the various food items are given in the annexure
In rural India calorie intakes declined between 1993 and 2009 Most of it is attributable to
the decline in calories from cereals and pulses to some extent Calories from cereals reduced
from 1530 in 1993 to 1383 in 2004 and 1296 in 2009 The contribution of milkmilk
products sugar fruits and vegetables remained largely unchanged between 1993 and 2009
The contribution of vanaspati oil to the calorie intake increased substantially Calories
obtained from oil increased from 111 in 1993 to 145 in 2004 and 169 in 2009
Similar results are found for urban areas as well The reduction in the contribution of pulses
to calorie intakes was more drastic in urban areas between 2004 and 2009
71
68
64
58
56
54
6
7
7
9
9
10
5
7
8
8
10
11
5
5
5
6
6
6
1
1
1
1
1
1
7
8
4
11
12
5
1
1
1
2
2
2
4
4
4
5
5
4
0 10 20 30 40 50 60 70 80 90 100
1993-94
2004-05
2009-10
1993-94
2004-05
2009-10
Fig 14 Calorie Intake by Food Commodities 1993 2004 and 2009
Cereals Milk Vanaspati-Oil Sugar Eggs amp Meats Pulses Fruits Vegetables
RU
RA
L U
RB
AN
11
In both rural and urban areas protein intake declined between 1993 and 2009 (Figure 15)
Much of it is reflected in a reduction in protein intake from cereals and pulses In rural areas
the protein intake from these commodities decreased from 50 gms in 1993 to 45 gms in 2004
and 40 gms in 2009 The corresponding numbers for urban areas are 44 gms (1993) 42 gms
(2004) and 37 gms (2009) Intake from dairy products (milk eggs and meats) increased
moderately Proteins from other sources are a very small fraction and largely remained
unchanged between 1993 and 2009
Between 1993-2009 fat intake rose in both rural and urban areas Vanaspati-oil has the
maximum share in total fat intakes and its contribution rose over the period 1993 and 2009
In rural areas fat intake from vanaspati-oil rose from 12 gms in 1993 to 16 gms in 2004 and
19 gms in 2009 In urban areas the share of vanaspati-oil rose from 19 gms in 1993 to 22
gms in 2004 and 24 gms in 2009 The other significant contributor to fat intake are cereals
pulses and milk products (including ghee and butter) but their contribution reduced between
1993 and 2009 Declining intake of fats from these commodities were more than offset by the
increased intake of fat from vanaspati-oil
69
68
66
60
58
57
9
9
10
12
13
14
4
5
5
6
6
6
13
13
10
17
18
12
5
6
5
6
7
6
0 10 20 30 40 50 60 70 80 90 100
1993-94
2004-05
2009-10
1993-94
2004-05
2009-10
Fig 15 Protein Intake by Food Commodities 1993 2004 and 2009
Cereals Milk Eggs amp Meats Pulses Fruits amp Vegetables
RU
RA
L U
RB
AN
12
13 Demand Theory Based Explanation of Changes in Nutrient Intake
In response to the DeatonndashDreze (2009) explanation of a downward shift in the calorie Engel
curve in terms of lower lsquorequirementsrsquo due to health improvements and less strenuous
activity levels and more sedentary life-styles we have developed an alternative explanation
of changes in the consumption of calories protein and fats over the period 1993ndash2009 This
explanation is embedded in a standard demand theory framework with food prices8 and
expenditure (as a proxy for income) cast in a pivotal role Based on different experiments
robust demand functions are estimated for each of the three nutrients viz calories protein and
fats (Tables 1-3) Our results show consistently robust food price and expenditure effects
thus raising further doubts about the adequacy of the DD explanation The analysis is based
8 An important point to bear in mind is that the price effects capture both own and cross-price effects through
substitutions between food commodities Briefly as prices change demands for commodities change and
consequently calorie (and other nutrientsrsquo) intakes Underlying this is a presumption that food choices are
informed by their nutritional content As Deaton and Dreze (2009) emphasise people do not buy calories and
other nutrients but food commodities However if food choices are informed by their nutritional values it is
meaningful to talk about demands for calories and other nutrients
17
14
11
10
8
7
31
27
26
31
29
30
39
46
49
44
47
49
2
1
1
2
2
1
8
9
3
10
12
3
4
3
3
4
3
3
0 10 20 30 40 50 60 70 80 90 100
1993-94
2004-05
2009-10
1993-94
2004-05
2009-10
Fig 16 Fat Intake by Food Commodities 1993 2004 and 2009
Cereals Milk Vanaspati-Oil Eggs amp Meats Pulses Fruits amp Vegetables
RU
RA
L U
RB
AN
13
on unit record data collected for the 50th
61st and 66
th rounds of the NSS (corresponding to
the years 1993ndash94 2004ndash05 and 2009-10 respectively) We will discuss separately the
results for rural and urban samples
(a) Demand Function
A basic demand equation for nutrients (calories protein fats) in rural and urban India with
pooled data for 1993 2004 and 2009 is given below
(1)
where the dependent variable is log of nutrient consumed by ith household in time t jtP is a
vector of food prices computed from the NSS at the village level (j) and time t E it is
household per capita expenditure for ith household in time t itX is a vector of household
characteristics (eg number of adult males females household size ) and a few others
specified as dummy variables (caste) D1t is a dummy variable that takes the value 1 for 2004
and 0 otherwise (to allow for changes in factors other than food prices and expenditure over
time) D2t+k is the second time dummy that takes the value 1 for 2009 and 0 otherwise and
it is the error term This equation is estimated using robust regression Although a Chow test
for a structural shift is not feasible with robust regression we have employed two
refinements one is the use of a time dummy that could potentially capture the health
improvements and less strenuous activity patterns (associated with easier access to drinking
water better transportation facilities) and the other is interactions of food price variables
with the time dummy to allow for different price and expenditure effects over time9
An important point to bear in mind is that the price effects capture both own and cross-price
effects through substitutions between food commodities Briefly as prices change demands
for commodities change and consequently for example calorie (and other nutrientsrsquo) intakes
9 While these effects yield insights into changing consumer demands a more detailed analysis along the lines of
Behrman and Deolalikar (1989) and Jha et al (2009) would further deepen our understanding consumer
preferences and tastes for variety
14
(b) Results
We first consider the calorie demand function For both rural and urban areas each of the
price effects has a significant negative coefficient with the exception of price of fruits and
vegetables whose coefficient in not significant Moreover the price effects on the demand for
calories have in many cases weakened as captured by the coefficients of the interaction term
(ie interaction between the price and the time dummies) A case in point is price of cereals
and pulses Rising incomes have a positive impact on calorie demand and so does the
proportion of adults in the household The former effect however weakened over time As
household size increases calorie demand decreases Education of adult female has a negative
impact on calorie demand as this may be attributed to consumption of a more balanced diet
rich in protein and vitamins and reduced dependence on cereals which is a major source of
calories By contrast education of adult male is not significant in rural areas but positive in
urban areas SCs have lower demands for calories in both rural and urban areas while that of
Others is positive in rural areas and negative in urban areas relative to STs The effect of time
alone is reduced consumption of calorie between 1993 and 2004 However somewhat
surprisingly the residual time effect is not significant between 2004-09 That this undermines
the DD explanation emphasising lower calorie requirements due to improvements in the
epidemiology of the disease environment less strenuous physical activities and more
sedentary life styles cannot be ruled out
In case of protein demand in both rural and urban areas there is a positive influence of the
price of fruits and vegetables whereas the elasticity of protein demand with respect to all
other food prices is negative As in the case of calorie demand several price effects
weakened over over time as captured by the interaction term (between food prices and the
time dummies) A case in point is price of milk and milk products eggs and meats Higher
incomeexpenditure increase protein demand but less so over time Increasing household size
reduces protein demand whereas rising proportion of adults in the household increases it
The impact of education of adult female is negative and that of education of adult male is
not significant SCs have lower demand for protein while Others have higher demand relative
to STs The residual effect of time after accounting for the interaction is significant with a
negative coefficient suggesting a lower demand for protein in 2009 and 2004 as compared to
1993
15
In case of fats too in both rural and urban areas there are significant price and expenditure
effects ndash positive in the case of price of cereals oil and fruits and vegetables and negative in
case of milk products and sugar The positive price elasticity of fats with respect to edible oil
price is somewhat surprising although the price effect has weakened over time MPCE has
positive Unlike in the case of calorie and protein highest education of adult female has a
positive impact on fat demand suggesting that households with females having higher than
middle level of education tend to eat diets rich in fats shifting away from diets rich in
calories and proteins Moreover highest education of adult male also has a positive and
significant effect As in the case of calorie and protein household size has a negative impact
and proportion of adults in a household has a positive impact on demand for fats SCs and
Others have higher demands relative to STs The effect of time alone is to increase the fat
demand in 2009 and 2004 as compared to 1993
2 Concluding Observations
The main findings of our analysis are summarised below from a policy perspective
An important insight from the comparison of three rounds of the NSS over the period 1993-
2009 points to a slowing down of the reduction in the calorie intake in both rural and urban
areas in 2004-09 relative to 1993-2004 A similar slowing down occurred in protein intake
over the more recent period (2004-09) While fat intake continued to rise over this period but
at a lower rate
A demand theory based explanation of changes in demands for these nutrients reaffirmed the
important roles of food price and expenditure changes A new insight however is that in
several cases food price effects weakened over time as also expenditure effects While the
residual time effect weakened for both calories and protein over the period 1993-2004 it
slowed down over the more recent period The effect of time on fat demand was however
positive and strengthened over the more recent period Altogether thus the DD explanation of
lower calorie and protein demands over time as a result of lower requirements is further
undermined
From a policy perspective the important roles of food price stabilisation and expansion of
livelihood opportunities remain key to ameliorating nutritional deprivation despite lowering
of nutritional requirements A closer scrutiny of dietary preferences and tastes is crucial for
16
both understanding sources of nutritional deprivation and for designing effective policies for
mitigating it
17
Table 1 Robust Regression Estimates Demand for Calories 1993-2009
RURAL URBAN
Dependent Variable Log of Per capita consumption
of calories
No of Obs = 193785 No of Obs = 124481
F(60193724) = 1192631 F(60124420) = 370511
Prob gt F = 0 Prob gt F = 0
Coefficient Elasticity Coefficient Elasticity
Price Cereals amp Pulses -0012 (-2524) -0166 (-2524) -0006 (-102) -0090 (-102)
---interaction T1 (2004) 0011 (2072) 0049 (2072) 0001 (096) - 0003 (096) -
---interaction T2 (2009) 0010 (2005) 0071 (2005) 0004 (699) 0037 (699)
Price Milk Milk Products Eggs amp Meats
-0003 (-6421) -0098 (-6421) -0001 (-1253) -0035 (-1253)
---interaction T1 (2004) 0002 (4288) 0026 (4288) 0000 (329) 0003 (329)
---interaction T2 (2009) 0002 (4983) 0040 (4983) 0001 (904) 0013 (904)
Price Oil -0008 (-2667) -0086 (-2667) -0004 (-101) -0048 (-101)
---interaction T1 (2004) 0004 (1175) 0015 (1175) 0001 (189) 0003 (189)
---interaction T2 (2009) 0006 (1934) 0031 (1934) 0004 (994) 0024 (994)
Price Sugar -0002 (-127) -0124 (-127) -0004 (-1209) -0183 (-1209)
---interaction T1 (2004) 0002 (1136) 0050 (1136) 0003 (1029) 0061 (1029)
---interaction T2 (2009) 0001 (704) 0027 (704) 0002 (516) 0033 (516)
Price Fruits amp Vegetables
-0001 (-116) - -0010 (-116) - 0001 (194) 0026 (194)
---interaction T1 (2004) 0001 (275) 0010 (275) 0000 (026) - 0001 (026) -
---interaction T2 (2009) -0001 (-174) -0007 (-174) -0003 (-392) -0027 (-392)
Monthly per capita expenditure
0001 (40195) 0418 (40195) 0000 (22549) 0240 (22549)
---interaction T1 (2004) 0000 (-1160) -0054 (-1160) 0000 (-2386) -0011 (-2386)
---interaction T2 (2009) 0000 (-1712) -0063 (-1712) 0000 (-5097) -0022 (-5097)
Household Size -0006 (-3076) -0033 (-3076) -0021 (-684) -0096 (-684)
Proportion of Adults in the household
0202 (9139) 0137 (9139) 0235 (8183) 0169 (8183)
Education Dummy Males 0000 (-023) - 0000 (-023) - 0012 (805) 0008 (805)
Education Dummy Females
-0025 (-215) -0008 (-215) -0013 (-952) -0007 (-952)
Time Dummy (2004) -0159 (-1893) -0061 (-1893) -0105 (-829) -0036 (-829)
Time Dummy (2009) -0007 (-069) - -0002 (-069) - 0006 (045) - 0002 (045) -
Caste Dummy (SC) -0011 (-586) -0002 (-586) -0017 (-498) -0002 (-498)
Caste Dummy (Others) 0010 (616) 0006 (616) -0005 (-177) -0004 (-177)
Constant 7569 (89023)
7712 (59282)
and refer to significance at the 1 5 and 10 level respectively
State Dummies are omitted and details will be furnished on request Education Dummy If highest level of education is middle or lower then dummy = 0 else=1 Omitted Time period 1993 Omitted caste ST
18
Table 2 Robust Regression Estimates Demand for Protein 1993-2009
RURAL URBAN
Dependent Variable
Log of Per capita consumption of protein
No of Obs = 193784 No of Obs = 124481
F(60193723) = 1144586 F(60124420) = 391491
Prob gt F = 0 Prob gt F = 0
Coefficient Elasticity Coefficient Elasticity
Price Cereals amp Pulses -0013 (-2392) -0169 (-2392) -0009 (-1508) -0144 (-1508)
---interaction T1 (2004) 0013 (2153) 0055 (2153) 0005 (662) 0019 (662)
---interaction T2 (2009) 0012 (2187) 0084 (2187) 0009 (1386) 0079 (1386)
Price Milk Milk Products Eggs amp Meats
-0003 (-7497) -0123 (-7497) 0000 (-373) -0011 (-373)
---interaction T1 (2004) 0002 (4993) 0032 (4993) 0000 (-196) -0002 (-196)
---interaction T2 (2009) 0003 (5815) 0050 (5815) 0000 (264) 0004 (264)
Price Oil -0010 (-3216) -0112 (-3216) -0007 (-1709) -0088 (-1709)
---interaction T1 (2004) 0005 (1623) 0022 (1623) 0003 (658) 0012 (658)
---interaction T2 (2009) 0007 (2218) 0038 (2218) 0006 (1562) 0041 (1562)
Price Sugar -0002 (-1085) -0114 (-1085) -0003 (-844) -0139 (-844)
---interaction T1 (2004) 0002 (941) 0045 (941) 0001 (337) 0022 (337)
---interaction T2 (2009) 0001 (249) 0010 (249) 0000 (082) - 0006 (082) -
Price Fruits amp Vegetables
0002 (42) 0040 (42) 0002 (244) 0036 (244)
---interaction T1 (2004) 0000 (084) - 0003 (084) - -0001 (-081) - -0004 (-081) -
---interaction T2 (2009) -0003 (-652) -0030 (-652) -0003 (-366) -0027 (-366)
Monthly per capita expenditure
0001 (39184) 0438 (39184) 0000 (21912) 0254 (21912)
---interaction T1 (2004) 0000 (-1004) -0051 (-1004) 0000 (-1527) -0008 (-1527)
---interaction T2 (2009) 0000 (-1389) -0058 (-1389) 0000 (-3705) -0017 (-3705)
Household Size -0005 (-2368) -0027 (-2368) -0018 (-5526) -0084 (-5526)
Proportion of Adults in the household
0198 (8293) 0134 (8293) 0226 (7247) 0163 (7247)
Education Dummy
Males 0001 (116) - 0001 (116) - 0012 (743) 0008 (743)
Education Dummy Females
-0025 (-2031) -0008 (-2031) -0014 (-947) -0008 (-947)
Time Dummy (2004) -0210 (-2315) -0081 (-2315) -0050 (-36) -0017 (-36)
Time Dummy (2009) -0031 (-284) -0009 (-284) -0047 (-307) -0015 (-307)
Caste Dummy (SC) -0007 (-364) -0001 (-364) -0007 (-187) -0001 (-187)
Caste Dummy (Others) 0011 (623) 0007 (623) 0005 (143) - 0004 (143) -
Constant 3952 (43144)
4101 (28987)
and refer to significance at the 1 5 and 10 level respectively
State Dummies are omitted and details will be furnished on request Education Dummy If highest level of education is middle or lower then dummy = 0 else=1 Omitted Time period 1993 Omitted caste ST
19
Table 3 Robust Regression Estimates Demand for Fats 1993- 2009
RURAL URBAN
Dependent Variable Log of Per capita
consumption of Fats
No of Obs = 193784 No of Obs = 124481
F(60193723) = 1895778 F(60124420) = 766201
Prob gt F = 0 Prob gt F = 0
Coefficient Elasticity Coefficient Elasticity
Price Cereals amp Pulses 0016 (2033) 0218 (2033) 0012 (1462) 0193 (1462)
---interaction T1 (2004) -0005 (-598) -0023 (-598) -0008 (-871) -0035 (-871)
---interaction T2 (2009) -0009 (-1067) -0062 (-1067) -0006 (-661) -0052 (-661)
Price Milk Milk Products Eggs amp Meats
-0013 (-1924) -0478 (-1924) -0009 (-7698) -0327 (-7698)
---interaction T1 (2004) 0008 (10509) 0106 (10509) 0005 (3537) 0056 (3537)
---interaction T2 (2009) 0010 (13313) 0172 (13313) 0007 (5587) 0121 (5587)
Price Oil 0002 (445) 0023 (445) 0007 (1364) 0097 (1364)
---interaction T1 (2004) -0001 (-251) -0005 (-251) -0003 (-571) -0014 (-571)
---interaction T2 (2009) -0002 (-429) -0011 (-429) -0004 (-801) -0029 (-801)
Price Sugar -0004 (-1365) -0217 (-1365) -0003 (-75) -0170 (-75)
---interaction T1 (2004) 0001 (306) 0022 (306) 0001 (123) - 0011 (123) -
---interaction T2 (2009) -0001 (-169) -0011 (-169) -0002 (-42) -0040 (-42)
Price Fruits amp Vegetables
0011 (1418) 0206 (1418) 0006 (615) 0125 (615)
---interaction T1 (2004) -0010 (-1227) -0070 (-1227) -0006 (-556) -0037 (-556)
---interaction T2 (2009) -0011 (-1392) -0097 (-1392) -0008 (-74) -0076 (-74)
Monthly per capita expenditure
0001 (44365) 0753 (44365) 0000 (28858) 0462 (28858)
---interaction T1 (2004) 0000 (-1279) -0098 (-127) 0000 (-1896) -0014 (-1896)
---interaction T2 (2009) -0001 (-2100) -0126 (-2100) 0000 (-8414) -0054 (-8414)
Household Size -0019 (-5556) -0097 (-5556) -0039 (-8497) -0179 (-8497)
Proportion of Adults in the household
0165 (4584) 0112 (4584) 0188 (4368) 0135 (4368)
Education Dummy Males
0056 (3204) 0029 (3204) 0086 (3825) 0060 (3825)
Education Dummy Females
0031 (167) 0010 (167) 0086 (4086) 0048 (4086)
Time Dummy (2004) 0299 (2175) 0115 (2175) 0161 (845) 0055 (845)
Time Dummy (2009) 0564 (3391) 0165 (3391) 0360 (1697) 0114 (1697)
Caste Dummy (SC) 0052 (174) 0009 (174) 0040 (764) 0005 (764)
Caste Dummy (Others) 0135 (5278) 0090 (5278) 0108 (2307) 0086 (2307)
Constant 3023 (21787)
3474 (17776)
and refer to significance at the 1 5 and 10 level respectively
State Dummies are omitted and details will be furnished on request Education Dummy If highest level of education is middle or lower then dummy = 0 else=1 Omitted Time period 1993 Omitted caste ST
20
Annexure 1 Distribution of Nutrient Intake (1993 ndash 2009)
The following tables show the distribution of nutrient intake (proportion of population in
each category) in rural and urban areas between 1993 and 2009 Figures in parenthesis
indicate the mean nutrient intake in each range
Table 1 Calorie Intake Distributions in Rural India 1993 2004 and 2009
Year Range of Calorie Intake Per Capita Per Day
Total lt1800 1801ndash2400 2401ndash3000 gt3000
1993 3109 (1491)
4007 (2084)
1942 (2650)
942 (3636)
100 (2156)
2004 3668
(1516)
4311
(2071)
1507
(2629)
514
(3925)
100
(2047)
2010 3528
(1531)
4591
(2071)
1492
(2622)
389
(3545)
100
(2020)
Table 2 Calorie Intake Distributions in Urban India 1993 2004 and 2009
Year
Range of Calorie Intake Per Capita Per Day
Total lt1700 1701ndash2100 2101ndash2600 gt2600
1993 2812
(1426)
2962
(1900)
2576
(2320)
1649
(3107)
100
(2074)
2004 2940
(1440)
3452
(1900)
2467
(2313)
1141
(3252)
100
(2021)
2010 3010
(1456)
3534
(1896)
2436
(2312)
1019
(3043)
100
(1982)
Table 3 Protein Intake Distributions in Rural India 1993 2004 and 2009
Year Range of Protein Intake Per Capita Per Day (Gms)
Total lt45 46ndash60 61ndash75 gt75
1993 2381
(371)
3379
(524)
2279
(668)
1961
(944)
100
(603)
2004 2881
(374)
3805
(522)
2146
(663)
1168
(939)
100
(558)
2010 2935
(380)
4081
(521)
2105
(661)
879
(892)
100
(541)
21
Table 4 Protein Intake Distributions in Urban India 1993 2004 and 2009
Year Range of Protein Intake Per Capita Per Day (Gms)
Total lt45 46ndash60 61ndash75 gt75
1993 2490
(371)
3777
(524)
2311
(665)
1423
(907)
100
(573)
2004 2940
(378)
3450
(523)
2469
(662)
1140
(949)
100
(554)
2010 2944
(383)
4366
(521)
1961
(661)
729
(876)
100
(534)
Table 5 Fat Intake Distributions in Rural India 1993 2004 and 2009
Year Range of Fat Intake Per Capita Per Day (Gms)
Total lt20 21ndash30 31ndash50 gt50
1993 3430
(140)
2508
(247)
2609
(383)
1454
(721)
100
(315)
2004 2259
(150)
2721
(249)
3358
(383)
1662
(746)
100
(354)
2010 1420
(154)
2405
(251)
4049
(388)
2125
(672)
100
(382)
Table 6 Fat Intake Distributions in Urban India 1993 2004 and 2009
Year Range of Fat Intake Per Capita Per Day (Gms)
Total lt25 26ndash40 41ndash60 gt60
1993 2504
(182)
2984
(323)
2615
(486)
1897
(802)
100
(421)
2004 1539
(194)
3102
(326)
3156
(489)
2204
(858)
100
(474)
2010 1032
(198)
2788
(330)
3661
(490)
2519
(781)
100
(489)
Source Authorsrsquo calculations based on the 50th 61
st and 66
th rounds of the NSS
22
Annexure 2 Distribution of Nutrient Intake by Food Commodities (1993 -2009)
The following tables show the distribution of nutrient (calorie protein and fat) intake from
nine food commodity groups for rural and urban areas between 1993 and 2009
Table 1 Mean Per Capita Calorie Intake by Food Commodities 1993 2004 and 2009
Year Cereals Milk
Products GheeButter
Vanaspati-Oil
Sugar Eggs MeatFish Poultry
PulsesNuts Dry Fruits
Fruits Vegetables Total
Rural India
1993-94 1530 137 111 103 2 12 151 20 89 2156
Share 710 64 51 48 01 06 70 09 41
2004-05 1383 137 145 98 3 12 156 23 90 2047
Share 676 67 71 48 01 06 76 11 44
2009-10 1296 141 169 93 3 12 84 20 83 2020
Share 642 70 84 46 01 06 42 10 41
Urban India
1993-94 1213 181 168 129 5 16 231 37 94 2074
Share 585 87 81 62 02 08 111 18 45
2004-05 1133 189 199 115 6 16 235 36 92 2021
Share 561 94 98 57 03 08 116 18 46
2009-
10 1071 199 217 110 5 14 106 33 83 1982
Share 540 100 109 55 03 07 53 17 42
Table 2 Mean Per Capita Protein Intake by Food Commodities 1993 2004 and 2009
Year Cereals Milk
Products GheeButter
Vanaspati-Oil
Sugar Eggs MeatFish Poultry
PulsesNuts Dry Fruits
Fruits Vegetables Total
Rural India
1993-94 418 53 0 0 02 2 78 02 29 603
Share 693 88 00 00 03 33 129 03 48
2004-05 379 53 0 0 03 2 73 03 28 558
Share 679 95 00 00 05 36 131 05 50
2009-10 356 55 0 0 03 2 53 02 25 541
Share 658 102 00 00 06 37 98 04 46
Urban India
1993-94 341 67 0 0 04 26 10 04 31 573
Share 595 117 00 00 07 45 175 07 54
2004-05 32 7 0 0 05 27 98 04 31 554
Share 578 126 00 00 09 49 177 07 56
2009-
10 302 74 0 0 04 26 65 04 27 534
Share 566 139 00 00 07 49 122 07 51
23
Table 3 Mean Per Capita Fat Intake by Food Commodities 1993 2004 and 2009
Year Cereals Milk
Products GheeButter
Vanaspati-Oil
Sugar Eggs MeatFish Poultry
PulsesNuts Dry Fruits
Fruits Vegetables Total
Rural India
1993-94 54 97 123 0 02 03 24 07 04 315
Share 171 308 390 00 06 10 76 22 13
2004-05 48 97 162 0 03 02 31 08 04 354
Share 136 274 458 00 08 06 88 23 11
2009-10 43 10 187 0 03 02 11 08 03 382
Share 113 262 490 00 08 05 29 21 08
Urban India
1993-94 4 132 186 0 04 04 4 11 04 421
Share 95 314 442 00 10 10 95 26 10
2004-05 37 138 221 0 05 03 56 11 04 475
Share 78 291 465 00 11 06 118 23 08
2009-
10 35 145 241 0 04 02 15 11 04 489
Share 72 297 493 00 08 04 31 22 08
Source Authorsrsquo calculations based on the 50th 61
st and 66
th rounds of the NSS
24
References
Behrman J and A Deolalikar (1989) ldquoIs Variety the Spice of life Implications for Calorie
Intakerdquo Review of Economics and Statistics vol 71
Deaton A (1995) The Analysis of Household Surveys A Microeconomic approach to
Development Policy Baltimore MD The Johns Hopkins University Press
Deaton A and J Dreze (2009) lsquoFood and Nutrition in India Facts and Interpretationsrsquo
Economic and Political Weekly XLIV(7) 42ndash65
Gaiha R R Jha and Vani S Kulkarni (2012) ldquoDemand for Nutrients in India 1993 to
2004rdquo Applied Economics available online 1 February 2012
Gopalan C B Sastri and S Balasubramanian (1971) Nutritive Value of Indian Foods
National institute of Nutrition Indian Council of Medical Research Hyderabad
Indian Council of Medical Research (ICMR 1990) Nutrient Requirements and
Recommended Dietary Allowances for Indians New Delhi ICMR
Jha R R Gaiha and A Sharma (2009) ldquo Modelling Variety in Consumption Expenditure on
Food in Indiardquo International Review of Applied Economics online publication 1
July 2009
Srinivasan TN (1992) lsquoUndernutrition Concepts Measurements and Policy Implicationsrsquo
in SR Osmani (ed) Nutrition and Poverty Clarendon Press Oxford pp 97ndash120
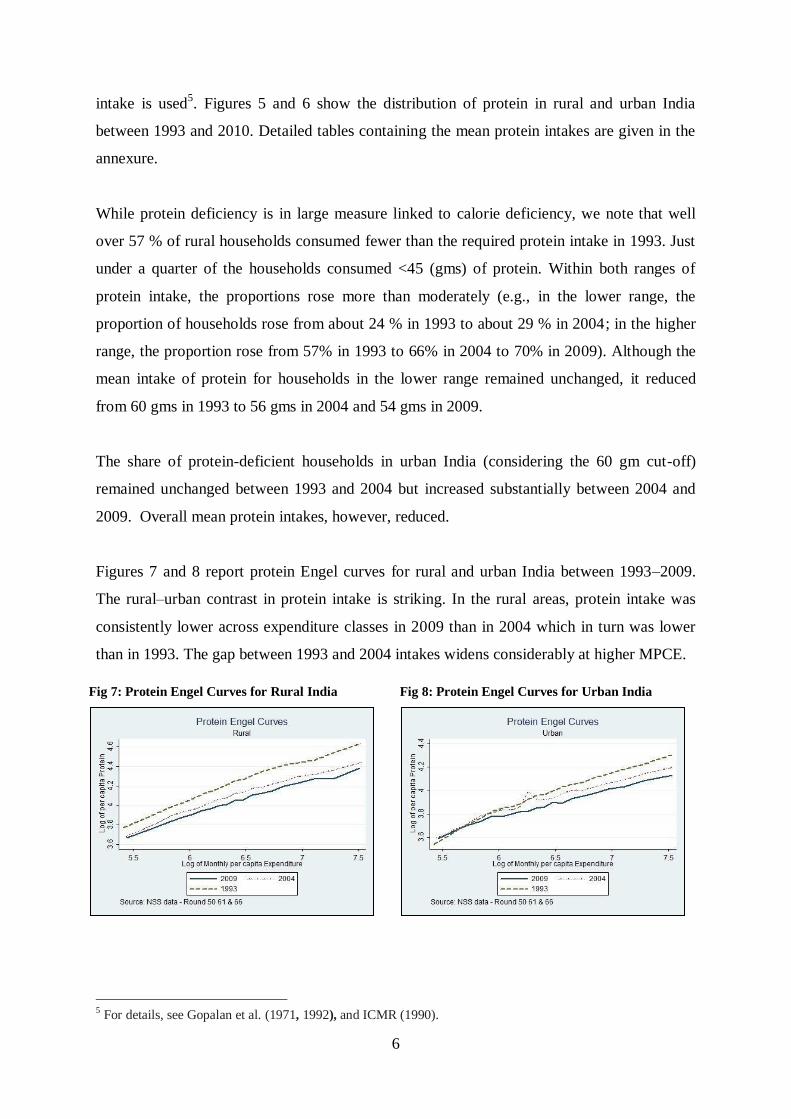
6
intake is used5 Figures 5 and 6 show the distribution of protein in rural and urban India
between 1993 and 2010 Detailed tables containing the mean protein intakes are given in the
annexure
While protein deficiency is in large measure linked to calorie deficiency we note that well
over 57 of rural households consumed fewer than the required protein intake in 1993 Just
under a quarter of the households consumed lt45 (gms) of protein Within both ranges of
protein intake the proportions rose more than moderately (eg in the lower range the
proportion of households rose from about 24 in 1993 to about 29 in 2004 in the higher
range the proportion rose from 57 in 1993 to 66 in 2004 to 70 in 2009) Although the
mean intake of protein for households in the lower range remained unchanged it reduced
from 60 gms in 1993 to 56 gms in 2004 and 54 gms in 2009
The share of protein-deficient households in urban India (considering the 60 gm cut-off)
remained unchanged between 1993 and 2004 but increased substantially between 2004 and
2009 Overall mean protein intakes however reduced
Figures 7 and 8 report protein Engel curves for rural and urban India between 1993ndash2009
The ruralndashurban contrast in protein intake is striking In the rural areas protein intake was
consistently lower across expenditure classes in 2009 than in 2004 which in turn was lower
than in 1993 The gap between 1993 and 2004 intakes widens considerably at higher MPCE
Fig 7 Protein Engel Curves for Rural India
Fig 8 Protein Engel Curves for Urban India
5 For details see Gopalan et al (1971 1992) and ICMR (1990)
7
In urban areas the 2004 curve was above the 1993 curve at low levels of MPCE and after the
cross-over expenditure of about Rs 500 the former lay below the 1993 curve The 2009 curve
lies above the 2004 curve at lower levels of MPCE and below the 2004 curve at higher levels
Fats
Mean fat intake increased substantially between 1993-94 and 2004-05 In rural areas the
mean fat intake increased by 12 per cent from 315 gms in 1993 to 354 gms in 2004 In
urban areas the mean fat intake increased by 13 per cent from 421 gms in 1993 to 475 gms
in 2004 The increase in fat intakes in the second period ie 2004-05 and 2009-10 were more
moderate Mean fat intakes increased to 382 gms (increase of 8 per cent) in rural areas and
489 gms (increase of 3 per cent) in urban areas
Although a precise range for fat requirements cannot be specified a range of 40ndash60 (gms) of
fat intake is desirable6 Figures 9 and 10 show the distribution of fat in rural and urban India
between 1993 and 2009 Detailed tables containing the mean fat intakes are given in the
annexure
Fig 9 Fat Intake Distributions for Rural India
Fig 10 Fat Intake Distributions for Urban India
6 Gopalan et al (1971) observe lsquoThe quantity of fat that should be included in a well balanced diet is not known
with any degree of certainty However it appears desirable in the present state of knowledge that the daily
intake of fat should be such that it contributes no more than 15 to 20 of the calories in the diet A total of
about 40 to 60 gms of fat can therefore be safely consumed daily and in order to obtain the necessary amounts
of essential fatty acids the fat intake should include at least 15 gms of vegetable oilsrsquo (pg 8) Also see ICMR
(1990)
34 23
14
25
27
24
26 34
40
15 17 21
0
10
20
30
40
50
60
70
80
90
100
1993 2004 2010
Pro
po
rtio
n o
f P
op
ula
tio
n (
)
Fat Intake Distribution Rural India
lt20 21ndash30 31ndash50 gt50 gms
25 15 10
30
31 28
26 32
37
19 22 25
0
10
20
30
40
50
60
70
80
90
100
1993 2004 2010
Pro
po
rtio
n o
f P
op
ula
tio
n (
)
Fat Intake Distribution Urban India
lt25 26ndash40 41ndash60 gt60 gms
8
Even considering the first three ranges of fat intake an astonishingly high estimate for fat
deficient households for rural India (over 85) is obtained for 1993 Well over one-third of
households were under the lowest range of lt20 (gms) The corresponding household share
with fat intakes lt50 gms fell to over 83 in 2004 and 79 in 2009 The share of households
consuming lt20 gms of fat fell sharply (from over 34 in 1993 to well over 22 in 2004 and
14 in 2009) Mean fat intakes increased over the period 1993 to 2009
Using higher ranges of fat intake for urban areas fat deprivation was pervasive (about 81 of
the households consumed lt60 gms of fats in 1993) About a quarter consumed lt25 gms
Over the period 1993ndash2009 the reduction in the proportion of fat- deprived was slight (from
81 in 1993 to 78 in 2004 to 75 in 2009) However as in rural India the proportion
consuming fats lt25 gms fell sharply Mean fat intake increased
Figures 11 and 12 show the Engel curves for fat In rural areas the fat Engel curves for 1993
lay below that for 2004 at lower levels of MPCE The 2009 curve lies above the 2004 curve
at lower levels of MPCE The crossover is at approximately Rs650 In urban areas the
crossover is at Rs1000 The curves converge beyond this
Fig 11 Fat Engel Curves for Rural India
Fig 12 Fat Engel Curves for Urban India
Thus taking nutritional norms as valid the overall picture of nutritional deprivation
worsened considerably over the period 1993ndash2009 The following Kernel density functions
(figure 13) clearly show a leftward shift in calorie and protein intake distributions and a
rightward shift in the fat intake distribution in both rural and urban areas between 1993 and
20097
7 For an admirably clear exposition of kernel density functions see Deaton (1995)
9
Fig 13 Kernel Density Functions for Calories Proteins and Fats consumed ndash Rural and
Urban India (1993 ndash 2009)
12 Factors Underlying Changes in Diets and Nutrition
We build on the DD analysis (2009) of food commodities that contributed to reduction in
calories protein and increase in fat consumption
10
Figure 14 shows the distribution of calorie protein and fat intake by food commodities for
rural and urban areas between 1993 and 2009 Detailed tables containing mean per capita
intake of nutrients from the various food items are given in the annexure
In rural India calorie intakes declined between 1993 and 2009 Most of it is attributable to
the decline in calories from cereals and pulses to some extent Calories from cereals reduced
from 1530 in 1993 to 1383 in 2004 and 1296 in 2009 The contribution of milkmilk
products sugar fruits and vegetables remained largely unchanged between 1993 and 2009
The contribution of vanaspati oil to the calorie intake increased substantially Calories
obtained from oil increased from 111 in 1993 to 145 in 2004 and 169 in 2009
Similar results are found for urban areas as well The reduction in the contribution of pulses
to calorie intakes was more drastic in urban areas between 2004 and 2009
71
68
64
58
56
54
6
7
7
9
9
10
5
7
8
8
10
11
5
5
5
6
6
6
1
1
1
1
1
1
7
8
4
11
12
5
1
1
1
2
2
2
4
4
4
5
5
4
0 10 20 30 40 50 60 70 80 90 100
1993-94
2004-05
2009-10
1993-94
2004-05
2009-10
Fig 14 Calorie Intake by Food Commodities 1993 2004 and 2009
Cereals Milk Vanaspati-Oil Sugar Eggs amp Meats Pulses Fruits Vegetables
RU
RA
L U
RB
AN
11
In both rural and urban areas protein intake declined between 1993 and 2009 (Figure 15)
Much of it is reflected in a reduction in protein intake from cereals and pulses In rural areas
the protein intake from these commodities decreased from 50 gms in 1993 to 45 gms in 2004
and 40 gms in 2009 The corresponding numbers for urban areas are 44 gms (1993) 42 gms
(2004) and 37 gms (2009) Intake from dairy products (milk eggs and meats) increased
moderately Proteins from other sources are a very small fraction and largely remained
unchanged between 1993 and 2009
Between 1993-2009 fat intake rose in both rural and urban areas Vanaspati-oil has the
maximum share in total fat intakes and its contribution rose over the period 1993 and 2009
In rural areas fat intake from vanaspati-oil rose from 12 gms in 1993 to 16 gms in 2004 and
19 gms in 2009 In urban areas the share of vanaspati-oil rose from 19 gms in 1993 to 22
gms in 2004 and 24 gms in 2009 The other significant contributor to fat intake are cereals
pulses and milk products (including ghee and butter) but their contribution reduced between
1993 and 2009 Declining intake of fats from these commodities were more than offset by the
increased intake of fat from vanaspati-oil
69
68
66
60
58
57
9
9
10
12
13
14
4
5
5
6
6
6
13
13
10
17
18
12
5
6
5
6
7
6
0 10 20 30 40 50 60 70 80 90 100
1993-94
2004-05
2009-10
1993-94
2004-05
2009-10
Fig 15 Protein Intake by Food Commodities 1993 2004 and 2009
Cereals Milk Eggs amp Meats Pulses Fruits amp Vegetables
RU
RA
L U
RB
AN
12
13 Demand Theory Based Explanation of Changes in Nutrient Intake
In response to the DeatonndashDreze (2009) explanation of a downward shift in the calorie Engel
curve in terms of lower lsquorequirementsrsquo due to health improvements and less strenuous
activity levels and more sedentary life-styles we have developed an alternative explanation
of changes in the consumption of calories protein and fats over the period 1993ndash2009 This
explanation is embedded in a standard demand theory framework with food prices8 and
expenditure (as a proxy for income) cast in a pivotal role Based on different experiments
robust demand functions are estimated for each of the three nutrients viz calories protein and
fats (Tables 1-3) Our results show consistently robust food price and expenditure effects
thus raising further doubts about the adequacy of the DD explanation The analysis is based
8 An important point to bear in mind is that the price effects capture both own and cross-price effects through
substitutions between food commodities Briefly as prices change demands for commodities change and
consequently calorie (and other nutrientsrsquo) intakes Underlying this is a presumption that food choices are
informed by their nutritional content As Deaton and Dreze (2009) emphasise people do not buy calories and
other nutrients but food commodities However if food choices are informed by their nutritional values it is
meaningful to talk about demands for calories and other nutrients
17
14
11
10
8
7
31
27
26
31
29
30
39
46
49
44
47
49
2
1
1
2
2
1
8
9
3
10
12
3
4
3
3
4
3
3
0 10 20 30 40 50 60 70 80 90 100
1993-94
2004-05
2009-10
1993-94
2004-05
2009-10
Fig 16 Fat Intake by Food Commodities 1993 2004 and 2009
Cereals Milk Vanaspati-Oil Eggs amp Meats Pulses Fruits amp Vegetables
RU
RA
L U
RB
AN
13
on unit record data collected for the 50th
61st and 66
th rounds of the NSS (corresponding to
the years 1993ndash94 2004ndash05 and 2009-10 respectively) We will discuss separately the
results for rural and urban samples
(a) Demand Function
A basic demand equation for nutrients (calories protein fats) in rural and urban India with
pooled data for 1993 2004 and 2009 is given below
(1)
where the dependent variable is log of nutrient consumed by ith household in time t jtP is a
vector of food prices computed from the NSS at the village level (j) and time t E it is
household per capita expenditure for ith household in time t itX is a vector of household
characteristics (eg number of adult males females household size ) and a few others
specified as dummy variables (caste) D1t is a dummy variable that takes the value 1 for 2004
and 0 otherwise (to allow for changes in factors other than food prices and expenditure over
time) D2t+k is the second time dummy that takes the value 1 for 2009 and 0 otherwise and
it is the error term This equation is estimated using robust regression Although a Chow test
for a structural shift is not feasible with robust regression we have employed two
refinements one is the use of a time dummy that could potentially capture the health
improvements and less strenuous activity patterns (associated with easier access to drinking
water better transportation facilities) and the other is interactions of food price variables
with the time dummy to allow for different price and expenditure effects over time9
An important point to bear in mind is that the price effects capture both own and cross-price
effects through substitutions between food commodities Briefly as prices change demands
for commodities change and consequently for example calorie (and other nutrientsrsquo) intakes
9 While these effects yield insights into changing consumer demands a more detailed analysis along the lines of
Behrman and Deolalikar (1989) and Jha et al (2009) would further deepen our understanding consumer
preferences and tastes for variety
14
(b) Results
We first consider the calorie demand function For both rural and urban areas each of the
price effects has a significant negative coefficient with the exception of price of fruits and
vegetables whose coefficient in not significant Moreover the price effects on the demand for
calories have in many cases weakened as captured by the coefficients of the interaction term
(ie interaction between the price and the time dummies) A case in point is price of cereals
and pulses Rising incomes have a positive impact on calorie demand and so does the
proportion of adults in the household The former effect however weakened over time As
household size increases calorie demand decreases Education of adult female has a negative
impact on calorie demand as this may be attributed to consumption of a more balanced diet
rich in protein and vitamins and reduced dependence on cereals which is a major source of
calories By contrast education of adult male is not significant in rural areas but positive in
urban areas SCs have lower demands for calories in both rural and urban areas while that of
Others is positive in rural areas and negative in urban areas relative to STs The effect of time
alone is reduced consumption of calorie between 1993 and 2004 However somewhat
surprisingly the residual time effect is not significant between 2004-09 That this undermines
the DD explanation emphasising lower calorie requirements due to improvements in the
epidemiology of the disease environment less strenuous physical activities and more
sedentary life styles cannot be ruled out
In case of protein demand in both rural and urban areas there is a positive influence of the
price of fruits and vegetables whereas the elasticity of protein demand with respect to all
other food prices is negative As in the case of calorie demand several price effects
weakened over over time as captured by the interaction term (between food prices and the
time dummies) A case in point is price of milk and milk products eggs and meats Higher
incomeexpenditure increase protein demand but less so over time Increasing household size
reduces protein demand whereas rising proportion of adults in the household increases it
The impact of education of adult female is negative and that of education of adult male is
not significant SCs have lower demand for protein while Others have higher demand relative
to STs The residual effect of time after accounting for the interaction is significant with a
negative coefficient suggesting a lower demand for protein in 2009 and 2004 as compared to
1993
15
In case of fats too in both rural and urban areas there are significant price and expenditure
effects ndash positive in the case of price of cereals oil and fruits and vegetables and negative in
case of milk products and sugar The positive price elasticity of fats with respect to edible oil
price is somewhat surprising although the price effect has weakened over time MPCE has
positive Unlike in the case of calorie and protein highest education of adult female has a
positive impact on fat demand suggesting that households with females having higher than
middle level of education tend to eat diets rich in fats shifting away from diets rich in
calories and proteins Moreover highest education of adult male also has a positive and
significant effect As in the case of calorie and protein household size has a negative impact
and proportion of adults in a household has a positive impact on demand for fats SCs and
Others have higher demands relative to STs The effect of time alone is to increase the fat
demand in 2009 and 2004 as compared to 1993
2 Concluding Observations
The main findings of our analysis are summarised below from a policy perspective
An important insight from the comparison of three rounds of the NSS over the period 1993-
2009 points to a slowing down of the reduction in the calorie intake in both rural and urban
areas in 2004-09 relative to 1993-2004 A similar slowing down occurred in protein intake
over the more recent period (2004-09) While fat intake continued to rise over this period but
at a lower rate
A demand theory based explanation of changes in demands for these nutrients reaffirmed the
important roles of food price and expenditure changes A new insight however is that in
several cases food price effects weakened over time as also expenditure effects While the
residual time effect weakened for both calories and protein over the period 1993-2004 it
slowed down over the more recent period The effect of time on fat demand was however
positive and strengthened over the more recent period Altogether thus the DD explanation of
lower calorie and protein demands over time as a result of lower requirements is further
undermined
From a policy perspective the important roles of food price stabilisation and expansion of
livelihood opportunities remain key to ameliorating nutritional deprivation despite lowering
of nutritional requirements A closer scrutiny of dietary preferences and tastes is crucial for
16
both understanding sources of nutritional deprivation and for designing effective policies for
mitigating it
17
Table 1 Robust Regression Estimates Demand for Calories 1993-2009
RURAL URBAN
Dependent Variable Log of Per capita consumption
of calories
No of Obs = 193785 No of Obs = 124481
F(60193724) = 1192631 F(60124420) = 370511
Prob gt F = 0 Prob gt F = 0
Coefficient Elasticity Coefficient Elasticity
Price Cereals amp Pulses -0012 (-2524) -0166 (-2524) -0006 (-102) -0090 (-102)
---interaction T1 (2004) 0011 (2072) 0049 (2072) 0001 (096) - 0003 (096) -
---interaction T2 (2009) 0010 (2005) 0071 (2005) 0004 (699) 0037 (699)
Price Milk Milk Products Eggs amp Meats
-0003 (-6421) -0098 (-6421) -0001 (-1253) -0035 (-1253)
---interaction T1 (2004) 0002 (4288) 0026 (4288) 0000 (329) 0003 (329)
---interaction T2 (2009) 0002 (4983) 0040 (4983) 0001 (904) 0013 (904)
Price Oil -0008 (-2667) -0086 (-2667) -0004 (-101) -0048 (-101)
---interaction T1 (2004) 0004 (1175) 0015 (1175) 0001 (189) 0003 (189)
---interaction T2 (2009) 0006 (1934) 0031 (1934) 0004 (994) 0024 (994)
Price Sugar -0002 (-127) -0124 (-127) -0004 (-1209) -0183 (-1209)
---interaction T1 (2004) 0002 (1136) 0050 (1136) 0003 (1029) 0061 (1029)
---interaction T2 (2009) 0001 (704) 0027 (704) 0002 (516) 0033 (516)
Price Fruits amp Vegetables
-0001 (-116) - -0010 (-116) - 0001 (194) 0026 (194)
---interaction T1 (2004) 0001 (275) 0010 (275) 0000 (026) - 0001 (026) -
---interaction T2 (2009) -0001 (-174) -0007 (-174) -0003 (-392) -0027 (-392)
Monthly per capita expenditure
0001 (40195) 0418 (40195) 0000 (22549) 0240 (22549)
---interaction T1 (2004) 0000 (-1160) -0054 (-1160) 0000 (-2386) -0011 (-2386)
---interaction T2 (2009) 0000 (-1712) -0063 (-1712) 0000 (-5097) -0022 (-5097)
Household Size -0006 (-3076) -0033 (-3076) -0021 (-684) -0096 (-684)
Proportion of Adults in the household
0202 (9139) 0137 (9139) 0235 (8183) 0169 (8183)
Education Dummy Males 0000 (-023) - 0000 (-023) - 0012 (805) 0008 (805)
Education Dummy Females
-0025 (-215) -0008 (-215) -0013 (-952) -0007 (-952)
Time Dummy (2004) -0159 (-1893) -0061 (-1893) -0105 (-829) -0036 (-829)
Time Dummy (2009) -0007 (-069) - -0002 (-069) - 0006 (045) - 0002 (045) -
Caste Dummy (SC) -0011 (-586) -0002 (-586) -0017 (-498) -0002 (-498)
Caste Dummy (Others) 0010 (616) 0006 (616) -0005 (-177) -0004 (-177)
Constant 7569 (89023)
7712 (59282)
and refer to significance at the 1 5 and 10 level respectively
State Dummies are omitted and details will be furnished on request Education Dummy If highest level of education is middle or lower then dummy = 0 else=1 Omitted Time period 1993 Omitted caste ST
18
Table 2 Robust Regression Estimates Demand for Protein 1993-2009
RURAL URBAN
Dependent Variable
Log of Per capita consumption of protein
No of Obs = 193784 No of Obs = 124481
F(60193723) = 1144586 F(60124420) = 391491
Prob gt F = 0 Prob gt F = 0
Coefficient Elasticity Coefficient Elasticity
Price Cereals amp Pulses -0013 (-2392) -0169 (-2392) -0009 (-1508) -0144 (-1508)
---interaction T1 (2004) 0013 (2153) 0055 (2153) 0005 (662) 0019 (662)
---interaction T2 (2009) 0012 (2187) 0084 (2187) 0009 (1386) 0079 (1386)
Price Milk Milk Products Eggs amp Meats
-0003 (-7497) -0123 (-7497) 0000 (-373) -0011 (-373)
---interaction T1 (2004) 0002 (4993) 0032 (4993) 0000 (-196) -0002 (-196)
---interaction T2 (2009) 0003 (5815) 0050 (5815) 0000 (264) 0004 (264)
Price Oil -0010 (-3216) -0112 (-3216) -0007 (-1709) -0088 (-1709)
---interaction T1 (2004) 0005 (1623) 0022 (1623) 0003 (658) 0012 (658)
---interaction T2 (2009) 0007 (2218) 0038 (2218) 0006 (1562) 0041 (1562)
Price Sugar -0002 (-1085) -0114 (-1085) -0003 (-844) -0139 (-844)
---interaction T1 (2004) 0002 (941) 0045 (941) 0001 (337) 0022 (337)
---interaction T2 (2009) 0001 (249) 0010 (249) 0000 (082) - 0006 (082) -
Price Fruits amp Vegetables
0002 (42) 0040 (42) 0002 (244) 0036 (244)
---interaction T1 (2004) 0000 (084) - 0003 (084) - -0001 (-081) - -0004 (-081) -
---interaction T2 (2009) -0003 (-652) -0030 (-652) -0003 (-366) -0027 (-366)
Monthly per capita expenditure
0001 (39184) 0438 (39184) 0000 (21912) 0254 (21912)
---interaction T1 (2004) 0000 (-1004) -0051 (-1004) 0000 (-1527) -0008 (-1527)
---interaction T2 (2009) 0000 (-1389) -0058 (-1389) 0000 (-3705) -0017 (-3705)
Household Size -0005 (-2368) -0027 (-2368) -0018 (-5526) -0084 (-5526)
Proportion of Adults in the household
0198 (8293) 0134 (8293) 0226 (7247) 0163 (7247)
Education Dummy
Males 0001 (116) - 0001 (116) - 0012 (743) 0008 (743)
Education Dummy Females
-0025 (-2031) -0008 (-2031) -0014 (-947) -0008 (-947)
Time Dummy (2004) -0210 (-2315) -0081 (-2315) -0050 (-36) -0017 (-36)
Time Dummy (2009) -0031 (-284) -0009 (-284) -0047 (-307) -0015 (-307)
Caste Dummy (SC) -0007 (-364) -0001 (-364) -0007 (-187) -0001 (-187)
Caste Dummy (Others) 0011 (623) 0007 (623) 0005 (143) - 0004 (143) -
Constant 3952 (43144)
4101 (28987)
and refer to significance at the 1 5 and 10 level respectively
State Dummies are omitted and details will be furnished on request Education Dummy If highest level of education is middle or lower then dummy = 0 else=1 Omitted Time period 1993 Omitted caste ST
19
Table 3 Robust Regression Estimates Demand for Fats 1993- 2009
RURAL URBAN
Dependent Variable Log of Per capita
consumption of Fats
No of Obs = 193784 No of Obs = 124481
F(60193723) = 1895778 F(60124420) = 766201
Prob gt F = 0 Prob gt F = 0
Coefficient Elasticity Coefficient Elasticity
Price Cereals amp Pulses 0016 (2033) 0218 (2033) 0012 (1462) 0193 (1462)
---interaction T1 (2004) -0005 (-598) -0023 (-598) -0008 (-871) -0035 (-871)
---interaction T2 (2009) -0009 (-1067) -0062 (-1067) -0006 (-661) -0052 (-661)
Price Milk Milk Products Eggs amp Meats
-0013 (-1924) -0478 (-1924) -0009 (-7698) -0327 (-7698)
---interaction T1 (2004) 0008 (10509) 0106 (10509) 0005 (3537) 0056 (3537)
---interaction T2 (2009) 0010 (13313) 0172 (13313) 0007 (5587) 0121 (5587)
Price Oil 0002 (445) 0023 (445) 0007 (1364) 0097 (1364)
---interaction T1 (2004) -0001 (-251) -0005 (-251) -0003 (-571) -0014 (-571)
---interaction T2 (2009) -0002 (-429) -0011 (-429) -0004 (-801) -0029 (-801)
Price Sugar -0004 (-1365) -0217 (-1365) -0003 (-75) -0170 (-75)
---interaction T1 (2004) 0001 (306) 0022 (306) 0001 (123) - 0011 (123) -
---interaction T2 (2009) -0001 (-169) -0011 (-169) -0002 (-42) -0040 (-42)
Price Fruits amp Vegetables
0011 (1418) 0206 (1418) 0006 (615) 0125 (615)
---interaction T1 (2004) -0010 (-1227) -0070 (-1227) -0006 (-556) -0037 (-556)
---interaction T2 (2009) -0011 (-1392) -0097 (-1392) -0008 (-74) -0076 (-74)
Monthly per capita expenditure
0001 (44365) 0753 (44365) 0000 (28858) 0462 (28858)
---interaction T1 (2004) 0000 (-1279) -0098 (-127) 0000 (-1896) -0014 (-1896)
---interaction T2 (2009) -0001 (-2100) -0126 (-2100) 0000 (-8414) -0054 (-8414)
Household Size -0019 (-5556) -0097 (-5556) -0039 (-8497) -0179 (-8497)
Proportion of Adults in the household
0165 (4584) 0112 (4584) 0188 (4368) 0135 (4368)
Education Dummy Males
0056 (3204) 0029 (3204) 0086 (3825) 0060 (3825)
Education Dummy Females
0031 (167) 0010 (167) 0086 (4086) 0048 (4086)
Time Dummy (2004) 0299 (2175) 0115 (2175) 0161 (845) 0055 (845)
Time Dummy (2009) 0564 (3391) 0165 (3391) 0360 (1697) 0114 (1697)
Caste Dummy (SC) 0052 (174) 0009 (174) 0040 (764) 0005 (764)
Caste Dummy (Others) 0135 (5278) 0090 (5278) 0108 (2307) 0086 (2307)
Constant 3023 (21787)
3474 (17776)
and refer to significance at the 1 5 and 10 level respectively
State Dummies are omitted and details will be furnished on request Education Dummy If highest level of education is middle or lower then dummy = 0 else=1 Omitted Time period 1993 Omitted caste ST
20
Annexure 1 Distribution of Nutrient Intake (1993 ndash 2009)
The following tables show the distribution of nutrient intake (proportion of population in
each category) in rural and urban areas between 1993 and 2009 Figures in parenthesis
indicate the mean nutrient intake in each range
Table 1 Calorie Intake Distributions in Rural India 1993 2004 and 2009
Year Range of Calorie Intake Per Capita Per Day
Total lt1800 1801ndash2400 2401ndash3000 gt3000
1993 3109 (1491)
4007 (2084)
1942 (2650)
942 (3636)
100 (2156)
2004 3668
(1516)
4311
(2071)
1507
(2629)
514
(3925)
100
(2047)
2010 3528
(1531)
4591
(2071)
1492
(2622)
389
(3545)
100
(2020)
Table 2 Calorie Intake Distributions in Urban India 1993 2004 and 2009
Year
Range of Calorie Intake Per Capita Per Day
Total lt1700 1701ndash2100 2101ndash2600 gt2600
1993 2812
(1426)
2962
(1900)
2576
(2320)
1649
(3107)
100
(2074)
2004 2940
(1440)
3452
(1900)
2467
(2313)
1141
(3252)
100
(2021)
2010 3010
(1456)
3534
(1896)
2436
(2312)
1019
(3043)
100
(1982)
Table 3 Protein Intake Distributions in Rural India 1993 2004 and 2009
Year Range of Protein Intake Per Capita Per Day (Gms)
Total lt45 46ndash60 61ndash75 gt75
1993 2381
(371)
3379
(524)
2279
(668)
1961
(944)
100
(603)
2004 2881
(374)
3805
(522)
2146
(663)
1168
(939)
100
(558)
2010 2935
(380)
4081
(521)
2105
(661)
879
(892)
100
(541)
21
Table 4 Protein Intake Distributions in Urban India 1993 2004 and 2009
Year Range of Protein Intake Per Capita Per Day (Gms)
Total lt45 46ndash60 61ndash75 gt75
1993 2490
(371)
3777
(524)
2311
(665)
1423
(907)
100
(573)
2004 2940
(378)
3450
(523)
2469
(662)
1140
(949)
100
(554)
2010 2944
(383)
4366
(521)
1961
(661)
729
(876)
100
(534)
Table 5 Fat Intake Distributions in Rural India 1993 2004 and 2009
Year Range of Fat Intake Per Capita Per Day (Gms)
Total lt20 21ndash30 31ndash50 gt50
1993 3430
(140)
2508
(247)
2609
(383)
1454
(721)
100
(315)
2004 2259
(150)
2721
(249)
3358
(383)
1662
(746)
100
(354)
2010 1420
(154)
2405
(251)
4049
(388)
2125
(672)
100
(382)
Table 6 Fat Intake Distributions in Urban India 1993 2004 and 2009
Year Range of Fat Intake Per Capita Per Day (Gms)
Total lt25 26ndash40 41ndash60 gt60
1993 2504
(182)
2984
(323)
2615
(486)
1897
(802)
100
(421)
2004 1539
(194)
3102
(326)
3156
(489)
2204
(858)
100
(474)
2010 1032
(198)
2788
(330)
3661
(490)
2519
(781)
100
(489)
Source Authorsrsquo calculations based on the 50th 61
st and 66
th rounds of the NSS
22
Annexure 2 Distribution of Nutrient Intake by Food Commodities (1993 -2009)
The following tables show the distribution of nutrient (calorie protein and fat) intake from
nine food commodity groups for rural and urban areas between 1993 and 2009
Table 1 Mean Per Capita Calorie Intake by Food Commodities 1993 2004 and 2009
Year Cereals Milk
Products GheeButter
Vanaspati-Oil
Sugar Eggs MeatFish Poultry
PulsesNuts Dry Fruits
Fruits Vegetables Total
Rural India
1993-94 1530 137 111 103 2 12 151 20 89 2156
Share 710 64 51 48 01 06 70 09 41
2004-05 1383 137 145 98 3 12 156 23 90 2047
Share 676 67 71 48 01 06 76 11 44
2009-10 1296 141 169 93 3 12 84 20 83 2020
Share 642 70 84 46 01 06 42 10 41
Urban India
1993-94 1213 181 168 129 5 16 231 37 94 2074
Share 585 87 81 62 02 08 111 18 45
2004-05 1133 189 199 115 6 16 235 36 92 2021
Share 561 94 98 57 03 08 116 18 46
2009-
10 1071 199 217 110 5 14 106 33 83 1982
Share 540 100 109 55 03 07 53 17 42
Table 2 Mean Per Capita Protein Intake by Food Commodities 1993 2004 and 2009
Year Cereals Milk
Products GheeButter
Vanaspati-Oil
Sugar Eggs MeatFish Poultry
PulsesNuts Dry Fruits
Fruits Vegetables Total
Rural India
1993-94 418 53 0 0 02 2 78 02 29 603
Share 693 88 00 00 03 33 129 03 48
2004-05 379 53 0 0 03 2 73 03 28 558
Share 679 95 00 00 05 36 131 05 50
2009-10 356 55 0 0 03 2 53 02 25 541
Share 658 102 00 00 06 37 98 04 46
Urban India
1993-94 341 67 0 0 04 26 10 04 31 573
Share 595 117 00 00 07 45 175 07 54
2004-05 32 7 0 0 05 27 98 04 31 554
Share 578 126 00 00 09 49 177 07 56
2009-
10 302 74 0 0 04 26 65 04 27 534
Share 566 139 00 00 07 49 122 07 51
23
Table 3 Mean Per Capita Fat Intake by Food Commodities 1993 2004 and 2009
Year Cereals Milk
Products GheeButter
Vanaspati-Oil
Sugar Eggs MeatFish Poultry
PulsesNuts Dry Fruits
Fruits Vegetables Total
Rural India
1993-94 54 97 123 0 02 03 24 07 04 315
Share 171 308 390 00 06 10 76 22 13
2004-05 48 97 162 0 03 02 31 08 04 354
Share 136 274 458 00 08 06 88 23 11
2009-10 43 10 187 0 03 02 11 08 03 382
Share 113 262 490 00 08 05 29 21 08
Urban India
1993-94 4 132 186 0 04 04 4 11 04 421
Share 95 314 442 00 10 10 95 26 10
2004-05 37 138 221 0 05 03 56 11 04 475
Share 78 291 465 00 11 06 118 23 08
2009-
10 35 145 241 0 04 02 15 11 04 489
Share 72 297 493 00 08 04 31 22 08
Source Authorsrsquo calculations based on the 50th 61
st and 66
th rounds of the NSS
24
References
Behrman J and A Deolalikar (1989) ldquoIs Variety the Spice of life Implications for Calorie
Intakerdquo Review of Economics and Statistics vol 71
Deaton A (1995) The Analysis of Household Surveys A Microeconomic approach to
Development Policy Baltimore MD The Johns Hopkins University Press
Deaton A and J Dreze (2009) lsquoFood and Nutrition in India Facts and Interpretationsrsquo
Economic and Political Weekly XLIV(7) 42ndash65
Gaiha R R Jha and Vani S Kulkarni (2012) ldquoDemand for Nutrients in India 1993 to
2004rdquo Applied Economics available online 1 February 2012
Gopalan C B Sastri and S Balasubramanian (1971) Nutritive Value of Indian Foods
National institute of Nutrition Indian Council of Medical Research Hyderabad
Indian Council of Medical Research (ICMR 1990) Nutrient Requirements and
Recommended Dietary Allowances for Indians New Delhi ICMR
Jha R R Gaiha and A Sharma (2009) ldquo Modelling Variety in Consumption Expenditure on
Food in Indiardquo International Review of Applied Economics online publication 1
July 2009
Srinivasan TN (1992) lsquoUndernutrition Concepts Measurements and Policy Implicationsrsquo
in SR Osmani (ed) Nutrition and Poverty Clarendon Press Oxford pp 97ndash120
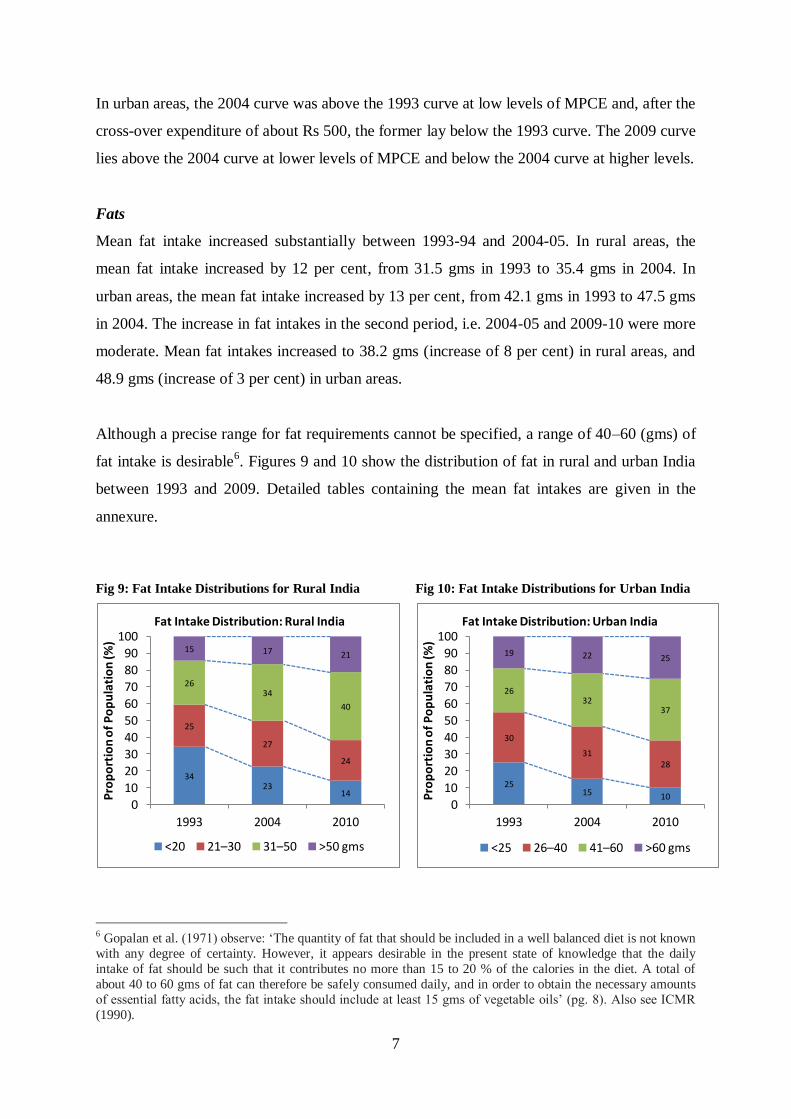
7
In urban areas the 2004 curve was above the 1993 curve at low levels of MPCE and after the
cross-over expenditure of about Rs 500 the former lay below the 1993 curve The 2009 curve
lies above the 2004 curve at lower levels of MPCE and below the 2004 curve at higher levels
Fats
Mean fat intake increased substantially between 1993-94 and 2004-05 In rural areas the
mean fat intake increased by 12 per cent from 315 gms in 1993 to 354 gms in 2004 In
urban areas the mean fat intake increased by 13 per cent from 421 gms in 1993 to 475 gms
in 2004 The increase in fat intakes in the second period ie 2004-05 and 2009-10 were more
moderate Mean fat intakes increased to 382 gms (increase of 8 per cent) in rural areas and
489 gms (increase of 3 per cent) in urban areas
Although a precise range for fat requirements cannot be specified a range of 40ndash60 (gms) of
fat intake is desirable6 Figures 9 and 10 show the distribution of fat in rural and urban India
between 1993 and 2009 Detailed tables containing the mean fat intakes are given in the
annexure
Fig 9 Fat Intake Distributions for Rural India
Fig 10 Fat Intake Distributions for Urban India
6 Gopalan et al (1971) observe lsquoThe quantity of fat that should be included in a well balanced diet is not known
with any degree of certainty However it appears desirable in the present state of knowledge that the daily
intake of fat should be such that it contributes no more than 15 to 20 of the calories in the diet A total of
about 40 to 60 gms of fat can therefore be safely consumed daily and in order to obtain the necessary amounts
of essential fatty acids the fat intake should include at least 15 gms of vegetable oilsrsquo (pg 8) Also see ICMR
(1990)
34 23
14
25
27
24
26 34
40
15 17 21
0
10
20
30
40
50
60
70
80
90
100
1993 2004 2010
Pro
po
rtio
n o
f P
op
ula
tio
n (
)
Fat Intake Distribution Rural India
lt20 21ndash30 31ndash50 gt50 gms
25 15 10
30
31 28
26 32
37
19 22 25
0
10
20
30
40
50
60
70
80
90
100
1993 2004 2010
Pro
po
rtio
n o
f P
op
ula
tio
n (
)
Fat Intake Distribution Urban India
lt25 26ndash40 41ndash60 gt60 gms
8
Even considering the first three ranges of fat intake an astonishingly high estimate for fat
deficient households for rural India (over 85) is obtained for 1993 Well over one-third of
households were under the lowest range of lt20 (gms) The corresponding household share
with fat intakes lt50 gms fell to over 83 in 2004 and 79 in 2009 The share of households
consuming lt20 gms of fat fell sharply (from over 34 in 1993 to well over 22 in 2004 and
14 in 2009) Mean fat intakes increased over the period 1993 to 2009
Using higher ranges of fat intake for urban areas fat deprivation was pervasive (about 81 of
the households consumed lt60 gms of fats in 1993) About a quarter consumed lt25 gms
Over the period 1993ndash2009 the reduction in the proportion of fat- deprived was slight (from
81 in 1993 to 78 in 2004 to 75 in 2009) However as in rural India the proportion
consuming fats lt25 gms fell sharply Mean fat intake increased
Figures 11 and 12 show the Engel curves for fat In rural areas the fat Engel curves for 1993
lay below that for 2004 at lower levels of MPCE The 2009 curve lies above the 2004 curve
at lower levels of MPCE The crossover is at approximately Rs650 In urban areas the
crossover is at Rs1000 The curves converge beyond this
Fig 11 Fat Engel Curves for Rural India
Fig 12 Fat Engel Curves for Urban India
Thus taking nutritional norms as valid the overall picture of nutritional deprivation
worsened considerably over the period 1993ndash2009 The following Kernel density functions
(figure 13) clearly show a leftward shift in calorie and protein intake distributions and a
rightward shift in the fat intake distribution in both rural and urban areas between 1993 and
20097
7 For an admirably clear exposition of kernel density functions see Deaton (1995)
9
Fig 13 Kernel Density Functions for Calories Proteins and Fats consumed ndash Rural and
Urban India (1993 ndash 2009)
12 Factors Underlying Changes in Diets and Nutrition
We build on the DD analysis (2009) of food commodities that contributed to reduction in
calories protein and increase in fat consumption
10
Figure 14 shows the distribution of calorie protein and fat intake by food commodities for
rural and urban areas between 1993 and 2009 Detailed tables containing mean per capita
intake of nutrients from the various food items are given in the annexure
In rural India calorie intakes declined between 1993 and 2009 Most of it is attributable to
the decline in calories from cereals and pulses to some extent Calories from cereals reduced
from 1530 in 1993 to 1383 in 2004 and 1296 in 2009 The contribution of milkmilk
products sugar fruits and vegetables remained largely unchanged between 1993 and 2009
The contribution of vanaspati oil to the calorie intake increased substantially Calories
obtained from oil increased from 111 in 1993 to 145 in 2004 and 169 in 2009
Similar results are found for urban areas as well The reduction in the contribution of pulses
to calorie intakes was more drastic in urban areas between 2004 and 2009
71
68
64
58
56
54
6
7
7
9
9
10
5
7
8
8
10
11
5
5
5
6
6
6
1
1
1
1
1
1
7
8
4
11
12
5
1
1
1
2
2
2
4
4
4
5
5
4
0 10 20 30 40 50 60 70 80 90 100
1993-94
2004-05
2009-10
1993-94
2004-05
2009-10
Fig 14 Calorie Intake by Food Commodities 1993 2004 and 2009
Cereals Milk Vanaspati-Oil Sugar Eggs amp Meats Pulses Fruits Vegetables
RU
RA
L U
RB
AN
11
In both rural and urban areas protein intake declined between 1993 and 2009 (Figure 15)
Much of it is reflected in a reduction in protein intake from cereals and pulses In rural areas
the protein intake from these commodities decreased from 50 gms in 1993 to 45 gms in 2004
and 40 gms in 2009 The corresponding numbers for urban areas are 44 gms (1993) 42 gms
(2004) and 37 gms (2009) Intake from dairy products (milk eggs and meats) increased
moderately Proteins from other sources are a very small fraction and largely remained
unchanged between 1993 and 2009
Between 1993-2009 fat intake rose in both rural and urban areas Vanaspati-oil has the
maximum share in total fat intakes and its contribution rose over the period 1993 and 2009
In rural areas fat intake from vanaspati-oil rose from 12 gms in 1993 to 16 gms in 2004 and
19 gms in 2009 In urban areas the share of vanaspati-oil rose from 19 gms in 1993 to 22
gms in 2004 and 24 gms in 2009 The other significant contributor to fat intake are cereals
pulses and milk products (including ghee and butter) but their contribution reduced between
1993 and 2009 Declining intake of fats from these commodities were more than offset by the
increased intake of fat from vanaspati-oil
69
68
66
60
58
57
9
9
10
12
13
14
4
5
5
6
6
6
13
13
10
17
18
12
5
6
5
6
7
6
0 10 20 30 40 50 60 70 80 90 100
1993-94
2004-05
2009-10
1993-94
2004-05
2009-10
Fig 15 Protein Intake by Food Commodities 1993 2004 and 2009
Cereals Milk Eggs amp Meats Pulses Fruits amp Vegetables
RU
RA
L U
RB
AN
12
13 Demand Theory Based Explanation of Changes in Nutrient Intake
In response to the DeatonndashDreze (2009) explanation of a downward shift in the calorie Engel
curve in terms of lower lsquorequirementsrsquo due to health improvements and less strenuous
activity levels and more sedentary life-styles we have developed an alternative explanation
of changes in the consumption of calories protein and fats over the period 1993ndash2009 This
explanation is embedded in a standard demand theory framework with food prices8 and
expenditure (as a proxy for income) cast in a pivotal role Based on different experiments
robust demand functions are estimated for each of the three nutrients viz calories protein and
fats (Tables 1-3) Our results show consistently robust food price and expenditure effects
thus raising further doubts about the adequacy of the DD explanation The analysis is based
8 An important point to bear in mind is that the price effects capture both own and cross-price effects through
substitutions between food commodities Briefly as prices change demands for commodities change and
consequently calorie (and other nutrientsrsquo) intakes Underlying this is a presumption that food choices are
informed by their nutritional content As Deaton and Dreze (2009) emphasise people do not buy calories and
other nutrients but food commodities However if food choices are informed by their nutritional values it is
meaningful to talk about demands for calories and other nutrients
17
14
11
10
8
7
31
27
26
31
29
30
39
46
49
44
47
49
2
1
1
2
2
1
8
9
3
10
12
3
4
3
3
4
3
3
0 10 20 30 40 50 60 70 80 90 100
1993-94
2004-05
2009-10
1993-94
2004-05
2009-10
Fig 16 Fat Intake by Food Commodities 1993 2004 and 2009
Cereals Milk Vanaspati-Oil Eggs amp Meats Pulses Fruits amp Vegetables
RU
RA
L U
RB
AN
13
on unit record data collected for the 50th
61st and 66
th rounds of the NSS (corresponding to
the years 1993ndash94 2004ndash05 and 2009-10 respectively) We will discuss separately the
results for rural and urban samples
(a) Demand Function
A basic demand equation for nutrients (calories protein fats) in rural and urban India with
pooled data for 1993 2004 and 2009 is given below
(1)
where the dependent variable is log of nutrient consumed by ith household in time t jtP is a
vector of food prices computed from the NSS at the village level (j) and time t E it is
household per capita expenditure for ith household in time t itX is a vector of household
characteristics (eg number of adult males females household size ) and a few others
specified as dummy variables (caste) D1t is a dummy variable that takes the value 1 for 2004
and 0 otherwise (to allow for changes in factors other than food prices and expenditure over
time) D2t+k is the second time dummy that takes the value 1 for 2009 and 0 otherwise and
it is the error term This equation is estimated using robust regression Although a Chow test
for a structural shift is not feasible with robust regression we have employed two
refinements one is the use of a time dummy that could potentially capture the health
improvements and less strenuous activity patterns (associated with easier access to drinking
water better transportation facilities) and the other is interactions of food price variables
with the time dummy to allow for different price and expenditure effects over time9
An important point to bear in mind is that the price effects capture both own and cross-price
effects through substitutions between food commodities Briefly as prices change demands
for commodities change and consequently for example calorie (and other nutrientsrsquo) intakes
9 While these effects yield insights into changing consumer demands a more detailed analysis along the lines of
Behrman and Deolalikar (1989) and Jha et al (2009) would further deepen our understanding consumer
preferences and tastes for variety
14
(b) Results
We first consider the calorie demand function For both rural and urban areas each of the
price effects has a significant negative coefficient with the exception of price of fruits and
vegetables whose coefficient in not significant Moreover the price effects on the demand for
calories have in many cases weakened as captured by the coefficients of the interaction term
(ie interaction between the price and the time dummies) A case in point is price of cereals
and pulses Rising incomes have a positive impact on calorie demand and so does the
proportion of adults in the household The former effect however weakened over time As
household size increases calorie demand decreases Education of adult female has a negative
impact on calorie demand as this may be attributed to consumption of a more balanced diet
rich in protein and vitamins and reduced dependence on cereals which is a major source of
calories By contrast education of adult male is not significant in rural areas but positive in
urban areas SCs have lower demands for calories in both rural and urban areas while that of
Others is positive in rural areas and negative in urban areas relative to STs The effect of time
alone is reduced consumption of calorie between 1993 and 2004 However somewhat
surprisingly the residual time effect is not significant between 2004-09 That this undermines
the DD explanation emphasising lower calorie requirements due to improvements in the
epidemiology of the disease environment less strenuous physical activities and more
sedentary life styles cannot be ruled out
In case of protein demand in both rural and urban areas there is a positive influence of the
price of fruits and vegetables whereas the elasticity of protein demand with respect to all
other food prices is negative As in the case of calorie demand several price effects
weakened over over time as captured by the interaction term (between food prices and the
time dummies) A case in point is price of milk and milk products eggs and meats Higher
incomeexpenditure increase protein demand but less so over time Increasing household size
reduces protein demand whereas rising proportion of adults in the household increases it
The impact of education of adult female is negative and that of education of adult male is
not significant SCs have lower demand for protein while Others have higher demand relative
to STs The residual effect of time after accounting for the interaction is significant with a
negative coefficient suggesting a lower demand for protein in 2009 and 2004 as compared to
1993
15
In case of fats too in both rural and urban areas there are significant price and expenditure
effects ndash positive in the case of price of cereals oil and fruits and vegetables and negative in
case of milk products and sugar The positive price elasticity of fats with respect to edible oil
price is somewhat surprising although the price effect has weakened over time MPCE has
positive Unlike in the case of calorie and protein highest education of adult female has a
positive impact on fat demand suggesting that households with females having higher than
middle level of education tend to eat diets rich in fats shifting away from diets rich in
calories and proteins Moreover highest education of adult male also has a positive and
significant effect As in the case of calorie and protein household size has a negative impact
and proportion of adults in a household has a positive impact on demand for fats SCs and
Others have higher demands relative to STs The effect of time alone is to increase the fat
demand in 2009 and 2004 as compared to 1993
2 Concluding Observations
The main findings of our analysis are summarised below from a policy perspective
An important insight from the comparison of three rounds of the NSS over the period 1993-
2009 points to a slowing down of the reduction in the calorie intake in both rural and urban
areas in 2004-09 relative to 1993-2004 A similar slowing down occurred in protein intake
over the more recent period (2004-09) While fat intake continued to rise over this period but
at a lower rate
A demand theory based explanation of changes in demands for these nutrients reaffirmed the
important roles of food price and expenditure changes A new insight however is that in
several cases food price effects weakened over time as also expenditure effects While the
residual time effect weakened for both calories and protein over the period 1993-2004 it
slowed down over the more recent period The effect of time on fat demand was however
positive and strengthened over the more recent period Altogether thus the DD explanation of
lower calorie and protein demands over time as a result of lower requirements is further
undermined
From a policy perspective the important roles of food price stabilisation and expansion of
livelihood opportunities remain key to ameliorating nutritional deprivation despite lowering
of nutritional requirements A closer scrutiny of dietary preferences and tastes is crucial for
16
both understanding sources of nutritional deprivation and for designing effective policies for
mitigating it
17
Table 1 Robust Regression Estimates Demand for Calories 1993-2009
RURAL URBAN
Dependent Variable Log of Per capita consumption
of calories
No of Obs = 193785 No of Obs = 124481
F(60193724) = 1192631 F(60124420) = 370511
Prob gt F = 0 Prob gt F = 0
Coefficient Elasticity Coefficient Elasticity
Price Cereals amp Pulses -0012 (-2524) -0166 (-2524) -0006 (-102) -0090 (-102)
---interaction T1 (2004) 0011 (2072) 0049 (2072) 0001 (096) - 0003 (096) -
---interaction T2 (2009) 0010 (2005) 0071 (2005) 0004 (699) 0037 (699)
Price Milk Milk Products Eggs amp Meats
-0003 (-6421) -0098 (-6421) -0001 (-1253) -0035 (-1253)
---interaction T1 (2004) 0002 (4288) 0026 (4288) 0000 (329) 0003 (329)
---interaction T2 (2009) 0002 (4983) 0040 (4983) 0001 (904) 0013 (904)
Price Oil -0008 (-2667) -0086 (-2667) -0004 (-101) -0048 (-101)
---interaction T1 (2004) 0004 (1175) 0015 (1175) 0001 (189) 0003 (189)
---interaction T2 (2009) 0006 (1934) 0031 (1934) 0004 (994) 0024 (994)
Price Sugar -0002 (-127) -0124 (-127) -0004 (-1209) -0183 (-1209)
---interaction T1 (2004) 0002 (1136) 0050 (1136) 0003 (1029) 0061 (1029)
---interaction T2 (2009) 0001 (704) 0027 (704) 0002 (516) 0033 (516)
Price Fruits amp Vegetables
-0001 (-116) - -0010 (-116) - 0001 (194) 0026 (194)
---interaction T1 (2004) 0001 (275) 0010 (275) 0000 (026) - 0001 (026) -
---interaction T2 (2009) -0001 (-174) -0007 (-174) -0003 (-392) -0027 (-392)
Monthly per capita expenditure
0001 (40195) 0418 (40195) 0000 (22549) 0240 (22549)
---interaction T1 (2004) 0000 (-1160) -0054 (-1160) 0000 (-2386) -0011 (-2386)
---interaction T2 (2009) 0000 (-1712) -0063 (-1712) 0000 (-5097) -0022 (-5097)
Household Size -0006 (-3076) -0033 (-3076) -0021 (-684) -0096 (-684)
Proportion of Adults in the household
0202 (9139) 0137 (9139) 0235 (8183) 0169 (8183)
Education Dummy Males 0000 (-023) - 0000 (-023) - 0012 (805) 0008 (805)
Education Dummy Females
-0025 (-215) -0008 (-215) -0013 (-952) -0007 (-952)
Time Dummy (2004) -0159 (-1893) -0061 (-1893) -0105 (-829) -0036 (-829)
Time Dummy (2009) -0007 (-069) - -0002 (-069) - 0006 (045) - 0002 (045) -
Caste Dummy (SC) -0011 (-586) -0002 (-586) -0017 (-498) -0002 (-498)
Caste Dummy (Others) 0010 (616) 0006 (616) -0005 (-177) -0004 (-177)
Constant 7569 (89023)
7712 (59282)
and refer to significance at the 1 5 and 10 level respectively
State Dummies are omitted and details will be furnished on request Education Dummy If highest level of education is middle or lower then dummy = 0 else=1 Omitted Time period 1993 Omitted caste ST
18
Table 2 Robust Regression Estimates Demand for Protein 1993-2009
RURAL URBAN
Dependent Variable
Log of Per capita consumption of protein
No of Obs = 193784 No of Obs = 124481
F(60193723) = 1144586 F(60124420) = 391491
Prob gt F = 0 Prob gt F = 0
Coefficient Elasticity Coefficient Elasticity
Price Cereals amp Pulses -0013 (-2392) -0169 (-2392) -0009 (-1508) -0144 (-1508)
---interaction T1 (2004) 0013 (2153) 0055 (2153) 0005 (662) 0019 (662)
---interaction T2 (2009) 0012 (2187) 0084 (2187) 0009 (1386) 0079 (1386)
Price Milk Milk Products Eggs amp Meats
-0003 (-7497) -0123 (-7497) 0000 (-373) -0011 (-373)
---interaction T1 (2004) 0002 (4993) 0032 (4993) 0000 (-196) -0002 (-196)
---interaction T2 (2009) 0003 (5815) 0050 (5815) 0000 (264) 0004 (264)
Price Oil -0010 (-3216) -0112 (-3216) -0007 (-1709) -0088 (-1709)
---interaction T1 (2004) 0005 (1623) 0022 (1623) 0003 (658) 0012 (658)
---interaction T2 (2009) 0007 (2218) 0038 (2218) 0006 (1562) 0041 (1562)
Price Sugar -0002 (-1085) -0114 (-1085) -0003 (-844) -0139 (-844)
---interaction T1 (2004) 0002 (941) 0045 (941) 0001 (337) 0022 (337)
---interaction T2 (2009) 0001 (249) 0010 (249) 0000 (082) - 0006 (082) -
Price Fruits amp Vegetables
0002 (42) 0040 (42) 0002 (244) 0036 (244)
---interaction T1 (2004) 0000 (084) - 0003 (084) - -0001 (-081) - -0004 (-081) -
---interaction T2 (2009) -0003 (-652) -0030 (-652) -0003 (-366) -0027 (-366)
Monthly per capita expenditure
0001 (39184) 0438 (39184) 0000 (21912) 0254 (21912)
---interaction T1 (2004) 0000 (-1004) -0051 (-1004) 0000 (-1527) -0008 (-1527)
---interaction T2 (2009) 0000 (-1389) -0058 (-1389) 0000 (-3705) -0017 (-3705)
Household Size -0005 (-2368) -0027 (-2368) -0018 (-5526) -0084 (-5526)
Proportion of Adults in the household
0198 (8293) 0134 (8293) 0226 (7247) 0163 (7247)
Education Dummy
Males 0001 (116) - 0001 (116) - 0012 (743) 0008 (743)
Education Dummy Females
-0025 (-2031) -0008 (-2031) -0014 (-947) -0008 (-947)
Time Dummy (2004) -0210 (-2315) -0081 (-2315) -0050 (-36) -0017 (-36)
Time Dummy (2009) -0031 (-284) -0009 (-284) -0047 (-307) -0015 (-307)
Caste Dummy (SC) -0007 (-364) -0001 (-364) -0007 (-187) -0001 (-187)
Caste Dummy (Others) 0011 (623) 0007 (623) 0005 (143) - 0004 (143) -
Constant 3952 (43144)
4101 (28987)
and refer to significance at the 1 5 and 10 level respectively
State Dummies are omitted and details will be furnished on request Education Dummy If highest level of education is middle or lower then dummy = 0 else=1 Omitted Time period 1993 Omitted caste ST
19
Table 3 Robust Regression Estimates Demand for Fats 1993- 2009
RURAL URBAN
Dependent Variable Log of Per capita
consumption of Fats
No of Obs = 193784 No of Obs = 124481
F(60193723) = 1895778 F(60124420) = 766201
Prob gt F = 0 Prob gt F = 0
Coefficient Elasticity Coefficient Elasticity
Price Cereals amp Pulses 0016 (2033) 0218 (2033) 0012 (1462) 0193 (1462)
---interaction T1 (2004) -0005 (-598) -0023 (-598) -0008 (-871) -0035 (-871)
---interaction T2 (2009) -0009 (-1067) -0062 (-1067) -0006 (-661) -0052 (-661)
Price Milk Milk Products Eggs amp Meats
-0013 (-1924) -0478 (-1924) -0009 (-7698) -0327 (-7698)
---interaction T1 (2004) 0008 (10509) 0106 (10509) 0005 (3537) 0056 (3537)
---interaction T2 (2009) 0010 (13313) 0172 (13313) 0007 (5587) 0121 (5587)
Price Oil 0002 (445) 0023 (445) 0007 (1364) 0097 (1364)
---interaction T1 (2004) -0001 (-251) -0005 (-251) -0003 (-571) -0014 (-571)
---interaction T2 (2009) -0002 (-429) -0011 (-429) -0004 (-801) -0029 (-801)
Price Sugar -0004 (-1365) -0217 (-1365) -0003 (-75) -0170 (-75)
---interaction T1 (2004) 0001 (306) 0022 (306) 0001 (123) - 0011 (123) -
---interaction T2 (2009) -0001 (-169) -0011 (-169) -0002 (-42) -0040 (-42)
Price Fruits amp Vegetables
0011 (1418) 0206 (1418) 0006 (615) 0125 (615)
---interaction T1 (2004) -0010 (-1227) -0070 (-1227) -0006 (-556) -0037 (-556)
---interaction T2 (2009) -0011 (-1392) -0097 (-1392) -0008 (-74) -0076 (-74)
Monthly per capita expenditure
0001 (44365) 0753 (44365) 0000 (28858) 0462 (28858)
---interaction T1 (2004) 0000 (-1279) -0098 (-127) 0000 (-1896) -0014 (-1896)
---interaction T2 (2009) -0001 (-2100) -0126 (-2100) 0000 (-8414) -0054 (-8414)
Household Size -0019 (-5556) -0097 (-5556) -0039 (-8497) -0179 (-8497)
Proportion of Adults in the household
0165 (4584) 0112 (4584) 0188 (4368) 0135 (4368)
Education Dummy Males
0056 (3204) 0029 (3204) 0086 (3825) 0060 (3825)
Education Dummy Females
0031 (167) 0010 (167) 0086 (4086) 0048 (4086)
Time Dummy (2004) 0299 (2175) 0115 (2175) 0161 (845) 0055 (845)
Time Dummy (2009) 0564 (3391) 0165 (3391) 0360 (1697) 0114 (1697)
Caste Dummy (SC) 0052 (174) 0009 (174) 0040 (764) 0005 (764)
Caste Dummy (Others) 0135 (5278) 0090 (5278) 0108 (2307) 0086 (2307)
Constant 3023 (21787)
3474 (17776)
and refer to significance at the 1 5 and 10 level respectively
State Dummies are omitted and details will be furnished on request Education Dummy If highest level of education is middle or lower then dummy = 0 else=1 Omitted Time period 1993 Omitted caste ST
20
Annexure 1 Distribution of Nutrient Intake (1993 ndash 2009)
The following tables show the distribution of nutrient intake (proportion of population in
each category) in rural and urban areas between 1993 and 2009 Figures in parenthesis
indicate the mean nutrient intake in each range
Table 1 Calorie Intake Distributions in Rural India 1993 2004 and 2009
Year Range of Calorie Intake Per Capita Per Day
Total lt1800 1801ndash2400 2401ndash3000 gt3000
1993 3109 (1491)
4007 (2084)
1942 (2650)
942 (3636)
100 (2156)
2004 3668
(1516)
4311
(2071)
1507
(2629)
514
(3925)
100
(2047)
2010 3528
(1531)
4591
(2071)
1492
(2622)
389
(3545)
100
(2020)
Table 2 Calorie Intake Distributions in Urban India 1993 2004 and 2009
Year
Range of Calorie Intake Per Capita Per Day
Total lt1700 1701ndash2100 2101ndash2600 gt2600
1993 2812
(1426)
2962
(1900)
2576
(2320)
1649
(3107)
100
(2074)
2004 2940
(1440)
3452
(1900)
2467
(2313)
1141
(3252)
100
(2021)
2010 3010
(1456)
3534
(1896)
2436
(2312)
1019
(3043)
100
(1982)
Table 3 Protein Intake Distributions in Rural India 1993 2004 and 2009
Year Range of Protein Intake Per Capita Per Day (Gms)
Total lt45 46ndash60 61ndash75 gt75
1993 2381
(371)
3379
(524)
2279
(668)
1961
(944)
100
(603)
2004 2881
(374)
3805
(522)
2146
(663)
1168
(939)
100
(558)
2010 2935
(380)
4081
(521)
2105
(661)
879
(892)
100
(541)
21
Table 4 Protein Intake Distributions in Urban India 1993 2004 and 2009
Year Range of Protein Intake Per Capita Per Day (Gms)
Total lt45 46ndash60 61ndash75 gt75
1993 2490
(371)
3777
(524)
2311
(665)
1423
(907)
100
(573)
2004 2940
(378)
3450
(523)
2469
(662)
1140
(949)
100
(554)
2010 2944
(383)
4366
(521)
1961
(661)
729
(876)
100
(534)
Table 5 Fat Intake Distributions in Rural India 1993 2004 and 2009
Year Range of Fat Intake Per Capita Per Day (Gms)
Total lt20 21ndash30 31ndash50 gt50
1993 3430
(140)
2508
(247)
2609
(383)
1454
(721)
100
(315)
2004 2259
(150)
2721
(249)
3358
(383)
1662
(746)
100
(354)
2010 1420
(154)
2405
(251)
4049
(388)
2125
(672)
100
(382)
Table 6 Fat Intake Distributions in Urban India 1993 2004 and 2009
Year Range of Fat Intake Per Capita Per Day (Gms)
Total lt25 26ndash40 41ndash60 gt60
1993 2504
(182)
2984
(323)
2615
(486)
1897
(802)
100
(421)
2004 1539
(194)
3102
(326)
3156
(489)
2204
(858)
100
(474)
2010 1032
(198)
2788
(330)
3661
(490)
2519
(781)
100
(489)
Source Authorsrsquo calculations based on the 50th 61
st and 66
th rounds of the NSS
22
Annexure 2 Distribution of Nutrient Intake by Food Commodities (1993 -2009)
The following tables show the distribution of nutrient (calorie protein and fat) intake from
nine food commodity groups for rural and urban areas between 1993 and 2009
Table 1 Mean Per Capita Calorie Intake by Food Commodities 1993 2004 and 2009
Year Cereals Milk
Products GheeButter
Vanaspati-Oil
Sugar Eggs MeatFish Poultry
PulsesNuts Dry Fruits
Fruits Vegetables Total
Rural India
1993-94 1530 137 111 103 2 12 151 20 89 2156
Share 710 64 51 48 01 06 70 09 41
2004-05 1383 137 145 98 3 12 156 23 90 2047
Share 676 67 71 48 01 06 76 11 44
2009-10 1296 141 169 93 3 12 84 20 83 2020
Share 642 70 84 46 01 06 42 10 41
Urban India
1993-94 1213 181 168 129 5 16 231 37 94 2074
Share 585 87 81 62 02 08 111 18 45
2004-05 1133 189 199 115 6 16 235 36 92 2021
Share 561 94 98 57 03 08 116 18 46
2009-
10 1071 199 217 110 5 14 106 33 83 1982
Share 540 100 109 55 03 07 53 17 42
Table 2 Mean Per Capita Protein Intake by Food Commodities 1993 2004 and 2009
Year Cereals Milk
Products GheeButter
Vanaspati-Oil
Sugar Eggs MeatFish Poultry
PulsesNuts Dry Fruits
Fruits Vegetables Total
Rural India
1993-94 418 53 0 0 02 2 78 02 29 603
Share 693 88 00 00 03 33 129 03 48
2004-05 379 53 0 0 03 2 73 03 28 558
Share 679 95 00 00 05 36 131 05 50
2009-10 356 55 0 0 03 2 53 02 25 541
Share 658 102 00 00 06 37 98 04 46
Urban India
1993-94 341 67 0 0 04 26 10 04 31 573
Share 595 117 00 00 07 45 175 07 54
2004-05 32 7 0 0 05 27 98 04 31 554
Share 578 126 00 00 09 49 177 07 56
2009-
10 302 74 0 0 04 26 65 04 27 534
Share 566 139 00 00 07 49 122 07 51
23
Table 3 Mean Per Capita Fat Intake by Food Commodities 1993 2004 and 2009
Year Cereals Milk
Products GheeButter
Vanaspati-Oil
Sugar Eggs MeatFish Poultry
PulsesNuts Dry Fruits
Fruits Vegetables Total
Rural India
1993-94 54 97 123 0 02 03 24 07 04 315
Share 171 308 390 00 06 10 76 22 13
2004-05 48 97 162 0 03 02 31 08 04 354
Share 136 274 458 00 08 06 88 23 11
2009-10 43 10 187 0 03 02 11 08 03 382
Share 113 262 490 00 08 05 29 21 08
Urban India
1993-94 4 132 186 0 04 04 4 11 04 421
Share 95 314 442 00 10 10 95 26 10
2004-05 37 138 221 0 05 03 56 11 04 475
Share 78 291 465 00 11 06 118 23 08
2009-
10 35 145 241 0 04 02 15 11 04 489
Share 72 297 493 00 08 04 31 22 08
Source Authorsrsquo calculations based on the 50th 61
st and 66
th rounds of the NSS
24
References
Behrman J and A Deolalikar (1989) ldquoIs Variety the Spice of life Implications for Calorie
Intakerdquo Review of Economics and Statistics vol 71
Deaton A (1995) The Analysis of Household Surveys A Microeconomic approach to
Development Policy Baltimore MD The Johns Hopkins University Press
Deaton A and J Dreze (2009) lsquoFood and Nutrition in India Facts and Interpretationsrsquo
Economic and Political Weekly XLIV(7) 42ndash65
Gaiha R R Jha and Vani S Kulkarni (2012) ldquoDemand for Nutrients in India 1993 to
2004rdquo Applied Economics available online 1 February 2012
Gopalan C B Sastri and S Balasubramanian (1971) Nutritive Value of Indian Foods
National institute of Nutrition Indian Council of Medical Research Hyderabad
Indian Council of Medical Research (ICMR 1990) Nutrient Requirements and
Recommended Dietary Allowances for Indians New Delhi ICMR
Jha R R Gaiha and A Sharma (2009) ldquo Modelling Variety in Consumption Expenditure on
Food in Indiardquo International Review of Applied Economics online publication 1
July 2009
Srinivasan TN (1992) lsquoUndernutrition Concepts Measurements and Policy Implicationsrsquo
in SR Osmani (ed) Nutrition and Poverty Clarendon Press Oxford pp 97ndash120

8
Even considering the first three ranges of fat intake an astonishingly high estimate for fat
deficient households for rural India (over 85) is obtained for 1993 Well over one-third of
households were under the lowest range of lt20 (gms) The corresponding household share
with fat intakes lt50 gms fell to over 83 in 2004 and 79 in 2009 The share of households
consuming lt20 gms of fat fell sharply (from over 34 in 1993 to well over 22 in 2004 and
14 in 2009) Mean fat intakes increased over the period 1993 to 2009
Using higher ranges of fat intake for urban areas fat deprivation was pervasive (about 81 of
the households consumed lt60 gms of fats in 1993) About a quarter consumed lt25 gms
Over the period 1993ndash2009 the reduction in the proportion of fat- deprived was slight (from
81 in 1993 to 78 in 2004 to 75 in 2009) However as in rural India the proportion
consuming fats lt25 gms fell sharply Mean fat intake increased
Figures 11 and 12 show the Engel curves for fat In rural areas the fat Engel curves for 1993
lay below that for 2004 at lower levels of MPCE The 2009 curve lies above the 2004 curve
at lower levels of MPCE The crossover is at approximately Rs650 In urban areas the
crossover is at Rs1000 The curves converge beyond this
Fig 11 Fat Engel Curves for Rural India
Fig 12 Fat Engel Curves for Urban India
Thus taking nutritional norms as valid the overall picture of nutritional deprivation
worsened considerably over the period 1993ndash2009 The following Kernel density functions
(figure 13) clearly show a leftward shift in calorie and protein intake distributions and a
rightward shift in the fat intake distribution in both rural and urban areas between 1993 and
20097
7 For an admirably clear exposition of kernel density functions see Deaton (1995)
9
Fig 13 Kernel Density Functions for Calories Proteins and Fats consumed ndash Rural and
Urban India (1993 ndash 2009)
12 Factors Underlying Changes in Diets and Nutrition
We build on the DD analysis (2009) of food commodities that contributed to reduction in
calories protein and increase in fat consumption
10
Figure 14 shows the distribution of calorie protein and fat intake by food commodities for
rural and urban areas between 1993 and 2009 Detailed tables containing mean per capita
intake of nutrients from the various food items are given in the annexure
In rural India calorie intakes declined between 1993 and 2009 Most of it is attributable to
the decline in calories from cereals and pulses to some extent Calories from cereals reduced
from 1530 in 1993 to 1383 in 2004 and 1296 in 2009 The contribution of milkmilk
products sugar fruits and vegetables remained largely unchanged between 1993 and 2009
The contribution of vanaspati oil to the calorie intake increased substantially Calories
obtained from oil increased from 111 in 1993 to 145 in 2004 and 169 in 2009
Similar results are found for urban areas as well The reduction in the contribution of pulses
to calorie intakes was more drastic in urban areas between 2004 and 2009
71
68
64
58
56
54
6
7
7
9
9
10
5
7
8
8
10
11
5
5
5
6
6
6
1
1
1
1
1
1
7
8
4
11
12
5
1
1
1
2
2
2
4
4
4
5
5
4
0 10 20 30 40 50 60 70 80 90 100
1993-94
2004-05
2009-10
1993-94
2004-05
2009-10
Fig 14 Calorie Intake by Food Commodities 1993 2004 and 2009
Cereals Milk Vanaspati-Oil Sugar Eggs amp Meats Pulses Fruits Vegetables
RU
RA
L U
RB
AN
11
In both rural and urban areas protein intake declined between 1993 and 2009 (Figure 15)
Much of it is reflected in a reduction in protein intake from cereals and pulses In rural areas
the protein intake from these commodities decreased from 50 gms in 1993 to 45 gms in 2004
and 40 gms in 2009 The corresponding numbers for urban areas are 44 gms (1993) 42 gms
(2004) and 37 gms (2009) Intake from dairy products (milk eggs and meats) increased
moderately Proteins from other sources are a very small fraction and largely remained
unchanged between 1993 and 2009
Between 1993-2009 fat intake rose in both rural and urban areas Vanaspati-oil has the
maximum share in total fat intakes and its contribution rose over the period 1993 and 2009
In rural areas fat intake from vanaspati-oil rose from 12 gms in 1993 to 16 gms in 2004 and
19 gms in 2009 In urban areas the share of vanaspati-oil rose from 19 gms in 1993 to 22
gms in 2004 and 24 gms in 2009 The other significant contributor to fat intake are cereals
pulses and milk products (including ghee and butter) but their contribution reduced between
1993 and 2009 Declining intake of fats from these commodities were more than offset by the
increased intake of fat from vanaspati-oil
69
68
66
60
58
57
9
9
10
12
13
14
4
5
5
6
6
6
13
13
10
17
18
12
5
6
5
6
7
6
0 10 20 30 40 50 60 70 80 90 100
1993-94
2004-05
2009-10
1993-94
2004-05
2009-10
Fig 15 Protein Intake by Food Commodities 1993 2004 and 2009
Cereals Milk Eggs amp Meats Pulses Fruits amp Vegetables
RU
RA
L U
RB
AN
12
13 Demand Theory Based Explanation of Changes in Nutrient Intake
In response to the DeatonndashDreze (2009) explanation of a downward shift in the calorie Engel
curve in terms of lower lsquorequirementsrsquo due to health improvements and less strenuous
activity levels and more sedentary life-styles we have developed an alternative explanation
of changes in the consumption of calories protein and fats over the period 1993ndash2009 This
explanation is embedded in a standard demand theory framework with food prices8 and
expenditure (as a proxy for income) cast in a pivotal role Based on different experiments
robust demand functions are estimated for each of the three nutrients viz calories protein and
fats (Tables 1-3) Our results show consistently robust food price and expenditure effects
thus raising further doubts about the adequacy of the DD explanation The analysis is based
8 An important point to bear in mind is that the price effects capture both own and cross-price effects through
substitutions between food commodities Briefly as prices change demands for commodities change and
consequently calorie (and other nutrientsrsquo) intakes Underlying this is a presumption that food choices are
informed by their nutritional content As Deaton and Dreze (2009) emphasise people do not buy calories and
other nutrients but food commodities However if food choices are informed by their nutritional values it is
meaningful to talk about demands for calories and other nutrients
17
14
11
10
8
7
31
27
26
31
29
30
39
46
49
44
47
49
2
1
1
2
2
1
8
9
3
10
12
3
4
3
3
4
3
3
0 10 20 30 40 50 60 70 80 90 100
1993-94
2004-05
2009-10
1993-94
2004-05
2009-10
Fig 16 Fat Intake by Food Commodities 1993 2004 and 2009
Cereals Milk Vanaspati-Oil Eggs amp Meats Pulses Fruits amp Vegetables
RU
RA
L U
RB
AN
13
on unit record data collected for the 50th
61st and 66
th rounds of the NSS (corresponding to
the years 1993ndash94 2004ndash05 and 2009-10 respectively) We will discuss separately the
results for rural and urban samples
(a) Demand Function
A basic demand equation for nutrients (calories protein fats) in rural and urban India with
pooled data for 1993 2004 and 2009 is given below
(1)
where the dependent variable is log of nutrient consumed by ith household in time t jtP is a
vector of food prices computed from the NSS at the village level (j) and time t E it is
household per capita expenditure for ith household in time t itX is a vector of household
characteristics (eg number of adult males females household size ) and a few others
specified as dummy variables (caste) D1t is a dummy variable that takes the value 1 for 2004
and 0 otherwise (to allow for changes in factors other than food prices and expenditure over
time) D2t+k is the second time dummy that takes the value 1 for 2009 and 0 otherwise and
it is the error term This equation is estimated using robust regression Although a Chow test
for a structural shift is not feasible with robust regression we have employed two
refinements one is the use of a time dummy that could potentially capture the health
improvements and less strenuous activity patterns (associated with easier access to drinking
water better transportation facilities) and the other is interactions of food price variables
with the time dummy to allow for different price and expenditure effects over time9
An important point to bear in mind is that the price effects capture both own and cross-price
effects through substitutions between food commodities Briefly as prices change demands
for commodities change and consequently for example calorie (and other nutrientsrsquo) intakes
9 While these effects yield insights into changing consumer demands a more detailed analysis along the lines of
Behrman and Deolalikar (1989) and Jha et al (2009) would further deepen our understanding consumer
preferences and tastes for variety
14
(b) Results
We first consider the calorie demand function For both rural and urban areas each of the
price effects has a significant negative coefficient with the exception of price of fruits and
vegetables whose coefficient in not significant Moreover the price effects on the demand for
calories have in many cases weakened as captured by the coefficients of the interaction term
(ie interaction between the price and the time dummies) A case in point is price of cereals
and pulses Rising incomes have a positive impact on calorie demand and so does the
proportion of adults in the household The former effect however weakened over time As
household size increases calorie demand decreases Education of adult female has a negative
impact on calorie demand as this may be attributed to consumption of a more balanced diet
rich in protein and vitamins and reduced dependence on cereals which is a major source of
calories By contrast education of adult male is not significant in rural areas but positive in
urban areas SCs have lower demands for calories in both rural and urban areas while that of
Others is positive in rural areas and negative in urban areas relative to STs The effect of time
alone is reduced consumption of calorie between 1993 and 2004 However somewhat
surprisingly the residual time effect is not significant between 2004-09 That this undermines
the DD explanation emphasising lower calorie requirements due to improvements in the
epidemiology of the disease environment less strenuous physical activities and more
sedentary life styles cannot be ruled out
In case of protein demand in both rural and urban areas there is a positive influence of the
price of fruits and vegetables whereas the elasticity of protein demand with respect to all
other food prices is negative As in the case of calorie demand several price effects
weakened over over time as captured by the interaction term (between food prices and the
time dummies) A case in point is price of milk and milk products eggs and meats Higher
incomeexpenditure increase protein demand but less so over time Increasing household size
reduces protein demand whereas rising proportion of adults in the household increases it
The impact of education of adult female is negative and that of education of adult male is
not significant SCs have lower demand for protein while Others have higher demand relative
to STs The residual effect of time after accounting for the interaction is significant with a
negative coefficient suggesting a lower demand for protein in 2009 and 2004 as compared to
1993
15
In case of fats too in both rural and urban areas there are significant price and expenditure
effects ndash positive in the case of price of cereals oil and fruits and vegetables and negative in
case of milk products and sugar The positive price elasticity of fats with respect to edible oil
price is somewhat surprising although the price effect has weakened over time MPCE has
positive Unlike in the case of calorie and protein highest education of adult female has a
positive impact on fat demand suggesting that households with females having higher than
middle level of education tend to eat diets rich in fats shifting away from diets rich in
calories and proteins Moreover highest education of adult male also has a positive and
significant effect As in the case of calorie and protein household size has a negative impact
and proportion of adults in a household has a positive impact on demand for fats SCs and
Others have higher demands relative to STs The effect of time alone is to increase the fat
demand in 2009 and 2004 as compared to 1993
2 Concluding Observations
The main findings of our analysis are summarised below from a policy perspective
An important insight from the comparison of three rounds of the NSS over the period 1993-
2009 points to a slowing down of the reduction in the calorie intake in both rural and urban
areas in 2004-09 relative to 1993-2004 A similar slowing down occurred in protein intake
over the more recent period (2004-09) While fat intake continued to rise over this period but
at a lower rate
A demand theory based explanation of changes in demands for these nutrients reaffirmed the
important roles of food price and expenditure changes A new insight however is that in
several cases food price effects weakened over time as also expenditure effects While the
residual time effect weakened for both calories and protein over the period 1993-2004 it
slowed down over the more recent period The effect of time on fat demand was however
positive and strengthened over the more recent period Altogether thus the DD explanation of
lower calorie and protein demands over time as a result of lower requirements is further
undermined
From a policy perspective the important roles of food price stabilisation and expansion of
livelihood opportunities remain key to ameliorating nutritional deprivation despite lowering
of nutritional requirements A closer scrutiny of dietary preferences and tastes is crucial for
16
both understanding sources of nutritional deprivation and for designing effective policies for
mitigating it
17
Table 1 Robust Regression Estimates Demand for Calories 1993-2009
RURAL URBAN
Dependent Variable Log of Per capita consumption
of calories
No of Obs = 193785 No of Obs = 124481
F(60193724) = 1192631 F(60124420) = 370511
Prob gt F = 0 Prob gt F = 0
Coefficient Elasticity Coefficient Elasticity
Price Cereals amp Pulses -0012 (-2524) -0166 (-2524) -0006 (-102) -0090 (-102)
---interaction T1 (2004) 0011 (2072) 0049 (2072) 0001 (096) - 0003 (096) -
---interaction T2 (2009) 0010 (2005) 0071 (2005) 0004 (699) 0037 (699)
Price Milk Milk Products Eggs amp Meats
-0003 (-6421) -0098 (-6421) -0001 (-1253) -0035 (-1253)
---interaction T1 (2004) 0002 (4288) 0026 (4288) 0000 (329) 0003 (329)
---interaction T2 (2009) 0002 (4983) 0040 (4983) 0001 (904) 0013 (904)
Price Oil -0008 (-2667) -0086 (-2667) -0004 (-101) -0048 (-101)
---interaction T1 (2004) 0004 (1175) 0015 (1175) 0001 (189) 0003 (189)
---interaction T2 (2009) 0006 (1934) 0031 (1934) 0004 (994) 0024 (994)
Price Sugar -0002 (-127) -0124 (-127) -0004 (-1209) -0183 (-1209)
---interaction T1 (2004) 0002 (1136) 0050 (1136) 0003 (1029) 0061 (1029)
---interaction T2 (2009) 0001 (704) 0027 (704) 0002 (516) 0033 (516)
Price Fruits amp Vegetables
-0001 (-116) - -0010 (-116) - 0001 (194) 0026 (194)
---interaction T1 (2004) 0001 (275) 0010 (275) 0000 (026) - 0001 (026) -
---interaction T2 (2009) -0001 (-174) -0007 (-174) -0003 (-392) -0027 (-392)
Monthly per capita expenditure
0001 (40195) 0418 (40195) 0000 (22549) 0240 (22549)
---interaction T1 (2004) 0000 (-1160) -0054 (-1160) 0000 (-2386) -0011 (-2386)
---interaction T2 (2009) 0000 (-1712) -0063 (-1712) 0000 (-5097) -0022 (-5097)
Household Size -0006 (-3076) -0033 (-3076) -0021 (-684) -0096 (-684)
Proportion of Adults in the household
0202 (9139) 0137 (9139) 0235 (8183) 0169 (8183)
Education Dummy Males 0000 (-023) - 0000 (-023) - 0012 (805) 0008 (805)
Education Dummy Females
-0025 (-215) -0008 (-215) -0013 (-952) -0007 (-952)
Time Dummy (2004) -0159 (-1893) -0061 (-1893) -0105 (-829) -0036 (-829)
Time Dummy (2009) -0007 (-069) - -0002 (-069) - 0006 (045) - 0002 (045) -
Caste Dummy (SC) -0011 (-586) -0002 (-586) -0017 (-498) -0002 (-498)
Caste Dummy (Others) 0010 (616) 0006 (616) -0005 (-177) -0004 (-177)
Constant 7569 (89023)
7712 (59282)
and refer to significance at the 1 5 and 10 level respectively
State Dummies are omitted and details will be furnished on request Education Dummy If highest level of education is middle or lower then dummy = 0 else=1 Omitted Time period 1993 Omitted caste ST
18
Table 2 Robust Regression Estimates Demand for Protein 1993-2009
RURAL URBAN
Dependent Variable
Log of Per capita consumption of protein
No of Obs = 193784 No of Obs = 124481
F(60193723) = 1144586 F(60124420) = 391491
Prob gt F = 0 Prob gt F = 0
Coefficient Elasticity Coefficient Elasticity
Price Cereals amp Pulses -0013 (-2392) -0169 (-2392) -0009 (-1508) -0144 (-1508)
---interaction T1 (2004) 0013 (2153) 0055 (2153) 0005 (662) 0019 (662)
---interaction T2 (2009) 0012 (2187) 0084 (2187) 0009 (1386) 0079 (1386)
Price Milk Milk Products Eggs amp Meats
-0003 (-7497) -0123 (-7497) 0000 (-373) -0011 (-373)
---interaction T1 (2004) 0002 (4993) 0032 (4993) 0000 (-196) -0002 (-196)
---interaction T2 (2009) 0003 (5815) 0050 (5815) 0000 (264) 0004 (264)
Price Oil -0010 (-3216) -0112 (-3216) -0007 (-1709) -0088 (-1709)
---interaction T1 (2004) 0005 (1623) 0022 (1623) 0003 (658) 0012 (658)
---interaction T2 (2009) 0007 (2218) 0038 (2218) 0006 (1562) 0041 (1562)
Price Sugar -0002 (-1085) -0114 (-1085) -0003 (-844) -0139 (-844)
---interaction T1 (2004) 0002 (941) 0045 (941) 0001 (337) 0022 (337)
---interaction T2 (2009) 0001 (249) 0010 (249) 0000 (082) - 0006 (082) -
Price Fruits amp Vegetables
0002 (42) 0040 (42) 0002 (244) 0036 (244)
---interaction T1 (2004) 0000 (084) - 0003 (084) - -0001 (-081) - -0004 (-081) -
---interaction T2 (2009) -0003 (-652) -0030 (-652) -0003 (-366) -0027 (-366)
Monthly per capita expenditure
0001 (39184) 0438 (39184) 0000 (21912) 0254 (21912)
---interaction T1 (2004) 0000 (-1004) -0051 (-1004) 0000 (-1527) -0008 (-1527)
---interaction T2 (2009) 0000 (-1389) -0058 (-1389) 0000 (-3705) -0017 (-3705)
Household Size -0005 (-2368) -0027 (-2368) -0018 (-5526) -0084 (-5526)
Proportion of Adults in the household
0198 (8293) 0134 (8293) 0226 (7247) 0163 (7247)
Education Dummy
Males 0001 (116) - 0001 (116) - 0012 (743) 0008 (743)
Education Dummy Females
-0025 (-2031) -0008 (-2031) -0014 (-947) -0008 (-947)
Time Dummy (2004) -0210 (-2315) -0081 (-2315) -0050 (-36) -0017 (-36)
Time Dummy (2009) -0031 (-284) -0009 (-284) -0047 (-307) -0015 (-307)
Caste Dummy (SC) -0007 (-364) -0001 (-364) -0007 (-187) -0001 (-187)
Caste Dummy (Others) 0011 (623) 0007 (623) 0005 (143) - 0004 (143) -
Constant 3952 (43144)
4101 (28987)
and refer to significance at the 1 5 and 10 level respectively
State Dummies are omitted and details will be furnished on request Education Dummy If highest level of education is middle or lower then dummy = 0 else=1 Omitted Time period 1993 Omitted caste ST
19
Table 3 Robust Regression Estimates Demand for Fats 1993- 2009
RURAL URBAN
Dependent Variable Log of Per capita
consumption of Fats
No of Obs = 193784 No of Obs = 124481
F(60193723) = 1895778 F(60124420) = 766201
Prob gt F = 0 Prob gt F = 0
Coefficient Elasticity Coefficient Elasticity
Price Cereals amp Pulses 0016 (2033) 0218 (2033) 0012 (1462) 0193 (1462)
---interaction T1 (2004) -0005 (-598) -0023 (-598) -0008 (-871) -0035 (-871)
---interaction T2 (2009) -0009 (-1067) -0062 (-1067) -0006 (-661) -0052 (-661)
Price Milk Milk Products Eggs amp Meats
-0013 (-1924) -0478 (-1924) -0009 (-7698) -0327 (-7698)
---interaction T1 (2004) 0008 (10509) 0106 (10509) 0005 (3537) 0056 (3537)
---interaction T2 (2009) 0010 (13313) 0172 (13313) 0007 (5587) 0121 (5587)
Price Oil 0002 (445) 0023 (445) 0007 (1364) 0097 (1364)
---interaction T1 (2004) -0001 (-251) -0005 (-251) -0003 (-571) -0014 (-571)
---interaction T2 (2009) -0002 (-429) -0011 (-429) -0004 (-801) -0029 (-801)
Price Sugar -0004 (-1365) -0217 (-1365) -0003 (-75) -0170 (-75)
---interaction T1 (2004) 0001 (306) 0022 (306) 0001 (123) - 0011 (123) -
---interaction T2 (2009) -0001 (-169) -0011 (-169) -0002 (-42) -0040 (-42)
Price Fruits amp Vegetables
0011 (1418) 0206 (1418) 0006 (615) 0125 (615)
---interaction T1 (2004) -0010 (-1227) -0070 (-1227) -0006 (-556) -0037 (-556)
---interaction T2 (2009) -0011 (-1392) -0097 (-1392) -0008 (-74) -0076 (-74)
Monthly per capita expenditure
0001 (44365) 0753 (44365) 0000 (28858) 0462 (28858)
---interaction T1 (2004) 0000 (-1279) -0098 (-127) 0000 (-1896) -0014 (-1896)
---interaction T2 (2009) -0001 (-2100) -0126 (-2100) 0000 (-8414) -0054 (-8414)
Household Size -0019 (-5556) -0097 (-5556) -0039 (-8497) -0179 (-8497)
Proportion of Adults in the household
0165 (4584) 0112 (4584) 0188 (4368) 0135 (4368)
Education Dummy Males
0056 (3204) 0029 (3204) 0086 (3825) 0060 (3825)
Education Dummy Females
0031 (167) 0010 (167) 0086 (4086) 0048 (4086)
Time Dummy (2004) 0299 (2175) 0115 (2175) 0161 (845) 0055 (845)
Time Dummy (2009) 0564 (3391) 0165 (3391) 0360 (1697) 0114 (1697)
Caste Dummy (SC) 0052 (174) 0009 (174) 0040 (764) 0005 (764)
Caste Dummy (Others) 0135 (5278) 0090 (5278) 0108 (2307) 0086 (2307)
Constant 3023 (21787)
3474 (17776)
and refer to significance at the 1 5 and 10 level respectively
State Dummies are omitted and details will be furnished on request Education Dummy If highest level of education is middle or lower then dummy = 0 else=1 Omitted Time period 1993 Omitted caste ST
20
Annexure 1 Distribution of Nutrient Intake (1993 ndash 2009)
The following tables show the distribution of nutrient intake (proportion of population in
each category) in rural and urban areas between 1993 and 2009 Figures in parenthesis
indicate the mean nutrient intake in each range
Table 1 Calorie Intake Distributions in Rural India 1993 2004 and 2009
Year Range of Calorie Intake Per Capita Per Day
Total lt1800 1801ndash2400 2401ndash3000 gt3000
1993 3109 (1491)
4007 (2084)
1942 (2650)
942 (3636)
100 (2156)
2004 3668
(1516)
4311
(2071)
1507
(2629)
514
(3925)
100
(2047)
2010 3528
(1531)
4591
(2071)
1492
(2622)
389
(3545)
100
(2020)
Table 2 Calorie Intake Distributions in Urban India 1993 2004 and 2009
Year
Range of Calorie Intake Per Capita Per Day
Total lt1700 1701ndash2100 2101ndash2600 gt2600
1993 2812
(1426)
2962
(1900)
2576
(2320)
1649
(3107)
100
(2074)
2004 2940
(1440)
3452
(1900)
2467
(2313)
1141
(3252)
100
(2021)
2010 3010
(1456)
3534
(1896)
2436
(2312)
1019
(3043)
100
(1982)
Table 3 Protein Intake Distributions in Rural India 1993 2004 and 2009
Year Range of Protein Intake Per Capita Per Day (Gms)
Total lt45 46ndash60 61ndash75 gt75
1993 2381
(371)
3379
(524)
2279
(668)
1961
(944)
100
(603)
2004 2881
(374)
3805
(522)
2146
(663)
1168
(939)
100
(558)
2010 2935
(380)
4081
(521)
2105
(661)
879
(892)
100
(541)
21
Table 4 Protein Intake Distributions in Urban India 1993 2004 and 2009
Year Range of Protein Intake Per Capita Per Day (Gms)
Total lt45 46ndash60 61ndash75 gt75
1993 2490
(371)
3777
(524)
2311
(665)
1423
(907)
100
(573)
2004 2940
(378)
3450
(523)
2469
(662)
1140
(949)
100
(554)
2010 2944
(383)
4366
(521)
1961
(661)
729
(876)
100
(534)
Table 5 Fat Intake Distributions in Rural India 1993 2004 and 2009
Year Range of Fat Intake Per Capita Per Day (Gms)
Total lt20 21ndash30 31ndash50 gt50
1993 3430
(140)
2508
(247)
2609
(383)
1454
(721)
100
(315)
2004 2259
(150)
2721
(249)
3358
(383)
1662
(746)
100
(354)
2010 1420
(154)
2405
(251)
4049
(388)
2125
(672)
100
(382)
Table 6 Fat Intake Distributions in Urban India 1993 2004 and 2009
Year Range of Fat Intake Per Capita Per Day (Gms)
Total lt25 26ndash40 41ndash60 gt60
1993 2504
(182)
2984
(323)
2615
(486)
1897
(802)
100
(421)
2004 1539
(194)
3102
(326)
3156
(489)
2204
(858)
100
(474)
2010 1032
(198)
2788
(330)
3661
(490)
2519
(781)
100
(489)
Source Authorsrsquo calculations based on the 50th 61
st and 66
th rounds of the NSS
22
Annexure 2 Distribution of Nutrient Intake by Food Commodities (1993 -2009)
The following tables show the distribution of nutrient (calorie protein and fat) intake from
nine food commodity groups for rural and urban areas between 1993 and 2009
Table 1 Mean Per Capita Calorie Intake by Food Commodities 1993 2004 and 2009
Year Cereals Milk
Products GheeButter
Vanaspati-Oil
Sugar Eggs MeatFish Poultry
PulsesNuts Dry Fruits
Fruits Vegetables Total
Rural India
1993-94 1530 137 111 103 2 12 151 20 89 2156
Share 710 64 51 48 01 06 70 09 41
2004-05 1383 137 145 98 3 12 156 23 90 2047
Share 676 67 71 48 01 06 76 11 44
2009-10 1296 141 169 93 3 12 84 20 83 2020
Share 642 70 84 46 01 06 42 10 41
Urban India
1993-94 1213 181 168 129 5 16 231 37 94 2074
Share 585 87 81 62 02 08 111 18 45
2004-05 1133 189 199 115 6 16 235 36 92 2021
Share 561 94 98 57 03 08 116 18 46
2009-
10 1071 199 217 110 5 14 106 33 83 1982
Share 540 100 109 55 03 07 53 17 42
Table 2 Mean Per Capita Protein Intake by Food Commodities 1993 2004 and 2009
Year Cereals Milk
Products GheeButter
Vanaspati-Oil
Sugar Eggs MeatFish Poultry
PulsesNuts Dry Fruits
Fruits Vegetables Total
Rural India
1993-94 418 53 0 0 02 2 78 02 29 603
Share 693 88 00 00 03 33 129 03 48
2004-05 379 53 0 0 03 2 73 03 28 558
Share 679 95 00 00 05 36 131 05 50
2009-10 356 55 0 0 03 2 53 02 25 541
Share 658 102 00 00 06 37 98 04 46
Urban India
1993-94 341 67 0 0 04 26 10 04 31 573
Share 595 117 00 00 07 45 175 07 54
2004-05 32 7 0 0 05 27 98 04 31 554
Share 578 126 00 00 09 49 177 07 56
2009-
10 302 74 0 0 04 26 65 04 27 534
Share 566 139 00 00 07 49 122 07 51
23
Table 3 Mean Per Capita Fat Intake by Food Commodities 1993 2004 and 2009
Year Cereals Milk
Products GheeButter
Vanaspati-Oil
Sugar Eggs MeatFish Poultry
PulsesNuts Dry Fruits
Fruits Vegetables Total
Rural India
1993-94 54 97 123 0 02 03 24 07 04 315
Share 171 308 390 00 06 10 76 22 13
2004-05 48 97 162 0 03 02 31 08 04 354
Share 136 274 458 00 08 06 88 23 11
2009-10 43 10 187 0 03 02 11 08 03 382
Share 113 262 490 00 08 05 29 21 08
Urban India
1993-94 4 132 186 0 04 04 4 11 04 421
Share 95 314 442 00 10 10 95 26 10
2004-05 37 138 221 0 05 03 56 11 04 475
Share 78 291 465 00 11 06 118 23 08
2009-
10 35 145 241 0 04 02 15 11 04 489
Share 72 297 493 00 08 04 31 22 08
Source Authorsrsquo calculations based on the 50th 61
st and 66
th rounds of the NSS
24
References
Behrman J and A Deolalikar (1989) ldquoIs Variety the Spice of life Implications for Calorie
Intakerdquo Review of Economics and Statistics vol 71
Deaton A (1995) The Analysis of Household Surveys A Microeconomic approach to
Development Policy Baltimore MD The Johns Hopkins University Press
Deaton A and J Dreze (2009) lsquoFood and Nutrition in India Facts and Interpretationsrsquo
Economic and Political Weekly XLIV(7) 42ndash65
Gaiha R R Jha and Vani S Kulkarni (2012) ldquoDemand for Nutrients in India 1993 to
2004rdquo Applied Economics available online 1 February 2012
Gopalan C B Sastri and S Balasubramanian (1971) Nutritive Value of Indian Foods
National institute of Nutrition Indian Council of Medical Research Hyderabad
Indian Council of Medical Research (ICMR 1990) Nutrient Requirements and
Recommended Dietary Allowances for Indians New Delhi ICMR
Jha R R Gaiha and A Sharma (2009) ldquo Modelling Variety in Consumption Expenditure on
Food in Indiardquo International Review of Applied Economics online publication 1
July 2009
Srinivasan TN (1992) lsquoUndernutrition Concepts Measurements and Policy Implicationsrsquo
in SR Osmani (ed) Nutrition and Poverty Clarendon Press Oxford pp 97ndash120

9
Fig 13 Kernel Density Functions for Calories Proteins and Fats consumed ndash Rural and
Urban India (1993 ndash 2009)
12 Factors Underlying Changes in Diets and Nutrition
We build on the DD analysis (2009) of food commodities that contributed to reduction in
calories protein and increase in fat consumption
10
Figure 14 shows the distribution of calorie protein and fat intake by food commodities for
rural and urban areas between 1993 and 2009 Detailed tables containing mean per capita
intake of nutrients from the various food items are given in the annexure
In rural India calorie intakes declined between 1993 and 2009 Most of it is attributable to
the decline in calories from cereals and pulses to some extent Calories from cereals reduced
from 1530 in 1993 to 1383 in 2004 and 1296 in 2009 The contribution of milkmilk
products sugar fruits and vegetables remained largely unchanged between 1993 and 2009
The contribution of vanaspati oil to the calorie intake increased substantially Calories
obtained from oil increased from 111 in 1993 to 145 in 2004 and 169 in 2009
Similar results are found for urban areas as well The reduction in the contribution of pulses
to calorie intakes was more drastic in urban areas between 2004 and 2009
71
68
64
58
56
54
6
7
7
9
9
10
5
7
8
8
10
11
5
5
5
6
6
6
1
1
1
1
1
1
7
8
4
11
12
5
1
1
1
2
2
2
4
4
4
5
5
4
0 10 20 30 40 50 60 70 80 90 100
1993-94
2004-05
2009-10
1993-94
2004-05
2009-10
Fig 14 Calorie Intake by Food Commodities 1993 2004 and 2009
Cereals Milk Vanaspati-Oil Sugar Eggs amp Meats Pulses Fruits Vegetables
RU
RA
L U
RB
AN
11
In both rural and urban areas protein intake declined between 1993 and 2009 (Figure 15)
Much of it is reflected in a reduction in protein intake from cereals and pulses In rural areas
the protein intake from these commodities decreased from 50 gms in 1993 to 45 gms in 2004
and 40 gms in 2009 The corresponding numbers for urban areas are 44 gms (1993) 42 gms
(2004) and 37 gms (2009) Intake from dairy products (milk eggs and meats) increased
moderately Proteins from other sources are a very small fraction and largely remained
unchanged between 1993 and 2009
Between 1993-2009 fat intake rose in both rural and urban areas Vanaspati-oil has the
maximum share in total fat intakes and its contribution rose over the period 1993 and 2009
In rural areas fat intake from vanaspati-oil rose from 12 gms in 1993 to 16 gms in 2004 and
19 gms in 2009 In urban areas the share of vanaspati-oil rose from 19 gms in 1993 to 22
gms in 2004 and 24 gms in 2009 The other significant contributor to fat intake are cereals
pulses and milk products (including ghee and butter) but their contribution reduced between
1993 and 2009 Declining intake of fats from these commodities were more than offset by the
increased intake of fat from vanaspati-oil
69
68
66
60
58
57
9
9
10
12
13
14
4
5
5
6
6
6
13
13
10
17
18
12
5
6
5
6
7
6
0 10 20 30 40 50 60 70 80 90 100
1993-94
2004-05
2009-10
1993-94
2004-05
2009-10
Fig 15 Protein Intake by Food Commodities 1993 2004 and 2009
Cereals Milk Eggs amp Meats Pulses Fruits amp Vegetables
RU
RA
L U
RB
AN
12
13 Demand Theory Based Explanation of Changes in Nutrient Intake
In response to the DeatonndashDreze (2009) explanation of a downward shift in the calorie Engel
curve in terms of lower lsquorequirementsrsquo due to health improvements and less strenuous
activity levels and more sedentary life-styles we have developed an alternative explanation
of changes in the consumption of calories protein and fats over the period 1993ndash2009 This
explanation is embedded in a standard demand theory framework with food prices8 and
expenditure (as a proxy for income) cast in a pivotal role Based on different experiments
robust demand functions are estimated for each of the three nutrients viz calories protein and
fats (Tables 1-3) Our results show consistently robust food price and expenditure effects
thus raising further doubts about the adequacy of the DD explanation The analysis is based
8 An important point to bear in mind is that the price effects capture both own and cross-price effects through
substitutions between food commodities Briefly as prices change demands for commodities change and
consequently calorie (and other nutrientsrsquo) intakes Underlying this is a presumption that food choices are
informed by their nutritional content As Deaton and Dreze (2009) emphasise people do not buy calories and
other nutrients but food commodities However if food choices are informed by their nutritional values it is
meaningful to talk about demands for calories and other nutrients
17
14
11
10
8
7
31
27
26
31
29
30
39
46
49
44
47
49
2
1
1
2
2
1
8
9
3
10
12
3
4
3
3
4
3
3
0 10 20 30 40 50 60 70 80 90 100
1993-94
2004-05
2009-10
1993-94
2004-05
2009-10
Fig 16 Fat Intake by Food Commodities 1993 2004 and 2009
Cereals Milk Vanaspati-Oil Eggs amp Meats Pulses Fruits amp Vegetables
RU
RA
L U
RB
AN
13
on unit record data collected for the 50th
61st and 66
th rounds of the NSS (corresponding to
the years 1993ndash94 2004ndash05 and 2009-10 respectively) We will discuss separately the
results for rural and urban samples
(a) Demand Function
A basic demand equation for nutrients (calories protein fats) in rural and urban India with
pooled data for 1993 2004 and 2009 is given below
(1)
where the dependent variable is log of nutrient consumed by ith household in time t jtP is a
vector of food prices computed from the NSS at the village level (j) and time t E it is
household per capita expenditure for ith household in time t itX is a vector of household
characteristics (eg number of adult males females household size ) and a few others
specified as dummy variables (caste) D1t is a dummy variable that takes the value 1 for 2004
and 0 otherwise (to allow for changes in factors other than food prices and expenditure over
time) D2t+k is the second time dummy that takes the value 1 for 2009 and 0 otherwise and
it is the error term This equation is estimated using robust regression Although a Chow test
for a structural shift is not feasible with robust regression we have employed two
refinements one is the use of a time dummy that could potentially capture the health
improvements and less strenuous activity patterns (associated with easier access to drinking
water better transportation facilities) and the other is interactions of food price variables
with the time dummy to allow for different price and expenditure effects over time9
An important point to bear in mind is that the price effects capture both own and cross-price
effects through substitutions between food commodities Briefly as prices change demands
for commodities change and consequently for example calorie (and other nutrientsrsquo) intakes
9 While these effects yield insights into changing consumer demands a more detailed analysis along the lines of
Behrman and Deolalikar (1989) and Jha et al (2009) would further deepen our understanding consumer
preferences and tastes for variety
14
(b) Results
We first consider the calorie demand function For both rural and urban areas each of the
price effects has a significant negative coefficient with the exception of price of fruits and
vegetables whose coefficient in not significant Moreover the price effects on the demand for
calories have in many cases weakened as captured by the coefficients of the interaction term
(ie interaction between the price and the time dummies) A case in point is price of cereals
and pulses Rising incomes have a positive impact on calorie demand and so does the
proportion of adults in the household The former effect however weakened over time As
household size increases calorie demand decreases Education of adult female has a negative
impact on calorie demand as this may be attributed to consumption of a more balanced diet
rich in protein and vitamins and reduced dependence on cereals which is a major source of
calories By contrast education of adult male is not significant in rural areas but positive in
urban areas SCs have lower demands for calories in both rural and urban areas while that of
Others is positive in rural areas and negative in urban areas relative to STs The effect of time
alone is reduced consumption of calorie between 1993 and 2004 However somewhat
surprisingly the residual time effect is not significant between 2004-09 That this undermines
the DD explanation emphasising lower calorie requirements due to improvements in the
epidemiology of the disease environment less strenuous physical activities and more
sedentary life styles cannot be ruled out
In case of protein demand in both rural and urban areas there is a positive influence of the
price of fruits and vegetables whereas the elasticity of protein demand with respect to all
other food prices is negative As in the case of calorie demand several price effects
weakened over over time as captured by the interaction term (between food prices and the
time dummies) A case in point is price of milk and milk products eggs and meats Higher
incomeexpenditure increase protein demand but less so over time Increasing household size
reduces protein demand whereas rising proportion of adults in the household increases it
The impact of education of adult female is negative and that of education of adult male is
not significant SCs have lower demand for protein while Others have higher demand relative
to STs The residual effect of time after accounting for the interaction is significant with a
negative coefficient suggesting a lower demand for protein in 2009 and 2004 as compared to
1993
15
In case of fats too in both rural and urban areas there are significant price and expenditure
effects ndash positive in the case of price of cereals oil and fruits and vegetables and negative in
case of milk products and sugar The positive price elasticity of fats with respect to edible oil
price is somewhat surprising although the price effect has weakened over time MPCE has
positive Unlike in the case of calorie and protein highest education of adult female has a
positive impact on fat demand suggesting that households with females having higher than
middle level of education tend to eat diets rich in fats shifting away from diets rich in
calories and proteins Moreover highest education of adult male also has a positive and
significant effect As in the case of calorie and protein household size has a negative impact
and proportion of adults in a household has a positive impact on demand for fats SCs and
Others have higher demands relative to STs The effect of time alone is to increase the fat
demand in 2009 and 2004 as compared to 1993
2 Concluding Observations
The main findings of our analysis are summarised below from a policy perspective
An important insight from the comparison of three rounds of the NSS over the period 1993-
2009 points to a slowing down of the reduction in the calorie intake in both rural and urban
areas in 2004-09 relative to 1993-2004 A similar slowing down occurred in protein intake
over the more recent period (2004-09) While fat intake continued to rise over this period but
at a lower rate
A demand theory based explanation of changes in demands for these nutrients reaffirmed the
important roles of food price and expenditure changes A new insight however is that in
several cases food price effects weakened over time as also expenditure effects While the
residual time effect weakened for both calories and protein over the period 1993-2004 it
slowed down over the more recent period The effect of time on fat demand was however
positive and strengthened over the more recent period Altogether thus the DD explanation of
lower calorie and protein demands over time as a result of lower requirements is further
undermined
From a policy perspective the important roles of food price stabilisation and expansion of
livelihood opportunities remain key to ameliorating nutritional deprivation despite lowering
of nutritional requirements A closer scrutiny of dietary preferences and tastes is crucial for
16
both understanding sources of nutritional deprivation and for designing effective policies for
mitigating it
17
Table 1 Robust Regression Estimates Demand for Calories 1993-2009
RURAL URBAN
Dependent Variable Log of Per capita consumption
of calories
No of Obs = 193785 No of Obs = 124481
F(60193724) = 1192631 F(60124420) = 370511
Prob gt F = 0 Prob gt F = 0
Coefficient Elasticity Coefficient Elasticity
Price Cereals amp Pulses -0012 (-2524) -0166 (-2524) -0006 (-102) -0090 (-102)
---interaction T1 (2004) 0011 (2072) 0049 (2072) 0001 (096) - 0003 (096) -
---interaction T2 (2009) 0010 (2005) 0071 (2005) 0004 (699) 0037 (699)
Price Milk Milk Products Eggs amp Meats
-0003 (-6421) -0098 (-6421) -0001 (-1253) -0035 (-1253)
---interaction T1 (2004) 0002 (4288) 0026 (4288) 0000 (329) 0003 (329)
---interaction T2 (2009) 0002 (4983) 0040 (4983) 0001 (904) 0013 (904)
Price Oil -0008 (-2667) -0086 (-2667) -0004 (-101) -0048 (-101)
---interaction T1 (2004) 0004 (1175) 0015 (1175) 0001 (189) 0003 (189)
---interaction T2 (2009) 0006 (1934) 0031 (1934) 0004 (994) 0024 (994)
Price Sugar -0002 (-127) -0124 (-127) -0004 (-1209) -0183 (-1209)
---interaction T1 (2004) 0002 (1136) 0050 (1136) 0003 (1029) 0061 (1029)
---interaction T2 (2009) 0001 (704) 0027 (704) 0002 (516) 0033 (516)
Price Fruits amp Vegetables
-0001 (-116) - -0010 (-116) - 0001 (194) 0026 (194)
---interaction T1 (2004) 0001 (275) 0010 (275) 0000 (026) - 0001 (026) -
---interaction T2 (2009) -0001 (-174) -0007 (-174) -0003 (-392) -0027 (-392)
Monthly per capita expenditure
0001 (40195) 0418 (40195) 0000 (22549) 0240 (22549)
---interaction T1 (2004) 0000 (-1160) -0054 (-1160) 0000 (-2386) -0011 (-2386)
---interaction T2 (2009) 0000 (-1712) -0063 (-1712) 0000 (-5097) -0022 (-5097)
Household Size -0006 (-3076) -0033 (-3076) -0021 (-684) -0096 (-684)
Proportion of Adults in the household
0202 (9139) 0137 (9139) 0235 (8183) 0169 (8183)
Education Dummy Males 0000 (-023) - 0000 (-023) - 0012 (805) 0008 (805)
Education Dummy Females
-0025 (-215) -0008 (-215) -0013 (-952) -0007 (-952)
Time Dummy (2004) -0159 (-1893) -0061 (-1893) -0105 (-829) -0036 (-829)
Time Dummy (2009) -0007 (-069) - -0002 (-069) - 0006 (045) - 0002 (045) -
Caste Dummy (SC) -0011 (-586) -0002 (-586) -0017 (-498) -0002 (-498)
Caste Dummy (Others) 0010 (616) 0006 (616) -0005 (-177) -0004 (-177)
Constant 7569 (89023)
7712 (59282)
and refer to significance at the 1 5 and 10 level respectively
State Dummies are omitted and details will be furnished on request Education Dummy If highest level of education is middle or lower then dummy = 0 else=1 Omitted Time period 1993 Omitted caste ST
18
Table 2 Robust Regression Estimates Demand for Protein 1993-2009
RURAL URBAN
Dependent Variable
Log of Per capita consumption of protein
No of Obs = 193784 No of Obs = 124481
F(60193723) = 1144586 F(60124420) = 391491
Prob gt F = 0 Prob gt F = 0
Coefficient Elasticity Coefficient Elasticity
Price Cereals amp Pulses -0013 (-2392) -0169 (-2392) -0009 (-1508) -0144 (-1508)
---interaction T1 (2004) 0013 (2153) 0055 (2153) 0005 (662) 0019 (662)
---interaction T2 (2009) 0012 (2187) 0084 (2187) 0009 (1386) 0079 (1386)
Price Milk Milk Products Eggs amp Meats
-0003 (-7497) -0123 (-7497) 0000 (-373) -0011 (-373)
---interaction T1 (2004) 0002 (4993) 0032 (4993) 0000 (-196) -0002 (-196)
---interaction T2 (2009) 0003 (5815) 0050 (5815) 0000 (264) 0004 (264)
Price Oil -0010 (-3216) -0112 (-3216) -0007 (-1709) -0088 (-1709)
---interaction T1 (2004) 0005 (1623) 0022 (1623) 0003 (658) 0012 (658)
---interaction T2 (2009) 0007 (2218) 0038 (2218) 0006 (1562) 0041 (1562)
Price Sugar -0002 (-1085) -0114 (-1085) -0003 (-844) -0139 (-844)
---interaction T1 (2004) 0002 (941) 0045 (941) 0001 (337) 0022 (337)
---interaction T2 (2009) 0001 (249) 0010 (249) 0000 (082) - 0006 (082) -
Price Fruits amp Vegetables
0002 (42) 0040 (42) 0002 (244) 0036 (244)
---interaction T1 (2004) 0000 (084) - 0003 (084) - -0001 (-081) - -0004 (-081) -
---interaction T2 (2009) -0003 (-652) -0030 (-652) -0003 (-366) -0027 (-366)
Monthly per capita expenditure
0001 (39184) 0438 (39184) 0000 (21912) 0254 (21912)
---interaction T1 (2004) 0000 (-1004) -0051 (-1004) 0000 (-1527) -0008 (-1527)
---interaction T2 (2009) 0000 (-1389) -0058 (-1389) 0000 (-3705) -0017 (-3705)
Household Size -0005 (-2368) -0027 (-2368) -0018 (-5526) -0084 (-5526)
Proportion of Adults in the household
0198 (8293) 0134 (8293) 0226 (7247) 0163 (7247)
Education Dummy
Males 0001 (116) - 0001 (116) - 0012 (743) 0008 (743)
Education Dummy Females
-0025 (-2031) -0008 (-2031) -0014 (-947) -0008 (-947)
Time Dummy (2004) -0210 (-2315) -0081 (-2315) -0050 (-36) -0017 (-36)
Time Dummy (2009) -0031 (-284) -0009 (-284) -0047 (-307) -0015 (-307)
Caste Dummy (SC) -0007 (-364) -0001 (-364) -0007 (-187) -0001 (-187)
Caste Dummy (Others) 0011 (623) 0007 (623) 0005 (143) - 0004 (143) -
Constant 3952 (43144)
4101 (28987)
and refer to significance at the 1 5 and 10 level respectively
State Dummies are omitted and details will be furnished on request Education Dummy If highest level of education is middle or lower then dummy = 0 else=1 Omitted Time period 1993 Omitted caste ST
19
Table 3 Robust Regression Estimates Demand for Fats 1993- 2009
RURAL URBAN
Dependent Variable Log of Per capita
consumption of Fats
No of Obs = 193784 No of Obs = 124481
F(60193723) = 1895778 F(60124420) = 766201
Prob gt F = 0 Prob gt F = 0
Coefficient Elasticity Coefficient Elasticity
Price Cereals amp Pulses 0016 (2033) 0218 (2033) 0012 (1462) 0193 (1462)
---interaction T1 (2004) -0005 (-598) -0023 (-598) -0008 (-871) -0035 (-871)
---interaction T2 (2009) -0009 (-1067) -0062 (-1067) -0006 (-661) -0052 (-661)
Price Milk Milk Products Eggs amp Meats
-0013 (-1924) -0478 (-1924) -0009 (-7698) -0327 (-7698)
---interaction T1 (2004) 0008 (10509) 0106 (10509) 0005 (3537) 0056 (3537)
---interaction T2 (2009) 0010 (13313) 0172 (13313) 0007 (5587) 0121 (5587)
Price Oil 0002 (445) 0023 (445) 0007 (1364) 0097 (1364)
---interaction T1 (2004) -0001 (-251) -0005 (-251) -0003 (-571) -0014 (-571)
---interaction T2 (2009) -0002 (-429) -0011 (-429) -0004 (-801) -0029 (-801)
Price Sugar -0004 (-1365) -0217 (-1365) -0003 (-75) -0170 (-75)
---interaction T1 (2004) 0001 (306) 0022 (306) 0001 (123) - 0011 (123) -
---interaction T2 (2009) -0001 (-169) -0011 (-169) -0002 (-42) -0040 (-42)
Price Fruits amp Vegetables
0011 (1418) 0206 (1418) 0006 (615) 0125 (615)
---interaction T1 (2004) -0010 (-1227) -0070 (-1227) -0006 (-556) -0037 (-556)
---interaction T2 (2009) -0011 (-1392) -0097 (-1392) -0008 (-74) -0076 (-74)
Monthly per capita expenditure
0001 (44365) 0753 (44365) 0000 (28858) 0462 (28858)
---interaction T1 (2004) 0000 (-1279) -0098 (-127) 0000 (-1896) -0014 (-1896)
---interaction T2 (2009) -0001 (-2100) -0126 (-2100) 0000 (-8414) -0054 (-8414)
Household Size -0019 (-5556) -0097 (-5556) -0039 (-8497) -0179 (-8497)
Proportion of Adults in the household
0165 (4584) 0112 (4584) 0188 (4368) 0135 (4368)
Education Dummy Males
0056 (3204) 0029 (3204) 0086 (3825) 0060 (3825)
Education Dummy Females
0031 (167) 0010 (167) 0086 (4086) 0048 (4086)
Time Dummy (2004) 0299 (2175) 0115 (2175) 0161 (845) 0055 (845)
Time Dummy (2009) 0564 (3391) 0165 (3391) 0360 (1697) 0114 (1697)
Caste Dummy (SC) 0052 (174) 0009 (174) 0040 (764) 0005 (764)
Caste Dummy (Others) 0135 (5278) 0090 (5278) 0108 (2307) 0086 (2307)
Constant 3023 (21787)
3474 (17776)
and refer to significance at the 1 5 and 10 level respectively
State Dummies are omitted and details will be furnished on request Education Dummy If highest level of education is middle or lower then dummy = 0 else=1 Omitted Time period 1993 Omitted caste ST
20
Annexure 1 Distribution of Nutrient Intake (1993 ndash 2009)
The following tables show the distribution of nutrient intake (proportion of population in
each category) in rural and urban areas between 1993 and 2009 Figures in parenthesis
indicate the mean nutrient intake in each range
Table 1 Calorie Intake Distributions in Rural India 1993 2004 and 2009
Year Range of Calorie Intake Per Capita Per Day
Total lt1800 1801ndash2400 2401ndash3000 gt3000
1993 3109 (1491)
4007 (2084)
1942 (2650)
942 (3636)
100 (2156)
2004 3668
(1516)
4311
(2071)
1507
(2629)
514
(3925)
100
(2047)
2010 3528
(1531)
4591
(2071)
1492
(2622)
389
(3545)
100
(2020)
Table 2 Calorie Intake Distributions in Urban India 1993 2004 and 2009
Year
Range of Calorie Intake Per Capita Per Day
Total lt1700 1701ndash2100 2101ndash2600 gt2600
1993 2812
(1426)
2962
(1900)
2576
(2320)
1649
(3107)
100
(2074)
2004 2940
(1440)
3452
(1900)
2467
(2313)
1141
(3252)
100
(2021)
2010 3010
(1456)
3534
(1896)
2436
(2312)
1019
(3043)
100
(1982)
Table 3 Protein Intake Distributions in Rural India 1993 2004 and 2009
Year Range of Protein Intake Per Capita Per Day (Gms)
Total lt45 46ndash60 61ndash75 gt75
1993 2381
(371)
3379
(524)
2279
(668)
1961
(944)
100
(603)
2004 2881
(374)
3805
(522)
2146
(663)
1168
(939)
100
(558)
2010 2935
(380)
4081
(521)
2105
(661)
879
(892)
100
(541)
21
Table 4 Protein Intake Distributions in Urban India 1993 2004 and 2009
Year Range of Protein Intake Per Capita Per Day (Gms)
Total lt45 46ndash60 61ndash75 gt75
1993 2490
(371)
3777
(524)
2311
(665)
1423
(907)
100
(573)
2004 2940
(378)
3450
(523)
2469
(662)
1140
(949)
100
(554)
2010 2944
(383)
4366
(521)
1961
(661)
729
(876)
100
(534)
Table 5 Fat Intake Distributions in Rural India 1993 2004 and 2009
Year Range of Fat Intake Per Capita Per Day (Gms)
Total lt20 21ndash30 31ndash50 gt50
1993 3430
(140)
2508
(247)
2609
(383)
1454
(721)
100
(315)
2004 2259
(150)
2721
(249)
3358
(383)
1662
(746)
100
(354)
2010 1420
(154)
2405
(251)
4049
(388)
2125
(672)
100
(382)
Table 6 Fat Intake Distributions in Urban India 1993 2004 and 2009
Year Range of Fat Intake Per Capita Per Day (Gms)
Total lt25 26ndash40 41ndash60 gt60
1993 2504
(182)
2984
(323)
2615
(486)
1897
(802)
100
(421)
2004 1539
(194)
3102
(326)
3156
(489)
2204
(858)
100
(474)
2010 1032
(198)
2788
(330)
3661
(490)
2519
(781)
100
(489)
Source Authorsrsquo calculations based on the 50th 61
st and 66
th rounds of the NSS
22
Annexure 2 Distribution of Nutrient Intake by Food Commodities (1993 -2009)
The following tables show the distribution of nutrient (calorie protein and fat) intake from
nine food commodity groups for rural and urban areas between 1993 and 2009
Table 1 Mean Per Capita Calorie Intake by Food Commodities 1993 2004 and 2009
Year Cereals Milk
Products GheeButter
Vanaspati-Oil
Sugar Eggs MeatFish Poultry
PulsesNuts Dry Fruits
Fruits Vegetables Total
Rural India
1993-94 1530 137 111 103 2 12 151 20 89 2156
Share 710 64 51 48 01 06 70 09 41
2004-05 1383 137 145 98 3 12 156 23 90 2047
Share 676 67 71 48 01 06 76 11 44
2009-10 1296 141 169 93 3 12 84 20 83 2020
Share 642 70 84 46 01 06 42 10 41
Urban India
1993-94 1213 181 168 129 5 16 231 37 94 2074
Share 585 87 81 62 02 08 111 18 45
2004-05 1133 189 199 115 6 16 235 36 92 2021
Share 561 94 98 57 03 08 116 18 46
2009-
10 1071 199 217 110 5 14 106 33 83 1982
Share 540 100 109 55 03 07 53 17 42
Table 2 Mean Per Capita Protein Intake by Food Commodities 1993 2004 and 2009
Year Cereals Milk
Products GheeButter
Vanaspati-Oil
Sugar Eggs MeatFish Poultry
PulsesNuts Dry Fruits
Fruits Vegetables Total
Rural India
1993-94 418 53 0 0 02 2 78 02 29 603
Share 693 88 00 00 03 33 129 03 48
2004-05 379 53 0 0 03 2 73 03 28 558
Share 679 95 00 00 05 36 131 05 50
2009-10 356 55 0 0 03 2 53 02 25 541
Share 658 102 00 00 06 37 98 04 46
Urban India
1993-94 341 67 0 0 04 26 10 04 31 573
Share 595 117 00 00 07 45 175 07 54
2004-05 32 7 0 0 05 27 98 04 31 554
Share 578 126 00 00 09 49 177 07 56
2009-
10 302 74 0 0 04 26 65 04 27 534
Share 566 139 00 00 07 49 122 07 51
23
Table 3 Mean Per Capita Fat Intake by Food Commodities 1993 2004 and 2009
Year Cereals Milk
Products GheeButter
Vanaspati-Oil
Sugar Eggs MeatFish Poultry
PulsesNuts Dry Fruits
Fruits Vegetables Total
Rural India
1993-94 54 97 123 0 02 03 24 07 04 315
Share 171 308 390 00 06 10 76 22 13
2004-05 48 97 162 0 03 02 31 08 04 354
Share 136 274 458 00 08 06 88 23 11
2009-10 43 10 187 0 03 02 11 08 03 382
Share 113 262 490 00 08 05 29 21 08
Urban India
1993-94 4 132 186 0 04 04 4 11 04 421
Share 95 314 442 00 10 10 95 26 10
2004-05 37 138 221 0 05 03 56 11 04 475
Share 78 291 465 00 11 06 118 23 08
2009-
10 35 145 241 0 04 02 15 11 04 489
Share 72 297 493 00 08 04 31 22 08
Source Authorsrsquo calculations based on the 50th 61
st and 66
th rounds of the NSS
24
References
Behrman J and A Deolalikar (1989) ldquoIs Variety the Spice of life Implications for Calorie
Intakerdquo Review of Economics and Statistics vol 71
Deaton A (1995) The Analysis of Household Surveys A Microeconomic approach to
Development Policy Baltimore MD The Johns Hopkins University Press
Deaton A and J Dreze (2009) lsquoFood and Nutrition in India Facts and Interpretationsrsquo
Economic and Political Weekly XLIV(7) 42ndash65
Gaiha R R Jha and Vani S Kulkarni (2012) ldquoDemand for Nutrients in India 1993 to
2004rdquo Applied Economics available online 1 February 2012
Gopalan C B Sastri and S Balasubramanian (1971) Nutritive Value of Indian Foods
National institute of Nutrition Indian Council of Medical Research Hyderabad
Indian Council of Medical Research (ICMR 1990) Nutrient Requirements and
Recommended Dietary Allowances for Indians New Delhi ICMR
Jha R R Gaiha and A Sharma (2009) ldquo Modelling Variety in Consumption Expenditure on
Food in Indiardquo International Review of Applied Economics online publication 1
July 2009
Srinivasan TN (1992) lsquoUndernutrition Concepts Measurements and Policy Implicationsrsquo
in SR Osmani (ed) Nutrition and Poverty Clarendon Press Oxford pp 97ndash120
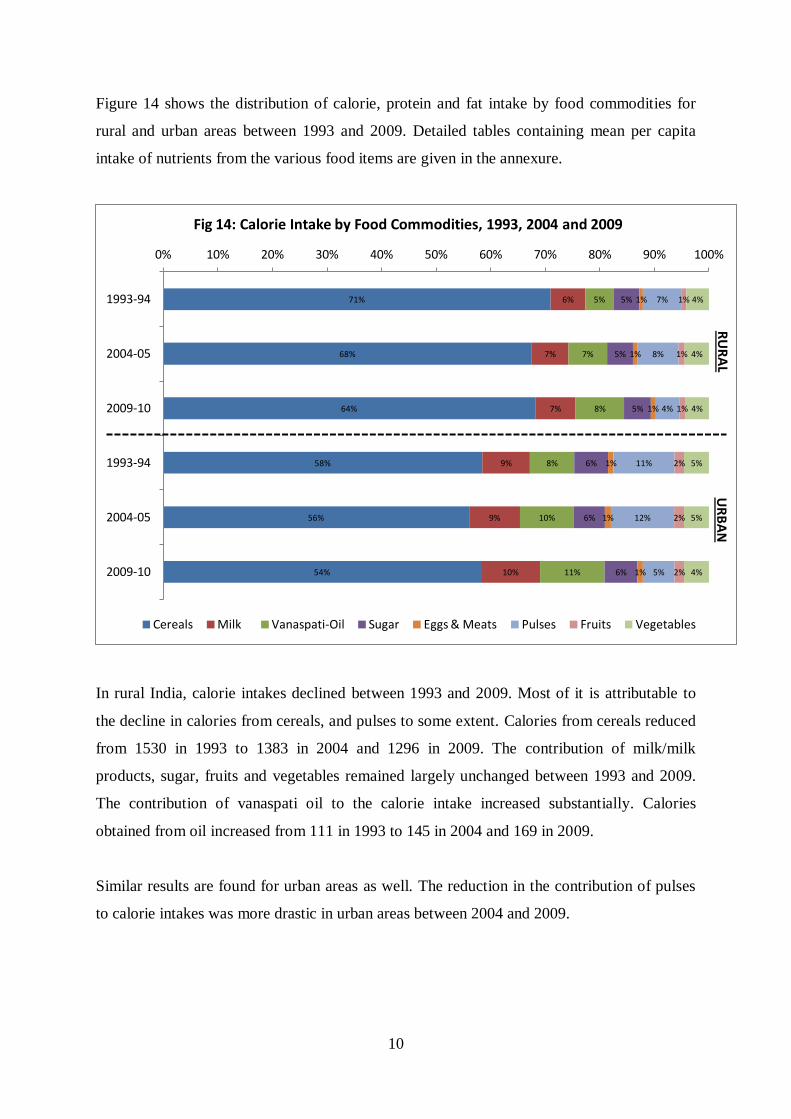
10
Figure 14 shows the distribution of calorie protein and fat intake by food commodities for
rural and urban areas between 1993 and 2009 Detailed tables containing mean per capita
intake of nutrients from the various food items are given in the annexure
In rural India calorie intakes declined between 1993 and 2009 Most of it is attributable to
the decline in calories from cereals and pulses to some extent Calories from cereals reduced
from 1530 in 1993 to 1383 in 2004 and 1296 in 2009 The contribution of milkmilk
products sugar fruits and vegetables remained largely unchanged between 1993 and 2009
The contribution of vanaspati oil to the calorie intake increased substantially Calories
obtained from oil increased from 111 in 1993 to 145 in 2004 and 169 in 2009
Similar results are found for urban areas as well The reduction in the contribution of pulses
to calorie intakes was more drastic in urban areas between 2004 and 2009
71
68
64
58
56
54
6
7
7
9
9
10
5
7
8
8
10
11
5
5
5
6
6
6
1
1
1
1
1
1
7
8
4
11
12
5
1
1
1
2
2
2
4
4
4
5
5
4
0 10 20 30 40 50 60 70 80 90 100
1993-94
2004-05
2009-10
1993-94
2004-05
2009-10
Fig 14 Calorie Intake by Food Commodities 1993 2004 and 2009
Cereals Milk Vanaspati-Oil Sugar Eggs amp Meats Pulses Fruits Vegetables
RU
RA
L U
RB
AN
11
In both rural and urban areas protein intake declined between 1993 and 2009 (Figure 15)
Much of it is reflected in a reduction in protein intake from cereals and pulses In rural areas
the protein intake from these commodities decreased from 50 gms in 1993 to 45 gms in 2004
and 40 gms in 2009 The corresponding numbers for urban areas are 44 gms (1993) 42 gms
(2004) and 37 gms (2009) Intake from dairy products (milk eggs and meats) increased
moderately Proteins from other sources are a very small fraction and largely remained
unchanged between 1993 and 2009
Between 1993-2009 fat intake rose in both rural and urban areas Vanaspati-oil has the
maximum share in total fat intakes and its contribution rose over the period 1993 and 2009
In rural areas fat intake from vanaspati-oil rose from 12 gms in 1993 to 16 gms in 2004 and
19 gms in 2009 In urban areas the share of vanaspati-oil rose from 19 gms in 1993 to 22
gms in 2004 and 24 gms in 2009 The other significant contributor to fat intake are cereals
pulses and milk products (including ghee and butter) but their contribution reduced between
1993 and 2009 Declining intake of fats from these commodities were more than offset by the
increased intake of fat from vanaspati-oil
69
68
66
60
58
57
9
9
10
12
13
14
4
5
5
6
6
6
13
13
10
17
18
12
5
6
5
6
7
6
0 10 20 30 40 50 60 70 80 90 100
1993-94
2004-05
2009-10
1993-94
2004-05
2009-10
Fig 15 Protein Intake by Food Commodities 1993 2004 and 2009
Cereals Milk Eggs amp Meats Pulses Fruits amp Vegetables
RU
RA
L U
RB
AN
12
13 Demand Theory Based Explanation of Changes in Nutrient Intake
In response to the DeatonndashDreze (2009) explanation of a downward shift in the calorie Engel
curve in terms of lower lsquorequirementsrsquo due to health improvements and less strenuous
activity levels and more sedentary life-styles we have developed an alternative explanation
of changes in the consumption of calories protein and fats over the period 1993ndash2009 This
explanation is embedded in a standard demand theory framework with food prices8 and
expenditure (as a proxy for income) cast in a pivotal role Based on different experiments
robust demand functions are estimated for each of the three nutrients viz calories protein and
fats (Tables 1-3) Our results show consistently robust food price and expenditure effects
thus raising further doubts about the adequacy of the DD explanation The analysis is based
8 An important point to bear in mind is that the price effects capture both own and cross-price effects through
substitutions between food commodities Briefly as prices change demands for commodities change and
consequently calorie (and other nutrientsrsquo) intakes Underlying this is a presumption that food choices are
informed by their nutritional content As Deaton and Dreze (2009) emphasise people do not buy calories and
other nutrients but food commodities However if food choices are informed by their nutritional values it is
meaningful to talk about demands for calories and other nutrients
17
14
11
10
8
7
31
27
26
31
29
30
39
46
49
44
47
49
2
1
1
2
2
1
8
9
3
10
12
3
4
3
3
4
3
3
0 10 20 30 40 50 60 70 80 90 100
1993-94
2004-05
2009-10
1993-94
2004-05
2009-10
Fig 16 Fat Intake by Food Commodities 1993 2004 and 2009
Cereals Milk Vanaspati-Oil Eggs amp Meats Pulses Fruits amp Vegetables
RU
RA
L U
RB
AN
13
on unit record data collected for the 50th
61st and 66
th rounds of the NSS (corresponding to
the years 1993ndash94 2004ndash05 and 2009-10 respectively) We will discuss separately the
results for rural and urban samples
(a) Demand Function
A basic demand equation for nutrients (calories protein fats) in rural and urban India with
pooled data for 1993 2004 and 2009 is given below
(1)
where the dependent variable is log of nutrient consumed by ith household in time t jtP is a
vector of food prices computed from the NSS at the village level (j) and time t E it is
household per capita expenditure for ith household in time t itX is a vector of household
characteristics (eg number of adult males females household size ) and a few others
specified as dummy variables (caste) D1t is a dummy variable that takes the value 1 for 2004
and 0 otherwise (to allow for changes in factors other than food prices and expenditure over
time) D2t+k is the second time dummy that takes the value 1 for 2009 and 0 otherwise and
it is the error term This equation is estimated using robust regression Although a Chow test
for a structural shift is not feasible with robust regression we have employed two
refinements one is the use of a time dummy that could potentially capture the health
improvements and less strenuous activity patterns (associated with easier access to drinking
water better transportation facilities) and the other is interactions of food price variables
with the time dummy to allow for different price and expenditure effects over time9
An important point to bear in mind is that the price effects capture both own and cross-price
effects through substitutions between food commodities Briefly as prices change demands
for commodities change and consequently for example calorie (and other nutrientsrsquo) intakes
9 While these effects yield insights into changing consumer demands a more detailed analysis along the lines of
Behrman and Deolalikar (1989) and Jha et al (2009) would further deepen our understanding consumer
preferences and tastes for variety
14
(b) Results
We first consider the calorie demand function For both rural and urban areas each of the
price effects has a significant negative coefficient with the exception of price of fruits and
vegetables whose coefficient in not significant Moreover the price effects on the demand for
calories have in many cases weakened as captured by the coefficients of the interaction term
(ie interaction between the price and the time dummies) A case in point is price of cereals
and pulses Rising incomes have a positive impact on calorie demand and so does the
proportion of adults in the household The former effect however weakened over time As
household size increases calorie demand decreases Education of adult female has a negative
impact on calorie demand as this may be attributed to consumption of a more balanced diet
rich in protein and vitamins and reduced dependence on cereals which is a major source of
calories By contrast education of adult male is not significant in rural areas but positive in
urban areas SCs have lower demands for calories in both rural and urban areas while that of
Others is positive in rural areas and negative in urban areas relative to STs The effect of time
alone is reduced consumption of calorie between 1993 and 2004 However somewhat
surprisingly the residual time effect is not significant between 2004-09 That this undermines
the DD explanation emphasising lower calorie requirements due to improvements in the
epidemiology of the disease environment less strenuous physical activities and more
sedentary life styles cannot be ruled out
In case of protein demand in both rural and urban areas there is a positive influence of the
price of fruits and vegetables whereas the elasticity of protein demand with respect to all
other food prices is negative As in the case of calorie demand several price effects
weakened over over time as captured by the interaction term (between food prices and the
time dummies) A case in point is price of milk and milk products eggs and meats Higher
incomeexpenditure increase protein demand but less so over time Increasing household size
reduces protein demand whereas rising proportion of adults in the household increases it
The impact of education of adult female is negative and that of education of adult male is
not significant SCs have lower demand for protein while Others have higher demand relative
to STs The residual effect of time after accounting for the interaction is significant with a
negative coefficient suggesting a lower demand for protein in 2009 and 2004 as compared to
1993
15
In case of fats too in both rural and urban areas there are significant price and expenditure
effects ndash positive in the case of price of cereals oil and fruits and vegetables and negative in
case of milk products and sugar The positive price elasticity of fats with respect to edible oil
price is somewhat surprising although the price effect has weakened over time MPCE has
positive Unlike in the case of calorie and protein highest education of adult female has a
positive impact on fat demand suggesting that households with females having higher than
middle level of education tend to eat diets rich in fats shifting away from diets rich in
calories and proteins Moreover highest education of adult male also has a positive and
significant effect As in the case of calorie and protein household size has a negative impact
and proportion of adults in a household has a positive impact on demand for fats SCs and
Others have higher demands relative to STs The effect of time alone is to increase the fat
demand in 2009 and 2004 as compared to 1993
2 Concluding Observations
The main findings of our analysis are summarised below from a policy perspective
An important insight from the comparison of three rounds of the NSS over the period 1993-
2009 points to a slowing down of the reduction in the calorie intake in both rural and urban
areas in 2004-09 relative to 1993-2004 A similar slowing down occurred in protein intake
over the more recent period (2004-09) While fat intake continued to rise over this period but
at a lower rate
A demand theory based explanation of changes in demands for these nutrients reaffirmed the
important roles of food price and expenditure changes A new insight however is that in
several cases food price effects weakened over time as also expenditure effects While the
residual time effect weakened for both calories and protein over the period 1993-2004 it
slowed down over the more recent period The effect of time on fat demand was however
positive and strengthened over the more recent period Altogether thus the DD explanation of
lower calorie and protein demands over time as a result of lower requirements is further
undermined
From a policy perspective the important roles of food price stabilisation and expansion of
livelihood opportunities remain key to ameliorating nutritional deprivation despite lowering
of nutritional requirements A closer scrutiny of dietary preferences and tastes is crucial for
16
both understanding sources of nutritional deprivation and for designing effective policies for
mitigating it
17
Table 1 Robust Regression Estimates Demand for Calories 1993-2009
RURAL URBAN
Dependent Variable Log of Per capita consumption
of calories
No of Obs = 193785 No of Obs = 124481
F(60193724) = 1192631 F(60124420) = 370511
Prob gt F = 0 Prob gt F = 0
Coefficient Elasticity Coefficient Elasticity
Price Cereals amp Pulses -0012 (-2524) -0166 (-2524) -0006 (-102) -0090 (-102)
---interaction T1 (2004) 0011 (2072) 0049 (2072) 0001 (096) - 0003 (096) -
---interaction T2 (2009) 0010 (2005) 0071 (2005) 0004 (699) 0037 (699)
Price Milk Milk Products Eggs amp Meats
-0003 (-6421) -0098 (-6421) -0001 (-1253) -0035 (-1253)
---interaction T1 (2004) 0002 (4288) 0026 (4288) 0000 (329) 0003 (329)
---interaction T2 (2009) 0002 (4983) 0040 (4983) 0001 (904) 0013 (904)
Price Oil -0008 (-2667) -0086 (-2667) -0004 (-101) -0048 (-101)
---interaction T1 (2004) 0004 (1175) 0015 (1175) 0001 (189) 0003 (189)
---interaction T2 (2009) 0006 (1934) 0031 (1934) 0004 (994) 0024 (994)
Price Sugar -0002 (-127) -0124 (-127) -0004 (-1209) -0183 (-1209)
---interaction T1 (2004) 0002 (1136) 0050 (1136) 0003 (1029) 0061 (1029)
---interaction T2 (2009) 0001 (704) 0027 (704) 0002 (516) 0033 (516)
Price Fruits amp Vegetables
-0001 (-116) - -0010 (-116) - 0001 (194) 0026 (194)
---interaction T1 (2004) 0001 (275) 0010 (275) 0000 (026) - 0001 (026) -
---interaction T2 (2009) -0001 (-174) -0007 (-174) -0003 (-392) -0027 (-392)
Monthly per capita expenditure
0001 (40195) 0418 (40195) 0000 (22549) 0240 (22549)
---interaction T1 (2004) 0000 (-1160) -0054 (-1160) 0000 (-2386) -0011 (-2386)
---interaction T2 (2009) 0000 (-1712) -0063 (-1712) 0000 (-5097) -0022 (-5097)
Household Size -0006 (-3076) -0033 (-3076) -0021 (-684) -0096 (-684)
Proportion of Adults in the household
0202 (9139) 0137 (9139) 0235 (8183) 0169 (8183)
Education Dummy Males 0000 (-023) - 0000 (-023) - 0012 (805) 0008 (805)
Education Dummy Females
-0025 (-215) -0008 (-215) -0013 (-952) -0007 (-952)
Time Dummy (2004) -0159 (-1893) -0061 (-1893) -0105 (-829) -0036 (-829)
Time Dummy (2009) -0007 (-069) - -0002 (-069) - 0006 (045) - 0002 (045) -
Caste Dummy (SC) -0011 (-586) -0002 (-586) -0017 (-498) -0002 (-498)
Caste Dummy (Others) 0010 (616) 0006 (616) -0005 (-177) -0004 (-177)
Constant 7569 (89023)
7712 (59282)
and refer to significance at the 1 5 and 10 level respectively
State Dummies are omitted and details will be furnished on request Education Dummy If highest level of education is middle or lower then dummy = 0 else=1 Omitted Time period 1993 Omitted caste ST
18
Table 2 Robust Regression Estimates Demand for Protein 1993-2009
RURAL URBAN
Dependent Variable
Log of Per capita consumption of protein
No of Obs = 193784 No of Obs = 124481
F(60193723) = 1144586 F(60124420) = 391491
Prob gt F = 0 Prob gt F = 0
Coefficient Elasticity Coefficient Elasticity
Price Cereals amp Pulses -0013 (-2392) -0169 (-2392) -0009 (-1508) -0144 (-1508)
---interaction T1 (2004) 0013 (2153) 0055 (2153) 0005 (662) 0019 (662)
---interaction T2 (2009) 0012 (2187) 0084 (2187) 0009 (1386) 0079 (1386)
Price Milk Milk Products Eggs amp Meats
-0003 (-7497) -0123 (-7497) 0000 (-373) -0011 (-373)
---interaction T1 (2004) 0002 (4993) 0032 (4993) 0000 (-196) -0002 (-196)
---interaction T2 (2009) 0003 (5815) 0050 (5815) 0000 (264) 0004 (264)
Price Oil -0010 (-3216) -0112 (-3216) -0007 (-1709) -0088 (-1709)
---interaction T1 (2004) 0005 (1623) 0022 (1623) 0003 (658) 0012 (658)
---interaction T2 (2009) 0007 (2218) 0038 (2218) 0006 (1562) 0041 (1562)
Price Sugar -0002 (-1085) -0114 (-1085) -0003 (-844) -0139 (-844)
---interaction T1 (2004) 0002 (941) 0045 (941) 0001 (337) 0022 (337)
---interaction T2 (2009) 0001 (249) 0010 (249) 0000 (082) - 0006 (082) -
Price Fruits amp Vegetables
0002 (42) 0040 (42) 0002 (244) 0036 (244)
---interaction T1 (2004) 0000 (084) - 0003 (084) - -0001 (-081) - -0004 (-081) -
---interaction T2 (2009) -0003 (-652) -0030 (-652) -0003 (-366) -0027 (-366)
Monthly per capita expenditure
0001 (39184) 0438 (39184) 0000 (21912) 0254 (21912)
---interaction T1 (2004) 0000 (-1004) -0051 (-1004) 0000 (-1527) -0008 (-1527)
---interaction T2 (2009) 0000 (-1389) -0058 (-1389) 0000 (-3705) -0017 (-3705)
Household Size -0005 (-2368) -0027 (-2368) -0018 (-5526) -0084 (-5526)
Proportion of Adults in the household
0198 (8293) 0134 (8293) 0226 (7247) 0163 (7247)
Education Dummy
Males 0001 (116) - 0001 (116) - 0012 (743) 0008 (743)
Education Dummy Females
-0025 (-2031) -0008 (-2031) -0014 (-947) -0008 (-947)
Time Dummy (2004) -0210 (-2315) -0081 (-2315) -0050 (-36) -0017 (-36)
Time Dummy (2009) -0031 (-284) -0009 (-284) -0047 (-307) -0015 (-307)
Caste Dummy (SC) -0007 (-364) -0001 (-364) -0007 (-187) -0001 (-187)
Caste Dummy (Others) 0011 (623) 0007 (623) 0005 (143) - 0004 (143) -
Constant 3952 (43144)
4101 (28987)
and refer to significance at the 1 5 and 10 level respectively
State Dummies are omitted and details will be furnished on request Education Dummy If highest level of education is middle or lower then dummy = 0 else=1 Omitted Time period 1993 Omitted caste ST
19
Table 3 Robust Regression Estimates Demand for Fats 1993- 2009
RURAL URBAN
Dependent Variable Log of Per capita
consumption of Fats
No of Obs = 193784 No of Obs = 124481
F(60193723) = 1895778 F(60124420) = 766201
Prob gt F = 0 Prob gt F = 0
Coefficient Elasticity Coefficient Elasticity
Price Cereals amp Pulses 0016 (2033) 0218 (2033) 0012 (1462) 0193 (1462)
---interaction T1 (2004) -0005 (-598) -0023 (-598) -0008 (-871) -0035 (-871)
---interaction T2 (2009) -0009 (-1067) -0062 (-1067) -0006 (-661) -0052 (-661)
Price Milk Milk Products Eggs amp Meats
-0013 (-1924) -0478 (-1924) -0009 (-7698) -0327 (-7698)
---interaction T1 (2004) 0008 (10509) 0106 (10509) 0005 (3537) 0056 (3537)
---interaction T2 (2009) 0010 (13313) 0172 (13313) 0007 (5587) 0121 (5587)
Price Oil 0002 (445) 0023 (445) 0007 (1364) 0097 (1364)
---interaction T1 (2004) -0001 (-251) -0005 (-251) -0003 (-571) -0014 (-571)
---interaction T2 (2009) -0002 (-429) -0011 (-429) -0004 (-801) -0029 (-801)
Price Sugar -0004 (-1365) -0217 (-1365) -0003 (-75) -0170 (-75)
---interaction T1 (2004) 0001 (306) 0022 (306) 0001 (123) - 0011 (123) -
---interaction T2 (2009) -0001 (-169) -0011 (-169) -0002 (-42) -0040 (-42)
Price Fruits amp Vegetables
0011 (1418) 0206 (1418) 0006 (615) 0125 (615)
---interaction T1 (2004) -0010 (-1227) -0070 (-1227) -0006 (-556) -0037 (-556)
---interaction T2 (2009) -0011 (-1392) -0097 (-1392) -0008 (-74) -0076 (-74)
Monthly per capita expenditure
0001 (44365) 0753 (44365) 0000 (28858) 0462 (28858)
---interaction T1 (2004) 0000 (-1279) -0098 (-127) 0000 (-1896) -0014 (-1896)
---interaction T2 (2009) -0001 (-2100) -0126 (-2100) 0000 (-8414) -0054 (-8414)
Household Size -0019 (-5556) -0097 (-5556) -0039 (-8497) -0179 (-8497)
Proportion of Adults in the household
0165 (4584) 0112 (4584) 0188 (4368) 0135 (4368)
Education Dummy Males
0056 (3204) 0029 (3204) 0086 (3825) 0060 (3825)
Education Dummy Females
0031 (167) 0010 (167) 0086 (4086) 0048 (4086)
Time Dummy (2004) 0299 (2175) 0115 (2175) 0161 (845) 0055 (845)
Time Dummy (2009) 0564 (3391) 0165 (3391) 0360 (1697) 0114 (1697)
Caste Dummy (SC) 0052 (174) 0009 (174) 0040 (764) 0005 (764)
Caste Dummy (Others) 0135 (5278) 0090 (5278) 0108 (2307) 0086 (2307)
Constant 3023 (21787)
3474 (17776)
and refer to significance at the 1 5 and 10 level respectively
State Dummies are omitted and details will be furnished on request Education Dummy If highest level of education is middle or lower then dummy = 0 else=1 Omitted Time period 1993 Omitted caste ST
20
Annexure 1 Distribution of Nutrient Intake (1993 ndash 2009)
The following tables show the distribution of nutrient intake (proportion of population in
each category) in rural and urban areas between 1993 and 2009 Figures in parenthesis
indicate the mean nutrient intake in each range
Table 1 Calorie Intake Distributions in Rural India 1993 2004 and 2009
Year Range of Calorie Intake Per Capita Per Day
Total lt1800 1801ndash2400 2401ndash3000 gt3000
1993 3109 (1491)
4007 (2084)
1942 (2650)
942 (3636)
100 (2156)
2004 3668
(1516)
4311
(2071)
1507
(2629)
514
(3925)
100
(2047)
2010 3528
(1531)
4591
(2071)
1492
(2622)
389
(3545)
100
(2020)
Table 2 Calorie Intake Distributions in Urban India 1993 2004 and 2009
Year
Range of Calorie Intake Per Capita Per Day
Total lt1700 1701ndash2100 2101ndash2600 gt2600
1993 2812
(1426)
2962
(1900)
2576
(2320)
1649
(3107)
100
(2074)
2004 2940
(1440)
3452
(1900)
2467
(2313)
1141
(3252)
100
(2021)
2010 3010
(1456)
3534
(1896)
2436
(2312)
1019
(3043)
100
(1982)
Table 3 Protein Intake Distributions in Rural India 1993 2004 and 2009
Year Range of Protein Intake Per Capita Per Day (Gms)
Total lt45 46ndash60 61ndash75 gt75
1993 2381
(371)
3379
(524)
2279
(668)
1961
(944)
100
(603)
2004 2881
(374)
3805
(522)
2146
(663)
1168
(939)
100
(558)
2010 2935
(380)
4081
(521)
2105
(661)
879
(892)
100
(541)
21
Table 4 Protein Intake Distributions in Urban India 1993 2004 and 2009
Year Range of Protein Intake Per Capita Per Day (Gms)
Total lt45 46ndash60 61ndash75 gt75
1993 2490
(371)
3777
(524)
2311
(665)
1423
(907)
100
(573)
2004 2940
(378)
3450
(523)
2469
(662)
1140
(949)
100
(554)
2010 2944
(383)
4366
(521)
1961
(661)
729
(876)
100
(534)
Table 5 Fat Intake Distributions in Rural India 1993 2004 and 2009
Year Range of Fat Intake Per Capita Per Day (Gms)
Total lt20 21ndash30 31ndash50 gt50
1993 3430
(140)
2508
(247)
2609
(383)
1454
(721)
100
(315)
2004 2259
(150)
2721
(249)
3358
(383)
1662
(746)
100
(354)
2010 1420
(154)
2405
(251)
4049
(388)
2125
(672)
100
(382)
Table 6 Fat Intake Distributions in Urban India 1993 2004 and 2009
Year Range of Fat Intake Per Capita Per Day (Gms)
Total lt25 26ndash40 41ndash60 gt60
1993 2504
(182)
2984
(323)
2615
(486)
1897
(802)
100
(421)
2004 1539
(194)
3102
(326)
3156
(489)
2204
(858)
100
(474)
2010 1032
(198)
2788
(330)
3661
(490)
2519
(781)
100
(489)
Source Authorsrsquo calculations based on the 50th 61
st and 66
th rounds of the NSS
22
Annexure 2 Distribution of Nutrient Intake by Food Commodities (1993 -2009)
The following tables show the distribution of nutrient (calorie protein and fat) intake from
nine food commodity groups for rural and urban areas between 1993 and 2009
Table 1 Mean Per Capita Calorie Intake by Food Commodities 1993 2004 and 2009
Year Cereals Milk
Products GheeButter
Vanaspati-Oil
Sugar Eggs MeatFish Poultry
PulsesNuts Dry Fruits
Fruits Vegetables Total
Rural India
1993-94 1530 137 111 103 2 12 151 20 89 2156
Share 710 64 51 48 01 06 70 09 41
2004-05 1383 137 145 98 3 12 156 23 90 2047
Share 676 67 71 48 01 06 76 11 44
2009-10 1296 141 169 93 3 12 84 20 83 2020
Share 642 70 84 46 01 06 42 10 41
Urban India
1993-94 1213 181 168 129 5 16 231 37 94 2074
Share 585 87 81 62 02 08 111 18 45
2004-05 1133 189 199 115 6 16 235 36 92 2021
Share 561 94 98 57 03 08 116 18 46
2009-
10 1071 199 217 110 5 14 106 33 83 1982
Share 540 100 109 55 03 07 53 17 42
Table 2 Mean Per Capita Protein Intake by Food Commodities 1993 2004 and 2009
Year Cereals Milk
Products GheeButter
Vanaspati-Oil
Sugar Eggs MeatFish Poultry
PulsesNuts Dry Fruits
Fruits Vegetables Total
Rural India
1993-94 418 53 0 0 02 2 78 02 29 603
Share 693 88 00 00 03 33 129 03 48
2004-05 379 53 0 0 03 2 73 03 28 558
Share 679 95 00 00 05 36 131 05 50
2009-10 356 55 0 0 03 2 53 02 25 541
Share 658 102 00 00 06 37 98 04 46
Urban India
1993-94 341 67 0 0 04 26 10 04 31 573
Share 595 117 00 00 07 45 175 07 54
2004-05 32 7 0 0 05 27 98 04 31 554
Share 578 126 00 00 09 49 177 07 56
2009-
10 302 74 0 0 04 26 65 04 27 534
Share 566 139 00 00 07 49 122 07 51
23
Table 3 Mean Per Capita Fat Intake by Food Commodities 1993 2004 and 2009
Year Cereals Milk
Products GheeButter
Vanaspati-Oil
Sugar Eggs MeatFish Poultry
PulsesNuts Dry Fruits
Fruits Vegetables Total
Rural India
1993-94 54 97 123 0 02 03 24 07 04 315
Share 171 308 390 00 06 10 76 22 13
2004-05 48 97 162 0 03 02 31 08 04 354
Share 136 274 458 00 08 06 88 23 11
2009-10 43 10 187 0 03 02 11 08 03 382
Share 113 262 490 00 08 05 29 21 08
Urban India
1993-94 4 132 186 0 04 04 4 11 04 421
Share 95 314 442 00 10 10 95 26 10
2004-05 37 138 221 0 05 03 56 11 04 475
Share 78 291 465 00 11 06 118 23 08
2009-
10 35 145 241 0 04 02 15 11 04 489
Share 72 297 493 00 08 04 31 22 08
Source Authorsrsquo calculations based on the 50th 61
st and 66
th rounds of the NSS
24
References
Behrman J and A Deolalikar (1989) ldquoIs Variety the Spice of life Implications for Calorie
Intakerdquo Review of Economics and Statistics vol 71
Deaton A (1995) The Analysis of Household Surveys A Microeconomic approach to
Development Policy Baltimore MD The Johns Hopkins University Press
Deaton A and J Dreze (2009) lsquoFood and Nutrition in India Facts and Interpretationsrsquo
Economic and Political Weekly XLIV(7) 42ndash65
Gaiha R R Jha and Vani S Kulkarni (2012) ldquoDemand for Nutrients in India 1993 to
2004rdquo Applied Economics available online 1 February 2012
Gopalan C B Sastri and S Balasubramanian (1971) Nutritive Value of Indian Foods
National institute of Nutrition Indian Council of Medical Research Hyderabad
Indian Council of Medical Research (ICMR 1990) Nutrient Requirements and
Recommended Dietary Allowances for Indians New Delhi ICMR
Jha R R Gaiha and A Sharma (2009) ldquo Modelling Variety in Consumption Expenditure on
Food in Indiardquo International Review of Applied Economics online publication 1
July 2009
Srinivasan TN (1992) lsquoUndernutrition Concepts Measurements and Policy Implicationsrsquo
in SR Osmani (ed) Nutrition and Poverty Clarendon Press Oxford pp 97ndash120
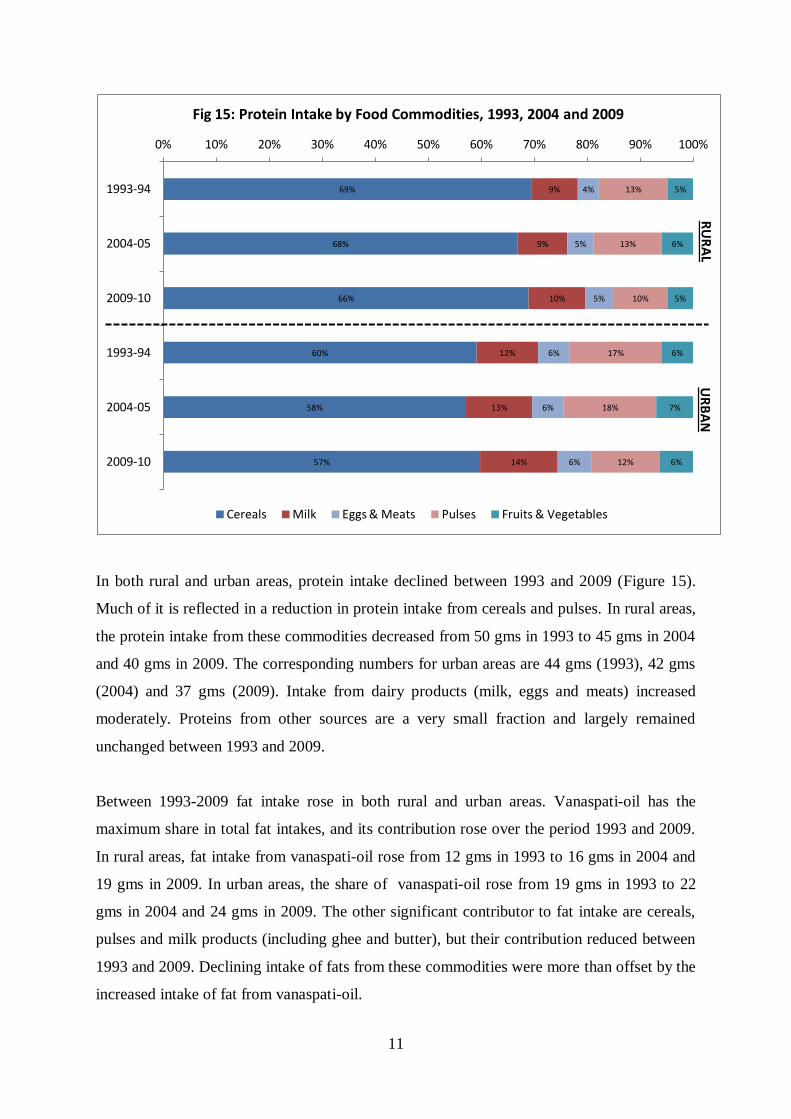
11
In both rural and urban areas protein intake declined between 1993 and 2009 (Figure 15)
Much of it is reflected in a reduction in protein intake from cereals and pulses In rural areas
the protein intake from these commodities decreased from 50 gms in 1993 to 45 gms in 2004
and 40 gms in 2009 The corresponding numbers for urban areas are 44 gms (1993) 42 gms
(2004) and 37 gms (2009) Intake from dairy products (milk eggs and meats) increased
moderately Proteins from other sources are a very small fraction and largely remained
unchanged between 1993 and 2009
Between 1993-2009 fat intake rose in both rural and urban areas Vanaspati-oil has the
maximum share in total fat intakes and its contribution rose over the period 1993 and 2009
In rural areas fat intake from vanaspati-oil rose from 12 gms in 1993 to 16 gms in 2004 and
19 gms in 2009 In urban areas the share of vanaspati-oil rose from 19 gms in 1993 to 22
gms in 2004 and 24 gms in 2009 The other significant contributor to fat intake are cereals
pulses and milk products (including ghee and butter) but their contribution reduced between
1993 and 2009 Declining intake of fats from these commodities were more than offset by the
increased intake of fat from vanaspati-oil
69
68
66
60
58
57
9
9
10
12
13
14
4
5
5
6
6
6
13
13
10
17
18
12
5
6
5
6
7
6
0 10 20 30 40 50 60 70 80 90 100
1993-94
2004-05
2009-10
1993-94
2004-05
2009-10
Fig 15 Protein Intake by Food Commodities 1993 2004 and 2009
Cereals Milk Eggs amp Meats Pulses Fruits amp Vegetables
RU
RA
L U
RB
AN
12
13 Demand Theory Based Explanation of Changes in Nutrient Intake
In response to the DeatonndashDreze (2009) explanation of a downward shift in the calorie Engel
curve in terms of lower lsquorequirementsrsquo due to health improvements and less strenuous
activity levels and more sedentary life-styles we have developed an alternative explanation
of changes in the consumption of calories protein and fats over the period 1993ndash2009 This
explanation is embedded in a standard demand theory framework with food prices8 and
expenditure (as a proxy for income) cast in a pivotal role Based on different experiments
robust demand functions are estimated for each of the three nutrients viz calories protein and
fats (Tables 1-3) Our results show consistently robust food price and expenditure effects
thus raising further doubts about the adequacy of the DD explanation The analysis is based
8 An important point to bear in mind is that the price effects capture both own and cross-price effects through
substitutions between food commodities Briefly as prices change demands for commodities change and
consequently calorie (and other nutrientsrsquo) intakes Underlying this is a presumption that food choices are
informed by their nutritional content As Deaton and Dreze (2009) emphasise people do not buy calories and
other nutrients but food commodities However if food choices are informed by their nutritional values it is
meaningful to talk about demands for calories and other nutrients
17
14
11
10
8
7
31
27
26
31
29
30
39
46
49
44
47
49
2
1
1
2
2
1
8
9
3
10
12
3
4
3
3
4
3
3
0 10 20 30 40 50 60 70 80 90 100
1993-94
2004-05
2009-10
1993-94
2004-05
2009-10
Fig 16 Fat Intake by Food Commodities 1993 2004 and 2009
Cereals Milk Vanaspati-Oil Eggs amp Meats Pulses Fruits amp Vegetables
RU
RA
L U
RB
AN
13
on unit record data collected for the 50th
61st and 66
th rounds of the NSS (corresponding to
the years 1993ndash94 2004ndash05 and 2009-10 respectively) We will discuss separately the
results for rural and urban samples
(a) Demand Function
A basic demand equation for nutrients (calories protein fats) in rural and urban India with
pooled data for 1993 2004 and 2009 is given below
(1)
where the dependent variable is log of nutrient consumed by ith household in time t jtP is a
vector of food prices computed from the NSS at the village level (j) and time t E it is
household per capita expenditure for ith household in time t itX is a vector of household
characteristics (eg number of adult males females household size ) and a few others
specified as dummy variables (caste) D1t is a dummy variable that takes the value 1 for 2004
and 0 otherwise (to allow for changes in factors other than food prices and expenditure over
time) D2t+k is the second time dummy that takes the value 1 for 2009 and 0 otherwise and
it is the error term This equation is estimated using robust regression Although a Chow test
for a structural shift is not feasible with robust regression we have employed two
refinements one is the use of a time dummy that could potentially capture the health
improvements and less strenuous activity patterns (associated with easier access to drinking
water better transportation facilities) and the other is interactions of food price variables
with the time dummy to allow for different price and expenditure effects over time9
An important point to bear in mind is that the price effects capture both own and cross-price
effects through substitutions between food commodities Briefly as prices change demands
for commodities change and consequently for example calorie (and other nutrientsrsquo) intakes
9 While these effects yield insights into changing consumer demands a more detailed analysis along the lines of
Behrman and Deolalikar (1989) and Jha et al (2009) would further deepen our understanding consumer
preferences and tastes for variety
14
(b) Results
We first consider the calorie demand function For both rural and urban areas each of the
price effects has a significant negative coefficient with the exception of price of fruits and
vegetables whose coefficient in not significant Moreover the price effects on the demand for
calories have in many cases weakened as captured by the coefficients of the interaction term
(ie interaction between the price and the time dummies) A case in point is price of cereals
and pulses Rising incomes have a positive impact on calorie demand and so does the
proportion of adults in the household The former effect however weakened over time As
household size increases calorie demand decreases Education of adult female has a negative
impact on calorie demand as this may be attributed to consumption of a more balanced diet
rich in protein and vitamins and reduced dependence on cereals which is a major source of
calories By contrast education of adult male is not significant in rural areas but positive in
urban areas SCs have lower demands for calories in both rural and urban areas while that of
Others is positive in rural areas and negative in urban areas relative to STs The effect of time
alone is reduced consumption of calorie between 1993 and 2004 However somewhat
surprisingly the residual time effect is not significant between 2004-09 That this undermines
the DD explanation emphasising lower calorie requirements due to improvements in the
epidemiology of the disease environment less strenuous physical activities and more
sedentary life styles cannot be ruled out
In case of protein demand in both rural and urban areas there is a positive influence of the
price of fruits and vegetables whereas the elasticity of protein demand with respect to all
other food prices is negative As in the case of calorie demand several price effects
weakened over over time as captured by the interaction term (between food prices and the
time dummies) A case in point is price of milk and milk products eggs and meats Higher
incomeexpenditure increase protein demand but less so over time Increasing household size
reduces protein demand whereas rising proportion of adults in the household increases it
The impact of education of adult female is negative and that of education of adult male is
not significant SCs have lower demand for protein while Others have higher demand relative
to STs The residual effect of time after accounting for the interaction is significant with a
negative coefficient suggesting a lower demand for protein in 2009 and 2004 as compared to
1993
15
In case of fats too in both rural and urban areas there are significant price and expenditure
effects ndash positive in the case of price of cereals oil and fruits and vegetables and negative in
case of milk products and sugar The positive price elasticity of fats with respect to edible oil
price is somewhat surprising although the price effect has weakened over time MPCE has
positive Unlike in the case of calorie and protein highest education of adult female has a
positive impact on fat demand suggesting that households with females having higher than
middle level of education tend to eat diets rich in fats shifting away from diets rich in
calories and proteins Moreover highest education of adult male also has a positive and
significant effect As in the case of calorie and protein household size has a negative impact
and proportion of adults in a household has a positive impact on demand for fats SCs and
Others have higher demands relative to STs The effect of time alone is to increase the fat
demand in 2009 and 2004 as compared to 1993
2 Concluding Observations
The main findings of our analysis are summarised below from a policy perspective
An important insight from the comparison of three rounds of the NSS over the period 1993-
2009 points to a slowing down of the reduction in the calorie intake in both rural and urban
areas in 2004-09 relative to 1993-2004 A similar slowing down occurred in protein intake
over the more recent period (2004-09) While fat intake continued to rise over this period but
at a lower rate
A demand theory based explanation of changes in demands for these nutrients reaffirmed the
important roles of food price and expenditure changes A new insight however is that in
several cases food price effects weakened over time as also expenditure effects While the
residual time effect weakened for both calories and protein over the period 1993-2004 it
slowed down over the more recent period The effect of time on fat demand was however
positive and strengthened over the more recent period Altogether thus the DD explanation of
lower calorie and protein demands over time as a result of lower requirements is further
undermined
From a policy perspective the important roles of food price stabilisation and expansion of
livelihood opportunities remain key to ameliorating nutritional deprivation despite lowering
of nutritional requirements A closer scrutiny of dietary preferences and tastes is crucial for
16
both understanding sources of nutritional deprivation and for designing effective policies for
mitigating it
17
Table 1 Robust Regression Estimates Demand for Calories 1993-2009
RURAL URBAN
Dependent Variable Log of Per capita consumption
of calories
No of Obs = 193785 No of Obs = 124481
F(60193724) = 1192631 F(60124420) = 370511
Prob gt F = 0 Prob gt F = 0
Coefficient Elasticity Coefficient Elasticity
Price Cereals amp Pulses -0012 (-2524) -0166 (-2524) -0006 (-102) -0090 (-102)
---interaction T1 (2004) 0011 (2072) 0049 (2072) 0001 (096) - 0003 (096) -
---interaction T2 (2009) 0010 (2005) 0071 (2005) 0004 (699) 0037 (699)
Price Milk Milk Products Eggs amp Meats
-0003 (-6421) -0098 (-6421) -0001 (-1253) -0035 (-1253)
---interaction T1 (2004) 0002 (4288) 0026 (4288) 0000 (329) 0003 (329)
---interaction T2 (2009) 0002 (4983) 0040 (4983) 0001 (904) 0013 (904)
Price Oil -0008 (-2667) -0086 (-2667) -0004 (-101) -0048 (-101)
---interaction T1 (2004) 0004 (1175) 0015 (1175) 0001 (189) 0003 (189)
---interaction T2 (2009) 0006 (1934) 0031 (1934) 0004 (994) 0024 (994)
Price Sugar -0002 (-127) -0124 (-127) -0004 (-1209) -0183 (-1209)
---interaction T1 (2004) 0002 (1136) 0050 (1136) 0003 (1029) 0061 (1029)
---interaction T2 (2009) 0001 (704) 0027 (704) 0002 (516) 0033 (516)
Price Fruits amp Vegetables
-0001 (-116) - -0010 (-116) - 0001 (194) 0026 (194)
---interaction T1 (2004) 0001 (275) 0010 (275) 0000 (026) - 0001 (026) -
---interaction T2 (2009) -0001 (-174) -0007 (-174) -0003 (-392) -0027 (-392)
Monthly per capita expenditure
0001 (40195) 0418 (40195) 0000 (22549) 0240 (22549)
---interaction T1 (2004) 0000 (-1160) -0054 (-1160) 0000 (-2386) -0011 (-2386)
---interaction T2 (2009) 0000 (-1712) -0063 (-1712) 0000 (-5097) -0022 (-5097)
Household Size -0006 (-3076) -0033 (-3076) -0021 (-684) -0096 (-684)
Proportion of Adults in the household
0202 (9139) 0137 (9139) 0235 (8183) 0169 (8183)
Education Dummy Males 0000 (-023) - 0000 (-023) - 0012 (805) 0008 (805)
Education Dummy Females
-0025 (-215) -0008 (-215) -0013 (-952) -0007 (-952)
Time Dummy (2004) -0159 (-1893) -0061 (-1893) -0105 (-829) -0036 (-829)
Time Dummy (2009) -0007 (-069) - -0002 (-069) - 0006 (045) - 0002 (045) -
Caste Dummy (SC) -0011 (-586) -0002 (-586) -0017 (-498) -0002 (-498)
Caste Dummy (Others) 0010 (616) 0006 (616) -0005 (-177) -0004 (-177)
Constant 7569 (89023)
7712 (59282)
and refer to significance at the 1 5 and 10 level respectively
State Dummies are omitted and details will be furnished on request Education Dummy If highest level of education is middle or lower then dummy = 0 else=1 Omitted Time period 1993 Omitted caste ST
18
Table 2 Robust Regression Estimates Demand for Protein 1993-2009
RURAL URBAN
Dependent Variable
Log of Per capita consumption of protein
No of Obs = 193784 No of Obs = 124481
F(60193723) = 1144586 F(60124420) = 391491
Prob gt F = 0 Prob gt F = 0
Coefficient Elasticity Coefficient Elasticity
Price Cereals amp Pulses -0013 (-2392) -0169 (-2392) -0009 (-1508) -0144 (-1508)
---interaction T1 (2004) 0013 (2153) 0055 (2153) 0005 (662) 0019 (662)
---interaction T2 (2009) 0012 (2187) 0084 (2187) 0009 (1386) 0079 (1386)
Price Milk Milk Products Eggs amp Meats
-0003 (-7497) -0123 (-7497) 0000 (-373) -0011 (-373)
---interaction T1 (2004) 0002 (4993) 0032 (4993) 0000 (-196) -0002 (-196)
---interaction T2 (2009) 0003 (5815) 0050 (5815) 0000 (264) 0004 (264)
Price Oil -0010 (-3216) -0112 (-3216) -0007 (-1709) -0088 (-1709)
---interaction T1 (2004) 0005 (1623) 0022 (1623) 0003 (658) 0012 (658)
---interaction T2 (2009) 0007 (2218) 0038 (2218) 0006 (1562) 0041 (1562)
Price Sugar -0002 (-1085) -0114 (-1085) -0003 (-844) -0139 (-844)
---interaction T1 (2004) 0002 (941) 0045 (941) 0001 (337) 0022 (337)
---interaction T2 (2009) 0001 (249) 0010 (249) 0000 (082) - 0006 (082) -
Price Fruits amp Vegetables
0002 (42) 0040 (42) 0002 (244) 0036 (244)
---interaction T1 (2004) 0000 (084) - 0003 (084) - -0001 (-081) - -0004 (-081) -
---interaction T2 (2009) -0003 (-652) -0030 (-652) -0003 (-366) -0027 (-366)
Monthly per capita expenditure
0001 (39184) 0438 (39184) 0000 (21912) 0254 (21912)
---interaction T1 (2004) 0000 (-1004) -0051 (-1004) 0000 (-1527) -0008 (-1527)
---interaction T2 (2009) 0000 (-1389) -0058 (-1389) 0000 (-3705) -0017 (-3705)
Household Size -0005 (-2368) -0027 (-2368) -0018 (-5526) -0084 (-5526)
Proportion of Adults in the household
0198 (8293) 0134 (8293) 0226 (7247) 0163 (7247)
Education Dummy
Males 0001 (116) - 0001 (116) - 0012 (743) 0008 (743)
Education Dummy Females
-0025 (-2031) -0008 (-2031) -0014 (-947) -0008 (-947)
Time Dummy (2004) -0210 (-2315) -0081 (-2315) -0050 (-36) -0017 (-36)
Time Dummy (2009) -0031 (-284) -0009 (-284) -0047 (-307) -0015 (-307)
Caste Dummy (SC) -0007 (-364) -0001 (-364) -0007 (-187) -0001 (-187)
Caste Dummy (Others) 0011 (623) 0007 (623) 0005 (143) - 0004 (143) -
Constant 3952 (43144)
4101 (28987)
and refer to significance at the 1 5 and 10 level respectively
State Dummies are omitted and details will be furnished on request Education Dummy If highest level of education is middle or lower then dummy = 0 else=1 Omitted Time period 1993 Omitted caste ST
19
Table 3 Robust Regression Estimates Demand for Fats 1993- 2009
RURAL URBAN
Dependent Variable Log of Per capita
consumption of Fats
No of Obs = 193784 No of Obs = 124481
F(60193723) = 1895778 F(60124420) = 766201
Prob gt F = 0 Prob gt F = 0
Coefficient Elasticity Coefficient Elasticity
Price Cereals amp Pulses 0016 (2033) 0218 (2033) 0012 (1462) 0193 (1462)
---interaction T1 (2004) -0005 (-598) -0023 (-598) -0008 (-871) -0035 (-871)
---interaction T2 (2009) -0009 (-1067) -0062 (-1067) -0006 (-661) -0052 (-661)
Price Milk Milk Products Eggs amp Meats
-0013 (-1924) -0478 (-1924) -0009 (-7698) -0327 (-7698)
---interaction T1 (2004) 0008 (10509) 0106 (10509) 0005 (3537) 0056 (3537)
---interaction T2 (2009) 0010 (13313) 0172 (13313) 0007 (5587) 0121 (5587)
Price Oil 0002 (445) 0023 (445) 0007 (1364) 0097 (1364)
---interaction T1 (2004) -0001 (-251) -0005 (-251) -0003 (-571) -0014 (-571)
---interaction T2 (2009) -0002 (-429) -0011 (-429) -0004 (-801) -0029 (-801)
Price Sugar -0004 (-1365) -0217 (-1365) -0003 (-75) -0170 (-75)
---interaction T1 (2004) 0001 (306) 0022 (306) 0001 (123) - 0011 (123) -
---interaction T2 (2009) -0001 (-169) -0011 (-169) -0002 (-42) -0040 (-42)
Price Fruits amp Vegetables
0011 (1418) 0206 (1418) 0006 (615) 0125 (615)
---interaction T1 (2004) -0010 (-1227) -0070 (-1227) -0006 (-556) -0037 (-556)
---interaction T2 (2009) -0011 (-1392) -0097 (-1392) -0008 (-74) -0076 (-74)
Monthly per capita expenditure
0001 (44365) 0753 (44365) 0000 (28858) 0462 (28858)
---interaction T1 (2004) 0000 (-1279) -0098 (-127) 0000 (-1896) -0014 (-1896)
---interaction T2 (2009) -0001 (-2100) -0126 (-2100) 0000 (-8414) -0054 (-8414)
Household Size -0019 (-5556) -0097 (-5556) -0039 (-8497) -0179 (-8497)
Proportion of Adults in the household
0165 (4584) 0112 (4584) 0188 (4368) 0135 (4368)
Education Dummy Males
0056 (3204) 0029 (3204) 0086 (3825) 0060 (3825)
Education Dummy Females
0031 (167) 0010 (167) 0086 (4086) 0048 (4086)
Time Dummy (2004) 0299 (2175) 0115 (2175) 0161 (845) 0055 (845)
Time Dummy (2009) 0564 (3391) 0165 (3391) 0360 (1697) 0114 (1697)
Caste Dummy (SC) 0052 (174) 0009 (174) 0040 (764) 0005 (764)
Caste Dummy (Others) 0135 (5278) 0090 (5278) 0108 (2307) 0086 (2307)
Constant 3023 (21787)
3474 (17776)
and refer to significance at the 1 5 and 10 level respectively
State Dummies are omitted and details will be furnished on request Education Dummy If highest level of education is middle or lower then dummy = 0 else=1 Omitted Time period 1993 Omitted caste ST
20
Annexure 1 Distribution of Nutrient Intake (1993 ndash 2009)
The following tables show the distribution of nutrient intake (proportion of population in
each category) in rural and urban areas between 1993 and 2009 Figures in parenthesis
indicate the mean nutrient intake in each range
Table 1 Calorie Intake Distributions in Rural India 1993 2004 and 2009
Year Range of Calorie Intake Per Capita Per Day
Total lt1800 1801ndash2400 2401ndash3000 gt3000
1993 3109 (1491)
4007 (2084)
1942 (2650)
942 (3636)
100 (2156)
2004 3668
(1516)
4311
(2071)
1507
(2629)
514
(3925)
100
(2047)
2010 3528
(1531)
4591
(2071)
1492
(2622)
389
(3545)
100
(2020)
Table 2 Calorie Intake Distributions in Urban India 1993 2004 and 2009
Year
Range of Calorie Intake Per Capita Per Day
Total lt1700 1701ndash2100 2101ndash2600 gt2600
1993 2812
(1426)
2962
(1900)
2576
(2320)
1649
(3107)
100
(2074)
2004 2940
(1440)
3452
(1900)
2467
(2313)
1141
(3252)
100
(2021)
2010 3010
(1456)
3534
(1896)
2436
(2312)
1019
(3043)
100
(1982)
Table 3 Protein Intake Distributions in Rural India 1993 2004 and 2009
Year Range of Protein Intake Per Capita Per Day (Gms)
Total lt45 46ndash60 61ndash75 gt75
1993 2381
(371)
3379
(524)
2279
(668)
1961
(944)
100
(603)
2004 2881
(374)
3805
(522)
2146
(663)
1168
(939)
100
(558)
2010 2935
(380)
4081
(521)
2105
(661)
879
(892)
100
(541)
21
Table 4 Protein Intake Distributions in Urban India 1993 2004 and 2009
Year Range of Protein Intake Per Capita Per Day (Gms)
Total lt45 46ndash60 61ndash75 gt75
1993 2490
(371)
3777
(524)
2311
(665)
1423
(907)
100
(573)
2004 2940
(378)
3450
(523)
2469
(662)
1140
(949)
100
(554)
2010 2944
(383)
4366
(521)
1961
(661)
729
(876)
100
(534)
Table 5 Fat Intake Distributions in Rural India 1993 2004 and 2009
Year Range of Fat Intake Per Capita Per Day (Gms)
Total lt20 21ndash30 31ndash50 gt50
1993 3430
(140)
2508
(247)
2609
(383)
1454
(721)
100
(315)
2004 2259
(150)
2721
(249)
3358
(383)
1662
(746)
100
(354)
2010 1420
(154)
2405
(251)
4049
(388)
2125
(672)
100
(382)
Table 6 Fat Intake Distributions in Urban India 1993 2004 and 2009
Year Range of Fat Intake Per Capita Per Day (Gms)
Total lt25 26ndash40 41ndash60 gt60
1993 2504
(182)
2984
(323)
2615
(486)
1897
(802)
100
(421)
2004 1539
(194)
3102
(326)
3156
(489)
2204
(858)
100
(474)
2010 1032
(198)
2788
(330)
3661
(490)
2519
(781)
100
(489)
Source Authorsrsquo calculations based on the 50th 61
st and 66
th rounds of the NSS
22
Annexure 2 Distribution of Nutrient Intake by Food Commodities (1993 -2009)
The following tables show the distribution of nutrient (calorie protein and fat) intake from
nine food commodity groups for rural and urban areas between 1993 and 2009
Table 1 Mean Per Capita Calorie Intake by Food Commodities 1993 2004 and 2009
Year Cereals Milk
Products GheeButter
Vanaspati-Oil
Sugar Eggs MeatFish Poultry
PulsesNuts Dry Fruits
Fruits Vegetables Total
Rural India
1993-94 1530 137 111 103 2 12 151 20 89 2156
Share 710 64 51 48 01 06 70 09 41
2004-05 1383 137 145 98 3 12 156 23 90 2047
Share 676 67 71 48 01 06 76 11 44
2009-10 1296 141 169 93 3 12 84 20 83 2020
Share 642 70 84 46 01 06 42 10 41
Urban India
1993-94 1213 181 168 129 5 16 231 37 94 2074
Share 585 87 81 62 02 08 111 18 45
2004-05 1133 189 199 115 6 16 235 36 92 2021
Share 561 94 98 57 03 08 116 18 46
2009-
10 1071 199 217 110 5 14 106 33 83 1982
Share 540 100 109 55 03 07 53 17 42
Table 2 Mean Per Capita Protein Intake by Food Commodities 1993 2004 and 2009
Year Cereals Milk
Products GheeButter
Vanaspati-Oil
Sugar Eggs MeatFish Poultry
PulsesNuts Dry Fruits
Fruits Vegetables Total
Rural India
1993-94 418 53 0 0 02 2 78 02 29 603
Share 693 88 00 00 03 33 129 03 48
2004-05 379 53 0 0 03 2 73 03 28 558
Share 679 95 00 00 05 36 131 05 50
2009-10 356 55 0 0 03 2 53 02 25 541
Share 658 102 00 00 06 37 98 04 46
Urban India
1993-94 341 67 0 0 04 26 10 04 31 573
Share 595 117 00 00 07 45 175 07 54
2004-05 32 7 0 0 05 27 98 04 31 554
Share 578 126 00 00 09 49 177 07 56
2009-
10 302 74 0 0 04 26 65 04 27 534
Share 566 139 00 00 07 49 122 07 51
23
Table 3 Mean Per Capita Fat Intake by Food Commodities 1993 2004 and 2009
Year Cereals Milk
Products GheeButter
Vanaspati-Oil
Sugar Eggs MeatFish Poultry
PulsesNuts Dry Fruits
Fruits Vegetables Total
Rural India
1993-94 54 97 123 0 02 03 24 07 04 315
Share 171 308 390 00 06 10 76 22 13
2004-05 48 97 162 0 03 02 31 08 04 354
Share 136 274 458 00 08 06 88 23 11
2009-10 43 10 187 0 03 02 11 08 03 382
Share 113 262 490 00 08 05 29 21 08
Urban India
1993-94 4 132 186 0 04 04 4 11 04 421
Share 95 314 442 00 10 10 95 26 10
2004-05 37 138 221 0 05 03 56 11 04 475
Share 78 291 465 00 11 06 118 23 08
2009-
10 35 145 241 0 04 02 15 11 04 489
Share 72 297 493 00 08 04 31 22 08
Source Authorsrsquo calculations based on the 50th 61
st and 66
th rounds of the NSS
24
References
Behrman J and A Deolalikar (1989) ldquoIs Variety the Spice of life Implications for Calorie
Intakerdquo Review of Economics and Statistics vol 71
Deaton A (1995) The Analysis of Household Surveys A Microeconomic approach to
Development Policy Baltimore MD The Johns Hopkins University Press
Deaton A and J Dreze (2009) lsquoFood and Nutrition in India Facts and Interpretationsrsquo
Economic and Political Weekly XLIV(7) 42ndash65
Gaiha R R Jha and Vani S Kulkarni (2012) ldquoDemand for Nutrients in India 1993 to
2004rdquo Applied Economics available online 1 February 2012
Gopalan C B Sastri and S Balasubramanian (1971) Nutritive Value of Indian Foods
National institute of Nutrition Indian Council of Medical Research Hyderabad
Indian Council of Medical Research (ICMR 1990) Nutrient Requirements and
Recommended Dietary Allowances for Indians New Delhi ICMR
Jha R R Gaiha and A Sharma (2009) ldquo Modelling Variety in Consumption Expenditure on
Food in Indiardquo International Review of Applied Economics online publication 1
July 2009
Srinivasan TN (1992) lsquoUndernutrition Concepts Measurements and Policy Implicationsrsquo
in SR Osmani (ed) Nutrition and Poverty Clarendon Press Oxford pp 97ndash120
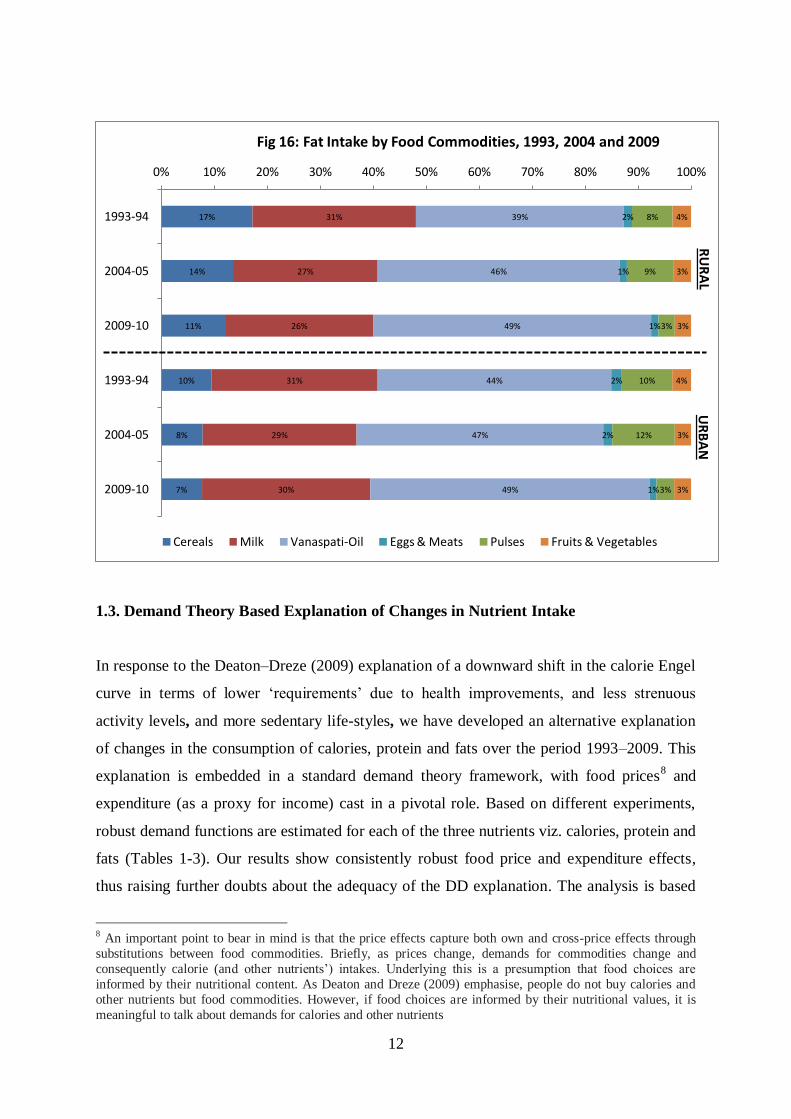
12
13 Demand Theory Based Explanation of Changes in Nutrient Intake
In response to the DeatonndashDreze (2009) explanation of a downward shift in the calorie Engel
curve in terms of lower lsquorequirementsrsquo due to health improvements and less strenuous
activity levels and more sedentary life-styles we have developed an alternative explanation
of changes in the consumption of calories protein and fats over the period 1993ndash2009 This
explanation is embedded in a standard demand theory framework with food prices8 and
expenditure (as a proxy for income) cast in a pivotal role Based on different experiments
robust demand functions are estimated for each of the three nutrients viz calories protein and
fats (Tables 1-3) Our results show consistently robust food price and expenditure effects
thus raising further doubts about the adequacy of the DD explanation The analysis is based
8 An important point to bear in mind is that the price effects capture both own and cross-price effects through
substitutions between food commodities Briefly as prices change demands for commodities change and
consequently calorie (and other nutrientsrsquo) intakes Underlying this is a presumption that food choices are
informed by their nutritional content As Deaton and Dreze (2009) emphasise people do not buy calories and
other nutrients but food commodities However if food choices are informed by their nutritional values it is
meaningful to talk about demands for calories and other nutrients
17
14
11
10
8
7
31
27
26
31
29
30
39
46
49
44
47
49
2
1
1
2
2
1
8
9
3
10
12
3
4
3
3
4
3
3
0 10 20 30 40 50 60 70 80 90 100
1993-94
2004-05
2009-10
1993-94
2004-05
2009-10
Fig 16 Fat Intake by Food Commodities 1993 2004 and 2009
Cereals Milk Vanaspati-Oil Eggs amp Meats Pulses Fruits amp Vegetables
RU
RA
L U
RB
AN
13
on unit record data collected for the 50th
61st and 66
th rounds of the NSS (corresponding to
the years 1993ndash94 2004ndash05 and 2009-10 respectively) We will discuss separately the
results for rural and urban samples
(a) Demand Function
A basic demand equation for nutrients (calories protein fats) in rural and urban India with
pooled data for 1993 2004 and 2009 is given below
(1)
where the dependent variable is log of nutrient consumed by ith household in time t jtP is a
vector of food prices computed from the NSS at the village level (j) and time t E it is
household per capita expenditure for ith household in time t itX is a vector of household
characteristics (eg number of adult males females household size ) and a few others
specified as dummy variables (caste) D1t is a dummy variable that takes the value 1 for 2004
and 0 otherwise (to allow for changes in factors other than food prices and expenditure over
time) D2t+k is the second time dummy that takes the value 1 for 2009 and 0 otherwise and
it is the error term This equation is estimated using robust regression Although a Chow test
for a structural shift is not feasible with robust regression we have employed two
refinements one is the use of a time dummy that could potentially capture the health
improvements and less strenuous activity patterns (associated with easier access to drinking
water better transportation facilities) and the other is interactions of food price variables
with the time dummy to allow for different price and expenditure effects over time9
An important point to bear in mind is that the price effects capture both own and cross-price
effects through substitutions between food commodities Briefly as prices change demands
for commodities change and consequently for example calorie (and other nutrientsrsquo) intakes
9 While these effects yield insights into changing consumer demands a more detailed analysis along the lines of
Behrman and Deolalikar (1989) and Jha et al (2009) would further deepen our understanding consumer
preferences and tastes for variety
14
(b) Results
We first consider the calorie demand function For both rural and urban areas each of the
price effects has a significant negative coefficient with the exception of price of fruits and
vegetables whose coefficient in not significant Moreover the price effects on the demand for
calories have in many cases weakened as captured by the coefficients of the interaction term
(ie interaction between the price and the time dummies) A case in point is price of cereals
and pulses Rising incomes have a positive impact on calorie demand and so does the
proportion of adults in the household The former effect however weakened over time As
household size increases calorie demand decreases Education of adult female has a negative
impact on calorie demand as this may be attributed to consumption of a more balanced diet
rich in protein and vitamins and reduced dependence on cereals which is a major source of
calories By contrast education of adult male is not significant in rural areas but positive in
urban areas SCs have lower demands for calories in both rural and urban areas while that of
Others is positive in rural areas and negative in urban areas relative to STs The effect of time
alone is reduced consumption of calorie between 1993 and 2004 However somewhat
surprisingly the residual time effect is not significant between 2004-09 That this undermines
the DD explanation emphasising lower calorie requirements due to improvements in the
epidemiology of the disease environment less strenuous physical activities and more
sedentary life styles cannot be ruled out
In case of protein demand in both rural and urban areas there is a positive influence of the
price of fruits and vegetables whereas the elasticity of protein demand with respect to all
other food prices is negative As in the case of calorie demand several price effects
weakened over over time as captured by the interaction term (between food prices and the
time dummies) A case in point is price of milk and milk products eggs and meats Higher
incomeexpenditure increase protein demand but less so over time Increasing household size
reduces protein demand whereas rising proportion of adults in the household increases it
The impact of education of adult female is negative and that of education of adult male is
not significant SCs have lower demand for protein while Others have higher demand relative
to STs The residual effect of time after accounting for the interaction is significant with a
negative coefficient suggesting a lower demand for protein in 2009 and 2004 as compared to
1993
15
In case of fats too in both rural and urban areas there are significant price and expenditure
effects ndash positive in the case of price of cereals oil and fruits and vegetables and negative in
case of milk products and sugar The positive price elasticity of fats with respect to edible oil
price is somewhat surprising although the price effect has weakened over time MPCE has
positive Unlike in the case of calorie and protein highest education of adult female has a
positive impact on fat demand suggesting that households with females having higher than
middle level of education tend to eat diets rich in fats shifting away from diets rich in
calories and proteins Moreover highest education of adult male also has a positive and
significant effect As in the case of calorie and protein household size has a negative impact
and proportion of adults in a household has a positive impact on demand for fats SCs and
Others have higher demands relative to STs The effect of time alone is to increase the fat
demand in 2009 and 2004 as compared to 1993
2 Concluding Observations
The main findings of our analysis are summarised below from a policy perspective
An important insight from the comparison of three rounds of the NSS over the period 1993-
2009 points to a slowing down of the reduction in the calorie intake in both rural and urban
areas in 2004-09 relative to 1993-2004 A similar slowing down occurred in protein intake
over the more recent period (2004-09) While fat intake continued to rise over this period but
at a lower rate
A demand theory based explanation of changes in demands for these nutrients reaffirmed the
important roles of food price and expenditure changes A new insight however is that in
several cases food price effects weakened over time as also expenditure effects While the
residual time effect weakened for both calories and protein over the period 1993-2004 it
slowed down over the more recent period The effect of time on fat demand was however
positive and strengthened over the more recent period Altogether thus the DD explanation of
lower calorie and protein demands over time as a result of lower requirements is further
undermined
From a policy perspective the important roles of food price stabilisation and expansion of
livelihood opportunities remain key to ameliorating nutritional deprivation despite lowering
of nutritional requirements A closer scrutiny of dietary preferences and tastes is crucial for
16
both understanding sources of nutritional deprivation and for designing effective policies for
mitigating it
17
Table 1 Robust Regression Estimates Demand for Calories 1993-2009
RURAL URBAN
Dependent Variable Log of Per capita consumption
of calories
No of Obs = 193785 No of Obs = 124481
F(60193724) = 1192631 F(60124420) = 370511
Prob gt F = 0 Prob gt F = 0
Coefficient Elasticity Coefficient Elasticity
Price Cereals amp Pulses -0012 (-2524) -0166 (-2524) -0006 (-102) -0090 (-102)
---interaction T1 (2004) 0011 (2072) 0049 (2072) 0001 (096) - 0003 (096) -
---interaction T2 (2009) 0010 (2005) 0071 (2005) 0004 (699) 0037 (699)
Price Milk Milk Products Eggs amp Meats
-0003 (-6421) -0098 (-6421) -0001 (-1253) -0035 (-1253)
---interaction T1 (2004) 0002 (4288) 0026 (4288) 0000 (329) 0003 (329)
---interaction T2 (2009) 0002 (4983) 0040 (4983) 0001 (904) 0013 (904)
Price Oil -0008 (-2667) -0086 (-2667) -0004 (-101) -0048 (-101)
---interaction T1 (2004) 0004 (1175) 0015 (1175) 0001 (189) 0003 (189)
---interaction T2 (2009) 0006 (1934) 0031 (1934) 0004 (994) 0024 (994)
Price Sugar -0002 (-127) -0124 (-127) -0004 (-1209) -0183 (-1209)
---interaction T1 (2004) 0002 (1136) 0050 (1136) 0003 (1029) 0061 (1029)
---interaction T2 (2009) 0001 (704) 0027 (704) 0002 (516) 0033 (516)
Price Fruits amp Vegetables
-0001 (-116) - -0010 (-116) - 0001 (194) 0026 (194)
---interaction T1 (2004) 0001 (275) 0010 (275) 0000 (026) - 0001 (026) -
---interaction T2 (2009) -0001 (-174) -0007 (-174) -0003 (-392) -0027 (-392)
Monthly per capita expenditure
0001 (40195) 0418 (40195) 0000 (22549) 0240 (22549)
---interaction T1 (2004) 0000 (-1160) -0054 (-1160) 0000 (-2386) -0011 (-2386)
---interaction T2 (2009) 0000 (-1712) -0063 (-1712) 0000 (-5097) -0022 (-5097)
Household Size -0006 (-3076) -0033 (-3076) -0021 (-684) -0096 (-684)
Proportion of Adults in the household
0202 (9139) 0137 (9139) 0235 (8183) 0169 (8183)
Education Dummy Males 0000 (-023) - 0000 (-023) - 0012 (805) 0008 (805)
Education Dummy Females
-0025 (-215) -0008 (-215) -0013 (-952) -0007 (-952)
Time Dummy (2004) -0159 (-1893) -0061 (-1893) -0105 (-829) -0036 (-829)
Time Dummy (2009) -0007 (-069) - -0002 (-069) - 0006 (045) - 0002 (045) -
Caste Dummy (SC) -0011 (-586) -0002 (-586) -0017 (-498) -0002 (-498)
Caste Dummy (Others) 0010 (616) 0006 (616) -0005 (-177) -0004 (-177)
Constant 7569 (89023)
7712 (59282)
and refer to significance at the 1 5 and 10 level respectively
State Dummies are omitted and details will be furnished on request Education Dummy If highest level of education is middle or lower then dummy = 0 else=1 Omitted Time period 1993 Omitted caste ST
18
Table 2 Robust Regression Estimates Demand for Protein 1993-2009
RURAL URBAN
Dependent Variable
Log of Per capita consumption of protein
No of Obs = 193784 No of Obs = 124481
F(60193723) = 1144586 F(60124420) = 391491
Prob gt F = 0 Prob gt F = 0
Coefficient Elasticity Coefficient Elasticity
Price Cereals amp Pulses -0013 (-2392) -0169 (-2392) -0009 (-1508) -0144 (-1508)
---interaction T1 (2004) 0013 (2153) 0055 (2153) 0005 (662) 0019 (662)
---interaction T2 (2009) 0012 (2187) 0084 (2187) 0009 (1386) 0079 (1386)
Price Milk Milk Products Eggs amp Meats
-0003 (-7497) -0123 (-7497) 0000 (-373) -0011 (-373)
---interaction T1 (2004) 0002 (4993) 0032 (4993) 0000 (-196) -0002 (-196)
---interaction T2 (2009) 0003 (5815) 0050 (5815) 0000 (264) 0004 (264)
Price Oil -0010 (-3216) -0112 (-3216) -0007 (-1709) -0088 (-1709)
---interaction T1 (2004) 0005 (1623) 0022 (1623) 0003 (658) 0012 (658)
---interaction T2 (2009) 0007 (2218) 0038 (2218) 0006 (1562) 0041 (1562)
Price Sugar -0002 (-1085) -0114 (-1085) -0003 (-844) -0139 (-844)
---interaction T1 (2004) 0002 (941) 0045 (941) 0001 (337) 0022 (337)
---interaction T2 (2009) 0001 (249) 0010 (249) 0000 (082) - 0006 (082) -
Price Fruits amp Vegetables
0002 (42) 0040 (42) 0002 (244) 0036 (244)
---interaction T1 (2004) 0000 (084) - 0003 (084) - -0001 (-081) - -0004 (-081) -
---interaction T2 (2009) -0003 (-652) -0030 (-652) -0003 (-366) -0027 (-366)
Monthly per capita expenditure
0001 (39184) 0438 (39184) 0000 (21912) 0254 (21912)
---interaction T1 (2004) 0000 (-1004) -0051 (-1004) 0000 (-1527) -0008 (-1527)
---interaction T2 (2009) 0000 (-1389) -0058 (-1389) 0000 (-3705) -0017 (-3705)
Household Size -0005 (-2368) -0027 (-2368) -0018 (-5526) -0084 (-5526)
Proportion of Adults in the household
0198 (8293) 0134 (8293) 0226 (7247) 0163 (7247)
Education Dummy
Males 0001 (116) - 0001 (116) - 0012 (743) 0008 (743)
Education Dummy Females
-0025 (-2031) -0008 (-2031) -0014 (-947) -0008 (-947)
Time Dummy (2004) -0210 (-2315) -0081 (-2315) -0050 (-36) -0017 (-36)
Time Dummy (2009) -0031 (-284) -0009 (-284) -0047 (-307) -0015 (-307)
Caste Dummy (SC) -0007 (-364) -0001 (-364) -0007 (-187) -0001 (-187)
Caste Dummy (Others) 0011 (623) 0007 (623) 0005 (143) - 0004 (143) -
Constant 3952 (43144)
4101 (28987)
and refer to significance at the 1 5 and 10 level respectively
State Dummies are omitted and details will be furnished on request Education Dummy If highest level of education is middle or lower then dummy = 0 else=1 Omitted Time period 1993 Omitted caste ST
19
Table 3 Robust Regression Estimates Demand for Fats 1993- 2009
RURAL URBAN
Dependent Variable Log of Per capita
consumption of Fats
No of Obs = 193784 No of Obs = 124481
F(60193723) = 1895778 F(60124420) = 766201
Prob gt F = 0 Prob gt F = 0
Coefficient Elasticity Coefficient Elasticity
Price Cereals amp Pulses 0016 (2033) 0218 (2033) 0012 (1462) 0193 (1462)
---interaction T1 (2004) -0005 (-598) -0023 (-598) -0008 (-871) -0035 (-871)
---interaction T2 (2009) -0009 (-1067) -0062 (-1067) -0006 (-661) -0052 (-661)
Price Milk Milk Products Eggs amp Meats
-0013 (-1924) -0478 (-1924) -0009 (-7698) -0327 (-7698)
---interaction T1 (2004) 0008 (10509) 0106 (10509) 0005 (3537) 0056 (3537)
---interaction T2 (2009) 0010 (13313) 0172 (13313) 0007 (5587) 0121 (5587)
Price Oil 0002 (445) 0023 (445) 0007 (1364) 0097 (1364)
---interaction T1 (2004) -0001 (-251) -0005 (-251) -0003 (-571) -0014 (-571)
---interaction T2 (2009) -0002 (-429) -0011 (-429) -0004 (-801) -0029 (-801)
Price Sugar -0004 (-1365) -0217 (-1365) -0003 (-75) -0170 (-75)
---interaction T1 (2004) 0001 (306) 0022 (306) 0001 (123) - 0011 (123) -
---interaction T2 (2009) -0001 (-169) -0011 (-169) -0002 (-42) -0040 (-42)
Price Fruits amp Vegetables
0011 (1418) 0206 (1418) 0006 (615) 0125 (615)
---interaction T1 (2004) -0010 (-1227) -0070 (-1227) -0006 (-556) -0037 (-556)
---interaction T2 (2009) -0011 (-1392) -0097 (-1392) -0008 (-74) -0076 (-74)
Monthly per capita expenditure
0001 (44365) 0753 (44365) 0000 (28858) 0462 (28858)
---interaction T1 (2004) 0000 (-1279) -0098 (-127) 0000 (-1896) -0014 (-1896)
---interaction T2 (2009) -0001 (-2100) -0126 (-2100) 0000 (-8414) -0054 (-8414)
Household Size -0019 (-5556) -0097 (-5556) -0039 (-8497) -0179 (-8497)
Proportion of Adults in the household
0165 (4584) 0112 (4584) 0188 (4368) 0135 (4368)
Education Dummy Males
0056 (3204) 0029 (3204) 0086 (3825) 0060 (3825)
Education Dummy Females
0031 (167) 0010 (167) 0086 (4086) 0048 (4086)
Time Dummy (2004) 0299 (2175) 0115 (2175) 0161 (845) 0055 (845)
Time Dummy (2009) 0564 (3391) 0165 (3391) 0360 (1697) 0114 (1697)
Caste Dummy (SC) 0052 (174) 0009 (174) 0040 (764) 0005 (764)
Caste Dummy (Others) 0135 (5278) 0090 (5278) 0108 (2307) 0086 (2307)
Constant 3023 (21787)
3474 (17776)
and refer to significance at the 1 5 and 10 level respectively
State Dummies are omitted and details will be furnished on request Education Dummy If highest level of education is middle or lower then dummy = 0 else=1 Omitted Time period 1993 Omitted caste ST
20
Annexure 1 Distribution of Nutrient Intake (1993 ndash 2009)
The following tables show the distribution of nutrient intake (proportion of population in
each category) in rural and urban areas between 1993 and 2009 Figures in parenthesis
indicate the mean nutrient intake in each range
Table 1 Calorie Intake Distributions in Rural India 1993 2004 and 2009
Year Range of Calorie Intake Per Capita Per Day
Total lt1800 1801ndash2400 2401ndash3000 gt3000
1993 3109 (1491)
4007 (2084)
1942 (2650)
942 (3636)
100 (2156)
2004 3668
(1516)
4311
(2071)
1507
(2629)
514
(3925)
100
(2047)
2010 3528
(1531)
4591
(2071)
1492
(2622)
389
(3545)
100
(2020)
Table 2 Calorie Intake Distributions in Urban India 1993 2004 and 2009
Year
Range of Calorie Intake Per Capita Per Day
Total lt1700 1701ndash2100 2101ndash2600 gt2600
1993 2812
(1426)
2962
(1900)
2576
(2320)
1649
(3107)
100
(2074)
2004 2940
(1440)
3452
(1900)
2467
(2313)
1141
(3252)
100
(2021)
2010 3010
(1456)
3534
(1896)
2436
(2312)
1019
(3043)
100
(1982)
Table 3 Protein Intake Distributions in Rural India 1993 2004 and 2009
Year Range of Protein Intake Per Capita Per Day (Gms)
Total lt45 46ndash60 61ndash75 gt75
1993 2381
(371)
3379
(524)
2279
(668)
1961
(944)
100
(603)
2004 2881
(374)
3805
(522)
2146
(663)
1168
(939)
100
(558)
2010 2935
(380)
4081
(521)
2105
(661)
879
(892)
100
(541)
21
Table 4 Protein Intake Distributions in Urban India 1993 2004 and 2009
Year Range of Protein Intake Per Capita Per Day (Gms)
Total lt45 46ndash60 61ndash75 gt75
1993 2490
(371)
3777
(524)
2311
(665)
1423
(907)
100
(573)
2004 2940
(378)
3450
(523)
2469
(662)
1140
(949)
100
(554)
2010 2944
(383)
4366
(521)
1961
(661)
729
(876)
100
(534)
Table 5 Fat Intake Distributions in Rural India 1993 2004 and 2009
Year Range of Fat Intake Per Capita Per Day (Gms)
Total lt20 21ndash30 31ndash50 gt50
1993 3430
(140)
2508
(247)
2609
(383)
1454
(721)
100
(315)
2004 2259
(150)
2721
(249)
3358
(383)
1662
(746)
100
(354)
2010 1420
(154)
2405
(251)
4049
(388)
2125
(672)
100
(382)
Table 6 Fat Intake Distributions in Urban India 1993 2004 and 2009
Year Range of Fat Intake Per Capita Per Day (Gms)
Total lt25 26ndash40 41ndash60 gt60
1993 2504
(182)
2984
(323)
2615
(486)
1897
(802)
100
(421)
2004 1539
(194)
3102
(326)
3156
(489)
2204
(858)
100
(474)
2010 1032
(198)
2788
(330)
3661
(490)
2519
(781)
100
(489)
Source Authorsrsquo calculations based on the 50th 61
st and 66
th rounds of the NSS
22
Annexure 2 Distribution of Nutrient Intake by Food Commodities (1993 -2009)
The following tables show the distribution of nutrient (calorie protein and fat) intake from
nine food commodity groups for rural and urban areas between 1993 and 2009
Table 1 Mean Per Capita Calorie Intake by Food Commodities 1993 2004 and 2009
Year Cereals Milk
Products GheeButter
Vanaspati-Oil
Sugar Eggs MeatFish Poultry
PulsesNuts Dry Fruits
Fruits Vegetables Total
Rural India
1993-94 1530 137 111 103 2 12 151 20 89 2156
Share 710 64 51 48 01 06 70 09 41
2004-05 1383 137 145 98 3 12 156 23 90 2047
Share 676 67 71 48 01 06 76 11 44
2009-10 1296 141 169 93 3 12 84 20 83 2020
Share 642 70 84 46 01 06 42 10 41
Urban India
1993-94 1213 181 168 129 5 16 231 37 94 2074
Share 585 87 81 62 02 08 111 18 45
2004-05 1133 189 199 115 6 16 235 36 92 2021
Share 561 94 98 57 03 08 116 18 46
2009-
10 1071 199 217 110 5 14 106 33 83 1982
Share 540 100 109 55 03 07 53 17 42
Table 2 Mean Per Capita Protein Intake by Food Commodities 1993 2004 and 2009
Year Cereals Milk
Products GheeButter
Vanaspati-Oil
Sugar Eggs MeatFish Poultry
PulsesNuts Dry Fruits
Fruits Vegetables Total
Rural India
1993-94 418 53 0 0 02 2 78 02 29 603
Share 693 88 00 00 03 33 129 03 48
2004-05 379 53 0 0 03 2 73 03 28 558
Share 679 95 00 00 05 36 131 05 50
2009-10 356 55 0 0 03 2 53 02 25 541
Share 658 102 00 00 06 37 98 04 46
Urban India
1993-94 341 67 0 0 04 26 10 04 31 573
Share 595 117 00 00 07 45 175 07 54
2004-05 32 7 0 0 05 27 98 04 31 554
Share 578 126 00 00 09 49 177 07 56
2009-
10 302 74 0 0 04 26 65 04 27 534
Share 566 139 00 00 07 49 122 07 51
23
Table 3 Mean Per Capita Fat Intake by Food Commodities 1993 2004 and 2009
Year Cereals Milk
Products GheeButter
Vanaspati-Oil
Sugar Eggs MeatFish Poultry
PulsesNuts Dry Fruits
Fruits Vegetables Total
Rural India
1993-94 54 97 123 0 02 03 24 07 04 315
Share 171 308 390 00 06 10 76 22 13
2004-05 48 97 162 0 03 02 31 08 04 354
Share 136 274 458 00 08 06 88 23 11
2009-10 43 10 187 0 03 02 11 08 03 382
Share 113 262 490 00 08 05 29 21 08
Urban India
1993-94 4 132 186 0 04 04 4 11 04 421
Share 95 314 442 00 10 10 95 26 10
2004-05 37 138 221 0 05 03 56 11 04 475
Share 78 291 465 00 11 06 118 23 08
2009-
10 35 145 241 0 04 02 15 11 04 489
Share 72 297 493 00 08 04 31 22 08
Source Authorsrsquo calculations based on the 50th 61
st and 66
th rounds of the NSS
24
References
Behrman J and A Deolalikar (1989) ldquoIs Variety the Spice of life Implications for Calorie
Intakerdquo Review of Economics and Statistics vol 71
Deaton A (1995) The Analysis of Household Surveys A Microeconomic approach to
Development Policy Baltimore MD The Johns Hopkins University Press
Deaton A and J Dreze (2009) lsquoFood and Nutrition in India Facts and Interpretationsrsquo
Economic and Political Weekly XLIV(7) 42ndash65
Gaiha R R Jha and Vani S Kulkarni (2012) ldquoDemand for Nutrients in India 1993 to
2004rdquo Applied Economics available online 1 February 2012
Gopalan C B Sastri and S Balasubramanian (1971) Nutritive Value of Indian Foods
National institute of Nutrition Indian Council of Medical Research Hyderabad
Indian Council of Medical Research (ICMR 1990) Nutrient Requirements and
Recommended Dietary Allowances for Indians New Delhi ICMR
Jha R R Gaiha and A Sharma (2009) ldquo Modelling Variety in Consumption Expenditure on
Food in Indiardquo International Review of Applied Economics online publication 1
July 2009
Srinivasan TN (1992) lsquoUndernutrition Concepts Measurements and Policy Implicationsrsquo
in SR Osmani (ed) Nutrition and Poverty Clarendon Press Oxford pp 97ndash120
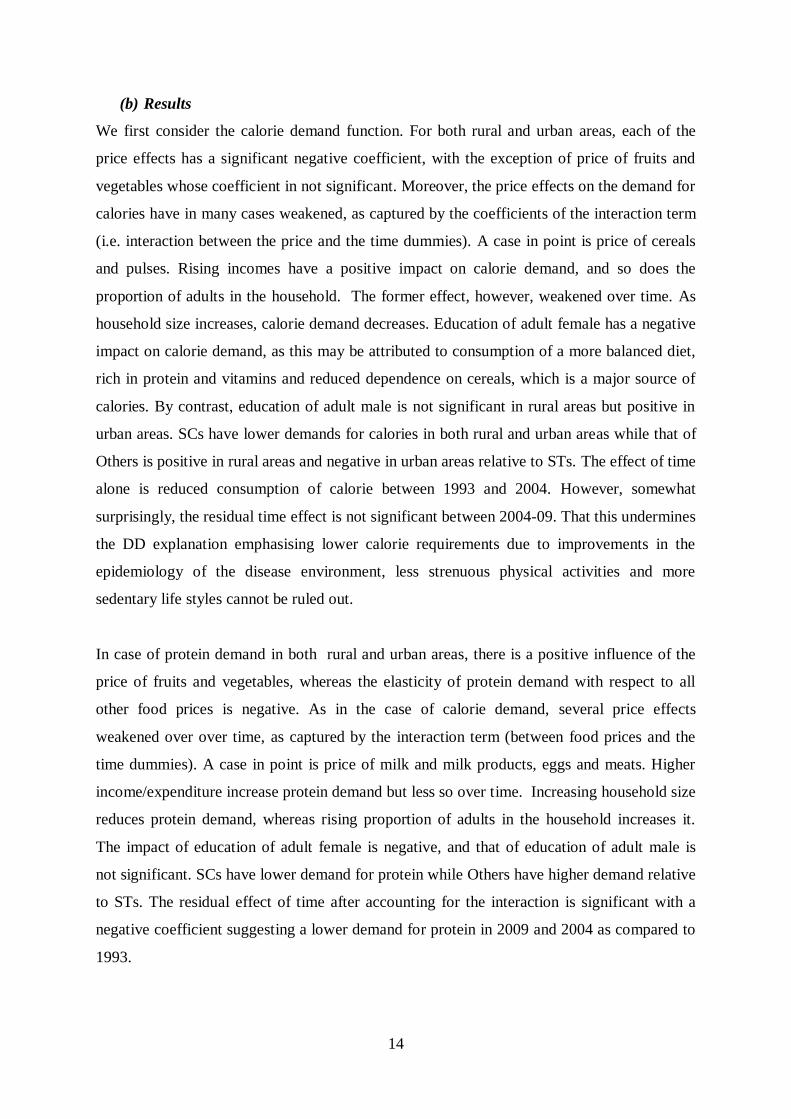
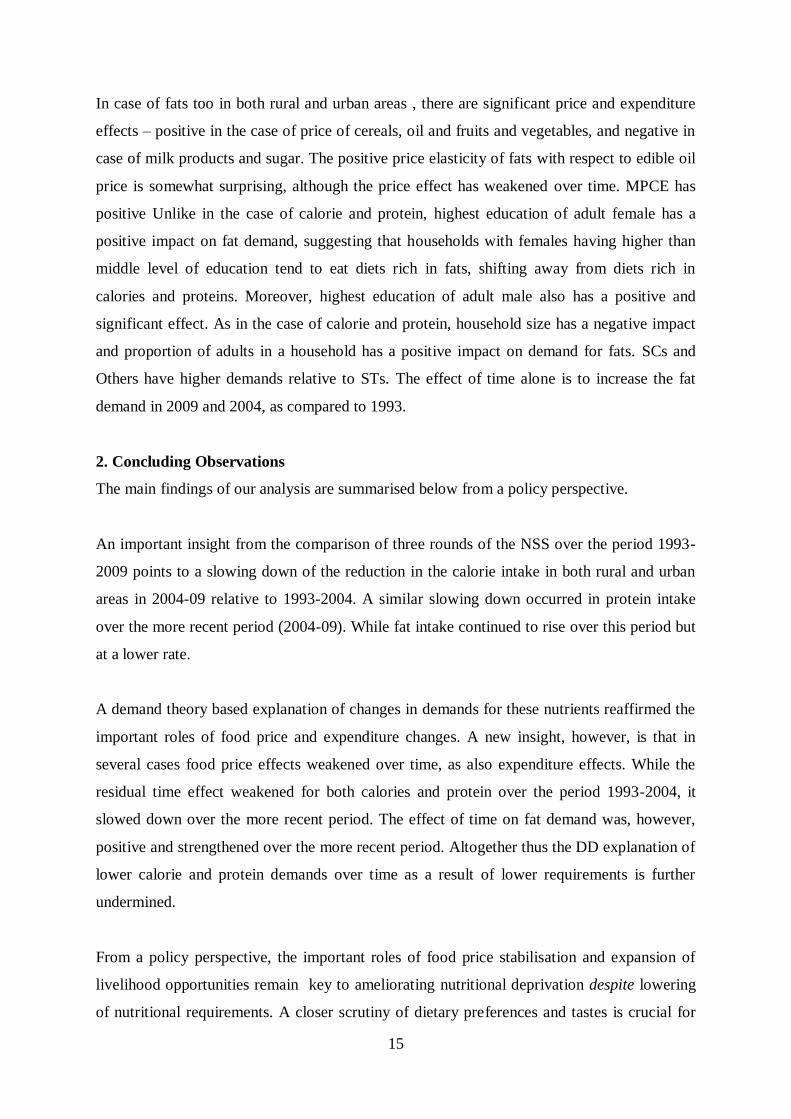
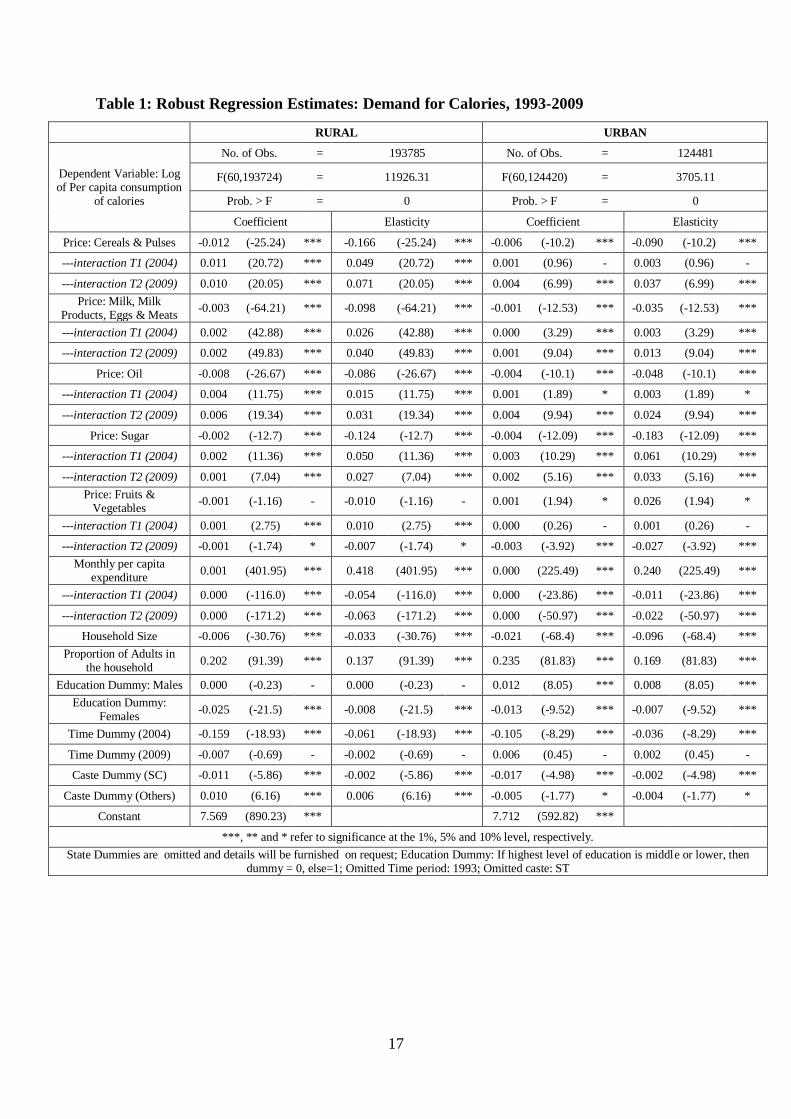
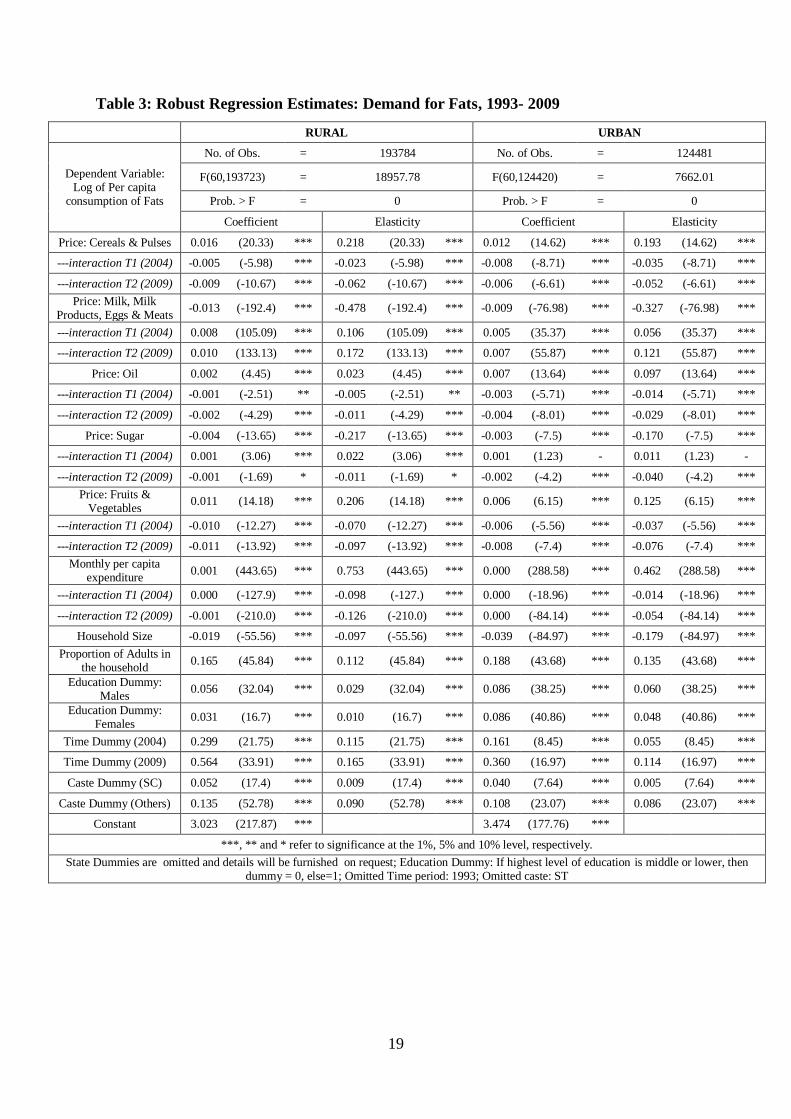
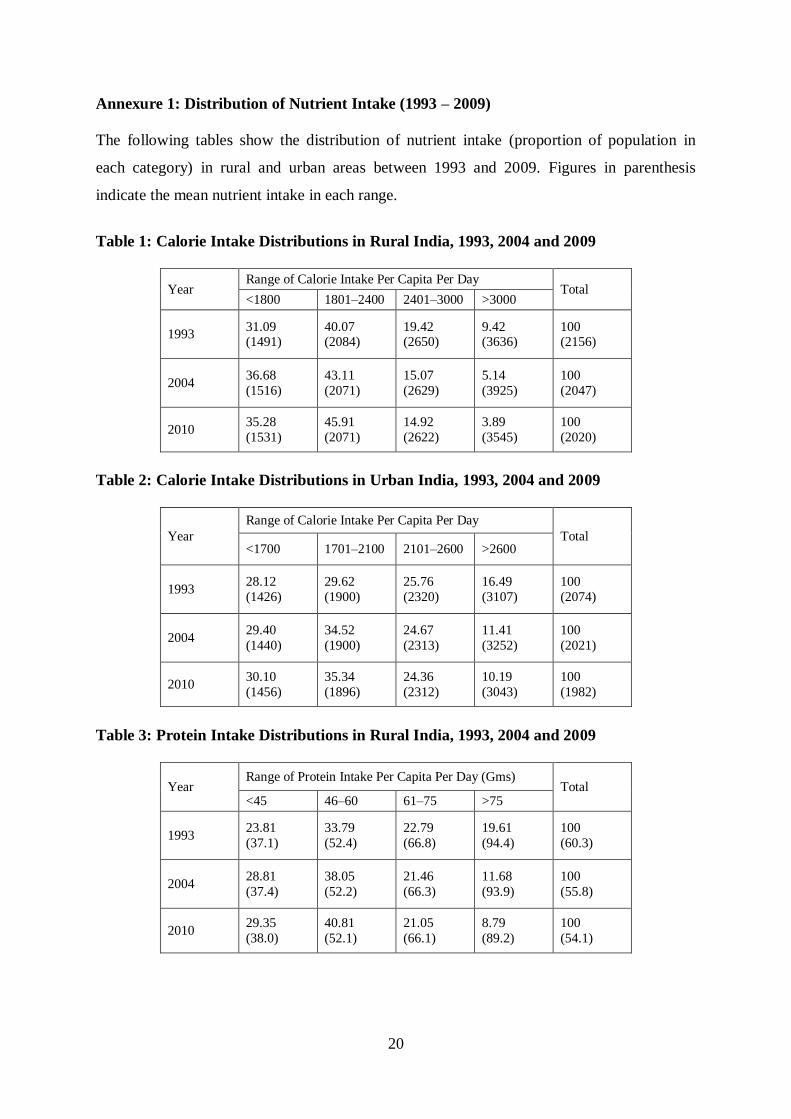
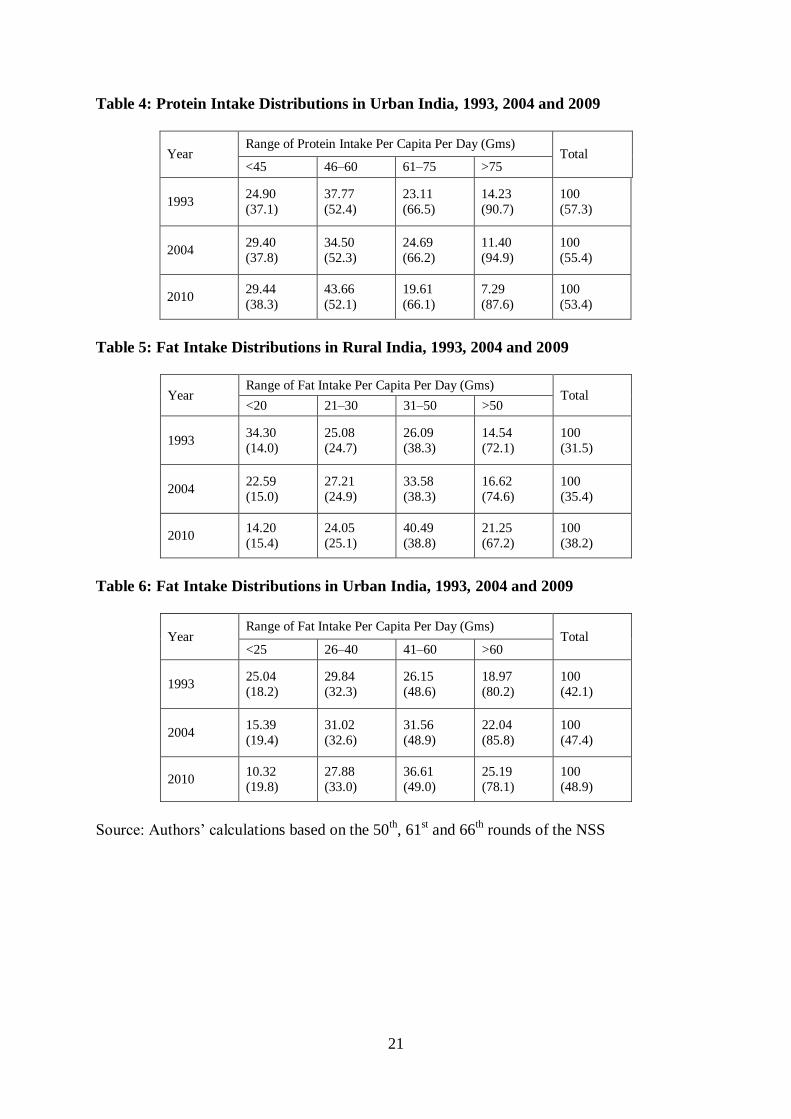
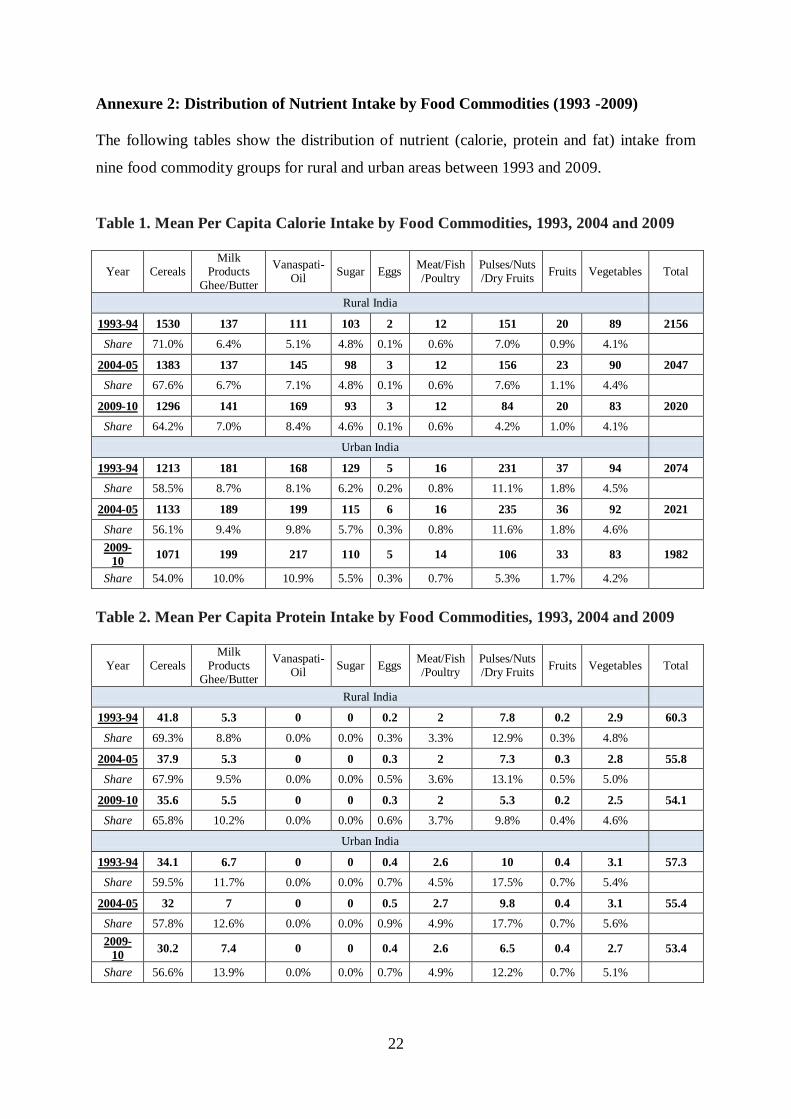
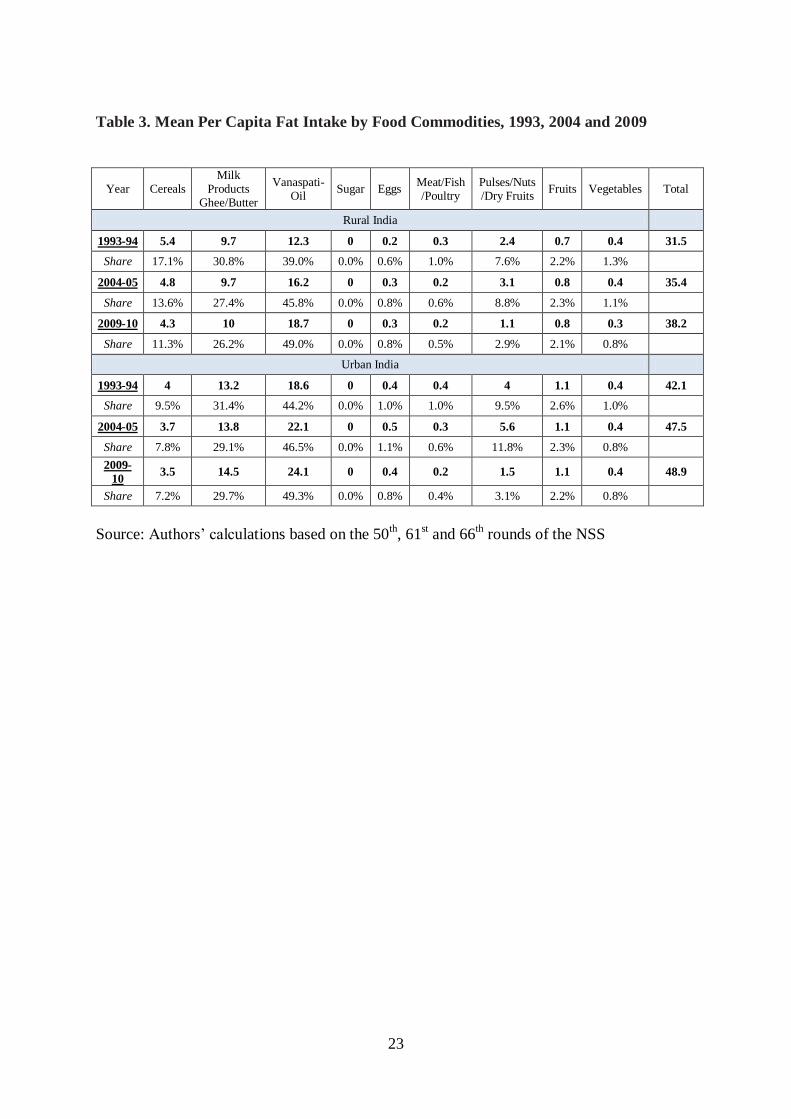
Copyright © 2022 FDOKUMEN