Demand for fish in Asia: a cross-country analysis
18
The Australian Journal of Agricultural and Resource Economics, 52, pp. 321–338 © 2008 The Authors Journal compilation © 2008 Australian Agricultural and Resource Economics Society Inc. and Blackwell Publishing Asia Pty Ltd doi: 10.1111/j.1467-8489.2008.00418.x Blackwell Publishing Ltd Oxford, UK AJAR Australian Journal of Agricultural and Resource Economics 1364-985X 1467-8489 © 2008 The Authors Journal Compilation © 2008 Australian Agricultural and Resource Economics Society Inc. and Blackwell Publishers Ltd XXX ORIGINAL ARTICLES Demand for fish in Asia M.M. Dey et al. Demand for fish in Asia: a cross-country analysis* Madan Mohan Dey and Yolanda T. Garcia with Praduman Kumar, Somying Piumsombun, Muhammad Sirajul Haque, Luping Li, Alias Radam, Athula Senaratne, Nguyen Tri Khiem and Sonny Koeshendrajana † Fish demand patterns in nine Asian countries were investigated using a multistage budgeting framework allowing a disaggregated approach to analysing fish consump- tion. This paper highlights the heterogeneity of fisheries products in terms of species, sources and cultural responses of consumers, factors that are important in fish demand under the Asian setting. Specifically, fish demand by income groups were compared to determine how the low- and high-income households respond to price and income changes. Results showed that the estimated price and income elasticities of all fish types included in the study were relatively more elastic among the poorer households. Key words: Asia, fish demand, inverse Mills ratio, multistage budgeting framework, price and income elasticity, quadratic AIDS model. 1. Introduction Fish is an important economic commodity in Asia. About 61 per cent of the world supply of fish comes from this region where a large proportion of it is * The authors wish to acknowledge the financial support from Asian Development Bank and the WorldFish Center for the conduct of this study. Special thanks are accorded to Mr Ferdinand J. Paraguas, Ms Sheryl M. Navarez and Ms Oai Li Chen for their excellent research support and Dr Rhoelano Briones for his insightful comments about the model specification. † Madan Mohan Dey (email: [email protected]) is a professor in the Aquaculture/Fisheries Department, University of Arkansas at Pine Bluff, USA, and a senior research fellow of The WorldFish Center, Penang, Malaysia; Yolanda T. Garcia (email: [email protected]) is an associate professor in the department of economics, University of the Philippines at Los Baños, Laguna, Philippines; both the major authors were with The WorldFish Center during the preparation of this paper. Praduman Kumar, former professor, Division of Agricultural Economics, Indian Agricultural Research Institute, New Delhi, India; Somying Piumsombun, Department of Fisheries, Ministry of Agriculture and Cooperative, Bangkok, Thailand; Muhammad Sirajul Haque, Department of Economics, University of Chittagong, Chittagong, Bangladesh; Luping Li, Center for Chinese Agricultural Policy, Chinese Academy of Sciences, Beijing, China; Alias Radam, Faculty of Economics and Management, Universiti Putra Malaysia, Selangor, Malaysia; Athula Senaratne, formerly with the National Aquaculture Development Authority , Colombo, Sri Lanka; Nguyen Tri Khiem, Dean and Professor, Faculty of Economics, An Giang University, Vietnam; and Sonny Koeshendrajana, Ministry of Marine Affairs and Fisheries, Jakarta, Indonesia.
-
Upload
independent -
Category
Documents
-
view
1 -
download
0
Transcript of Demand for fish in Asia: a cross-country analysis

The Australian Journal of Agricultural and Resource Economics
, 52, pp. 321–338
© 2008 The AuthorsJournal compilation © 2008 Australian Agricultural and Resource Economics Society Inc. and Blackwell Publishing Asia Pty Ltddoi: 10.1111/j.1467-8489.2008.00418.x
Blackwell Publishing LtdOxford, UKAJARAustralian Journal of Agricultural and Resource Economics1364-985X1467-8489© 2008 The AuthorsJournal Compilation © 2008 Australian Agricultural and Resource Economics Society Inc. and Blackwell Publishers LtdXXX
ORIGINAL ARTICLES
Demand for fish in AsiaM.M. Dey
et al
.
Demand for fish in Asia: a cross-country analysis*
Madan Mohan Dey and Yolanda T. Garcia with Praduman Kumar, Somying Piumsombun, Muhammad
Sirajul Haque, Luping Li, Alias Radam, Athula Senaratne, Nguyen Tri Khiem and Sonny Koeshendrajana
†
Fish demand patterns in nine Asian countries were investigated using a multistagebudgeting framework allowing a disaggregated approach to analysing fish consump-tion. This paper highlights the heterogeneity of fisheries products in terms of species,sources and cultural responses of consumers, factors that are important in fish demandunder the Asian setting. Specifically, fish demand by income groups were comparedto determine how the low- and high-income households respond to price andincome changes. Results showed that the estimated price and income elasticities ofall fish types included in the study were relatively more elastic among the poorerhouseholds.
Key words:
Asia, fish demand, inverse Mills ratio, multistage budgeting framework, price and income elasticity, quadratic AIDS model.
1. Introduction
Fish is an important economic commodity in Asia. About 61 per cent of theworld supply of fish comes from this region where a large proportion of it is
* The authors wish to acknowledge the financial support from Asian Development Bankand the WorldFish Center for the conduct of this study. Special thanks are accorded to MrFerdinand J. Paraguas, Ms Sheryl M. Navarez and Ms Oai Li Chen for their excellent researchsupport and Dr Rhoelano Briones for his insightful comments about the model specification.
†
Madan Mohan Dey (email: [email protected]) is a professor in the Aquaculture/FisheriesDepartment, University of Arkansas at Pine Bluff, USA, and a senior research fellow of TheWorldFish Center, Penang, Malaysia; Yolanda T. Garcia (email: [email protected]) is anassociate professor in the department of economics, University of the Philippines at LosBaños, Laguna, Philippines; both the major authors were with The WorldFish Center duringthe preparation of this paper. Praduman Kumar, former professor, Division of AgriculturalEconomics, Indian Agricultural Research Institute, New Delhi, India; Somying Piumsombun,Department of Fisheries, Ministry of Agriculture and Cooperative, Bangkok, Thailand;Muhammad Sirajul Haque, Department of Economics, University of Chittagong, Chittagong,Bangladesh; Luping Li, Center for Chinese Agricultural Policy, Chinese Academy of Sciences,Beijing, China; Alias Radam, Faculty of Economics and Management, Universiti PutraMalaysia, Selangor, Malaysia; Athula Senaratne, formerly with the National AquacultureDevelopment Authority , Colombo, Sri Lanka; Nguyen Tri Khiem, Dean and Professor, Facultyof Economics, An Giang University, Vietnam; and Sonny Koeshendrajana, Ministry ofMarine Affairs and Fisheries, Jakarta, Indonesia.

322 M.M. Dey
et al.
© 2008 The AuthorsJournal compilation © 2008 Australian Agricultural and Resource Economics Society Inc. and Blackwell Publishing Asia Pty Ltd
consumed domestically. Per capita consumption in Asia averaged to about27 kg annually, which is higher than the world’s average of 18 kg. Across theregion, per capita consumption varies significantly ranging from 63 kg/yearin the case of Japan (Delgado
et al
. 2003) to only 4.5 kg/year in India whereonly one-third of the population are fish-eaters (Dey
et al
. 2005). The growthin fish consumption in Asia over the last decade had been increasing at notablerates. A large part of this increase was attributed mainly to populationgrowth, urbanisation and expansion in per capita income that are currentlybeing experienced in the region.
Responses of fish demand to changes in prices and incomes are importantin analysing the effects of any technological change, infrastructure developmentor economic policy on future production, consumption and trade of variousfisheries products. While many past researches on fish demand have treatedfish as a single commodity in the consumer food basket, recent studies haveevolved into more disaggregated analyses (Wessells and Wilen 1993; Dey2000; Garcia
et al
. 2005). The intention is to capture short-term responses ofspecies-specific markets to price and non-price factors, a feature that doesnot lend easily from using aggregated data.
Since the market for fishery products is rapidly gaining competitivenessboth at the domestic and international scene, more detailed and disaggregatedmarket analyses are often needed due to the following reasons: (i) fishgenerally come from different production environments, that is, aquaculturevs. capture and freshwater vs. marine fisheries; (ii) fish preferences varyaccording to type of consumers, that is, rural vs. urban consumers, and poorvs. non-poor households; and (iii) fish trade is often differentiated accordingto market destinations, that is, domestic vs. international channels. The effectof these factors are often useful to stakeholders in the fishery sector, forexample, fishermen, fish farmers, traders and consumers, in assessing marketsensitivity to new developments in the sector. For example, as the role ofAsian aquaculture becomes more important in the global supply of fish, themarket responses of various aquaculture species grown in the region haveimportant implications in technology development, species selection, welfareeffects (in terms of consumption and livelihood); and foreign exchange earnings.
The present study aims to address the need to recognise fish as a heterogeneousproduct especially in analysing market structure and policy effectiveness inthe fishery sector. This is particularly important in Asia, since unlike in manywestern and developed countries where processed and value-added fishproducts are popular, consumers in the region generally prefer whole and livefish including choice-cuts like head, belly, roe, etc. Often, consumer preferenceis based on fish characteristics such as size, freshness, colour, flesh qualityand taste. However, existing demand studies in Asia have mostly treated fishas a single commodity. Sadly such an approach obscures the tremendousheterogeneity of fishery products in terms of fish types/species, productionsource and consumer preferences, thus blunting the usefulness of mostdemand analyses pertaining to the sector.

Demand for fish in Asia 323
© 2008 The AuthorsJournal compilation © 2008 Australian Agricultural and Resource Economics Society Inc. and Blackwell Publishing Asia Pty Ltd
This study is focused on the estimation of demand price and incomeelasticities for major fish groups that are commonly found in Asia. In thispaper, the term ‘fish’ refers to finfish (both fresh and processed) and non-finfish,for example, shrimps, crabs, bi-valves, squids and other aquatic products.Section 2 of the paper is devoted to the model used in the analysis. Section 3discusses the cross-country comparison of consumption and the estimatedown-price and income elasticities for various fish types derived from theempirical demand model. Furthermore, this section is focused on how theelasticity estimates behaved at different levels of household income. The finalsection presents some policy implications of the results of the study.
2. Model and estimation procedure
A multistage budgeting framework was used in this paper to model the fishconsumption behaviour of Asian households. The study built on the frameworkused by Deaton and Muellbauer (1980), Blundell
et al
. (1993) and Heien andWessells (1990) which extended the idea of exhaustive expenditure system todifferent levels or stages. Specifically, the present model was similar to theapproach employed by Dey (2000) and Garcia
et al
. (2005) in their earlierfish demand studies for Bangladesh and Philippines, respectively. These twopapers were largely instrumental in the development of the current study.
The multistage budgeting technique addresses a common problem inempirical estimation of system demand models requiring a sizeable numberof equations, given the wide variety of consumption goods jointly purchasedby households (Thomas 1987; Blundell
et al
. 1993; Mustapha
et al
. 1994; Fan
et al
. 1995; Tiffin and Tiffin 1999). Specifically, a full demand system containingall consumer goods warrants a huge number of own- and cross-price param-eters that are impractical to estimate under the constraint of limited data.Hence, the solution is to estimate the model in stages, whereby expenditureson goods belonging to broad food categories are incorporated in the modelby estimating them sequentially.
In this study, a three-stage budgeting framework was adopted to enable thespecification of a fish demand system in the final stage that is species-specific,while keeping the number of equations in the demand system manageable.Per capita expenditure functions (for food and subsequently for fish) werespecified at the initial two stages of the model. While the quadratic extensionof the Deaton and Muellbauer’s linear approximate AIDS model (1980),suggested by Banks
et al
. (1997), hereinafter referred to as the QUAIDSmodel was formulated at the final stage.
Stage 1 of the model assumes that households allocate consumptionexpenditures to broad groupings such as food and non-food commoditieswhich in turn are affected by income and some demographic characteristicsof the household. The food expenditure (FD) function is specified as follows:
(1)FD f(PF, PNF, , , )= Y Y Z2

324 M.M. Dey
et al.
© 2008 The AuthorsJournal compilation © 2008 Australian Agricultural and Resource Economics Society Inc. and Blackwell Publishing Asia Pty Ltd
The price index for food (PF) was computed as the geometric mean offood prices (
Σ
W
j
ln
P
j
), where
W
j
is the share in total food expenditure of the
j
th commodity and
P
j
is the price. Due to data constraints, the per capitaexpenditure for non-food commodities was used as a proxy variable for theprice index for non-food commodities (PNF). This proxy variable takes intoaccount the ‘income effect’ of the changes in PNF. Equation (1) furtherassumes that the ‘substitution effect’ between food and non-food commoditiesis negligible.
The income variable (
Y
) was included in the model in both linear andsquared forms. The quadratic income term (
Y
2
) aims to capture the possiblenon-linearity in food consumption behaviour of households with respect toincome. The variable
Z
represents the vector of household characteristics toaccount for demographic factors that may affect consumption such as familysize, number of children and urbanity of residence.
The fish expenditure (FS) equation in stage 2 was specified as a function ofthe prices of various types of food commodities, such as cereal, fish, meat,poultry products, pulses, vegetables and beverages and is defined as follows:
(2)
Variable
P
is a vector of prices of the various food commodities listed abovewhile
Z
is a vector of demographic variables similar to those defined inEquation (1). To incorporate the effect of the food expenditure variable fromstage 1, the predicted value of FD was included in Equation (2) as aninstrumental variable. The squared term FD*
2
was also added to capture thenon-linearity in fish consumption which is similarly assumed to exhibit acertain threshold level.
The QUAIDS model for specific fish types is specified in stage 3 as a systemof equations where the budget share of each fish type (
W
i
) is expressed as afunction of fish prices (PF), predicted fish expenditures (FS*) from stage 2and some demographic characteristics of households (
Z
). The QUAIDSmodel is expressed as follows:
(3)
The linear approximate form of the model is achieved by deflating thepredicted fish expenditure variables (FS* and FS*
2
) by
P
* which is thehousehold-specific Stone’s price index for fish (where log
P
* =
Σ
k
W
k
log
P
k
for
k
number of goods). Stone index allows the empirical approximation ofthe non-linear AIDS model (with translog price index) to be linearly estimated.However, a number of papers (e.g. Moschini 1995; Asche and Wessels 1997)have indicated that Stone index is not invariant to changes in units ofmeasurements and its application introduces measurement errors. Asche andWessels (1997) have suggested normalisation of prices to 1.0 as a solution tothis problem, but this approach holds only at a particular point. Given that
FS f FD FD ( , *, * , )= P Z2
W P P Zi i / *, , )= f(PF, FS*/ *, FS* IMR2

Demand for fish in Asia 325
© 2008 The AuthorsJournal compilation © 2008 Australian Agricultural and Resource Economics Society Inc. and Blackwell Publishing Asia Pty Ltd
our aim is to use QUAIDS to estimate elasticities for different economicgroups, we have used Stone’s price index which may not be problematic forour dataset.
1
Aside from capturing the non-linearity condition in consumption (assuggested, for example, by Blundell
et al
. 1993; Dickens
et al
. 1993), thequadratic expenditure term (FS*
2
) also relaxes the equality restrictionimposed by linear demand functions regarding the allocation of marginalexpenditures for various fish types among rich and poor households. Such anassumption limits the classification of certain fish types into either necessityor luxury commodities and denies the possibility that some fish types may beconsidered luxuries at low level of incomes but can become necessities athigher level of incomes (Banks
et al
. 1997; Beach and Holt 2001).The QUAIDS model also assumes that fish is weakly separable from all the
other food categories included in the model, such as cereals, meat, poultryproducts, fruits, vegetables, and beverages. The separability assumption isnecessary to satisfy the condition for estimating the demand model in amultistage budgeting framework (Eales and Unnevehr 1988; Jorgenson
et al
.1988; Yen and Roe 1989; Michalek and Keyzer 1992). Specifically, demandseparability requires the ordering of the marginal utilities derived from theconsumption of fish commodities to be independent from those derived fromconsuming other food commodities especially those from alternative sourcesof animal protein like dairy and meat products.
The inverse Mills ratios (IMRs) are also incorporated in the model tocorrect for the possible bias created by the presence of zero consumption forcertain fish types (Heckman 1979; Cheng and Capps 1988; Heien andWessells 1990; Byrne
et al
. 1996). Zero consumption results when householdsreport no consumption due to either abstention or corner solution in thehousehold’s utility maximisation problem (Shonkwiler and Yen 1999; Peraliand Chavas 2000). Corner solution results when consumers cannot affordto pay the price of certain high-value fish types given budget constraintswhile abstention may be due to non-preference or infrequent purchases. Bothcases render the share in expenditure
W
i
to zero. In this paper, the correctionof the sample selection bias resulting from the presence of numerous zeroconsumption of certain fish types was done either through the use of theHeckman (1979) two-step procedure in estimating the IMRs for specific fishtypes or through the Tobit specification of the fish expenditure function instage 2.
Using the parameter estimates of the QUAIDS model, the uncompensatedprice elasticities for the different fish types are estimated as follows:
(4)
1
Fish prices were measured as USD/kg, which is more or less a ‘universal’ unit for this kindof study.
ξij ij i i i j i ijb W c c W W k ( / ) { ln( )}( / ) = − + −1 22 FS

326 M.M. Dey
et al.
© 2008 The AuthorsJournal compilation © 2008 Australian Agricultural and Resource Economics Society Inc. and Blackwell Publishing Asia Pty Ltd
where
k
ij
is the Knonecker delta which is equal to 1 for own-price elasticityand zero for cross-price elasticity;
W
i
is the consumption share of the
i
th fishtype; while
b
i
and
c
i
are parameter estimates of the QUAIDS model. On theother hand, the fish expenditure elasticity
η
i
of the individual fish type isgiven by the following formula:
(5)
The income elasticity, for a specific fish species is then computed as thejoint product of food expenditure elasticity
η
FD
from stage 1, fish expenditureelasticity
η
FS
with respect to food from stage 2, and fish expenditure elasticityfor the individual fish type, i.e.
(6)
The price and income elasticities of fish demand for the poor and non-poorhouseholds is computed by substituting the specific income level of theparticular household group in the elasticity formula. This technique impliesthat only one set of demand parameters needs to be estimated from the globalsample to arrive at elasticity estimates of different income groups. Suchsegmented approach to elasticity measurement is more useful in analysingconsumer demand as compared to using ‘average’ estimates for the wholepopulation especially when significant variation in demand responses areexpected from various income groups (Park
et al
. 1996).
3. Sources of data
The data used in this paper were from a study conducted by the WorldFishCenter entitled ‘Strategies and Options for Increasing and Sustaining Fisheriesand Aquaculture Production to Benefit Poor Households in Asia’ led by theprincipal author of the paper with funding from the Asian DevelopmentBank. This project was implemented in nine Asian countries, namely:Bangladesh, China, India, Indonesia, Malaysia, Philippines, Sri Lanka,Thailand and Vietnam from 2001–2004. Fish consumption data wereobtained mainly from the municipal or national household consumptionsurveys conducted either by the project or statistical bureaus of partnercountries, respectively (Appendix Table A1). Primary surveys were conductedwhenever fish consumption by species is not available in the nationalsurvey.
Since there was wide variation in fish classifications found in the respectivecountry data (each containing 6–11 fish types), some degree of aggregationwas employed to facilitate cross-country comparison of species-specificelasticities. Seven broad categories were adopted in the study, which includedfour types of finfish, two types of non-finfish and one category for processedfish (Appendix Table A2).
ηi i i ic c W ( ln( )/ ) = + +1 22 1FS
ηiY
η η η ηiY
i ( )( )( )= FD FS

Demand for fish in Asia 327
© 2008 The AuthorsJournal compilation © 2008 Australian Agricultural and Resource Economics Society Inc. and Blackwell Publishing Asia Pty Ltd
4. Results and discussion
Table 1 presents the allocation of consumption expenditures to various fooditems commonly purchased by Asian households. Cereals generally contributethe largest share ranging from 24 to 38 per cent across the nine countries.This is immediately followed by the shares of meat (ranging from 3 to 26 percent) and fish (5–21 per cent). These results highlight the important role offish in the animal-protein intake of most Asian households.
Moreover, the proportion of the budget spent on fish is larger for consumersbelonging to the higher income group (ranging from 8 to 21 per cent)compared to the lower income group (ranging only from 5 to 16 per cent).Similarly, the share of fish expenditure was found to be higher in the urbanareas (6–32 per cent) compared to the rural areas (3–15 per cent). Expectedly,these results suggest that increasing affluence and urbanisation can potentiallyincrease the consumption of fish and fishery products.
Table 1 also presents the share of each fish group in total fish expenditureacross countries. The share of freshwater species was found to be consistentlyhigher than that of the marine species except in the case of Malaysia andPhilippines. This emphasises the relative preference of most Asian house-holds for freshwater species, especially for those living in deltaic countrieswith abundant inland waters like Bangladesh, India, China, Vietnam andThailand. On the other hand, for countries with long coastlines like thePhilippines and Malaysia, marine species appeared to dominate householdfish consumption. These results imply that geographical factors seemed tomold the preference of fish consumers.
Processed fish appeared to be an important component of fish expenditure(averaging 10 per cent), especially among Indonesian and Philippinehouseholds where expenditure shares reaching 22 per cent in both countries.This could be explained by the abundant supply of marine fish in thesecountries due to their archipelagic geology thus encouraging a culture for fishprocessing.
Expenditure shares of non-finfish such as shrimp, other crustaceans andmolluscs were found to be low, generally less than 10 per cent except inChina, Bangladesh and Thailand. High expenditure shares for these speciescould be related to the fast growth of cultured species (especially shrimp) inthese countries making them easily accessible and affordable.
The estimated parameters of the country QUAIDS model were notpresented in this paper for brevity but will be available from the authorsupon request. To capture the effect of income on fish demand, country datawere partitioned into quintile groups before price and income elasticitieswere estimated. The own-price elasticities of fish demand by major fish typesand income groups are presented in Table 2. The elasticity estimates areexpressed as weighted averages of various fish species under specific fish types(i.e. high-value vs. low-value) by using the shares of specific fish species/groupin the total fish expenditure as weights. Although elasticity estimates for all

328M
.M. D
ey
et al.
© 2008 T
he Authors
Journal compilation ©
2008 Australian A
gricultural and Resource E
conomics Society Inc. and B
lackwell P
ublishing Asia P
ty Ltd
Table 1
Share of food/fish expenditure to total budget by country, income group and geographic location, 2004
Food item Bangladesh China India Indonesia Malaysia Philippines Sri Lanka Thailand Vietnam Average
Food share in total expendituresCereals 38 24 32 24 24 33 23 31 34 29Meat 12 26 6 3 15 13 14 22 20 14.5Fish 20 5 6 9 21 14 11 16 19 13.5Others 30 45 56 64 40 40 52 31 27 43Total share 100 100 100 100 100 100 100 100 100 100
Fish share by income groupLowest – – 5 – – 16 – 15 15 13Highest – – 8 – – 12 – 18 21 15
Fish share by locationRural 10 3 7 – 15 – – – – 9Urban 21 7 6 – 32 – – – – 16
Fish share by speciesFreshwater fish 71 40 62 42 7 28 69 43 68 48
High-value 25 4 49 – 2 15 69 22 27 26Low-value 46 36 13 42 5 13 – 21 41 27
Marine fish 13 35 29 30 81 41 29 16 27 33High-value 1 17 8 13 10 23 21 8 4 12Low-value 12 18 21 17 71 18 8 8 23 22
Non-finfishShrimp 14 13 5 6 5 4 – 9 2 7
Crustaceans/molluscs – 12 4 – 7 5 – 23 – 10Processed fish
Dried fish 2 – – 22 – 22 2 9 3 10Total 100 100 100 100 100 100 100 100 100 100
– Not available.Data were based on ADB-RETA 5945 Country Reports.

Dem
and for fish in Asia
329
© 2008 T
he Authors
Journal compilation ©
2008 Australian A
gricultural and Resource E
conomics Society Inc. and B
lackwell P
ublishing Asia P
ty Ltd
Table 2
Own-price elasticities of major fish groups across countries, 2004
Fish Types Bangladesh China India Indonesia Malaysia Philippines Sri Lanka Thailand Vietnam All
Freshwater fishHigh-value –1.22 –0.29 –0.99 – –0.98 –2.14 –1.08 –0.13 –0.90 –0.97Low-value –0.96 –0.39 –0.99 –0.94 –1.08 –1.58 – –0.76 –1.23 –0.99
Marine fishHigh-value –1.92 –0.44 –0.98 –1.40 –0.91 –1.61 –0.98 –0.60 –1.04 –1.10Low-value –0.88 –0.95 –1.03 –0.27 –1.12 –1.34 –0.85 –1.28 – –0.96
Non-finfishShrimp –1.00 –0.46 –0.99 –1.04 –0.89 –0.95 – –0.64 –4.25 –1.28Others – – –1.00 – –0.99 –0.79 – – – –0.93
Processed fish – – – –0.72 – –1.33 –0.85 –0.66 – –0.89Average –1.01 –0.46 –0.92 –0.84 –1.07 –1.51 –1.04 –0.46 –1.12 –0.94Lowest income group
Freshwater fishHigh-value –2.02 – –0.99 – –1.46 –3.61 –1.06 –0.16 –0.88 –1.45Low-value –1.08 – –0.99 –0.89 –1.08 –1.87 – –0.75 –1.74 –1.20
Marine fishHigh-value –2.78 – –0.62 –1.45 –0.58 –1.48 –0.96 –0.61 –0.94 –1.26Low-value –1.04 – –0.96 –0.37 –1.12 –1.30 –0.84 –1.20 – –0.98
Non-finfishShrimp –0.98 – –0.96 –1.06 –1.24 –0.92 – –0.66 –2.21 1.18Others – – –1.01 – –1.08 –0.87 – – – –0.98
Processed fish –0.40 – – –0.84 – –1.19 –0.86 –0.62 – –0.78Average –1.29 – –0.95 –0.87 –1.07 –1.70 –1.02 –0.46 –1.03 –1.06Highest income group
Freshwater fishHigh-value –1.08 – –0.99 – –0.97 –1.46 –1.15 –0.36 –0.90 –0.99Low-value –0.83 – –0.99 –0.94 –1.08 –1.40 – –0.70 –0.92 –0.98
Marine fishHigh-value –1.49 – –0.97 –1.35 –0.91 –1.73 –0.98 –0.64 –1.09 –1.17Low-value –0.80 – –0.94 –0.10 –1.12 –1.48 –0.79 –1.32 – –0.94
Non-finfishShrimp –1.04 – –1.00 –1.02 –0.89 –1.00 – –0.74 –3.06 –1.25Others – – –0.99 – –0.99 –0.70 – – – –0.89
Processed fish –0.40 – – –0.56 – –1.51 –0.83 –0.71 – –0.80Average –0.92 – –0.98 –0.77 –1.07 –1.47 –1.08 –0.52 –0.72 –0.94
The item ‘others’ under non-finfish category refers to crustaceans and molluscs.Data were based on ADB-RETA 5945 Country Reports.

330 M.M. Dey
et al.
© 2008 The AuthorsJournal compilation © 2008 Australian Agricultural and Resource Economics Society Inc. and Blackwell Publishing Asia Pty Ltd
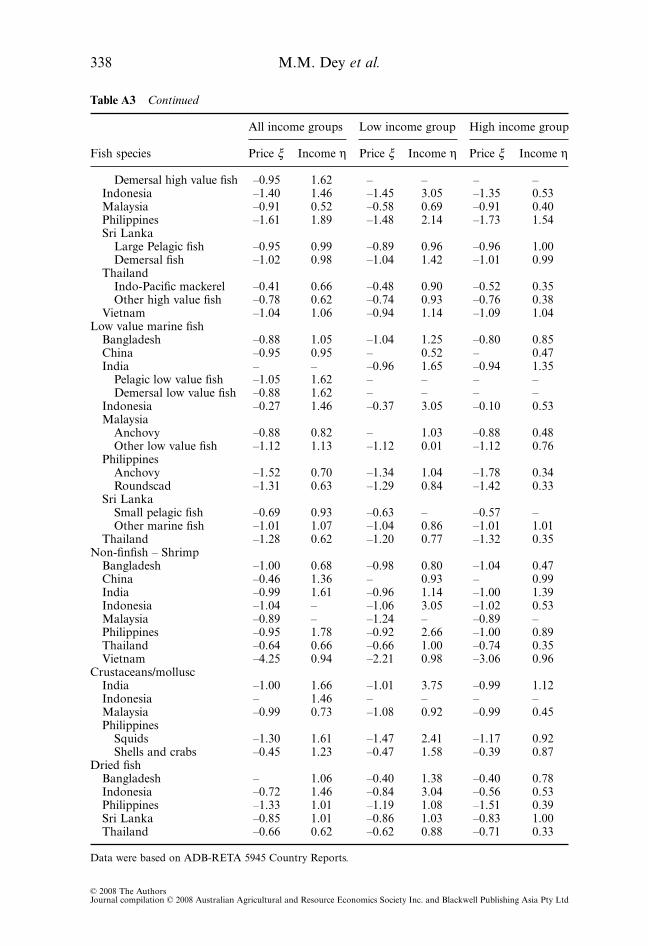
quintile groupings were generated for each country model, comparisons weremade only between the two extreme groups, that is, first vs. fifth quintileswhich were used to represent the lowest and highest income groups,respectively. Elimination of the three middle quintiles allowed the study for amore dramatic comparison of elasticity differences between the poor and thenon-poor households. Individual elasticity estimates by species, countriesand income groups are presented in Appendix Table A3. Note that thecross-price elasticities of the various fish species/groups were also estimatedin the country models but were similarly not presented. Estimates, however,can also be requested from the authors.
On average, the own-price elasticities were found to vary widely across fishtypes ranging from –0.13 to –4.25, demonstrating the heterogeneity of fishdemand in the region. Except for the high-value marine fish (e.g. large pelagicand demersal species), and shrimp, all the other fish types were found to haveaverage elasticities less than 1, implying that the demand for fish is generallyinelastic. These results are consistent with those observed by Asche
et al
.(2007) where high-value fish species tend to have more elastic demand thanlow-value species. Specifically, the observed inelastic demand, especiallyfor the low-value fish groups suggests that most Asian households aregenerally less responsive to changes in prices for these fish types. This can beexplained by the relative importance of fish in the Asian diet contributingabout 37 per cent to the total animal protein intake in most households(Dey et al. 2005).
Furthermore, the own-price elasticity of fish demand was observed to belower among households with higher incomes. Specifically, the averageelasticities of the various fish categories were generally found to be lower forthe highest income group as compared to the lowest income group. Thesesuggest that the poorer households consider fish as an elastic commoditywhile their more affluent counterparts regard it as an inelastic good. Further-more, these imply that the poorer households tend to exhibit more demandresponsiveness given changes in fish prices than the richer households. Moreimportantly, price elasticity seems to move from elastic to inelastic ashouseholds go up the income bracket. This result is important since itemphasises the flexibility in fish demand of the Asian poor in absorbingpotential supply expansions in the market. Note that this observation is con-sistent with most demand studies for various food commodities available inthe literature, for example, rice (Senauer 1990), rice and cassava (Timmer andAlderman 1979) and fish (Park et al. 1996).
While the highest income group exhibited inelastic demand for most of thefish types, the elasticities for high-value species were surprisingly elastic. Onepossible explanation for this is that the high-value species like grouper, tunaand shrimp can have numerous substitutes at their price range in terms ofmeat and other poultry products. Hence, even if the rich households canafford to pay the price of the high-value fish, they tend to respond quickly toany price change, thus rendering this subgroup to be price elastic.
Demand for fish in Asia 331
© 2008 The AuthorsJournal compilation © 2008 Australian Agricultural and Resource Economics Society Inc. and Blackwell Publishing Asia Pty Ltd
It is interesting to note that among the low-income households, whileaverage elasticities were found to be mostly greater than 1, the cheaper fish typessuch as the low-value marine fish (e.g. anchovy, roundscad, small pelagic anddemersal species), crustaceans/molluscs and dried fish were found to beprice inelastic. This can be explained in two ways. First, the low-value fishis the cheapest form of animal protein that is affordable for the poor. Second,since the price is generally low, there is limited number of substitutes for fishas protein source at that price range, thus making the low-value fish inelastic.
The estimated income elasticities for fish demand by income groups arepresented in Table 3. Based on these tables, income elasticities for all the fishtypes yielded positive values suggesting that fish in general (whether fresh orprocessed) is considered as a normal good by all households in the region,whether rich or poor.
All country income elasticities, on average, were found to be elastic withvalues ≥1. This implies that fish is generally considered as a luxury good byAsian consumers. On average, freshwater fish (both low- and high-value)were found to have lower income elasticities than their marine counterpartsuggesting less variability in demand as income rises. This reiterates thepreference of most Asian households for freshwater fish species.
With respect to income groups, average income elasticities for all fish typeswere found to be elastic for the low-income households with values rangingfrom 1.25 to 2.19. Conversely, the high-income households yielded inelasticvalues for all the fish types ranging from 0.61 to 0.90. Note that similar to thecase of price elasticities, the trend in income elasticities took the same trendof shifting from elastic to inelastic as households go up the income ladder.This suggests that fish consumption among the poorer households respondsmore to income changes than the richer households. Hence, as countries inAsia become more successful in their drive towards poverty alleviation, moredemand for fish can be expected to come from the low-income householdswhich comprised the bulk of the Asian population.
Among the high-income households, except for Malaysia, the high-valuespecies tend to exhibit higher income elasticities than the low-value speciesespecially for the marine subgroup. A similar trend is observable among thelow-income households. This means demand for high-value fish becomesmore unstable in the face of rising incomes. This could similarly be related tothe wide variety of choices available to consumers at the upper price range,thus making demand more volatile when income increases. On the contrary,the elasticity of high-value fish in Malaysia was found to be lower than thelow-value species. This is expected since Malaysia is one of countries in Asiawith very high per capita fish consumption.
5. Conclusion and policy implication
Two important results emerged from this analysis. First, fish is clearly aheterogenous product, as shown by the wide variability in the estimated

332M
.M. D
ey et al.
© 2008 T
he Authors
Journal compilation ©
2008 Australian A
gricultural and Resource E
conomics Society Inc. and B
lackwell P
ublishing Asia P
ty Ltd
Table 3 Income elasticities of major fish groups across countries, 2004
Fish Types Bangladesh China India Indonesia Malaysia Philippines Sri Lanka Thailand Vietnam All
Freshwater fishHigh-value 1.43 0.99 1.62 1.46 0.87 0.57 0.86 0.12 0.99 1.00Low-value 0.91 0.99 1.62 1.46 1.94 0.56 – 0.06 0.66 1.02
Marine fishHigh-value 1.56 1.05 1.62 1.46 0.52 1.89 0.98 0.64 1.06 1.20Low-value 1.05 0.95 1.62 1.46 1.13 0.64 1.00 0.62 – 1.06
Non-finfishShrimp 0.68 1.36 1.61 – – 1.78 – 0.66 0.94 1.17Others – – 1.66 1.46 0.73 1.38 – – – 1.31
Processed fish 1.06 – – 1.46 – 1.01 1.01 0.62 – 1.03Average 1.03 0.92 1.62 1.46 1.12 1.07 0.90 0.26 0.59 1.00Lowest income group
Freshwater fishHigh-value 2.63 0.58 1.63 3.05 1.12 0.14 0.72 0.41 0.99 1.25Low-value 1.15 1.07 1.64 3.05 2.34 0.49 – 0.32 0.66 1.38
Marine fishHigh-value 3.07 0.90 1.14 3.05 0.69 2.14 1.19 0.91 1.14 1.58Low-value 1.25 0.52 1.65 3.05 1.04 0.87 0.86 0.77 – 1.25
Non-finfishShrimp 0.80 0.93 1.14 3.05 – 2.66 – 1.00 0.98 1.51Others – 3.75 – 0.92 1.91 – – – 2.19
Processed fish 1.38 – – 3.04 – 1.08 1.03 0.88 – 1.48Average 0.70 0.66 1.35 0.53 0.68 0.73 1.04 0.13 0.73 0.73Highest income group
Freshwater fishHigh-value 0.94 0.44 1.36 0.53 0.54 0.59 1.05 0.03 0.99 0.72Low-value 0.59 0.77 1.36 0.53 1.18 0.48 – 0.008 0.98 0.74
Marine fishHigh-value 1.00 0.87 1.37 0.53 0.40 1.54 1.00 0.37 1.04 0.90Low-value 0.85 0.47 1.35 0.53 0.76 0.33 1.01 0.35 – 0.71
Non-finfishShrimp 0.47 0.99 1.39 0.53 – 0.89 – 0.35 0.96 0.80Others – – 1.12 – 0.45 0.89 – – – 0.82
Processed fish 0.78 – – 0.53 – 0.39 1 0.33 – 0.61Average 0.70 0.66 1.35 0.53 0.68 0.73 1.04 0.13 0.73 0.73
The item ‘others’ under non-finfish category refers to crustaceans and molluscs.Data were based on ADB-RETA 5945 Country Reports.
Demand for fish in Asia 333
© 2008 The AuthorsJournal compilation © 2008 Australian Agricultural and Resource Economics Society Inc. and Blackwell Publishing Asia Pty Ltd
income and price elasticities of different fish types. This result is importantfor future modelling and analysis of the fisheries sector. Also, it goes without sayingthat past assumptions regarding fish as a single or homogenous commodityis faulty and unrealistic, especially in the case of Asian demand models.
Second, the estimated price and income elasticities for all fish types tend tobe higher among the poorer sector of the economy compared to the moreaffluent members of the society. This implies that the poorer householdsoften consider seafood and fishery products as luxury commodities especiallythe high-value species while the rich simply consider them as basic fooditems. Hence, partitioning the population by income groups allows a betterunderstanding of fish demand responses that are characteristic of the poorand rich consumers.
Both of these results have important policy implications. The analysisshowed that as per capita income and population grow in most Asiancountries, there will be tremendous increases in fish demand that areexpected to come mostly from the poorer sector of the economy. Absence ofcommensurate increases in fish supply will create pressure for fish prices togo up, which will hurt the consumers. This has worrisome consequences onthe protein intake of households, particularly among the poor. A way tocircumvent this welfare loss is to expand fish production, which to date canbe easily addressed through aquaculture. However, increasing fish supply, inturn will exert a downward pressure on the price of fish, which is detrimentalon the part of the fish farmers. Nevertheless, when fish demand is priceelastic, a decline in the price can bring about rising revenues. There is there-fore a need to focus aquaculture expansion to fish species where consumerdemand exhibits elastic responses. This information is important in consideringfuture policies and developments in fishery technology and investment,especially in aquaculture. As highlighted in this study, the consumption oflow-value fish species among the poorer households tends to exhibit the kindof demand response that can trigger beneficial effects to both consumers andproducers in the face of rising production. In such a case, tilapia, carp, catfishand other low value aquaculture species can continue to play an importantrole in Asian aquaculture.
References
Asche, F., Bjorndal, T. and Gordon, D. (2007). Studies in the demand structure for fish andseafood products, in Weintraub, A., Romero, C., Bjorndal, T. and Epstein, R. (eds),Handbook of Operations Research in Natural Resources. Springer, 295–314.
Asche, F. and Wessels, C.R. (1997). On price indices in the almost ideal demand system,American Journal of Agricultural Economics 79, 1182–1185.
Banks, J., Blundell, R. and Lewbel, A. (1997). Quadratic engel curves and consumer demand,Review of Economics and Statistics 79, 527–539.
Beach, R. and Holt, M. (2001). Incorporating quadratic scale curves in inverse demandsystems, American Journal of Agricultural Economics 83, 230–245.
Blundell, R., Pashardes, P. and Weber, G. (1993). What do we learn about consumer demandpatterns from micro data? American Economic Review 83, 570–597.

334 M.M. Dey et al.
© 2008 The AuthorsJournal compilation © 2008 Australian Agricultural and Resource Economics Society Inc. and Blackwell Publishing Asia Pty Ltd
Byrne, P., Capps, O. and Saha, A. (1996). Analysis of food-away-from-home expenditurepatterns for US households, American Journal of Agricultural Economics 78, 614–627.
Cheng, H. and Capps, O. (1988). Demand analysis of fresh and frozen finfish and shellfish inthe United States, American Agricultural Economics Association 70, 533–542.
Deaton, A.S. and Muellbauer, J. (1980). An almost ideal demand system, American EconomicReview 70, 359–368.
Delgado, C., Rosegrant, M., Wada, N., Meijer, S. and Ahmed, M. (2003). Fish to 2020: Supplyand Demand in a Changing World. International Food Policy Research Institute, Washington,D.C. and WorldFish Center, Penang.
Dey, M. (2000). Analysis of demand for fish in Bangladesh, Aquaculture Economics andManagement 4, 65–83.
Dey, M., Rab, M., Paraguas, F., Piumsumbun, S., Bhatta, R., Ferdous, A. and Ahmed, M.(2005). Fish consumption and food security: a disaggregated analysis by types of fish andclasses of consumers in selected Asian countries, Aquaculture Economics and Management 9, 89–111.
Dickens, R., Fry, V. and Pashardes, P. (1993). Non-linearities and equivalence scale, EconomicsJournal 103, 359–368.
Eales, J.S. and Unnevehr, L.J. (1988). Demand for beef and chicken products: separability andstructural change, American Journal of Agricultural Economics 70, 521–532.
Fan, S., Wailes, E.L. and Cramer, G.L. (1995). Household demand in Rural China: a two-stageLES-AIDS model, American Journal of Agriculture Economics 77, 54–62.
Garcia, Y., Dey, M. and Navarez, S. (2005). Demand for fish in the Philippines: a disaggre-gated analysis, Aquaculture Economics and Management 9, 141–168.
Heckman, J. (1979). Sample selection bias as a specification error, Econometrica 47, 153–161.Heien, D. and Wessells, C.R. (1990). Demand system estimation with microdata: a censored
regression approach, Journal of Business and Economic Statistics 8, 365–371.Jorgenson, D.W., Slesnick, D.T. and Stoker, T.M. (1988). Two-stage budgeting and exact
aggregation, Journal of Business and Economic Statistics 6, 313–325.Michalek, J. and Keyzer, M. (1992). Estimation of a two-stage LES-AIDS consumer demand
system for eight EC countries, European Review of Agricultural Economics 19, 137–163.Moschini, G. (1995). Units of measurement and the stone index in demand system estimation,
American Journal of Agricultural Economics 77, 63–68.Mustapha, N., Ghaffar, R.A. and Poerwono, D. (1994). An almost ideal demand system analysis
of fresh fish in Semarang, Indonesia, Journal of International Food and Agribusiness Marketing6, 91–128.
Park, J., Holcomb, R., Raper, K. and Capps, O. Jr (1996). A demand systems analysis of foodcommodities by US households segmented by income, American Journal of AgriculturalEconomics 78, 290–300.
Perali, F. and Chavas, J. (2000). Estimation of censored demand equations from large cross-section data, American Journal of Agricultural Economics 8, 1022–1037.
Senauer, B. (1990). Household behavior and nutrition in developing countries, Food Policy 15,408–417.
Shonkwiler, J.S. and Yen, S. (1999). Two-step estimation of a censored system of equations,American Journal of Agricultural Economics 81, 972–982.
Thomas, R.L. (1987). Applied Demand Analysis. Longman Group Limited, Harlow, England.Tiffin, A. and Tiffin, R. (1999). Estimates of food demand elasticities for Great Britain: 1972–
94, Journal of Agricultural Economics 50, 140–147.Timmer, C.P. and Alderman, H. (1979). Estimating consumption parameters for food policy
analysis, American Journal of Agricultural Economics 61, 982–987.Wessells, C. and Wilen, J. (1993). Economic analysis of Japanese household demand for
salmon, Journal of the World Aquaculture Society 24, 361–378.Yen, S.T. and Roe, T. (1989). Estimation of a two-level demand system with limited dependent
variables, American Journal of Agricultural Economics 71, 85–99.

Dem
and for fish in Asia
335
© 2008 T
he Authors
Journal compilation ©
2008 Australian A
gricultural and Resource E
conomics Society Inc. and B
lackwell P
ublishing Asia P
ty Ltd
Appendix
Table A1 Summary of information regarding fish consumption survey and geographical coverage by countries
CountryType of data Year Coverage
Sample size (households) Data source
Bangladesh Primary 1999 9 out of 64 districts 810 Project surveyChina Panel/
Secondary1997 and 2001
Nationwide (20% of total national sample)
49 508 National Statistics Bureau (Household Expenditure Survey)
India Primary 2002 6 out of 18 fish eating states 591 Project surveyIndonesia Secondary 1999 Nationwide (All 26 provinces) 61 482 Central Bureau of Statistics (Socio-Economic National Survey)Malaysia Secondary 2000 Nationwide (All 13 states) 9 198 National Statistics Bureau (Household Expenditure Survey)Philippines Secondary 2000 Nationwide (All 16 regions) 39 615 National Statistics Office (Family income and expenditure survey)Thailand Panel/
Primary1999 and 2002
10 inland provinces 5 coastal provinces
456 Project survey
Sri Lanka Secondary 1996 Nationwide (All 8 provinces) 19 752 Department of Census and Statistics (Household Income and Expenditure Survey)
Vietnam Primary 2002 13 out of 62 provinces 780 Project survey
Data were based on ADB-RETA 5945 Country Reports.

336M
.M. D
ey et al.
© 2008 T
he Authors
Journal compilation ©
2008 Australian A
gricultural and Resource E
conomics Society Inc. and B
lackwell P
ublishing Asia P
ty Ltd
Table A2 Fish species included in the major fish groupings by source and country, 2004
Fish Types Bangladesh China India Indonesia Malaysia Philippines Sri Lanka Thailand Vietnam
Freshwater fishHigh-value fish
Indian major carp, live fish, hilsa
Grass carp, Crucian carp
Indian major carp
– Freshwater fish
Milkfish Freshwater fish
Snakehead, silver barb
Snakehead, silver barb, high value freshwater fish
Low-value fish
Tilapia, pangas, other carp, freshwater fish
Common carp, silver carp
Common carp, other freshwater fish
Other freshwater fish
Other fish Tilapia – Tilapia, catfish
Tilapia, carp, catfish, low value freshwater fish
Marine fishHigh-value fish
High value marine fish
Yellow croaker, hairtail, marine fish
Pelagic high value fish, demersal high value fish
High value fish
High value fish
Other fresh fish
Large pelagic fish, demersal fish
Indo-Pacific mackerel Other high value fish
High value marine fish
Low-value fish
Low value marine fish
Other fin fish Pelagic low value fish, Demersal low value fish
Low value fish
Anchovy, other fish
Anchovy, roundscad
Small pelagic fish, other marine fish
Other low value fish
Low value marine fish
Non-finfish* Shrimp Shrimp Shrimp, molluscs
Crustaceans Crustaceans, molluscs
Shrimp, squid, crabs and shells
– Shrimp Shrimp
Processed fish Dried fish – – Dried fish, preserve fish
– Preserved fish
Processed fish
Dried fish –
Number of fish types
11 9 9 6 7 10 6 9 10
* Two subcategories of non-finfish were specified in the demand model but there were country data where only one type of non-finfish was present.Source: Data were based on ADB-RETA 5945 Country Reports.

Demand for fish in Asia 337
© 2008 The AuthorsJournal compilation © 2008 Australian Agricultural and Resource Economics Society Inc. and Blackwell Publishing Asia Pty Ltd
Table A3 Price and income elasticities of various fish species belonging to major fish groupingby country and income group, 2004
Fish species
All income groups Low income group High income group
Price ξ Income η Price ξ Income η Price ξ Income η
High value freshwater fishBangladesh
Indian major carp –1.22 1.49 –2.52 3.10 –1.02 0.98Live fish –1.84 1.25 –2.01 1.50 –1.63 0.88Hilsa –0.58 1.38 –0.30 2.09 –0.72 0.84
ChinaCrucian carp –0.29 0.95 – 0.59 – 0.41Grass carp – 1.04 – 0.56 – 0.48Indian (Major carp) –0.99 1.62 –0.99 1.63 –0.99 1.36
Indonesia – 1.46 – 3.05 – 0.53Malaysia –0.98 0.87 –1.46 1.12 –0.97 0.54Philippines (Milkfish) –2.14 0.57 –3.61 0.14 –1.46 0.59Sri Lanka –1.08 0.86 –1.06 0.72 –1.15 1.05Thailand
Snakehead –0.24 0.24 –0.18 0.74 –0.29 0.07Silver barb –0.13 0.09 –0.25 0.39 –0.70 0.01
VietnamSnakehead –0.87 1.00 –0.81 1.00 –0.89 1.00Silverbarb –1.78 0.96 –1.92 0.96 –1.68 0.96
Other high value fish –0.52 0.97 –0.54 0.98 –0.53 0.97Low value freshwater fish
BangladeshTilapia –1.24 0.99 –1.45 1.29 –1.21 0.62Pangas –0.78 0.62 – – – –Other carp –1.08 1.36 –1.70 2.00 –0.97 0.96Assorted small fish –0.80 0.72 –0.82 0.89 –0.75 0.52
China Silver carp –0.39 0.94 – 0.51 – 0.03Common carp – 0.85 – 0.52 – 0.05Freshwater fish – 1.00 – 1.10 – 0.82
IndiaCommon carp –0.99 – – – –Other freshwater fish –0.99 1.62 –0.99 1.64 –0.99 1.36
Indonesia –0.94 1.46 –0.89 3.05 –0.94 0.53Malaysia –1.08 1.94 –1.08 2.34 –1.08 1.18Philippines (Tilapia) –1.58 0.56 –1.87 0.49 1.40 0.48Thailand
Tilapia –0.74 0.05 –0.74 0.30 –0.66 0.001Catfish –0.96 0.12 –0.95 0.43 –0.95 0.03
VietnamCarp –1.28 0.98 –1.21 0.99 –1.20 0.98Catfish –1.04 1.01 –1.05 1.01 –1.03 1.01Tilapia –6.08 0.94 –12.84 0.07 –2.82 0.98
High value marine fishBangladesh –1.92 1.56 –2.78 3.07 –1.49 1.00China 0.55
Hairtail –0.44 0.90 – 0.61 – 0.27Yellow croker – 1.26 – 1.04 – 0.64Marine fish – 1.08 – – – 1.09
India –0.62 1.14 –0.97 1.37Pelagic high value fish –0.99 1.62 – – – –
338 M.M. Dey et al.
© 2008 The AuthorsJournal compilation © 2008 Australian Agricultural and Resource Economics Society Inc. and Blackwell Publishing Asia Pty Ltd
Demersal high value fish –0.95 1.62 – – – –Indonesia –1.40 1.46 –1.45 3.05 –1.35 0.53Malaysia –0.91 0.52 –0.58 0.69 –0.91 0.40Philippines –1.61 1.89 –1.48 2.14 –1.73 1.54Sri Lanka
Large Pelagic fish –0.95 0.99 –0.89 0.96 –0.96 1.00Demersal fish –1.02 0.98 –1.04 1.42 –1.01 0.99
ThailandIndo-Pacific mackerel –0.41 0.66 –0.48 0.90 –0.52 0.35Other high value fish –0.78 0.62 –0.74 0.93 –0.76 0.38
Vietnam –1.04 1.06 –0.94 1.14 –1.09 1.04Low value marine fish
Bangladesh –0.88 1.05 –1.04 1.25 –0.80 0.85China –0.95 0.95 – 0.52 – 0.47India – – –0.96 1.65 –0.94 1.35
Pelagic low value fish –1.05 1.62 – – – –Demersal low value fish –0.88 1.62 – – – –
Indonesia –0.27 1.46 –0.37 3.05 –0.10 0.53Malaysia
Anchovy –0.88 0.82 – 1.03 –0.88 0.48Other low value fish –1.12 1.13 –1.12 0.01 –1.12 0.76
PhilippinesAnchovy –1.52 0.70 –1.34 1.04 –1.78 0.34Roundscad –1.31 0.63 –1.29 0.84 –1.42 0.33
Sri LankaSmall pelagic fish –0.69 0.93 –0.63 – –0.57 –Other marine fish –1.01 1.07 –1.04 0.86 –1.01 1.01
Thailand –1.28 0.62 –1.20 0.77 –1.32 0.35Non-finfish – Shrimp
Bangladesh –1.00 0.68 –0.98 0.80 –1.04 0.47China –0.46 1.36 – 0.93 – 0.99India –0.99 1.61 –0.96 1.14 –1.00 1.39Indonesia –1.04 – –1.06 3.05 –1.02 0.53Malaysia –0.89 – –1.24 – –0.89 –Philippines –0.95 1.78 –0.92 2.66 –1.00 0.89Thailand –0.64 0.66 –0.66 1.00 –0.74 0.35Vietnam –4.25 0.94 –2.21 0.98 –3.06 0.96
Crustaceans/molluscIndia –1.00 1.66 –1.01 3.75 –0.99 1.12Indonesia – 1.46 – – – –Malaysia –0.99 0.73 –1.08 0.92 –0.99 0.45Philippines
Squids –1.30 1.61 –1.47 2.41 –1.17 0.92Shells and crabs –0.45 1.23 –0.47 1.58 –0.39 0.87
Dried fishBangladesh – 1.06 –0.40 1.38 –0.40 0.78Indonesia –0.72 1.46 –0.84 3.04 –0.56 0.53Philippines –1.33 1.01 –1.19 1.08 –1.51 0.39Sri Lanka –0.85 1.01 –0.86 1.03 –0.83 1.00Thailand –0.66 0.62 –0.62 0.88 –0.71 0.33
Data were based on ADB-RETA 5945 Country Reports.
Fish species
All income groups Low income group High income group
Price ξ Income η Price ξ Income η Price ξ Income η
Table A3 Continued