Defining localities for health planning: A GIS approach
16
~ Pergamon 0277-9536(95)00180-8 Soc. Sci. Med. Vol. 42, No. 6, pp. 801-816, 1996 Copyright :t£ 1996 Elsevier Science Ltd Printed in Great Britain. All rights reserved 027%9536/96 $15.00 + 0.00 DEFINING LOCALITIES FOR HEALTH PLANNING: A GIS APPROACH NINA BULLEN, ~GRAHAM MOON 2 and KELVYN JONES I ~Department of Geography, University of Portsmouth, Buckingham Building, Lion Terrace, Portsmouth PO1 3HE, England and 2School of Social and Historical Studies, University of Portsmouth. Milldam, Burnaby Road, Portsmouth PO1 3AS, England Abstract--The National Health Service in Britain is undergoing far-reaching changes. While District and Regional Health Authorities are currently merging, professionals agree that primary health care is most efficientlymanaged at the local level. This paper uses geographical information systems (GIS) capabilities to identify a nested hierarchy of localities for the management of primary health care in West Sussex, England. GIS coverages were developed which contained key criteria for defining local areas, including nodes or focal points of serviceprovision,edges which act as physicalor psychological barriers to movement, districts such as official administrative areas and interaction criteria such as journey to work, school and family doctor (GP) surgeries. Central to the derivation of the localitieswas a large matrix of patient to GP flows based on postcoded data. Once managed, these data revealed clear geographical patterns of patient to GP allegiance.A large-scalefieldsurveyobtained supporting information on the perception of areas from local residents. Key words--health planning, locality, geographical information systems INTRODUCTION The purpose of this paper is to show how Geographical Information Systems (GIS) can be used to identify local areas for primary health care planning. We discuss both geographical concepts and specific tools, in this case, the ARC/INFO Geographical Information System (GIS). The paper divides into four main sections, beginning with a brief outline of the current changes within the U.K. National Health Service, particularly in relation the effective delivery of primary health care and the 'localities' debate. We then provide an overview of how English health authorities have approached the task of defining their own localities for health planning and offer a brief review of the literature on regionalization problems in service delivery and the potential application of GIS. Third, we outline criteria for defining localities in the county of West Sussex, in the south of England. We discuss the strategy adopted and the use of GIS; interactive querying of the GIS database and, in particular, overlays of different data sets, provided the key approach to assessing appropriate localities. An alternative approach to regionalization using entropy-maximizing infor- mation statistics to identify which areas needed to be grouped together in order to minimize the cross-border flow of patients to doctor's surgeries is also reported. Finally, we offer some conclusions on the usefulness of a GIS-based approach to locality definition. LOCALITY PLANNING Significant variation in health over fairly small areas is well-known to geographers and epidemiologists and is currently being reflected in national and inter- national trends towards primary care development and planning at the local scale. The World Health Organisation (WHO) recognize the importance of intersectoral collaboration between service providers and of community participation in their "Global Health for All Strategy' [1]. Such ideas have been instrumental in the development of locally-based health-care initiatives in many countries. At root, these perspectives make the claim that community involvement in health care facilitates better health and that such involvement necessitates collaborative planning focused on relatively small and coherent communities. In the U,K., these issues are reflected in policy documents such as the 'Cumberlege' report on community nursing [2] and the 1987 White Paper on Primary Health Care [3], both of which argued strongly for localism and community as organiz- ational bases for care delivery. The current interest in local responsiveness amongst U.K. health authorities also coincides with an emphasis on consumerism in the national health policy agenda through which public involvement in health care planning and delivery is encouraged; locality planning is a means towards this goal [4, 5]. It is contended that, by basing health care planning on small geographical areas, recognizable and known to the public, there will be greater public involvement in, commitment to and understanding of the disposition of health care resources. In the U.K., much of this policy imperative stems from the relatively large size of District Health 801
Transcript of Defining localities for health planning: A GIS approach

~ Pergamon 0277-9536(95)00180-8
Soc. Sci. Med. Vol. 42, No. 6, pp. 801-816, 1996 Copyright :t£ 1996 Elsevier Science Ltd
Printed in Great Britain. All rights reserved 027%9536/96 $15.00 + 0.00
DEFINING LOCALITIES FOR HEALTH PLANNING: A GIS APPROACH
NINA BULLEN, ~ GRAHAM MOON 2 and KELVYN JONES I
~Department of Geography, University of Portsmouth, Buckingham Building, Lion Terrace, Portsmouth PO1 3HE, England and 2School of Social and Historical Studies,
University of Portsmouth. Milldam, Burnaby Road, Portsmouth PO1 3AS, England
Abstract--The National Health Service in Britain is undergoing far-reaching changes. While District and Regional Health Authorities are currently merging, professionals agree that primary health care is most efficiently managed at the local level. This paper uses geographical information systems (GIS) capabilities to identify a nested hierarchy of localities for the management of primary health care in West Sussex, England. GIS coverages were developed which contained key criteria for defining local areas, including nodes or focal points of service provision, edges which act as physical or psychological barriers to movement, districts such as official administrative areas and interaction criteria such as journey to work, school and family doctor (GP) surgeries. Central to the derivation of the localities was a large matrix of patient to GP flows based on postcoded data. Once managed, these data revealed clear geographical patterns of patient to GP allegiance. A large-scale field survey obtained supporting information on the perception of areas from local residents.
Key words--health planning, locality, geographical information systems
INTRODUCTION
The purpose of this paper is to show how Geographical Information Systems (GIS) can be used to identify local areas for primary health care planning. We discuss both geographical concepts and specific tools, in this case, the ARC/INFO Geographical Information System (GIS). The paper divides into four main sections, beginning with a brief outline of the current changes within the U.K. National Health Service, particularly in relation the effective delivery of primary health care and the 'localities' debate. We then provide an overview of how English health authorities have approached the task of defining their own localities for health planning and offer a brief review of the literature on regionalization problems in service delivery and the potential application of GIS. Third, we outline criteria for defining localities in the county of West Sussex, in the south of England. We discuss the strategy adopted and the use of GIS; interactive querying of the GIS database and, in particular, overlays of different data sets, provided the key approach to assessing appropriate localities. An alternative approach to regionalization using entropy-maximizing infor- mation statistics to identify which areas needed to be grouped together in order to minimize the cross-border flow of patients to doctor's surgeries is also reported. Finally, we offer some conclusions on the usefulness of a GIS-based approach to locality definition.
LOCALITY PLANNING
Significant variation in health over fairly small areas is well-known to geographers and epidemiologists and
is currently being reflected in national and inter- national trends towards primary care development and planning at the local scale. The World Health Organisation (WHO) recognize the importance of intersectoral collaboration between service providers and of community participation in their "Global Health for All Strategy' [1]. Such ideas have been instrumental in the development of locally-based health-care initiatives in many countries. At root, these perspectives make the claim that community involvement in health care facilitates better health and that such involvement necessitates collaborative planning focused on relatively small and coherent communities.
In the U,K., these issues are reflected in policy documents such as the 'Cumberlege' report on community nursing [2] and the 1987 White Paper on Primary Health Care [3], both of which argued strongly for localism and community as organiz- ational bases for care delivery. The current interest in local responsiveness amongst U.K. health authorities also coincides with an emphasis on consumerism in the national health policy agenda through which public involvement in health care planning and delivery is encouraged; locality planning is a means towards this goal [4, 5]. It is contended that, by basing health care planning on small geographical areas, recognizable and known to the public, there will be greater public involvement in, commitment to and understanding of the disposition of health care resources.
In the U.K., much of this policy imperative stems from the relatively large size of District Health
801

802 Nina Bullen et al.
Authorities (DHAs). Originally envisaged, at their creation, as corresponding to the catchment of district general hospitals, actual population sizes varied substantially, ranging from about 90,000 to 860,000 [6]. Recent changes within the NHS have altered the role of the DHAs. Notably, the shift to the kinternal market' system in April 1991 separated the role of service providers from purchasers. The DHAs are no longer responsible for providing health care directly, but for purchasing services on behalf of their resident population and many are currently merging to form larger "commissioning agencies'. Purchasers require a detailed assessment of priorities, specific needs, likely levels of demand and quality criteria. Within this context, and in a situation of relatively little information on both unit costs of supply and likely patterns of demand, 'locality purchasing' is being adopted to enable health care to be better targeted towards local needs.
THE PRACTICE OF LOCALITY PLANNING
While many health authorities are moving towards locality planning or locality purchasing, the literature suggests some diversity in the aims identified by different authorities. Issues such as management, budgeting, service delivery, planning, information gathering and community/consumer involvement have been identified as relevant, with priorities varying between district health authorities [7]. There have also been differing approaches to the delineation of localities, ranging from a bottom-up approach involving consumers and community groups, for example, in Riverside and West Lambeth, London, to a top-down approach driven at district level by senior managers, as in Wandsworth and Islington, in London [6].
In technical terms, locality planning has been variously seen as a normative modelling problem and a mapping exercise. The latter perspective has dominated in Britain and will be discussed below. The former approach has undoubted strengths and examples of its fruitful application to social and public service delivery zonation problems have been widely discussed, particularly in the North American literature, but also in Britain [8-11]. Normative modelling has tended, however, to be concerned mainly with the generation of service areas around a provider facility rather than the identification of communities who may exercise choice or have choice exercised for them with regard to the providers which they use. It has also relied on a more sophisticated technical background than the mapping approach and depends on assumptions and conceptualizations which, though academically ten- able, lack the immediate heuristic impact of the mapping approaches. There are indications that a sound basis is now emerging for the integration of normative modelling with GIS-based approaches to provide a combined strategy [12], but for much
practical day-to-day health planning, the mapping approach retains a slight edge with regard to acceptability.
Various GIS packages are increasingly being used by health authorities for mapping approaches to locality planning. This strategy adds considerable value to traditional map plus survey methods for community identification [13] as it links with health authority needs with regard to the profiling of local areas in terms of population characteristics and health status. It enhances information for health planning. Yet, at the same time, it too suffers problems. Not only are there obvious difficulties reflecting the availability of geocoded, accurate and timely information which also affect normative models, there are also problems associated with the basic spatial units which are used to form localities. Localities are often uncritically equated with readily available sets of boundaries, in particular, aggregations of census wards. The key aim should be to identify an appropriate set of basic spatial units, which allow linkage to important data sources such as the census, but which are then capable of aggregation to local areas or localities which are meaningful, both to local residents and in terms of health planning.
Identifying localities: previous approaches
GIS is now widely used in the U.K. in work purporting to be concerned with locality planning [14-18]. This section discusses examples of U.K. health locality planning where the prior considerations for defining the boundaries of local areas have been explicitly reported.
Initial approaches to the delineation of localities often compared maps of existing service and administrative boundaries. For example, one of the earliest attempts to introduce locality planning was undertaken by the Exeter Health Authority in the early 1980's [19]. The aims were to improve liaison between the District Health Authority, Social Services and other statutory bodies and to achieve continuity in terms of the sub-areas used by different service providers. The Exeter district was divided into 12 localities, with populations ranging from 10,000 to 40,000. Coterminous boundaries between social services areas, health service and general practitioner (GP) areas were identified as a starting point and then modified to reflect local community features such as school catchments and shopping centres.
A broadly similar approach was taken to identify 'neighbourhoods' in North Staffordshire, for the purposes of data collection, service delivery and possible implementation of health forums [20]. In this case, two approaches were considered, but rejected as unfeasible: a large scale survey of residents to assess levels of neighbourhood allegiance, and a computer based location/allocation modelling exercise. Instead, 'neighbourhoods' were based on overlays of maps, manually transformed to a uniform scale, to identify
~ sussex /
Defining localities for health planning
:::::::::::::::::::::::::::::::
County and Family Health Services Authority Boundan/ District Health Authority Boundary
Cra~ey East • Grinstead,
803
(.) ii....il
• Midhurst
© U 7"
H C il.-..ii ii:i!i :ii:ii~ 'ii ii!i!i ii:;i'; %
ArundelQ ;~i ~i: • Chichester ~:;~iCY
!i~i:~::: L
Bognor Regis
!iii~ • Horsham i i ..............
,4 • Billingshurst ::..;; ,,.:i~"' ,..ii ~"i~, c,
.iii i" ~'~.o Burgess .:~i~i:: • ":!~{ ,.., ~ ~,-~':::~; Hill II iili? ..... PU I bO rough *~,~y-..~::r~:'%~;~ ......... ~:~
# j
iii~ D O W N S .~i~!.-._
ehampton IL.., , . ' -""S~ re-h a m Worthing
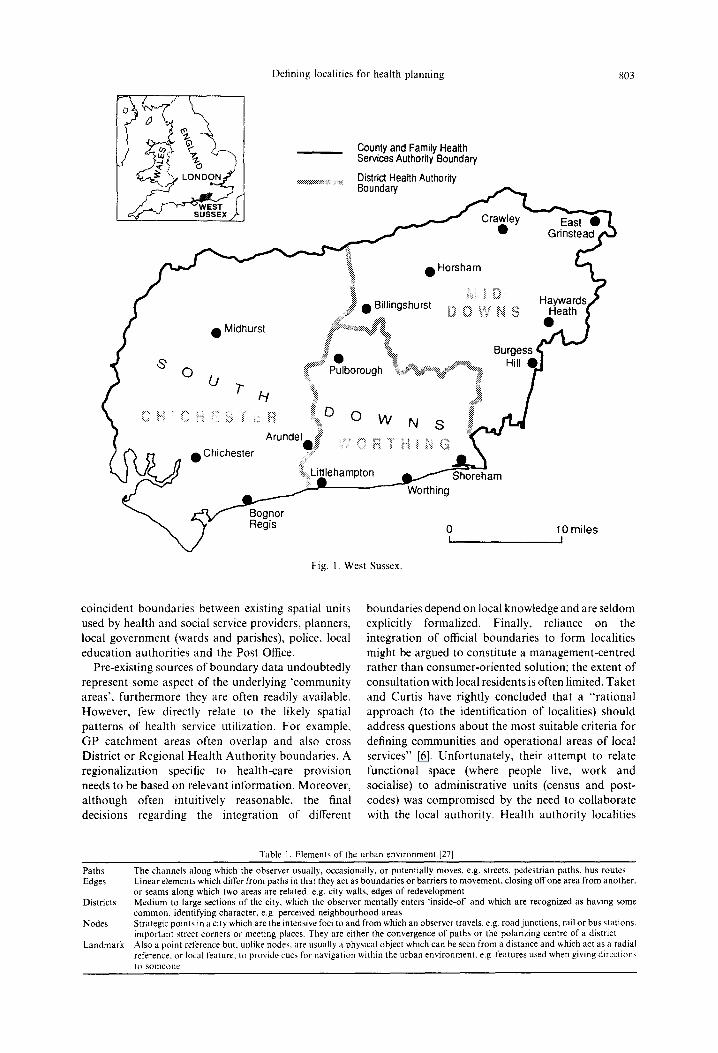
Fig. 1. West Sussex.
Heath
0 10 miles I I
coinc iden t bounda r i e s be tween exist ing spat ial uni ts used by hea l th and social service providers , p lanners , local g o v e r n m e n t (wards and par ishes) , police, local
educa t i on au thor i t i es and the Pos t Office. Pre-exis t ing sources o f b o u n d a r y da t a u n d o u b t e d l y
represen t some aspec t o f the under ly ing ' c o m m u n i t y areas ' , f u r t h e r m o r e they are of ten readily available. How e ve r , few direct ly relate to the likely spatial pa t t e rns o f hea l th service uti l izat ion. F o r example ,
G P c a t c h m e n t areas of ten over lap and also cross Dis t r ic t o r Reg iona l Hea l th A u t h o r i t y boundar ies . A reg iona l iza t ion specific to hea l th -care p rov i s ion needs to be based on re levant in fo rma t ion . Moreove r ,
a l t h o u g h of ten intuit ively reasonable , the final decis ions regard ing the in tegra t ion o f different
bounda r i e s d e p e n d on local knowledge and are se ldom explicit ly formal ized. Finally, rel iance on the in tegra t ion o f official bounda r i e s to fo rm localit ies might be a rgued to cons t i tu te a m a n a g e m e n t - c e n t r e d ra the r t han c o n s u m e r - o r i e n t e d solut ion; the ex tent o f consu l t a t ion wi th local res idents is of ten limited. Taker and Curt is have rightly conc luded tha t a " r a t i ona l
a p p r o a c h (to the ident i f ica t ion o f localities) should address ques t ions abou t the mos t sui table cr i ter ia for
def ining c o m m u n i t i e s and ope ra t iona l areas o f local services" [6]. Unfo r t una t e l y , their a t t emp t to relate
func t iona l space (where people live, work and socialise) to adminis t ra t ive uni ts (census and pos t - codes) was c o m p r o m i s e d by the need to co l l abora te wi th the local au thor i ty . Hea l th au thor i ty localit ies
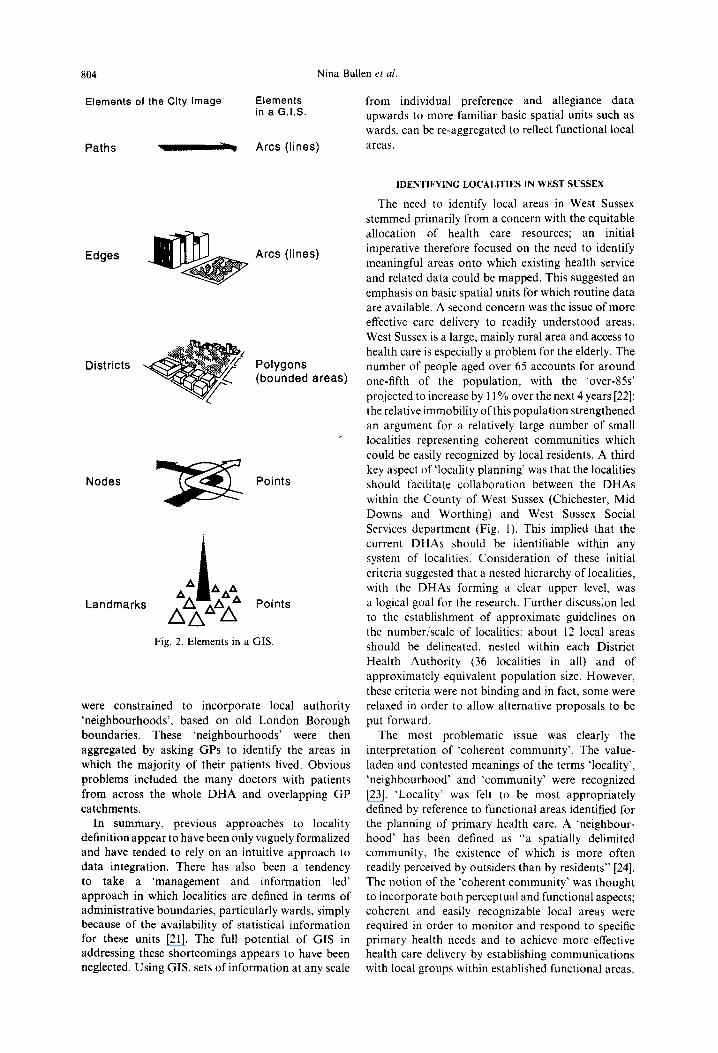
Table 1. Elements of the urban environment [27]
Paths Edges
Districts
Nodes
Landmark
The channels along which the observer usually, occasionally, or potentially moves, e.g. streets, pedestrian paths, bus routes Linear elements which differ from paths in that they act as boundaries or barriers to movement, closing off one area from another. or seams along which two areas are related, e.g. city walls, edges of redevelopment Medium to large sections of the city, which the observer mentally enters "inside-of' and which are recognized as having some common, identifying character, e.g. perceived neighbourhood areas Strategic points in a city which are the intensive loci to and from which an observer travels, e.g. road junctions, rail or bus stations. important street corners or meeting places. They are either the convergence of paths or the polarizing centre of a district Also a point reference but, unlike nodes, are usually a physical object which can be seen from a distance and which act as a radial reference, or local feature, to provide cues for navigation within the urban environment, e.g features used when giving directions 1 0 s o m e o n e
804
Elements of the City Image
Paths _ ~ ,
Nina Bullen et al.
Elements from individual preference and allegiance data in a G.I.S. upwards to more familiar basic spatial units such as
wards, can be re-aggregated to reflect functional local
Arcs (lines) areas.
Edges Arcs (lines)
Districts Z'
Polygons (bounded areas)
Nodes
Landmarks
Points
Fig. 2. Elements in a GIS.
were constrained to incorporate local authority 'neighbourhoods', based on old London Borough boundaries. These 'neighbourhoods' were then aggregated by asking GPs to identify the areas in which the majority of their patients lived. Obvious problems included the many doctors with patients from across the whole DHA and overlapping GP catchments.
In summary, previous approaches to locality definition appear to have been only vaguely formalized and have tended to rely on an intuitive approach to data integration. There has also been a tendency to take a 'management and information led' approach in which localities are defined in terms of administrative boundaries, particularly wards, simply because of the availability of statistical information for these units [21]. The full potential of GIS in addressing these shortcomings appears to have been neglected. Using GIS, sets of information at any scale
IDENTIFYING LOCALITIES IN WEST SUSSEX
The need to identify local areas in West Sussex stemmed primarily from a concern with the equitable allocation of health care resources; an initial imperative therefore focused on the need to identify meaningful areas onto which existing health service and related data could be mapped. This suggested an emphasis on basic spatial units for which routine data are available. A second concern was the issue of more effective care delivery to readily understood areas. West Sussex is a large, mainly rural area and access to health care is especially a problem for the elderly. The number of people aged over 65 accounts for around one-fifth of the population, with the 'over-85s' projected to increase by 11% over the next 4 years [22]; the relative immobility of this population strengthened an argument for a relatively large number of small localities representing coherent communities which could be easily recognized by local residents. A third key aspect of 'locality planning' was that the localities should facilitate collaboration between the DHAs within the County of West Sussex (Chichester, Mid Downs and Worthing) and West Sussex Social Services department (Fig. 1). This implied that the current DHAs should be identifiable within any system of localities. Consideration of these initial criteria suggested that a nested hierarchy of localities, with the DHAs forming a clear upper level, was a logical goal for the research. Further discussion led to the establishment of approximate guidelines on the number/scale of localities: about 12 local areas should be delineated, nested within each District Health Authority (36 localities in all) and of approximately equivalent population size. However, these criteria were not binding and in fact, some were relaxed in order to allow alternative proposals to be put forward.
The most problematic issue was clearly the interpretation of ~coherent community'. The value- laden and contested meanings of the terms 'locality', 'neighbourhood' and ~community' were recognized [23]. 'Locality' was felt to be most appropriately defined by reference to functional areas identified for the planning of primary health care. A 'neighbour- hood' has been defined as "a spatially delimited community, the existence of which is more often readily perceived by outsiders than by residents" [24]. The notion of the 'coherent community' was thought to incorporate both perceptual and functional aspects; coherent and easily recognizable local areas were required in order to monitor and respond to specific primary health needs and to achieve more effective health care delivery by establishing communications with local groups within established functional areas.

Def in ing locali t ies fo r hea l th p l a n n i n g 805
The strategy
In order to reflect perceptual, functional and formal divisions of geographical space within West Sussex, a GIS-based strategy was adopted to integrate different layers of geographical data using the ARC/INFO GIS [25, 26]. In selecting the data for West Sussex, we drew on the work of Lynch, which provides an insight into how people perceive the urban environment and construct their patterns of daily activity around 'mental images' of the city [27]. The links between perceptions and use of space and identity with particular communities allowed us to use the elements of the urban environment identified by Lynch (Table 1) as a conceptual framework for the identification of key spatial datasets. Figure 2 illustrates these elements and shows how they can be recast within the framework and terminology of a geographical information system (in this case, ESRI's ARC/INFO) as arcs (lines), polygons (bounded areas) or points. Additional information was linked to the map features to allow analytical queries of the data and other GIS operations, as discussed by Twigg [21]. Each set of data was stored as a separate layer or ~coverage' within the GIS, listed in Table 2.
GIS coverages
This section discusses the data coverages created for West Sussex in terms of thematic levels and shows how each level was used in the identification of the localities.
Level one: official boundaries. The inclusion of official boundaries in the GIS database was important for two reasons. First, the initial criteria had suggested that existing DHA boundaries should be identifiable within the final set of localities. Secondly, the importance of data linkage, particularly with census information, meant that the localities should be based on appropriate spatial units.
Various sets of official boundaries were examined which, in contrast to the studies discussed earlier, showed a high degree of coterminosity. The county
boundary is coterminous with the West Sussex Family Health Services Authority (FHSA) (Fig. 1). West Sussex FHSA covers the three District Health Authorities of Chichester, Mid Downs and Worthing. Within the county, joint planning between the District Health Authorities and West Sussex Social Services was facilitated by coterminous boundaries between the DHAs and Social Services divisions, except for three parishes. All county council services, including Social Services, were delivered to local areas delineated on a common spatial basis: the civil parish. Thus, Social Services divisions and sub-divisions, Education Areas and Library Service divisions all follow Parish boundaries. County Council Community Areas, used by County Councillors in their constituency work (public meetings, targeting service information and monitoring local needs) were defined as groups of parishes. Furthermore, the role of parishes in local politics suggests that they play an important part in community identity, particularly in a rural county such as West Sussex.
The case for choosing the civil parish as the basic spatial unit for building localities was clearly considerable. It is not, however, unproblematic. First, official routine health data are not produced by civil parish in the U.K. The utility of a parish-based solution therefore departs from the optimal for the health service. Nevertheless, health data are increas- ingly available in a geocoded disaggregated form capable of combination, using GIS, to any chosen zonation--an approach which, though requiring investment, adds flexibility and value to data analysis. Second, the main towns of West Sussex: Chichester, Worthing and Crawley, were each single parishes and in need of a finer spatial subdivision. In these towns, the urban wards were used as an imperfect but available basis for identifying intra-urban communi- ties. Using ARC/INFO, the 1991 enumeration districts were aggregated to parishes and an integrated coverage of parishes and urban wards generated to provide the basic spatial units capable of aggregation to form localities. The remaining levels within the GIS
Table 2. Data coverages for West Sussex
Thematic level City element GIS feature GIS coverage
Official boundaries District Polygon Census ED Census wards Parishes Social services divisions DHA boundaries
Perceived neighbourhoods District Polygon Survey of residents Extent of urban area
Key services Node Points Schools Libraries Post offices Ambulance stations GP surgeries
Roads & railways Path Arcs Roads Railways
Natural boundaries Edges Arcs South Downs Rivers
Catchments District Thiessen polygons School catchment areas Flows Arcs Journey to work
Patient to GP

806 Nina Bullen et al.
e . ,
8
._>
Defining localities for health planning 807
provided the criteria which governed or constrained the aggregation of these basic spatial units.
Level two: perceived neighbourhoods. Unlike the other layers, information on local perceptions of ~neighbourhood' and 'community' is rarely available from published sources. A questionnaire and mapping exercise was therefore devised, drawing on previous studies of community and neighbourhood [13, 28]. This was piloted with members of the Community Health Councils, local organizations set up within each District Health Authority to represent the consumer's view, and then repeated using street interviews in the shopping centres of the 15 largest towns in West Sussex. This approach was chosen in order to provide easy access to the largest number of people in a fairly short period of time; over 1000 responses were obtained. Respondents were asked to outline their local neighbourhood on a base map and to provide supporting information on the strength of local community feeling. Perceived neighbourhoods varied from closely circumscribed areas corresponding to the built up area of villages, small towns or sub-areas within large towns, to extensive areas. This variation reflected different social networks, access to means of transport and commuting patterns.
A random sample of 500 individuals' neighbour- hoods were digitized and entered into the GIS. The
separate coverages were then converted to raster format (100 m grid squares). Each grid square was coded 1 (inside a neighbourhood) or 0 (outside) and the separate coverages were merged using the GRID module of ARC/INFO, so that each cell of the grid contained a frequency count of the number of respondents who had included that cell within a local neighbourhood. Figure 3 indicates the results of this process with the white shading highlighting areas identified by at least 50 respondents. While clearly constrained by the sampling strategy and of relatively limited utility in the overall GIS strategy, Fig. 3 offers a useful subjective assessment of relative strength of locality allegiances. It offers support for the decision to use wards as the basic spatial unit in urban areas, and it also assisted in the validation of functional areas derived from service utilization patterns.
LeL'el three: key sert, ice centres. These coverages contained data on the location of post offices and sub-post offices, County libraries, schools, ambulance stations and doctor's surgeries. The coverages were created by converting postcoded address lists to Ordnance Survey grid references via the Central Postcode Directory. Maintained by OPCS and marketed by the Post Office, this is a computerized file which matches the first address in each unit postcode
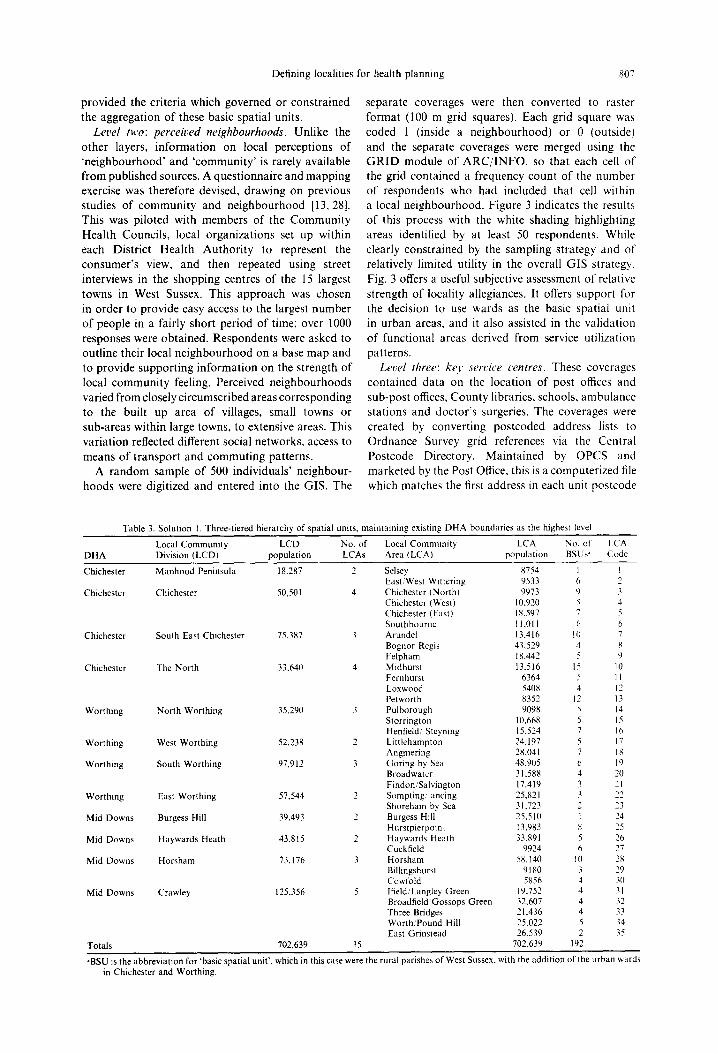
Table 3. Solution 1. Three-tiered hierarchy of spatial units, maintaining existing DHA boundaries as the highest level
Local Community LCD No. of Local Community LCA No. of LCA DHA Division (LCD) population LCAs Area ILCA) population BSUs ~' Code
Chichester Manhood Peninsula 18,287 2
Chichester Chichester 50,501 4
Chichester South East Chichester 75,387 3
Chichester The North 33.640 4
Worthing North Worthing 35~290 3
Worthing West Worthing 52.238 2
Worthing South Worthing 97,912 3
Worthing East Worthing 57.544 2
Mid Downs Burgess Hill 39.493 2
Mid Downs Haywards Heath 43.815 2
Mid Downs Horsham 73,176 3
Mid Downs Crawley 125,356 5
Totals 702,639 35
Selsey 8754 1 I East/West Wittering 9533 6 2 Chichester (North) 9973 9 3 Chichester (West) 10,920 5 4 Chichester (East) 18,597 7 5 Southbourne 11,011 6 6 Arundel 13,416 10 7 Bognor Regis 43,529 4 8 Felpham 18,442 5 9 Midhurst 13,516 15 10 Fernhurst 6364 5 1 Loxwood 5408 4 12 Petworth 8352 12 13 Pulborough 9098 5 14 Storrington 10,668 5 15 Henfield/Steyning 15,524 7 16 Littlehampton 24,197 5 ! 7 Angmering 28,041 7 18 Goring by Sea 48.905 6 19 Broadwater 31.588 4 20 Findon/Salvington 17,419 3 21 Sompting ancing 25,821 3 22 Shoreham by Sea 31,723 2 23 Burgess Hill 25,510 I 24 Hurstpierpoin~ 13.983 ~ 25 Haywards Heath 33,891 5 26 Cuckfield 9924 6 27 Horsham 58,140 10 28 Billingshurst 9180 3 29 Cow fold 5856 4 ~0 lfield/Langley Green 19.752 4 3 I Broadfield/Gossops Green 32.607 4 32 Three Bridges 21.436 4 33 Worth/Pound Hill 25,022 5 ~4 East Grinstead 26,539 2 ~5
702,639 192 -
"BSU is the abbreviation for "basic spatial unit', which in this case were the rural parishes of West Sussex, with the addition of the urban wards in Chichester and Worthing.

808 Nina Bullen et al.
m I •
• m •
z ~
"°11 m
o
g g ~ = o o o o
o 0 X '~
:,7
cz~
~A
e,,
E Y~

Defining localities for health planning 809
to an Ordnance Survey grid reference, accurate to the nearest 100 m for England and Wales. An overlay of the service locations illustrated the concentration of activity at nodal points in the main towns (Fig. 4). It also demonstrated that Midhurst, Petworth and Pulborough are important centres in the rural area to the north of the County, while Crawley, a new town, is characterized by polycentric nodes located in the sep- arate neighbourhoods around which it was planned.
Let,el Jour: roads and railways, natural boundaries. Features such as railway lines and roads, as well as rivers and hills, act to restrict movement, social interaction and hence community development in certain directions. In West Sussex, the South Downs act as a major dividing line (Fig. 5).
Let,el .fit,e: .[tows and catchments. Analysis of population movements to key services can be used to define functional catchment areas. Where such data are unavailable, theoretical catchments can be defined as Thiessen polygons around service centres, within ARC/INFO. Coverages were generated of school catchment areas, journey-to-work flows and, most importantly in the context of the emerging emphasis on primary health care in health service planning, GP catchments. The latter analysis was based on actual patterns of patient to doctor allegiance, as revealed by the patient register and GP/surgery address databases held by the FHSA. Data selected from the patient register included the code of the patient's registered GP and the patient's home postcode. The GP/surgery
database was used to link every GP to the postcode of their main practice address. We were unable to identify whether the patient attended a local branch surgery or the main practice. However, the FHSA argued that many branch surgeries only offered a partial service, often held on an adhoc basis. Patients may also see any of the doctors in a practice. For these reasons, patient flows were linked only to main surgeries.
725,000 records for the West Sussex population registered with West Sussex GPs were extracted from the patient register after removing those records with postcodes which were missing (18,000) or impossible to link to an enumeration district (6000). Each patient address (origin) and main practice (destination) was then allocated to its enumeration district using the OPCS Postcode ED directory and cell counts were generated for a matrix of origin/destination pairs using SPSS [29]. The 12,000 potential flows were imported to ARC/INFO and plotted to reveal a complex pattern, although core areas and major axes could be identified. A second stage selected the dominant flow out of each ED using SPSS; the plot of this procedure showed a much clearer pattern of patient to doctor allegiance (Fig. 5). The area served by a surgery varied from fairly wide rural areas, for example around Midhurst, to tight clusters of flows around local surgeries in Bognor Regis and Crawley. This coverage provided cross-validation of the information on service nodes and the indications of the maps of perceived communities.
Table 4. Solution 2. Localities unconstrained by existing DHA boundaries
DHA Locality Population No. of BSUs ' Locality code
Chichester Selsey 8754 1 1 Chichester East/West Wittering 9533 6 2 Chichester Bognor Regis 43,529 4 3 Chichester Felpbam 18,442 5 4 Worthing Littlehampton/Angmering 51,342 8 5 Worthing Worthing 97,912 13 ¢~ Worthing Sompting/Lancing 25,821 3 7 Worthing Shoreham by Sea 31,723 2 8 Worthing Henfield 10,268 5 9 Worthing:Mid Downs Cowfold 10,447 6 10 Mid Downs Hurstpierpoint 13,712 7 11 Mid Downs Burgess Hill 25,510 1 12 Mid Downs Cuckfield 10,860 7 l 3 Mid Downs Haywards Heath 33,891 5 14 Mid Downs East Grinstead 24,351 I 15 Mid Downs Worth/Turners Hill 27,210 6 16 Mid Downs Three Bridges 21.436 4 17 Mid Downs Broadfield/Gossops Green 32,607 4 18 Mid Downs lfield/Langley Green 19,752 4 19 Mid Downs Horsham 58,140 I 0 20 Mid Downs Billingshurst 9180 3 2 I Worthing Storrington 10,668 5 22 Worthing Chichester Pulborough 11,299 9 23 Chichester Loxwood 5408 4 24 Chichester Petworth 6151 8 25 Worthing Chichester Arundel 14,312 14 26 Chichester Chichester (East) 18,597 7 27 Chichester Chichester (West) 10,920 5 28 Chichester Chichester (North) 9973 9 29 Chichester Southbourne 11,011 6 30 Chichester Midhurst 14,497 16 3 I Chichester Fernhurst 5383 4 32 Totals 702.639 192 ---
"BSU is the abbreviation for "basic spatial unit', which in this case were the rural parishes of West Sussex, with the addition of the urban wards in Chichester and Worthing.
SSM 42:6:~"

810 Nina BuUen et al.
z
!ll o
t~_
o
C
C=3 O-
E o .~
I®
O
O
e~
O
e ~
g ,
~r

Defining localities for health planning
Table 5. Solution 3. Two-tiered hierarchy of spatial units, classification based on GP/Patient profile
811
HLA No. of LA No. of LA DHA Higher Level Area (HLA) population LAs Local Area (LA) population BSUs ~ code
Mid Downs Crawley 100,961 3 Langley Green/Tilgate 34,734 6 1 Mid Downs Pound Hill/Turners Hill 30,132 6 2 Mid Downs lfield/Rusper 36,095 7 4 Mid Downs Central Belt 210,934 16 East Grinstead 26,539 2 3 Mid Downs Horsham 52,834 6 5 Mid Downs/Chichester Loxwood 7732 5 6 Mid Downs Haywards Heath 33,891 5 7 Mid Downs Cuckfield 9629 5 8 Mid Downs Billingshurst 10,018 4 9 Chichester Petworth 7283 10 10 Chichester Fernhurst 5383 4 11 Chichester Cowfold 6151 5 12 Worthing Pulborough 9098 5 15 Worthing Storrington 9640 4 16 Chichester Bury 2201 4 17 Mid Downs Hurstpierpoint 13,712 7 18 Worthing Henfield 5527 3 20 Worthing Steyning 10,498 5 21 Worthing Bramber 798 1 30 Chichester Midhurst 13,365 2 Rogate 3934 3 13 Chichester Midhurst 9431 11 14 Mid Downs Burgess Hill 25,510 1 Burgess Hill 25,510 1 19 Chichester Chichester 50,004 5 East & West Dean 2849 6 22 Chichester Boshara 5013 3 28 Chichester Chichester 15,705 7 29 Chichester Oving/Donnington 16,909 6 33 Chichester East & West Wittering 9533 6 37 Chichester Southbourne 10,030 1 Southbourne 10,030 5 23 Chichester/Worthing Arundel 18,844 2 Arundel 4191 8 24 Chichester Slindon 14,653 8 25 Worthing Worthing 67,920 2 Patching/Findon 2357 3 26 Worthing Worthing 65,563 8 32 Chichester/Worthing Angmering/Littlehampton 47,110 1 Angmering/Littlehampton 47,110 6 27 Worthing Adur 57,544 1 Adur 57,544 5 31 Worthing Ferring/Central Worthing 34,721 1 Ferring/Central Worthing 34,721 5 34 Chichester Bognor Regis 43,529 1 Bognor Regis 43,529 4 35 Chichester Middleton-on-Sea 13,413 I Middleton-on- Sea 13,413 2 36 Chichester Selsey 8754 1 Selsey 8754 1 38 Totals 702,639 38 702,639 192

812 Nina BuUen et al.
L ~
. , r l ~ '
o
z
a ~
I lii
o
2
O
0
e.
,d

Defining localities for health planning 813
Z
A
r ~
o
o .-.I
c C3
O
s ==
]
== "K
..__-
O
r ~
e,b

8 1 4 N i n a B u l l e n et al.
c ~
Z
r ~
O
;,,7 Lx.
te~ o
ta ~7.
O - _ _
qa .---I
I e~
,o
5.-"
O . d
~6
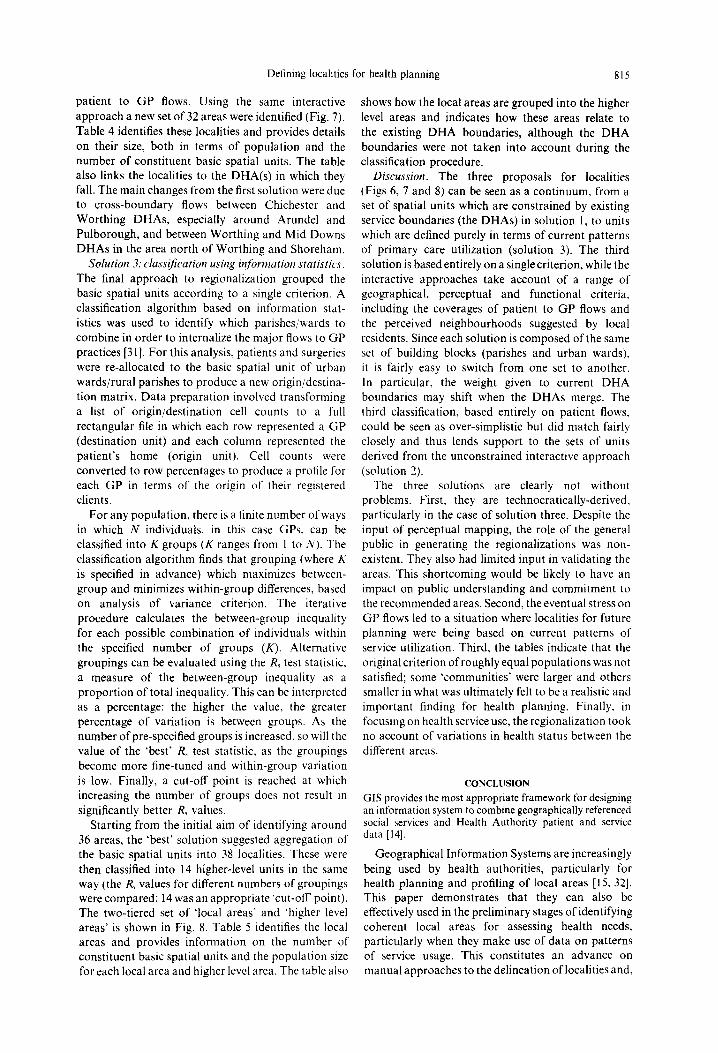
Defining localities
patient to GP flows. Using the same interactive approach a new set of 32 areas were identified (Fig. 7). Table 4 identifies these localities and provides details on their size, both in terms of population and the number of constituent basic spatial units. The table also links the localities to the DHA(s) in which they fall. The main changes from the first solution were due to cross-boundary flows between Chichester and Worthing DHAs, especially around Arundel and Pulborough, and between Worthing and Mid Downs DHAs in the area north of Worthing and Shoreham.
Solution 3: classification using inJormation statistics. The final approach to regionalization grouped the basic spatial units according to a single criterion. A classification algorithm based on information stat- istics was used to identify which parishes/wards to combine in order to internalize the major flows to GP practices [31]. For this analysis, patients and surgeries were re-allocated to the basic spatial unit of urban wards/rural parishes to produce a new origin/destina- tion matrix. Data preparation involved transforming a list of origin/destination cell counts to a full rectangular file in which each row represented a GP (destination unit) and each column represented the patient's home (origin unit). Cell counts were converted to row percentages to produce a profile for each GP in terms of the origin of their registered clients.
For any population, there is a finite number of ways in which N individuals, in this case GPs, can be classified into K groups (K ranges from 1 to N). The classification algorithm finds that grouping (where K is specified in advance) which maximizes between- group and minimizes within-group differences, based on analysis of variance criterion. The iterative procedure calculates the between-group inequality for each possible combination of individuals within the specified number of groups (K). Alternative groupings can be evaluated using the Rs test statistic, a measure of the between-group inequality as a proportion of total inequality, This can be interpreted as a percentage: the higher the value, the greater percentage of variation is between groups. As the number of pre-specified groups is increased, so will the value of the 'best' R~ test statistic, as the groupings become more fine-tuned and within-group variation is low. Finally, a cut-off point is reached at which increasing the number of groups does not result in significantly better Rs values.
Starting from the initial aim of identifying around 36 areas, the 'best' solution suggested aggregation of the basic spatial units into 38 localities. These were then classified into 14 higher-level units in the same way (the R~ values for different numbers of groupings were compared; 14 was an appropriate "cut-off point). The two-tiered set of qocal areas" and "higher level areas' is shown in Fig. 8. Table 5 identifies the local areas and provides information on the number of constituent basic spatial units and the population size for each local area and higher level area. The table also
for health planning 815
shows how the local areas are grouped into the higher level areas and indicates how these areas relate to the existing DHA boundaries, although the DHA boundaries were not taken into account during the classification procedure.
Discussion. The three proposals for localities (Figs 6, 7 and 8) can be seen as a continuum, from a set of spatial units which are constrained by existing service boundaries (the DHAs) in solution 1, to units which are defined purely in terms of current patterns of primary care utilization (solution 3). The third solution is based entirely on a single criterion, while the interactive approaches take account of a range of geographical, perceptual and functional criteria, including the coverages of patient to GP flows and the perceived neighbourhoods suggested by local residents. Since each solution is composed of the same set of building blocks (parishes and urban wards), it is fairly easy to switch from one set to another. In particular, the weight given to current DHA boundaries may shift when the DHAs merge. The third classification, based entirely on patient flows, could be seen as over-simplistic but did match fairly closely and thus lends support to the sets of units derived from the unconstrained interactive approach (solution 2).
The three solutions are clearly not without problems. First, they are technocratically-derived, particularly in the case of solution three. Despite the input of perceptual mapping, the role of the general public in generating the regionalizations was non- existent. They also had limited input in validating the areas. This shortcoming would be likely to have an impact on public understanding and commitment to the recommended areas. Second, the eventual stress on GP flows led to a situation where localities for future planning were being based on current patterns of service utilization. Third, the tables indicate that the original criterion of roughly equal populations was not satisfied; some 'communities" were larger and others smaller in what was ultimately felt to be a realistic and important finding for health planning. Finally, in focusing on health service use, the regionalization took no account of variations in health status between the different areas.
CONCLUSION GIS provides the most appropriate framework for designing an information system to combine geographically referenced social services and Health Authority patient and service data [14].
Geographical Information Systems are increasingly being used by health authorities, particularly for health planning and profiling of local areas [15, 32]. This paper demonstrates that they can also be effectively used in the preliminary stages of identifying coherent local areas for assessing health needs, particularly when they make use of data on patterns of service usage. This constitutes an advance on manual approaches to the delineation of localities and,
816 Nina Bullen et al.
through the integrative capabilities of GIS, allows a number of problems to be addressed. Specifically, the paper has indicated how the utility of pre-existing boundaries can be evaluated against more perceptu- ally-grounded data; it has also enabled comparisons to be made between the 'stated preferences' of residents, based on a field survey of perceived local neighbour- hoods, and the 'revealed preferences' indicated by actual patterns of spatial behaviour, such as visiting the family doctor. Whilst GIS systems may allow for more sophisticated and rigorous regionalizations than those presented here, it is also true that the use of GIS as described in this paper offered significant advantages in terms of data integration, the interactive querying of the database and the preparation of map output.
The key element in defining localities for health planning is the choice of an appropriate basic spatial unit. In West Sussex, the localities were groupings of rural parishes and urban wards. These units are the basis for current service boundaries, an important consideration in implementing new proposals to improve service delivery. They also enable data linkage with sources such as the census since both wards and parishes are aggregations of census enumeration districts. Data can therefore be aggre- gated to the level of localities to produce population profiles, which can inform the assessment of health needs. The goal of empowering local communities depends on consumers having access to information and a forum to voice their views. In West Sussex, the parishes are the smallest scale of grass-roots political allegiance. Localities defined from this basic spatial unit should therefore reflect 'coherent community areas' and increase the flow of information between service agencies and consumers.
Acknowledgements--A version of this paper was given to the 6th International Medical Geography Symposium, Vancouver B.C., Canada. The authors would like to thank participants for their helpful comments.
R E F E R E N C E S
1. W.H.O. Global Strategy for Health Jbr All by the Year 2000 + . World Health Organization, Geneva, 1981.
2. D.H.S.S. Neighbourhood Nursing: A Foeus ,for Care. HMSO, London, 1986.
3. GB Parliament. Promoting Better Health: The Govern- ment's Programme.for Improving Primary Health Care. HMSO, London, 1987.
4. Department of Health. The Health of the Nation. . . and You. HMSO, London, 1992.
5. Department of Health. The Patient's Charter. HMSO, London, 1993.
6. Taket A. R. and Curtis S. E. Locality planning for health care: a case study in East London. Area 21, 357, 1989.
7. King's Fund. Decemralising Community Health Services. King's Fund, London, 1987.
8. Clarke M. (Editor) Planning and Anah,sis in Health Care Systems. Pion, London, 1984.
9. Clarke M. and Spewage M. Integrated models for public policy analysis. Papers Regional Sci. Assoc. 55, 25, 1984.
10. Mayhew L. and Leonardi G. Equity, efficiency and accessibility in urban and regional health care systems. Environ. Plann. A 14, 1479, 1982.
11. Thomas R. Geomedical Systems, Chap. 8. Routledge, London, 1992.
12. Honey R. Stages in reorganising service delivery regions. Environ. Plann. C 9, 51, 1991.
13. Pacione M. Neighbourhood communities in the modern city: some evidence from Glasgow. Scottish Geog. Mag. 15, 169, 1983.
14. Todd P., Brown P., Hirshfield A. and Bundred P. A GIS-based system for community health care on Wirral: beyond the pilot phase. Paper presented at the Annual Conference, Institute of British Geographers, Univ. of Nottingham, 1994.
15. Ritchie W. Desktop mapping helps rural Wales target health resources, GIS Europe, December, 50, 1993.
16. Morgan K. A geographical information system in health service planning in Avon. In The Association jbr Geographic ln['ormation Yearbook (Edited by Foster M. and Shand P.). Taylor & Francis, London, 1990.
17. Burnhill P. M., Dowie P. J. and Healey R. G. Common service boundaries: from conflicting to conterminous boundaries, Working Paper 24. Regional Research Laboratory for Scotland, Univ. of Edinburgh, Edin- burgh, 1991.
18. Dowie P. J., Koval S. J., Burnhill P. M. and Healey R. G. GIS and community health care: a case study of geriatric service provision. In EGIS '91 Proc. (Edited by Harts J., Ottens H. F. L. and Scholten H. J.). EGIS Foundation, Utrecht, 1991.
19. Exeter and District Community Health Council. Locality Planning: Power to the People? Exeter and District CHC, Exeter, 1986.
20. Kivell P. T., Turton B. J. and Dawson B. R. P. Neighbourhoods for health service administration. Soe. Sci. Med. 30, 701, 1990.
21. Twigg L. Health based geographical information systems: their potential examined in the light of existing data sources. Soc. Sci. Med. 30, 143, 1990.
22. West Sussex County Council Social Services Depart- ment. West Sussex Community Care Plan 1994 1995. West Sussex County Council, Chichester, 1994.
23. Moon G. Conceptions of space and community in British health policy. Soe. Sci. Med. 30, 165, 1990.
24. Eyles J. Neighbourhoods. In The Dictionao' of Human Geography (Edited by Johnston R. J~, Gregory D. and Smith D. M.), 2nd edn. Blackwell, Oxford, 1989.
25. Bullen N., Moon G. and Jones K. Defining communities: a GIS approach to delivering better health care. Mapping Awareness 8(2), 22, 1994.
26. E.S.R.1. Understanding GIS: The ARC/1NFO Method. Environmental Systems Research Institute, Redlands, CA, 1990.
27. Lynch K. The Image t~fthe City. MIT Press, Cambridge, MA, 1960.
28. Herbert D. T. and Raine J. W. Defining communities within urban areas. Town Plann. Rev. 47, 325, 1976.
29. Norusis M. J. SPSS Introductoo" Guide: Basic Statistics and Operations. McGraw-Hill, New York, 1982.
30. Coombes M., Openshaw S., Wong C. and Raybould S. GIS in community boundary definition. Mapping Awareness and GLS in Europe G1S Eur. 7(4), 41, 1993.
31. Johnston R. J. and Semple R. K. Classification using information statistics. CA TMOG 38, Geo Books, Norwich, 1983.
32. Wain R. The use of a geographical information system in locality profiling. Mapping Awareness 7(8), 20, 1993.