YA Popov, DE Shcherbakov. Origin and evolution of the Coleorrhyncha as shown by the fossil record
Upload
independentCategory
view
0download
0
Journal of Cerebral Blood Flow and Metabolism 13:469-474 © 1993 The International Society of Cerebral Blood Flow and Metabolism Published by Raven Press, Ltd., New York
Defective Brain Energy Metabolism Shown by In Vivo 31p MR Spectroscopy in 28 Patients with
Mitochondrial Cytopathies
Bruno Barbiroli, *Pasquale Montagna, *Paolo Martinelli, Raffaele Lodi, Stefano lotti, *Pietro Cortelli, Rosanna Funicello, and tPaolo Zaniol
Cattedra di Biochimica Clinica dell' Universitii di Bologna and *Istituto di Clinica Neurologica dell' Universitii di
Bologna, Bologna, and tIstituto di Radiologia dell' Universitii di Modena, Modena, Italy
Summary: We studied brain energy metabolism by phosphorus magnetic resonance spectroscopy e1p MRS) in 28 patients with mitochondrial cytopathies, and 20 normal control subjects. Fourteen patients had myopathy alone, six had only mild brain symptoms, and eight showed different degrees of brain involvement. Brain 31p MRS showed a low phosphocreatine content in all patients, accompanied by a high inorganic phosphate in 14 of 28 patients. The average value of the Pi concentration in the patient group was significantly (p = 0.009) different from the control group. The cytosolic pH was normal. From these data were derived a high concentration of ADP (cal-
Mitochondrial cytopathies are a heterogeneous group of diseases thought to be due to inherited disorders of mitochondrial function (Schneck et aI., 1973; Berenberg et aI., 1977; Di Mauro et aI., 1985), and characterized by a wide variety of clinical phenotypes (Schneck et aI., 1973; Berenberg et aI., 1977; Pavlakis et aI., 1984; Di Mauro et aI., 1985; Hurko and McKann, 1985; Bourd et aI., 1987; Frackowiak et aI., 1988; Wallace et at., 1988; Berkovic et aI., 1989). Many patients show symptoms and signs involving multiple organs as in KearnsSayre syndrome (KSS), in myoclonic epilepsy and
Received July 30, 1992; final revision received December 9, 1992; accepted December 9, 1992.
Address correspondence and reprint requests to Prof. B. Barbiroli at Istituto di Clinic a N eurologica, via U. Foscolo 7, 40123 Bologna, Italy.
Abbreviations used: CPEO, chronic progressive external ophthalmoplegia; DRESS, depth-resolved surface-coil spectroscopy; FID, free induction decay; KSS, Kearns-Sayre syndrome; LHON, Leber's hereditary optic neuropathy; MELAS, mitochondrial encephalomyopathy, lactic acidosis, and stroke-like episodes; MERRF, myoclonic epilepsy and ragged-red fibers; MRS, magnetic resonance spectroscopy; PCr, phosphocreatine; PP, phosphorylation potential.
469
culated from the creatine kinase equilibrium), a high percent value of V/V max for ATP biosynthesis, and a low phosphorylation potential, all features showing a derangement of brain energy metabolism, in all patients with mitochondrial cytopathies. 31p MRS proved to be sensitive enough to disclose a deficit of mitochondrial functionality not only in the affected patients, but also in those without clinically evident brain symptoms. Key Words: Brain bioenergetics-Impaired brain energy metabolism-Mitochondrial cytopathies-Brain MR spectroscopy.
ragged-red fibers (MERRF), and the syndrome of mitochondrial encephalomyopathy, lactic acidosis, and stroke-like episodes (MELAS), while others appear to be clinically affected only in the extraocular muscles as in chronic progressive external ophthalmoplegia (CPEO) or do not show any muscle involvement as in Leber's hereditary optic neuropathy (LHON).
It has been recently shown that patients with LHON (Cortelli et aI., 1991) have a subclinical involvement of skeletal muscles. It remains controversial whether the brain of patients with different mitochondrial cytopathies may also (Eleff et aI., 1990; Matthews and Arnold, 1990; Matthews et aI., 1991; Montagna et aI., 1992) have a deficit of energy metabolism independently of the presence of brain symptoms.
At the moment, phosphorus magnetic resonance spectroscopy e1p MRS) is the only noninvasive method that allows an in vivo assessment of brain energy metabolism by measuring the high-energy phosphates.
The aim of this work was to ascertain by 31p MRS

470 B. BARB/ROLl ET AL.
whether an impairment of brain energy metabolism was present in patients with mitochondrial cytopathies, especially in those without any overt symptoms or signs of brain involvement.
involvement of the limbs; within this CPEO group, patients 10 to 12 had additional symptoms and signs of CNS involvement, as manifested by psychic, cerebellar, or brain computed tomographic (CT) changes. Ragged-red fibers, the hallmark of mitochondrial alterations on muscle biopsy, were prominent in these CPEO patients, in some cases associated with mtDNA deletions. Patients 13 to 18 all had familial LHON, in cases 13 to 17 linked to an 1 1 ,778 mtDNA mutation. Patients 19 to 23 were instead cases of mitochondrial myopathy (MM) unassociated with CPEO, and patients 24 to 28 were cases of mitochondrial encephalopathies (EM) with variable phenotypes [migrainous strokes and mtDNA deletion in case 24;
MATERIALS AND METHODS
Patients and control subjects The patient group (Table 1) consisted of 28 patients
affected by mitochondrial cytopathies. Patients 1 to 12 had CPEO, isolated or associated with mild myopathic
TABLE 1. Clinical and laboratory features of 28 patients with mitochondrial cytopathies
Patient Sex/age Additional clinical and Muscle biochemistryl no. (years) Diagnosis laboratory features molecular biology
I F/61 CPEO Deafness; EMG myopathic; HSL RRF; COX deficit 2 M/42 CPEO Proximal weakness; EMG myopathic + RRF
neurogenic atrophy 3 M/75 CPEO Dysphagia; weakness LE; high CK; HSL RRF; mtDNA deletion 4 F/69 CPEO EMG myopathic; HSL RRF; COX deficit 5 M/66 CPEO EMG neurogenic; HSL RRF 6 F/46 CPEO Mild weakness LE; EMG myopathic RRF 7 M/33 CPEO High CK; HSL RRF 8 F/37 CPEO EMG myopathic; HSL RRF 9 F/68 CPEO Weakness LE; EMG myopathic; HSL RRF
10 M/64 CPEO Deafness; slight cortical atrophy; COX deficit peri ventricular calcifications; high CK; HSL
11 M/55 CPEO Gait ataxia; deafness; mental deterioration; RRF; mtDNA deletion polyneuropathy; diffuse cerebral atrophy; ventricular calcifications; HSL
12 F/52 CPEO Weakness LE; gait ataxia; periventricular RRF calcifications; HSL
13 M/25 LHON Bilateral optic atrophy 11,778 mtDNA mutation 14 M/56 LHON Bilateral optic atrophy 11,778 mtDNA mutation 15 M/36 LHON Bilateral optic atrophy 11,778 mtDNA mutation 16 M/22 LHON Bilateral optic atrophy 11,778 mtDN A mutation 17 M/45 LHON Bilateral optic atrophy 11,778 mtDNA mutation 18 F/47 LHON Bilateral optic atrophy; HSL Abnormal COX 19 F/40 MM Mild generalized weakness; respiratory RRF
failure; HSL 20 MIlO MM Generalized proximal weakness; EMG RRF
myopathic; HSL 21 F/2S MM Mild generalized weakness; EMG Abnormal SDH
myopathic; high CK; HSL 22 F/36 MM Periventricular calcifications; HSL RRF; multiple mtDNA deletions 23 F/55 MM Diffuse mild weakness; EMG myopathic; RRF; COX deficit
HSL 24 F/40 EM Migraine strokes, ischemic lesions in RRF; mtDNA deletion; COX deficit
occipital lobes (see Bresolin et aI., 1991) 25 F/18 MERRF Gait ataxia; myoclonic epilepsy; cortical SCR deficit; abnormal mitochondria on
and cerebellar atrophy; HSL electron microscopy 26 M/49 MELAS Stroke-like episodes; seizures; ataxia; RRF
dementia; focal multiple brain lesions; HSL
27 F/41 MTRP Mother of patient no. 28 8,993 mtDNA mutation (10% heteroplasmy)
28 FII3 MTRP Daughter of patient no. 27; retinitis 8,993 mtDNA mutation (70% pigmentosa; ataxia; psychic retardation; heteroplasmy) cerebellar and brainstem atrophy; polyneuropathy
CPEO = chronic progressive external ophthalmoplegia; LHON = Leber's hereditary optic neuropathy; MERRF = myoclonic epilepsy and ragged-red fibers; MELAS = mitochondrial encephalomyopathy, lactic acidosis, and stroke-like episodes; MTRP =
mitochondrial retinitis pigmentosa (Holt et aI., 1990) EM = encephalomyopathy; MM = mitochondrial myopathy; RRF = ragged-red fibers; HSL = high serum lactate; CK = serum creatine kinase; COX = cytochrome oxidase; SCR = succinate-cytochrome C reductase; SDH = succinate dehydrogenase; LE = lower extremities; EMG = electromyography; mtDNA = mitochondrial DNA.
J Cereb Blood Flow Metab, Vol. 13, No.3, 1993
ABNORMAL BRAIN MRS IN MITOCHONDRIAL CYTOPATHIES 471
MERRF and MELAS syndrome in cases 25 and 26, respectively; and familial mitochondrial retinitis pigmentosa (Holt et al., 1990) in cases 27 and 28]. These patients, except case 27, had severe CNS involvement, as manifested. in ischemic strokes, seizures, cerebellar, and brainstem atrophy. All patients were free from medications.
Normal control subjects, matched for age and sex, free from any neurological disorder, volunteered for the study.
Informed consent was obtained in all cases.
Phosphorus magnetic resonance spectroscopy 31p MR spectra were acquired by a GE 1.5 T Signa
system with a spectroscopy accessory using a surface coil provided by General Electric (Milwaukee, WI, U.S.A.) as recently reported (Barbiroli et al., 1992). The pulse width and transmitter power were adjusted to obtain maximal signal intensity. A data table of 1,000 complex points was collected for each free induction decay (FID). The band width was 2 kHz. The stimulation-response sequence was repeated every 5 s.
The spectroscopic measurements were performed according to the quantification and quality assessment protocols defined by the EEC Concerted Research Project on "Tissue Characterization by M RS and M RI," COMAC-BME 11. 1.3.
All studies were performed on occipital lobes by the depth-resolved surface-coil spectroscopy (DRESS) localization technique (Bottomly et al., 1984). The surface coil (with a test tube filled with water in the center) was placed directly on the skull in the occipital region and precisely positioned by imaging the brain as previously reported (Barbiroli et al., 1990). The profile of the sensitivity volume of the coil (Barbiroli et al., 199 1; Keevil et al., 199 1) was routinely overlapped to the proton image of the brain to avoid contamination by muscle resonances. The flip angle in the selected volume was approximately 30°, and it was not necessary to introduce any correction for saturation effects due to repetition time. Four hundred FIDs were accumulated to obtain a signal-to-noise ratio for j3-ATP of 9- 12. The accumulated spectra were transferred to the data station and processed using 4 Hz line broadening and manual phasing. The baseline distortion due to the technique itself was removed by the method of Allman et al. ( 1989). To quantify the individual components, a curve-fitting program supplied with the Nicolet data station (RUN GENCAP) was used, assuming a Lorentzian line shape, and using a 14-line parameter analysis as previously described (Barbiroli et aI., 1990). Spectra were analyzed blindly without knowing the subject status (whether patient or control).
Metabolite concentrations were calculated assuming a cytosolic [ATP] of 3.0 mM, a value found in animal (Chapman et aI., 198 1) and human brain (Bottomly and Hardy, 1989). We do not have absolute data on ATP content in the brain of patients with mitochondrial cytopathies. Nevertheless, if [ATP] were lower in these patients, [ADP] would be even higher.
Mitochondrial functionality was assessed by calculating the ADP concentration (Degani et aI., 1987; Petroff et al., 1988), a major regulator of mitochondrial respiration (Chance and Williams, 1955; Chance et aI., 1986), the phosphorylation potential (PP), a measure of the readily available free energy in the cell (Veech et aI., 1979), and
the percentage of the maximal rate of ATP biosynthesis (V/V max) (Nioka et aI., 1987).
Intracellular pH The intracellular pH was calculated from the chemical
shift of inorganic phosphate (Pi) from phosphocreatine (PCr) (Petroff et al., 1984).
Statistical analysis Results are presented as mean ± SD. Statistical signif
icance was determined using Student's t test for unpaired data.
RESULTS
Figure 1 reports a typical 31 P MR spectrum of occipital lobes from a patient (case no. 9) compared with an age- and sex-matched control. A low intensity of PCr resonance can be seen in the patient's spectrum accompanied by a small increase in Pi resonance. PCr was significantly decreased in all patients as shown by Fig. 2, which reports the distribution of all cases studied. On the other hand, an increased Pi concentration was not a common finding in all patients, although the average value of the patient group was significantly (p = 0.009) different
UJ W � 0 Cl.. Cl..
Pi
per A
ATP
a
B
FIG. 1. Phosphorus-31 magnetic resonance (31 P MRS) spectrum of occipital lobes from a patient with a mitochondrial cytopathy (patient no. 9) (A) compared with an age- and sexmatched normal volunteer (8). PME = phosphomonoesters; Pi = inorganic phosphate; POE = phosphodiesters; per =
phosphocreatine.
J Cereb Blood Flow Me/ab, Vol. 13, No.3, 1993

472 B. BARBIROLI ET AL.
5 r--n----------------------� a 100
4
gl: at 0 8 0 8t 80 a...
I- a...
Iii 8 0
--- i * -t- Ir- -
-1= x
I --
�I 60 (\l E
--- - > ,- .......
�! > 1:-
3
::::!: I .. - 40 ::::!:
� :::J. -- -
, -
� a... 0
a «
20
E 2
U a...
o L-__________________________ � o per Pi ADP V IVmax PP
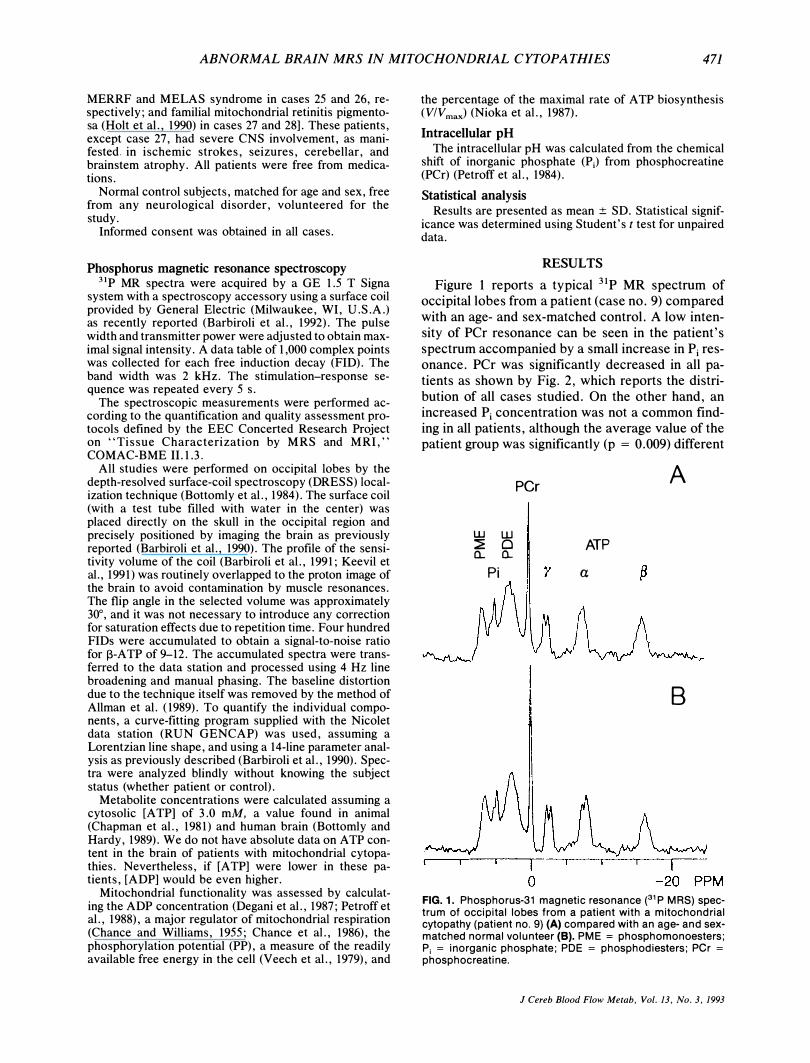
FIG. 2. Distribution of [PCr], [P;], [ADP], VlVmax, and phosphorylation potential (PP) for normal controls (open circles) and patients with mitochondrial cytopathies (closed circles). Left ordinate: scale for [PCr] and [Pi]; right ordinate: scale for [ADP], VlVmax, and PP. Note that this distribution clearly defines two distinct populations for all variables except for Pi'
from the control group (Table 2). An elevated Pi content was found in 14 of 28 patients, the others being within the normal range.
The average AOP concentration in the patient group was significantly (p = 0. 000) higher than in the control group (Table 2), the [AOP] of all patients being higher than the highest value found in normal volunteers (Fig. 2). AOP is the major regulator of mitochondrial respiration with a Km in the range of 20 fLM (Matthews and Arnold, 1990; Matthews et a1., 1991). Hence, an increased AOP level shows a defective mitochondrial functionality in all patients. This is also shown by an increased percentile value
TABLE 2. Brain (occipital lobes) 31 P MR spectroscopy data and mitochondrial function of 28 patients with
mitochondrial cytopathies, and 20 healthy control subjects
31p MRS data PCr (mM) Pi (mM) pH
Calculated mitochondrial values ADP ( .... M)
V/Vmax (%) PP
Patients
3.45 ± 0.33a 1.40 ± O.17b
7.04 ± 0.02c
43 ± 7.4" 64 ± 2.9a 52 ± 8.8a
Controls
4.44 ± 0.28 1.28 ± 0.12 7.03 ± 0.02
28 ± 2.6 55 ± 2.0 83 ± 7.4
PP = phosphorylation potential. Figures are means ± SD. Statistical significance was determined by Student's t test for unpaired data.
a p = 0.000, bp = 0.009, Cnot significant.
J Cereb Blood Flow Metab, Vol. 13, No.3, 1993
of the maximal rate of ATP biosynthesis (V/V max) , and by a decreased PP.
The mean value of the PP in 14 patients without any brain symptoms, i.e., 9 with CPEO (cases 1-9) plus 5 with mitochondrial myopathies (cases 19-23), was 57 ± 5.74 (SO), while the mean value of 6 patients with LHON and no brain symptoms other than optic neuropathy was 49.5 ± 3.73 (SO). It is also noteworthy that patients no. 24, 25, 26, and 28 with severe brain symptoms had a much lower PP value, i.e., 32, 39, 41, and 34, respectively.
DISCUSSION
Phosphorus MRS to our knowledge is the only noninvasive method that, by direct measurement of high-energy phosphates, affords essential information on the efficiency of A TP production and the extent to which oxidative metabolism meets the bioenergetic needs of cell function. The knowledge of PCr and Pi concentrations enables the calculation of the velocity of oxidative metabolism V in relation to its maximum capability V max according to the Michaelis-Menten relationship, which involves control by ADP and Pi'
We performed brain spectroscopy on occipital lobes in all patients; only two (cases 24 and 26) showed symptoms or signs attributable to the occipital cortex. To avoid the contribution of neck and skull skeletal muscles, we checked the profile of the sensitivity volume of the coil when used with the DRESS localization technique by a specifically designed phantom (Barbiroli et a1., 1991; Keevil et a1. , 1991). The surface coil was positioned after overlapping the profile of the sensitivity volume of the coil on the proton image of the brain. Contamination by muscle resonances was negligible, if any, in our experimental conditions and the signals could be attributed mainly to the brain cortex. Moreover, involvement of neck muscles was not prominent in any of our patients. Despite this, it is conceivable that some muscle contamination, still undetectable by proton imaging, could have occurred, thus affecting our measurements of the PCr concentration. However, our results were the same in those patients who in principle could have atrophy (such as cases 1-12 and 19-23), and in those where the neck muscles were absolutely normal (such as cases 13-18, 24, and 27-28). Muscle contamination, therefore, did not play any significant role in the quantitative evaluation of brain PCr in our group of patients under our experimental conditions.
The concentrations of PCr and Pi in the brain of healthy volunteers were somewhat different from the ones reported by other authors (Eleff et a1.,

ABNORMAL BRAIN MRS IN MITOCHONDRIAL CYTOPATHIES 473
1990; Matthews et aI., 1991). The difference can be attributed in part to the different techniques used, in part to different brain areas studied, and in part to the number of lines used to quantify the single resonances of brain spectra (see the Materials and Methods section).
A PCr concentration lower than in matched healthy volunteers was common to all patients. On the other hand, only 14 of 28 patients had an increased Pi content. However, as the patients with normal Pi content had a low [PCr], the ADP concentration, calculated from the creatine kinase equilibrium (Degani et aI., 1987; Petroff et al., 1988), was also abnormal in all cases (Fig. 2). It is known from brain studies on animal models that it is possible to recognize stable and unstable states of metabolism by knowing the ADP concentration (Clark et al., 1987; Delivoria-Papadopulos and Chance, 1988), the relationship between the rate of mitochondrial ATP biosynthesis and [ADP] having the characteristics of a rectangular hyperbola (Chance et al., 1985,1986). Therefore, an increased cytosolic free [ADP] indicates that the brain tissue operates nearer to the asymptote of the hyperbola and that brain cells are in a more unstable metabolic condition.
A derangement of brain energy metabolism in patients with abnormal mitochondrial functionality has also been found by Frackowiak et al. (1988) by positron emission tomography (PET), and their results are consistent with an increased ADP concentration.
A defective mitochondrial functionality was also shown in all patients by an increased percent value of V/V max for ATP biosynthesis. Eleff et al. (1990) reported a V/V max of 56% in the brain of normal individuals. We found a V/V max of 55% in our control group, while the patient group had a mean of 64%. These findings indicate that the actual rate of ATPase is increased in functioning mitochondria since the ones that have a functional deficit are unable to supply enough ATP to fulfill the energy demand of the cell. The V/V max values of single patients ranged from 59 to 70% (Fig. 2), a value higher than the highest value found in normal individuals.
All of our patients also showed a decreased cytosolic PP, an expression of the readily available free energy in the cell (Veech et al., 1979); hence, this is another index of mitochondrial functionality in steady-state conditions. The lower the PP, the smaller the energy reserve available in the cell. The PP of patients without any brain symptoms (nine CPEO + six MM) was significantly (p = 0.012) different from the mean value found in six patients with optic neuropathy as the only brain sign
(LHON), the mean value of the latter group being 2 SD higher than the single values found in the patients with severe brain symptoms. This evidence supports the existence of a relationship between the PP and the severity of brain symptoms. However, at the moment we do not have enough data to draw a definite conclusion on whether brain symptoms in mitochondrial cytopathies depend on the degree of impairment of brain energy metabolism in the different clinical phenotypes studied.
Our present findings confirm and extend previous results reported by Eleff et al. (1990) and our group (Montagna et al., 1992) that impaired mitochondrial function of brain cortex may be associated with any of the clinical expressions of mitochondrial cytopathies, and that 31p MRS is able to uncover a deficit of brain energy metabolism not only in affected patients, but also in those patients without any brain symptoms and/or signs.
Acknowledgment: The financial support of TelethonItaly and of Regione Emilia-Romagna to the project is gratefully acknowledged. The authors are grateful to Dr. Britton Chance, Department of Biochemistry and Biophysics, University of Pennsylvania, for constant consultation and advice. The MR system was a generous gift of the late Mr. Enzo Ferrari (Maranello, Modena), who made this study possible. R. F. is the recipient of a UILDM-Sezione di Modena Fellowship.
REFERENCES
Allman T, Holland GA, Lenkinsky RE, Charles HC (1988) A simple method for processing NMR spectra in which acquisition is delayed: Application to in vivo localized 31p NMR spectra acquired using the DRESS technique. Magn Reson Med 7:88-94
Barbiroli B, Montagna P, Cortelli P, Martinelli P, Sacquegna T, Zaniol P, Lugaresi E (1990) Complicated migraine studied by phosphorus magnetic resonance spectroscopy. Cephalalgia 10:263-272
Barbiroli B, Bassoli P, Ferraresi M, Golinelli R, Santinelli P, Serafini M, Zaniol P (1991) A test object for quality control of 31p_MRS probes and localization techniques in a wholebody imager-spectrometer. Eurospin Q 27:36-37
Barbiroli B, Montagna P, Cortelli P, Funicello R, Iotti S, Monari L, Pierangeli G, Zaniol P, Lugaresi E (1992) Abnormal brain and muscle energy metabolism shown by 31p magnetic resonance spectroscopy in patients affected with migraine with aura. Neurology 42: 1209-1214
Berenberg RA, Pellock JM, DiMauro S, Schotland DL, Bonilla E, Eastwood A, Hays A, Vicale CT, Behrens M, Chutorian A, Rowland LP (1977) Lumping or splitting? "Ophthalmoplegia-pius" or Kearns-Sayre syndrome? Ann Neuroll: 37-54
Berkovic SF, Carpenter S, Evans A, Karpati G, Shoubridge EA, Andermann F, Meyer E, Tyler JL, Diksic M, Arnold D, Wolfe LS, Andermann E, Hakim AM (1989) Myoclonus epilepsy and ragged-red fibres (MERRF): A clinical, pathological, biochemical, magnetic resonance spectrographic, and positron emission tomographic study with a new hypothesis for the pathogenesis of mitochondrial encephalomyopathies. Brain 112:1231-1260
Bottomly PA, Foster TH, Darrow RD (1984) Depth-resolved sur-
J Cereb Blood Flow Metab, Vol. /3, No.3, 1993

474 B. BARBIROLI ET AL.
face-coil spectroscopy (DRESS) for in vivo lH, 31p, and l3C NMR. J Magn Reson 59:338-342
Bottomly PA, Hardy CJ (1989) Rapid, reliable in vivo assay of human phosphate metabolites by nuclear magnetic resonance. Clin Chern 35:392-395
Borud 0, Torbergsen T, Mathieson E. (1987) Increased lactate in cerebrospinal fluid from 7 siblings in a family with mitochondrial myopathy and cerebral ataxia. J Inherited Metab Dis 10:400
Bresolin N, Martinelli TP, Barbiroli B, Zaniol P, Ausenda C, Montagna P, Gallanti A, Comi GP, Scarlato G, Lugaresi E (1991) Muscle mitochondrial DNA deletion and 3Ip_MR spectroscopy alterations in a migraine patient. J Neurol Sci 104: 182-189
Chance B, Leigh JS Jr, Clark BJ, Maris J, Kent J, Nioka S, Smith D (1985) Control of oxidative phosphorylation and oxygen delivery in human skeletal muscle: A steady-state analysis of the work/energy cost transfer function. Proc Natl Acad Sci USA 82:8384-8388
Chance B, Leigh JS Jr, Kent J, McCully K, Nioka S, Clark BJ, Maris JM, Graham T (1986) Multiple controls of oxidative metabolism in living tissues as studied by phosphorus magnetic resonance. Proc Soc Natl Acad Sci USA 83:9458-9462
Chance B, Williams G (1955) Respiratory enzymes in oxidative phosphorylation. I. Kinetics of oxygen utilization. J Bioi Chern 217:383-393
Chapman AG, Westberger E, Siesjo BK (1981) The metabolism of purine and pyrimidine nucleotides in rat cortex during insulin-induced hypoglycemia and recovery. J Neurachem 36: 179-189
Clark BJ, Smith D, Chance B (1987) Metabolic consequences of oxygen transport studied with phosphorus magnetic resonance spectroscopy. In: Oxygen Transport and Utilization (Bryan-Vrown CW, Ayres SM, eds), Fullerton, CA, Society for Critical Care Medicine, pp 144--170
Cortelli P, Montagna P, Avoni P, Sangiorgi S, Bresolin N, Moggio M, Zaniol P, Mantovani V, Barboni P, Barbiroli B, Lugaresi E (1991) Leber's hereditary optic neuropathy: Genetic, biochemical, and phosphorus magnetic resonance spectroscopy study in an Italian family. Neurology 41: 1211-1215
Degani H, Alger JR, Shulman RG, Petroff OAC, Prichard JW (1987) 31 P magnetization transfer studies of creatine kinase kinetics in living rabbit brain. Magn Reson Med 5:1-12
Delivoria-Papadopulos M, Chance B (1988) 3Ip_NMR spectroscopy in the newborn. In: Neonatal Intensive Care (Guthrie RD, ed), New York, Churchill Livingstone, pp 153-179
Di Mauro S, Bonilla E, Zeviani M, Nakagawa M, De Vivo DC (1985) Mitochondrial myopathies. Ann NeuroI17:521-538
Eleff SM, Barker PB, Blackband SJ, Chatham JC, Lutz NW, Johns RD, Bryan NR, Hurko ° (1990) Phosphorus magnetic resonance spectroscopy of patients with mitochondrial cytopathies demonstrates decreased levels of brain phosphocreatine. Ann Neural 27:626--630
J Cereb Blood Flow Metab. Vol. 13. No. 3. 1993
Frackowiak RSJ, Herold S, Petty RKH, Morgan-Hughes JA (1988) The cerebral metabolism of glucose and oxygen measured with positron tomography in patients with mitochondrial diseases. Brain 111: 1009--1024
Holt n, Harding AE, Petty RKH, Morgan-Huges JA (1990) A new mitochondrial disease associated with mitochondrial DNA heteroplasmy. Am J Hum Genet 46:428-433
Hurko 0, McKann GM (1986) Presentation of metabolic diseases. In: Diseases of the Nervous System: Clinical Neurobiology (Asbury AK, McKann GM, McDonald WI, eds), Philadelphia, W. B. Saunders, pp 780--794
Keevil SF, Barbiroli B, Collins D, Heriksen 0, Longo R, Moore C, Segebarth C, Smith MA (1991) Results of a multi-centre trial of test objects for localized in vivo NMR spectroscopy. Eurospin Q 27:63--69
Matthews PM, Arnold DL (1990) Phosphorus magnetic resonance spectroscopy of brain in mitochondrial cytopathies. Ann Neural 28:839-840
Matthews PM, Berkovic SF, Shoubridge EA, Anderman F, Karpati G, Carpenter A, Arnold DL (1991) In vivo magnetic resonance spectroscopy of brain and muscle in a type of mitochondrial encephalomyopathy (MERRF). Ann Neurol 29:435-437
Montagna P, Martinelli P, Cortelli P, Zaniol P, Lugaresi E, Barbiroli B (1992) Brain 3lP-magnetic resonance spectroscopy in mitochondrial cytopathies. Ann Neural 31:451-452
Nioka S, Chance B, Hilberman M, Subramanian HV, Leigh JS Jr, Veech RL, Forster RE (1987) Relationship between intracellular pH and energy metabolism in dog brain as measured by 31p_NMR. J Appl Physiol 62:2094--2102
Pavlakis SG, Phillips PC, Di Mauro S, De Vivo DC, Rowland LP (1984) Mitochondrial myopathy, encephalopathy, lactic acidosis and stroke like episodes: A distinctive clinical syndrome. Ann Neurol 16:481-488
Petroff OAC, Prichard JW, Behar KL, Alger JR, Shulman T (1984) Cerebral metabolism in hyper and hypocarbia: 31p and IH nuclear magnetic resonance studies. Magn Reson Med 1:589-593
Petroff OAC, Ogini T, Alger JR (1988) High resolution proton magnetic resonance spectroscopy of rabbit brain: Regional metabolite levels and postmortem changes. J Neurochem 51:163-171
Schneck L, Adachi M, Briet P, Wolintz A, Yolk BW (1973) Ophthalmoplegia plus with morphological and chemical studies of cerebellar and muscle tissue. J Neurol Sci 19:37-44
Veech RL, Lawson JWR, Cornell NW, Krebs HA (1979) Cytosolic phosphorylation potential. J Biol Chern 254:6538--6547
Wallace DC, Zheng X, Lott MT (1988) Familial mitochondrial encephalomyopathy (MERRF): Genetic, pathophysiological, and biochemical characterization of a mitochondrial DNA disease. Cell 55:601--610
Copyright © 2022 FDOKUMEN