Deep exclusive π+ electroproduction off the proton at CLAS
18
DOI 10.1140/epja/i2013-13016-9 Regular Article – Experimental Physics Eur. Phys. J. A (2013) 49: 16 T HE EUROPEAN P HYSICAL JOURNAL A Deep exclusive π + electroproduction off the proton at CLAS K. Park 35, a , M. Guidal 21 , R.W. Gothe 34 , J.M. Laget 35 , M. Gar¸ con 7 , K.P. Adhikari 29 , M. Aghasyan 18 , M.J. Amaryan 29 , M. Anghinolfi 19 , H. Avakian 35 , H. Baghdasaryan 39,41 , J. Ball 7 , N.A. Baltzell 1 , M. Battaglieri 19 , I. Bedlinsky 22 , R.P. Bennett 29 , A.S. Biselli 11,30 , C. Bookwalter 13 , S. Boiarinov 35 , W.J. Briscoe 15 , W.K. Brooks 36,35 , V.D. Burkert 35 , D.S. Carman 35 , A. Celentano 19 , S. Chandavar 28 , G. Charles 7 , M. Contalbrigo 17 , V. Crede 13 , A. D’Angelo 20,32 , A. Daniel 28 , N. Dashyan 41 , R. De Vita 19 , E. De Sanctis 18 , A. Deur 35 , C. Djalali 34 , G.E. Dodge 29 , D. Doughty 8,35 , R. Dupre 7 , H. Egiyan 35 , A. El Alaoui 1 , L. El Fassi 1 , P. Eugenio 13 , G. Fedotov 34 , S. Fegan 37 , J.A. Fleming 10 , T.A. Forest 16 , A. Fradi 21 , N. Gevorgyan 41 , G.P. Gilfoyle 31 , K.L. Giovanetti 23 , F.X. Girod 35 , W. Gohn 9 , E. Golovatch 33 , L. Graham 34 , K.A. Griffioen 40 , B. Guegan 21 , L. Guo 12,35 , K. Hafidi 1 , H. Hakobyan 36,41 , C. Hanretty 39 , D. Heddle 8,35 , K. Hicks 28 , D. Ho 5 , M. Holtrop 26 , Y. Ilieva 34,15 , D.G. Ireland 37 , B.S. Ishkhanov 33 , D. Jenkins 38 , H.S. Jo 21 , D. Keller 39 , M. Khandaker 27 , P. Khetarpal 12 , A. Kim 24 , W. Kim 24 , F.J. Klein 6 , S. Koirala 29 , A. Kubarovsky 30,33 , V. Kubarovsky 35 , S.E. Kuhn 29 , S.V. Kuleshov 36,22 , K. Livingston 37 , H.Y. Lu 5 , I.J.D. MacGregor 37 , Y. Mao 34 , N. Markov 9 , D. Martinez 16 , M. Mayer 29 , B. McKinnon 37 , C.A. Meyer 5 , T. Mineeva 9 , M. Mirazita 18 , V. Mokeev 35,33, b , H. Moutarde 7 , E. Munevar 35 , C. Munoz Camacho 21 , P. Nadel- Turonski 35 , C.S. Nepali 29 , S. Niccolai 21,15 , G. Niculescu 23,28 , I. Niculescu 23,35 , M. Osipenko 19 , A.I. Ostrovidov 13 , L.L. Pappalardo 17 , R. Paremuzyan 41, c , S. Park 13 , E. Pasyuk 35,2 , S. Anefalos Pereira 18 , E. Phelps 34 , S. Pisano 18 , O. Pogorelko 22 , S. Pozdniakov 22 , J.W. Price 3 , S. Procureur 7 , D. Protopopescu 37,26 , A.J.R. Puckett 35 , B.A. Raue 12,35 , G. Ricco 14, d , D. Rimal 12 , M. Ripani 19 , G. Rosner 37 , P. Rossi 18 , F. Sabati´ e 7 , M.S. Saini 13 , C. Salgado 27 , D. Schott 12 , R.A. Schumacher 5 , E. Seder 9 , H. Seraydaryan 29 , Y.G. Sharabian 35 , E.S. Smith 35 , G.D. Smith 37 , D.I. Sober 6 , D. Sokhan 21 , S.S. Stepanyan 24 , P. Stoler 30 , I.I. Strakovsky 15 , S. Strauch 34,15 , M. Taiuti 14, e , W. Tang 28 , C.E. Taylor 16 , Ye Tian 34 , S. Tkachenko 39 , A. Trivedi 34 , M. Ungaro 35,30 , B. Vernarsky 5 , H. Voskanyan 41 , E. Voutier 25 , N.K. Walford 6 , D.P. Watts 10 , L.B. Weinstein 29 , D.P. Weygand 35 , M.H. Wood 4,34 , N. Zachariou 34 , J. Zhang 35,29 , Z.W. Zhao 39 , and I. Zonta 20, f 1 Argonne National Laboratory, Argonne, Illinois 60439, USA 2 Arizona State University, Tempe, Arizona 85287-1504, USA 3 California State University, Dominguez Hills, Carson, California 90747, USA 4 Canisius College, Buffalo, New York 14208, USA 5 Carnegie Mellon University, Pittsburgh, Pennsylvania 15213, USA 6 Catholic University of America, Washington, D.C. 20064, USA 7 CEA, Centre de Saclay, Irfu/Service de Physique Nucl´ eaire, 91191 Gif-sur-Yvette, France 8 Christopher Newport University, Newport News, Virginia 23606, USA 9 University of Connecticut, Storrs, Connecticut 06269, USA 10 Edinburgh University, Edinburgh EH9 3JZ, UK 11 Fairfield University, Fairfield Connecticut 06824, USA 12 Florida International University, Miami, Florida 33199, USA 13 Florida State University, Tallahassee, Florida 32306, USA 14 Universit`a di Genova, 16146 Genova, Italy 15 The George Washington University, Washington, D.C. 20052, USA 16 Idaho State University, Pocatello, Idaho 83209, USA 17 INFN, Sezione di Ferrara, 44100 Ferrara, Italy 18 INFN, Laboratori Nazionali di Frascati, 00044 Frascati, Italy 19 INFN, Sezione di Genova, 16146 Genova, Italy 20 INFN, Sezione di Roma Tor Vergata, 00133 Rome, Italy 21 Institut de Physique Nucl´ eaire ORSAY, Orsay, France 22 Institute of Theoretical and Experimental Physics, Moscow, 117259, Russia 23 James Madison University, Harrisonburg, Virginia 22807, USA 24 Kyungpook National University, Daegu 702-701, Republic of Korea 25 LPSC, Universit´ e Joseph Fourier, CNRS/IN2P3, INPG, Grenoble, France 26 University of New Hampshire, Durham, New Hampshire 03824-3568, USA 27 Norfolk State University, Norfolk, Virginia 23504, USA
-
Upload
independent -
Category
Documents
-
view
0 -
download
0
Transcript of Deep exclusive π+ electroproduction off the proton at CLAS

DOI 10.1140/epja/i2013-13016-9
Regular Article – Experimental Physics
Eur. Phys. J. A (2013) 49: 16 THE EUROPEANPHYSICAL JOURNAL A
Deep exclusive π+ electroproduction off the proton at CLAS
K. Park35,a, M. Guidal21, R.W. Gothe34, J.M. Laget35, M. Garcon7, K.P. Adhikari29, M. Aghasyan18,M.J. Amaryan29, M. Anghinolfi19, H. Avakian35, H. Baghdasaryan39,41, J. Ball7, N.A. Baltzell1, M. Battaglieri19,I. Bedlinsky22, R.P. Bennett29, A.S. Biselli11,30, C. Bookwalter13, S. Boiarinov35, W.J. Briscoe15, W.K. Brooks36,35,V.D. Burkert35, D.S. Carman35, A. Celentano19, S. Chandavar28, G. Charles7, M. Contalbrigo17, V. Crede13,A. D’Angelo20,32, A. Daniel28, N. Dashyan41, R. De Vita19, E. De Sanctis18, A. Deur35, C. Djalali34, G.E. Dodge29,D. Doughty8,35, R. Dupre7, H. Egiyan35, A. El Alaoui1, L. El Fassi1, P. Eugenio13, G. Fedotov34, S. Fegan37,J.A. Fleming10, T.A. Forest16, A. Fradi21, N. Gevorgyan41, G.P. Gilfoyle31, K.L. Giovanetti23, F.X. Girod35,W. Gohn9, E. Golovatch33, L. Graham34, K.A. Griffioen40, B. Guegan21, L. Guo12,35, K. Hafidi1, H. Hakobyan36,41,C. Hanretty39, D. Heddle8,35, K. Hicks28, D. Ho5, M. Holtrop26, Y. Ilieva34,15, D.G. Ireland37, B.S. Ishkhanov33,D. Jenkins38, H.S. Jo21, D. Keller39, M. Khandaker27, P. Khetarpal12, A. Kim24, W. Kim24, F.J. Klein6,S. Koirala29, A. Kubarovsky30,33, V. Kubarovsky35, S.E. Kuhn29, S.V. Kuleshov36,22, K. Livingston37, H.Y. Lu5,I.J.D. MacGregor37, Y. Mao34, N. Markov9, D. Martinez16, M. Mayer29, B. McKinnon37, C.A. Meyer5,T. Mineeva9, M. Mirazita18, V. Mokeev35,33,b, H. Moutarde7, E. Munevar35, C. Munoz Camacho21, P. Nadel-Turonski35, C.S. Nepali29, S. Niccolai21,15, G. Niculescu23,28, I. Niculescu23,35, M. Osipenko19, A.I. Ostrovidov13,L.L. Pappalardo17, R. Paremuzyan41,c, S. Park13, E. Pasyuk35,2, S. Anefalos Pereira18, E. Phelps34, S. Pisano18,O. Pogorelko22, S. Pozdniakov22, J.W. Price3, S. Procureur7, D. Protopopescu37,26, A.J.R. Puckett35, B.A. Raue12,35,G. Ricco14,d, D. Rimal12, M. Ripani19, G. Rosner37, P. Rossi18, F. Sabatie7, M.S. Saini13, C. Salgado27, D. Schott12,R.A. Schumacher5, E. Seder9, H. Seraydaryan29, Y.G. Sharabian35, E.S. Smith35, G.D. Smith37, D.I. Sober6,D. Sokhan21, S.S. Stepanyan24, P. Stoler30, I.I. Strakovsky15, S. Strauch34,15, M. Taiuti14,e, W. Tang28, C.E. Taylor16,Ye Tian34, S. Tkachenko39, A. Trivedi34, M. Ungaro35,30, B. Vernarsky5, H. Voskanyan41, E. Voutier25, N.K. Walford6,D.P. Watts10, L.B. Weinstein29, D.P. Weygand35, M.H. Wood4,34, N. Zachariou34, J. Zhang35,29, Z.W. Zhao39, andI. Zonta20,f
1 Argonne National Laboratory, Argonne, Illinois 60439, USA2 Arizona State University, Tempe, Arizona 85287-1504, USA3 California State University, Dominguez Hills, Carson, California 90747, USA4 Canisius College, Buffalo, New York 14208, USA5 Carnegie Mellon University, Pittsburgh, Pennsylvania 15213, USA6 Catholic University of America, Washington, D.C. 20064, USA7 CEA, Centre de Saclay, Irfu/Service de Physique Nucleaire, 91191 Gif-sur-Yvette, France8 Christopher Newport University, Newport News, Virginia 23606, USA9 University of Connecticut, Storrs, Connecticut 06269, USA
10 Edinburgh University, Edinburgh EH9 3JZ, UK11 Fairfield University, Fairfield Connecticut 06824, USA12 Florida International University, Miami, Florida 33199, USA13 Florida State University, Tallahassee, Florida 32306, USA14 Universita di Genova, 16146 Genova, Italy15 The George Washington University, Washington, D.C. 20052, USA16 Idaho State University, Pocatello, Idaho 83209, USA17 INFN, Sezione di Ferrara, 44100 Ferrara, Italy18 INFN, Laboratori Nazionali di Frascati, 00044 Frascati, Italy19 INFN, Sezione di Genova, 16146 Genova, Italy20 INFN, Sezione di Roma Tor Vergata, 00133 Rome, Italy21 Institut de Physique Nucleaire ORSAY, Orsay, France22 Institute of Theoretical and Experimental Physics, Moscow, 117259, Russia23 James Madison University, Harrisonburg, Virginia 22807, USA24 Kyungpook National University, Daegu 702-701, Republic of Korea25 LPSC, Universite Joseph Fourier, CNRS/IN2P3, INPG, Grenoble, France26 University of New Hampshire, Durham, New Hampshire 03824-3568, USA27 Norfolk State University, Norfolk, Virginia 23504, USA
Page 2 of 18 Eur. Phys. J. A (2013) 49: 16
28 Ohio University, Athens, Ohio 45701, USA29 Old Dominion University, Norfolk, Virginia 23529, USA30 Rensselaer Polytechnic Institute, Troy, New York 12180-3590, USA31 University of Richmond, Richmond, Virginia 23173, USA32 Universita di Roma Tor Vergata, 00133 Rome, Italy33 Skobeltsyn Nuclear Physics Institute, Skobeltsyn Nuclear Physics Institute, 119899 Moscow, Russia34 University of South Carolina, Columbia, South Carolina 29208, USA35 Thomas Jefferson National Accelerator Facility, Newport News, Virginia 23606, USA36 Universidad Tecnica Federico Santa Marıa, Casilla 110-V Valparaıso, Chile37 University of Glasgow, Glasgow G12 8QQ, UK38 Virginia Polytechnic Institute and State University, Blacksburg, Virginia 24061-0435, USA39 University of Virginia, Charlottesville, Virginia 22901, USA40 College of William and Mary, Williamsburg, Virginia 23187-8795, USA41 Yerevan Physics Institute, 375036 Yerevan, Armenia
Received: 11 June 2012 / Revised: 7 December 2012Published online: 30 January 2013c© The Author(s) 2013. This article is published with open access at Springerlink.comCommunicated by Z.-E. Meziani
Abstract. The exclusive electroproduction of π+ above the resonance region was studied using the CEBAFLarge Acceptance Spectrometer (CLAS) at Jefferson Laboratory by scattering a 6 GeV continuous electronbeam off a hydrogen target. The large acceptance and good resolution of CLAS, together with the highluminosity, allowed us to measure the cross section for the γ∗p → nπ+ process in 140 (Q2, xB , t) bins:0.16 < xB < 0.58, 1.6 GeV2 < Q2 < 4.5 GeV2 and 0.1 GeV2 < −t < 5.3 GeV2. For most bins, the statisticalaccuracy is on the order of a few percent. Differential cross sections are compared to four theoreticalmodels, based either on hadronic or on partonic degrees of freedom. The four models can describe thegross features of the data reasonably well, but differ strongly in their ingredients. In particular, the modelbased on Generalized Parton Distributions (GPDs) contain the interesting potential to experimentallyaccess transversity GPDs.
1 Introduction
One of the major challenges in contemporary nuclearphysics is the study of the transition between hadronicand partonic pictures of the strong interaction. At asymp-totically short distances, the strong force is actually weakand the appropriate degrees of freedom are the quarksand gluons (partons) whose interaction can be quantifiedvery precisely by perturbative Quantum Chromodynam-ics (pQCD). However, at larger distances on the orderof oneFermi, effective theories that take hadrons as ele-mentary particles whose interactions are described by theexchange of mesons appear more applicable. The connec-tion between these two domains is not well understood.In order to make progress, a systematic study of a seriesof hadronic reactions probing these intermediate distancescales is necessary. The exclusive electroproduction of ameson (or of a photon) from a nucleon, γ∗N → N ′M ,is particularly interesting. Indeed, it offers two ways tovary the scale of the interaction and therefore to studythis transition regime. One can vary the virtuality of the
incoming photon Q2 = −(pe − p′e)2, which effectively rep-
resents the transverse size of the probe, or the momen-tum transfer to the nucleon t = (pN − p′N )2, which effec-tively represents the transverse size of the target. Here, pe
and p′e are the initial and scattered electron four-momentaand pN and p′N are the initial and final nucleon four-momenta, respectively. Figure 1 sketches the transitionregions that have been experimentally explored until now(lightly shaded areas) as a function of these two variables,Q2 and |t|. In this figure, we keep, quite arbitrarily, onlythe experiments for which |t| > 3GeV2 in photoproduc-tion (SLAC [1,2] and JLab [3]) and Q2 > 1.5GeV2 inelectroproduction (Cornell [4,5], JLab [6–8] and HER-MES [9]). These are the domains for which, we believe,there are chances to observe first signs that partonic de-grees of freedom play a role in the reactions. The darklyshaded area in fig. 1 represents the phase space covered bythe present work. It is divided into 140 (Q2, xB or W, t)bins, to be compared to only a few (Q2, xB or W, t) bins inthe lightly shaded areas for the previous electroproductionexperiments.
a e-mail: [email protected] Present address: Skobeltsyn Nuclear Physics Institute, 119899 Moscow, Russia.c Present address: Institut de Phyique Nucleaire ORSAY, Orsay, France.d Present address: INFN, Sezione di Genova, 16146 Genova, Italy.e Present address: INFN, Sezione di Genova, 16146 Genova, Italy.f Present address: Universita di Roma Tor Vergata, 00133 Rome, Italy.

Eur. Phys. J. A (2013) 49: 16 Page 3 of 18
0
2.5
5
7.5
10
0 2 4 6 8 10 12 14-t [GeV2]
Q2 [G
eV2 ]
Fig. 1. (Color online) Schematic representation of the γ∗N →N ′π process (above the resonance region) in different regionsof the (Q2, t) plane. The Feynman diagrams describe the reac-tion in terms of meson exchanges at low Q2 and |t|, in termsof GPDs at large Q2 and small |t|, and in terms of hadrondistribution amplitudes (DA) at large |t|. The lightly shadedareas (magenta and green online) represent approximately theexperimentally explored regions up to now. The darkly shadedarea (blue online) represents the phase space covered by thiswork.
We also display in fig. 1 three Feynman-type diagramsillustrating the mechanisms believed to be at stake forthe γ∗N → N ′M process: at asymptotically large Q2,asymptotically large |t| (both in terms of partonic degreesof freedom) and at low Q2 and low |t| (in terms of hadronicdegrees of freedom).
At asymptotically large Q2 and small |t| (along thevertical axis in fig. 1), the exclusive electroproduction ofa meson should be dominated by the so-called “handbagdiagram” [10–15]. The initial virtual photon hits a quarkin the nucleon and this same quark, after a single gluonexchange, ends up in the final meson. A QCD factoriza-tion theorem [15] states that the complex quark and gluonnon-perturbative structure of the nucleon is described bythe Generalized Parton Distributions (GPDs). For the π+
channel at leading twist in QCD, i.e. at asymptoticallylarge Q2, the longitudinal part of the cross section σL
is predicted to be dominant over the transverse part σT .Precisely, dσL/dt should scale as 1/Q6 at fixed xB and |t|,while dσT /dt should scale as 1/Q8. It is predicted that σL
is sensitive to the helicity-dependent GPDs E and H [15]while, if higher-twist effects are taken into account andfactorization is assumed, σT is sensitive to the transver-sity GPDs, HT and ET = 2HT + ET [16].
At large values of |t|, in photoproduction (i.e. along thehorizontal axis in fig. 1) but also presumably in electropro-duction, the γ(∗)N → N ′M process should be dominatedby the coupling of the (virtual) photon to one of the va-
lence quarks of the nucleon (or of the produced meson),with minimal interactions among the valence quarks. Inthis regime, a QCD factorization theorem states that thecomplex structure of the hadrons is described by distribu-tion amplitudes (DA) which at small distances (large |t|)can be reduced to the lowest Fock states, i.e. 3 quarks forthe nucleon and q-q for the meson [17]. At sufficiently highenergy, constituent counting rules (CCR) [18–20] predictan s−7 scaling of the differential cross section dσ/dt atfixed center-of-mass pion angles, provided |s|, |t|, and |u|are all large. Here s = W 2 is the squared invariant massof the γ∗-p system and u = (p∗γ − p′N )2 is given in termsof the four-vectors p∗γ = pe − p′e and p′N for the final-statenucleon. The large |t| and |u| region corresponds typicallyto a center-of-mass pion angle θcm ≈ 90◦. In this domain,the CCR predict dσ/dt = f(θcm)s2−n for the energy de-pendence of the cross section, where f(θcm) depends ondetails of the dynamics of the process and n is the totalnumber of point-like particles and gauge fields in the ini-tial and final states. For example, our reaction γ∗p → nπ+
should have n = 9, since there is one initial photon, threequarks in the initial and the final nucleons, and two in thefinal pion.
Many questions are open, in particular at which Q2
and s do such scaling laws start to appear. Even if theserespective scaling regimes are not reached at the presentexperimentally accessible Q2 and s values, can one never-theless extract GPDs or DAs, provided that some correc-tions to the QCD leading-twist mechanisms are applied?Only experimental data can help answer such questions.
2 Insights from previous experiments withrespect to partonic approaches
The two most recent series of experiments that have mea-sured exclusive π+ electroproduction off the proton, inthe large-Q2, low-|t| regime where the GPD formalism ispotentially applicable, have been conducted in Hall C atJefferson Lab (JLab) [6–8] and at HERMES [9].
The Hall C experiments, with 2 to 6GeV electronbeam energies, separated the σL and σT cross sectionsof the γ∗p → nπ+ process using the Rosenbluth techniquefor 0.17 < xB < 0.48 and Q2 up to 3.91GeV2. The termσL dominated the cross section for |t| < 0.2GeV2, whileσT was dominant for larger |t| values. These data werecompared to two GPD-based calculations, hereafter re-ferred to as VGG [21] and GK [16,22] from the initials ofthe models’ authors. The comparison of the data with theVGG model can be found in the Hall C publications [6,7]while the comparison with the GK model can be found inthe GK publications [16,22]. For σL, which should be theQCD leading-twist contribution, these GPD calculationswere found to be in general agreement with the magni-tude and the Q2 and t dependencies of the experimentaldata. In these two calculations the main contribution to σL
stems from the E GPD, which is modeled either entirelyas pion-exchange in the t-channel [21] or is at least dom-inated by it [16,22] (see refs. [23,24] for the connection

Page 4 of 18 Eur. Phys. J. A (2013) 49: 16
between the t-channel pion-exchange and the E GPD).This term is also called the “pion pole”, and the differ-ence between the two calculations lies in the particularchoice made for the t-channel pion propagator (Reggeizedor not) and the introduction of a hadronic form factoror not at the πNN vertex. In both calculations, σL con-tains higher-twist effects because the pure leading-twistcomponent of the pion pole largely underestimates thedata. Only the GK model, which explicitly takes into ac-count higher-twist quark transverse momentum, is ableto calculate σT . Agreement between data and calculationis found only if the HT transversity GPD is introduced,which makes up most of σT .
The HERMES experiment used 27.6GeV electron andpositron beams to measure the γ∗p → nπ+ cross sectionat four (xB , Q2) values, with xB ranging from 0.08 to 0.35and Q2 from 1.5 to 5GeV2. Since all data were taken at asingle beam energy, no longitudinal/transverse separationcould be carried out. The differential cross section dσ/dtwas compared to the same two GPD models mentionedabove. The GK model, which calculates both the longitu-dinal and transverse parts of the cross section, displays thesame feature as for the lower energy JLab data, i.e. a dom-inance of σL up to −t ≈ 0.2GeV2, after which σT takesover. The sum of the transverse and longitudinal parts ofthe cross section calculated by the GK model is in verygood agreement with the data over most of the t rangemeasured at HERMES [16,22]. The VGG model, whichcalculates only the longitudinal part of the cross section,is in agreement with the data only for low t values [9].Again, in both calculations, σL is dominated by the EGPD, modeled essentially by the pion pole term, and σT ,in the GK model, is due to the transversity GPDs. TheHERMES experiment also measured the transverse targetspin asymmetry AUT for the γ∗p → nπ+ process, whichindicate [16,22] that the transversity GPDs HT or ET in-deed play an important role in the process, confirming theapproach of the GK group.
The comparison between the JLab Hall C and HER-MES experiments and the two GPD-based calculationsyields very encouraging signs that, although higher-twistcontributions definitely play a major role, these data canbe interpreted in terms of GPDs, in particular transversityGPDs. More precise and extensive data would be highlyuseful to confirm these findings. Firstly, the present CLASexperiment extends somewhat the (xB , Q2) phase spacepreviously covered by the JLab Hall C experiments andsecondly, it covers 20 (xB , Q2) bins (with statistical errorsof a few percent on average) which doubles the numberof bins of the JLab Hall C experiments (and triples theHERMES number of bins). These new data are importantto test the present GPD-based model calculations and, ifsuccessful, bring more stringent constraints on the currentGPD parametrizations.
The large-|t| (large-|u|) domain, where the DA formal-ism is asymptotically applicable for γ(∗)p → nπ+, has sofar been explored only in high-energy photoproduction atSLAC [1,2] and intermediate-energy photoproduction atJLab [25,26]. While the SLAC data tend to follow the s−7
Fig. 2. Three-dimensional view of the CLAS detector.
scaling asymptotic prediction, for a 90◦ center-of-mass an-gle, the more recent JLab data, which are compatible withthe SLAC data but are more precise, actually reveal somelarge oscillations around this s−7 behavior.
In recent years a similar trend, i.e. “global” scal-ing behavior, has been observed in deuteron photo-disintegration experiments [27–33], and also in hyperonphotoproduction [34]. It would be interesting to see thisin exclusive pion electroproduction and if so, whether theoscillations disappear as Q2 increases. The measurementpresented in this article is the first one to explore thislarge-|t|, large-|u| domain (θcm ≈ 90◦) for
√s > 2GeV in
π+ exclusive electroproduction off the proton. The presentCLAS electroproduction experiment covers a t-range up to≈ 5GeV2 while the largest |t| values measured by Hall Care ≈ 0.9GeV2 and by HERMES ≈ 2GeV2.
3 The experiment
The measurement was carried out with the CEBAF LargeAcceptance Spectrometer (CLAS) [35]. A schematic viewof CLAS is shown in fig. 2. CLAS has a toroidal magneticfield generated by six flat superconducting coils (maintorus), arranged symmetrically around the azimuth. Sixidentical sectors are independently instrumented with 34layers of drift cells for particle tracking (R1, R2, R3), plas-tic scintillation counters for time-of-flight (TOF) measure-ments, gas threshold Cherenkov counters (CC) for elec-tron and pion separation, and electromagnetic calorime-ters (EC) for photon and neutron detection. To aid inelectron/pion separation, the EC is segmented into an in-ner part closer to the target and an outer part furtheraway from the target. CLAS covers on average 80% of thefull 4π solid angle for the detection of charged particles.The azimuthal acceptance is maximum at a polar angleof 90◦ and decreases at forward angles. The polar anglecoverage ranges from about 8◦ to 140◦ for the detectionof π+. The scattered electrons are detected in the CC andEC, which extend from 8◦ to 45◦.
Eur. Phys. J. A (2013) 49: 16 Page 5 of 18
The target is surrounded by a small toroidal magnet(mini-torus). This magnet is used to shield the drift cham-bers closest to the target from the intense low-energy elec-tron background resulting from Møller scattering.
A Faraday cup, composed of 4000 kg of lead and75 radiation lengths thick, is located in the beam dump,≈ 29meters downstream the CLAS target. It completelystops the electrons and thus allows to measure the accu-mulated charge of the incident beam and therefore thetotal flux of the beam [35].
The specific experimental data set “e1-6” used for thisanalysis was collected in 2001. The incident beam hadan average intensity of 7 nA and an energy of 5.754GeV.The 5 cm long liquid-hydrogen target was located 4 cmupstream of the CLAS center. This offset of the targetposition was found to optimize the acceptance of forward-going positively charged particles. The main torus mag-net was set to 90% of its maximum field, corresponding toan integral magnetic field of ≈ 2.2Tm in the forward di-rection. The torus current during the run was very stable(< 0.03%). Empty-target runs were performed to measurecontributions from the target cell windows.
In this analysis, the scattered electron and the pro-duced π+ were detected and the final state neutron deter-mined from missing mass. The continuous electron beamprovided by CEBAF is well suited for measurements in-volving two or more final-state particles in coincidence,leading to very small accidental coincidence contributions,smaller than 10−3, for the instantaneous luminosity of1034 cm−2 s−1 of the present measurement.
Raw data were subjected to the calibration and re-construction procedures that are part of the standardCLAS data analysis sequence. Stringent kinematic cutswere applied to select events with one electron candi-date and only one positively charged track. These eventswere then subjected to further selection criteria de-scribed in the following Section. Throughout the analy-sis, the experimental data distributions were comparedto the output of our Monte Carlo program GSIM (seesect. 4).
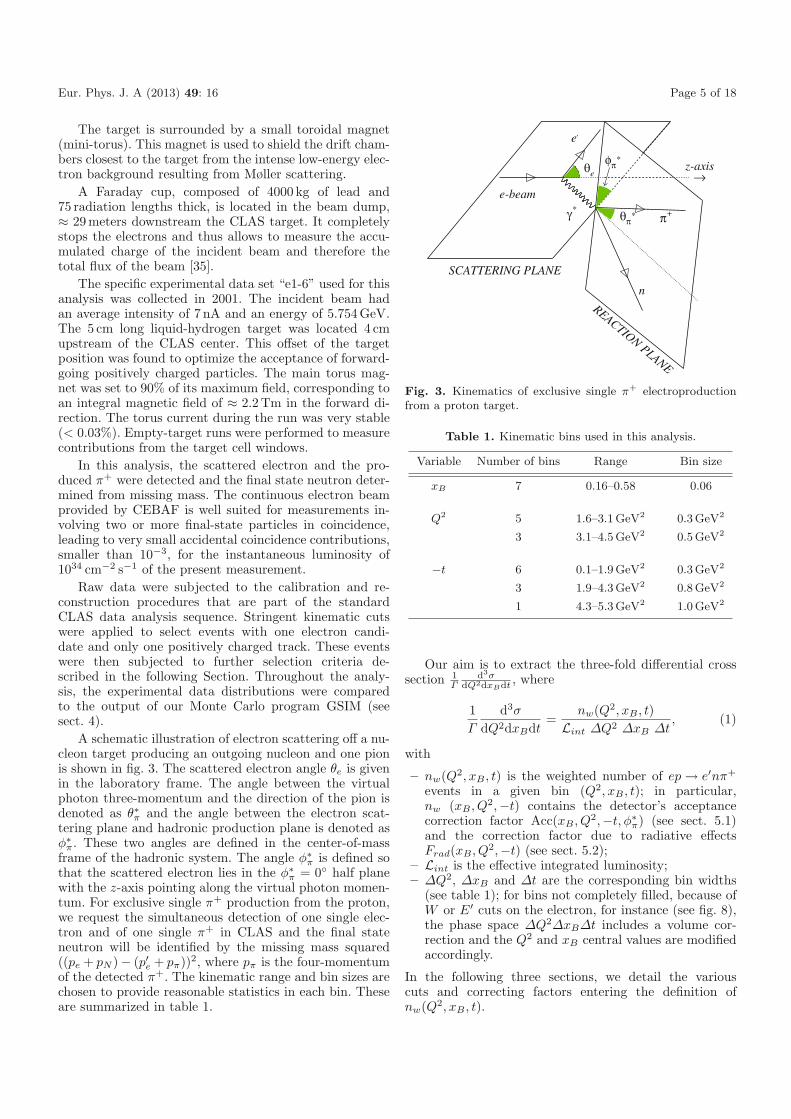
A schematic illustration of electron scattering off a nu-cleon target producing an outgoing nucleon and one pionis shown in fig. 3. The scattered electron angle θe is givenin the laboratory frame. The angle between the virtualphoton three-momentum and the direction of the pion isdenoted as θ∗π and the angle between the electron scat-tering plane and hadronic production plane is denoted asφ∗
π. These two angles are defined in the center-of-massframe of the hadronic system. The angle φ∗
π is defined sothat the scattered electron lies in the φ∗
π = 0◦ half planewith the z-axis pointing along the virtual photon momen-tum. For exclusive single π+ production from the proton,we request the simultaneous detection of one single elec-tron and of one single π+ in CLAS and the final stateneutron will be identified by the missing mass squared((pe + pN )− (p′e + pπ))2, where pπ is the four-momentumof the detected π+. The kinematic range and bin sizes arechosen to provide reasonable statistics in each bin. Theseare summarized in table 1.
e-beam
e,
θe →z-axis
γ*
SCATTERING PLANE
REACTION PLANE
π+θπ*
n
φπ*
Fig. 3. Kinematics of exclusive single π+ electroproductionfrom a proton target.
Table 1. Kinematic bins used in this analysis.
Variable Number of bins Range Bin size
xB 7 0.16–0.58 0.06
Q2 5 1.6–3.1 GeV2 0.3 GeV2
3 3.1–4.5 GeV2 0.5 GeV2
−t 6 0.1–1.9 GeV2 0.3 GeV2
3 1.9–4.3 GeV2 0.8 GeV2
1 4.3–5.3 GeV2 1.0 GeV2
Our aim is to extract the three-fold differential crosssection 1
Γd3σ
dQ2dxBdt , where
1Γ
d3σ
dQ2dxBdt=
nw(Q2, xB , t)Lint ΔQ2 ΔxB Δt
, (1)
with
– nw(Q2, xB , t) is the weighted number of ep → e′nπ+
events in a given bin (Q2, xB , t); in particular,nw (xB , Q2,−t) contains the detector’s acceptancecorrection factor Acc(xB , Q2,−t, φ∗
π) (see sect. 5.1)and the correction factor due to radiative effectsFrad(xB , Q2,−t) (see sect. 5.2);
– Lint is the effective integrated luminosity;– ΔQ2, ΔxB and Δt are the corresponding bin widths
(see table 1); for bins not completely filled, because ofW or E′ cuts on the electron, for instance (see fig. 8),the phase space ΔQ2ΔxBΔt includes a volume cor-rection and the Q2 and xB central values are modifiedaccordingly.
In the following three sections, we detail the variouscuts and correcting factors entering the definition ofnw(Q2, xB , t).

Page 6 of 18 Eur. Phys. J. A (2013) 49: 16
4 Data analysis
4.1 Particle identification and event selection
4.1.1 Electron identification
The electrons are identified at the trigger level by requir-ing at least 640MeV energy deposited in the EC in co-incidence with a signal in the CC (which triggers on onephotoelectron).
Additional requirements for particle identification(PID) were used in the off-line analysis to refine the elec-tron identification. First, we required that the EC andCC hits matched with a reconstructed track in the driftchambers (DC). Second, we correlated the energy de-posited in the EC and the momentum obtained by thetrack reconstruction in the DC. This is aimed at remov-ing the pion contamination. Electrons deposit energy inproportion to their incident energy in the calorimeterwhereas pions are minimum ionizing and deposit a con-stant amount of energy in the calorimeter. The ratio ofthe total deposited energy in the EC to the momentumof the particle is called the sampling fraction. For elec-trons, approximately 30% of the total energy depositedin the EC is directly measured in the active scintillatormaterial. The remainder of the energy is deposited in thelead sheets interleaved between the scintillators. Figure 4shows the sampling fraction E/pe versus particle momen-tum pe. The average sampling fraction for electrons wasfound to be 0.291 for this experiment. The solid lines infig. 4 show the ±3σ sampling fraction cuts used in thisanalysis.
To further reject pions, we required the energy de-posited in the inner EC to be larger than 50MeV. Mini-mum ionizing particles lose less than this amount in the15 cm thickness of the inner EC.
Fiducial cuts were applied to exclude the EC detectoredges. When an electron hit is close to an edge, part of theshower leaks outside the device; in this case, the energycannot be fully reconstructed from the calorimeter infor-mation alone. This problem can be avoided by selectingonly those electrons lying inside a fiducial volume withinthe EC that excludes the edges. A GEANT-based sim-ulation (GSIM) was used to determine the EC-responsewith full electron energy reconstruction. The calorimeterfiducial volume was defined by cuts that excluded the in-efficient detector regions.
Particle tracks were reconstructed using the driftchamber information, and each event was extrapolatedto the target center to obtain a vertex location. We de-manded that the reconstructed z-vertex position (distancealong the beam axis from the center of CLAS, with neg-ative values indicating upstream of the CLAS center) liesin the range −80mm < zvtx < −8mm. This is slightlylarger than the target cell size in order to take intoaccount the resolution effects on the vertex reconstruc-tion.
Finally, a lower limit on the number of photoelectronsdetected in the photomultiplier tubes of the CC provided
0
0.1
0.2
0.3
0.4
0.5
0.6
0.7
0 1 2 3 40
2000
4000
6000
8000
10000
x 10 2
pe[GeV]E
/pe
0
0.1
0.2
0.3
0.4
0.5
0.6
0.7
0 1 2 3 4
10
10 2
10 3
10 4
pe[GeV]
E/p
e
Fig. 4. (Color online) EC sampling fraction versus particlemomentum for the experimental data before (top) and after(bottom) EC energy cuts. The solid curves show the ±3σ sam-pling fraction cuts which are applied to select electrons.
an additional cut to improve electron identification. Thenumber of photoelectrons detected in the CC follows aPoisson distribution modified for irregularities in light col-lection efficiency for the individual elements of the array.For this experiment, a good electron event was requiredto have 3 or more photoelectrons detected in the CC. Theefficiency of the CC cut was determined from the exper-imental data. We fit the number of photoelectrons usingthe modified Poisson distribution. The efficiency range af-ter the CC cut is 78% to 99% depending on the kine-matic region. The correction is then the integral belowthe cut divided by the total integral of the resulting fitfunction.

Eur. Phys. J. A (2013) 49: 16 Page 7 of 18
0
0.25
0.5
0.75
1
0.5 1 1.5 2 2.5 3 3.51
10
10 2
10 3
pπ [GeV]
β
0
0.25
0.5
0.75
1
0.5 1 1.5 2 2.5 3 3.51
10
10 2
10 3
10 4
10 5
pπ [GeV]
β
Fig. 5. (Color online) Velocity β versus momentum for π+
candidates using experimental data (top) and the GSIM MonteCarlo simulation (bottom). The solid curves are ±1.5σ β cutlines used to select π+ from positron (β = 1 band) and pro-ton (β < 0.8 band) backgrounds. (The data are issued froma skimmed file which selected one electron and at least onepositively charged particle and one neutral particle).
4.1.2 Positively charged pion identification
The main cuts to select the π+ are based on charge, z-vertex, fiducial cuts and velocity versus momentum cor-relations. The velocity β is calculated from the ratio ofthe path length of the reconstructed track, to the time offlight.
Figure 5 shows the β versus p distribution for pos-itively charged particles from experimental data (top)and from the GSIM Monte Carlo simulation (bottom). AGaussian is fit to β for bins in momentum pπ. A ±1.5σ cuton β is chosen for pion candidates as shown in fig. 5 (solidcurves in the plot). Pions and positrons (β = 1) are wellseparated below pπ = 250MeV/c of momentum in the ex-perimental data, but this is no longer the case at momenta
-20
0
20
20 40 60 80θe [deg]
φ e [d
eg]
0
50
100
150
200
-20 0 20φe [deg]
Num
. of e
vent
s
0
20
40
60
80
-20 0 20φe [deg]
Num
. of e
vent
s
Fig. 6. (Color online) Example of electron fiducial cuts for theelectron momentum bin (pe = 1.437 ± .025GeV) in Sector 2.See the detailed explanation in the text.
larger than 400MeV/c. For this reason, positrons can bemis-identified as pions, which increases the background.At higher momenta, there can also be some particlemis-identification from protons and kaons. We estimatedthat the missing mass and vertex cuts reduce this mis-identification to the 5–10% level. This residual backgroundcontamination was subtracted as described in sect. 6.
4.2 Fiducial cuts
4.2.1 Electron fiducial cuts
The fiducial cuts for electrons were developed to excluderegions with non-uniform detector efficiency such as theedges of a sector in the CC and EC. The fiducial cut isa function of the angles θe, φe, and momentum pe of theelectron. An example of such fiducial cut can be seen infig. 6 for a given electron momentum bin. The solid line in

Page 8 of 18 Eur. Phys. J. A (2013) 49: 16
the top plot shows the boundary of the fiducial region forthe central momentum in that bin. Only electron eventsinside the curve (blue area) were used in the analysis. Thiscurve was determined by selecting the flat high-efficiencyareas in the θe-sliced φe distributions. The histograms onthe bottom of fig. 6 show examples of such φe distribu-tions at two values of θe = 23◦ ± 0.5◦ and 29◦ ± 0.5◦. Onesees a central, uniform area, flanked by two fringes. Thehighlighted area in the center indicates the selected fidu-cial range. In addition, a set of θe versus pe cuts was usedto eliminate the areas with low detection efficiency due toproblematic time-of-flight counters, photomultiplier tubesin Cherenkov counters, or drift chamber areas.
4.2.2 Pion fiducial cuts
The fiducial cuts for pions depend on the angles θπ, φπ
and the momentum pπ. The pion momentum is scanned in100MeV steps from 0.3 to 1.7GeV. The uniform detectorefficiency region was determined by selecting a flat high-efficiency φπ region in each θπ-sliced momentum bin, andthe bad TOF counters and the inefficient DC areas wereexcluded by additional software cuts (the same procedureas was applied to electrons). Figure 7 shows an example forthe fiducial cuts for pions. The low-efficiency DC regions(between the black solid lines) and the bad TOF paddles(between red solid lines) are removed in both experimental(top) and simulated (bottom) data as part of the fiducialcuts.
4.3 Kinematic corrections
Due to effects that are not included in the reconstruc-tion software (deviations of the magnetic field from per-fect toroidal symmetry, misalignment of the tracking sys-tem, . . . ), we have to apply some empirical correctionsto the measured angles and momenta of both electronsand pions. For electrons, the kinematic corrections areapplied using the elastic ep → e′p′ process for which thekinematics is overconstrained. The goal is to correct thethree-momentum of the electron so as to minimize the con-straints due to the equations of conservation of energy andmomentum. The same procedure is applied to the π+’sthree-momentum using our reaction ep → e′π+n understudy, minimizing the deviation of the missing mass peakposition from the neutron mass. The same correction fac-tors are used for all events having the same kinematics. Inthis way we keep the spatial resolution of the drift cham-ber systems and multiple scattering effects and the miss-ing mass resolution approaches its intrinsic limitations.The corrections were most sizable (≈ 5%) for the pionmomentum. They resulted in an improved missing massresolution, from 23 to 35MeV depending on kinematics.The corrections were most sizable for the high-momentumand forward-angle pions at high W which are of inter-est in this experiment. We then applied additional ad hocsmearing factors for the tracking and timing resolutionsto the Monte Carlo so that they match the experimentaldata.
pπ [GeV]
θ π[d
eg]
20
40
60
80
100
0 1 2 3 4 51
10
10 2
10 3
pπ [GeV]
θ π [d
eg]
Fig. 7. (Color online) Pion polar angular distribution as afunction of momentum in Sector 3. The low detector responseareas are removed by empirical cuts for experimental (top)and simulated data (bottom). The black thin solid curves arefiducial cuts based on DC inefficiencies and the red thick solidcurves are cuts for bad TOF counters.
5 Monte Carlo simulation
In order to calculate the CLAS acceptance for ep →e′π+n, we simulated electron and pion tracks using theCLAS GEANT3-based Monte Carlo Package GSIM. Forsystematic checks, we used two Monte Carlo event gener-ators. Our approach is that by comparing the results ofsimulations carried out with two very different event gen-erators, a conservative and reliable estimation of system-atic effects, such as finite bin size effects, is obtained. Thefirst event generator, GENEV (see ref. [36] for the origi-nal publication dedicated to photoproduction processes),generates events for various exclusive meson electropro-duction reactions for proton and neutron targets (π, ω,ρ0, and φ), including their decay, radiative effects, and

Eur. Phys. J. A (2013) 49: 16 Page 9 of 18
2
3
4
5
0 0.2 0.4 0.6
10
10 2
10 3
xB
Q2 [
GeV
2 ]
Fig. 8. (Color online) Kinematic coverage and binning (redboxes) as a function of xB and Q2 (integrated over all othervariables) for the experimental data. Only events with W >2 GeV are shown.
resonant and non-resonant multi-pion production, with re-alistic kinematic distributions. GENEV uses cross sectiontables based on existing photoproduction data and extrap-olates to electroproduction by introducing a virtual pho-ton flux factor (Γ ) and the electromagnetic form factors.Radiative effects, based on the Mo and Tsai formula [37],are part of this event generator as an option. Although theformula is exact only for elastic e-p scattering, it can beused as a first approximation to simulate the radiative tailand to estimate bin migration effects in our pion produc-tion process, as will be discussed in sect. 5.2. The secondevent generator, FSGEN [38], distributes events accordingto the ep → e′π+n phase space.
Electrons and positive pions were generated under the“e1-6” experimental conditions. Events were processedthrough GSIM. As already mentioned, additional ad hocsmearing factors for the tracking and timing resolutionsare applied after GSIM so that they match the experi-mental data. The low-efficiency regions in the drift cham-bers and problematic TOF channels were removed duringthis procedure. Acceptance and radiative corrections werecalculated for the same kinematic bins as were used forthe yield extraction as shown in table 1. Figure 8 showsthe binning in Q2 and xB applied in this analysis. How-ever, some bins will be dropped at some later stage in theanalysis, in particular due to very low acceptances (see fol-lowing subsection). Our cross sections will be defined atthe (xB , Q2,−t) values given by the geometrical center ofthe three-dimensional bins. To account for non-linear vari-ations of the cross section within a bin, a correction to ourcross sections is determined by fitting with a simple ad hocthree-variable function the simultaneous (xB , Q2,−t) de-pendence of our cross sections. This correction comes outat the level of a couple of percent in average.
Fig. 9. (Color online) Examples of acceptance as a functionof φ∗
π for various t and xB bins at Q2 = 2.35 GeV2. The dipsat φ∗
π = 0◦ and 180◦ are due to sector boundaries in CLAS.
5.1 Acceptance corrections
We related the experimental yields to the cross sections us-ing the acceptance, including the efficiency of the detector.The acceptance factor (Acc) compensates for various ef-fects, such as the geometric coverage of the detector, hard-ware and software inefficiencies, and resolution from trackreconstruction. We generated approximately 850 millionevents, taking radiative effects into account. This resultsin a statistical uncertainty for the acceptance determina-tion of less than 5% for most bins, which is much lowerthan the systematic uncertainty that we have estimated(see sect. 7).
We define the acceptance as a function of the kinematicvariables,
Acc(xB , Q2,−t, φ∗π) =
NREC(xB , Q2,−t, φ∗π)
NGENrad. (xB , Q2,−t, φ∗
π), (2)
where NREC is the number of reconstructed particles andNGEN
rad. is the number of generated particles in each kine-matic bin (the meaning of the subscript rad. will be-come clear in the next section). The kinematic variables inNGEN refer to the generated values (after “radiation” butbefore propagation through CLAS) so that bin migrationeffects are taken into account in the definition of our accep-tance. The acceptances are in general between 1 and 9%.Figure 9 shows examples of acceptances, determined withthe GENEV+GSIM packages, as a function of the angleφ∗
π at a given Q2 for various xB and t bins. Bins with anacceptance below 0.2% were dropped. For the integrationover the φ∗
π angle, in order to obtain our three-fold crosssections, we fitted the acceptance-corrected φ∗
π distribu-tions, so that any hole in the φ∗
π distribution would bereplaced by its fit value.
Page 10 of 18 Eur. Phys. J. A (2013) 49: 16
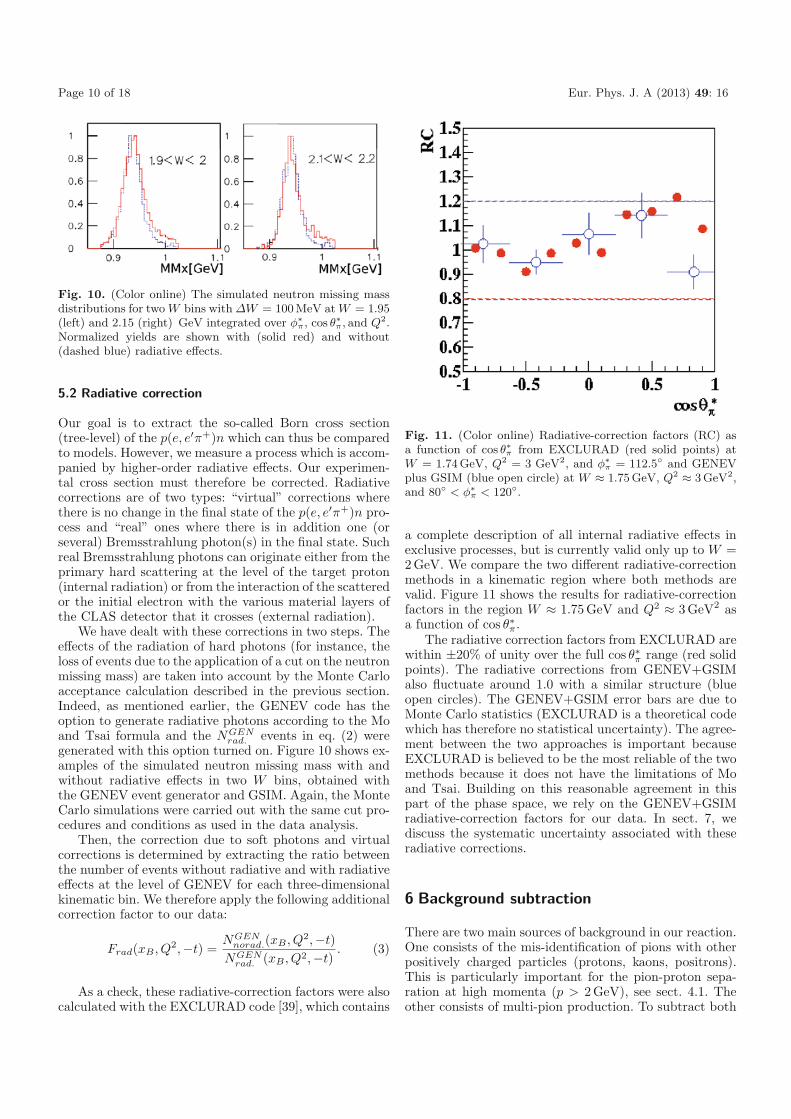
Fig. 10. (Color online) The simulated neutron missing massdistributions for two W bins with ΔW = 100 MeV at W = 1.95(left) and 2.15 (right) GeV integrated over φ∗
π, cos θ∗π, and Q2.
Normalized yields are shown with (solid red) and without(dashed blue) radiative effects.
5.2 Radiative correction
Our goal is to extract the so-called Born cross section(tree-level) of the p(e, e′π+)n which can thus be comparedto models. However, we measure a process which is accom-panied by higher-order radiative effects. Our experimen-tal cross section must therefore be corrected. Radiativecorrections are of two types: “virtual” corrections wherethere is no change in the final state of the p(e, e′π+)n pro-cess and “real” ones where there is in addition one (orseveral) Bremsstrahlung photon(s) in the final state. Suchreal Bremsstrahlung photons can originate either from theprimary hard scattering at the level of the target proton(internal radiation) or from the interaction of the scatteredor the initial electron with the various material layers ofthe CLAS detector that it crosses (external radiation).
We have dealt with these corrections in two steps. Theeffects of the radiation of hard photons (for instance, theloss of events due to the application of a cut on the neutronmissing mass) are taken into account by the Monte Carloacceptance calculation described in the previous section.Indeed, as mentioned earlier, the GENEV code has theoption to generate radiative photons according to the Moand Tsai formula and the NGEN
rad. events in eq. (2) weregenerated with this option turned on. Figure 10 shows ex-amples of the simulated neutron missing mass with andwithout radiative effects in two W bins, obtained withthe GENEV event generator and GSIM. Again, the MonteCarlo simulations were carried out with the same cut pro-cedures and conditions as used in the data analysis.
Then, the correction due to soft photons and virtualcorrections is determined by extracting the ratio betweenthe number of events without radiative and with radiativeeffects at the level of GENEV for each three-dimensionalkinematic bin. We therefore apply the following additionalcorrection factor to our data:
Frad(xB , Q2,−t) =NGEN
norad.(xB , Q2,−t)NGEN
rad. (xB , Q2,−t). (3)
As a check, these radiative-correction factors were alsocalculated with the EXCLURAD code [39], which contains
Fig. 11. (Color online) Radiative-correction factors (RC) asa function of cos θ∗
π from EXCLURAD (red solid points) atW = 1.74 GeV, Q2 = 3 GeV2, and φ∗
π = 112.5◦ and GENEVplus GSIM (blue open circle) at W ≈ 1.75 GeV, Q2 ≈ 3GeV2,and 80◦ < φ∗
π < 120◦.
a complete description of all internal radiative effects inexclusive processes, but is currently valid only up to W =2GeV. We compare the two different radiative-correctionmethods in a kinematic region where both methods arevalid. Figure 11 shows the results for radiative-correctionfactors in the region W ≈ 1.75GeV and Q2 ≈ 3GeV2 asa function of cos θ∗π.
The radiative correction factors from EXCLURAD arewithin ±20% of unity over the full cos θ∗π range (red solidpoints). The radiative corrections from GENEV+GSIMalso fluctuate around 1.0 with a similar structure (blueopen circles). The GENEV+GSIM error bars are due toMonte Carlo statistics (EXCLURAD is a theoretical codewhich has therefore no statistical uncertainty). The agree-ment between the two approaches is important becauseEXCLURAD is believed to be the most reliable of the twomethods because it does not have the limitations of Moand Tsai. Building on this reasonable agreement in thispart of the phase space, we rely on the GENEV+GSIMradiative-correction factors for our data. In sect. 7, wediscuss the systematic uncertainty associated with theseradiative corrections.
6 Background subtraction
There are two main sources of background in our reaction.One consists of the mis-identification of pions with otherpositively charged particles (protons, kaons, positrons).This is particularly important for the pion-proton sepa-ration at high momenta (p > 2GeV), see sect. 4.1. Theother consists of multi-pion production. To subtract both

Eur. Phys. J. A (2013) 49: 16 Page 11 of 18
Fig. 12. (Color online) Example of the missing mass peak plusbackground at Q2 = 2.65 GeV2, −t = 1.15 GeV2, and xB =0.43. The top plot shows the fitted background distribution(hatched region). The bottom plot shows the neutron missingmass distribution before (black squares) and after (red solidpoints) background subtraction.
backgrounds, we fit the neutron missing mass distributionbin by bin. We used many methods to fit these spectra: fitof only the background, fit of the signal plus background,with different functional forms both for the signal andthe background, variation of the fitted range, etc. . . , fromwhich we extracted a systematic uncertainty (see sect. 7).
Figure 12 (top) shows an example of a fit based ononly the background, with an exponential plus a Gaus-sian. The former function was determined from simula-tions of the multi-pion spectra in the neutron missingmass region > 1.02GeV. A comparison of the missingmass (MMx) spectrum is shown in the bottom plot offig. 12 before (black squares) and after (red solid circles)
background subtraction. In the range of the neutron miss-ing mass cut, shown by the two vertical lines at 0.877GeVand 1.0245GeV, the background is small, and the remain-ing radiative tail becomes visible after the background issubtracted.
7 Systematic uncertainties
Several sources of systematic uncertainty that can affectour measurements have been studied by changing variouscuts and using different event generators.
We varied the criteria used for the particle identifica-tion to provide more and less stringent particle selectionsimultaneously for experimental and GSIM data and thenreran the complete analysis. The cuts on EC energy depo-sition and CC amplitude for the electron, as well as cutson the TOF timing for the pion, have been varied. The ECsampling fraction cut was varied from ±3σEC to ±2σEC
which led to a 5% uncertainty for electron identification.Changing the TOF β cut from ±2σTOF to ±2.5σTOF forpion identification gives a 1.7% uncertainty. The variouscuts for channel identification such as fiducial, missingmass, and vertex cuts produced 3%, 1%, and 1.6% sys-tematic uncertainties, respectively.
Acceptance and radiative corrections are the biggestsources of systematic errors. The systematic uncertaintyfrom the acceptance is evaluated by comparing our resultsusing the GENEV and FSGEN event generators. In thelimit of infinitely large statistics and infinitely small binsize, our acceptances should be model-independent (up tothe bin-migration effects). But these conditions are notreached here and we find differences between 2 and 8%.The systematic uncertainty for radiative corrections is es-timated similarly by comparing the radiative-correctionfactors (GENEV and EXCLURAD). We calculated thedifference between the cross sections corrected for radia-tive effects using either GENEV-GEANT simulation orthe W -expanded EXCLURAD (where EXCLURAD waslinearly extrapolated to W > 2GeV). An average 8% sys-tematic uncertainty was found. Acceptance and radiativecorrections are actually correlated, but after a combinedanalysis we estimated an averaged range 4–12% total un-certainty for both of these effects together.
Concerning the background subtraction procedure un-der the neutron missing mass (see sect. 6), we used vari-ous fitting functions (Gaussian plus exponential, Gaussianplus polynomial, exponential plus polynomial, etc.) andvarious fitting ranges. These various fitting functions andranges eventually produced small differences and we esti-mated a 3% systematic uncertainty associated with thisprocedure.
To take into account the model dependency of our bin-centering correction (see sect. 4.3), we also introduce anerror equal to the correction factor itself which is, we re-call, at the level of a couple of percent in average.
These latter systematic uncertainties were determinedfor each bin. Concerning overall scale uncertainties, thetarget length and density have a 1% systematic uncer-tainty and the integrated charge uncertainty is estimated

Page 12 of 18 Eur. Phys. J. A (2013) 49: 16
Table 2. Average systematic uncertainties for the differentialcross sections.
Source Criterion Estimated
contribution
Type Point to point
e− PID Sampling fraction
cut in EC
(3σSF → 2σSF) 5%
e− fiducial cut Fiducial volume change
(10% reduced) 2.5%
π+ PID β resolution change
(2σTOF → 2.5σTOF) 1.7%
π+ fiducial cut Width (10% reduced) 3.5%
Missing Neutron missingmass mass resolutioncut (3σMMx → 3.5σMMx) 1%
Vertex cut z-vertex width
(5% reduced) 1.6%
Acceptance GENEV vs. FSGEN
Radiative GENEV vs. EXCLURAD 4–12%corrections
Background Various fit functionssubtraction exponential, Gaussian
and high-order polynomials 3%
Bin-centering Toy model 2–4%effect
Type Overall scale/normalization
LH2 target Density/length 1%
Luminosity Integrated charge 2%
Total 9–14%
at 2%. The background from the target cell was sub-tracted based on the empty-target runs and amounted to0.6± 0.2% of our e′π+X events. The total systematic un-certainties, averaged over all bins, is then approximately12%. Table 2 summarizes the main systematic uncertain-ties in this analysis averaged over all the accessible kine-matic bins seen in fig. 8.
Let us finally mention that this same data set “e1-6”was analyzed earlier for the measurement of the five-folddifferential cross section in semi-inclusive π+ electropro-
duction on protons (ref. [40]). In this work, as checks of thenormalization procedure, the inclusive proton structurefunction F2 and the elastic cross section in electron-protoncoincidence were extracted (figs. 7 and 8 of ref. [40]). Theagreement with the world’s data of these two quantitieswas found to be very good with a maximum systematic un-certainty estimated to 10%. Although the groups involvedin that earlier work and the present ones are different, asthe data set analyzed and many software tools used areidentical, we believe that this gives further confidence inour normalization procedure.
8 Results and discussion
In this section, we present our results for the cross sec-tions of the p(e, e′π+)n reaction in the invariant massregion W > 2GeV. We have extracted the differen-tial cross sections as a function of several variables (t,Q2, and W or xB). The angle φ∗
π is always integratedover in the following. The extraction of the interferencecross sections σTT and σTL is the subject of an ongo-ing analysis and will be presented in a future article.The error bars on all cross sections include both sta-tistical and systematic uncertainties added in quadra-ture. All values of our cross sections and uncertaintiescan be found on the CLAS database web page: http://clasweb.jlab.org/cgi-bin/clasdb/db.cgi.
8.1 dσ/dt as a function of t
Figure 13 shows the differential cross section dσ/dt as afunction of t for different (xB , Q2) bins. We define thereduced differential cross section,
dσ
dt=
1Γ
d3σ
dQ2dxBdt, (4)
where the virtual photon flux factor [41] has been fac-tored out. We have included in fig. 13 the JLab Hall Cdata, which cover only the very small t domain. We notethat there is generally reasonable agreement between theresults of the two experiments. However, care must betaken in comparing the Hall C and Hall B measurementsas the central (t, Q2, and W or xB , ε) values do not ex-actly match each other. For instance, the most impor-tant discrepancy seems to appear in the bin (xB , Q2) =(0.49, 3.35) where the Hall C measurement was carriedout at ε = 0.45 [8] while ours corresponds to ε = 0.58 (thexB and Q2 values being almost similar). According to thevalue of σL relative to σT , the Hall C cross section shouldthen be renormalized: between a factor of 1.58/1.45 ≈ 9%(if σL ≈ σT which the Hall C separated data [6,7] in-dicate, although at a slightly different kinematics) and afactor 0.58/0.45 ≈ 30% (if σL dominates over σT whichthe Laget model predicts). For better visualization, whichis also relevant for the comparison with the models, wealso show fig. 14 which concentrates on the low |t| rangeof fig. 13.
Eur. Phys. J. A (2013) 49: 16 Page 13 of 18
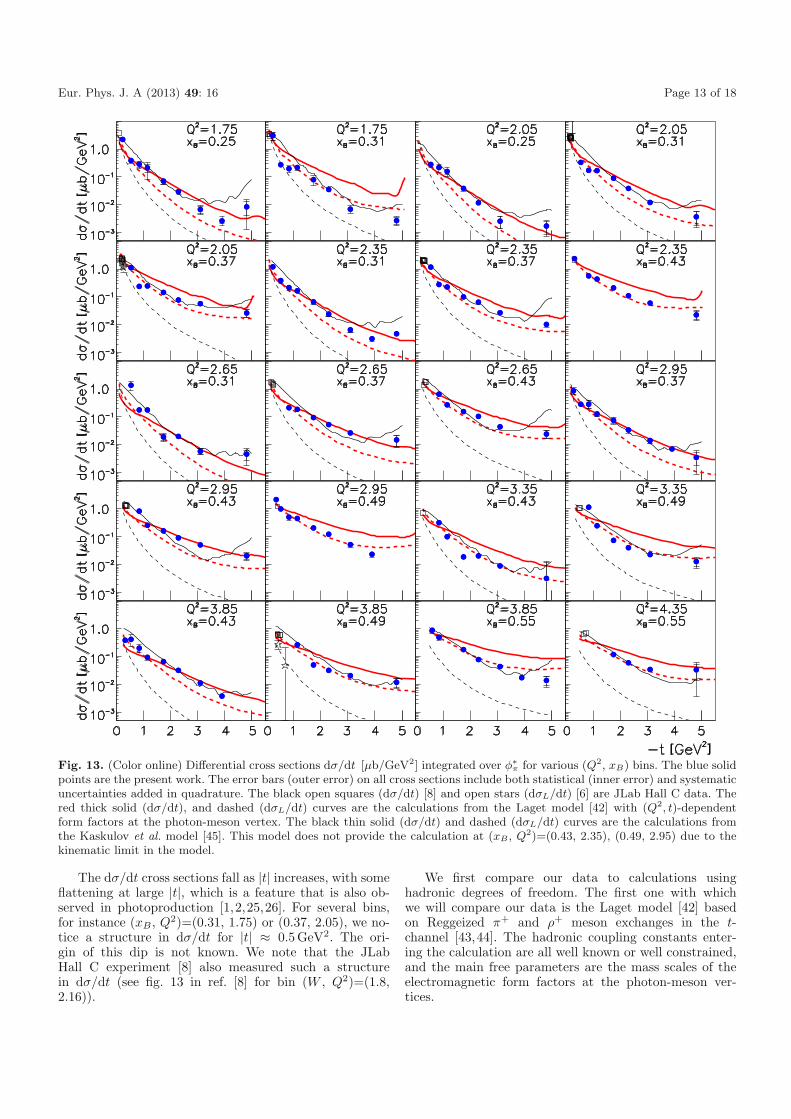
Fig. 13. (Color online) Differential cross sections dσ/dt [μb/GeV2] integrated over φ∗π for various (Q2, xB) bins. The blue solid
points are the present work. The error bars (outer error) on all cross sections include both statistical (inner error) and systematicuncertainties added in quadrature. The black open squares (dσ/dt) [8] and open stars (dσL/dt) [6] are JLab Hall C data. Thered thick solid (dσ/dt), and dashed (dσL/dt) curves are the calculations from the Laget model [42] with (Q2, t)-dependentform factors at the photon-meson vertex. The black thin solid (dσ/dt) and dashed (dσL/dt) curves are the calculations fromthe Kaskulov et al. model [45]. This model does not provide the calculation at (xB , Q2)=(0.43, 2.35), (0.49, 2.95) due to thekinematic limit in the model.
The dσ/dt cross sections fall as |t| increases, with someflattening at large |t|, which is a feature that is also ob-served in photoproduction [1,2,25,26]. For several bins,for instance (xB , Q2)=(0.31, 1.75) or (0.37, 2.05), we no-tice a structure in dσ/dt for |t| ≈ 0.5GeV2. The ori-gin of this dip is not known. We note that the JLabHall C experiment [8] also measured such a structurein dσ/dt (see fig. 13 in ref. [8] for bin (W , Q2)=(1.8,2.16)).
We first compare our data to calculations usinghadronic degrees of freedom. The first one with whichwe will compare our data is the Laget model [42] basedon Reggeized π+ and ρ+ meson exchanges in the t-channel [43,44]. The hadronic coupling constants enter-ing the calculation are all well known or well constrained,and the main free parameters are the mass scales of theelectromagnetic form factors at the photon-meson ver-tices.
Page 14 of 18 Eur. Phys. J. A (2013) 49: 16
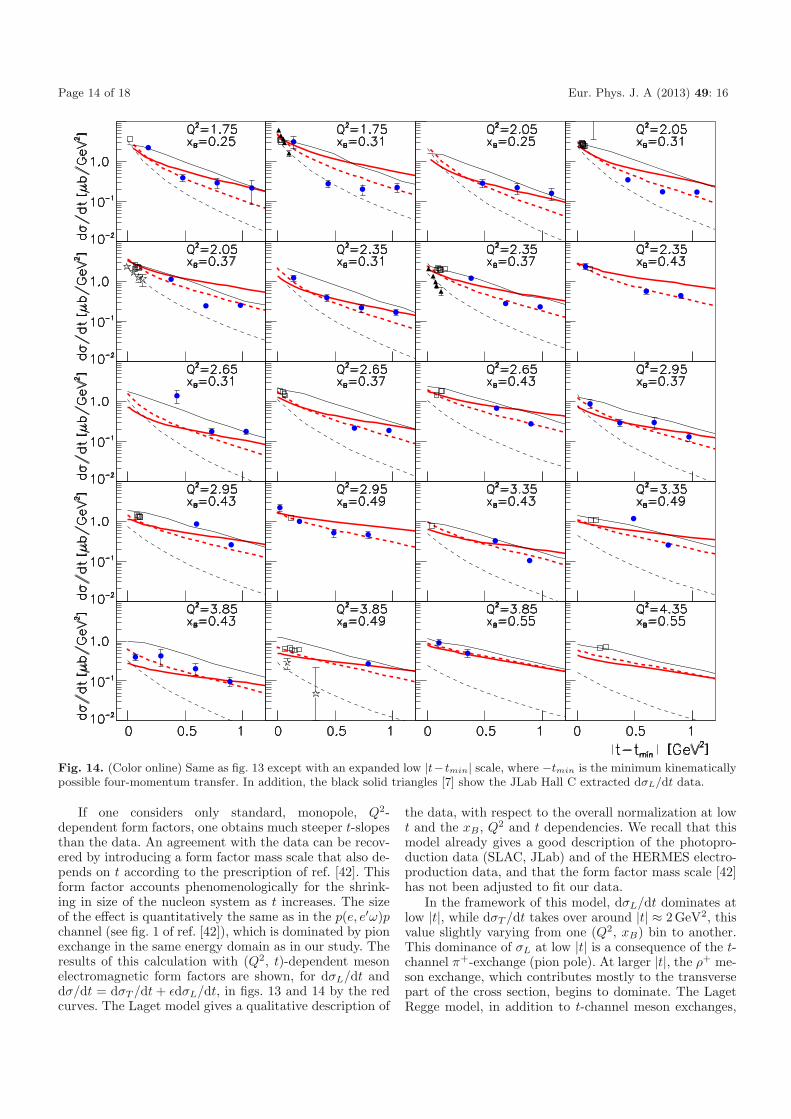
Fig. 14. (Color online) Same as fig. 13 except with an expanded low |t− tmin| scale, where −tmin is the minimum kinematicallypossible four-momentum transfer. In addition, the black solid triangles [7] show the JLab Hall C extracted dσL/dt data.
If one considers only standard, monopole, Q2-dependent form factors, one obtains much steeper t-slopesthan the data. An agreement with the data can be recov-ered by introducing a form factor mass scale that also de-pends on t according to the prescription of ref. [42]. Thisform factor accounts phenomenologically for the shrink-ing in size of the nucleon system as t increases. The sizeof the effect is quantitatively the same as in the p(e, e′ω)pchannel (see fig. 1 of ref. [42]), which is dominated by pionexchange in the same energy domain as in our study. Theresults of this calculation with (Q2, t)-dependent mesonelectromagnetic form factors are shown, for dσL/dt anddσ/dt = dσT /dt + εdσL/dt, in figs. 13 and 14 by the redcurves. The Laget model gives a qualitative description of
the data, with respect to the overall normalization at lowt and the xB, Q2 and t dependencies. We recall that thismodel already gives a good description of the photopro-duction data (SLAC, JLab) and of the HERMES electro-production data, and that the form factor mass scale [42]has not been adjusted to fit our data.
In the framework of this model, dσL/dt dominates atlow |t|, while dσT /dt takes over around |t| ≈ 2GeV2, thisvalue slightly varying from one (Q2, xB) bin to another.This dominance of σL at low |t| is a consequence of the t-channel π+-exchange (pion pole). At larger |t|, the ρ+ me-son exchange, which contributes mostly to the transversepart of the cross section, begins to dominate. The LagetRegge model, in addition to t-channel meson exchanges,

Eur. Phys. J. A (2013) 49: 16 Page 15 of 18
also contains u-channel baryon exchanges. It thus exhibitsan increase of the cross section in some (Q2, xB) bins atthe largest |t| values, corresponding to low-|u| values. Wehave additional data at larger |t| (lower |u|) that are cur-rently under analysis.
The second model with which we compare our datais the “hybrid” two-component hadron-parton model pro-posed in refs. [45,46]. Like in the Laget model, it is basedon the exchange of the π+ and ρ+ Regge trajectories in thet-channel. However, the model complements these hadron-like interaction types, which dominate in photoproduc-tion and low Q2 electroproduction, by a direct interactionof virtual photons with partons at high values of Q2 fol-lowed by string (quark) fragmentation into π+n. The par-tonic part of the production mechanism is described by a“deep inelastic”-like electroproduction mechanism wherethe quark knockout reaction γ∗q → q is followed by thefragmentation process of the Lund type. The transverseresponse is then treated as the exclusive limit of the semi-inclusive reaction p(e, e′π+)X. Figures 13 and 14 showthe results of this model compared to our data where verygood agreement is found. This calculation was also foundto give a good description of the L/T-separated Hall Cand unseparated HERMES data [45,46].
The third model that we wish to discuss, the GKmodel, is based purely on partonic degrees of freedom andis based on the handbag GPD formalism. In this modeldσL/dt is also mostly generated by the pion pole, sim-ilar to the two previous models. There are, however, acouple of differences in the treatment of this pion pole inthe GK calculation. For instance, the Laget model has anintrinsic energy dependence. It is “Reggeized”, so the t-channel propagator is proportional to sαπ(t), where απ(t)is the pion Regge trajectory. In addition, it uses a (Q2,t)-dependent electromagnetic form factor. These two fea-tures change the s, xB, and t dependencies of the pionpole with respect to the GK treatment. Indeed, in the lat-ter case, the t-channel pion propagator is proportional to1/(t − m2
π), so it has no s dependence, and the hadronicform factor at the πNN vertex is only t-dependent.
Figure 15 shows the results of the GK calculation (inblue) for dσL/dt and dσ/dt. We recall that the GK modelis applicable only for small values of −t/Q2. Outside thisregime, higher-twist contributions that are not taken intoaccount in the GK handbag formalism are expected. TheGK model describes qualitatively our low-t unseparatedcross sections over our whole (xB , Q2) domain. This isremarkable since the GK model was optimized for higher-energy kinematics (HERMES) and no further adjustmentswere made for the present CLAS kinematics. We see thatdσL/dt has a non-negligible contribution only in the verylow |t| domain and only for a few (xB , Q2) bins, in par-ticular at the lowest xB and the largest Q2 values (forinstance, the (xB , Q2) bins (0.25, 1.75) and (0.31, 2.35)).This is in line with the observation that at HERMES kine-matics, i.e. at lower xB and larger Q2 values, the longitu-dinal part of the cross section dominates in the GK modelat low |t|. For the larger xB values, one sees that the dom-inance of dσL/dt at low |t| is not at all systematic in theGK calculation. The ratio of dσL/dt to dσ/dt strongly de-
pends on xB . Specifically, it decreases as xB increases andat xB = 0.49, dσL/dt is only a few percent of dσ/dt, evenat the lowest t values. This is a notable difference fromthe Laget Regge model, for instance.
In particular, one can remark in fig. 15, where we dis-play in two (xB , Q2) bins ((0.31, 1.75) and (0.37, 2.35))the longitudinal part of the cross section as extractedfrom Hall C [7], that the longitudinal part of the GKcalculation is not in good agreement with the experi-mental data. This can be attributed to the way the pionpole and/or the pion-nucleon form factor, which are themain contributors to the longitudinal part of the crosssection, are modeled in the GK approach. A Reggeiza-tion (like in the Laget model) or a change in the pion-nucleon form factor parametrization could possibly en-hance the pion pole contribution at JLab kinematics andprovide better agreement with our data (without dam-aging the agreement with the HERMES data) [47]. Werecall that the GK model for which the GPD parame-ters were fitted to the low xB HERMES data, was simplyextrapolated to the kinematics of the present article with-out any optimization and thus the present disagreementobserved in dσL/dt should not be considered as defini-tive.
In the GK model, the transverse part of the cross sec-tion is due to transversity GPDs. In fig. 15, the GK cal-culation predicts that the transverse part of the cross sec-tion dominates essentially everywhere in our kinematicdomain. Although the GK L/T ratio probably needsto be adjusted as we just discussed, the GK calcula-tion opens the original and exciting perspective to accesstransversity GPDs through exclusive π+ electroproduc-tion.
Finally, at the kinematics of our experiment, in spiteof our W > 2GeV cut, it cannot be excluded that nu-cleon resonances contribute. In ref. [48], Kaskulov andMosel identify these high-lying resonances with partonicexcitations in the spirit of the resonance-parton dualityhypothesis and invoke the continuity in going from an in-clusive final deep inelastic state to exclusive pion produc-tion. During this transition one expects that the inclusionof resonance excitations enhances the transverse responsewhile leaving the longitudinal strength originating in thet-channel meson exchanges intact. Thus, in this work, thet-channel exchange part of the production amplitude isagain described by the exchange of the Regge trajectories(π+, ρ+ and a+
1 ) to which it is added a nucleon resonancecomponent that is described via a dual connection be-tween the resonance and partonic deep inelastic processes.The parameters of this model have been tuned using theforward JLab Hall C data. Figure 15 shows the results ofthis calculation with our data and a reasonable agreementis found.
The four models that we just discussed, although theygive a reasonable description of the unseparated cross sec-tions, display rather different L/T ratios. The precise mea-surement of this ratio as a function of xB , Q2 and t appearsthus as essential to clarify the situation. For instance, inorder to validate and/or tune the GK approach, it wouldbe interesting to study the Q2 dependence at fixed xB and

Page 16 of 18 Eur. Phys. J. A (2013) 49: 16
Fig. 15. (Color online) Same as fig. 14 except with |t − tmin| scale. The blue thick solid and dashed curves are dσ/dt anddσL/dt, respectively, from the GK model [22]. The magenta thin solid (dσ/dt) and dashed (dσL/dt) curves are the calculationsfrom the 2nd Kaskulov et al. model [48].
t of the longitudinal and transverse cross sections. Theyshould approach, as Q2 increases, a 1/Q6 and 1/Q8 scalingbehavior, respectively, as mentioned in the introduction ofthis article. In contrast, the Laget Regge model, for whichxB is not a “natural” variable (it is rather W ) should notpredict such a Q2 scaling at fixed xB . Although we areprobably very far from such an asymptotic regime, themeasurement of the Q2 dependence in the transition re-gion accessible with the upcoming JLab 12GeV upgradeshould provide some strong constraints and in particu-lar some checks on the way the higher-twist correctionsare treated in the GK model. Such a program is alreadyplanned at JLab [49].
8.2 dσ/dt as a function of Q2 at fixed t
Figures 16 and 17 show the differential cross section dσ/dtas a function of Q2 at fixed xB for various t values. Infig. 16, our data are fitted with a 1/Qn function and arecompared to the GK model. We recall that, at asymptot-ically large Q2, the handbag mechanism predicts a dom-inance of σL which should scale as 1/Q6 at fixed t andxB . The resulting exponents n of our fit indicates a flat-ter Q2 dependence than 1/Q6. At the relatively low Q2
range accessed in this experiment, higher-twist effects areexpected to contribute and hence the leading-twist 1/Q6
dependence of σL is no longer expected. We note that such

Eur. Phys. J. A (2013) 49: 16 Page 17 of 18
Fig. 16. (Color online) Differential cross sections dσ/dt[μb/GeV2] versus Q2 at fixed xB for various t values. Thedashed curves are the results of a fit to the function A/Qn.The solid curves are the results of the GK calculations [22].The GK calculations are only valid for −t <≈ 1 GeV2 so wedo not display those results for −t = 2.3 GeV2.
Fig. 17. (Color online) Differential cross sections dσ/dt[μb/GeV2] versus Q2 at fixed xB for various t values. Thesolid curves are the results of the Laget calculations [42] andthe dash-dotted curves of the “hybrid” two-component hadron-parton model of refs. [45,46].
higher-twist contributions are part of the GK calculationand the GK model also does not show this scaling be-havior at the present Q2 values. Although the GK modeltends to underestimate the normalization of our data, itsQ2 dependence agrees reasonably well with our data.
cosθπ* = -0.01θπ* = 90.5(deg)
cosθπ* = 0.27θπ* = 74.3(deg)
cosθπ* = 0.42
θπ* = 65.2(deg)
cosθπ* = 0.53
θπ* = 58 (deg)
Fig. 18. (Color online) Scaled cross sections s7dσ/dt[104 μbGeV12] versus W for θ∗
π ≈ 60◦ . . . 90◦ and various Q2
bins. Thick curves are from the Laget model [42]. The thincurves are to guide the eye, connecting points with the sameQ2 values.
In fig. 17, we compare our data to the Laget [42] andthe Kaskulov et al. [45,46] models. The Laget calcula-tion gives a reasonable description of the data althoughit seems to have a slightly steeper Q2 dependence thanour data (particularly in the xB=0.37 bin). We note thatin the xB=0.43 bin, our data seem to display a structure(dip) for Q2 values between 3 and 4GeV2, which is cer-tainly intriguing. We have at this stage no particular ex-planation for this. We just observe that the “hybrid” two-component hadron-parton model of refs. [45,46] displaysapparently also such structure which should therefore befurther investigated.
8.3 dσ/dt as a function of W at fixed θ∗π
Figure 18 shows our scaled cross sections, s7dσ/dt, as afunction of W for four Q2 values and four bins in cos θ∗π:−0.01± 0.16, 0.27± 0.1, 0.42± 0.05 and 0.53± 0.06. Thelever arm in W is limited. At θ∗π = 90◦, where the scal-ing behavior is expected to set in most quickly, we haveonly 2 or 3 data points in W , depending on the Q2 bin.It is therefore difficult to draw precise conclusions at thisstage for the W dependence at fixed Q2. Nevertheless,with these limited (but unique) data, one can say that, atθ∗π = 90◦, except for the 3 data points at Q2 = 2.35GeV2,the W dependence of s7dσ/dt does not appear to be con-stant. We also display in fig. 18 the result of the Lagetmodel. It gives, within a factor two, a general descriptionof these large-angle data. The W dependence of our datais very similar to the energy dependence that was observedin photoproduction [3]. In the same energy range as cov-ered by the present study, real-photon data exhibit strongdeviations from scaling. Within the Laget model, these

Page 18 of 18 Eur. Phys. J. A (2013) 49: 16
deviations are accounted for by the coupling between thenπ+ and the ρN channels [50]. The JLab 12GeV upgradewill allow us to increase the coverage in W and checkwhether the hints of oscillations that we observe remainin the virtual-photon sector.
9 Summary
We have measured the cross sections of exclusive elec-troproduction of π+ mesons from protons as a functionof −t = 0.1–5.3GeV2, xB = 0.16–0.58, and Q2 = 1.6–4.5GeV2. We have compared our differential cross sectionsto four recent calculations based on hadronic and partonicdegrees of freedom. The four models give a qualitative de-scription of the overall strength and of the t, Q2 and xB
dependencies of our unseparated cross sections. There isan obvious need for L-T separated cross sections in orderto distinguish between the several approaches. These sep-arations will be possible with the upcoming JLab 12GeVupgrade. In particular, if the handbag approach can ac-comodate the data, the p(e, e′π+)n process offers the out-standing potential to access transversity GPDs.
We acknowledge the outstanding efforts of the staff of theAccelerator and the Physics Divisions at Jefferson Lab thatmade this experiment possible. We also give many thanks toP. Kroll, S. Goloskokov and M. Kaskulov for their calculations.The early work of D. Dore on this analysis is also acknowl-edged. This work was supported in part by the US Departmentof Energy, the National Science Foundation, the Italian Isti-tuto Nazionale di Fisica Nucleare, the French American Cul-tural Exchange (FACE) and Partner University Funds (PUF)programs, the French Centre National de la Recherche Scien-tifique, the French Commissariat a l’Energie Atomique, theUnited Kingdom’s Science and Technology Facilities Council,the Chilean Comision Nacional de Investigacion Cientıfica yTecnologica (CONICYT), and the National Research Founda-tion of Korea. The Southeastern Universities Research Associa-tion (SURA) operated the Thomas Jefferson National Acceler-ator Facility for the US Department of Energy under ContractNo.DE-AC05-84ER40150.
Open Access This is an open access article distributedunder the terms of the Creative Commons AttributionLicense (http://creativecommons.org/licenses/by/3.0), whichpermits unrestricted use, distribution, and reproduction in anymedium, provided the original work is properly cited.
References
1. R.L. Anderson et al., Phys. Rev. D 14, 679 (1976).2. C. White et al., Phys. Rev. D 49, 58 (1994).3. W. Chen et al., Phys. Rev. Lett. 103, 012301 (2009).4. C.J. Bebek et al., Phys. Rev. D 13, 25 (1976).5. C.J. Bebek et al., Phys. Rev. D 13, 1693 (1978).
6. T. Horn et al., Phys. Rev. C 78, 058201 (2008).7. H.P. Blok et al., Phys. Rev. C 78, 045202 (2008).8. X. Qian et al., Phys. Rev. C 81, 055209 (2010).9. A. Airapetian et al., Phys. Lett. B 659, 486 (2008).
10. D. Muller, D. Robaschik, B. Geyer, F.-M. Dittes, J.Horejsi, Fortschr. Phys. 42, 101 (1994).
11. X. Ji, Phys. Rev. Lett. 78, 610 (1997).12. X. Ji, Phys. Rev. D 55, 7114 (1997).13. A.V. Radyushkin, Phys. Lett. B 380, 417 (1996).14. A.V. Radyushkin, Phys. Rev. D 56, 5524 (1997).15. J.C. Collins, L. Frankfurt, M. Strikman, Phys. Rev. D 56,
2982 (1997).16. S.V. Goloskokov, P. Kroll, Eur. Phys. J. C 65, 137 (2010).17. S.J. Brodsky, G.P. Lepage, Phys. Rev. D 22, 2157 (1980).18. S.J. Brodsky, G.R. Farrar, Phys. Rev. Lett. 31, 1153
(1973).19. S.J. Brodsky, G.R. Farrar, Phys. Rev. D 11, 1309 (1975).20. V. Matveev et al., Nuovo Cimento Lett. 7, 719 (1973).21. M. Vanderhaeghen, P.A.M. Guichon, M. Guidal, Phys.
Rev. D 60, 094017 (1999).22. S.V. Goloskokov, P. Kroll, Eur. Phys. J. A 47, 112 (2011).23. L. Mankiewicz, G. Piller, A. Radyushkin, Eur. Phys. J. C
10, 307 (1999).24. L. Frankfurt, P. Pobylitsa, M. Poliakov, M. Strikman,
Phys. Rev. D 60, 014010 (1999).25. L.Y. Zhu et al., Phys. Rev. Lett. 91, 022003 (2003).26. L.Y. Zhu et al., Phys. Rev. C 71, 044603 (2005).27. J. Napolitano et al., Phys. Rev. Lett. 61, 2530 (1988).28. S.J. Freedman et al., Phys. Rev. C 48, 1864 (1993).29. J.E. Belz et al., Phys. Rev. Lett. 74, 646 (1995).30. C. Bochna et al., Phys. Rev. Lett. 81, 4576 (1998).31. E.C. Schulte et al., Phys. Rev. Lett. 87, 102302 (2001).32. P. Rossi et al., Phys. Rev. Lett. 94, 012301 (2005).33. M. Mirazita et al., Phys. Rev. C 70, 014005 (2004).34. R.A. Schumacher, M.M. Sargsian, Phys. Rev. C 83, 025207
(2011).35. B.A. Mecking et al., Nucl. Instrum. Methods A 51, 409
(1995).36. P. Corvisiero et al., Nucl. Instrum. Methods A 346,
433 (1994) and E. Golovach, M. Ripani, M. Battaglieri,R. De Vita, private communication.
37. L.W. Mo, Y.S. Tsai, Rev. Mod. Phys. 41, 205 (1969).38. S. Stepanyan, private communication.39. A. Afanasev et al., Phys. Rev. D 66, 074004 (2002).40. M. Osipenko et al., Phys. Rev. D 80, 032004 (2009).41. L. Hand, Phys. Rev. 129, 1834 (1963).42. J.M. Laget, Phys. Rev. D 70, 054023 (2004).43. M. Guidal, J.M. Laget, M. Vanderhaeghen, Nucl. Phys. A
627, 645 (1997).44. M. Guidal, J.M. Laget, M. Vanderhaeghen, Phys. Lett. B
400, 6 (1997).45. M.M. Kaskulov, K. Gallmeister, U. Mosel, Phys. Rev. D
78, 114022 (2008).46. M.M. Kaskulov, U. Mosel, Phys. Rev. C 80, 028202 (2009).47. P. Kroll, private communication.48. M.M. Kaskulov, U. Mosel, Phys. Rev. C 81, 045202 (2010).49. T. Horn et al., Jefferson Lab E12-07-105, http://www.
jlab.org/exp prog/proposals/07/PR12-07-105.pdf.50. J.M. Laget, Phys. Lett. B 685, 146 (2010).