Continent-wide response of mountain vegetation to climate change
Upload
independentCategory
view
0download
0
ORIGINAL ARTICLE
doi:10.1111/j.1558-5646.2012.01682.x
DEEP DIVERSIFICATION AND LONG-TERMPERSISTENCE IN THE SOUTH AMERICAN ‘DRYDIAGONAL’: INTEGRATING CONTINENT-WIDEPHYLOGEOGRAPHY AND DISTRIBUTIONMODELING OF GECKOSFernanda P. Werneck,1,2 Tony Gamble,3,4 Guarino R. Colli,5 Miguel T. Rodrigues,6 and Jack W. Sites, Jr1,7
1Department of Biology, Brigham Young University, Provo, Utah 846022E-mail: [email protected]
3Department of Genetics, Cell Biology and Development, University of Minnesota, Minneapolis, Minnesota 554454Bell Museum of Natural History, University of Minnesota, St. Paul, Minnesota 551085Departamento de Zoologia, Universidade de Brasılia, 70910–900 Brasılia, DF, Brazil6Departamento de Zoologia, Instituto de Biociencias, Universidade de Sao Paulo, 05508–090 Sao Paulo, SP, Brazil7Bean Life Science Museum, Brigham Young University, Provo, Utah 84602
Received January 7, 2012
Accepted April 19, 2012
The relative influence of Neogene geomorphological events and Quaternary climatic changes as causal mechanisms on Neotropical
diversification remains largely speculative, as most divergence timing inferences are based on a single locus and have limited
taxonomic or geographic sampling. To investigate these influences, we use a multilocus (two mitochondrial and 11 nuclear genes)
range-wide sampling of Phyllopezus pollicaris, a gecko complex widely distributed across the poorly studied South American ‘dry
diagonal’ biomes. Our approach couples traditional and model-based phylogeography with geospatial methods, and demonstrates
Miocene diversification and limited influence of Pleistocene climatic fluctuations on P. pollicaris. Phylogeographic structure and
distribution models highlight that persistence across multiple isolated regions shaped the diversification of this species complex.
Approximate Bayesian computation supports hypotheses of allopatric and ecological/sympatric speciation between lineages that
largely coincide with genetic clusters associated with Chaco, Cerrado, and Caatinga, standing for complex diversification between
the ‘dry diagonal’ biomes. We recover extremely high genetic diversity and suggest that eight well-supported clades may be
valid species, with direct implications for taxonomy and conservation assessments. These patterns exemplify how low-vagility
species complexes, characterized by strong genetic structure and pre-Pleistocene divergence histories, represent ideal radiations
to investigate broad biogeographic histories of associated biomes.
KEY WORDS: ABC, Miocene, open biomes, Phyllopezus, Pleistocene, population structure, speciation.
Identification of underlying mechanisms shaping the diversifica-
tion of intraspecific lineages and species complexes is essential
to understand speciation processes and ultimately biogeographic
patterns across multiple spatial and temporal scales. Emergent
approaches based on the coalescent theory coupled with geospa-
tial methods represent exciting advances in testing for alternative
models of population divergence at the species level, and histori-
cal biogeography at the landscape level (Knowles and Alvarado-
Serrano 2010; Chan et al. 2011). The use of model-based inference
in phylogeography (i.e., any method in which a fully specified
3 0 1 4C© 2012 The Author(s). Evolution C© 2012 The Society for the Study of Evolution.Evolution 66-10: 3014–3034

DEEP DIVERGENCE OF SOUTH AMERICAN ‘DRY DIAGONAL’ BIOMES
probabilistic model describes how observed data are generated) is
not free of controversy (Templeton 2010). However, as more simu-
lation studies and empirical applications are completed, the debate
declines (Bloomquist et al. 2010), and their utility as a reason-
able statistical approach has now become consolidated (Beaumont
et al. 2010; Bertorelle et al. 2010; Garrick et al. 2010).
Approximate Bayesian computation (ABC) is one of the most
emblematic ‘likelihood-free’ model-based methods currently in
use (Beaumont 2010). Briefly, ABC simulates millions of ge-
nealogies assuming different parameter and prior values under
competing models, and those producing patterns of genetic vari-
ation most similar to the observed data (determined by summary
statistics, SuSt) are then retained and analyzed in detail (Bertorelle
et al. 2010; Csillery et al. 2010). Recent implementations of
ABC to test complex evolutionary scenarios have brought sta-
tistical rigor and power to phylogeography, enhancing the po-
tential interfaces and outcomes of the field (Hickerson et al.
2011).
In a recent global survey, Beheregaray (2008) identified
large phylogeographic knowledge gaps in most South American
biomes. In the last decade or so, however, phylogeographic re-
search has accelerated throughout much of the continent, includ-
ing Amazonia (Geurgas and Rodrigues 2010; Ribas et al. 2012),
Atlantic Forest (Carnaval et al. 2009; Thome et al. 2010; Cabanne
et al. 2011), Andean regions (Cadena et al. 2011; Chaves and
Smith 2011), and Patagonia (Lessa et al. 2010; Breitman et al.
2011; Nunez et al. 2011), to cite some examples. Conspicuous
gaps in this emerging coverage are the highly threatened open
vegetation biomes of central-eastern South America, which ex-
tend diagonally across a large latitudinal range and include the
Seasonally Dry Tropical Forests (SDTFs, with the largest area,
Caatinga, in northeastern Brazil), the Cerrado savanna (central
Brazil), and the Chaco (southwestern South America, Fig. 1).
Early studies interpreted these regions as a single complex of
low-diversity open formations, the ‘diagonal of dry formations’
(Vanzolini 1963, 1976), without regionally distinct biotas, de-
spite their strong character (reviewed by Werneck 2011). How-
ever, species diversity and endemism is high for some taxa within
these biomes, including fish (Leal et al. 2003), squamate reptiles
(Rodrigues 2003; Nogueira et al. 2011), Lepidoptera (Amorim
et al. 2009), and plants (Oliveira and Marquis 2002; Simon et al.
2009).
The combined influences of Paleogene–Neogene geologi-
cal processes and Quaternary climatic and vegetational fluctu-
ations are hypothesized to have generated and maintained the
high diversity levels, and to have driven the differentiation of
the open biome communities from adjacent rainforests and from
each other (Werneck 2011). Recent studies have yielded mixed
results concerning the primary diversification processes in some
of these open biome biotas. For example, Miocene (23–5.3 Mya)
geological events were interpreted as primary determinants of
diversification among lizard genera (Giugliano et al. 2007) and
species (Werneck et al. 2009), and within a frog species complex
(Maciel et al. 2010), whereas recent adaptive shifts driven by fire
dynamics (Simon et al. 2009) and Quaternary climatic changes
were identified as foremost processes of some plant (Ramos
et al. 2007; Caetano et al. 2008) and fruitfly (Moraes et al. 2009)
groups.
The role of relatively recent Quaternary changes versus Neo-
gene geomorphological events in the origin and diversification of
high Neotropical biodiversity has been a recurrent debate (Moritz
et al. 2000; Rull 2008, 2011a; Hoorn et al. 2010). Each of these hy-
potheses predicts very different causal mechanisms (climatic vs.
geomorphological) and patterns of genetic diversification. A po-
tential role was attributed to Quaternary glacial cycles and habitat
stability (refugia), especially in the Northern Hemisphere (Hewitt
2004), but now also in the Southern Hemisphere where glaciers
did not cover large areas but climate may have had consider-
able impacts (Carnaval et al. 2009; Pepper et al. 2011; Sersic
et al. 2011). Overall, it is expected that Quaternary stability
will be reflected in higher genetic diversity and strong phylo-
geographic structure between refugia in opposition to unstable
regions, where populations have genetic signatures of repeated
distributional shifts (Hewitt 2004).
The alternative hypothesis predicts that species have been
little affected by Pleistocene fluctuations when compared to pre-
vious geomorphological events that remained largely unchanged.
These older events are then predicted to leave stronger genetic
signatures, characterized by deep phylogeographic structure with
multiple well-supported haploclades, pre-Pleistocene divergence
times, and the presence of cryptic species and multiple evolu-
tionary significant units (Moritz et al. 2000; Rull 2008; Hoorn
et al. 2010). A third hypothesis, although, remains largely unex-
plored: that of Tertiary and Quaternary causal mechanisms leaving
mutually detectable genetic signatures across different levels of
sampled coalescent trees (Fujita et al. 2010; Rull 2011a). In this
case, most crown clades ages would date back to the Paleogene–
Neogene, whereas most extant terminals would have diverged
during the Quaternary (Rull 2011a). Distinguishing among these
alternative hypotheses requires the use of multiple markers span-
ning a wide range of coalescent times and mutation rates, coupled
with dense population sampling, to estimate species trees and
divergence times.
Species or species complexes broadly distributed across
the ‘dry diagonal’ biomes represent ideal models to investigate
subcontinental diversification patterns that span the Tertiary–
Quaternary boundary. The nocturnal gecko Phyllopezus polli-
caris (Phyllodactylidae; Gekkota) fits this role (Gamble et al.
EVOLUTION OCTOBER 2012 3 0 1 5
FERNANDA P. WERNECK ET AL.
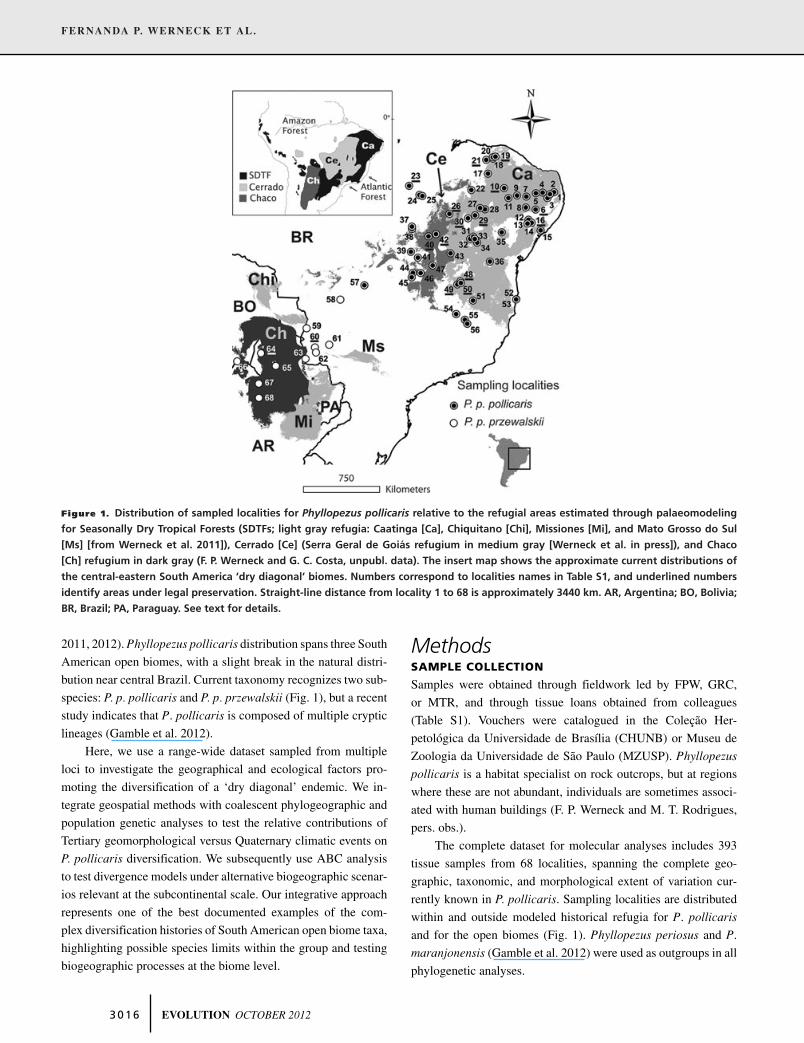
Figure 1. Distribution of sampled localities for Phyllopezus pollicaris relative to the refugial areas estimated through palaeomodeling
for Seasonally Dry Tropical Forests (SDTFs; light gray refugia: Caatinga [Ca], Chiquitano [Chi], Missiones [Mi], and Mato Grosso do Sul
[Ms] [from Werneck et al. 2011]), Cerrado [Ce] (Serra Geral de Goias refugium in medium gray [Werneck et al. in press]), and Chaco
[Ch] refugium in dark gray (F. P. Werneck and G. C. Costa, unpubl. data). The insert map shows the approximate current distributions of
the central-eastern South America ‘dry diagonal’ biomes. Numbers correspond to localities names in Table S1, and underlined numbers
identify areas under legal preservation. Straight-line distance from locality 1 to 68 is approximately 3440 km. AR, Argentina; BO, Bolivia;
BR, Brazil; PA, Paraguay. See text for details.
2011, 2012). Phyllopezus pollicaris distribution spans three South
American open biomes, with a slight break in the natural distri-
bution near central Brazil. Current taxonomy recognizes two sub-
species: P. p. pollicaris and P. p. przewalskii (Fig. 1), but a recent
study indicates that P. pollicaris is composed of multiple cryptic
lineages (Gamble et al. 2012).
Here, we use a range-wide dataset sampled from multiple
loci to investigate the geographical and ecological factors pro-
moting the diversification of a ‘dry diagonal’ endemic. We in-
tegrate geospatial methods with coalescent phylogeographic and
population genetic analyses to test the relative contributions of
Tertiary geomorphological versus Quaternary climatic events on
P. pollicaris diversification. We subsequently use ABC analysis
to test divergence models under alternative biogeographic scenar-
ios relevant at the subcontinental scale. Our integrative approach
represents one of the best documented examples of the com-
plex diversification histories of South American open biome taxa,
highlighting possible species limits within the group and testing
biogeographic processes at the biome level.
MethodsSAMPLE COLLECTION
Samples were obtained through fieldwork led by FPW, GRC,
or MTR, and through tissue loans obtained from colleagues
(Table S1). Vouchers were catalogued in the Colecao Her-
petologica da Universidade de Brasılia (CHUNB) or Museu de
Zoologia da Universidade de Sao Paulo (MZUSP). Phyllopezus
pollicaris is a habitat specialist on rock outcrops, but at regions
where these are not abundant, individuals are sometimes associ-
ated with human buildings (F. P. Werneck and M. T. Rodrigues,
pers. obs.).
The complete dataset for molecular analyses includes 393
tissue samples from 68 localities, spanning the complete geo-
graphic, taxonomic, and morphological extent of variation cur-
rently known in P. pollicaris. Sampling localities are distributed
within and outside modeled historical refugia for P. pollicaris
and for the open biomes (Fig. 1). Phyllopezus periosus and P.
maranjonensis (Gamble et al. 2012) were used as outgroups in all
phylogenetic analyses.
3 0 1 6 EVOLUTION OCTOBER 2012
DEEP DIVERGENCE OF SOUTH AMERICAN ‘DRY DIAGONAL’ BIOMES
SEQUENCE DATA COLLECTION
We sequenced partial mtDNA sequences from cytochrome b
(cytb) and NADH dehydrogenase subunit 2 (ND2) genes from
most individuals (some samples failed to amplify for ND2). We
then obtained a maximum likelihood (ML) gene tree to direct
subsampling efforts representing haplotype and geographical di-
versity (one or two individuals representing all haplotypes at
each locality) for the nuclear loci. We screened approximately
40 rapidly evolving nuclear markers from a variety of sources,
and amplified 11 variable loci within P. pollicaris (including
protein coding regions and introns). Supporting Information Ap-
pendix S2 and Table S2 summarize relevant details for the 13
gene regions, primers, laboratory protocols, sequence assembling,
alignment, recombination tests, and treatment of heterozygous in-
dividuals. We deposited all sequences in GenBank (accession nos.
JQ825288-JQ828670) and trees in TreeBase (no. 12502).
GENE TREE ESTIMATION AND GENETIC DISTANCES
To describe the overall phylogeographic structure of P. pollicaris,
we performed ML analyses on single-gene and partitioned con-
catenated datasets (mtDNA and nuDNA), including both gene
copies in the case of phased nuclear loci, using RAxML version
7.0.0 (Stamatakis 2006). Analyses were implemented with GTR +Gamma model, 200 independent ML searches, and 1000 nonpara-
metric bootstrap replicates to assess nodal support (Felsenstein
1985). We used Geophylobuilder version 1.0 (Kidd and Liu 2008)
to construct a tridimensional representation (geophylogeny) from
the mtDNA gene tree and associated geographical data, and visu-
alized it with ArcGIS and ArcScene version 9.1 (ESRI). We cal-
culated net among-group distances between mtDNA haploclades
with MEGA version 5.05 (Tamura et al. 2011), using uncorrected
and Tamura–Nei (Tamura and Nei 1993) corrected distances, and
500 bootstrap replicates to estimate standard errors.
SPECIES TREE ESTIMATION AND DIVERGENCE
DATING
We estimated the P. pollicaris species tree from the multilocus
trees under a coalescent model and simultaneously estimated di-
vergence times using ∗BEAST version 1.6.2 (Drummond and
Rambaut 2007; Heled and Drummond 2010). The lack of Phyl-
lopezus fossils prevented rigorous divergence dating, but we used
a less-ideal indirect calibration based on substitution rates to pro-
vide a first estimate of divergence dates for the major nodes rel-
evant to testing biogeographic scenarios. We used uncorrelated
relaxed clocks to allow for rate heterogeneity among lineages, a
Yule prior for the species tree, and a normal prior on the global
substitution rate to calibrate the estimation (mean = 0.0065 sub-
stitutions/my; SD = 0.0025 for the ucld.mean parameter) based
on the mtDNA substitution rate of 0.65% changes/million years
(Macey et al. 1998), widely employed in dating squamate phy-
logenies. For the nuclear loci, we used the default gamma prior
for ucld.mean and exponential prior for ucld.stdev, with a mean
of 0.5.
As with most species tree estimation methods, ∗BEAST re-
quires a priori assignment of individual alleles to a species (‘traits’
file) before estimating the relationships. There is no routine pro-
cedure on how to assign individuals to species in a poorly known
complex, but any approach elected should avoid underestima-
tion of intraspecific diversity. We provisionally made assignments
based on well-supported and geographically structured mtDNA
haploclades. We selected at random one of the phased nuclear
gene copies to represent each individual on this and subsequent
analyses to avoid extremely time-consuming computations. We
implemented five independent runs of 100 million generations
each (total 5 × 10⁸ generations), and assessed convergence of
MCMC runs (effective sample sizes, ESS values > 200) using
Tracer version 1.4.1 (Rambaut and Drummond 2007). Stationar-
ity was reached before the 10% of the posterior samples, which
was used as a conservative burn-in when pooling files from the
independent runs with LogCombiner (Drummond and Rambaut
2007). We used BEAGLE version 1.0 (Ayres et al. 2012), a pro-
graming interface to accelerate analyses.
POPULATION STRUCTURE AND ASSIGNMENTS
We investigated population structure with a Bayesian probabilis-
tic genetic clustering implemented by STRUCTURE version 2.3
(Pritchard et al. 2000) using a genotype matrix of two mtDNA
and four nuDNA. This subset of nuclear loci spanned a range
of nucleotide diversities and coalescent times (KIF24, MYH2,
PRLR, and rpl35) in the complex, but allowed us to avoid the
exceptionally time-consuming computations typical of such large
datasets. We are aware that in some instances (e.g. long history of
isolation), STRUCTURE can create clusters that are inconsistent
with the main evolutionary divisions (Kalinowski 2011). This re-
sult seems to be forced by evaluation of an inappropriately small
number of discrete genetic clusters, K (Kalinowski 2011), so we
explored a large range of values by running 20 replicated analyses
over a range of K from 2 to 30. Each of these 580 independent
runs implemented one million generations following a burn-in
of one million generations, and incorporated the possibility of
mixed ancestry. We visualized the optimal K structure based on
the rate of change in the log probability of data between succes-
sive K values, �K (Evanno et al. 2005), as calculated by Structure
Harvester.
We combined the replicate analyses under the optimal K
identified with CLUMPP (Jakobsson and Rosenberg 2007), and
plotted results with individuals in the order of their appearance on
the mtDNA gene tree, to facilitate cross-visualization of results.
EVOLUTION OCTOBER 2012 3 0 1 7

FERNANDA P. WERNECK ET AL.
Because �K may favor smaller values of K representing basal
levels of hierarchical structure (Evanno et al. 2005; Weisrock
et al. 2010), we reran the STRUCTURE analyses (same set of
parameters) within each of the major basal clusters identified to
investigate finer level structure.
QUATERNARY PALAEOMODELING AND ANCESTRAL
DISTRIBUTIONS
To estimate P. pollicaris species distribution models (SDMs)
across Quaternary climatic fluctuations, we implemented
the maximum entropy machine-learning algorithm MAXENT
(Phillips et al. 2006). The occurrence dataset included our field
GPS records, georeferenced museum or published records, and
records from trusted collectors or on-line gazetteers (e.g., ACME
Mapper version 2.0, and Global Gazetteer version 2.2), which
were verified with Google Earth to ensure points were not lo-
cated in heavily urbanized areas. Current climatic variables were
downloaded from WorldClim (Hijmans et al. 2005), while Last
Glacial Maximum [21 ky BP, LGM] and Holocene [6 ky BP]
were based on ECHAM3 (Deutsches 1992), and Last Interglacial
[130 ky BP, LIG] data were obtained from Otto-Bliesner et al.
(2006). We then obtained a historical stability map by overlap-
ping the presence/absence projections under the four scenarios.
Methodology is described in detail in Werneck et al. (2011; in
press), as applied to the open biomes. To estimate the ancestral
distribution of the basal node of P. pollicaris, we used PhyloMap-
per version 1b1 (Lemmon and Lemmon 2008) with nonparametric
rate-smoothing to obtain an ultrametric tree from the mtDNA gene
tree based on unique haplotypes, and corresponding geographical
coordinates.
GENETIC DIVERSITY AND TEST OF QUATERNARY
PHYLOGEOGRAPHIC PREDICTIONS
We calculated population genetic metrics and tested general ge-
netic predictions derived from the habitat stability (refugia) hy-
pothesis (Table 1) based on mtDNA (Carnaval et al. 2009). We
grouped samples based on the results of Structure, and into sta-
ble or unstable regions, and calculated coalescent estimators
of genetic diversity with Migrate-n version 3.2.15 (Beerli and
Palczewski 2010). We used two independent ML runs with 10
short chains and five long chains, for a total of 2000 and 20,000
generations, a burn-in of 20,000 steps, and starting parameters
for the calculations derived from an Fst-like estimator (Beerli and
Palczewski 2010). We calculated the other genetic parameters in
Table 1 and respective significance levels with 10,000 coalescent
simulations using DnaSP version 5 (Rozas et al. 2003). We also
implemented Mantel tests with Zt (Bonnett and de Peer 2002)
to investigate isolation-by-distance (IBD) patterns as character-
ized by correlations between geographical and genetic distances
matrixes.
TESTS OF POPULATION DIVERGENCE
AND BIOGEOGRAPHIC SCENARIOS
We used an ABC approach to test three alternative scenarios for
the diversification of P. pollicaris relevant to hypothesized biogeo-
graphic scenarios (models and parameters described in Results).
Analyses consisted of three steps: (1) draw parameter values from
the prior distributions and simulate data under each model; (2)
compute SuSt and the distance between simulated and observed
datasets; and (3) use a rejection algorithm to approximate the
posterior distribution of parameters by retaining the simulations
closest to the observed data, based on a specified threshold, that is
tolerance (Lopes and Beaumont 2010). Model choice can affect
estimates and conclusions, so alternative models should represent
biologically relevant hypotheses in the simplest way possible,
and model fit should be explored (Carstens and Knowles 2010;
Csillery et al. 2010). We simulated 100,000 coalescent genealo-
gies under each model with msABC (Pavlidis et al. 2010), and
simulated a total of six loci (the same used for Structure analyses)
(Pavlidis et al. 2010). Number of gene copies, number and length
of loci, and prior distributions were chosen to reproduce observed
values from the empirical dataset.
We estimated empirical relative mutation rates of loci and av-
erage theta across lineages specified in the models using Migrate-
n version 3.2.15 (Beerli and Palczewski 2010) implementing the
same search strategy as above, and used those parameters to con-
vert absolute times into coalescent times (units of 4No genera-
tions), assuming one generation per year. We selected all seven
global SuSt to be computed with mean and variance calculated
across the loci, but excluded population-specific SuSt that cannot
be compared between models with different numbers of popula-
tions. We transformed observed sequence data into ms-like files
and then calculated the same global SuSt across all loci.
We estimated posterior probabilities and models sup-
port using ‘postpr’ and parameter posterior distributions us-
ing ‘abc’ functions of the R package ‘abc’, move the comma
to out of the single quote implemented in R version 2.11.1
(R Development Core Team 2010). We set tolerance to
0.001 and implemented a nonlinear neural network regression,
which has been shown to outperform other ABC algorithms
(Camargo et al. 2012). We summarized simulated model fit to
the observed data using a Principal Components Analysis (PCA):
predictive plots in which the observed SuSt occurred within the
cloud of simulated SuSt were interpreted as good fit. All inten-
sive computational analyses were submitted to the BYU Fulton
Supercomputing Cluster.
ResultsMARKER AND DNA POLYMORPHISM
We sequenced a total of 1828 and 7477 bp of mtDNA and nuclear
markers, respectively. Nucleotide diversity ranged from 0.59%
3 0 1 8 EVOLUTION OCTOBER 2012

DEEP DIVERGENCE OF SOUTH AMERICAN ‘DRY DIAGONAL’ BIOMES
Table 1. Population genetic summary metrics used in model validation, and respective expectations for the estimated Quaternary
historical stability surface.
Metric DescriptionExpectation (stable
areas)Expectation (unstable
areas)
θ Theta diversityparameter
Higher genetic diversity Lower genetic diversity
Mean Da Average net nucleotidedifferences acrosslocalities
Higher differencesacross localitiesreflecting highergeographic structurewithin refugia
Fewer differences acrosslocalities (lowergeographic structure)
Fay and Wu’s Hs(P-value)
Test to detect populationexpansion signal
Lack of signature ofpopulation expansion
Signatures of populationexpansion
Mantel’s correlationcoefficient (P-value)
Isolation-by-distance(IBD) test
Presence of IBD patterns No IBD patterns
Table 2. Phyllopezus pollicaris molecular markers ranked by hap-
lotype and nucleotide diversity (%). H = number of haplotypes;
Hd = haplotype diversity; Pi = Nucleotide diversity (per site);
k = average number of nucleotide differences between sequences;
S = number of polymorphic (segregating) sites.
LengthGene (bp) N/localities H/Hd Pi(%)/k S
Cytb 942 393/68 164/0.99 15.65/98.4 344ND2 886 312/62 130/0.98 16.85/97.72 340KIF24 565 241/67 142/0.97 3.65/20.37 263ACA 900 225/61 48/0.84 2.83/15.39 201MYH2 436 227/63 128/0.97 2.66/8.84 98PRLR 563 265/68 98/0.96 2.65/13.70 174rpl35 617 206/61 76/0.96 2.15/11.91 151MC1R 524 238/61 72/0.92 1.20/6.30 82MAP1Bex5 888 226/64 55/0.89 1.15/8.81 119MXRA5 919 258/68 96/0.94 1.09/9.75 166SINCAIP 482 263/68 61/0.93 1.09/5.14 80DMXL1 943 276/68 69/0.85 0.91/8.63 179RBMX 640 262/68 41/0.87 0.59/3.18 65
(RBMX) to 16.85% (ND2); and overall haplotype diversity and
average number of nucleotide differences were surprisingly high
(Table 2). We found a high number of polymorphic sites for the
mtDNA and most nuclear loci, including some protein coding
genes (Table 2). The two mtDNA fragments were concatenated
and treated as a single locus in subsequent analyses; 269 of the
388 samples analyzed represented unique haplotypes restricted
to single localities. Most well-sampled localities (n ≥ 4) were
characterized by different haplotypes, but haplotypes were shared
once between two nearby localities (Xingo [no. 12] and Poco
Redondo [no. 16]), and once between two disjunct populations
(Tiangua [no. 20] and Peixe [no. 39]).
All but three nuclear loci (MC1R, MAP1B, DMXL1) had
at least one fixed indel among lineages, and MYH2 and rpl35
regions had the largest number of indels. Barra do Garcas (no. 57)
and Sao Geraldo do Araguaia (no. 23) had the highest fre-
quency of fixed indels (across five loci), followed by Babaculandia
(no. 24), Grao Mogol (no. 51), and Mucuge (no. 36), with indels
across three loci.
GENE TREE ESTIMATION
The mtDNA tree identified multiple deep, moderately to strongly
supported haploclades, with several localities exhibiting mono-
phyly. We identified 44 mtDNA haploclades (A–AR, Fig. 2,
Table S1), which were used as assignments for species tree esti-
mation. We conservatively recognized some haploclades with low
support, if concordant with geography, to avoid underestimating
diversity in downstream analysis. Corrected mtDNA distances
among haploclades ranged from 0.2% between geographically
close sister-clades (Table S3) to values as high as 35% (uncor-
rected distances 0.2–25%, Table S4), with mean distance across
the tree of 23.4% (SD = 0.9%).
Some individual nuclear gene trees lacked resolution at the
most basal levels (e.g., ACA), but most had moderate resolution
and support (Fig. S1). In contrast, the concatenated nuclear ML
tree recovered 12 strongly supported clades (Fig. 3). The overall
genealogy of mtDNA and nuclear trees was congruent, with some
relationships consistently recovered and well supported across all
trees, as P. p. przewalskii (from southwestern Brazil and through-
out Chaco) and the Caatinga group (Figs. 2, 3, and S1). Cerrado
populations occupy three positions on the tree, two small basal
lineages, including mtDNA haploclades A, B, and C, and nuclear
clades (Mucuge no. 36) and (Sao Geraldo do Araguaia no. 23 +Barra do Garcas no. 57), sister to all other lineages. A second
clade, mtDNA haploclade E and nuclear clade (Serra da Mesa
EVOLUTION OCTOBER 2012 3 0 1 9
FERNANDA P. WERNECK ET AL.
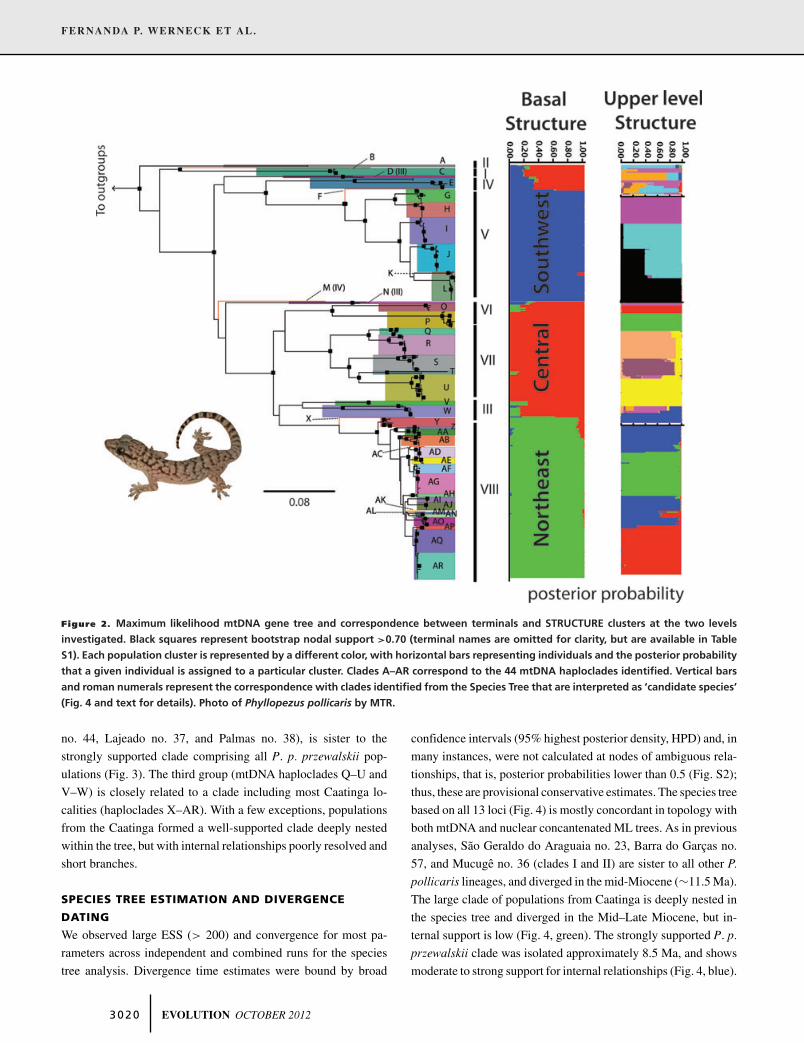
Figure 2. Maximum likelihood mtDNA gene tree and correspondence between terminals and STRUCTURE clusters at the two levels
investigated. Black squares represent bootstrap nodal support >0.70 (terminal names are omitted for clarity, but are available in Table
S1). Each population cluster is represented by a different color, with horizontal bars representing individuals and the posterior probability
that a given individual is assigned to a particular cluster. Clades A–AR correspond to the 44 mtDNA haploclades identified. Vertical bars
and roman numerals represent the correspondence with clades identified from the Species Tree that are interpreted as ‘candidate species’
(Fig. 4 and text for details). Photo of Phyllopezus pollicaris by MTR.
no. 44, Lajeado no. 37, and Palmas no. 38), is sister to the
strongly supported clade comprising all P. p. przewalskii pop-
ulations (Fig. 3). The third group (mtDNA haploclades Q–U and
V–W) is closely related to a clade including most Caatinga lo-
calities (haploclades X–AR). With a few exceptions, populations
from the Caatinga formed a well-supported clade deeply nested
within the tree, but with internal relationships poorly resolved and
short branches.
SPECIES TREE ESTIMATION AND DIVERGENCE
DATING
We observed large ESS (> 200) and convergence for most pa-
rameters across independent and combined runs for the species
tree analysis. Divergence time estimates were bound by broad
confidence intervals (95% highest posterior density, HPD) and, in
many instances, were not calculated at nodes of ambiguous rela-
tionships, that is, posterior probabilities lower than 0.5 (Fig. S2);
thus, these are provisional conservative estimates. The species tree
based on all 13 loci (Fig. 4) is mostly concordant in topology with
both mtDNA and nuclear concantenated ML trees. As in previous
analyses, Sao Geraldo do Araguaia no. 23, Barra do Garcas no.
57, and Mucuge no. 36 (clades I and II) are sister to all other P.
pollicaris lineages, and diverged in the mid-Miocene (∼11.5 Ma).
The large clade of populations from Caatinga is deeply nested in
the species tree and diverged in the Mid–Late Miocene, but in-
ternal support is low (Fig. 4, green). The strongly supported P. p.
przewalskii clade was isolated approximately 8.5 Ma, and shows
moderate to strong support for internal relationships (Fig. 4, blue).
3 0 2 0 EVOLUTION OCTOBER 2012

DEEP DIVERGENCE OF SOUTH AMERICAN ‘DRY DIAGONAL’ BIOMES
Figure 3. Phyllopezus pollicaris concatenated nuclear maximum likelihood tree; relationships within terminal clades are collapsed for
ease of presentation and clades are labeled according to current subspecies designations or major localities. Parentheses include locality
numbers (Fig. 1 and Table S1)/letters corresponding to the mtDNA haploclades (Fig. 2 and Table S1)/roman numerals corresponding to
the clades recovered in the species tree (Fig. 4 and Table S1).
Divergence times estimated the origin and major crown
clades splits of P. pollicaris to have occurred during the Miocene
(between 11 and 5 Ma), followed by divergence within these ma-
jor groups during the Pliocene–Pleistocene transition (5–1.5 Ma).
These estimates are concordant with previous estimates for the ori-
gin of P. pollicaris (Gamble et al. 2011), and indicate that limited
diversification occurred during Late Pleistocene, mostly among
geographically close populations in the Chaco and Caatinga
(Fig. 4, blue and green). Most Cerrado populations initiated and
ended their diversification during the Miocene, and are charac-
terized by long branches and older diversification dates (Fig. 4,
red).
POPULATION STRUCTURE AND ASSIGNMENTS
Calculations of �K detected a peak at K = 3, representing the
most basal hierarchical structure in the data (Evanno et al. 2005;
Weisrock et al. 2010). Assignments detected at K = 3 are con-
gruent with geographic clusters in the Southwest (SW), Central
(CE), and Northeast (NE) of the P. pollicaris distribution, which
are largely coincident with the distributions of the Chaco, Cerrado,
and Caatinga, respectively (Figs. 5, 6). One exception are samples
from a few close localities in Paraıba state (Itaporanga [no. 7],
Junco do Serido [no. 4], Patos [no. 5]), assigned to the Central
cluster, while surrounded by populations assigned to the Northeast
cluster (Fig. 5). There is also overall concordance between iden-
tified multilocus clusters and mtDNA haploclades and geophy-
logeny (Fig. 5). Some individuals located at the contact regions
between clusters revealed admixed assignments (Fig. 6).
When we reran analyses within each of the major clusters,
�K detected K = 3, K = 9, and K = 3 (total K = 15) for the SW,
CE, and NE clusters, respectively, demonstrating further popu-
lation structure, more pronounced in the CE populations. How-
ever, although most individual membership posterior probabilities
were greater than 0.9 in the first round of analyses, coefficients
EVOLUTION OCTOBER 2012 3 0 2 1

FERNANDA P. WERNECK ET AL.
Figure 4. Phyllopezus pollicaris species tree (maximum clade credibility tree based on all 13 loci) and divergence time estimates, derived
under a coalescent model with ∗BEAST. Clades colors correspond to population clusters defined by STRUCTURE analyses, and the squares
correspond to nodes with posterior probability >0.75. Terminals A–AR identify the 44 mtDNA haploclades, and clades highlighted by
roman numerals are interpreted as ‘candidate species’, pending confirmation from ecological and morphological studies. Credibility
intervals are omitted for clarity, but see Figure S2.
are overall lower at the finer level structure, and further divide
both admixed and nonadmixed sets of individuals (Fig. 2). There-
fore, as we considered using population assignments to develop
divergence models, and alternative models should preferentially
represent biologically relevant questions in the simplest way pos-
sible, we chose to focus subsequent analyses at the basal level of
clustering (K = 3).
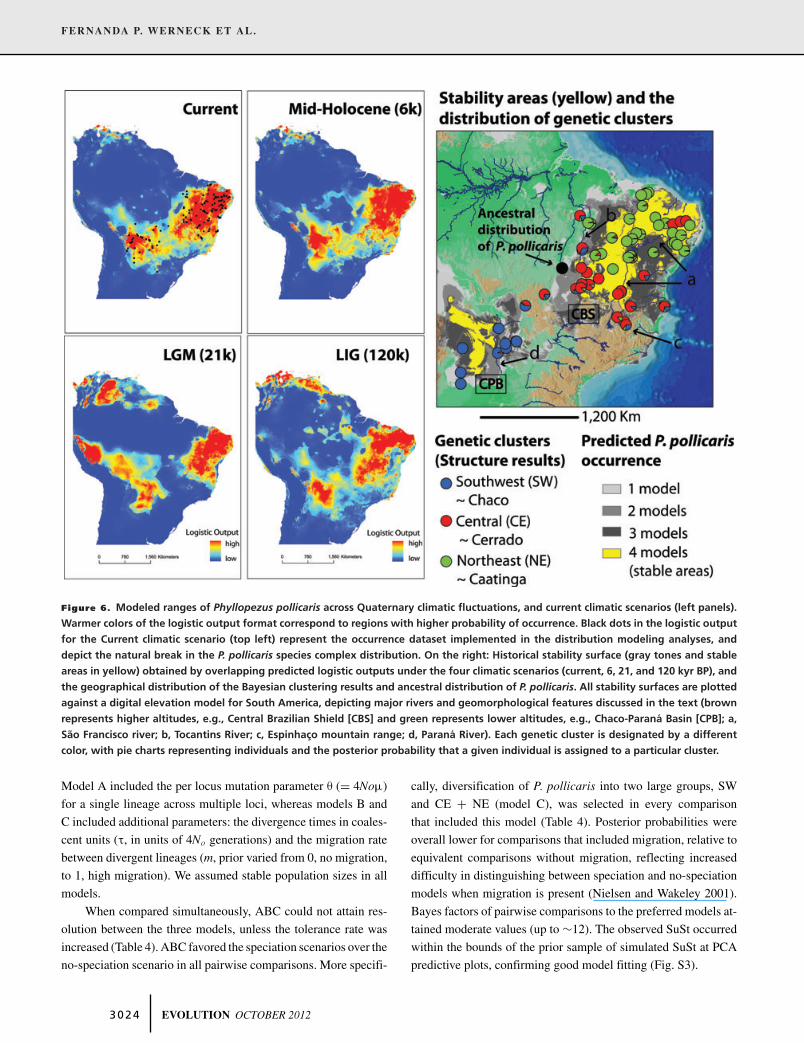
PALAEOMODELING AND ANCESTRAL
DISTRIBUTIONS
Estimated palaeomodels depict a potential distribution of P. pol-
licaris contracted to the southwest and northeast of the ‘dry di-
agonal’ during the LGM, with a break in central Brazil. These
two SDMs blocks closely track the distribution of population
clusters, SW to one extreme and [CE + NE] to the other
(Fig. 6). However, when considering all SDMs and the stabil-
ity surface, we observe that P. pollicaris potential distribution did
not change drastically across Quaternary climatic fluctuations,
especially from the Holocene to the present (Fig. 6). Note the
extensive overlap of highly suitable areas across the four time
periods (i.e., large areas of stability; Fig. 6, yellow areas). Despite
minor oscillations in the species range, the P. pollicaris stabil-
ity map provides a close match for the ‘dry diagonal’ biomes
stability models (Werneck 2011; Werneck et al. in press). Thus,
we are confident that P. pollicaris tracked changes of the open
biomes and that this complex represents a suitable proxy of their
biogeographic patterns at both shallow and deep temporal scales.
The ancestral distribution was estimated by PhyloMapper to be
located in central Brazil, nearby CE and NE current distributions,
where ancient Phyllopezus lineages became extinct (Fig. 6, black
circle).
GENETIC POLYMORPHISM AND TEST
OF PHYLOGEOGRAPHIC PREDICTIONS
None of the groupings (or the total sample) revealed detectable
signatures of population expansion or reduction (Table 3). We
did detect significant IBD across all groupings, except for the
SW cluster, which had overall lower diversity when compared to
3 0 2 2 EVOLUTION OCTOBER 2012

DEEP DIVERGENCE OF SOUTH AMERICAN ‘DRY DIAGONAL’ BIOMES
Figure 5. Phyllopezus pollicaris and outgroups mtDNA geophylogeny as estimated by GeoPhyloBuilder and visualized by ArcScene.
Colors shapes correspond to population clusters identified with STRUCTURE and the black arrow shows the tree root.
the other clusters (Table 3). We did not find major differences
between samples from stable and unstable areas with respect to
most population genetic metrics, contradicting predictions from
the hypothesis of strong influence of Quaternary refugia on clade’s
genetic structure (Hewitt 2004; Carnaval et al. 2009). In fact,
unstable areas presented higher genetic diversity than stable areas
with respect to several metrics (Table 3).
TESTS OF POPULATION DIVERGENCE
AND BIOGEOGRAPHIC SCENARIOS: ABC
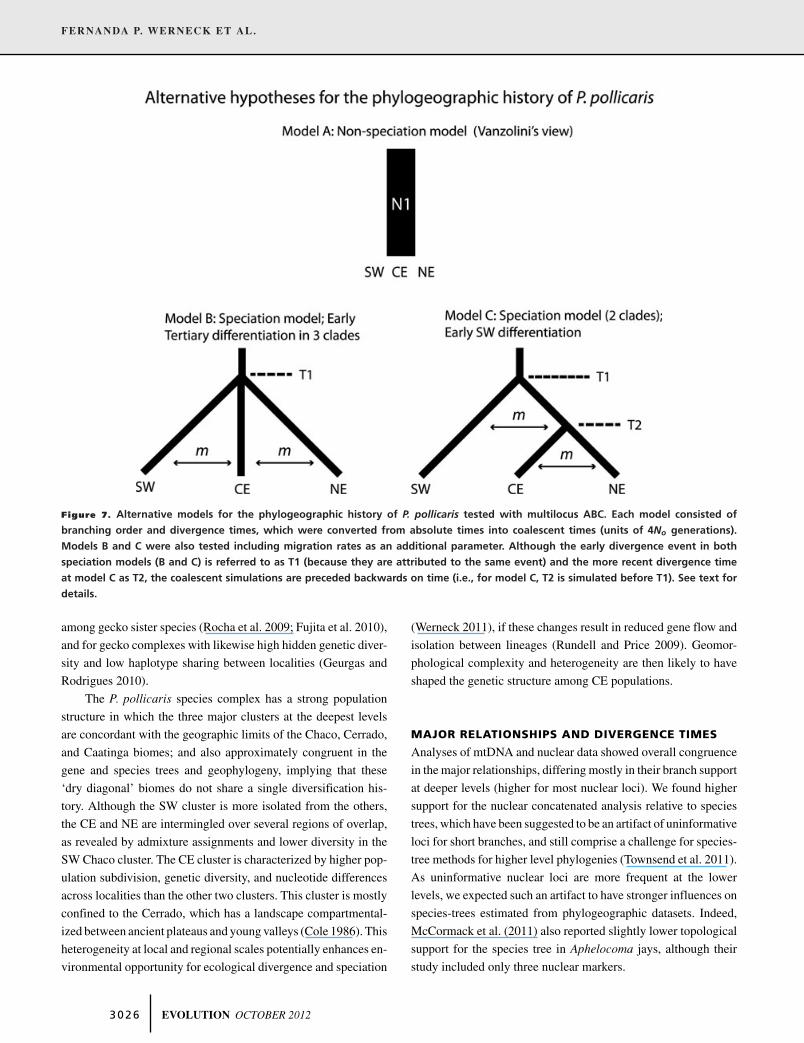
We developed three models representing alternative biogeo-
graphic scenarios for the diversification of P. pollicaris across
the ‘dry diagonal’ based on (1) speciation expectations from esti-
mated genealogies, population structure, and palaeomodels; and
(2) available geological information with relevant times that fall
within the dated chronogram from ∗BEAST. The use of exter-
nal information (e.g., dates of geological events) is crucial to
narrow the universe of possible histories (Garrick et al. 2010).
The first model (A) represents a no-speciation null model and re-
flects views from early studies that the open biomes had a shared
history (Vanzolini 1976); it was modeled as a large population,
with no substructure and free migration. Model B hypothesizes an
approximately simultaneous early divergence from the ancestral
area (as estimated by PhyloMapper) into three clades (SW, CE,
and NE, as recovered by Structure), and represents a geologically
older speciation scenario. Model C represents an early diversifi-
cation of the southwest (SW) group from the other groups (CE +NE), followed by a more recent divergence between these last two.
This hypothesis would correspond to two speciation events within
P. pollicaris, and it predicts a (SW [CE + NE]) topology (Fig. 7).
We attribute the early divergence time (T1) to the final up-
lift of the Central Brazilian Plateau that took place 7–5 Ma, an
important event hypothesized to have driven divergence across
the open biomes (Werneck 2011). We hypothesize the more re-
cent divergence time (T2) to represent the final phase of the eco-
logical expansion of grass-dominated vegetation and increased
fire frequency (5–3 Mya), which may have promoted additional
ecological diversification of the Cerrado from the adjacent open
biomes (Beerling and Osborne 2006; Simon et al. 2009; Edwards
et al. 2010). Both divergence times fall within estimated diver-
gence times for P. pollicaris lineages (Fig. 4). Although the use
of three subgroups estimated by Structure does not fully corrob-
orate the phylogenetic results (which recover a paraphyletic CE
group), the models were intended to capture the broad substruc-
ture and biogeographic patterns supported by available geological
data for the ‘dry diagonal’. Because divergence with some degree
of gene flow may be common (Nosil 2008), we also considered
the possibility of migration in the diversification models B and C.
EVOLUTION OCTOBER 2012 3 0 2 3
FERNANDA P. WERNECK ET AL.
Figure 6. Modeled ranges of Phyllopezus pollicaris across Quaternary climatic fluctuations, and current climatic scenarios (left panels).
Warmer colors of the logistic output format correspond to regions with higher probability of occurrence. Black dots in the logistic output
for the Current climatic scenario (top left) represent the occurrence dataset implemented in the distribution modeling analyses, and
depict the natural break in the P. pollicaris species complex distribution. On the right: Historical stability surface (gray tones and stable
areas in yellow) obtained by overlapping predicted logistic outputs under the four climatic scenarios (current, 6, 21, and 120 kyr BP), and
the geographical distribution of the Bayesian clustering results and ancestral distribution of P. pollicaris. All stability surfaces are plotted
against a digital elevation model for South America, depicting major rivers and geomorphological features discussed in the text (brown
represents higher altitudes, e.g., Central Brazilian Shield [CBS] and green represents lower altitudes, e.g., Chaco-Parana Basin [CPB]; a,
Sao Francisco river; b, Tocantins River; c, Espinhaco mountain range; d, Parana River). Each genetic cluster is designated by a different
color, with pie charts representing individuals and the posterior probability that a given individual is assigned to a particular cluster.
Model A included the per locus mutation parameter θ (= 4Noμ)
for a single lineage across multiple loci, whereas models B and
C included additional parameters: the divergence times in coales-
cent units (τ, in units of 4No generations) and the migration rate
between divergent lineages (m, prior varied from 0, no migration,
to 1, high migration). We assumed stable population sizes in all
models.
When compared simultaneously, ABC could not attain res-
olution between the three models, unless the tolerance rate was
increased (Table 4). ABC favored the speciation scenarios over the
no-speciation scenario in all pairwise comparisons. More specifi-
cally, diversification of P. pollicaris into two large groups, SW
and CE + NE (model C), was selected in every comparison
that included this model (Table 4). Posterior probabilities were
overall lower for comparisons that included migration, relative to
equivalent comparisons without migration, reflecting increased
difficulty in distinguishing between speciation and no-speciation
models when migration is present (Nielsen and Wakeley 2001).
Bayes factors of pairwise comparisons to the preferred models at-
tained moderate values (up to ∼12). The observed SuSt occurred
within the bounds of the prior sample of simulated SuSt at PCA
predictive plots, confirming good model fitting (Fig. S3).
3 0 2 4 EVOLUTION OCTOBER 2012

DEEP DIVERGENCE OF SOUTH AMERICAN ‘DRY DIAGONAL’ BIOMES
Table 3. Population genetic summary metrics estimated from mtDNA (cytb + ND2, total 1828 bp) across stable and unstable areas,
population clusters, and the total sample. N = sample size; θ = diversity parameter (per sequence); θsites = diversity parameter (per site);
Pi = nucleotide diversity (per site); k = average number of nucleotide differences; Mean Da = average net nucleotide differences across
localities with more than two individuals sampled; Hs = Fay and Wu’s Hs test of population expansion. P-values in bold correspond to
significant values at the 0.05 probability level.
Mantel’sθsites (95% correlationconfidence Mean Da Hs coefficient
Region N θ interval) Pi k (min.; max.) (P-value) (P-value)
Population clusterCentral (CE) 131 185.23 0.120 (0.046–0.165) 0.15680 200.6 0.174 (0.010; 0.226) 0.029(0.330) 0.410 (0.002)Northeast (NE) 151 96.29 0.194 (0.083–0.364) 0.03736 64.478 0.037 (0.00006; 0.06132) −0.065(0.333) 0.303 (0.003)Southwest (SW) 105 91.38 0.058 (0.025–0.078) 0.07096 121.9 0.076 (0.001; 0.118) −0.082(0.332) 0.065 (0.439)
Stability surfaceStable 217 151.54 0.136 (0.114–0.165) 0.1405 202.3 0.118 (0.005; 0.216) 0.229(0.329) 0.507 (<0.0001)Unstable 170 169.89 0.084 (0.067–0.104) 0.1565 233.8 0.165 (0.001; 0.225) 1.520(0.323) 0.616 (<0.0001)
Total 387 194.08 0.123 (0.108–0.142) 0.155 219.1 0.147 (0.001; 0.224) 0.048(0.331) 0.575 (<0.0001)
Table 4. Posterior probabilities of comparisons between no-speciation and speciation models, as analyzed with approximate Bayesian
computation. Comparisons were done among all models simultaneously, between nonspeciation versus speciation models (two at a
time), and between the speciation models only. Values represent comparisons including isolation models/migration models (for models
B and C only). Preferred model at each comparison is marked in bold for emphasis, and i/m = isolation/migration.
Models comparisons
No-speciation versusspeciation models,pairwise
All models Speciation models onlyModel and parameters A versus B versus C i/m A versus B i/m A versus C i/m B versus C i/m
Model A; no-speciation 0.089/0.169∗ 0.158/0.159 0.08/0.169 NAModel B; early speciation 0.098/0.168∗ 0.842/0.841 NA 0.007/0.286Model C; speciation in two
clades (SW [NE+CE])0.813/0.663∗ NA 0.84/0.831 0.993/0.714
∗No resolution at tolerance rate = 0.001; results shown at an increased tolerance rate (tol = 0.1).
DiscussionThe degree to which phylogeographic approaches can resolve
broader biogeographic processes is directly dependent on the cov-
erage of geographical sampling, the biology of the study taxa, and
the nature of markers used. Single-locus (mtDNA) phylogeog-
raphy has been profusely criticized (Brito and Edwards 2009),
because it ignores coalescent stochasticity and tends to provide
biased and overly simplistic inferences (Knowles and Maddison
2002). Regarding sampling design, robust inferences require a
trade-off between number of loci and individuals, but generally
an increased number of individuals within species/populations
improve species tree accuracy (Maddison and Knowles 2006).
However, most phylogeographic studies for Neotropical taxa are
still based mainly on mtDNA and limited population and indi-
vidual sampling, so their broader biogeographic implications are
limited.
In this article, we present a densely sampled case study for
a broadly distributed Neotropical habitat-specialist species com-
plex. Our findings revealed a very deep mtDNA structure typical
of low-vagility species, unprecedented levels of cryptic genetic
diversity, and diversification dating back to at least the Neogene
with persistence across Quaternary fluctuations. Ultimately, we
tested alternative divergence scenarios, which proved useful to
infer major biogeographic patterns across the ‘dry diagonal’.
DNA POLYMORPHISM, GENETIC DISTANCES,
AND POPULATION STRUCTURE
Patterns of DNA polymorphism, gene and species trees are clearly
consistent with the occurrence of a complex of cryptic species
within P. pollicaris, as hypothesized by Gamble et al. (2011,
2012). The large mtDNA genetic distances among clades found
here exceed typical values ranging from 5% to 11% reported
EVOLUTION OCTOBER 2012 3 0 2 5
FERNANDA P. WERNECK ET AL.
Figure 7. Alternative models for the phylogeographic history of P. pollicaris tested with multilocus ABC. Each model consisted of
branching order and divergence times, which were converted from absolute times into coalescent times (units of 4No generations).
Models B and C were also tested including migration rates as an additional parameter. Although the early divergence event in both
speciation models (B and C) is referred to as T1 (because they are attributed to the same event) and the more recent divergence time
at model C as T2, the coalescent simulations are preceded backwards on time (i.e., for model C, T2 is simulated before T1). See text for
details.
among gecko sister species (Rocha et al. 2009; Fujita et al. 2010),
and for gecko complexes with likewise high hidden genetic diver-
sity and low haplotype sharing between localities (Geurgas and
Rodrigues 2010).
The P. pollicaris species complex has a strong population
structure in which the three major clusters at the deepest levels
are concordant with the geographic limits of the Chaco, Cerrado,
and Caatinga biomes; and also approximately congruent in the
gene and species trees and geophylogeny, implying that these
‘dry diagonal’ biomes do not share a single diversification his-
tory. Although the SW cluster is more isolated from the others,
the CE and NE are intermingled over several regions of overlap,
as revealed by admixture assignments and lower diversity in the
SW Chaco cluster. The CE cluster is characterized by higher pop-
ulation subdivision, genetic diversity, and nucleotide differences
across localities than the other two clusters. This cluster is mostly
confined to the Cerrado, which has a landscape compartmental-
ized between ancient plateaus and young valleys (Cole 1986). This
heterogeneity at local and regional scales potentially enhances en-
vironmental opportunity for ecological divergence and speciation
(Werneck 2011), if these changes result in reduced gene flow and
isolation between lineages (Rundell and Price 2009). Geomor-
phological complexity and heterogeneity are then likely to have
shaped the genetic structure among CE populations.
MAJOR RELATIONSHIPS AND DIVERGENCE TIMES
Analyses of mtDNA and nuclear data showed overall congruence
in the major relationships, differing mostly in their branch support
at deeper levels (higher for most nuclear loci). We found higher
support for the nuclear concatenated analysis relative to species
trees, which have been suggested to be an artifact of uninformative
loci for short branches, and still comprise a challenge for species-
tree methods for higher level phylogenies (Townsend et al. 2011).
As uninformative nuclear loci are more frequent at the lower
levels, we expected such an artifact to have stronger influences on
species-trees estimated from phylogeographic datasets. Indeed,
McCormack et al. (2011) also reported slightly lower topological
support for the species tree in Aphelocoma jays, although their
study included only three nuclear markers.
3 0 2 6 EVOLUTION OCTOBER 2012

DEEP DIVERGENCE OF SOUTH AMERICAN ‘DRY DIAGONAL’ BIOMES
Instances of topological discordance are evident at internal
nodes of more recent lineages, and at the admixture zones be-
tween CE and NE phylogeographic groups. For example, rela-
tionships within the NE group are poorly resolved. This pat-
tern can be attributed to the reduced topographic complexity
of the Caatinga that is disrupted by few prominent landforms,
such as elevated plateaus (e.g., Chapadas do Araripe, Apodi, and
Borborema, Serra do Espinhaco), and relictual rainforest enclaves
(Sampaio 1995). Fewer geological barriers in the Caatinga likely
enhanced opportunity for gene flow, yielding less-resolved diver-
sification histories.
A few samples are characterized by discordant placement
among datasets or methods. For example, the clade D (Diamantina
no. 55 + Serro no. 56) occupying a basal position in the mtDNA
(Fig. 2) and the species trees (Fig. 4), but a more nested position in
the nuclear concatenated tree (Fig. 3). Similarly, Matias Cardoso
no. 50 + Augusto de Lima no. 54 and Grao Mogol no. 51 (clades
V and W) are basal in the species tree but deeply nested in both
concatenated trees, and these samples show admixed structures
(Fig. 6). These cases show the confounding effect of contact zones
between adjacent groups on species tree inference, and the impor-
tance of multilocus coalescence methods for estimating species
trees in instances of discordance (Leache 2009). In these cases,
we favor the species tree hypothesis that places some of the north-
ern Minas Gerais populations closer to the base of the tree (V, W,
and D), and remaining samples (Januaria [Q, no. 49] and Manga
[R, no. 48]) as sister to the large clade of Caatinga populations
(Fig. 4).
The most interesting outcome of this hypothesis comes from
the disjunct placement of Manga (clade R, no. 48) and Matias
Cardoso (clade V, no. 50) localities that are less than 15 km apart,
but are separated by the Sao Francisco River (Fig. 6, letter a, SFR).
The SFR is recognized as a barrier that has driven speciation at
high taxonomic levels, with several endemic genera and species
pairs isolated on opposite sides (Rodrigues 1996). More recently,
the SFR was suggested as an important phylogeographic barrier
to Atlantic Forest taxa distributed closer to the delta (Pellegrino
et al. 2005; Carnaval and Moritz 2008). Recent divergence esti-
mates in the lizard genera Eurolophosaurus (Passoni et al. 2008)
and Calyptommatus (Siedchlag et al. 2010) suggest that the SFR
probably formed a vicariant barrier during the Late Miocene, con-
cordant with P. pollicaris divergence times. The SFR also likely
prevented secondary contact between previously diverged P. pol-
licaris lineages, reinforcing its importance as a singular center of
diversification. Our results also suggest a role for the Tocantins
River as barrier between CE and NE clusters (Fig. 6, letter b).
Denser sampling and investigation of other taxa distributed in the
region are, however, needed to further explore this hypothesis.
Sao Geraldo do Araguaia (no. 23/A), Barra do Garcas
(no. 57/B), and Mucuge (no. 36/C) on the other hand were re-
covered as highly distinct and early differentiated populations in
all analyses. Mucuge together with other populations (Diamantina
[no. 55/D] and Serro [no. 56/D]) are located in the high altitude
“campos rupestres” in the Serra do Espinhaco mountain range
(Fig. 6, letter c), a region well known for its high levels of en-
demism, including squamates (Cassimiro and Rodrigues 2009;
Nogueira et al. 2011). Establishment of the Espinhaco range was
a regional event that potentially influenced P. pollicaris diver-
gence (see below).
Divergence within the P. pollicaris complex proceeded in a
nearly continuous fashion since about 11.5 Ma, but with crown
clades originating in the Mid–Late Miocene. Phyllopezus pol-
licaris przewalskii from Chaco is strongly supported by gene
and species tree, and diverged approximately 8.5 Ma. Pleistocene
diversification is recovered among some geographically close
Caatinga populations; a time correlating with geological evidence
for the exposition of formerly submerged granite surfaces (laje-
dos) where the species occur. These times suggest a major in-
fluence of divergence/geographical barriers during the Miocene,
followed by a nearly continuous diversification, with no clear
bursts of Quaternary diversifications (Rull 2011b). Long-term
diversification with combined Neogene and Pleistocene causal
mechanisms is expected to be apparent at higher taxonomic lev-
els (Rull 2011a), whereas the prolonged complex history of ‘dry
diagonal’ biomes is here evident within a single complex.
Likewise, ancient divergence dates have been reported in
other gecko complexes (Pellegrino et al. 2005; Geurgas and
Rodrigues 2010; Oliver et al. 2010), and these are commonly
older than codistributed taxonomic groups. Patterns of New World
gecko diversification exemplify most of the scenarios described
for terrestrial vertebrates, including ancient vicariance, trans-
Atlantic rafting and temporary land bridge dispersal, and hu-
man introductions (Gamble et al. 2011), and reflect their ancient
Gondwanan origin (Kluge 1987). Positive correlations between
clade age and species diversity described for geckos (Gamble et
al. 2011) can account for some of the patterns we report for P.
pollicaris complex (ancient divergence times and high diversity).
MODEL-BASED POPULATION DIVERGENCE:
BIOGEOGRAPHIC IMPLICATIONS
We are aware that our models represent simplifications (e.g.,
no substructure within major clusters, use of combined splitting
times, and use of a nearly monophyletic group [CE]), but they do
reflect phylogeographic patterns within P. pollicaris that correlate
with major biogeographic events across the ‘dry diagonal’. ABC
favored the speciation scenarios over the no-speciation model,
and we found stronger support for model C, representing an early
diversification (∼7–5 Ma) of the southwest (SW) from the (CE +NE) group, followed by a more recent divergence between these
last two (∼5–3 Ma). Comparisons of model C under isolation
EVOLUTION OCTOBER 2012 3 0 2 7

FERNANDA P. WERNECK ET AL.
and migration suggest that divergence may have occurred with
some gene flow. Due to the high correspondence between groups
tested and the ‘dry diagonal’ biomes, we can infer geomorpholog-
ical events potentially responsible for an early diversification of
Chaco lineages followed by divergence of Cerrado and Caatinga
lineages, and their biogeographic implications.
Key Neogene events often emphasized as causal mechanisms
for Neotropical diversification (e.g., closure of the Panama Isth-
mus, Andean uplift, change of drainage patterns with the cessa-
tion of marine incursions into the Amazon basin; Hoorn et al.
2010; Rull 2011a) almost certainly impacted indirectly the ‘dry
diagonal’ biota diversification, which is largely confined to the
Brazilian Shield (Werneck 2011). However, other correlated, but
less-understood, events were more relevant for this region and for
the diversification of P. pollicaris complex. From the hypothe-
sized ancestral area in central Brazil, some ancestral population
dispersed across the ‘dry diagonal’ before being subject of the fol-
lowing suggested biogeographic events that generated the three
major genetic lineages.
Marine transgressions during the Mid–Late Miocene (∼10–
5 Ma), supported by sedimentology and marine fossil records,
covered large portions of the Chaco-Parana Basin (CPB), and
formed the second flooding pulse of the Paranaense Sea, iso-
lating large areas of the Chaco depression and associated biota
(Hernandez et al. 2005; Ruskin et al. 2011). Isolation of southwest
populations of P. pollicaris initiated by these marine transgres-
sions was most likely enhanced by the Chaco subsidence due to
an intense uplift phase of the Andes and the final uplift of the
Central Brazilian Shield during the Late Miocene–Early Pliocene
transition, 7–5 Mya (Gubbles et al. 1993; Uba et al. 2006; Mulch
et al. 2010). We hypothesize that these events, in concert, drove
allopatric speciation of the P. p. przewalskii clade (SW). The
resulting altitudinal break acted as a geographical barrier and
prevented secondary contact, with the lowland populations iso-
lated on the SW side (CPB and Paraguay River basin) and the
higher elevation Brazilian Plateaus populations to the CE–NE side
(Fig. 6). Strong isolation coupled with low densities of P. polli-
caris preferred habitat (rock outcrops) in the Chaco, may have
limited population sizes, and thus explain the reduced molecular
variation in the SW clade.
We also hypothesize that subsequent regional tectonic events
responsible for the final establishment of the Brazilian Plateau and
enclosed regional mountain ranges (e.g., Serras do Espinhaco, do
Mar, da Mantiqueira, 2–4 Mya) coupled with ecological events
such as expansion of grasslands and increased fire frequency
(Beerling and Osborne 2006; Simon et al. 2009) would promote
differentiation between Cerrado and Caatinga clades. However,
because CE and NE lineages are not reciprocally monophyletic
and show some admixture, they may have diverged through eco-
logical speciation along environmental gradients, without physi-
cal barriers to prevent gene flow (Nosil 2008). The alternative of
sympatric speciation is supported by an increasing body of evi-
dence in marine vertebrates (Foote et al. 2009; Crow et al. 2010),
where obvious barriers are less evident, but is also documented
for terrestrial vertebrates (Niemiller et al. 2008; VanderWerf et al.
2010), and must also be considered as a possibility here.
Although the exact mechanisms are not clear, events at
the Tertiary–Quaternary boundary that significantly remodeled
eastern Brazil’s landscapes may have confounded the genetic
signatures of the earlier isolating events, including vegetation
shifts (Werneck et al. 2011, in press), and neotectonic activity
(Riccomini and Assumpcao 1999). We suggest that the less
dramatic differentiation between Cerrado and Caatinga lineages
could be due to a combination of more recent divergence and gene
flow, and represent a possible example of ecological or sympatric
speciation (Vanzolini 1976).
PAST DISTRIBUTIONS AND TESTS OF QUATERNARY
PHYLOGEOGRAPHIC PREDICTIONS
Our results suggest a limited influence for Quaternary climatic
fluctuations on the phylogeographic history and SDMs of P. polli-
caris. Patterns of genetic variation and structure reflect the impact
of earlier influences and a Miocene origin of the crown clades
followed by persistence through the Pleistocene without major
demographic changes. Our modeling suggests a slight range re-
duction of P. pollicaris during the LGM with a break in central
Brazil. This “two LGM refugia” scenario reflects very distinct
SDMs between the SW and the [CE + NE] clusters, and these
ecological niche differences may have promoted additional diver-
sification between these two groups.
Although Pleistocene distributional shifts shaped strong ge-
netic signatures in many groups (Carnaval et al. 2009; Knowles
and Alvarado-Serrano 2010; Lessa et al. 2010), there are counter-
examples in which phylogeographic signatures reflect events
that have not been overwritten by Pleistocene climate dynamics
(Leavitt et al. 2007; Bell et al. 2010; Thome et al. 2010; Hoskin et
al. 2011). For P. pollicaris specifically, the influence of climatic
fluctuations seems minor when compared to geographical and
topographical influences that remained largely unchanged since
the Miocene, however, they can not be neglected, and likely played
a relevant role to promote further differentiation between and
within previously diverged lineages.
TAXONOMIC IMPLICATIONS AND PROVISIONAL
SPECIES LIMITS
Phyllopezus pollicaris should clearly be treated as polytypic, and
because the consistently recovered clades are deeply divergent
and strongly supported in all analyses, they are almost certainly
valid species. Here, we comment briefly on species limits and
taxonomic implications within P. pollicaris complex.
3 0 2 8 EVOLUTION OCTOBER 2012

DEEP DIVERGENCE OF SOUTH AMERICAN ‘DRY DIAGONAL’ BIOMES
The P. p. przewalskii clade is strongly supported across all
analyses, and it has a distinct structure and a singular SDM.
Although morphological uniformity generally characterizes the
P. pollicaris complex, P. p. przewalskii is also morphologically
diagnosable by the lack of postcloacal tubercles and slightly
lower ventral scales count (Vanzolini 1953), and in its karyotype
(Pellegrino et al. 1997). Under a general lineage species concept
(de Queiroz 2007) and our empirical evidence for both ecolog-
ical and genetic nonexchangeability (Crandall et al. 2000), P.
p. przewalskii should be elevated to species status. The nested
placement of P. p. przewalskii within P. pollicaris renders the
other subspecies, P. p. pollicaris, paraphyletic. We hypothesize
that the following clades (Roman numerals in Fig. 4 and Table
S1) should be treated as ‘candidate species’: Clades I (no. 38)
and II (no. 7 and no. 54), which are the sister groups to all other
P. pollicaris, should be treated as two candidate species, along
with these six remaining clades: Clade III (6 localities); Clade IV
(3 localities); Clade V (P. przewaslkii, 11 localities); Clade VI
(6 localities); Clade VII (7 localities), and the Clade VIII (the
32 remaining Caatinga localities). See Figure S4 for the geo-
graphic distribution of the eight ‘candidate species’. Aside from P.
przewaslkii, we do not suggest formal names for any of these lin-
eages, but as ‘candidate species’ (Morando et al. 2003) they can
guide biogeography-based conservation planning because they
register broad evolutionary patterns without the necessity of for-
mal names (Bickford et al. 2007; Riddle et al. 2011).
IMPLICATIONS FOR ‘DRY DIAGONAL’
CONSERVATION
Recent studies show that current knowledge of amphibian and
reptile species diversity in the Neotropics has been underestimated
(Fouquet et al. 2007; Geurgas and Rodrigues 2010; Gamble et al.
2011; Funk et al. 2012). The cryptic genetic diversity disclosed
here reveals that the South American ‘dry diagonal’ biomes are
no exception. With the management task of preserving adaptive
diversity, evolutionary processes, and natural genetic connections
across the range of species complexes (Crandall et al. 2000; Davis
et al. 2008), we can propose some conservation implications of
our results.
Our assessment of the P. pollicaris complex shows that pro-
tection of the eight candidate species is necessary to preserve the
evolutionary processes that generated them, especially if these ge-
ographic regions have fostered codivergence in other taxa (Davis
et al. 2008). Protection of long-isolated populations should be
augmented by protection of admixture zones to maximize adap-
tive diversity and evolutionary potential (Crandall et al. 2000;
Smith et al. 2001; Moritz et al. 2009). This can be accomplished
by placing reserves at the core of the three major clusters, and
several are established and were included in our sampling (e.g.,
no. 6, 10, 16, 19, 40, 42, 48, 49, 50, 64; Fig. 1). Fortunately, re-
serves have also been established in the transition zones between
CE and NE clusters (no. 23 and 26), but additional reserves in this
region (e.g., no. 36, 37, 38, 51, 54, 55, 56,) and between the SW
populations and the other lineages (e.g. no. 57, 58, 61) should be
considered in regional conservation planning.
Persistence through Quaternary fluctuations and high diver-
sity within the P. pollicaris complex suggests that it has the poten-
tial to tolerate adverse scenarios and to adapt to new conditions
(Davis et al. 2005), as long as rock outcrops persist. These patterns
provide important insights about responses to future environmen-
tal changes and long-term population viability, a critical vari-
able for establishing efficient conservation strategies (Diniz-Filho
et al. 2008). However, other taxa associated with ‘dry diagonal’
features more susceptible to oscillations may be more susceptible
to extinction due to climate change. Allocation of conservation
resources will then be more effective if comparative studies can
provide evolutionary histories of a diverse array of codistributed
‘dry diagonal’ endemics.
ConclusionsThis study highlights how phylogeographic patterns can be stud-
ied in a spatio-temporal framework to investigate broader his-
torical biogeographic processes through the coupling of SDMs,
multilocus genetic data, and model-based approaches (Knowles
2009; Knowles and Alvarado-Serrano 2010). For species com-
plexes such as P. pollicaris, whose current and historical distribu-
tions overlap closely those of the relevant biomes, major phylo-
geographic breaks may reflect influential historical biogeographic
processes. These characteristics make such complexes important
evolutionary radiations to study the deep history of associated
biomes. This approach is particularly relevant for poorly studied
regions, such as the South American ‘dry diagonal’ biomes where
threats are escalating.
In this perspective, the deeply divergent lineages of P. polli-
caris, which are geographically structured along the southwest–
northeast ‘dry diagonal’, reflect complex diversification scenar-
ios and the primary influence of geologically old processes
on the dry biomes diversification. Long-term isolation is not
essential to generate significant genetic differentiation (Knowles
and Alvarado-Serrano 2010), but this is the case for the P. polli-
caris complex, whose distributions are characterized by substan-
tial stability and genetic signatures of deep historical events that
were not erased by Pleistocene climate shifts. Recent environmen-
tal instability thus does not appear to be the primary parameter
influencing the genetic outcomes of the diversification process in
this taxon.
Each biome has unique population clusters and lineages;
and our model-based approach yielded stronger support for the
EVOLUTION OCTOBER 2012 3 0 2 9

FERNANDA P. WERNECK ET AL.
diversification models, contradicting early views that the ‘dry
diagonal’ biomes would have a shared diversification history.
More precisely, the central portion of South America appears to
have served as important diversification center over the last several
million years, as a response to geomorphological rearrangements
of the landscape. These results have important implications
for identification of areas to maximize the protection of rich
lineages unique to the region, which evolved in concert with the
diversification of central-eastern South American ‘dry diagonal’
biomes.
ACKNOWLEDGMENTSFPW was supported by fellowships from CAPES/Fulbright (no.15073722–2697/06–8) and by a graduate research assistantship from theBYU Department of Biology. This work was funded by the National Geo-graphic Society (NGS, no. 8642–09), National Science Foundation DDIGaward (DEB-1210346), Society of Systematic Biologists (SSB), Neotrop-ical Grassland Conservancy (NGC), Society for the Study of Amphibiansand Reptiles (SSAR), Idea Wild, Conselho Nacional de DesenvolvimentoCientıfico e Tecnologico (CNPq), Fundacao de Amparo a Pesquisa doEstado de Sao Paulo (FAPESP), and Fundacao de Apoio a Pesquisa doDistrito Federal (FAPDF). The work in the Sites lab was also supportedby a BYU Mentoring Environment Grant (2011), and National ScienceFoundation (NSF) awards EF 0334966 (“Deep Scaly” project) and OISE0530267 (“PIRE – Patagonia” project); this last project to the follow-ing institutions (listed alphabetically): Brigham Young University, Cen-tro Nacional Patagonico (AR), Dalhousie University, Instituto BotanicoDarwinion (AR), Universidad Austral de Chile, Universidad de Con-cepcion, Universidad Nacional del Comahue, Universidad Nacional deCordoba, and University of Nebraska. FPW thanks the Instituto ChicoMendes de Conservacao da Biodiversidade (ICMBio; no. 16381–2) andInstituto Estadual de Florestas (IEF-MG; no. 066–070/09) for issuingcollecting permits. We thank the following researchers: D. Loebman, I. J.Roberto, F. S. Rodrigues, M. Persio, V. H. G. L. Cavalcante, P. Peloso, A.Prudente, D. M. Borges-Nojosa, J. Cassimiro, M. Teixeira, Jr., R. Recoder,F. F. Curcio, D. Pavan, J. Roscito, R. M. L. Santos, R. Villela, P. H. Valdujo,F. L. Souza, M. Uetanabaro, C. Candido, D. O. Mesquita, F. R. Delfim, R.G. Faria, C. B. Carvalho, R. A. Santos, H. Zaher, F. Graziotin, C. C. MelloD’Horta, V. L. Ferreira, C. Strussmann, and curators of the following in-stitutions for providing tissue samples for this study: CHUNB, MZUSP,Colecao Herpetologica da Universidade Federal do Ceara (CHUFC),Laboratorio de Zoologia da Universidade Federal do Piauı (LZUFPI),Museu Paraense Emılio Goeldi (MPEG), Departamento de Zoologia daUniversidade Federal do Mato Grosso (UFMT), Colecao Herpetologicada Universidade Federal do Mato Grosso do Sul (UFMS/CH), MuseoNacional de Historia Natural del Paraguay (MNHNP), ZoologischesForschungsinstitut und Museum Alexander Koenig (ZFMK), Museumfur Tierkunde Dresden (MTD), Museo Nacional de Ciencias Naturales(MNCN), Herpetological collection of L. J. Avila and M. Morando(LJAMM) of the Centro Nacional Patagonico (CENPAT–CONICET).FPW thanks A. H. S. B. Soares, R. Leite, D. C. de Paula, M. M. Espırito-Santo, M. M. Caixeta, R. Recoder, S. F. Balbino, A. F. Beda, V. L.Ferreira, N. Rufino, F. C. Villela, L. J. Avila, N. Feltrin, N. Frutos,M. Motte, N. J. Scott, P. Cacciali, G. H. C. Vieira, D. O. Mesquita,S. Vieira, S. C. Ribeiro for their invaluable assistance in the field ex-peditions. This manuscript benefitted from discussions of the analyseswith A. Camargo, R. N. Leite, P. Pavlidis, J. E. McCormack, J. Brein-holt, and G. C. Costa; and from helpful comments from two anonymousreviewers.
LITERATURE CITEDAmorim, F. W., R. S. Avila, Jr., A. J. A. de Camargo, A. L. Vieira, and P. E.
Oliveira. 2009. A hawkmoth crossroads? Species richness, seasonalityand biogeographical affinities of Sphingidae in a Brazilian Cerrado. J.Biogeogr. 36:662–674.
Ayres, D. L., A. Darling, D. J. Zwickl, P. Beerli, M. T. Holder, P. O. Lewis, J. P.Huelsenbeck, F. Ronquist, D. L. Swofford, M. P. Cummings, et al. 2012.BEAGLE: an application programming interface and high-performancecomputing library for statistical phylogenetics. Syst. Biol. 61:170–173.
Beaumont, M. A. 2010. Approximate Bayesian computation in evolution andecology. Annu. Rev. Ecol. Evol. Syst. 41:379–405.
Beaumont, M. A., R. Nielsen, C. Robert, J. Hey, O. Gaggiotti, L. L. Knowles,A. Estoup, M. Panchal, J. Corander, M. J. Hickerson, et al. 2010. Indefense of model-based inference in phylogeography. Mol. Ecol. 19:436–446.
Beerli, P., and M. Palczewski. 2010. Unified framework to evaluate panmixiaand migration direction among multiple sampling locations. Genetics185:313–326.
Beerling, D. J., and C. P. Osborne. 2006. The origin of the savanna biome.Glob. Change Biol. 12:2023–2031.
Beheregaray, L. B. 2008. Twenty years of phylogeography: the state of the fieldand the challenges for the Southern Hemisphere. Mol. Ecol. 17:3754–3774.
Bell, R. C., J. L. Parra, M. Tonione, C. J. Hoskin, J. B. Mackenzie, S. E.Williams, and C. Moritz. 2010. Patterns of persistence and isolationindicate resilience to climate change in montane rainforest lizards. Mol.Ecol. 19:2531–2544.
Bertorelle, G., A. Benazzo, and S. Mona. 2010. ABC as a flexible frameworkto estimate demography over space and time: some cons, many pros.Mol. Ecol. 19:2609–2625.
Bickford, D., D. J. Lohman, N. S. Sodhi, P. K. L. Ng, R. Meier, K. Winker, K.K. Ingram, and I. Das. 2007. Cryptic species as a window on diversityand conservation. Tree 22:148–155.
Bloomquist, E. W., P. Lemey, and M. A. Suchard. 2010. Three roads diverged?Routes to phylogeographic inference. Tree 25:626–632.
Bonnett, E., and V. de Peer. 2002. Zt: a software tool for simple and partialMantel tests. J. Stat. Softw. 7:1–12.
Breitman, M. F., L. J. Avila, J. W. Sites, Jr., and M. Morando. 2011. Lizardsfrom the end of the world: Phylogenetic relationships of the Liolaemus
lineomaculatus section (Squamata: Iguania: Liolaemini). Mol. Phylo-genet. Evol. 59:364–376.
Brito, P. H., and S. V. Edwards. 2009. Multilocus phylogeography and phylo-genetics using sequence-based markers. Genetica 135:439–455.
Cabanne, G. S., F. M. D’Horta, D. Meyer, J. M. C. Silva, and C. Y. Miyaki.2011. Evolution of Dendrocolaptes platyrostris (Aves: Furnariidae) be-tween the South American open vegetation corridor and the Atlanticforest. Bio. J. Linn. Soc. 103:801–820.
Cadena, C. D., N. Gutierrez-Pinto, N. Davila, and R. T. Chesser. 2011. Nopopulation genetic structure in a widespread aquatic songbird from theNeotropics. Mol. Phylogenet. Evol. 58:540–545.
Caetano, S., D. Prado, R. T. Pennington, S. Beck, A. T. Oliveira-Filho, R.Spichiger, and Y. Naciri. 2008. The history of Seasonally Dry TropicalForests in eastern South America: inferences from the genetic structureof the tree Astronium urundeuva (Anacardiaceae). Mol. Ecol. 17:3147–3159.
Camargo, A., M. Morando, L.J. Avila, and J.W. Sites, Jr. 2012. Species de-limitation with ABC and other coalescent-based methods in lizards ofthe Liolaemus darwinii complex (Squamata: Liolaemidae). Evolution.doi:10.111/j.1558-5646.2012.01640.x.
Carnaval, A. C., and C. Moritz. 2008. Historical climate modelling pre-dicts patterns of current biodiversity in the Brazilian Atlantic forest. J.Biogeogr. 35:1187–1201.
3 0 3 0 EVOLUTION OCTOBER 2012

DEEP DIVERGENCE OF SOUTH AMERICAN ‘DRY DIAGONAL’ BIOMES
Carnaval, A. C., M. J. Hickerson, C. F. B. Haddad, M. T. Rodrigues, and C.Moritz. 2009. Stability predicts genetic diversity in the Brazilian AtlanticForest hotspot. Science 323:785–789.
Carstens, B. C., and L. L. Knowles. 2010. Navigating the unknown: modelselection in phylogeography. Mol. Ecol. 19:4581–4582.
Cassimiro, J., and M. T. Rodrigues. 2009. A new species of lizard genusGymnodactylus Spix, 1825 (Squamata: Gekkota: Phyllodactylidae) fromSerra do Sincora, northeastern Brazil, and the status of G. carvalhoiVanzolini, 2005. Zootaxa 2008:38–52.
Chan, L. M., J. L. Brown, and A. D. Yoder. 2011. Integrating statisticalgenetic and geospatial methods brings new power to phylogeography.Mol. Phylogenet. Evol. 59:523–537.
Chaves, J. A., and T. B. Smith. 2011. Evolutionary patterns of diversificationin the Andean hummingbird genus Adelomyia. Mol. Phylogenet. Evol.60:207–218.
Cole, M. 1986. The Savannas: biogeography and geobotany. Academic Press,London.
Crandall, K. A., O. R. P. Bininda-Emonds, G. M. Mace, and R. K. Wayne.2000. Considering evolutionary processes in conservation biology. Tree15:290–295.
Crow, K. D., H. Munehara, and G. Bernardi. 2010. Sympatric speciation in agenus of marine reef fishes. Mol. Ecol. 19:2089–2105.
Csillery, K., M. G. B. Blum, O. E. Gaggiotti, and O. Francois. 2010. Approx-imate Bayesian computation (ABC) in practice. Tree 25:410–418.
Davis, E. B., M. S. Koo, C. Conroy, J. L. Patton, and C. Moritz. 2008. TheCalifornia Hotspots Project: identifying regions of rapid diversificationof mammals. Mol. Ecol. 17:120–138.
Davis, M. B., R. G. Shaw, and J. R. Etterson. 2005. Evolutionary responsesto changing climate. Ecology 86:1704–1714.
de Queiroz, K. 2007. Species concepts and species delimitation. Syst. Biol.56:879–886.
Deutsches, K. M. 1992. The ECHAM3 atmospheric general circulation model.Pp. 1–184. DKRZ Techinical Report No. 6. Deutsches Klimarechenzen-trum Modellbetreuungsgruppe Hamburg, Germany.
Diniz-Filho, J. A. F., M. P. C. Telles, S. L. Bonatto, E. Eizirik, T. R. O.Freitas, P. Marco, Jr., F. R. Santos, A. Sole-Cava, and T. N. Soares. 2008.Mapping the evolutionary twilight zone: molecular markers, populationsand geography. J. Biogeogr. 35:753–763.
Drummond, A. J., and A. Rambaut. 2007. BEAST: Bayesian evolutionaryanalysis by sampling trees. BMC Evol. Biol. It is a on-line access jour-nal, and this is the way they cite it (including other Evolution papers).Alternatively, could be 7: 1–8.
Edwards, E. J., C. P. Osborne, C. A. E. Stromberg, S. A. Smith, W. J. Bond,P. A. Christin, A. B. Cousins, M. R. Duvall, D. L. Fox, R. P. Freckleton,et al. 2010. The origins of C-4 grasslands: integrating evolutionary andecosystem science. Science 328:587–591.
Evanno, G., S. Regnaut, and J. Goudet. 2005. Detecting the number of clustersof individuals using the software STRUCTURE: a simulation study. Mol.Ecol. 14:2611–2620.
Felsenstein, J. 1985. Confidence-limits on phylogenies—an approach usingthe bootstrap. Evolution 39:783–791.
Foote, A. D., J. Newton, S. B. Piertney, E. Willerslev, and M. T. Gilbert. 2009.Ecological, morphological and genetic divergence of sympatric NorthAtlantic killer whale populations. Mol. Ecol. 18:5207–5217.
Fouquet, A., A. Gilles, M. Vences, C. Marty, M. Blanc, and N. J. Gemmell.2007. Underestimation of species richness in Neotropical frogs revealedby mtDNA analyses. PLoS One 10:1–10.
Fujita, M. K., J. A. McGuire, S. C. Donnellan, and C. Moritz. 2010. Diversi-fication and persistence at the arid-monsoonal interface: Australia-widebiogeography of the Bynoe’s gecko (Heteronotia bionoei: Gekkonidae).Evolution 64:2293–2314.
Funk, W. C., M. Caminer, and S. R. Ron. 2012. High levels of cryptic speciesdiversity uncovered in Amazonian frogs. Proc. R. Soc. Lond. B Biol.279:1806–1814.
Gamble, T., A. M. Bauer, G. R. Colli, E. Greenbaum, T. R. Jackman, L. J.Vitt, and A. M. Simons. 2011. Coming to America: multiple origins ofNew World geckos. J. Evol. Biol. 24:231–244.
Gamble, T., G. R. Colli, M. T. Rodrigues, F. P. Werneck, and A. M.Simons. 2012. Phylogeny and cryptic diversity in geckos (Phyllopezus;Phyllodactylidae; Gekkota) from South America’s open biomes. Mol.Phylogenet. Evol. 62:943–953.
Garrick, R. C., A. Caccone, and P. Sunnucks. 2010. Inference of popula-tion history by coupling exploratory and model-driven phylogeographicanalyses. Int. J. Mol. Sci. 11:1190–1227.
Geurgas, S. R., and M. T. Rodrigues. 2010. The hidden diversity of Coleo-dactylus amazonicus (Sphaerodactylinae, Gekkota) revealed by molec-ular data. Mol. Phylogenet. Evol. 54:583–593.
Giugliano, L. G., R. G. Collevatti, and G. R. Colli. 2007. Molecular datingand phylogenetic relationships among Teiidae (Squamata) inferred bymolecular and morphological data. Mol. Phylogenet. Evol. 45:168–179.
Gubbles, T. L., B. L. Isacks, and E. Farrar. 1993. High-level surfaces, plateauuplift, and foreland development, Bolivian central Andes. Geology21:695–698.
Heled, J., and A. J. Drummond. 2010. Bayesian inference of species treesfrom multilocus data. Mol. Biol. Evol. 27:570–580.
Hernandez, R. M., T. E. Jordan, A. D. Farjat, L. Echavarrıa, B. D. Idleman, andJ. H. Reynolds. 2005. Age, distribution, tectonics, and eustatic controls ofthe Paranense and Caribbean marine transgressions in southern Boliviaand Argentina. J. South Am. Earth Sci. 19:495–512.
Hewitt, G. M. 2004. Genetic consequences of climatic oscillations in theQuaternary. Philos. Trans. R. Soc. Lond. B 359:183–195.
Hickerson, M. J., B. C. Carstens, J. Cavender-Bares, K. A. Crandall, C. H.Graham, J. B. Johnson, L. Rissler, P. F. Victoriano, and A. D. Yoder.2011. Phylogeography’s past, present, and future: 10 years after Avise,2000. Mol. Phylogenet. Evol. 54:291–301.
Hijmans, R. J., S. E. Cameron, J. L. Parra, P. G. Jones, and A. Jarvis. 2005.Very high resolution interpolated climate surfaces for global land areas.Int. J. Climatol. 25:1965–1978.
Hoorn, C., F. P. Wesselingh, H. ter Steege, M. A. Bermudez, A. Mora,J. Sevink, I. Sanmartın, A. Sanchez-Meseguer, C. L. Anderson, J. P.Figueiredo, et al. 2010. Amazonia through time: Andean uplift, climatechange, landscape evolution, and biodiversity. Science 330:927–931.
Hoskin, C. J., M. Tonione, M. Higgie, J. B. Mackenzie, S. E. Williams,J. VanderWal, and C. Moritz. 2011. Persistence in peripheral refugiapromotes phenotypic divergence and speciation in a rainforest frog.Am. Nat. 178:561–578.
Jakobsson, M., and N. A. Rosenberg. 2007. CLUMPP: a cluster matching andpermutation program for dealing with label switching and multimodalityin analysis of population structure. Bioinformatics 23:1801–1806.
Kalinowski, S. T. 2011. The computer program STRUCTURE does not reli-ably identify the main genetic clusters within species: simulations andimplications for human population structure. Heredity 106:625–632.
Kidd, D. M., and X. Liu. 2008. GEOPHYLOBUILDER 1.0: an ARCGISextension for creating ‘geophylogenies’. Mol. Ecol. Res. 8:88–91.
Kluge, A. G. 1987. Cladistic relationships in the Gekkonoidea (Squamata,Sauria). Miscellaneous Publications, Museum of Zoology, University ofMichigan 173:1–54.
Knowles, L. L. 2009. Statistical phylogeography. Annu. Rev. Ecol. Evol. Syst.40:593–612.
Knowles, L. L., and D. F. Alvarado-Serrano. 2010. Exploring the populationgenetic consequences of the colonization process with spatio-temporallyexplicit models: insights from coupled ecological, demographic and
EVOLUTION OCTOBER 2012 3 0 3 1

FERNANDA P. WERNECK ET AL.
genetic models in montane grasshoppers. Mol. Ecol. 19:3727–3745.
Knowles, L. L., and W. P. Maddison. 2002. Statistical phylogeography. Mol.Ecol. 11:2623–2635.
Leache, A. D. 2009. Species tree discordance traces to phylogeographic cladeboundaries in North American fence lizards (Sceloporus) Syst. Biol.58:547–559.
Leal, I. R., M. Tabarelli, and J. M. C. Silva. 2003. Ecologia e Conservacao daCaatinga. Universidade Federal de Pernambuco, Recife.
Leavitt, D. H., R. L. Bezy, K. A. Crandall, and J. W. Sites, Jr. 2007. Multi-locus DNA sequence data reveal a history of deep cryptic vicarianceand habitat-driven convergence in the desert night lizard Xantusia vig-
ilis species complex (Squamata: Xantusiidae). Mol. Ecol. 16:4455–4481.
Lemmon, A. R., and E. M. Lemmon. 2008. A Likelihood framework forestimating phylogeographic history on a continuous landscape. Syst.Biol. 57:544–561.
Lessa, E. P., G. D’Elıa, and U. F. J. Pardinas. 2010. Genetic footprints oflate Quaternary climate change in the diversity of Patagonian-Fueguianrodents. Mol. Ecol. 19:3031–3037.
Lopes, J. A., and M. A. Beaumont. 2010. ABC: a useful Bayesian tool for theanalysis of population data. Infect. Genet. Evol. 10:826–833.
Macey, J. R., J. A. Schulte II, N. B. Ananjeva, A. Larson, N. Rastegar-Pouyani,S. M. Shammakov, and T. J. Papenfuss. 1998. Phylogenetic relationshipsamong agamid lizards of the Laudakia caucasia species group: testinghypotheses of biogeographic fragmentation and an area cladogram forthe Iranian Plateau. Mol. Phylogenet. Evol. 10:118–131.
Maciel, N. M., R. G. Collevatti, G. R. Colli, and E. F. Schwartz. 2010.Late Miocene diversification and phylogenetic relationships of the hugetoads in the Rhinella marina (Linnaeus, 1758) species group (Anura:Bufonidae). Mol. Phylogenet. Evol. 57:787–797.
Maddison, W. P., and L. L. Knowles. 2006. Inferring phylogeny despite in-complete lineage sorting. Syst. Biol. 55:21–30.
McCormack, J. E., J. Heled, K. S. Delaney, A. T. Peterson, and L. L.Knowles. 2011. Calibrating divergence times on species trees versusgene trees: implications for speciation histoty of Aphelocoma jays. Evo-lution 65:184–202.
Moraes, E. M., K. S. C. Yotoko, M. H. Manfrin, V. N. Solferini, and F. M. Sene.2009. Phylogeography of the cactophilic species Drosophila gouveai:demographic events and divergence timing in dry vegetation enclaves ineastern Brazil. J. Biogeogr. 36:2136–2147.
Morando, M., L. J. Avila, and J. W. S. Sites, Jr. 2003. Sampling strategiesfor delimiting species: genes, individuals, and populations in the Lio-laemus elongatus-kriegi complex (Squamata: Liolaemidae) in Andean-Patagonian South America. Syst. Biol. 52:159–185.
Moritz, C., J. L. Patton, C. J. Schneider, and T. B. Smith. 2000. Diversificationof rainforest faunas: an integrated molecular approach. Annu. Rev. Ecol.Syst. 31:533–563.
Moritz, C., C. J. Hoskin, J. B. Mackenzie, B. L. Phillips, M. Tonione, N. Silva,J. VanderWal, S. E. Williams, and C. H. Graham. 2009. Identificationand dynamics of a cryptic suture zone in tropical rainforest. Proc. R.Soc. Lond. B Biol. 276:1235–1244.
Mulch, A., C. E. Uba, M. R. Strecker, R. Schoenberg, and Chamberlain. 2010.Late Miocene climate variability and surface elevation in the centralAndes. Earth Planet. Sci. Lett. 290:173–182.
Nielsen, R., and J. Wakeley. 2001. Distinguishing migration from isolation: aMarkov Chain Monte Carlo approach. Genetics 158:885–896.
Niemiller, M. L., B. M. Fitzpatrick, and B. T. Miller. 2008. Recent diver-gence with gene flow in Tennessee cave salamanders (Plethodontidae:Gyrinophilus) inferred from gene genealogies. Mol. Ecol. 17:2258–2275.
Nogueira, C., S. Ribeiro, G. C. Costa, and G. R. Colli. 2011. Vicarianceand endemism in a Neotropical savanna hotspot: distribution patterns ofCerrado squamate reptiles. J. Biogeogr. 38:1907–1922.
Nosil, P. 2008. Speciation with gene flow could be common. Mol. Ecol.17:2103–2106.
Nunez, J. J., N. K. Wood, F. E. Rabanal, F. M. Fontanella, and J. W. Sites Jr.2011. Amphibian phylogeography in the Antipodes: refugia and post-glacial colonization explain mitochondrial haplotype distribution in thePatagonian frog Eupsophus calcaratus (Cycloramphidae). Mol. Phylo-genet. Evol. 58:343–352.
Oliveira, P. S., and R. J. Marquis. 2002. The Cerrados of Brazil: ecology andnatural history of a Neotropical Savanna. Columbia Univ. Press, NewYork.
Oliver, P. M., M. Adams, and P. Doughty. 2010. Molecular evidence forten species and Oligo-Miocene vicariance within a nominal Australiangecko species (Crenadactylus ocellatus, Diplodactylidae). BMC Evol.Biol. 10:1–11.
Otto-Bliesner, B. L., S. J. Marshall, J. T. Overpeck, G. H. Miller, A. Hu, andL. I. P. m. CAPE. 2006. Simulating Arctic climate warmth and icefieldretreat in the Last Interglaciation. Science 311:1751–1753.
Passoni, J. C., M. L. Benozzati, and M. T. Rodrigues. 2008. Phylogeny,species limits, and biogeography of the Brazilian lizards of the genus Eu-
rolophosaurus (Squamata: Tropiduridae) as inferred from mitochondrialDNA sequences. Mol. Phylogenet. Evol. 46:403–414.
Pavlidis, P., S. Laurent, and W. Stephan. 2010. msABC: a modification ofHudson’s ms to facilitate multi-locus ABC analysis. Mol. Ecol. Res.10:723–727.
Pellegrino, K. C., S. Kasahara, M. T. Rodrigues, and Y. Yonenaga-Yassuda. 1997. Pericentric inversion events in karyotypic distinction ofBrazilian lizards of genus Phyllopezus (Squamata, Gekkonidae) detectedby chromosomal banding patterns. Hereditas 127:255–262.
Pellegrino, K. C. M., M. T. Rodrigues, A. N. Waite, M. Morando, Y. Y.Yassuda, and J. W. Sites, Jr. 2005. Phylogeography and species limits inthe Gymnodactylus darwinii complex (Gekkonidae, Squamata): geneticstructure coincides with river systems in the Brazilian Atlantic Forest.Biol. J. Linn. Soc. 84:13–26.
Pepper, M., M. K. Fujita, C. Moritz, and S. Keogh. 2011. Palaeoclimate changedrove diversification among isolated mountain refugia in the Australianarid zone. Mol. Ecol. 20:1529–1545.
Phillips, S. J., R. P. Anderson, and R. E. Schapire. 2006. Maximum entropymodeling of species geographic distributions. Ecol. Model 190:231–259.
Pritchard, J. K., M. Stephens, and P. Donnelly. 2000. Inference of populationstructure using multilocus genotype data. Genetics 155:945–959.
R Development Core Team. 2010. R: a language and environment for statisticalcomputing. R Foundation for Statistical Computing, Vienna, Austria.Available at http://www.R-project.org.
Rambaut, A., and A. J. Drummond. 2007. Tracer Analysis Toolv1.4. Tracer University of Oxford, Oxford, U.K. Available athttp://beast.bio.ed.ac.uk/.
Ramos, A. C. S., J. P. Lemos-Filho, R. A. Ribeiro, F. R. Santos, and M.B. Lovato. 2007. Phylogeography of the tree Hymenaea stigonocarpa
(Fabaceae: Caesalpinioideae) and the influence of Quaternary climatechanges in the Brazilian Cerrado. Ann. Bot. 100:1219–1228.
Ribas, C. C., A. Aleixo, A. C. R. Nogueira, C. Y. Miyaki, and J. Cracraft.2012. A palaeobiogeographic model for biotic diversification withinAmazonia over the past three million years. Proc. R. Soc. Lond. B Biol.279:681–689.
Riccomini, C., and M. Assumpcao. 1999. Quaternary tectonics in Brazil.Episodes 22:221–225.
Riddle, B. R., R. J. Ladle, S. A. Lourie, and R. J. Whittaker. 2011. Basicbiogeography: estimating biodiversity and mapping nature. Pp. 47–92
3 0 3 2 EVOLUTION OCTOBER 2012
DEEP DIVERGENCE OF SOUTH AMERICAN ‘DRY DIAGONAL’ BIOMES
in R. J. Ladle and R. J. Whittaker, eds. Conservation biogeography.Wiley-Blackwell, Chichester, UK.
Rocha, S., M. Vences, F. Glaw, D. Posada, and D. J. Harris. 2009. Multi-gene phylogeny of Malagasy day geckos of the genus Phelsuma. Mol.Phylogenet. Evol. 52:530–537.
Rodrigues, M. T. 1996. Lizards, snakes, and amphisbaenians from the Qua-ternary sand dunes of the middle Rio Sao Francisco, Bahia, Brazil. J.Herpetol. 30:513–523.
———. 2003. Herpetofauna da Caatinga. Pp. 181–236 in I. R. Leal, M.Tabarelli, and J. M. C. Silva, eds. Ecologia e Conservacao da Caatinga.Editora Universitaria da UFPE, Recife.
Rozas, J., J. C. Sanchez-DelBarrio, X. Messeguer, and R. Rozas. 2003. DnaSP,DNA polymorphism analyses by the coalescent and other methods.Bioinformatics 19:2496–2497.
Rull, V. 2008. Speciation timing and neotropical biodiversity: the Tertiary–Quaternary debate in the light of molecular phylogenetic evidence. Mol.Ecol. 17:2722–2729.
———. 2011a. Neotropical biodiversity: timing and potential drivers. Tree26:508–513.
———. 2011b. Origins of biodiversity. Science 331:398–399.Rundell, R. J., and T. D. Price. 2009. Adaptive radiation, nonadaptive radiation,
ecological speciation and nonecological speciation. Tree 24:394–398.Ruskin, B. G., F. M. Davila, G. D. Hoke, T. E. Jordan, R. A. Astini, and R.
Alonso. 2011. Stable isotope composition of middle Miocene carbonatesof the Frontal Cordillera and Sierras Pampeanas: did the Paranaense sea-way flood western and central Argentina? Palaeogeogr. Palaeoclimatol.Palaeocol. 308:293–303.
Sampaio, E. V. S. B. 1995. Overview of the Brazilian Caatinga. Pp. 35–63in S. H. Bullock, H. A. Mooney, and E. Medina, eds. Seasonally DryTropical Forests. Cambridge Univ. Press, Cambridge, UK.
Sersic, A. N., A. Cosacov, A. A. Cocucci, L. A. Johnson, R. Pozner, L. J. Avila,J. W. Sites, Jr., and M. Morando. 2011. Emerging phylogeographicalpatterns of plants and terrestrial vertebrates from Patagonia. Biol. J.Linn. Soc. 103:475–494.
Siedchlag, A. C., M. L. Benozzati, J. C. Passoni, and M. T. Rodrigues. 2010.Genetic structure, phylogeny, and biogeography of Brazilian eyelid-less lizards of genera Calyptommatus and Nothobachia (Squamata,Gymnophthalmidae) as inferred from mitochondrial DNA sequences.Mol Phylogenet Evol 56:622–630.
Simon, M. F., R. Grether, L. P. Queiroz, C. Skema, and R. T. Pennington. 2009.Recent assembly of the Cerrado, a neotropical plant diversity hotspot,by in situ evolution of adaptations to fire. Proc. Natl. Acad. Sci. USA106:20359–20364.
Smith, T. B., S. Kark, C. J. Schneider, R. K. Wayne, and C. Moritz. 2001.Biodiversity hotspots and beyond: the need for preserving environmentaltransitions. Tree 16:431.
Stamatakis, A. 2006. RAxML-VI-HPC: maximum likelihood-based phyloge-netic analyses with thousands of taxa and mixed models. Bioinformatics22:2688–2690.
Tamura, K., and M. Nei. 1993. Estimation of the number of nucleotide sub-stitutions in the control region of mitochondrial DNA in humans andchimpanzees. Mol. Biol. Evol. 10:512–526.
Tamura, K., D. Peterson, G. Stecher, M. Nei, and S. Kumar. 2011. MEGA5:molecular evolutionary genetics analysis using maximum likelihood,evolutionary distance, and maximum parsimony methods. Mol. Biol.Evol. 28:2731–2739.
Templeton, A. R. 2010. Coherent and incoherent inference in phylogeographyand human evolution. Proc. Natl. Acad. Sci. USA 107:6376–6381.
Thome, M. T. C., K. R. Zamudio, J. G. R. Giovanelli, C. F. B. Haddad, F. A.Baldissera, Jr., and J. Alexandrino. 2010. Phylogeography of endemictoads and post-Pliocene persistence of the Brazilian Atlantic Forest.Mol. Phylogenet. Evol. 55:1018–1031.
Townsend, T. M., D. G. Mulcahy, B. P. Noonan, J. W. Sites Jr., C. A. Kuczyn-ski, J. J. Wiens, and T. W. Reeder. 2011. Phylogeny of iguanian lizardsinferred from 29 nuclear loci, and a comparison of concatenated andspecies-tree approaches for an ancient, rapid radiation. Mol. Phylogenet.Evol. 61:363–380.
Uba, C. E., C. Heubeck, and C. Hulka. 2006. Evolution of the Late CenozoicChaco foreland basin, Southern Bolıvia. Basin Res. 18:145–170.
VanderWerf, E. A., L. C. Young, N. W. Yeung, and D. B. Carlon. 2010. Step-ping stone speciation in Hawaii’s flycatchers: molecular divergence sup-ports new island endemics within the elepaio. Conserv. Genet. 11:1283–1298.
Vanzolini, P. E. 1953. Sobre o genero Phyllopezus Peters (Sauria,Gekkonidae). Papeis Avulsos de Zoologia, Sao Paulo 11:353–369.
———. 1963. Problemas faunısticos do Cerrado. Pp. 305–321 in M. Ferri,ed. Simposio sobre o Cerrado. Editora da Universidade de Sao Paulo.,Sao Paulo.
———. 1976. On the lizards of a Cerrado-Caatinga contact, evolutionary andzoogeographical implications (Sauria). Papeis Avulsos de Zoologia, SaoPaulo 29:111–119.
Weisrock, D. W., R. M. Rasoloarison, I. Fiorentino, J. M. Ralison, S. M.Goodman, P. M. Kappeler, and A. D. Yoder. 2010. Delimiting specieswithout nuclear monophyly in Madagascar’s mouse lemurs. PLoS Biol.5:e9883.
Werneck, F. P. 2011. The diversification of eastern South American openvegetation biomes: historical biogeography and perspectives. Quat. Sci.Rev. 30:1630–1648.
Werneck, F. P., L. G. Giugliano, R. G. Collevatti, and G. R. Colli. 2009.Phylogeny, biogeography and evolution of clutch size in South Americanlizards of the genus Kentropyx (Squamata: Teiidae). Mol. Ecol. 18:262–278.
Werneck, F. P., G. C. Costa, G. R. Colli, D. Prado, and J. W. Sites, Jr. 2011.Revisiting the historical distribution of Seasonally Dry Tropical Forests:new insights based on palaeodistribution modelling and palynologicalevidence. Glob. Ecol. Biogeogr. 20:272–288.
Werneck, F. P., C. Nogueira, G. R. Colli, J. W. Sites, Jr., and G. C. Costa.Climatic stability in the Brazilian Cerrado: implications for biogeo-graphical connection of South American savannas, species richness, andconservation in a biodiversity hotspot. J. Biogeogr. doi:10.1111/j.1365-2699.2012.02715.x.
Associate Editor: B. Fitzpatrick
EVOLUTION OCTOBER 2012 3 0 3 3

FERNANDA P. WERNECK ET AL.
Supporting InformationThe following supporting information is available for this article:
Appendix S1: Sample collection
Table S1. Details of material examined, with locality data for all species examined, mtDNA haploclades assignments, species tree
clades correspondence, and major population clusters assignments.
Appendix S2: Genetic markers, lab protocols, and sequence editing/alignment
Table S2. Mitochondrial and nuclear genes and primers used, with details of PCR conditions.
Table S3. Net among-group distances between sampled clades for mtDNA data.
Table S4. Net among-group uncorrected distances between sampled clades for mtDNA data.
Figure S1. Individual nuclear gene maximum likelihood trees.
Figure S2. Species tree for Phyllopezus pollicaris with estimated divergence times and credibility intervals.
Figure S3. Principal Components Analysis vectors predictive plots (PC1 × PC2 and PC1 × PC3) for the prior predictive
distributions of Summary Statistics (SuSt) for all models compared using the approximate Bayesian computation approach.
Figure S4. Geographic distribution of the eight ‘candidate species’ clades within the Phyllopezus pollicaris complex.
Supporting Information may be found in the online version of this article.
Please note: Wiley-Blackwell is not responsible for the content or functionality of any supporting information supplied by the
authors. Any queries (other than missing material) should be directed to the corresponding author for the article.
3 0 3 4 EVOLUTION OCTOBER 2012
Copyright © 2022 FDOKUMEN