New wine in old wineskins? Growth, terrorism and the resource curse in sub-Saharan Africa
Upload
khangminh22Category
view
0download
0
DECOUPLING ENERGY AND RESOURCE USE FROM GROWTH IN THE INDIAN CONSTRUCTION SECTOR
POLICY BRIEF II
By Pratibha Ruth Caleb, Sriraj Gokarakonda, Rohan Jain, Zeenat Niazi, Vaibhav Rathi, Shritu Shrestha, Stefan Thomas, Kilian Topp
A POTENTIAL ANALYSIS STUDY

2
IMPRINT
PUBLISHED BY
Deutsche Gesellschaft fürInternationale Zusammenarbeit (GIZ) GmbH
Environmental Policy ProgrammeKöthener Straße 210963 Berlin, GermanyT +49 30 33 8424-272F +49 30 33 842422-272
DESIGN AND LAYOUT
SCHUMACHER – Design und digitale Medienwww.schumacher-visuell.de
AS OF
April 2017
The analysis, results and recommendations in this paper represent the opinion of the author(s) and are not necessarily representative of the position of Deutschen Gesellschaft für Internationale Zusammenarbeit (GIZ) GmbH. Responsibility for the content of external websites linked in this publication always lies with their respective publishers.
1
A POTENTIAL ANALYSIS STUDY
DECOUPLING ENERGY AND RESOURCE USE FROM GROWTH IN THE INDIAN CONSTRUCTION SECTOR
POLICY BRIEF II

2
CONTENTS
TABLE OF CONTENTS 2
LIST OF FIGURES 4
LIST OF TABLES 4
LIST OF ABBREVIATIONS 5
THE POLICY BRIEFS 8
KEY MESSAGES 9
1 FRAMEWORK FOR ASSESSING THE POTENTIAL FOR DECOUPLING IN THE INDIAN BUILDINGS AND CONSTRUCTION SECTOR 12
2 THEORETICAL POTENTIAL FOR DECOUPLING 15
2.1 PHASE-WISE RESOURCES AND ENERGY USAGE IN BUILDINGS 16
2.2 ALTERNATIVE MATERIALS AND TECHNOLOGY INTERVENTIONS 16
2.2.1 EXAMPLE ANALYSIS OF BRICK AND ALTERNATIVES 18
2.2.2 EXAMPLE ANALYSIS OF SAND AND ALTERNATIVES 19
2.2.3 EXAMPLE ANALYSIS OF AIR CONDITIONING TECHNOLOGIES 19
2.2.4 EXAMPLE ANALYSIS OF LIGHTING TECHNOLOGIES 20
2.2.5 EXAMPLE ANALYSIS OF RENEWABLE ENERGY TECHNOLOGIES 20
2.3 SUBSECTORS 21
TABLE OF CONTENTS

3
2.4 FACTORS 21
2.4.1 OPERATIONAL ENERGY 21
2.4.2 EMBODIED ENERGY 24
2.4.3 UTILITY FUEL MIX (SUPPLY GRID ENERGY MIX) 24
2.4.4 BUILDING FUEL MIX (ON-SITE ENERGY GENERATION AND CONSUMPTION) 26
2.4.5 PRIMARY MATERIAL CONSUMPTION 26
2.4.6 ENVIRONMENTAL IMPACT 27
2.4.7 GROWTH AND PRODUCTIVITY 28
2.4.8 LABOUR PRODUCTIVITY AND HUMAN RESOURCE DEVELOPMENT 28
2.5 CONCLUSION: TYPE AND NATURE OF DECOUPLING 29
3 ANALYSIS OF THE CURRENT POLICY SCENARIO 31
3.1 CURRENT POLICY SITUATION 31
3.2 WEAK LINKS AND MISSING POLICY ELEMENTS 33
4 EUROPEAN/GERMAN POLICY EXPERIENCE IS ENCOURAGING FOR DECOUPLING 35
4.1 ENERGY EFFICIENCY IN THE EUROPEAN/GERMAN BUILDINGS AND CONSTRUCTION SECTOR 35
4.2 RESOURCE EFFICIENCY IN THE GERMAN BUILDINGS AND CONSTRUCTION SECTOR 37
4.3 IMPACT OF VARIOUS POLICY INTERVENTIONS ON DECOUPLING 39
5 CONCLUSIONS 46
BIBLIOGRAPHY 48
ANNEX 50
RESEARCH TEAM 52

4
LIST OF FIGURES
LIST OF TABLES
FIGURE 1: STEPS TO EVALUATE THE THEORETICAL POTENTIAL FOR DECOUPLING IN BUILDINGS AND CONSTRUCTION SECTOR 15
FIGURE 2: BREAKDOWN OF RENEWABLE ENERGY GENERATION AS OF AUGUST 2015 IN MW (TOTAL 36,470) 25
FIGURE 3: POLICIES THAT IMPACT ON OPERATIONAL ENERGY USAGE THROUGH VARIOUS TECHNOLOGIES 31
FIGURE 4: POLICIES THAT USE VARIOUS MEASURES TO IMPACT RESOURCE USAGE 32
FIGURE 5: BREAKDOWN OF POLICES DEALING WITH CONSTRUCTION AND OPERATIONAL PHASES 33
FIGURE 6: ENERGY INTENSITY OF THE GERMAN ECONOMY 36
FIGURE 7: DMC PER CAPITA (IN RAW MATERIAL EQUIVALENTS) 38
FIGURE 8: RAW MATERIAL PRODUCTIVITY AND ECONOMIC GROWTH 38
TABLE 1: INFLUENCING FACTORS AND INDICATORS OF DECOUPLING 13
TABLE 2: EXAMPLES OF ALTERNATIVE MATERIALS AND TECHNOLOGY INTERVENTIONS 17
TABLE 3: COMPARISON OF PROPERTIES OF VARIOUS ALTERNATIVE MASONRY MATERIALS 18
TABLE 4: ENERGY CONSUMPTION SCENARIO IN RESIDENTIAL BUILDINGS 22
TABLE 5: ENERGY CONSUMPTION SCENARIO IN NON-RESIDENTIAL BUILDINGS 23
TABLE 6: PRIMARY ENERGY FACTORS IN THE EU 25
TABLE 7: ENVIRONMENTAL IMPACTS THROUGH THE LIFE CYCLE OF A BUILDING 27
TABLE 8: ANALYSIS OF DECOUPLING 30
TABLE 9: DECOUPLING GAPS AND INTERNATIONAL LESSONS 40
TABLE 10: COMPARISON OF DECOUPLING STUDIES FROM THE LITERATURE 50
TABLE 11: ABSOLUTE DECOUPLING METRICS IN 21 COUNTRIES 51
LIST OF FIGURES
LIST OF TABLES

ABBREVIATION FULL FORMAAC Autoclaved aerated cementBAFA Federal Offi ce for Economic Affairs and Export ControlBAT Best available technologyBEE Bureau of Energy Effi ciencyBIBB Federal Institute for Vocational Education and TrainingBMUB Federal Ministry for the Environment, Nature Conservation, Building and Nuclear SafetyBREEAM Building Research Establishment Environmental Assessment MethodC&D Construction and demolitionC2C Cradle to cradleCAG Comptroller and Auditor GeneralCBERD Center for Building Energy Research and DevelopmentCBRI Central Building Research InstituteCEPT Centre for Environmental Planning and TechnologyCFL Compact fl uorescent lightCHCP Combined heating, cooling and power CSH Concentrated solar heat demea German Material Effi ciency Agency Dena German Energy Agency DGB German Trade Union Confederation DGNB German Sustainable Building Council DMC Domestic material consumption DSM Demand-side management ECM Energy conservation measureEIS Energy information system EnEV Energy Conservation Regulations (German)EPBD Energy Performance for Buildings Directive (EU)EPC Energy performance certifi cate EPI Energy performance indicator EPR Extended producer responsibility ESCO Energy service companyEU European UnionFIT Feed-in tariff FSC Forest Stewardship Council
LIST OF ABBREVIATIONS

6
GDP Gross domestic productGIZ Deutsche Gesellschaft für Internationale ZusammenarbeitGPP Green public procurement HQE High Quality Environmental Standard HRD Human resource developmentHVAC Heating, ventilating and air conditioning IESS India Energy Security Scenarios IGEA Investment grade energy audits JNNSM Jawaharlal Nehru National Solar Mission KfW KfW Development Bank (KfW Entwicklungsbank)kgoe Kilogram oil equivalentLCOE Levelised cost of electricity LED Light-emitting diode LEED Leadership in Energy and Environmental Design MEPS Minimum energy performance standard MNRE Ministry of New and Renewable EnergyMtoe Million Tonnes of oil equivalentNDC Nationally Determined ContributionNEERI National Environmental Engineering Research Institute NeMAT Netzwerken zur Materialeffi zienz NITI Aayog National Institution for Transforming India NZEB Nearly zero-energy buildings PEF Primary energy factor PH Passive house/Passivhaus ProgRess German resource effi ciency programme PV Solar photovoltaicsRD&D Research, development and demonstration REC Renewable energy certifi cate SDA State Designated Agency TWh Terawatt hoursVerMAt Verbesserung der Materialeffi zienz (German programme to promote material effi ciency)VRV Variable refrigerant volume VSBK Vertical shaft brick kilns
CONTENTSLIST OF ABBREVIATIONS

7

CONTEXT OF THE POLICY BRIEF SERIESIndia is currently at a crucial juncture where it is aiming for economic growth to meet the basic needs of its 1.2 billion people. However, so far this growth has resulted in energy shortages and the increasing use of limited resources. This policy brief series is about decoupling, i.e. improving effi ciency to reduce the resources and energy needed for this growth and meet the country’s increasing development needs.
The construction sector is highly resource and energy intensive; it is therefore imperative that it moves towards a path of environmental sustainability. This transition is likely to be achieved by decoupling both resource and energy use from the sector’s growth. Decision-makers in the sector will play a crucial role in achieving this. The aim of this policy brief series is to inform decision-makers in India at central government and state level about the current status of research, policy and institutions in the Indian construction sector and to identify key drivers and barriers. Finally, practical recommendations will be made for decision-makers about how to promote decoupling of resource and energy use from growth in the construction sector.
The series comprises three policy briefs:
Policy brief 1 focuses on the baseline for decoupling in the Indian construction sector. The study draws attention to the existing scenario in terms of key policies, research and institutions linked to resources and energy in the sector.
Policy brief 2 focuses on analysing the potential for decoupling in the Indian buildings and construction sector. Primary and secondary research was con ducted to identify the factors that infl uence decoupling. Subsequently, a framework was established to make it possible to measure the nature and extent of decoupling that is possible within the existing policy environment. Furthermore, gaps, drivers and barriers have been identifi ed which could enable a potential analysis study on decoupling to be carried out. In addition, examples of good practice from Germany and other European countries have been studied with a view to learning lessons that can help to bridge the current gaps in India.
Policy brief 3 focuses on recommendations both at national and state level on the possible interventions that could result in resource and energy use being decoupled from growth in the Indian construction sector. Lack of a comprehensive policy on resource effi ciency and the possibility of using secondary raw materials to obtain resource and impact decoupling continue to be the key issues that India will have to grapple with in the years to come.
THE POLICY BRIEFS
The policy briefs are a follow-up of the Policy Paper “Decoupling Economic Growth from Resource Consumption. A Transformation Strategy with Manifold Socio-Economic Benefi ts for India and Germany” by Peter Hennicke and Ashok Khosla with contributions from Chitrangna Dewan, Kriti Negrath, Zeenat Niazi, Meghan O’Brien, Mandira Singh Thakur, Henning Witts, published in November
2014. The Policy Paper was elaborated by members of the Indo-German Expert Group on Green and Inclusive Economy. The group is supported by the German Ministry for the Environment, Nature Conservation, Building and Nuclear Safety (BMUB) and facilitated by the GIZ Environmental Policy Programme in Berlin and the Indo-German Environment Partnership in Delhi.
KEY MESSAGES
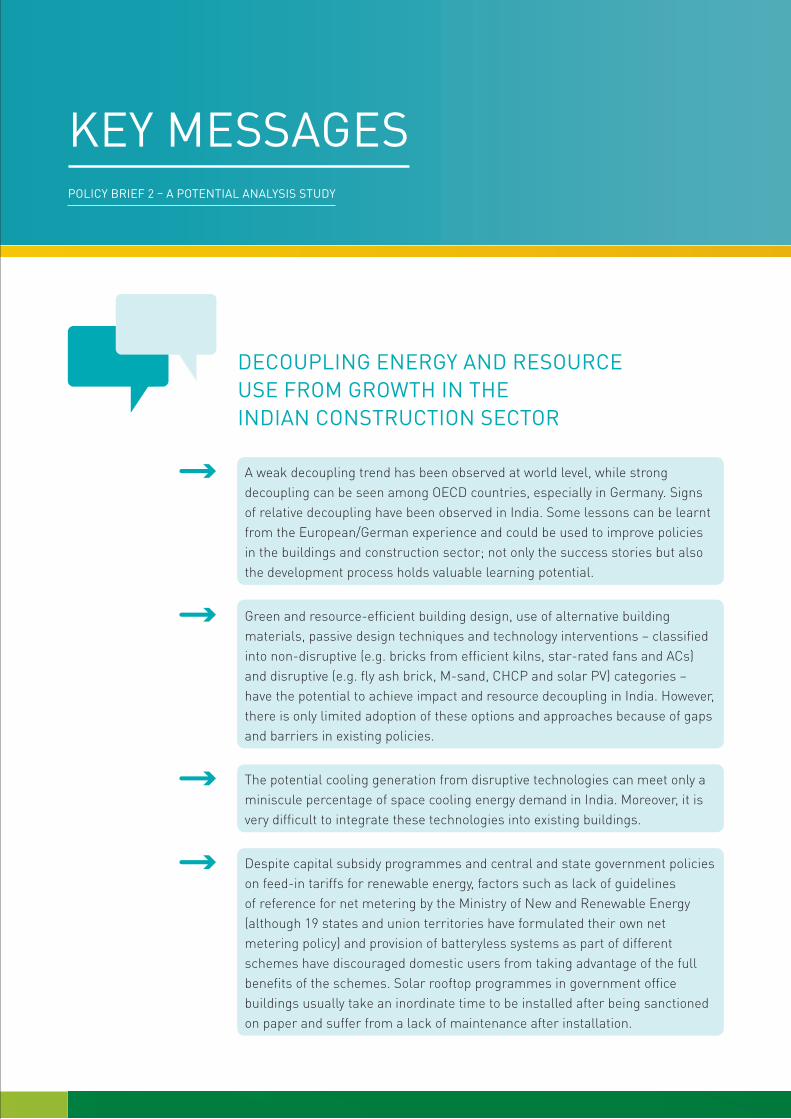
A weak decoupling trend has been observed at world level, while strong decoupling can be seen among OECD countries, especially in Germany. Signs of relative decoupling have been observed in India. Some lessons can be learnt from the European/German experience and could be used to improve policies in the buildings and construction sector; not only the success stories but also the development process holds valuable learning potential.
Green and resource-effi cient building design, use of alternative building materials, passive design techniques and technology interventions – classifi ed into non-disruptive (e.g. bricks from effi cient kilns, star-rated fans and ACs) and disruptive (e.g. fl y ash brick, M-sand, CHCP and solar PV) categories – have the potential to achieve impact and resource decoupling in India. However, there is only limited adoption of these options and approaches because of gaps and barriers in existing policies.
The potential cooling generation from disruptive technologies can meet only a miniscule percentage of space cooling energy demand in India. Moreover, it is very diffi cult to integrate these technologies into existing buildings.
POLICY BRIEF 2 – A POTENTIAL ANALYSIS STUDY
DECOUPLING ENERGY AND RESOURCE USE FROM GROWTH IN THE INDIAN CONSTRUCTION SECTOR
Despite capital subsidy programmes and central and state government policies on feed-in tariffs for renewable energy, factors such as lack of guidelines of reference for net metering by the Ministry of New and Renewable Energy (although 19 states and union territories have formulated their own net metering policy) and provision of batteryless systems as part of different schemes have discouraged domestic users from taking advantage of the full benefi ts of the schemes. Solar rooftop programmes in government offi ce buildings usually take an inordinate time to be installed after being sanctioned on paper and suffer from a lack of maintenance after installation.
KEY MESSAGES
To be able to develop long-term policies on decoupling, it is important to identify the technical feasibility in various building sub-sectors and make recommendations that target realisation of their full potential.
Regulatory policies appear to be the front-runner when it comes to resources, followed by transparency and information, target-setting and planning, and infrastructure and funding. RD&D and BAT promotion and capacity building (including scaling-up measures, involvement of SMEs and skills development initiatives) appear to be severely underrepresented in current policies.
Incentives and fi nancial instruments lead the charge for energy-effi cient technological interventions policies, followed by regulation, and transparency and information policies in this segment. There is a need for more policies that promote Research, Development and Demonstration (RD&D) and best available technologies (BAT) to increase the use of low-impact building materials.
The majority of green building projects are commercial and offi ce buildings, whereas those in the residential sector comprise large developments or government-sponsored housing projects. However, the majority of residential projects are still constructed by small builders, developers and local masons who are not highly literate and are not yet aware of green buildings.
Barring solar photovoltaic and, to a certain extent, solar thermal, promising technologies that could increase the share of onsite renewable energy in buildings are still confi ned to pilot projects and await large-scale deployment.

It is crucial that energy (cost) savings derived from dedicated energy conservation measures (ECMs), demand-side management (DSM) programmes and energy service company (ESCO) contracts translate into long-term bonds and are not converted into short-term monetary savings, which are then lost in the rebound effects.
It is unclear at this stage whether a decrease in resource use results in economic growth shrinking and whether switching to effi cient resources results in sustained growth. Only once a set of reliable indicators has been established can decoupling act as a yardstick for policy implementation. A national resource policy is needed to understand, highlight and rank the severity of impact due to the use of various resources.

12
Over the years, many resource-synergetic options and approaches in the buildings and construction industry have been developed. They include resource substitution, multiple uses, and use of secondary raw materials during the construction phase. Energy effi ciency and increasing renewable energy in the buildings’ energy mix or total energy mix are primary instruments that can advance decoupling in the operational phase of a building. These measures ensure that the pressure on natural resources is mitigated by decoupling growth from energy and resource use. Yet there is only limited spontaneous adoption of these options and approaches beyond a handful of isolated oases of good practice. It is often argued that energy effi ciency has multiple benefi ts for the economy, such as stimulating growth in new technologies, creating new jobs etc., and that it therefore helps to promote a green economy. Various studies have analysed the barriers to and drivers of uptake of resource and energy-effi cient technologies and highlight the interventions needed in the policy sphere. The main aim of all these policies is to decrease virgin material consumption and increase effi ciency by promoting alternative materials and technologies. However, it is vital to critically enquire whether the alternatives being proposed achieve the following objectives in the buildings and construction sector:
• augment the growth of the green economy as envisaged?
• act in a coordinated manner to deliver the intended energy and resource savings?
• achieve decoupling of growth from energy and resource use (both impact and resource decoupling)?
On a macro-economic scale, the consulting company ECON has studied the effects of decoupling energy and greenhouse gas intensity on the gross domestic product (GDP) of various OECD and non-OECD countries. The potential drivers of decoupling include energy effi ciency, increasing the share of renewables in the total energy mix, and structural changes in the economy.1 Decoupling has been defi ned in terms of weak (relative) decoupling and strong (absolute) decoupling. GDP growth with declining energy intensity indicates weak decoupling, whereas GDP growth with declining energy consumption indicates strong decoupling. The study concluded that a weak decoupling trend has been observed at world level. Strong decoupling has been observed among OECD countries, with especially strong decoupling in Germany. China show weak decoupling with the potential to turn that into strong decoupling in future (ECON, 2015). From the baseline study of energy and resource use in the indian construction sector, some signs of relative decoupling have been observed in India.
1 That is, by replacing high energy intensive sectors with low energy intensive sectors
1 FRAMEWORK FOR ASSESSING THE POTENTIAL FOR DECOUPLING IN THE INDIAN BUILDINGS AND CONSTRUCTION SECTOR

13
Multiple studies have researched the extent of decoupling in different sectors of the economy by applying decomposition analysis. Decomposition analysis uses various mathematical models to help quantify the relative contribution of predefi ned factors to the change in overall energy and resource consumption (Heinen, 2013). A number of such studies by Mulder & de Groot (2004), Diakoulaki & Mandaraka (2007), and Andreoni & Galmarini (2012) have been summarised (see Table 10 and Table 11 in the Annex) to understand the key factors that infl uence decoupling.
Decoupling exclusively in the buildings and construction sector has not yet been analysed in previous studies. However, conceptual parallels can be drawn from the literature to conduct a theoretical potential analysis. It is vital to identify the key factors (see Table 1) that infl uence decoupling, the alternative materials and technologies being proposed, and the indicators against which decoupling in the buildings and construction sector can be assessed.
Table 1: Infl uencing factors and indicators of decoupling
Infl uencing factors Relevance to decoupling in the buildings and construction sector
Total primary energy consumptionThis specifi es the total primary energy consumed in the life cycle of a building. For effective decoupling, fossil fuel-based primary energy consumption has to decrease.
Utility fuel mix Utility fuel mix describes the share of various renewable and non-renewable energy sources supplied by utilities. For effective decoupling, the renewable energy in the utility fuel mix has to increase.
Building fuel mix
Building fuel mix describes the share of various renewable and non-renewable energy sources used by an individual building (by generating onsite renewable energy etc.). For effective decoupling, the renewable energy in the fuel mix of individual buildings has to increase.
Primary resource consumptionThis is the total primary resource consumption in the life cycle of a building. For effective decoupling, primary resource consumption has to decrease.
Environmental impactThis is the cumulative environmental impact caused by building construction. For effective decupling, the environmental impact caused by resource and energy consumption has to decrease.
Growth and productivityThis specifi es the economic growth and productivity resulting from building construction activities. For effective decoupling, the economic growth and productivity in the building sector and subsectors have to increase.
Labour productivity and human resource development (HRD)
This is the labour productivity and HRD resulting from building construction activities. For effective decoupling, it is crucial to increase and diversify employment opportunities, and use human resources effectively.

14
1 FRAMEWORK FOR ASSESSING THE POTENTIAL FOR DECOUPLING IN THE INDIAN BUILDINGS AND CONSTRUCTION SECTOR
Alternative materials and technology interventions
Non-disruptive materials and technologies
Improving the effi ciency of production and operation of existing construction practices and technologies. For example, using more effi cient air conditioners, lighting and appliances in the place of old and ineffi cient ones, or using bricks produced from vertical shaft brick kilns (VSKB), which are more effi cient than conventional kilns.
Disruptive materials and technologies
Replacing existing construction practices and technologies with new and effi cient ones. For example, replacing burnt mud bricks with fl y ash and autoclaved aerated concrete (AAC) blocks, using construction and demolition (C&D) waste-based aggregates in place of natural aggregates, replacing single-glazed wooden frame windows with polyurethane double-glazed windows, using solar cooling technologies in place of conventional air conditioning etc.
Indicators of decoupling
Resource decoupling
This means reducing the rate of use of (primary) resources and the energy per unit of economic activity. This understanding of ‘dematerialization’ is based on the concept of using less material, energy, water and land to achieve the same economic output, resulting in more effi cient use of resources. This is also sometimes referred to as absolute/strong decoupling.
Impact decoupling
This means raising economic output while reducing the negative environmental impacts that arise from the extraction of resources (degradation of rivers and land caused by extracting sand and soil respectively), production (land degradation, waste and emissions), use of commodities (transport resulting in CO2 emissions), and in the post-consumption phase (waste and emissions). This is also referred to as relative/weak decoupling.
Source: Authors’ analysis

15
This chapter discusses all the factors integral to India and their relevance to decoupling. For the sake of brevity and understanding the decoupling concept, only key information is presented here. The following theoretical model (see Figure 1) shows the steps involved in evaluating the potential for decoupling in various sub-sectors of the buildings and construction sector using various resource and technological
interventions. In the course of this study, we discovered that quantifying decoupling needs more reliable data and verifi able indicators, which are unavailable at the moment. Therefore, only a qualitative analysis has been presented in this section that focuses more on developing a methodology to quantify decoupling, identifying key factors, required data, and reliable indicators.
2 THEORETICAL POTENTIAL FOR DECOUPLING
Figure 1: Steps to evaluate the theoretical potential for decoupling in buildings and construction sector
Source: Authors’ analysis
STEP 1
Phase-wise resource and energy usage:
Segregate resources and energy as per their usage into operational and construction phase
Design and construction phase
Operation and maintenance phase
STEP 4
Factors:
For each of the scenarios identified above analyse all the relevant factors described below
Total primary energy consumption
Fuel mix at utility level
Fuel miy at building level
Primary resource consumption
Environmental impact
Growth and productivity
Labour productivity and HRD
STEP 2
Alternative materials and technology interventions:
Identify alternatives to the existing inefficent technologies and materials and classify them into the following two categories:
• Disruptive• Non-disruptive
STEP 3
Sub sectors:
Group technologies and meterials as they are applicable to each of the sectors described below in various scenarios:
• Residential• Institutional and office• Retail• Hospitality• Medical facilities• Transport terminals
16
2.1 PHASE-WISE RESOURCES AND ENERGY USAGE IN BUILDINGSResource and energy consumption in buildings can be broadly divided into two phases: the design and construction phase, and the operation and maintenance phase. The design and construction of buildings results in the consumption of primary resources, which can be expressed by weight or volume, while energy required for transport and processing primary resources results in embodied energy of these resources. Soil and sand are amongst the primary resources used for construction. The operation and maintenance phase consists of energy consumption for the day-to-day functioning of the buildings, which is also called specifi c or fi nal energy consumption. Total primary energy consumption includes both embodied and fi nal energy consumption. Although the life cycle of a building also includes a demolition phase, its share is negligible compared to the construction and operational phase and hence has not been discussed in detail here.
2.2 ALTERNATIVE MATERIALS AND TECHNOLOGY INTERVENTIONSVarious alternative materials and techniques have been developed in order to reduce environmental impact and increase energy and resource effi ciency. The ease of adaptability and potential impact of these alternatives differ depending on various factors. They can be classifi ed into two categories: non-disruptive and disruptive. Table 2 below shows a few examples of the most commonly used alternative building materials and technologies. The nature of the merits and the challenges associated with various alternatives for each of the materials and technologies is discussed later.
2 THEORETICAL POTENTIAL FOR DECOUPLING

17
Table 2: Examples of alternative materials and technology interventions
Measure Business as usual Non-disruptive Disruptive
Construction phase
Replacing sand with other alternatives
Sand – Manufactured sand
Replacing brick with other alternatives
Burnt mud bricks Burnt mud bricks from effi cient kilns
Autoclaved aerated concrete (AAC) and fl y ash brick
Operational phase
Effi cient technical systems reduce energy consumption
Window/split air conditioners High effi ciency split air conditioners/variable refrigerant volume (VRV) systems
Solar air conditioners and combined heating, cooling and power (CHCP)
Effi cient lighting systems reduce energy consumption
Incandescent Compact fl uorescent light bulbs (CFL) and light-emitting diodes (LED)
–
Using renewable technologies
None Solar photovoltaics (PV) and solar thermal
High effi ciency building- integrated solar PV, CHCP
Source: Authors’ analysis

18
2.2.1 EXAMPLE ANALYSIS OF BRICK AND ALTERNATIVESThe use of clay bricks for construction has been a common practice in India. According to the Ministry of Mines, Government of India, brick earth accounted for 5.2 % of total minor minerals extracted in the year 2014–15. The extraction of brick earth involves removing topsoil, which is valuable for its high level of fertility and has high opportunity costs because of its use in agricultural production. In the year 2014–15, 184.14 million tonnes of fl y ash were generated by 145 thermal power plants (Central Electricity Authority, 2015). Disposal of this material has been a major problem in India, but it has started to be incorporated into a variety of masonry units in the construction sector. It is used both as a stabilizer and as a main component in bricks. Since it is a by-product, the
energy used and carbon dioxide emitted in its production are attributed to the intended product and not to the production of fl y ash. Thus, the utilization of fl y ash in brick-making results in impact decoupling, since not only is the extraction of topsoil reduced, thereby reducing the environmental impact of extraction, but also the energy required to produce these bricks is lowered. As per estimates by the Fly Ash Bricks and Blocks Manufacturers’ Federation (FABMAFED), about 20 billion cubic feet (0.566 billion cubic metres) of topsoil could be saved annually if the existing 140,000 red brick kilns in the country switched to using fl y ash. Over the last two decades, the production of fl y ash-based bricks/blocks/tiles has increased from 0.70 million tonnes in 1998–99 to 12.02 million tonnes in 2014–15, which constitutes 11.72 % of total fl y ash utilized in that year (Central
2 THEORETICAL POTENTIAL FOR DECOUPLING
Table 3: Comparison of properties of various alternative masonry materials
Parameters Clay bricksAutoclaved aerated concrete (AAC)
Fly ash bricks
CO2 emissions (kg CO2/kg of brick)
0.2e 0.3e 0.04b
Embodied energy (MJ/kg of brick)
3e 3.5e 0.52b
Thermal conductivity (K value) W/m-K
0.7e 0.12a 0.6–0.8c
Soil consumption 1 kg/kg of brickd 0 kg/kg of brick (Uses fl y ash, which is a waste product from thermal power plants and thus involves no consumption of topsoil)
0 kg/kg of brick (Uses fl y ash, which is a waste product from thermal power plants and thus involves no consumption of topsoil)
a Satyanarayan, 2014 b Flyashbricksdelhi, 2009. Weight of fl y ash bricks considered to be 2.5 kg per brickc Based on expert consultationd Based on expert consultatione Kumar, Buddhi, & Chauhan, 2012
19
Electricity Authority, 2015). Existing green building rating systems in the country mandate the use of fl y ash in construction. However, fl y ash availability and supply varies from region to region. A regional approach based on fl y ash availability may be a more prudent way to mandate its use in construction.
2.2.2 EXAMPLE ANALYSIS OF SAND AND ALTERNATIVES Sand continues to be a critical resource for construction; it contributed 16.5 % to the value of minor minerals in 2014–15 (Ministry of Mines, 2015). The demand for sand as a construction aggregate accounted for 29 % of the total aggregate demand in 2010. According to a study by the Freedonia Group, the total demand for sand is expected to increase from 630 million metric tonnes in 2010 to 1430 million metric tonnes in 2020 (Aggregates Business Europe, 2013). Sand mining has adverse impacts on the environment, which include degradation of land, disturbance to the water table resulting in topological disorder/erosion, changes in biotic and abiotic systems, severe ecological imbalance etc. (O.C. & Ramzan, 2016). In this context, viable alternatives have been developed with stable physical and chemical properties making it stronger than natural sand. One of the alternatives used in building construction is manufactured sand (M-sand). In India, particularly in the state of Karnataka, M-sand has been included in the Schedule of Rates for public works with close to 100 M-sand manufacturing facilities located in the state (The Hindu, 2015). Increasing the supply and use of M-Sand in construction is expected to bring about a reduction in ecological destruction on the riverbeds where the sand is extracted, which will result in impact decoupling.
2.2.3 EXAMPLE ANALYSIS OF AIR CONDITIONING TECHNOLOGIESSales of air conditioners (ACs) are expected to increase signifi cantly in the coming years due to the current low market penetration of ACs (approximately 4 %) in Indian households and due to the increase in built footprint in the coming years. This implies that the market, associated revenue, and energy usage for air conditioners will continue to increase. It is safe to assume that the majority of the green building projects use non-disruptive and effi cient cooling technologies. Non-disruptive technologies – such as Bureau of Energy Effi ciency (BEE) star-rated ACs, fans, Building Energy Code compliant chillers etc. – increase the overall system and operational effi ciency of the heating, ventilating and air conditioning (HVAC) equipment and thereby reduce the cooling energy consumption.
On the other hand, there are non-conventional and renewable HVAC technologies, such as solar cooling, and combined heating, cooling and power (CHCP), which can be considered as disruptive technologies. The total area occupied by collectors for concentrated solar heating technologies under the UNDP-GEF project on concentrated solar heat (CSH) was 16,373 square metres, of which 11,247 square metres (69 %) were used for process heat or cooling2 (MNRE, 2014). If the potential were fully utilised, 5 million square metres of collector area for solar cooling with 25,000 TR (0.088 GW) could be achieved by 2022 (Signal, 2014). Applications of CHCP in building cooling are not very widespread compared to its industrial applications. As per an estimate by Deutsche Gesell-
2 Includes both heating and cooling. Exact estimates of space cooling are not available.

20
schaft für Internationale Zusammenarbeit (GIZ), the potential for building-integrated gas-based CHCP systems is approximately 6 GW (Pales & West, 2014).
The potential cooling generation from alternative technologies can meet only a miniscule percentage of space cooling energy demand. Moreover, it is very diffi cult to integrate these technologies into existing buildings. Despite their attractive payback periods, the use of disruptive cooling technologies is still confi ned to fl agship projects and a few green building projects, owing to factors such as the scale of the project, cooling and heating schedule and demand, technical feasibility and expertise, capital cost etc. (Pales & West, 2014). Cooling energy demand itself can be reduced by adopting passive cooling techniques and by maximising natural ventilation potential. However, a wide range of reasons such as air pollution, noise, building usage patterns, user behaviour etc. limit the adoption of most simple passive building techniques. Active integration of passive and active cooling systems to work in a mixed-mode/hybrid system is also still limited to demonstration/experimental buildings and still needs validation and adoption.
2.2.4 EXAMPLE ANALYSIS OF LIGHTING TECHNOLOGIESLighting has always been a low-hanging fruit for achieving energy effi ciency and the transformation from ineffi cient incandescent to compact fl uorescent lights (CFL) and then to light-emitting diodes (LEDs) has been rapid, owing to several pro-active policies such as Bachat Lamp Yojana and the Domestic Effi cient Lighting Programme (BEE, 2015; MoP, 2016). Rural areas that have not yet been electrifi ed are being served by solar lamps in the interim (NABARD, 2016). These policies are a combination of subsidies,
bulk procurement, energy services schemes etc. In the light of these policy interventions and easy access to and deployment of energy effi cient lighting technologies such as LEDs, the potential for further effi ciency in lighting could be fully exploited in the coming decades. While LED lighting imports increased by up to 2.7 times from 2012–15, LED exports shrank by up to 0.7 times in the same period (ElectronicsB2B, 2015).
2.2.5 EXAMPLE ANALYSIS OF RENEWABLE ENERGY TECHNOLOGIESBuilding-integrated renewable energy has the highest potential for reducing fossil fuel-based total primary energy consumption in the buildings sector when compared to the combined effect of designing effi cient building envelopes and using effi cient cooling and lighting technologies (Talakonukula, Prakash, & Shukla, 2013). The proliferation of building-integrated solar photovoltaics has been especially encouraging, although not phenomenal. Out of the total 525 MW of solar rooftop systems installed, residential accounts for 143 MW, commercial for 172 MW, and the remaining 210MW is on industrial rooftops. Solar rooftop systems certainly hold immense unfulfi lled potential given the solar radiation levels in the country and the amount of roof space available. Despite capital subsidies and feed-in tariff policies by state governments, the Comptroller and Auditor General of India’s report on renewable energy found that factors such as lack of net metering and provision of batteryless systems within the schemes discouraged domestic users from taking advantage of their full benefi ts. In addition, the report also highlights several instances of installed rooftops not operating to their full potential due to a lack of maintenance and technical challenges to grid connectivity (CAG, 2015).
2 THEORETICAL POTENTIAL FOR DECOUPLING

21
Similar to rooftop solar photovoltaic technology, rooftop solar water heaters (SWH) also represent considerable unfulfi lled potential. Only a minute fraction of energy consumption for thermal applications – about 0.25 % (0.6 Mtoe out of a total of 240 Mtoe) – comes from solar thermal. Looking on the bright side, buildings accounted for about 82 % of installed capacity of solar water heaters in the country. The market for SWH in buildings is expected to grow tenfold between 2014 and 2032 and is expected to be equivalent to the annual electricity generated from approximately 64 GWp of solar PV installations. Capital costs and performance risks, equitable distribution in high-rise buildings, inadequate quality standards, lack of labelling, and inclusion of a mandatory requirement in local building by-laws to provide SHW technologies have been cited as challenges to the expansion of SWH in residential buildings (Greentech Knowledge Solutions Pvt. Ltd, 2015).
2.3 SUBSECTORSThe core construction practices in the buildings and construction sector in India appear to be similar across different subsectors such as residential, offi ces, retail, hospitality, medical facilities, educational and transport terminals. However, the resource and energy consumption patterns in each of them vary considerably. In addition, many effi cient construction and energy technologies that are suited for a particular type of building might not be suitable for other sectors. For example, CHCP technologies are mostly suited for hospitality and medical facilities, where there is a simultaneous cooling and heating demand, and are less suited in residential applications.
2.4 FACTORSThe following factors have been identifi ed from the literature as the key factors that affect decoupling. The list of factors is neither exhaustive nor conclusive, but strives to provide enough information to analyse decoupling on a macro scale. Quantifi cation metrics, sources of information and gaps have been discussed for each of the factors.
2.4.1 OPERATIONAL ENERGYOf the total energy consumption in the country during the year 2013–2014, 22.5 % was consumed by the residential sector and 8.7 % by the commercial sector, taking the total consumption by building-related uses to approximately 31 % (CSO, 2015). Table 4 shows a comparison of energy consumption profi les, baseline and best practice energy consumption patterns in the country, and projection scenarios for the residential and commercial sector. An energy performance indicator (EPI) typically serves as an indicator of specifi c energy intensity in buildings and is expressed in kWh/m2/year. The EPI should be treated with caution as the procedure for calculating energy consumption and fl oor area is at the discretion of the rating system in question. There is no methodology for calculating EPIs that has nationwide acceptance (CSE, 2014).

22
Residential sector: A study conducted in sample urban residential buildings in two climatic regions of India – composite climate (Delhi-NCR) and warm humid climate (Chennai) – calculated the mean fi nal energy consumption as 48 kWh/m2/year and 43 kWh/m2/year respectively (Kanagaraj et al., 2014). Another study published in 2014 by the Global Buildings Performance Network (GBPN) reported that the average EPI in 1–4 bedroom residential units ranges from 35–46 kWh/m2/year in four cities representing four different climate zones. The energy consumption depends on the number of air conditioners and peaks during the summer months. The studies also found out that absolute energy consumption increases with the growth in the number of air conditioners (AC) per dwelling unit. Table 4 below shows a comparison of average energy consumption (based
on the two studies mentioned above) versus baseline energy consumption (based on different rating systems and regulations in India and Germany) in the residential sector.
Although observed EPIs for the majority of the buildings in both studies by Kanagaraj et al. (2014) and GBPN (2014) fall below the GRIHA EPI baseline and the Passivhaus standard, they are still marred with ineffi ciencies in design, technologies deployed and usage. Hence, they hold immense potential for further lowering their energy consumption. In addition, average energy consumption is only a gross approximation considering the diversity in the data. There also appears to be a need to correlate and revise the EPI baselines in India to refl ect the values based on latest measured consumption data, usage and available best practices.
Table 4: Energy consumption scenario in residential buildings
Average energy consumption Baseline consumption
Kanagaraj et al., 2014
GBPN, 2014 GRIHA green building rating (voluntary standard)
Passivhaus, Germany (voluntary standard)
Energy Conservation Regulations, (EnEV) Germany (mandatory)
Climate zones
Composite & warm and humid
Composite, hot and humid, hot and dry, moderate
Moderate Composite, hot and humid, hot and dry, cold
All (a few exceptions exist for hot and humid climates)
–
EPI value (kWh/m2/year)
40–50 (average) 35–46 (average) <50 <70 Space heating/ cooling energy <15
Specifi c energy demand < 46.1
Energy con sumption for heating and hot water
< 60–70 kWh/m2 of heated indoor area/year
Source: Authors’ analysis
2 THEORETICAL POTENTIAL FOR DECOUPLING

23
As per GBPN (2014), annual energy consumption in the residential sector in India is projected to increase from 650 kWh in 2012 to 2,750 kWh by 2050 in a business-as-usual scenario and could be cut down to 1,170 kWh in a very aggressive effi ciency scenario. Energy use in the residential sector is projected to reach around 2,250 TWh in a moderate effi ciency scenario and 1,200 TWh in an aggressive effi ciency scenario by 2047 (NITI Aayog, 2015). Each scenario includes assumed different levels of effi cient lighting and appliance penetration for a given growth in the residential building sector within the timeframe.
Commercial sector: Preliminary results from a benchmarking study on commercial buildings in India show that energy consumption in typical offi ce buildings ranges from about 100 kWh/m2/year to about 500 kWh/m2/year, depending on the type of building, climate zone and period of usage (USAID ECO-III Project, 2010). Table 5 shows a comparison of baseline energy consumption versus best-practice energy consumption in the non-residential sector.
Energy use in the commercial sector is projected to reach around 795 TWh in a moderate effi ciency scenario and 671.5 TWh in an aggressive effi ciency
Table 5: Energy consumption scenario in non-residential buildings
Average energy consumption (kWh/m2/year)
Baseline energy consumption (kWh/m2/year)
Sector USAID ECO-III Project, 2010
USAID ECO-III Project, 2010
GRIHA BEE star rating
Typical day time operated offi ce building
115 141 < 75 (moderate climate)
< 90 kWh/m2/year (all other climate zones except moderate)
65–85 (for buildings that have < 50 % air conditioned area )
Offi ce buildings operating three shifts
349 < 225 (moderate climate)
< 300 kWh/m2/year (all other climate zones except moderate)
115–200 (for buildings that have > 50 % air conditioned area )
Secondary government hospitals
88 – – –
Multi-speciality hospitals
378 – – –
Luxury hotels 279 – – –
Source: Authors’ analysis

24
scenario by 2047 (NITI Aayog, 2015). Each scenario includes different assumed levels of effi ciency for the building envelope, lighting and appliance penetration for a given growth in the residential building sector within the timeframe.
2.4.2 EMBODIED ENERGY Embodied energy is the total energy that is required for the extraction, processing, manufacture and delivery of building materials to the building sites. It is thus the indicator for the overall environmental impact of building materials and their production processes. Talakonukula, Prakash, & Shukla (2013) calculated that embodied energy in air-conditioned residential buildings in India is approximately 10–20 % per cent of operational energy. Their study of a 4-storey concrete-framed block of fl ats comprising 44 units revealed that the embodied energy of the building was about 11 % of the operating energy, with the predominant materials being steel, cement and bricks. Steel accounted for 34 % of the initial embodied energy followed by cement (25 %) and bricks (24 %). However, another study by Praseeda, Venkatarama Reddy, & Mani (2016) observed that the embodied energy can further increase up to 50 % in non-air-conditioned buildings, indicating that air conditioning plays a critical role in total primary energy consumption (Praseeda, Venkatarama Reddy, & Mani, 2016).
The use of alternative materials and technologies can signifi cantly reduce embodied energy. For example, vertical shaft brick kilns are an energy-effi cient technology for fi red clay brick production. The technology saves 30–50 % on fuel as compared to other brick-fi ring technologies, thus reducing the embodied energy of brick production considerably. Similarly, Fal-G bricks are manufactured from a mix
of fl y ash (industrial waste), lime and calcined gypsum (a by-product of phosphogypsum or natural gypsum). The mix capitalizes on the strength of fl y ash/lime mixtures in the presence of gypsum. These fl y ash bricks reduce the embodied energy because they use waste material and are manufactured by mechanically compressing the raw material and thus do not need fi ring (Khanna, 2011). Thus, reducing embodied energy through design and choice of building material can signifi cantly reduce the environmental impacts.
Embodied energy is measured in MJ or GJ in absolute terms and MJ/m2 or GJ/m2 in specifi c terms.
2.4.3 UTILITY FUEL MIX (SUPPLY GRID ENERGY MIX)The total installed electricity capacity in the country as at August 2015 was 276,783 MW, which comprised 60.8 % coal, 8.4 % gas, 0.4 % diesel, 2.1 % nuclear, 15.2 % hydro and 13.17 % renewable energy. Of the total capacity of 36,471 MW of renewable energy, 11.2 % was from small-scale hydro projects, 65.2 % from wind power, 12.1 % from biomass/cogeneration, 0.3 % from waste to energy, and 11.1 % from solar power (see Figure 2) (CEA, 2015). The anticipated fi gures for total electrical energy available in the country for the period 2014–15 are 995,157 MU of available energy at a peak demand of 144,788 MW against a requirement of 1,048,672 MU at a peak demand of 147,815 MW, leaving a shortage of 5.1 % and 2 % respectively (CEA, 2014). This implies an increase in the electricity shortage and results in load shedding. The utility mix provides an easy opportunity to move towards a transition to clean energy. Options that are available for consumers in this direction include switching to a cleaner utility provider or purchasing renewable energy certifi cates. India has a renewable energy potential of 245,880 MW (estimated)
2 THEORETICAL POTENTIAL FOR DECOUPLING

25
and its market is growing at an average annual rate of 15 % (IGEP, 2013). Despite the high demand for the input materials needed for wind energy, the potential resource savings of using it instead of coal-based power plants are still much higher – saving up to 350 million tonnes of primary raw materials by 2030 (IGEP, 2013).
The primary energy factor (PEF) indicates the effi ciency of converting a primary source of energy such as coal, gas, solar etc. into usable electricity. PEF typically takes into account all inherent conversion and transmission losses and serves as an appropriate indicator for individual fuels or fuel mix. A lower PEF indicates higher effi ciency of production and vice versa. Table 6 shows PEF values from the European Union (EU) (Fritsche & Greß, 2015). The comparative values for India are not readily available, but values from older sources show a PEF value of around 3.4.
Figure 2: Breakdown of renewable energy generation as of August 2015 in MW (Total 36,470)
Source: CEA, 2015
65.2 %12.1 %
11.2 %
11.1 %
0.3 %
Wind powerBiomass/cogenerationSolar powerSmall hydroWaste to energy
Table 6: Primary energy factors in the EU
PEF (kWhprim/kWhel) PEF total PEF non-renewable PEF renewable PEF other*
EU (2013) 2.46 2.18 0.36 0.04
*= includes waste heat, and non-renewable wastesSource: Fritsche & Greß, 2015
26
2.4.4 BUILDING FUEL MIX (ON-SITE ENERGY GENERATION AND CONSUMPTION)Technologies that infl uence fuel mix at an individual building level include solar photovoltaic, solar thermal, ground-source heat pumps, and co-generation (CHCP) technologies etc. However, except for solar photovoltaic and to a certain extent solar thermal, the remaining technologies are still confi ned to pilot projects and await large-scale deployment. The total installed rooftop capacity at the end of 2015 is estimated to be 525 MW, which represents around 11 % of total solar PV installed capacity, which also includes utility-scale solar PV (PTI, 2015). As a part of the Jawaharlal Nehru National Solar Mission (JNNSM), the target for installed capacity of solar rooftops is 40 GW by 2022.
The potential for using conventional and alternative sources of energy varies across building sectors and depends on several factors. For the formulation of long-term policies on decoupling, it is important to identify the technical feasibility in various building sectors and make recommendations that target the achievement of their full potential. For example, single-family and multi-family houses have more roof surface area to install solar renewable technologies, but apartment buildings have limited area. Similarly, cogeneration techniques are useful only in buildings with simultaneous heating and cooling demand. Therefore, a blanket policy recommendation to increase the use of various renewable technologies in the buildings sector will not yield the expected results unless the nuances in technology use and deployment are understood.
The building fuel mix is considered in terms of energy generated or saved and therefore subtracted from the building’s specifi c energy consumption. Typically, the EPI for low-energy and net zero-energy buildings is expressed after factoring in the energy generated from renewable sources of energy.
2.4.5 PRIMARY MATERIAL CONSUMPTIONResource effi ciency is considered to be an effective means of reducing environmental burdens and simultaneously strengthening India’s economy by contributing to the decoupling of resource consumption from economic growth. India’s construction sector has been growing at an average annual growth rate of 10 % since 2000 and it is still growing rapidly, which means that India’s housing stock is estimated to increase from 330 million housing units in 2011 to 770 million in 2030. This increases energy use and signifi cant raw material footprints, including the consumption of minerals (sand, gravel), cement, steel, bricks, aggregates, and diminishes natural reserves. It uses 40–45 % of India’s steel, 85 % of its paint production, 65–70 % of its glass; furthermore, a signifi cant percentage of the output from the automotive, mining and excavation equipment industries are used in the construction industry (Planning Commission, 2012).
2 THEORETICAL POTENTIAL FOR DECOUPLING
27
Resource-effi cient measures hold signifi cant material-saving potential of more than 40 %. About 50 billion tonnes of materials could be saved if all the housing demand were constructed using resource-effi cient options by 2030 (IGEP, 2013). It is important to note that the two crucial resources sand and soil often operate outside of the formal economy. Hence, even though the resource use and environmental impact related to their usage is very real, the value addition arising from the use of these resources in the formal economy is debatable.
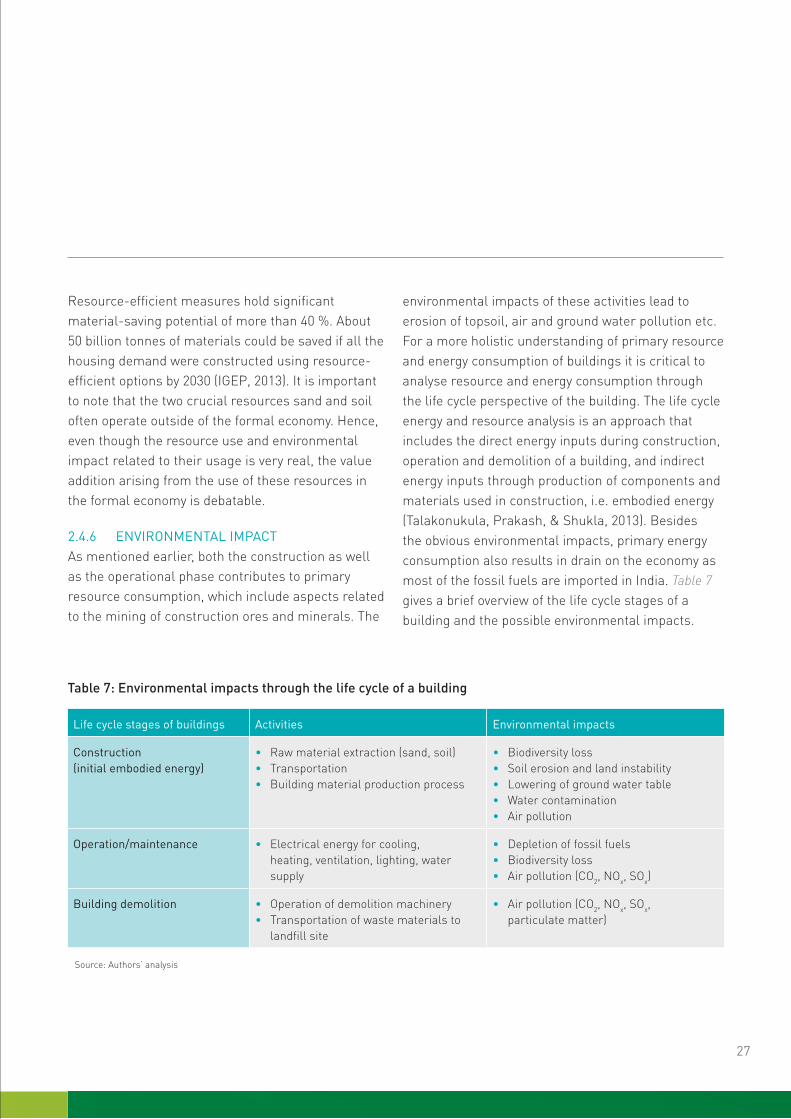
2.4.6 ENVIRONMENTAL IMPACTAs mentioned earlier, both the construction as well as the operational phase contributes to primary resource consumption, which include aspects related to the mining of construction ores and minerals. The
environmental impacts of these activities lead to erosion of topsoil, air and ground water pollution etc. For a more holistic understanding of primary resource and energy consumption of buildings it is critical to analyse resource and energy consumption through the life cycle perspective of the building. The life cycle energy and resource analysis is an approach that includes the direct energy inputs during construction, operation and demolition of a building, and indirect energy inputs through production of components and materials used in construction, i.e. embodied energy (Talakonukula, Prakash, & Shukla, 2013). Besides the obvious environmental impacts, primary energy consumption also results in drain on the economy as most of the fossil fuels are imported in India. Table 7 gives a brief overview of the life cycle stages of a building and the possible environmental impacts.
Table 7: Environmental impacts through the life cycle of a building
Life cycle stages of buildings Activities Environmental impacts
Construction (initial embodied energy)
• Raw material extraction (sand, soil)• Transportation• Building material production process
• Biodiversity loss• Soil erosion and land instability• Lowering of ground water table • Water contamination• Air pollution
Operation/maintenance • Electrical energy for cooling, heating, ventilation, lighting, water supply
• Depletion of fossil fuels • Biodiversity loss• Air pollution (CO2, NOx, SOx)
Building demolition • Operation of demolition machinery• Transportation of waste materials to
landfi ll site
• Air pollution (CO2, NOx, SOx, particulate matter)
Source: Authors’ analysis

28
2.4.7 GROWTH AND PRODUCTIVITYBuildings in India are divided into the residential and the service sector. According to 2015 estimates, the service sector (54.4 %) is the single largest contributor to India’s GDP, compared to agriculture (16.1 %) and industry (29.5 %) (CIA, 2016). Energy consumption is thus crucial to productivity in service sector buildings such as IT, fi nance and hospitality etc. India’s service sector is the second fastest growing in the world (Bhargava, 2014). Increasing its productivity while consuming the least energy possible is therefore crucial.
Unlike in the service sector, growth in the residential sector cannot be directly quantifi ed into productivity and economic growth. Signifi cant reasons for lowering energy consumption in the residential sector include the fact that it would reduce the fi nancial losses accumulated by the distribution companies because of the heavily subsidized electricity prices, reduce peak demand, and lower the capital and operational expenses for the distribution companies. Making energy accessible and affordable for residential consumers and enabling them to save electricity will lower their monthly expenditure on electricity and give households more disposable income. The increase in GDP due to the spur in the real estate sector also has to be taken into account.
Data on economic growth in the commercial sector is easily available and can be measured directly in terms of GDP and employment generation. However, growth in the residential sector should take into account a combination of qualitative measures of human wellbeing, reduction in revenue loss for the generation and distribution companies, and economic activity in the construction and real estate sector. This data is not readily available and appropriate metrics to measure growth and productivity across the various subsectors of the buildings and construction sector need to be developed.
2.4.8 LABOUR PRODUCTIVITY AND HUMAN RESOURCE DEVELOPMENT The construction sector is India’s second largest employer after agriculture. The employment rate is increasing, with about 41 million people employed in the sector in 2011, which is almost four times as many as in 2005. The bulk of construction work takes place in the metros and cities. The workforce chiefl y comprises unskilled workers – more than 80 % – who are predominantly seasonal migrant workers from rural areas (Planning Commission, 2013). The shortage of skilled workers is exacerbated by a lack of capacity in public and private training institutions (Darko et al., 2013). This data is not readily available and appropriate metrics to measure labour productivity across the various subsectors of the buildings and construction sector need to be developed.
2 THEORETICAL POTENTIAL FOR DECOUPLING

29
2.5 CONCLUSION: TYPE AND NATURE OF DECOUPLINGViewed individually, alternative technologies and materials have differing potential to contribute to decoupling. However, it would only be possible to measure their cumulative impact if they were used comprehensively and in a particular building sector. This is because a certain alternative might individually have a high impact compared to another low-impact alternative. However, the use of such a high-impact alternative might be very limited in terms of quantity, volume or net savings achieved compared to another low-impact alternative. Furthermore, cost, payback, and certain other factors, as discussed for each of the alternatives described, might inhibit their use.
For example, it is becoming increasingly clearer that there is a great deal of untapped potential in the rooftop solar photovoltaic sector. Ambitious targets have already been set, the technology and roof
space is available, and there is no dearth of solar radiation in the country, so all it would take to tap the full potential is technology integration and policy leapfrogging.
Similarly, projections such as the India Energy Security Scenarios 2047 (IESS 2047) show that there is immense potential for achieving relative decoupling in individual sectors. For example, relative decoupling is possible in the residential and commercial building sector under certain scenarios. In a developing economy such as India, it is not feasible to achieve absolute decoupling in any sector. However, absolute decoupling – both in terms of technology and material – should be made a priority for critical resources. For example, it is very important to reduce the overall use of sand.
Table 8 analyses drivers and barriers to achieving absolute and relative decoupling in both the residential and non-residential sectors for the various factors listed above.

30
Table 8: Analysis of decoupling
Impact decoupling
Drivers Barriers
Construction phase – residential and non-residential:• Given the lack of awareness of the adverse impact of CO2
emission and NDCs at regional and grassroots levels, the problem should be translated and interpreted in terms of environmental and air pollution which are immediately felt and easily understood by people.
• Increase in employment opportunities and commercial viability of construction materials and SMEs.
Construction phase – residential and non-residential:• Non-disruptive technologies have the potential to reduce
environmental impact.
Operational phase – residential:• Building fuel mix, incorporating solar rooftop for
example, has the highest potential to reduce dependence on fossil fuel-based grid electricity.
• Elimination of load shedding due to solar back up.• Monetary benefi ts. • Energy cost savings – encourage conversion of energy
(cost) savings into long-term bonds.• Competitive feed-in tariff (FIT) and levelised cost of
electricity (LCOE) regime.
Construction phase – residential and non-residential:• Mass production and commercial viability of some
alternative building materials. • Lack of awareness and monitoring at city/municipal level.• Informal nature of the building materials supply chain. • Labour intensive cum exploitative nature of building
materials manufacturing industry.
Operational phase – residential and non-residential:• Functional issues in deploying renewable technologies in
individual buildings.
Operational phase – residential:• Greater proliferation of home appliances, especially
appliances which are not within the regulatory ambit.• Lack of credibility measures to encourage renewable
energy certifi cate (REC) purchase schemes.• Energy subsidy not in line with demand in higher
consumption slabs.
Resource decoupling
Construction phase – residential and non-residential:• Increased economic opportunities in rural areas
Construction phase – residential and non-residential:• Non-disruptive technologies have the potential to reduce
primary resource consumption. • Increase in local manufacturing in appropriate disruptive
technologies.• REC purchase obligations for buildings that exceeds
specifi c consumption level.
Construction phase – residential and non-residential:• Demand for construction activity due to increase in
population growth.• Lack of regulatory framework for the fl ow of building
construction materials.• The nature of and need for increased economic growth
that is dependent on the consumption of energy and resources.
Operational phase – residential:• Lack of leapfrogging in uptake of disruptive technologies.
Source: Authors’ analysis
2 THEORETICAL POTENTIAL FOR DECOUPLING

31
3.1 CURRENT POLICY SITUATIONNumerous policies at central, state and local levels, along with popular green building rating systems, are key to minimising the environmental impact and resource consumption caused by the construction and operation of buildings. They encourage the use of materials with low embodied energy and the reuse of industrial by-products in construction, and the use of energy-effi cient and renewable energy technologies during the operational phase. A number of key non-disruptive and disruptive technologies and resources being used in India have been identifi ed from the literature, along with examples of good practice and green building standards (refer to policy brief 1 for details). The policies have been classifi ed for the purpose of analysis using the bigEE.net policy package (Wuppertal Institute, 2016). The technologies
pertain, for example, to the building envelope, air conditioners, solar thermal, solar photovoltaic, fans, LED and CFL lighting, and chillers. Resources include sand, cement, steel, brick and others. These technologies and resources have then been categorized into different policy headings as identifi ed in policy brief 1 to identify the trigger points and gaps.
Firstly, technological interventions that have been recognized as crucial to facilitating decoupling in the buildings and construction sector were analysed (see Figure 3). It can be seen that incentives and fi nancing has been one of the popular policy instruments across different technologies, followed by capacity building and research, development and demonstration (RD&D) and promoting best available technology (BAT). One observation while making the classifi cation was that most policies aim to minimise
3 ANALYSIS OF THE CURRENT POLICY SCENARIO
Figure 3: Policies that impact on operational energy usage through various technologies
Source: own illustration
Figure 3: Policies that impact on operational energy usage through various technologies
6
Building envelopeTechnical systems
LEDCFL
ACCeiling fans
Solar PVSolar thermal
Chillers & auxOthers
0
2
4
8
10
12
14
Num
ber
of p
olic
ies
Target and planning
Infrastructure Regulation Transparency Incentives and financing
Capacity RD&D and BAT promotion

32
the total building energy consumption instead of focusing on a particular effi cient technology option. Most of the time, generic terms such as ‘green building’ or ‘energy-effi cient’ building are used. This runs the risk of introducing trade-offs between different technology and resource groups, leaving some effi cient options out of the race for various reasons such as high capital cost, lack of technical knowledge etc.
Secondly, resource interventions that have been recognized as crucial to enabling decoupling in the buildings and construction sector were analysed (see Figure 4). Regulatory policies appear to be the front-runner when it comes to resources, followed by transparency and information, target-setting and planning, and infrastructure and funding. Research, Development and Demonstration (RD&D)
and best available technology (BAT) promotion and capacity building appear to be severely under-represented in polices. Although the four resource options are covered by regulatory oversight, implementation is possible only in formal sectors such as cement and steel. Sand and soil (brick) run the risk of slipping through the net. Capacity building and R&D policies should be encouraged.
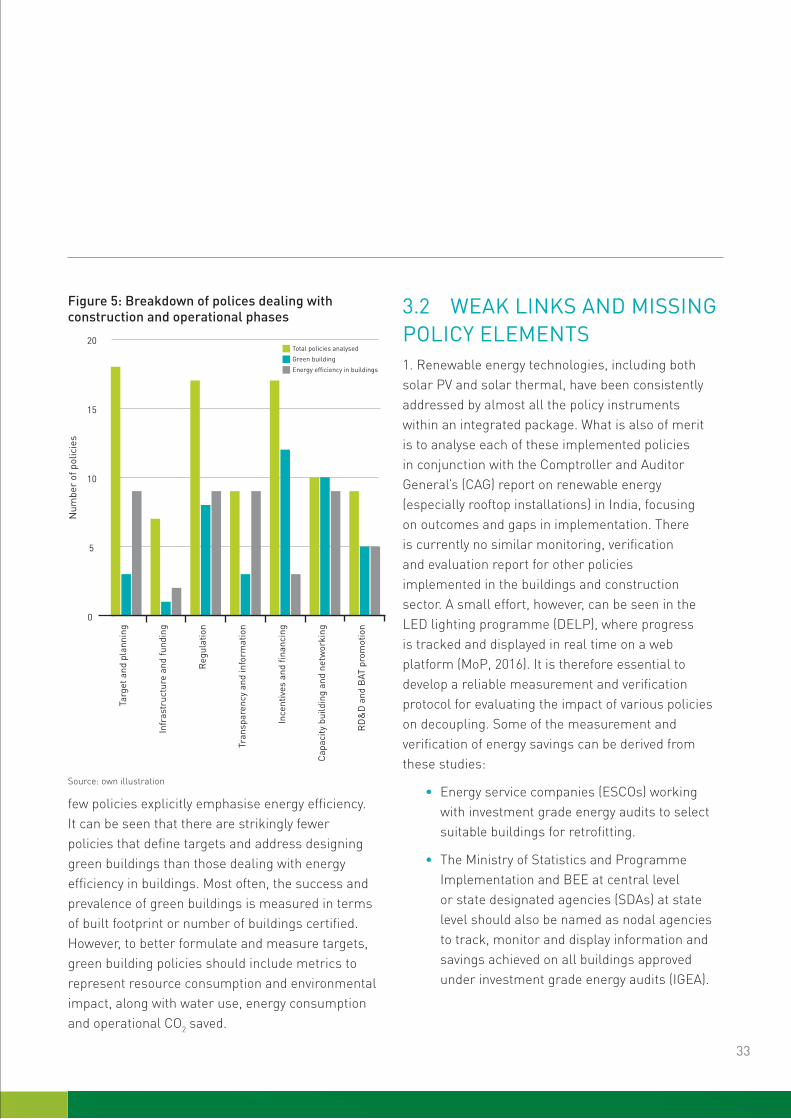
Thirdly, policies were categorised according to whether they address the construction or operational phase (see Figure 5). Here, the green building category comprises policies on building materials used during the construction phase and the energy effi ciency category comprises policies that emphasise reducing energy use during the operational phase. Often, green building is used as an umbrella term for both green and energy-effi cient buildings. Only a
3 ANALYSIS OF THE CURRENT POLICY SCENARIO
Figure 4: Policies that use various measures to impact resource usage
Source: own illustration
0
2
4
6
8
10
12
SandCement
SteelBrick
Others
Target and planning
Infrastructure Regulation Transparency Incentives and financing
Capacity RD&D and BAT promotion
Num
ber
of p
olic
ies
33
few policies explicitly emphasise energy effi ciency. It can be seen that there are strikingly fewer policies that defi ne targets and address designing green buildings than those dealing with energy effi ciency in buildings. Most often, the success and prevalence of green buildings is measured in terms of built footprint or number of buildings certifi ed. However, to better formulate and measure targets, green building policies should include metrics to represent resource consumption and environmental impact, along with water use, energy consumption and operational CO2 saved.
3.2 WEAK LINKS AND MISSING POLICY ELEMENTS 1. Renewable energy technologies, including both solar PV and solar thermal, have been consistently addressed by almost all the policy instruments within an integrated package. What is also of merit is to analyse each of these implemented policies in conjunction with the Comptroller and Auditor General’s (CAG) report on renewable energy (especially rooftop installations) in India, focusing on outcomes and gaps in implementation. There is currently no similar monitoring, verifi cation and evaluation report for other policies implemented in the buildings and construction sector. A small effort, however, can be seen in the LED lighting programme (DELP), where progress is tracked and displayed in real time on a web platform (MoP, 2016). It is therefore essential to develop a reliable measurement and verifi cation protocol for evaluating the impact of various policies on decoupling. Some of the measurement and verifi cation of energy savings can be derived from these studies:
• Energy service companies (ESCOs) working with investment grade energy audits to select suitable buildings for retrofi tting.
• The Ministry of Statistics and Programme Implementation and BEE at central level or state designated agencies (SDAs) at state level should also be named as nodal agencies to track, monitor and display information and savings achieved on all buildings approved under investment grade energy audits (IGEA).
Figure 5: Breakdown of polices dealing with construction and operational phases
Source: own illustration
0
5
10
15
20Total policies analysed
Green building
Energy efficiency in buildingsR
D&
D a
nd B
AT p
rom
otio
n
Capa
city
bui
ldin
g an
d ne
twor
king
Ince
ntiv
es a
nd fi
nanc
ing
Tran
spar
ency
and
info
rmat
ion
Reg
ulat
ion
Infr
astr
uctu
re a
nd fu
ndin
g
Targ
et a
nd p
lann
ing
Num
ber
of p
olic
ies

34
2. Incentives and fi nancial instruments lead the charge for technological intervention policies. However, there is a clear lack of regulation and policies on transparency and information in this segment. Although there are some minimum energy performance standards (MEPS) and labelling policies in the lighting and appliances sector, most of them are still in the changeover stage from being voluntary to binding.
3. Of the total energy consumption in the country during the year 2013–2014, 22.5 % was accounted for by the residential sector and 8.7 % by the commercial sector (CSO, 2015). By 2030, the highest growth in building construction is expected in the residential sector (67 %) followed by the service sector (37 %) (Climate Works Foundation, 2010). This indicates that both resource and energy consumption will be highest in the residential sector. Although exact estimates for sub-sectors are not available, LEED reports that the housing sector occupies about 40 % of the green building footprint (Mutu Krishnan, 2012). Besides, it is likely that GRIHA certifi ed buildings are mainly government-owned, while LEED-certifi ed buildings range from large corporate to offi ce spaces, factories and hotels (Darko et al., 2013). Given the existing footprint of residential buildings and the projected growth in the residential sector, it is not surprising that the majority of green construction should happen in the residential sector. However, the majority of the green building projects in the service sector are commercial and offi ce buildings, whereas projects in the residential sector are large-scale developments or government-sponsored housing projects. The majority of the residential projects are still constructed by small builders, developers and local masons who are not highly literate and not yet aware of green buildings.
4. Targets and planning policy measures during the construction phase lag behind those for the operational phase. One quite possible reason for this is that the latter is easy to measure. The construction phase has more impact on environment and resource consumption, both of which are comparatively diffi cult to account for, given their diverse nature and use patterns. In order to deal with resource-effi ciency challenges and explore related options that India will face in the years ahead, more comprehensive qualitative and quantitative data are required, from which future scenarios and trends can be predicted (IGEP, 2013).
5. Although regulatory measures appear to dominate in resource policies, a closer look at particular polices gives a different view. Cement and steel production have already reached considerable effi ciency both in terms of resources and embodied energy. However, the national policy on sand has recently been formulated and regulatory oversight on both sand and brick production is extremely diffi cult given the very nature of their procurement and manufacturing. There is a clear lack of incentives and fi nance to promote alternative materials, although there are considerable RD&D and BAT promotion policies. An integrated policy package should ensure mass production and a closed supply chain for alternative materials.
3 ANALYSIS OF THE CURRENT POLICY SCENARIO

35
Efforts to achieve absolute decoupling can be seen in European countries, e.g. Germany, where there is innovation in effi cient technologies and a stringent and supportive policy environment. Although the German economy doubled in size between 1970 and 2011, CO2 emissions have decreased and energy use stabilised (see Figure 6). The gap between GDP growth and GHG emissions reduction is widening and a 1 % GDP increase has coincided with a 0.9 % decrease in carbon emissions (PWC, 2013). Likewise, the economy of the United Kingdom grew by 27 % while emissions fell by 20 % between 2000 and 2014 (Aden, 2016). Decoupling in other countries can be seen in Table 12 in the Annex. The increase in energy and resource effi ciency, and a growth in renewable energy are the main factors of decoupling in Europe. Renewables, including wind power, solar power (thermal, photovoltaic and concentrated), hydroelectric, tidal power, geothermal energy, biomass and waste to energy, have huge potential to stimulate employment and create jobs in new green technologies in the EU (Eurostat, 2016). Besides that, studies show that factors playing a role in decoupling in Europe are deindustrialisation and growing imports from developing countries.
Technological development and stringent policies on energy and material effi ciency have played a vital role in decoupling energy and resource use from growth in the European/German construction sector. A number of lessons can be learnt from the European experience, which are discussed below.
4.1 ENERGY EFFICIENCY IN THE EUROPEAN/GERMAN BUILDINGS AND CONSTRUCTION SECTORAt European level, the Energy Performance for Buildings Directive (EPBD), a mandatory framework directive, obliges member states to set minimum energy performance standards (MEPS) to achieve signifi cant reductions in the energy consumption of buildings. The Directive was recast in 2010 (EPBD recast, 2010/31/EU), making its goals more ambitious – including moving towards nearly zero-energy buildings (NZEB) for new public buildings by 2018 and all new residential and commercial buildings by 2020. Germany’s Energy Conservation Regulations (Energieeinsparverordnung, EnEV) stipulate minimum energy performance for new buildings and substantial retrofi tting. They cover heating, cooling, domestic hot water and, for non-residential buildings only, lighting and ventilation. The energy standards are stringent and mandatory, and have been tightened regularly. The regulations have been updated from EnEV 2007 to EnEV 2009 in order achieve around 30 % energy savings. The latest revision which is EnEV 2016 calls for increased energy effi ciency compared to all the previous editions bigEE 2014). In terms of other governance frameworks, Germany has no energy subsidies but energy-intensive industries are exempted from energy taxes to avoid increasing their electricity costs (bigEE 2014). Besides offering the choice of using clean (renewable) energy in buildings, Germany provides feed-in tariffs to promote renewable energy. It offers compensation to renewable energy producing buildings and also provides guaranteed grid access,
4 EUROPEAN/GERMAN POLICY EXPERIENCE IS ENCOURAGING FOR DECOUPLING

36
4 EUROPEAN/GERMAN POLICY EXPERIENCE IS ENCOURAGING FOR DECOUPLING
Figure 6: Energy intensity of the German economy
Source: PWC, 2013
Energy intensity (toe/GDP thousand USD)*, 1970–2010
Energy consumption per sector ****
1970
1972
1974
1976
1978
1980
1982
1984
1986
1988
1990
1992
1994
1996
1998
2000
2002
2004
2006
2008
2010
High-income OECDGermany
-1,8% p.a. **
1990
20
40
60
80
100
120
140
0,35
0,30
0,25
0,20
0,15
0,10
0,05
0,00
0
1992
1994
1996
1998
2000
2002
2004
2006
2008
2010
Inde
xto
e/G
DP
per
capi
ta
Industry
Transport
HouseholdsCommerce, trade, services
* The energy intensity includes the transport sector** Change in primary energy intensity; Final energy use intensity decreased by -3.1% annually (1990–2011)*** Transport sector is excluded form the scope of this study**** Due to the reunicication, sector data is only available from 1990

37
long-term contracts (15–20 years) for the electricity produced and purchase prices based on the cost of generation (UNEP, 2014).
In EU member countries, voluntary energy performance certifi cates (EPC) provide information about a building’s energy consumption and give advice about energy-saving potential. It is a legal obligation for a building to have an EPC before being let or sold. Likewise, a building built to the Passive House (PH) standard provides an opportunity for energy savings of at least 80–90 % compared with conventional buildings. It enables high energy effi ciency/performance in a building by using appropriate insulation, an airtight construction and effi cient mechanical ventilation. These voluntary labels incentivise owners and investors to accept higher building costs and at the same time tenants benefi t from lower energy costs and long-term social benefi ts. The German Energy Agency (Deutsche Energie-Agentur, Dena) has been responsible for and active in demonstrating higher energy-effi cient buildings. It monitors, documents and evaluates buildings, incentivising people to save energy and resources, and enjoy economic and social gains.
Likewise, innovation and the use of highly energy-effi cient technologies in buildings, such as double and triple glazing, effi cient lighting (LED), energy-effi cient appliances and insulation have contributed to signifi cant energy reductions. The availability and cost effectiveness of these technologies, supported by incentives, have boosted their extensive use. Financial incentives are available in Europe for both residential and commercial buildings. The most common ones are grants/subsidies, loans and tax incentives. KfW Development Bank (KfW Entwicklungsbank) funding in Germany provides low-interest loans to individuals and municipalities to improve building energy
performance, under the rules of which the more the effi cient the building the higher the subsidy level. Besides that, various German energy advice services have specially trained energy advisors, providing information about the options for energy saving before and during construction. Estimated savings through this programme amount to 1 to 2 TWh in primary energy and 0.3 to 0.6 million tonnes of CO2 emissions (bigEE.net, 2014).
4.2 RESOURCE EFFICIENCY IN THE GERMAN BUILDINGS AND CONSTRUCTION SECTORBuildings in the EU account for 42 % of its energy consumption, 35 % of its greenhouse gas emissions and 50 % of its extracted materials (EC, 2011 in PE International, 2013). The European Commission’s ‘Roadmap to a Resource Effi cient Europe’ is a core part of the Europe 2020 strategy, which is aiming to achieve high resource effi ciency levels for the renovation and construction of buildings and infrastructure by 2020. It uses a life-cycle approach, in which all new buildings will be nearly zero energy and highly material effi cient. Furthermore, policies for renovating existing buildings will be in place to ensure cost-effi cient refurbishing at a rate of 2 % per year and also targeting recycling 70 % of non-hazardous construction and demolition waste (PE International, 2013). Likewise, the EU’s Ecodesign Directive provides consistent EU-wide rules for improving the environmental performance and energy effi ciency of building appliances. It helps to eliminate the ineffi cient products from the market, contributing to the EU’s 2020 energy effi ciency objective. It also supports industrial competitiveness and innovation by promoting energy-effi cient products (EC, 2016).

38
The German government adopted the Resource Effi ciency programme (ProgRess) in 2012 to promote the protection and sustainable use of the country’s natural resources (Bundesregierung, 2012) and support resource effi ciency goals. Data on domestic material consumption (DMC) in raw material per capita is available for Germany for every year since 2000, and Eurostat is implementing the indicator for the EU27 (BMUB, 2015). DMC in Figure 7 shows the diminishing rate of material consumption per capita in Germany. Likewise, Figure 8 shows the decoupling relationship between raw material productivity, extraction and imports on the one hand and GDP on the other.
The Swiss vision of ‘2000 Watt per capita society’ combines energy effi ciency with material effi ciency and implies a factor 4 to 5 increase in energy effi ciency. Research and development activities have been carried out for this Europe-wide with the aim of increasing economic growth using low carbon technologies.
A number of voluntary green building certifi cation schemes promote green buildings. They include the German Sustainable Building Council (DGNB), the UK’s Building Research Establishment Environmental Assessment Method (BREEAM), the High Quality Environmental standard (HQE) in France, and Leadership in Energy and Environmental Design (LEED) from the USA, each of which has been developed and modifi ed to suit the needs of the country in question. Building energy and resource effi ciency in Europe and Germany could become more effective if these schemes were mandatory instead of voluntary.
Figure 7: DMC per capita (in raw material equivalents)
Source: Federal Statistical Offi ce
Figure 8. DMC per capita (in raw material equivalents)
0
5
10
15
20
25
BiomassIndustrial minerals
Construction mineralsOres
Energy carrier
DM
C in
Raw
mat
eria
ls e
quiv
alen
ts p
er c
apita
l [t]
2008 200920072006200520042003200220012000
Figure 8: Raw material productivity and economic growth
Source: Federal Statistical Offi ce, Wiesbaden 2011
80
90
100
110
120
130
140150
70
147,5
122,3
82,9
1994
1996
1998
2000
2002
2004
2006
2008
2010
1995
1997
1999
2001
2003
2005
2007
2009
Inde
x (1
994–
100)
Raw material productivity
Gross domestic products price-adjusted
Raw materials extraction and imports
4 EUROPEAN/GERMAN POLICY EXPERIENCE IS ENCOURAGING FOR DECOUPLING

39
In terms of material production, Germany supports the circular economy concept for material waste reduction. In this concept, resources and products are sustainably sourced, designed to be reused, remanufactured and recycled so that waste becomes a resource and less primary raw material needs to be used (IGEP, 2013). The German construction industry has demonstrated that of the 13.0 million tonnes construction waste, 0.3 million tonnes were recycled (2.3 %), 12.3 million tonnes (94.6 %) were sold on for a different use, and only 0.4 million tonnes (3.1 %) were disposed of in landfi lls (Kreislaufwirtschaft Bau, 2013). The European Commission has also obliged all member states to develop national waste prevention programmes and describe in detail how the generation of waste can be decoupled from economic development.
As an innovative alternative building material to reduce energy and resources, Germany produces eco-cement that uses industrial waste materials such as blast furnace slag and fl y ash, and reduces the embodied carbon of the average structure by 25 % (ecocem n.d.). Likewise, metal (e.g. aluminium) recycling is carried out intensively in Germany. Various certifi cation schemes – Cradle to Cradle (C2C), Forest Stewardship Council (FSC), Natureplus, European Ecolabel and the Blue Angel – are used in Europe to provide information on and certify green products.
KfW has also made funds available for green buildings that are similar to its fi nancial incentives for energy-effi cient building. The range of energy and resource effi ciency policies and technologies in Europe/Germany illustrates the efforts towards decoupling economic growth from energy and resource use in the construction sector.
4.3 IMPACT OF VARIOUS POLICY INTERVENTIONS ON DECOUPLING Based on a policy paper on decoupling economic growth from resource consumption by Hennicke et al. (2014), the key activities for the decoupling process, which can be driven by policies and measures, are listed in Table 9. The Table also illustrates how they might be further adapted and developed in the context of the buildings and construction sector in India, detailing their barriers, key actors involved, and how they are dealt with in Europe/Germany.
The Table shows that supportive policies do exist in India, but that they are either voluntary or limited to specifi c sectors or building types (see policy brief 1 for more detail on policies in India). The barriers listed are some of the underlying reasons or they are the ones that hinder the success of policy implementation. Key actors and stakeholders have also been identifi ed. Comparing Indian and European/German experience for the same activities, it can be seen that the latter’s policies are stronger, address a wider scope and take a long-term planning approach. Some lessons can be learnt from the experience and used to improve policies in the buildings and construction sector; not only the success stories but also the development process holds valuable learning potential. In Europe, some of the EU Member States are still struggling to achieve the stringent targets set. Refurbishing existing buildings to nearly zero-energy buildings (NZEB) as per the target of the Energy Performance for Buildings Directive (EPBD) is still a challenge due to the issue of cost effi ciency. The EPC database is available but access to it (e.g. in Germany and Austria) is only allowed for experts

Table 9: Decoupling gaps and international lessons
Setting realistic targets and developing indicatorsLong term targets, indicators monitor progress and the distance to targets
Existing policies and initiatives in India Key stakeholders
• National Action Plan on Climate Change, 12th fi ve-year plan (2012–2017)
• Energy Conservation Action Plan• National Electricity Policy• ECO III – Municipal Energy Effi ciency Programme• National Mission on Sustainable Habitat (NMSH)• Appliance MEPS and labelling programme
• Central and state ministries• Municipal authorities
Gaps
• Lack of cohesive national policy/directive on energy consumption in buildings
European/German experience
• EU’s Energy Performance Building Directive (EPBD) as a tool to transition to nearly zero-energy buildings (NZEBs) within a specifi ed time limit
• EU’s Ecodesign Directive (MEPS) designed to increase effi ciency of appliances• Germany’s Energy Conservation Regulations (EnEV) make it mandatory for every new residential
and non-residential building to adhere to specifi ed energy consumption limits and possess an energy performance certifi cate indicating its energy consumption
• Germany’s Resource Effi ciency programme (ProgRess), adopted by the Federal Environment Ministry (BMUB) in 2012, to make the extraction and use of natural resources more sustainable and reduce associated environmental pollution as far as possible.
40
who are directly involved and occasionally for policy-makers and researchers working on specifi c projects. This limits transparency and the efforts to create energy effi ciency awareness (ADENE, 2015). Table 9 shows gaps in decoupling in the buildings and construction sector in India and some international examples of good practice that address those gaps.
4 EUROPEAN/GERMAN POLICY EXPERIENCE IS ENCOURAGING FOR DECOUPLING

Scenario analysis on the macroeconomic impacts of decoupling in buildings
Existing policies and initiatives in India Key stakeholders
• A handful of studies on the energy-saving potential of energy-effi cient and green buildings
• NITI Aayog’s India Energy Security Scenarios 2047, for example
• Research institutes such as policy think tanks, centres for development studies etc.
• Ministry of Statistics And Programme Implementation• NITI Aayog• MoP, MNRE, MoUD, etc.
Gaps
• No comprehensive studies/scenario analysis considering the impacts of decoupling, due to lack of data availability, specifi c targets and indicators
European/German experience
• Macroeconomic modelling on resource effi cincy in Europe• The following factors are being considered while conducting the macroeconomic research in Europe:
• various studies on rebound effect exists• spillover effects of reducing material inputs• technology and resource prices and their substitution• lifestyle changes
Development and use of indicators showing energy and resource-effi cient economy Indicators – energy use in various buildings, resource and material use along the production chain and carbon, land and water footprint
Existing policies and initiatives in India Key stakeholders
• Voluntary measurement and recording • Post-occupancy evaluation of buildings certifi ed under
schemes such as GRIHA and LEED
• Research institutes such as National Environmental Engineering Research Institute (NEERI), Central Building Research Institute (CBRI)
• Statistical and economic institutes• Green building rating bodies
Gaps
• Lack of priority indicators in terms of resource criticality and pollutants• No comprehensive qualitative and quantitative directory on buildings, construction materials• Not enough detailed studies on by how much building construction stimulates the economy
European/German experience
• Energy performance certifi cate database (EPC), for example, providing information on use of energy by buildings (but this involves a data protection issue)
• TABULA-EPSICOPE database provides chronological building typologies and energy consumption of buildings across Europe in the last century. Such a database helps map consumption and develop reliable effi ciency scenarios.
• ODYSSEE MURE project supported by Intelligent Energy Europe provides comprehensive monitoring of energy consumption and effi ciency trends as well as an evaluation of energy effi ciency policy measures by sector for EU countries and Norway.
• EUROSTAT, provider of statistics at European level, consolidates the data and ensures they are comparable, using harmonized methodology. Eurostat does not collect data. This is done in Member States by their statistical authorities.
• Energy Effi ciency Watch 3 project (EEW3) facilitates implementation of the Energy Effi ciency Directive (EED) across the EU and provides a constant feedback loop on the implementation of European and national energy effi ciency policies.
41

Establishing an institutional setting for RD&D
Existing policies and initiatives in India Key stakeholders
• R&D on alternative building materials by the Building Materials and Technology Promotion Council (BMTPC), CBRI etc.
• Department of Science and Technology, Government of India, under the Clean Energy Research Initiative (CERI), plans to initiate a programme to support research and development in the area of habitat energy effi ciency.
• IIT Delhi, Madras and Bombay working on low-emission and resource-effi cient cement
• Ministry of Science and Technology• Ministry of Environment• MoP, MNRE• International organizations• SMEs• Highly skilled workforce
Gaps
• There is a very little connection between innovation and incubation, i.e. the research does not always translate into market scale-up
European/German experience
• R&D at universities, demonstration of ultra-low energy buildings and Plus Energy house• Building envelope specifi cations for new and refurbished buildings have been scaled up and
adopted as benchmarks• Wide reach of Passivhaus standard• Intelligent Energy Europe has offered a helping hand to organizations willing to improve energy
sustainability
Getting the prices right and phasing out environmentally harmful subsidiesInternalisation of external environmental costs
Existing policies and initiatives in India Key stakeholders
• Administered pricing mechanism (APM) in April 2002 – 12th FYP
• Environmental tax-12th FYP• Renewable energy is growing but coal is still a major
source of energy
• Ministry of Environment and Forests• Ministry of Power
Gaps
• Unfulfi lled potential and limited adoption of renewables and good practices
European/German experience
• There are no energy subsidies, except up to some thresholds for some energy-intensive industries. • Average monthly household power bill in Germany is 0.34 EUR/kWh, which is higher than in the
U.S.A. (0.12EUR/KWh) but total monthly electricity bills are similar. This indicates that higher tariffs encourage customers to use less energy.
42

High-impact policies on recycling and use of secondary raw materials Ensure strong regulatory mechanisms for internalising principles of reduce, reuse, recycle
Existing policies and initiatives in India Key stakeholders
• Construction and Demolition Waste Management Rules, 2016
• Fly Ash Notifi cation, 1999 and amendments
• Component manufacturers • Construction companies• Civil society• Owners
Gaps
• Lack of information and skills• Most recycling takes place in the informal sector• No provision on deconstruction in the C&D waste rules• Limited buying and selling of energy-effi cient technologies and environmentally friendly products• Weak incentives for effi cient alternatives• Voluntary nature of these certifi cations attracts the attention of very few builders
European/German experience
• Support for the circular economy concept and focus on waste as a resource (remanufacturing, re-use, repair, and waste to energy)
• Extended producer responsibility (EPR)
Promoting new energy and resource-effi cient business models Brings about a change from a linear-economy approach (business models focused on selling high quantities) to a circular-economy approach (business models focusing on interactions between producers and customers)
Existing policies and initiatives in India Key stakeholders
• Linear economy• Limited buying and selling of energy-effi cient
technologies and environmentally friendly products• Energy-effi cient and green building certifi cations –
Energy Star, GRIHA, LEED
• Property development companies• Component manufacturers• Investors and owners
Gaps
• Less connection between innovation and incubation, i.e. the research does not always translate into market scale-up
• Weak incentives for effi cient alternatives• Voluntary nature of these certifi cations attracts the attention of very few builders
European/German experience
• Higher energy costs encourage customers to buy energy-effi cient products• Feed-in tariffs in Germany• Take-back schemes for the products. Incentives to compensate upfront costs.• DGNB, LEED, HQE etc. Financial incentives encourage investors and owners to build energy-
effi cient and green buildings
43
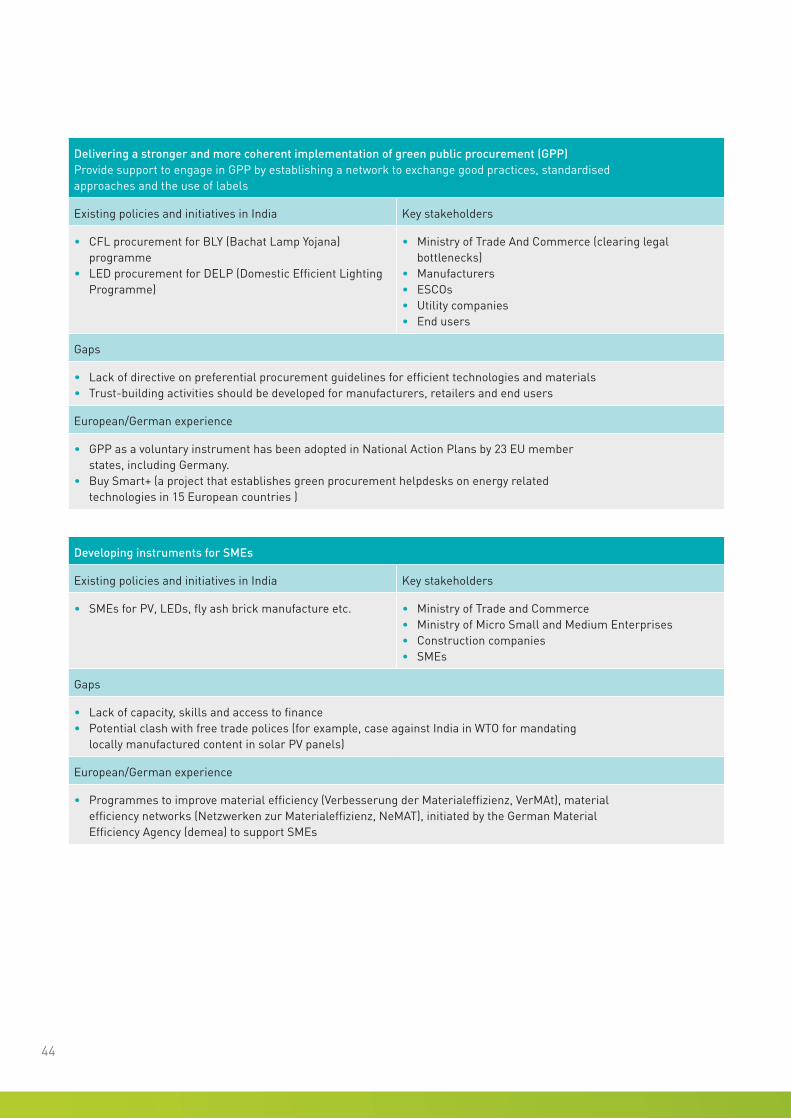
Delivering a stronger and more coherent implementation of green public procurement (GPP) Provide support to engage in GPP by establishing a network to exchange good practices, standardised approaches and the use of labels
Existing policies and initiatives in India Key stakeholders
• CFL procurement for BLY (Bachat Lamp Yojana) programme
• LED procurement for DELP (Domestic Effi cient Lighting Programme)
• Ministry of Trade And Commerce (clearing legal bottlenecks)
• Manufacturers• ESCOs• Utility companies• End users
Gaps
• Lack of directive on preferential procurement guidelines for effi cient technologies and materials• Trust-building activities should be developed for manufacturers, retailers and end users
European/German experience
• GPP as a voluntary instrument has been adopted in National Action Plans by 23 EU member states, including Germany.
• Buy Smart+ (a project that establishes green procurement helpdesks on energy related technologies in 15 European countries )
Developing instruments for SMEs
Existing policies and initiatives in India Key stakeholders
• SMEs for PV, LEDs, fl y ash brick manufacture etc. • Ministry of Trade and Commerce• Ministry of Micro Small and Medium Enterprises• Construction companies • SMEs
Gaps
• Lack of capacity, skills and access to fi nance• Potential clash with free trade polices (for example, case against India in WTO for mandating
locally manufactured content in solar PV panels)
European/German experience
• Programmes to improve material effi ciency (Verbesserung der Materialeffi zienz, VerMAt), material effi ciency networks (Netzwerken zur Materialeffi zienz, NeMAT), initiated by the German Material Effi ciency Agency (demea) to support SMEs
44

Supporting employment and skills on the ground – institutional framework and capacities to implement building regulations and regulations related to SMEs manufacturing building materials
Existing policies and initiatives in India Key stakeholders
• Construction Skills Development Council provides training
• Industrial training institutes (ITIs)• Polytechnics
• MHRD• Property development companies• Workers• Local governments
Gaps
• Skilled labour defi cit plagues virtually every major economic sector in India• Lack of capacity building activities for construction workers and technicians who actually build and
operate buildings, training them on using and working with effi cient technologies and materials
European/German experience
• The Federal Institute for Vocational Education and Training (BIBB)• The German Trade Union Confederation (DGB) and the German Employers’ Organisation
for Vocational Training • The construction workforce is trained to understand and handle effi cient building technologies
such as installation of thermal insulation, thermal bridging, renewable technologies, highly effi cient heating and cooling systems etc.
Guiding the fi nancial sector to enable the transition
Existing policies and initiatives in India Key stakeholders
• Financial incentives for certifi ed buildings – but the focus is on large-scale construction, for example KfW Development Bank’s refi nancing programme and the National Housing Bank’s (NHB) programme on energy- effi cient residences
• Financial incentives leveraging international agreements such as Bachat Lamp Yojana
• Government ministries such as MoHUD, MNRE, etc.• Non-banking fi nancial corporations such as National
Housing Bank• Banks• Investors and owners• Financial regulators
Gaps
• More incentives needed for small players
European/German experience
• KfW, a state-owned bank, provides capital at low interest rates to building investors who wish to increase their building’s energy performance.
• Federal Offi ce for Economic Affairs and Export Control (BAFA) • Energy Effi ciency Fund
Source: Authors’ analysis
45

46
5 CONCLUSIONS
Despite persistent demand and short supply of energy, and the high reliance on coal-based thermal power plants, the overall energy intensity in India has been declining gradually over the years and is estimated to be 0.62 kgoe /US$ in 2011 compared to 1.09 kgoe/US$ in 1981. This is partly due to the fact that renewables’ share has increased, production effi ciency has been stepped up and the country has seen sustained GDP growth (Planning Commission, 2013). However, absolute resource and energy consumption, as well as the environmental impacts associated with that, are on the rise. Various bottom-up analyses show that reducing primary resource and energy consumption in buildings is possible using alternative materials and technologies and renewable energy technologies. However, it has been noticed that only a few policies have well-defi ned targets. Most often policies are only seen as catalysts for change instead of as a process that guides the entire reaction. An effective policy evaluation mechanism needs to be developed for every policy measure.
The idea of weak (relative) decoupling argues for decreasing the share of fossil fuel and nuclear-based energy and increasing the share of renewables in the primary energy mix. However, in the case of India, both shares are set to keep on increasing for at least the next two decades. To enable decoupling
in the buildings and construction sector in the operational phase, it is vital to increase the share of renewable energy technologies at individual building (neighbourhood or community) level in the short term, which is a bottom-up approach. However, the country appears to be giving equal priority to increasing the share of renewables in the utility mix, which is a top-down approach.
It is absolutely crucial that energy (cost) savings derived from dedicated energy conservation measures (ECMs), demand-side management (DSM) programmes and ESCO contracts translate into long-term bonds and are not converted into short-term monetary savings, which are lost in the rebound effects. Analogous to ‘cess’ collected, energy savings that result from various dedicated energy effi ciency programmes should be accounted for and used to provide better and equitable energy services.
In the short term, it is essential that alternative materials be deployed on a large scale as soon as possible during the construction phase. This requires scaling-up measures, involvement of SMEs and skills development initiatives. In the long run, construction activity should become less dependent on virgin resources and should focus on recycling technologies.

47
It should be noted that the various policy initiatives that have had a high impact in one target sector have not necessarily produced the same results in other target sectors. For example, regulation has been very effective in the lighting and AC sector, while it has done precious little in the sand and soil sector. There are a wide variety of reasons for this. For example, regulation in the AC industry is strongly supported by a cohesive transparency and information campaign, incentives and BAT promotion. Such a vigorous approach is clearly absent when it comes to promoting alternatives for sand and brick. This can be clearly attributed to the visibility of the indicators against which the impacts are measured. While the former affects energy consumption, which is clearly visible, the effects of the latter are varied and cannot be directly accounted for. The environmental impact of construction activity should be made more accountable by developing appropriate indicators similar to those for energy consumption. It is unclear at this stage whether a decrease in resource use results in shrinking growth and whether switching to effi cient resources results in sustained growth. Only once sets of reliable indicators have been established, will decoupling be able to act as a yardstick for policy implementation.

BIBLIOGRAPHY
Aden, N. (2016, April). The Roads to Decoupling: 21 Countries are Reducing Carbon Emissions While Growing GDP. Retrieved 27 April 2016 from World Resources Institute: http://www.wri.org/blog/2016/04/roads-decoupling-21-countries-are-reducing-carbon-emissions-while-growing-gdp
ADENE. (2015). 2016 Implementing the Energy Performance of Building Directive (EPBD): Featuring country reports. Lisbon: Concerted Action Energy Performance of Buildings.
Aggregates Business Europe. (2013). Booming Indian aggregates market. From www.aggbusiness.com: http://www.aggbusiness.com/sections/market-reports/features/booming-indian-aggregates-market/
Andreoni, V., & Galmarini, S. (2012). Decoupling economic growth from carbon dioxide emissions: A decomposition analysis of Italian energy consumption. Energy (44), 682-691.
BEE. (2015). Bureau of Energy Effi ciency. Retrieved January 2016 from https://beeindia.gov.in/content/bachat-lamp-yojana-bly-0
Bhargava, Y. (2014). India has second fastest growing services sector. Retrieved 2 February 2016 from The Hindu: http://www.thehindu.com/business/budget/india-has-second-fastest-growing-services-sector/article6193500.ece
BMUB. (2015). German Resource Effi ciency Programme (ProgRess): Programme for the sustainable use and conservation of natural resources. Federal Ministry for the Environment, Nature Conservation, Building and Nuclear Safety (BMUB).
CAG. (2015). Report of the Comptroller and Auditor General of India on Renewable Energy Sector in India. Ministry of New and Renewable Energy. New Delhi: Ministry of New and Renewable Energy, GOI.
CEA. (2014). Load Generation Balance Report 2014–15. Central Electricity Authority, New Delhi.
CEA. (2015). Executive Summary Power Sector August 15. Central Electricity Authority. New Delhi: CEA. Retrieved 5 February 2016 from: http://cea.nic.in/reports/monthly/executivesummary/2015/exe_summary-08.pdf
Central Electricity Authority. (2015). Report on fl y ash generation at coal/lignite based thermal power stations and its utilization in the country for the year 2014–15.
CIA. (2016). Cia.gov. Retrieved March 2016 from The World Factbook: https://www.cia.gov/library/publications/the-world-factbook/fields/2012.html
Climate Works Foundation. (2010). Reducing GHG Emissions in the Building Sector in India: A Strategy Paper. New Delhi: Climate Works Foundation.
CSE, (2014). Making sense of green building rating. [online] New Delhi: Centre for Science and Environment, p.2. Retrieved 4 January 2016 from: http://www.cseindia.org/userfiles/Making%20sense%20of%20green%20building%20rating.pdf.
CSO. (2015). Energy Statistics 2015. Central Statistics Offi ce, Ministry of Statistics and Programme Implementation. New Delhi: 22.
Darko, E., Nagrath, K., Niaizi, Z., Scott, A., Varsha, D., & Vijaya Lakshmi, K. (2013). Green building: case study. ODI.
Diakoulaki, D., & Mandaraka, M. (2007). Decomposition analysis for assessing the progress in decoupling industrial growth from CO2 emissions in the EU manufacturing sector. Energy Economics, 4 (29), 636–664.
EC. (2016). Ecodesign. Retrieved 2 March 2016 from European Commission. Growth: Internal Market, Industry, Entrepreneurship and SMEs: http://ec.europa.eu/growth/industry/sustainability/ecodesign/index_en.htm
ECON. (2015, 22 October). Decoupling of economic growth from conventional energy consumption and GHG emissions. Retrieved February 2016 from https://eu.boell.org/sites/default/files/diw_econ_hbs_brussels_decoupling_v1.0_tohbs.pdf
ElectronicsB2B. (2015). A close look at India’s LED imports and exports – ElectronicsB2B. Retrieved 14 March 2016 from: http://electronicsb2b.efytimes.com/close-look-indias-led-imports-exports/
Eurostat. (2016, 15 February). Renewable energy statistics. Retrieved 25 April 2016 from Eurostat: Statistics Explained: http://ec.europa.eu/eurostat/statistics-explained/index.php/Renewable_energy_statistics
FlyashBricksDelhi. (2010, 16 April). Fly Ash Brick Performance. From www.fl yashbricksdelhi.com: http://www.flyashbricksdelhi.com/Fly-Ash-Bricks-India/Fly-Ash-Brick-Performance
Fritsche, U., & Greß, H.-W. (2015). Development of the Primary Energy Factor of Electricity Generation in the EU-28 from 2010–2013. International Institute for Sustainability Analysis and Strategy, Darmstadt.
GRIHA. (2015). GRIHA V – 2015 Abridged Document. New Delhi: GRIHA Council and The Energy and Resources Institute.
Heinen, S. (2013, 10 April). Analyzing Energy Use with Decomposition Methods. Retrieved 21 February 2016 from International Energy Agency: www.iea.org/media/training/presentations/Day_3_Session_12_Indicators_Decomposition_Methods.pdf
IGEP. (2013). India‘s Future Needs for Resources: Dimensions, Challenges and Possible Solutions. IFEU, TERI, Dittrich, M., SERI, Wuppertal Institute, GIZ.
Khanna, P. (2011). Material and Technology – An inventory of select materials and technologies for building construction. New Delhi: Development Alternatives Group.
Kreislaufwirtschaft Bau. (2013). Mineralische Bauabfälle Monitoring 2010: Bericht zum Aufkommen und zum Verbleib mineralischer Bauabfälle im Jahr 2010. Kreislaufwirtschaft Bau c/o Bundesverband Baustoffe – Stein und Erden e.V. Berlin.
Ministry of Mines. (2015). Annual report 2014–2015. Government of India.
MNRE. (2014). Ministry of New and Renewable Energy, GOI. Retrieved 12 March 2016 from http://mnre.gov.in/file-manager/UserFiles/State-wise-number-of-CST-based-project-supported-under-UNDP-GEF-CSHP.pdf
MoP. (2016). National Ujala Dashboard. Retrieved 12 February 2016 from http://www.delp.in/
Mulder, P., & de Groot, H. (2004). Decoupling Economic Growth and Energy Use. Tinbergen Institute. Tinbergen Institute Amsterdam.
MutuKrishnan, A. (2012, 19–20 June). Green Building Movement in India: Trends & Opportunities. Stuttgart, Germany.
NABARD. (2016). NABARD. Retrieved January 2016 from https://www.nabard.org/english/installation_of_solar.aspx
O.C., A. K., & Ramzan, D. C. (2016). Social, Economic and Environmental Effect of Sand Mining. The International Journal of Humanities and Social Studies, 4 (1).
OECD and IEA. (2015). India Energy Outlook: World Energy Outlook Special Report. International Energy Agency.
Pales, A. F., & West, K. (2014). CHP/DC Country Scorecard: India. International Energy Agency. OECD/IEA.
PE International. (2013). Topical Paper 2: Strategies for decoupling – options to consider in the fi eld of buildings and infrastructure. European Commission.
Pearce, F. (2016). Is it possible to reduce CO2 emissions and grow the global economy? Retrieved 20 April 2016 from The Guardian: http://www.theguardian.com/environment/2016/apr/14/is-it-possible-to-reduce-co2-emissions-and-grow-the-global-economy
Planning Commission. (2012). Twelfth Five Year Plan Volume 2.

Planning Commission. (2013). Twelfth Five Year Plan (2012–2017) Economic Sectors. Planning Commission, Government of India. New Delhi: SAGE Publications India Pvt Ltd.
Planning Commission. (2014). The Final Report of the Expert Group on Low Carbon Strategies for Inclusive growth. Planning Commission, New Delhi.
Planning Commission. India Energy Security Scenarios, 2047: User Guide for Residential Lighting and Appliances India Energy Security Scenario 2047. Planning Commission.
PTI. (2015, 3 December). India crosses 5 GW-mark for solar installations: Study. The Economic Times.
PWC. (2013). Decarbonisation and the Economy: An empirical analysis of the economic impact of energy and climate change policies in Denmark, Sweden, Germany, UK and the Netherlands.
Shukla, R. (2014). Burnt Clay Bricks Versus Autoclaved Aerated Concrete Blocks. International Journal of Engineering Research & Technology, 3 (11).
Singhal, A. (2014). Status and Scope of Solar Cooling in India. Sun Focus, 4, 8.
Talakonukula, R., Prakash, R., & Shukla, K. K. (2013). Life Cycle Energy Analysis of a Multifamily Residential House: A Case Study in Indian Context. Open Journal of Energy Effi ciency (2), 31–41.
The Hindu. (2015, 28 March). More use of M-Sand may stabilise cost of river sand: experts. From www.thehindu.com: http://www.thehindu.com/news/cities/bangalore/more-use-of-msand-may-stabilise-cost-of-river-sand-experts/article7042960.ece
UNEP. (2014). Decoupling 2: Technologies, opportunities and policy options. A Report of the Working Group on Decoupling to the International Resource Panel. von Weizsäcker, E.U., de Larderel, J, Hargroves, K., Hudson, C., Smith, M., Rodrigues, M.
Urge-Vorsatz et al. (2012). Best Practice Policies for Low Energy and Carbon Buildings. A Scenario Analysis. Research Report Prepared by the Center for Climate Change and Sustainable Policy (3CSEP) for the Global Buildings Performance Network.
USAID ECO-III Project. (2010). Energy assessment guide for commercial buildings. International Resources Group. New Delhi: 2.

50
ANNEX
Table 10: Comparison of decoupling studies from the literature
Study Mulder and de Groot Andreoni and Galmarini Diakoulaki and Mandaraka
Investigation
The extent to which technology-driven improvements in energy and labour productivity performance contribute to decoupling of economic growth from environmental pressure
To assess trends in decoupling between economic growth from CO2 emissions
To assess the progress in decoupling industrial growth from CO2 emissions
Area of study 14 OECD countries Italy European Union
Sectors 10 manufacturing sectors 5 main economic sectors Key manufacturing sectors
Period of study 1970–1997 1998–2006 1990–2003
Data sources
Energy data published by IEA Economic data from by ISDB and STAN published by OECD
Italian National Institute of Statistics (ISTAT) and EurostatNational energy accounts
OECD Energy Balances (IEA, 2005) Average IEA emission factors Groningen Growth and Development Centre Database
Factors
Technology productivityLabour productivity
Emission intensityEnergy intensityOverall economic activity Sectoral share in overall economic activity
Industrial outputEnergy intensityStructureFuel mix Utility mix
Growth indicatorGross domestic product (GDP) Gross domestic product (GDP) Total value added from
manufacturing
Intensity indicators
CO2 CO2 Energy-related CO2
Conclusions and observations
Technology-driven productivity growth stimulates decoupling Increase in energy productivity leads to increase in labour productivity
No improvement in energy intensity Improvement in CO2 emission intensity This improvement has been attributed to the increasing number of energy policies intended to promote the use of renewable energy and abatement technologies.
Strong decoupling linked to a reduction in the manufacturing energy intensity and a shift towards other less energy intensive economic sectors. Fuel shifts in the utility mix have strongly contributed to decoupling compared to fuel shifts in the industry energy mix.

51
Table 11: Absolute decoupling metrics in 21 countries
Change in CO2 (2000–2014) %
Change in CO2 (2000–2014) Mt
Change in real GDP (2000–2014)
Change in industry’s share in GDP (2000–2013)
Austria -3 % -2 21 % -3 %
Belgium -12 % -20 21 % -6 %
Bulgaria -5 % -2 62 % 2 %
Czech Republic -14 % -18 40 % -0.3 %
Denmark -30 % -17 8 % -5 %
Finland -18 % -11 18 % -9 %
France -19 % -83 16 % -4 %
Germany -12 % -106 16 % -1 %
Hungary -24 % -14 29 % -2 %
Ireland -16 % -7 47 % -9 %
Netherlands -8 % -19 15 % -3 %
Portugal -23 % -16 1 % -6%
Romania -22 % -21 65 % -1 %
Slovakia -22 % -9 75 % -3 %
Spain -14 % -48 20 % -8 %
Sweden -8 % -5 31 % -4 %
Switzerland -10 % -4 28 % -0.3 %
Ukraine -29 % -99 49 % -10 %
United Kingdom -20 % -120 27 % -6 %
United States -6 % -382 28 % -3 %
Uzbekistan -2 % -2 28 % 10 %
52
RESEARCH TEAM
THE SOCIETY FOR TECHNOLOGY AND ACTION FOR RURAL ADVANCEMENT (TARA)Vaibhav RathiRohan JainPratibha Ruth CalebZeenat Niazi
CONTACT DETAILS
Development AlternativesB-32, Tara Crescent, Qutub Institutional Area New Delhi – 110 016, IndiaT +91 (11) 2656 4444, 2654 4100, F +91 (11) 2685 1158
[email protected]://www.devalt.org
ABOUT DEVELOPMENT ALTERNATIVES GROUP
Development Alternatives (DA), the world’s fi rst social enterprise dedicated to sustainable development, is a research and action organisation striving to deliver socially equitable, environmentally sound and economically scalable development outcomes. Established in 1982 and headquartered in New Delhi, the DA Group pioneered the concept of business-like approaches to eradicating poverty and conserving the natural resource base on which human development depends. The Society for Technology & Action for Rural Advancement (TARA) is a social enterprise set up in the year 1985 at New Delhi, India. It is an “incubation engine” of the Development Alternatives Group which has been providing development solutions in India and elsewhere.

3
WUPPERTAL INSTITUTE
Sriraj GokarakondaDr Shritu ShresthaKilian ToppDr Stefan Thomas
CONTACT DETAILS
Wuppertal Institute for Climate, Environment and EnergyDöppersberg 19 42103 Wuppertal, Germany T +49 202 2492-0F +49 202 2492-108
[email protected]://www.wupperinst.org
ABOUT WUPPERTAL INSTITUTE
The Wuppertal Institute undertakes research and develops models, strategies and instruments for transitions to sustainable development at local, national and international level. Sustainability research at the Wuppertal Institute focuses on the challenges connected with resources, climate and energy and their relation to economy and society. Special emphasis is put on analysing and stimulating innovations that decouple economic growth and wealth from natural resource use.

Copyright © 2022 FDOKUMEN