Decision-making in abstract trust games: A user interface perspective
7
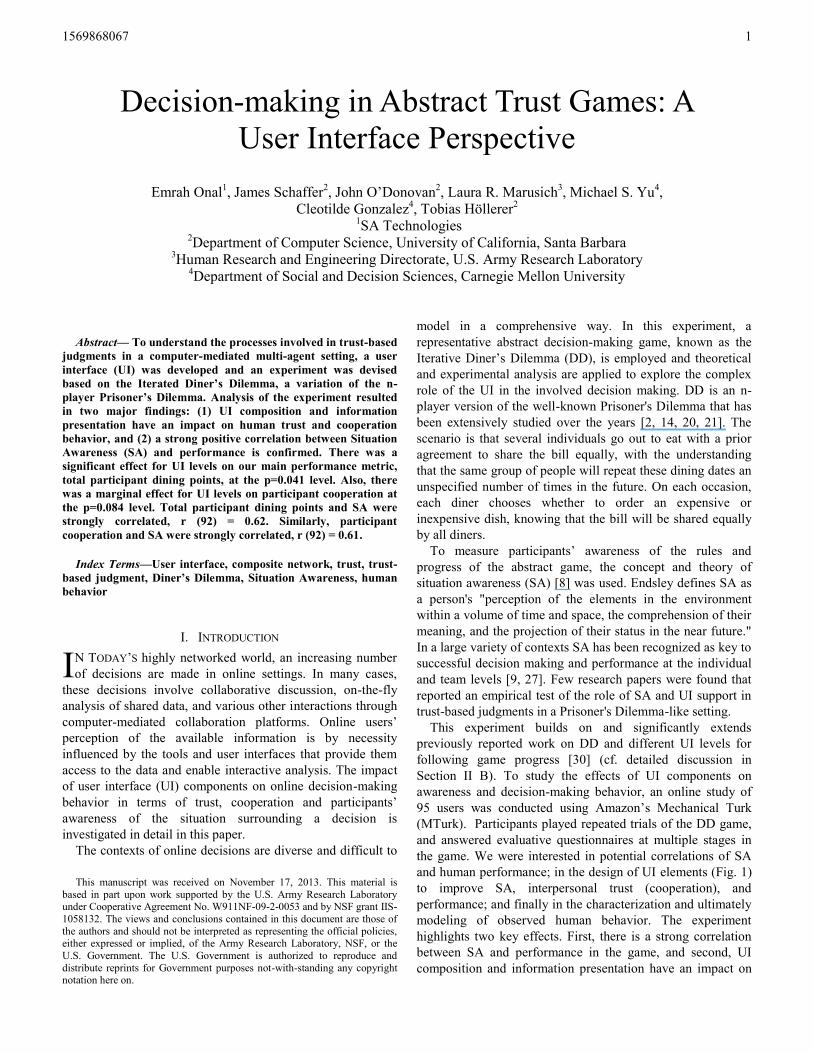
1569868067 1 Abstract— To understand the processes involved in trust-based judgments in a computer-mediated multi-agent setting, a user interface (UI) was developed and an experiment was devised based on the Iterated Diner’s Dilemma, a variation of the n- player Prisoner’s Dilemma. Analysis of the experiment resulted in two major findings: (1) UI composition and information presentation have an impact on human trust and cooperation behavior, and (2) a strong positive correlation between Situation Awareness (SA) and performance is confirmed. There was a significant effect for UI levels on our main performance metric, total participant dining points, at the p=0.041 level. Also, there was a marginal effect for UI levels on participant cooperation at the p=0.084 level. Total participant dining points and SA were strongly correlated, r (92) = 0.62. Similarly, participant cooperation and SA were strongly correlated, r (92) = 0.61. Index Terms—User interface, composite network, trust, trust- based judgment, Diner’s Dilemma, Situation Awareness, human behavior I. INTRODUCTION N TODAY’S highly networked world, an increasing number of decisions are made in online settings. In many cases, these decisions involve collaborative discussion, on-the-fly analysis of shared data, and various other interactions through computer-mediated collaboration platforms. Online users’ perception of the available information is by necessity influenced by the tools and user interfaces that provide them access to the data and enable interactive analysis. The impact of user interface (UI) components on online decision-making behavior in terms of trust, cooperation and participants’ awareness of the situation surrounding a decision is investigated in detail in this paper. The contexts of online decisions are diverse and difficult to This manuscript was received on November 17, 2013. This material is based in part upon work supported by the U.S. Army Research Laboratory under Cooperative Agreement No. W911NF-09-2-0053 and by NSF grant IIS- 1058132. The views and conclusions contained in this document are those of the authors and should not be interpreted as representing the official policies, either expressed or implied, of the Army Research Laboratory, NSF, or the U.S. Government. The U.S. Government is authorized to reproduce and distribute reprints for Government purposes not-with-standing any copyright notation here on. model in a comprehensive way. In this experiment, a representative abstract decision-making game, known as the Iterative Diner’s Dilemma (DD), is employed and theoretical and experimental analysis are applied to explore the complex role of the UI in the involved decision making. DD is an n- player version of the well-known Prisoner's Dilemma that has been extensively studied over the years [2, 14, 20, 21]. The scenario is that several individuals go out to eat with a prior agreement to share the bill equally, with the understanding that the same group of people will repeat these dining dates an unspecified number of times in the future. On each occasion, each diner chooses whether to order an expensive or inexpensive dish, knowing that the bill will be shared equally by all diners. To measure participants’ awareness of the rules and progress of the abstract game, the concept and theory of situation awareness (SA) [8] was used. Endsley defines SA as a person's "perception of the elements in the environment within a volume of time and space, the comprehension of their meaning, and the projection of their status in the near future." In a large variety of contexts SA has been recognized as key to successful decision making and performance at the individual and team levels [9, 27]. Few research papers were found that reported an empirical test of the role of SA and UI support in trust-based judgments in a Prisoner's Dilemma-like setting. This experiment builds on and significantly extends previously reported work on DD and different UI levels for following game progress [30] (cf. detailed discussion in Section II B). To study the effects of UI components on awareness and decision-making behavior, an online study of 95 users was conducted using Amazon’s Mechanical Turk (MTurk). Participants played repeated trials of the DD game, and answered evaluative questionnaires at multiple stages in the game. We were interested in potential correlations of SA and human performance; in the design of UI elements (Fig. 1) to improve SA, interpersonal trust (cooperation), and performance; and finally in the characterization and ultimately modeling of observed human behavior. The experiment highlights two key effects. First, there is a strong correlation between SA and performance in the game, and second, UI composition and information presentation have an impact on Decision-making in Abstract Trust Games: A User Interface Perspective Emrah Onal 1 , James Schaffer 2 , John O’Donovan 2 , Laura R. Marusich 3 , Michael S. Yu 4 , Cleotilde Gonzalez 4 , Tobias Höllerer 2 1 SA Technologies 2 Department of Computer Science, University of California, Santa Barbara 3 Human Research and Engineering Directorate, U.S. Army Research Laboratory 4 Department of Social and Decision Sciences, Carnegie Mellon University I
-
Upload
independent -
Category
Documents
-
view
0 -
download
0
Transcript of Decision-making in abstract trust games: A user interface perspective
1569868067 1
Abstract— To understand the processes involved in trust-based
judgments in a computer-mediated multi-agent setting, a user
interface (UI) was developed and an experiment was devised
based on the Iterated Diner’s Dilemma, a variation of the n-
player Prisoner’s Dilemma. Analysis of the experiment resulted
in two major findings: (1) UI composition and information
presentation have an impact on human trust and cooperation
behavior, and (2) a strong positive correlation between Situation
Awareness (SA) and performance is confirmed. There was a
significant effect for UI levels on our main performance metric,
total participant dining points, at the p=0.041 level. Also, there
was a marginal effect for UI levels on participant cooperation at
the p=0.084 level. Total participant dining points and SA were
strongly correlated, r (92) = 0.62. Similarly, participant
cooperation and SA were strongly correlated, r (92) = 0.61.
Index Terms—User interface, composite network, trust, trust-
based judgment, Diner’s Dilemma, Situation Awareness, human
behavior
I. INTRODUCTION
N TODAY’S highly networked world, an increasing number
of decisions are made in online settings. In many cases,
these decisions involve collaborative discussion, on-the-fly
analysis of shared data, and various other interactions through
computer-mediated collaboration platforms. Online users’
perception of the available information is by necessity
influenced by the tools and user interfaces that provide them
access to the data and enable interactive analysis. The impact
of user interface (UI) components on online decision-making
behavior in terms of trust, cooperation and participants’
awareness of the situation surrounding a decision is
investigated in detail in this paper.
The contexts of online decisions are diverse and difficult to
This manuscript was received on November 17, 2013. This material is
based in part upon work supported by the U.S. Army Research Laboratory under Cooperative Agreement No. W911NF-09-2-0053 and by NSF grant IIS-
1058132. The views and conclusions contained in this document are those of
the authors and should not be interpreted as representing the official policies, either expressed or implied, of the Army Research Laboratory, NSF, or the
U.S. Government. The U.S. Government is authorized to reproduce and
distribute reprints for Government purposes not-with-standing any copyright notation here on.
model in a comprehensive way. In this experiment, a
representative abstract decision-making game, known as the
Iterative Diner’s Dilemma (DD), is employed and theoretical
and experimental analysis are applied to explore the complex
role of the UI in the involved decision making. DD is an n-
player version of the well-known Prisoner's Dilemma that has
been extensively studied over the years [2, 14, 20, 21]. The
scenario is that several individuals go out to eat with a prior
agreement to share the bill equally, with the understanding
that the same group of people will repeat these dining dates an
unspecified number of times in the future. On each occasion,
each diner chooses whether to order an expensive or
inexpensive dish, knowing that the bill will be shared equally
by all diners.
To measure participants’ awareness of the rules and
progress of the abstract game, the concept and theory of
situation awareness (SA) [8] was used. Endsley defines SA as
a person's "perception of the elements in the environment
within a volume of time and space, the comprehension of their
meaning, and the projection of their status in the near future."
In a large variety of contexts SA has been recognized as key to
successful decision making and performance at the individual
and team levels [9, 27]. Few research papers were found that
reported an empirical test of the role of SA and UI support in
trust-based judgments in a Prisoner's Dilemma-like setting.
This experiment builds on and significantly extends
previously reported work on DD and different UI levels for
following game progress [30] (cf. detailed discussion in
Section II B). To study the effects of UI components on
awareness and decision-making behavior, an online study of
95 users was conducted using Amazon’s Mechanical Turk
(MTurk). Participants played repeated trials of the DD game,
and answered evaluative questionnaires at multiple stages in
the game. We were interested in potential correlations of SA
and human performance; in the design of UI elements (Fig. 1)
to improve SA, interpersonal trust (cooperation), and
performance; and finally in the characterization and ultimately
modeling of observed human behavior. The experiment
highlights two key effects. First, there is a strong correlation
between SA and performance in the game, and second, UI
composition and information presentation have an impact on
Decision-making in Abstract Trust Games: A
User Interface Perspective
Emrah Onal1, James Schaffer
2, John O’Donovan
2, Laura R. Marusich
3, Michael S. Yu
4,
Cleotilde Gonzalez4, Tobias Höllerer
2
1SA Technologies
2Department of Computer Science, University of California, Santa Barbara
3Human Research and Engineering Directorate, U.S. Army Research Laboratory
4Department of Social and Decision Sciences, Carnegie Mellon University
I
1569868067 2
human trust and cooperation behavior. Human trust has many
contributing factors, making it difficult to define and model
[1], especially across contexts. The term ‘trust’ can describe
the user’s trust in a system as a whole or interpersonal trust
[25]. In our study, we are interested in interpersonal trust,
where the user has to trust other (in this case, simulated) co-
diners. We look at cooperation rate as a proxy for this
interpersonal trust.
II. BACKGROUND AND RELATED WORK
Related work for this research falls in two main areas:
general research on Intelligent Information Displays, including
their impact on SA at the cognitive level, and research on
Social Dilemmas, including recent research on trust and
awareness in the DD problem.
A. Information Displays, Situation Awareness, and Trust
Design of interactive information displays supporting SA is
a well-known challenge [9]. As discussed in the introduction,
very little is known regarding SA in groups involved in
situations of conflict. While higher SA is expected to result in
higher cooperation in productive team work [26, 27],
intuitively, the less information an "opponent" has, the better it
might be for our own good.
Gonzalez et al. [15, 22] studied the effect of varying four
different degrees of information on the tendency to cooperate
while playing the Prisoner’s Dilemma game. The findings
were that the amount of interdependence information exposed
to the participant was proportional to individual cooperation
and mutual cooperation, possibly driven by the awareness and
increased response to the partner's cooperation. Joint
performance and satisfaction were also generally higher for
pairs that had more information. Accordingly, we then expect
that higher levels of SA would result in higher levels of
cooperation and higher common benefits compared to lower
levels of SA.
B. Prisoner’s Dilemma and Diner’s Dilemma
The Prisoner’s Dilemma is a game used in economics and
psychology to study cooperation. The iterated form of the
Prisoner’s Dilemma has been used to study phenomena
ranging from military arms races [18] to the red queen
hypothesis in evolutionary biology [17, 24].
The Prisoner’s Dilemma has been translated to multiple
actors in two ways. In the public goods game, the benefits of
cooperation are spread amongst all players while the costs of
cooperation are borne individually. In DD, the costs of
defection are spread amongst all players while the benefits of
defection are rewarded individually. Although the public
goods game is well researched, DD has received less attention,
with the exception of the recent work by Teng et al. [30] that
is extended here. That work focused on the relationship
between behavior and awareness in DD, wherein a human
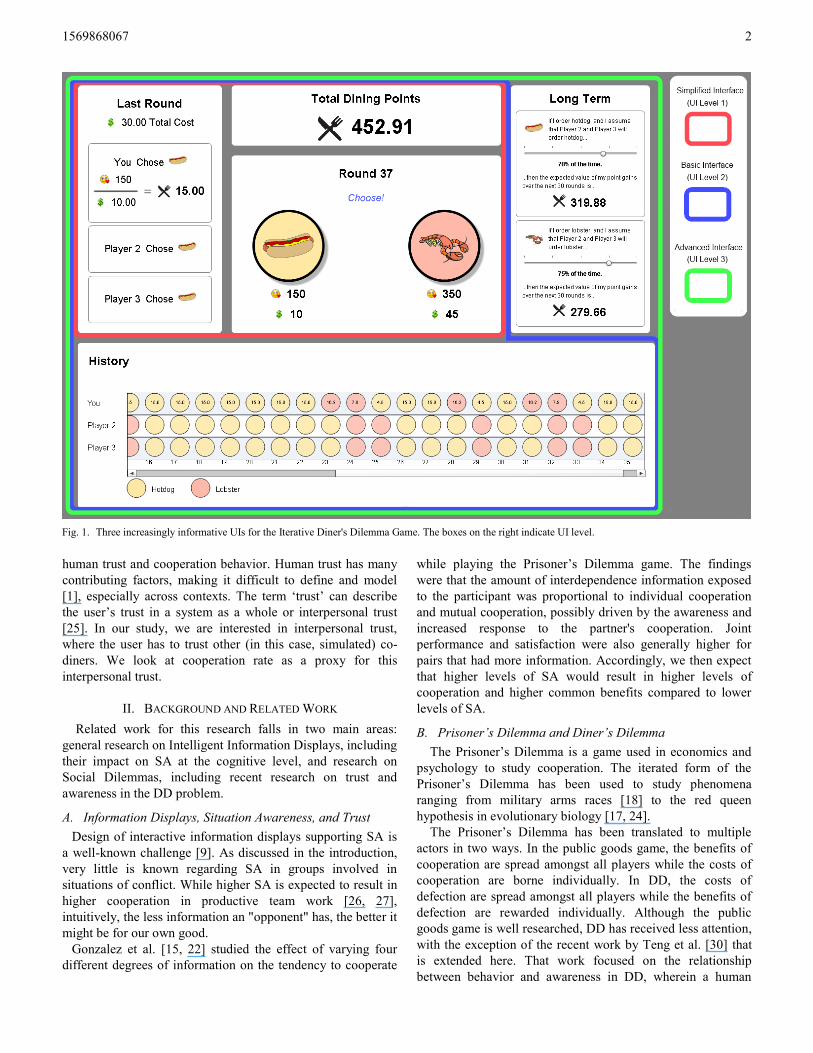
Fig. 1. Three increasingly informative UIs for the Iterative Diner's Dilemma Game. The boxes on the right indicate UI level.
1569868067 3
played repeated rounds of the game with two computer
opponents. Based on SA theory and design principles, the
authors developed three different UIs that were expected to
represent the information needed to support a specific SA
Level: perception (level 1 SA), comprehension (level 2 SA),
and projection (level 3 SA). Several Trust-related metrics were
also assessed, including percentage of cooperation over time
and subjective level of self-reported trust toward the
opponents. Our paper responds to and goes beyond Teng et
al.’s early study in the following ways:
1) Scale and Significance: Teng et al.’s experiment
comprised 24 participants resulting in limited significant
effects. Our experiment has 95 participants; as a result,
our tests had more power to detect significant effects.
2) Variables: In this experiment, the automated opponent
strategies are purposefully simplified, mitigating the
confounding effect of opponent strategy reported in Teng
et al..
3) User Interface: In Teng et al.’s work, the UI for the DD
game did not induce the desired level of awareness in the
game. We present and evaluate a new interactive UI that
addresses some of these game awareness issues (Fig. 1).
4) Measurement of Awareness: In this experiment, SA level
is explicitly measured through iterative Situation
Awareness Global Assessment Technique (SAGAT)
questionnaires [7] during user evaluations.
III. EXPERIMENT
A. Overview
A 5x3 between-subjects experiment was designed to
investigate the relationship between trust, SA, and UI
complexity. Participants played a web-based implementation
of DD against two simulated opponents, which were playing
tit-for-tat with five variations of cooperation and defection
parameters, described in the next section. To meet the
challenge of actively effecting a participant into a particular
SA level, three different UIs were designed that exposed
varying degrees and complexity of information, described in
Section D.
After logging in, participants completed a pre-study
questionnaire that collects some basic demographic and
expertise information, and required the user to answer three
screening questions to test their attention. They were then
directed to an interactive training session that explained the
game rules in detail over six hypothetical rounds. After the
training, if the participants were ready to continue, a 100-
round session of DD was started. SAGAT freezes occurred
after Round 50 and Round 90 of the game. When all rounds
were completed, the users were directed to a post-study
questionnaire where they provided feedback on the game and
the simulated opponents.
The user's goal was to maximize his or her 'Dining Points',
defined as the ratio of the food quality of the chosen meal
divided by the diner’s share of the bill. In each round, the
participant must weigh the pros and cons of selecting either
hot dog or lobster by assessing the cost/value tradeoffs
involved, the opponent behavior, and the long-term gain of a
chosen strategy. We ran a supervised pilot study with 8
participants to verify data collection and experimental
procedures before running the main experiment on the web
with MTurk participants.
B. Opponent Strategies and Payoff Matrix
The simulated opponents played simple variants of tit-for-
tat (TFT): a simple strategy in which the opponent makes the
same decision that the participant did on the previous round.
Two parameters were varied into five different configurations
between participants: the probability that the opponent
cooperates (order hot dog) given the player previously
cooperated, and the probability that the opponent defects
(order lobster) given the player previously defected -- (1) TFT
with 33% probability of forgiveness (TFT-1-0.67), (2) TFT
with 17% probability of forgiveness (TFT-1-0.83), (3) True
TFT (TFT-1-1), (4) TFT with 17% probability of defection
(TFT-0.83-1), and (5) TFT with 33% probability of defection
(TFT-0.67-1).
The opponent strategies, as well as the DD payoff matrix
were designed to be cooperation-encouraging, so that even at
high opponent defection rates (up to 56% defection) the
outcome-maximizing strategy is to always cooperate. This
facilitates investigation of predicted cooperative participant
behavior across a wide range of opponent defection rates. Hot
dog was $10 with a food quality of 150, whereas lobster was
$45 with a food quality of 350. Dining Points are taken as the
ratio of food quality to each player’s share of the bill.
C. Participants
The experimental system was deployed on MTurk and data
was collected from 95 participants. MTurk is a web service
that provides attractive tools for researchers who require large
participant pools and inexpensive overhead for their
experiments. Numerous experiments have been conducted,
notably Buhrmester et al. [5], assessing the validity of using
the service to collect research data, and these studies have
generally found that the quality of data collected from MTurk
is comparable to what would be collected from supervised
laboratory experiments. In the Diner's Dilemma experiment,
the MTurk participant age ranged from 19 to 60 with an
average of 32 and a median of 30. 61% of participants were
male while 39% were female.
D. User Interface
For the purpose of our study, we avoid showing the user
information that might be considered a recommendation or
expert opinion, potentially biasing them towards cooperation
or defection, in line with literature on system transparency and
explanatory interfaces [23, 25, 28]. Instead, participants were
shown one of three configurations of the UI with varying
amounts of information (Fig. 1). The ‘simplified’ UI only
displays the bare minimum amount of information necessary
for a participant to perceive the environment, although clever
users would still be able to achieve SA levels 2 or 3 by paying
close attention or taking extra time to perform a data analysis.
The ‘basic’ interface aids comprehension of opponent
1569868067 4
behavior by displaying an enumerated game history that
participants can examine to get a quick synopsis of opponent
behavior from the outset to the current round. The ‘advanced’
interface included a tool to advise a participant on the long
term gains of their choices.
Level 1 UI (simplified): All participants were shown, at a
minimum, their current dining points, the food quality and cost
of each menu item, the current round, and the results from the
previous round in terms of dining points. This view explicitly
reports on only the most current and recent game states,
leading us to hypothesize that the participants would not be
able to keep track of opponent behavior as easily as subjects
using the more advanced interfaces.
Level 2 UI (basic): This UI level includes all UI features
from Level 1 UI, and adds a ‘History’ panel to provide
historical game information to the participant. In a similar
study, Teng et al. [30] presented both the participant and
opponent score in a game history panel. Their results showed a
drop in participant cooperation when the history panel was
presented. Based on their observation that presenting opponent
score can promote retaliatory behavior, we omit the score
display feature from our user interface design.
Level 3 UI (advanced): This UI level includes all UI
features from Level 1 and 2 UIs, and adds a ‘Long Term’
panel to provide long-term projection information. This is an
interactive panel where the participant can enter his or her
assumptions about opponent behavior and calculate the
expected dining points. By default, nothing is selected, so as to
avoid biasing the participant in either direction.
E. SA Measurement
SA measurement provides a proven way to assess system
effectiveness and the user’s level of awareness of the situation.
There are several approaches for the direct measurement of
SA. The SAGAT is a widely tested and validated technique
[7] for objectively measuring SA across all of its elements
(levels 1, 2, and 3) with numerous studies supporting its
validity and reliability [6, 12, 16].
Objective SA was measured using the SAGAT, based on
questions derived from an analysis of SA requirements of the
experiment. There were a total of 15 questions in each of two
questionnaires (one after 50 rounds and after 90 rounds), all
with multiple-choice answers. Participants were informed
about the questionnaires, but not about their timing. The
experiment’s UI was not visible during the questionnaire
phase. The range of possible scores was 0-15 on each
questionnaire, with a combined SA score range of 0-30.
IV. ANALYSIS AND RESULTS
In this section, the major findings in the data collected from
the 95 participants are presented. The next section is a
discussion of these findings. Independent variables in the
experiment were opponent strategies and UI levels. Opponent
strategies were based on the tit-for-tat strategy with five levels
of varying defection and forgiveness behavior. There were
three variations of the UI with increasing information density
and type. Dependent variables were participant cooperation
(an indirect indicator of interpersonal trust), total dining points
(an indicator of participant performance), and SA.
The two-factor analysis of variance (ANOVA) showed a
significant main effect for the opponent strategy on dining
points [F(4, 80)=69.90, p<0.0001], and cooperation rate
[F(4,80)= 4.87, p=0.001], and SA [F(4,80)=4.00, p=0.005].
There was no significant interaction effect between opponent
strategies and UI levels (p>0.43). In all analyses type II sum of
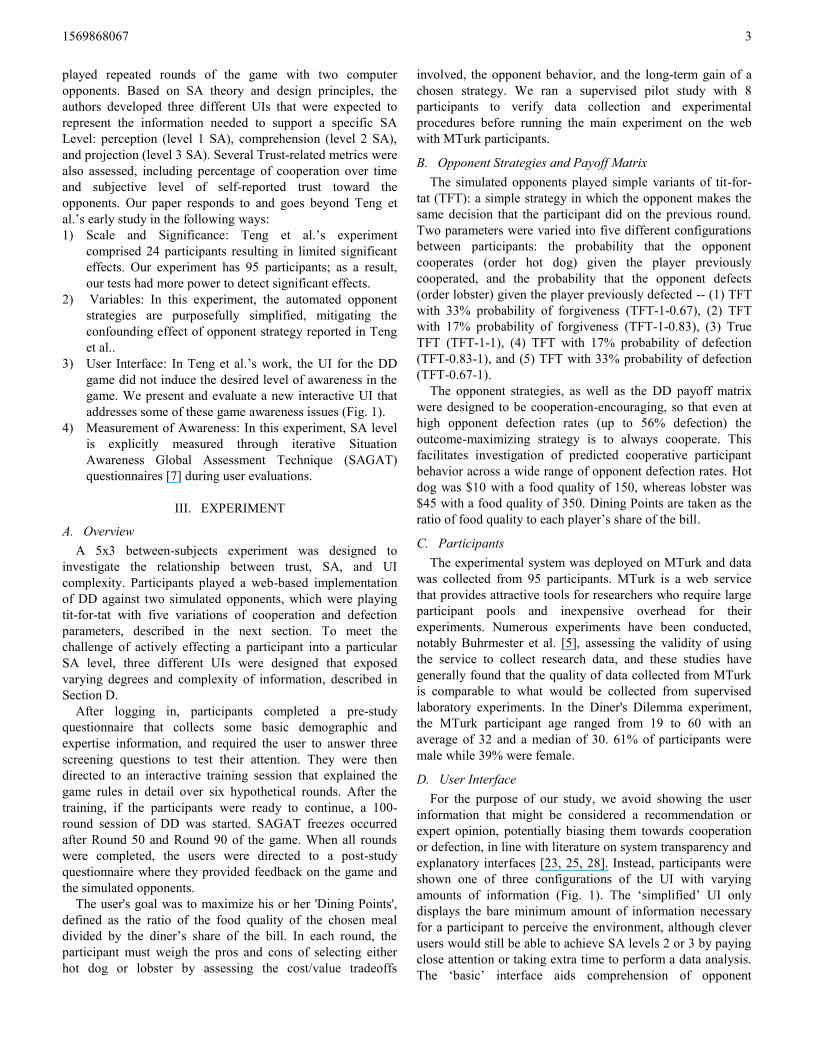
squares was used because of unbalanced data. Fig. 2 shows an
overview of mean participant cooperation rate over five co-
diner strategies for the implemented payoff matrix. Co-diner
strategies, from left to right, are TFT-1-0.67, TFT-1-0.83,
TFT-1-1, TFT-0.83-1, TFT-0.67-1. The dashed line is score
penalty if the participant doesn’t use the ‘theoretically
optimum player strategy’.
Fig. 2. Mean participant cooperation rate for 5 co-diner strategies. Mean
participant cooperation rate decreases with decreasing co-diner forgiveness and then with increasing co-diner defection.
Table I shows mean participant cooperation rates for three
UI levels and five opponent strategies. The two-factor
ANOVA showed a marginal effect for UI Level on
cooperation rate [F(2,80)=2.56, p=0.084]. Going from UI
Level 1 to UI Level 2, participant cooperation rate is higher in
all opponent strategies but one. UI Level 3 has the lowest
participant cooperation rate in all opponent strategies. Mean
participant cooperation for UI Level 1, UI Level 2, and UI
Level 3 are 74.9% (n=25), 80.9% (n=30), and 63.3% (n=40),
respectively. Participant cooperation is highest for UI Level 2
and lowest for UI Level 3. Post-hoc Tukey HSD analysis
indicate that difference is between UI level 2 and UI level 3.
TABLE I. PARTICIPANT COOPERATION RATE BY UI LEVEL AND STRATEGY
Opponent Strategy UI Level 1 UI Level 2 UI Level 3
TFT-1-0.67 86.4% 97.3% 83.0%
TFT-1-0.83 94.5% 87.9% 73.2%
TFT-1-1 75.0% 87.5% 68.3%
TFT-0.83-1 70.8% 72.1% 68.0%
TFT-0.67-1 61.0% 67.0% 51.8%
Table II shows mean total dining points for three UI levels
and five opponent strategies. The two-factor ANOVA showed
a significant main effect for UI Level on dining points [F(2,
80)=3.33, p=0.041]. Going from UI Level 1 to UI Level 2,
dining points are higher in all opponent strategies but one. UI
Level 3 has the lowest dining points in all opponent strategies
1569868067 5
but one. Mean total dining points for UI Level 1, UI Level 2,
and UI Level 3 are 1167 (n=25), 1249 (n=30), and 1093
(n=40), respectively. Total dining points is highest for UI
Level 2 and lowest for UI Level 3. This finding is consistent
with participant cooperation; because the conditions tested in
this experiment total dining points is a direct function of
participant cooperation. Post-hoc Tukey HSD analysis
indicates that the difference is between UI level 2 and 3.
TABLE II. MEAN TOTAL DINING POINTS BY UI LEVEL AND STRATEGY
Opponent Strategy UI Level 1 UI Level 2 UI Level 3
TFT-1-0.67 1421.0 1484.3 1381.5
TFT-1-0.83 1457.3 1413.0 1287.4
TFT-1-1 1282.5 1392.8 1232.5
TFT-0.83-1 1067.5 1087.6 1078.7
TFT-0.67-1 909.0 948.8 906.4
Table III shows mean combined SA score for three UI
levels and five opponent strategies. The two-factor ANOVA
showed no significant main effect for UI Level on SA [F(2,
80)=45.654, p=0.127].
TABLE III. COMBINED SA SCORE BY UI LEVEL AND OPPONENT STRATEGY
Opponent Strategy UI Level 1 UI Level 2 UI Level 3
TFT-1-0.67 23.0 26.7 26.5
TFT-1-0.83 24.5 24.9 21.0
TFT-1-1 28.0 26.8 21.6
TFT-0.83-1 19.3 23.9 21.2
TFT-0.67-1 19.4 19.5 19.9
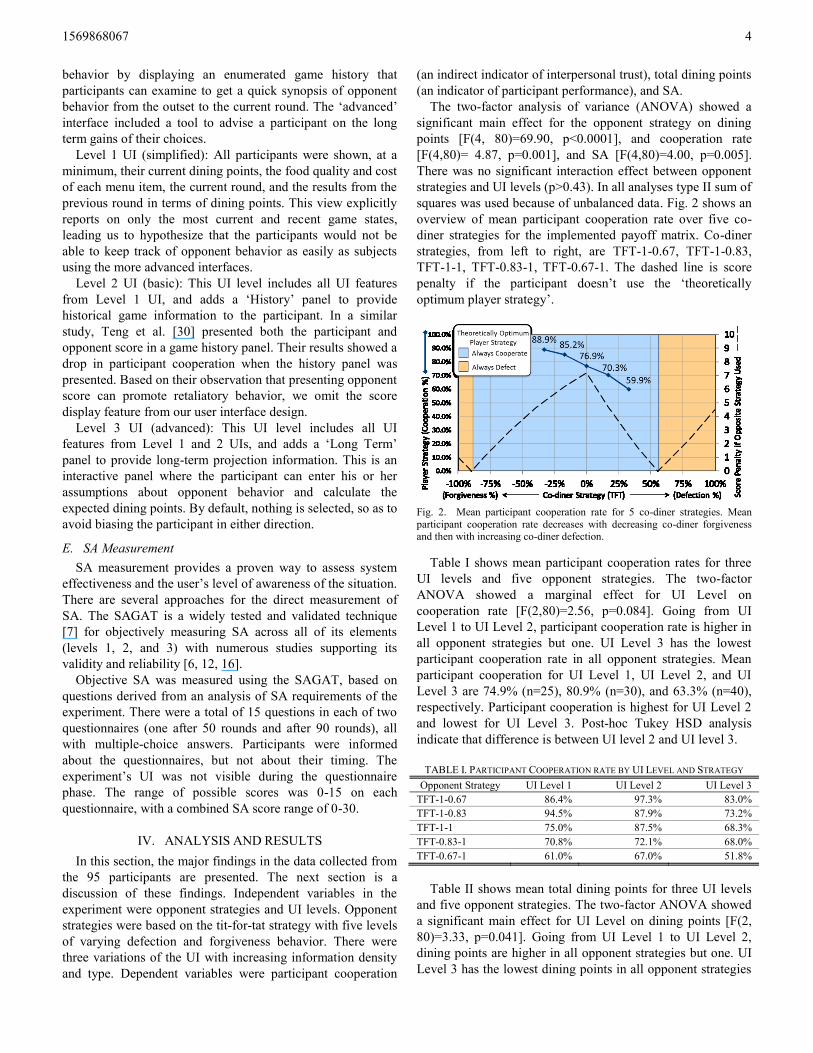
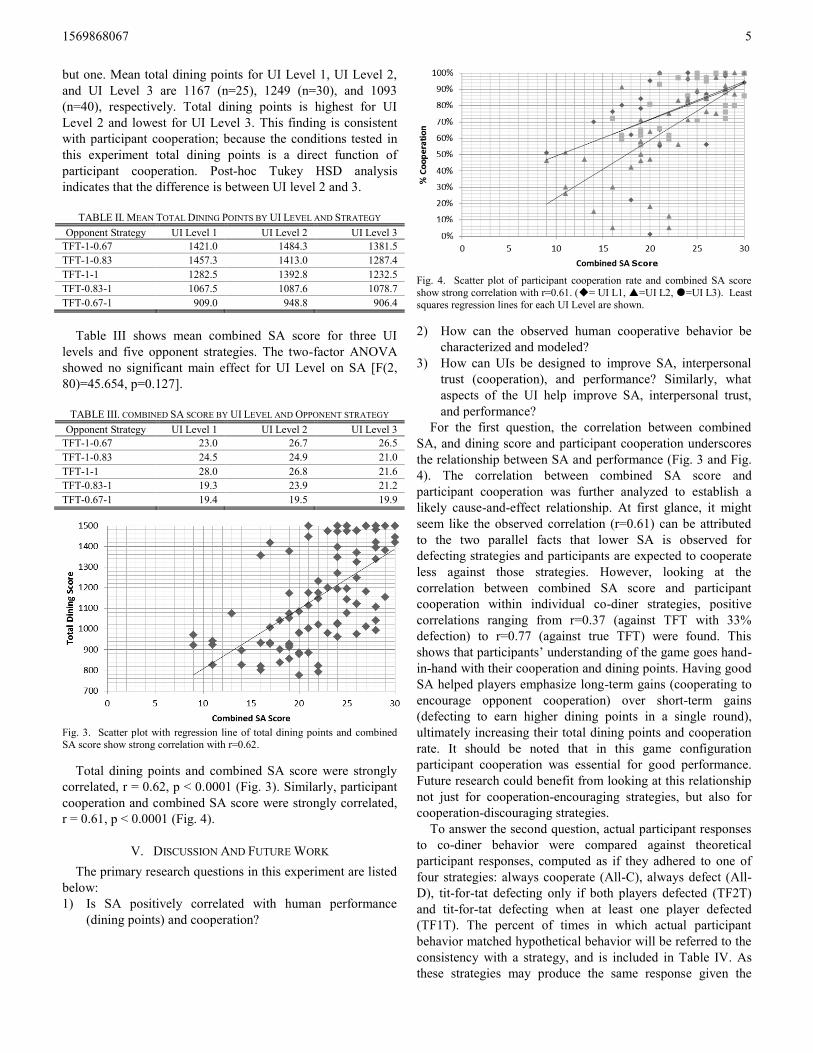
Fig. 3. Scatter plot with regression line of total dining points and combined SA score show strong correlation with r=0.62.
Total dining points and combined SA score were strongly
correlated, r = 0.62, p < 0.0001 (Fig. 3). Similarly, participant
cooperation and combined SA score were strongly correlated,
r = 0.61, p < 0.0001 (Fig. 4).
V. DISCUSSION AND FUTURE WORK
The primary research questions in this experiment are listed
below:
1) Is SA positively correlated with human performance
(dining points) and cooperation?
Fig. 4. Scatter plot of participant cooperation rate and combined SA score
show strong correlation with r=0.61. (= UI L1, =UI L2, =UI L3). Least squares regression lines for each UI Level are shown.
2) How can the observed human cooperative behavior be
characterized and modeled?
3) How can UIs be designed to improve SA, interpersonal
trust (cooperation), and performance? Similarly, what
aspects of the UI help improve SA, interpersonal trust,
and performance?
For the first question, the correlation between combined
SA, and dining score and participant cooperation underscores
the relationship between SA and performance (Fig. 3 and Fig.
4). The correlation between combined SA score and
participant cooperation was further analyzed to establish a
likely cause-and-effect relationship. At first glance, it might
seem like the observed correlation (r=0.61) can be attributed
to the two parallel facts that lower SA is observed for
defecting strategies and participants are expected to cooperate
less against those strategies. However, looking at the
correlation between combined SA score and participant
cooperation within individual co-diner strategies, positive
correlations ranging from r=0.37 (against TFT with 33%
defection) to r=0.77 (against true TFT) were found. This
shows that participants’ understanding of the game goes hand-
in-hand with their cooperation and dining points. Having good
SA helped players emphasize long-term gains (cooperating to
encourage opponent cooperation) over short-term gains
(defecting to earn higher dining points in a single round),
ultimately increasing their total dining points and cooperation
rate. It should be noted that in this game configuration
participant cooperation was essential for good performance.
Future research could benefit from looking at this relationship
not just for cooperation-encouraging strategies, but also for
cooperation-discouraging strategies.
To answer the second question, actual participant responses
to co-diner behavior were compared against theoretical
participant responses, computed as if they adhered to one of
four strategies: always cooperate (All-C), always defect (All-
D), tit-for-tat defecting only if both players defected (TF2T)
and tit-for-tat defecting when at least one player defected
(TF1T). The percent of times in which actual participant
behavior matched hypothetical behavior will be referred to the
consistency with a strategy, and is included in Table IV. As
these strategies may produce the same response given the
1569868067 6
same co-diner behavior, it is possible for a participant’s
responses to be consistent with multiple strategies at the same
time. Note that, in this analysis, strategies are applied to
evaluate participant behavior; this contrasts with the use of
strategies applied to the co-diners to probe participant
behavior.
While no one strategy matched the observed human
behavior across all co-diner behaviors, participant responses
appear to be consistent with either TF2T or All-C. Given the
similarity of the two strategies it is difficult to determine
which participant behaviors are more consistent. Participant
behaviors do not appear to be consistent with All-D, in
general. Finally, to the degree that participant responses are
consistent with a tit-for-tat strategy, participant responses
seem more aligned with TF2T than TF1T, suggesting that a
single cooperating co-diner may be sufficient to cause
participants to cooperate; both co-diners may need to defect in
order for participants to defect.
TABLE IV. CONSISTENCY OF PARTICIPANT BEHAVIOR WITH STRATEGY BY
CO-DINER STRATEGIES
Strategy TF2T TF1T All-C All-D
TFT-1-0.67 85.6% 83.8% 88.0% 12.0%
TFT-1-0.83 80.8% 78.5% 85.4% 14.6%
TFT-1-1 75.0% 75.0% 74.7% 25.3%
TFT-0.83-1 68.8% 56.5% 70.4% 29.6%
TFT-0.67-1 69.9% 57.2% 57.1% 42.9%
Looking across UI levels, participant behavior matches
either TF2T or All-C. As before, it appears difficult to
determine whether participant behavior overall is more
consistent with TF2T or All-C, but both strategies appear to
describe participant behavior better than TF1T and All-D
(Table V).
TABLE V. CONSISTENCY OF PARTICIPANT BEHAVIOR WITH STRATEGY BY UI
LEVEL
Strategy TF2T TF1T All-C All-D
UI Level 1 76.8% 67.5% 74.9% 25.1%
UI Level 2 74.1% 68.9% 80.9% 19.1%
UI Level 3 73.6% 65.9% 63.3% 36.7%
All 74.6% 67.3% 71.9% 28.1%
For the third question, it was established that the UI does
have a significant effect on participant behavior (Table I and
Table II). From UI Level 1 to UI Level 2, increased levels of
cooperation and dining points were observed. This can
partially be explained by the fact that UI Level 2 provides
additional historical information in the form of the player
‘History’ panel. In a similar experiment, Teng et al. [30]
reported a decrease in cooperation rate when a game history
panel was presented to participants. One significant difference
in Teng et al.’s experiment is the inclusion of opponent scores
in the game history panel -- something omitted from our
experiment. The inclusion of opponent scores might have
encouraged the participant to retaliate more in case of a
defection. More research is needed to establish this subtle
effect.
Interestingly, decreased levels of cooperation and dining
points were observed from UI Level 2 to UI Level 3, partly
contradicting our hypothesis. The only difference between UI
Level 2 and UI Level 3 is the addition of the interactive and
what-if scenario exploration encouraging ‘Long Term’ panel.
Previous work by Teng et al. [30] reported reduced
cooperation rates with the inclusion of a prediction table that
was non-interactive and based on only one round of DD. Our
improved ‘Long Term’ panel was designed to provide level 3
SA (projection) support and emphasize strategic thinking by
being exploratory and presenting longer term dining scores
[23, 25, 29]. Clearly, the inclusion of the long-term panel
affected participants negatively in cooperation and dining
points. One possibility for this outcome is the additional visual
and cognitive complexity introduced by the long-term panel.
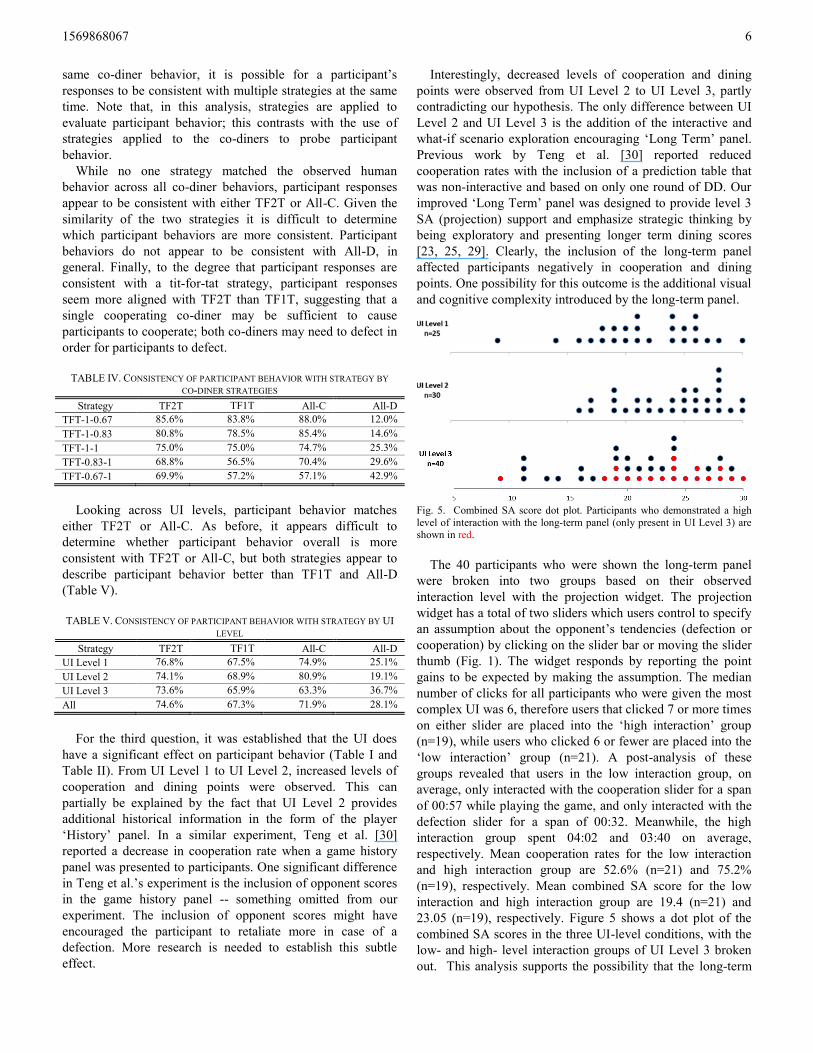
Fig. 5. Combined SA score dot plot. Participants who demonstrated a high
level of interaction with the long-term panel (only present in UI Level 3) are shown in red.
The 40 participants who were shown the long-term panel
were broken into two groups based on their observed
interaction level with the projection widget. The projection
widget has a total of two sliders which users control to specify
an assumption about the opponent’s tendencies (defection or
cooperation) by clicking on the slider bar or moving the slider
thumb (Fig. 1). The widget responds by reporting the point
gains to be expected by making the assumption. The median
number of clicks for all participants who were given the most
complex UI was 6, therefore users that clicked 7 or more times
on either slider are placed into the ‘high interaction’ group
(n=19), while users who clicked 6 or fewer are placed into the
‘low interaction’ group (n=21). A post-analysis of these
groups revealed that users in the low interaction group, on
average, only interacted with the cooperation slider for a span
of 00:57 while playing the game, and only interacted with the
defection slider for a span of 00:32. Meanwhile, the high
interaction group spent 04:02 and 03:40 on average,
respectively. Mean cooperation rates for the low interaction
and high interaction group are 52.6% (n=21) and 75.2%
(n=19), respectively. Mean combined SA score for the low
interaction and high interaction group are 19.4 (n=21) and
23.05 (n=19), respectively. Figure 5 shows a dot plot of the
combined SA scores in the three UI-level conditions, with the
low- and high- level interaction groups of UI Level 3 broken
out. This analysis supports the possibility that the long-term

1569868067 7
panel might have confused at least some of the participants,
thereby reducing their scores. However, participants who took
advantage of the long-term panel exhibited higher SA scores.
While UIs should provide integrated information and support
higher levels of SA, designing effective UIs without
overloading the operator remains a challenge. Future studies in
this area could focus on specific aspects of what makes some
participants confused instead of effective, as well as how to
better provide level 3 SA support.
VI. CONCLUSION
Using the Iterated Diner’s Dilemma as an abstract game
scenario, we conducted a study on the impact of three different
UI designs on achieved SA (measured) and on cooperation
rate and game performance (observed). We found a significant
effect for UI levels on total participant dining points (our
performance metric) at the p<0.05 level [F(2,92)=3.33,
p=0.041]. There was a marginal effect for UI levels on
participant cooperation at the p<0.10 level [F(2,92)=2.56,
p=0.084]. We also observed a strong correlation between SA
and performance in the game. We believe that our results,
including our difficulty in furthering Level 3 SA through
interface design, can inform various other decision-making
scenarios and help increase productivity through more
efficient decision-making.
Additional experiments and further research are needed to
better explain, model, and predict human behavior under
different conditions, opponent strategies, and supporting UIs.
We believe that this research can help to guide future work on
how to visualize information, how to assist users, and
constructively influence user behavior towards outcome-
maximizing strategies. In ongoing work, we have begun to
formulate computational models of the human cooperation
behavior we observed, an effort that will contribute to the
formulation of human trust models, and will at the same time
allow us to scale up the exploration of believable multi-agent
interaction beyond two computer-controlled agents. We are
also interested in going beyond the confines of abstract trust
games, and explore the interdependencies of UI Design, SA,
Trust, and Performance in specific real-world scenarios
without sacrificing the fully controllable nature of the
experimentation and its generalizability.
REFERENCES
[1] Abdul-Rahman, A., & Hailes, S. A distributed trust model. Proc. New
security paradigms 1997 (1998), 48-60. ACM. [2] Andreoni, J. and Miller, J. Rational cooperation in the finitely repeated
Prisoner’s Dilemma: experimental evidence. The Economic Journal 103,
418 (1993), 570-585. [3] Axelrod, R. and Hamilton, W. D. The evolution of cooperation. Science
211, 4489 (1981), 1390-1396.
[4] Brewer, M. B. and Kramer, R. M. Choice behavior in social dilemmas: effects of social identity, group size, and decision framing. Journal of
Personality and Social Psychology 50, 3 (1986), 543-549.
[5] Buhrmester, M., Kwang, T., and Gosling, S. D. Amazon's Mechanical Turk A New Source of Inexpensive, Yet High-Quality,
Data? Perspectives on Psychological Science, 6, 1 (2011), 3-5.
[6] Collier, S.G. and K. Folleso. SACRI: A measure of Situation Awareness of nuclear power plant control rooms. In Experimental analysis and
measurement of Situation Awareness, eds. D.J. Garland and M.R.
Endsley, (1995) 115-122. [7] Endsley, M.R. Situation Awareness global assessment technique
(SAGAT). Proc. NAECON (1988), 789–795. New York: IEEE.
[8] Endsley, M. R. Toward a theory of Situation Awareness in dynamic systems. Human Factors (1995), 37(1), 32-64.
[9] Endsley, M.R. and Jones, D.G. Designing for Situation Awareness: An
Approach to Human-Centered Design. CRC Press, Boca Raton, FL, 2003.
[10] Endsley, M. R., and Kiris, E. O. The out-of-the-loop performance
problem and level of control in automation. Human Factors: The Journal of the Human Factors and Ergonomics Society (1995), 37(2),
381-394.
[11] Endsley, M.R., Sollenberger, R., and Stein, E. The use of predictive displays for aiding controller situation awareness. Proc. Human Factors
and Ergonomics Society Annual Meeting 43, 1 (1999), 51-55.
[12] Fracker, M.L. Attention gradients in Situation Awareness. In Situational Awareness in Aerospace Operations (AGARD-CP-478), 478 (1990), 6/1-
6/10.
[13] Frank, R. H., Gilovich, T. and Regan, D. T. Does studying economics inhibit cooperation? Journal of Economic Perspectives, 7, 2 (1993), 159-
171.
[14] Gneezy, U., Haruvy, E. and Yafe, H. The inefficiency of splitting the bill. The Economic Journal 114, 495 (2004), 265–280.
[15] Gonzalez, C., Ben-Asher, N., Martin, J.M. and Dutt, V. Emergence of
cooperation with increased information: Explaining the process with instance-based learning models. Unpublished manuscript under review
(2013). [16] Gugerty, L.J. Situation Awareness During Driving: Explicit and Implicit
Knowledge in Dynamic Spatial Memory. Journal of Experimental
Psychology: Applied, 3, (1997) 42-66. [17] Hauert, C., De Monte, S., Hofbauer, J. and Sigmund, K. Volunteering as
red queen mechanism for cooperation in public goods games. Science
296, 5570 (2002), 1129-1132. [18] Jervis, R. The Illogic of American Nuclear Strategy. Cornell University
Press, Ithaca, NY, 1984.
[19] Jones, D.G. and Endsley, M.R. Sources of situation awareness errors in aviation. Aviation, Space and Environmental Medicine 67, 6 (1996),
507-512.
[20] Kreps, D. M., Milgrom, P., Roberts, J. and Wilson, R. Rational cooperation in the finitely repeated prisoners' dilemma. Journal of
Economic Theory 27, 2 (1982), 245-52.
[21] Liberman, V., Samuels, S. and Ross, L. The name of the game: predictive power of reputations versus situational labels in determining
Prisoner’s Dilemma game moves. Personality and Social Psychology
Bulletin 30, 9 (2004), 1175-1185. [22] Martin, J.M., Juvina, I., Lebiere, C., and Gonzalez, C. The effects of
individual and context on aggression in repeated social interaction.
Applied Ergonomics 44, 5 (2013), 710-718. [23] McSherry, D. Explanation in recommender systems. Artificial
Intelligence Review 24, 2 (2005), 179-197.
[24] Nowak, M. and Sigund, K. Evolutionary dynamics of biological games. Science 303, 5659 (2004), 793-799.
[25] O'Donovan, J., and Smyth, B. Trust in recommender systems. Proc.
International Conference on Intelligent User Interfaces (IUI) (2005), 167-174. ACM.
[26] Rabin, M. Incorporating fairness into game theory and economics, The
American Economic Review 83, 5 (1993), 1281-1302. [27] Salas, E., Prince, C., Baker, D.P. and Shrestha, L. Situation awareness in
team performance: Implications for measurement and training. Human
Factors 37, 1 (1995), 123-136. [28] Saner, L.D., Bolstad, C.A., Gonzalez, C. and Cuevas, H.M. Measuring
and predicting shared situation awareness in teams. Journal of Cognitive
Engineering and Decision Making 3, 3 (2009), 280-308. [29] Sinha, R., and Swearingen, K. The role of transparency in recommender
systems. CHI'02 ext. abstracts Human factors in computing
systems (2002), 830-831. ACM. [30] Teng Y., Jones, R., Marusich, L., O'Donovan, J., Gonzalez, C. and
Hollerer, T. Trust and situation awareness in a 3-player diner's dilemma
game. In Proc. CogSIMA, IEEE (2013), 25-28.