Dear Journal of Environmental Quality manuscript author
10
AMERICAN SOCIETY OF AGRONOMY CROP SCIENCE SOCIETY OF AMERICA SOIL SCIENCE SOCIETY OF AMERICA 677 South Segoe Road • Madison WI 53711 • 608/273-8080 • 608/273-2021 (fax) Dear Journal of Environmental Quality manuscript author: Following are the galley proofs for your JEQ manuscript. Please review the galley proofs carefully; they will not be read by editorial staff. Review of the word- processing file at the query letter stage should not be considered a substitute for galley proof review. Note that you are being asked to correct errors, not revise the paper. Extensive revision of manuscript content is not acceptable at this point. Reviewing the proofs. Please follow these guidelines for reviewing the proofs: • Print a copy of this file; do not review the galley proofs on-screen. The exception is figures, which generally have a truer representation on-screen than in the printed copy. • Mark your corrections, in red ink, directly on the galley proofs. Make sure that corrections are noticeable and easy to understand. • Check all type on the galley proofs, including the running heads that appear at the top of each page, the title and byline, the abbreviations list, and the author–paper documentation paragraph. • If your galley proofs have tables, check the table data against that in your original tables. • If your galley proofs have equations, check them against those in your original manuscript. • If your galley proofs have figures, check to be sure that all type is legible, including any small-print text. If a figure requires alteration, you must provide a printed copy of the revised figure. • The layout of the tables, figures, and equations is not final. Layout will be set per journal style when the full-issue paginated proofs are assembled. Returning the proofs. If the galley proofs require alterations, return the marked galley proofs via express delivery to the address below. Alternatively, you may return the marked galley proofs by fax. If you choose this option, you must also send an email message that includes a description of each alteration. If the galley proofs do not require alterations, you may send an email message indicating that no changes are needed. Thank you for your contribution to JEQ. Kind regards, Eric Sherman, Associate Production Editor Journal of Environmental Quality 677 South Segoe Road Madison, Wisconsin 53711 USA 608-268-4970 (phone), 608-273-2021 (fax), [email protected] (email)
Transcript of Dear Journal of Environmental Quality manuscript author

AMERICAN SOCIETY OF AGRONOMY CROP SCIENCE SOCIETY OF AMERICA SOIL SCIENCE SOCIETY OF AMERICA
677 South Segoe Road • Madison WI 53711 • 608/273-8080 • 608/273-2021 (fax) Dear Journal of Environmental Quality manuscript author: Following are the galley proofs for your JEQ manuscript. Please review the galley proofs carefully; they will not be read by editorial staff. Review of the word-processing file at the query letter stage should not be considered a substitute for galley proof review. Note that you are being asked to correct errors, not revise the paper. Extensive revision of manuscript content is not acceptable at this point. Reviewing the proofs. Please follow these guidelines for reviewing the proofs:
• Print a copy of this file; do not review the galley proofs on-screen. The exception is figures, which generally have a truer representation on-screen than in the printed copy.
• Mark your corrections, in red ink, directly on the galley proofs. Make sure that corrections are noticeable and easy to understand.
• Check all type on the galley proofs, including the running heads that appear at the top of each page, the title and byline, the abbreviations list, and the author–paper documentation paragraph.
• If your galley proofs have tables, check the table data against that in your original tables.
• If your galley proofs have equations, check them against those in your original manuscript.
• If your galley proofs have figures, check to be sure that all type is legible, including any small-print text. If a figure requires alteration, you must provide a printed copy of the revised figure.
• The layout of the tables, figures, and equations is not final. Layout will be set per journal style when the full-issue paginated proofs are assembled.
Returning the proofs. If the galley proofs require alterations, return the marked galley proofs via express delivery to the address below. Alternatively, you may return the marked galley proofs by fax. If you choose this option, you must also send an email message that includes a description of each alteration. If the galley proofs do not require alterations, you may send an email message indicating that no changes are needed. Thank you for your contribution to JEQ. Kind regards, Eric Sherman, Associate Production Editor Journal of Environmental Quality 677 South Segoe Road Madison, Wisconsin 53711 USA 608-268-4970 (phone), 608-273-2021 (fax), [email protected] (email)
Upflow Reactors for Riparian Zone Denitrification
Peter W. van Driel, William D. Robertson,* and L. Craig Merkley
ABSTRACTWe used permeable reactive subsurface barriers consisting of a C
source (wood particles), with very high hydraulic conductivities (,0.1–1 cm s21), to provide high rates of riparian zone NO3–N removal at twofield sites in an agricultural area of southwestern Ontario. At one site,a 0.73-m3 reactor containing fine wood particles was monitored for a20-mo period and achieved a 33% reduction in mean influent NO3–Nconcentration of 11.5 mg L21 and a mean removal rate of 4.5 mg L21
d21 (0.7 g m22 d21). At the second site, four smaller reactors (0.21 m3
each), two containing fine wood particles and two containing coarsewood particles, were monitored for a 4-mo period and were successfulin attenuating mean influent NO3–N concentrations of 23.7 to 35.1 mgL21 by 41 to 63%. Mean reaction rates for the two coarse-particlereactors (3.2 and 7.8 mg L21 d21, or 1.5 and 3.4 g m22 d21) were notsignificantly different (p. 0.2) than the rates observed in the two fine-particle reactors (5.0 and 9.9 mg L21 d21, or 1.8–3.5 g m22 d21). A two-dimensional ground water flow model is used to illustrate how per-meable reactive barriers such as these can be used to redirect groundwater flow within riparian zones, potentially augmenting NO3
2 re-moval in this environment.
NUTRIENTS applied to augment crop production haveresulted in environmental consequences such as ele-
vated ground water NO3–N concentrations (Fleischerand Stibe, 1989; Canter, 1996; Panno and Kelly, 2004).Nitrate-N-enriched ground water discharging to surfacewater courses can lead to excessive algal growth andcause ecosystemdeterioration (Canter, 1996).Onemeansof protecting aquatic ecosystems from nutrient over-loading is through the maintenance of naturally vege-tated riparian buffer strips adjacent to surface watercourses. Here, in addition to NO3–N assimilation intoplant biomass, the presence of sediments enriched inOC (organic C) can stimulate microbial denitrification(Ehrlich, 1990):
5(CH2O) 1 4NO23 1 4H1 ! 5CO2(g) 1 2N2(g) 1 7H2O
[1]
Studies of NO3–N attenuation in riparian buffer stripsin agricultural areas have been undertaken by a numberof researchers (e.g., Young et al., 1980; Groffman et al.,1991; Simmons et al., 1992; Osborne and Kovacic, 1993;Hill, 1996; Schnabel et al., 1996; Gold et al., 1998;Mengis et al., 1999; Royer et al. (2004) among others).Several studies report higher rates of NO3–N removal
in shallow soil zone sediments with elevated OC con-tents compared with underlying C horizon material(Lowrance, 1992; Flite et al., 2001), or in patches of Chorizon material containing locally higher amounts ofOC as a result of the presence of decaying root material(Gold et al., 1998; Jacinthe et al., 1998). The linkagebetween NO3
2 consumption and the availability of OCfrom the biologically active soil zone has caused studiesof riparian-zone NO3
2 attenuation to be focused gen-erally at relatively shallow depths of ,1 to 2 m. How-ever, organic-rich soil zone sediments also contain clayminerals produced by weathering reactions, and as aresult have hydraulic conductivity (K) values that areusually orders of magnitude less than that of typical sandand gravel aquifers that are most prone to NO3
2 con-tamination (e.g., 102 3 to 1021 cm s21, Freeze and Cherry,1979). Thus, although NO3
2 consumption rates may behigh in shallow C-rich zones, at sites where thicker aqui-fers are present, it is possible that much of the groundwater approaching stream discharge points does so viadeeper, more permeable flow paths that may have lessopportunity to interact with shallow C sources. Addi-tionally, lower-K sediments associated with ripariansoil zones and stream alluvium can have the effect ofhydraulically isolating aquifer flow systems from somesurface water courses. Only a few studies have ad-dressed the fate of NO3
2 in riparian zones with thickeraquifer systems present, however (e.g., Bohlke andDenver, 1995; Hill, 1996; Tesoriero et al., 2000; Puckettet al., 2002).The use of artificially constructed permeable reactive
barriers augmented with OC solids is an emerging tech-nology for remediation of NO3–N in ground water.Wood particles have been identified as an effective ma-terial for use in such barriers because of low cost, highpermeability, and reaction rates that are suitable forlong-term, multiyear treatment. Barriers or container-ized reactors using particulate wood media have beenused to treat NO3–N from septic tank effluent (Robert-son and Cherry, 1995; Robertson et al., 2000, 2005a),agricultural tile drainage (Blowes et al., 1994; Robertsonet al., 1994, 2000; van Driel et al., 2005), and shallowground water contaminated by agricultural practices(Schipper and Vojvodic-Vukovic, 1998; Robertson et al.,2005b). Robertson et al. (2005b) used a wood particlemedium that was coarse grained (1–50 mm diam.) andhad very high K (,1 cm s21) in a reactive layer thatcaused convergence of ground water flow into the layerand allowed the capture of ground water from aquiferzones located below the bottom of the layer.We conducted field trials in which wood particle re-
actors were installed at two sites where high-NO32
P.W. van Driel and W.D. Robertson, Department of Earth Sciences,University of Waterloo, 200 University Ave. W., Waterloo, ON,Canada. L.C. Merkley, Upper Thames River Conservation Authority,1424 Clarke Road, London, ON, Canada. Received 24 Jan. 2005.*Corresponding author ([email protected]).
Published in J. Environ. Qual. j:j–j (2006).Technical Reports: Ground Water Qualitydoi:10.2134/jeq2005.0027ª ASA, CSSA, and SSSA677 S. Segoe Rd., Madison, WI 53711 USA
Abbreviations: HRT, hydraulic retention time; K, hydraulic conduc-tivity; OC, organic carbon.
Reproducedfrom
JournalofEnvironmentalQuality.PublishedbyASA,CSSA,andSSSA.Allcopyrights
reserved.
1
Galley Proof JEQ q05-0027
ground water from agricultural activity was migratingthrough streamside riparian zones. The Caddy-BottCreek site has a thick (.4 m), areally extensive aquifer;at the Woodstock site, a thick aquifer (.10 m) is alsopresent and the trial was run for a longer period, whichincluded winter season monitoring. Our objective was todemonstrate the feasibility of using artificial permeablereactive barriers to passively augment NO3
2 removal inriparian zones. A numerical ground water flow modelwas also used to illustrate how high-permeability mediacan be used to modify flow paths within a riparian zone.
METHODSSite Descriptions
The Woodstock site is in southwestern Ontario nearthe city of Woodstock, at a location where a groundwater spring discharges at the headwaters of a stream.The site is in a local woodlot that is surrounded by ag-ricultural terrain dominated by corn (Zea mays L.) andsoybean [Glycine max (L.) Merr.] production. An un-confined, glacial outwash sand and gravel aquifer ispresent, which has elevated NO3–N (5–15 mg L21)throughout its ,10- to 15-m saturated thickness (Rob-ertson et al., 2005b). The aquifer serves as a local sourceof water supply.
The Caddy-Bott Creek site is flat and is located besidea perennial stream near the city of London, also insouthwestern Ontario. The creek has a catchment of,4 km2, which is intensively cultivated, predominantlyfor corn and soybean production. An unconfined, glacialoutwash sand and gravel aquifer of variable thickness un-derlies much of the catchment (Sado and Vagners, 1972),including the study site. Aerial photograph evidenceindicates that the stream was ditched and straightenedbefore 1955 to facilitate drainage, as is often the casein this area of Ontario, and that the creek’s watershedhas been under intensive cultivation since that time.Between 1994 and 1996, the creek was re-dredged and a
15-m-wide buffer strip was established along both sidesof the creek (Fig. 1; Ontario Stewardship Centre, 2004).The buffer strips were revegetated naturally with grassesor were planted with trees. At the time of this study(2003), ,40 cm of recent stream alluvium consisting ofsoft to moderately firm, organic rich, sandy silt sedimenthad accumulated in the creek bed during the 8-yr periodfollowing re-dredging of the creek. High well yields intwo multilevel piezometer bundles installed in the up-gradient farm field (e.g., CD4, Fig. 1) indicate that theaquifer extends to at least the 4-m depth at the study siteand contains ground water with NO3–N concentrations.10 mg L21 and as high as 67 mg L21 (van Driel, 2004).The up-gradient field receives both chemical fertilizerand swine manure applications.
Reactor and Monitoring Network InstallationThe Woodstock reactor consists of 0.73 m3 of a fine
wood particle medium (1–5 mm diam.) housed in a ply-wood box, 1.1 by 1.1 m in surface area, that is open at thebottom to allow inflow of ground water. It was installedon 25 Apr. 2002 by excavating manually to ,1 m belowthe water table, at a location immediately adjacent to thespring (Fig. 2a). A 10-cm-thick layer of 1- to 2-cm-diam.gravel was placed at the bottom of the reactor beforebackfilling the box with the wood medium. A drainagepipe of 2-cm-diam. Plastic tubing was installed into theupper surface of the reactor. This was used to maintainwater levels generally 5 to 10 cm lower than the adja-cent water table, which consequently induced upwardground water flow through the reactor. Varying the ele-
Fig. 1. Caddy-Bott Creek site, showing water table elevation (31 Oct.2003) and location of the five up-flow reactor test cells installedthrough the riparian sediments at the edge of the creek. Water leveldatum is the creek elevation at CD6.
Fig. 2. Hydraulic head values and ground water flow directions asso-ciated with the up-flow reactors at: (a) the Woodstock site and (b)the Caddy-Bott Creek site. Head values (m) were measured 4 May2003 at the Woodstock site and 31 Oct. 2003 at the Caddy-BottCreek site.
Reproducedfrom
JournalofEnvironmentalQuality.PublishedbyASA,CSSA,andSSSA.Allcopyrights
reserved.
2 J. ENVIRON. QUAL., VOL. j, j–j 2006
Galley Proof JEQ q05-0027
vation of the outlet tube allowed the reactor flow rateto be manipulated. The effective porosity of the finewood particle medium was assumed to be 0.47 basedon the results of an in situ tracer test in a previous study(van Driel, 2004), which used a similar medium. Thepore volume of the reactor was thus estimated at 0.34 m3
(0.73 m3 3 0.47).After reactor installation, three multiple-piezometer
bundles were installed into and adjacent to the reactor,to allow depth profiling of water quality parameters. Theseeach consisted of 7 to 9 variable-depth sampling tubes(Fig. 2a) of 0.6-cm-o.d. polyethylene, which were installedusing a percussion hammer with a 5-cm-diam. drive casingwith expendable drive tips.
The Caddy-Bott Creek reactors were installed intothe riparian buffer strip at the edge of the creek on 24and 25 June 2003. Five pits, 0.6 by 0.5 m in surface area,were dug manually to a depth of ,70 cm through thelow-K soil zone and into the underlying aquifer, whichwas encountered at a depth of,40 cm. These were eachbackfilled with 0.21 m3 of wood particle media (Fig. 2b),two with a fine particle medium (1–5 mm diam.) andthree with a coarse particle medium (1–50 mm diam.).Different medium sizes were used to provide a compari-son of reaction rates and hydraulic performance in re-actors with different permeability characteristics. It washoped that the use of the more permeable coarse me-dium would help to alleviate flow bypass problems thathave been noted in previous studies using the fine woodparticle medium (Schipper et al., 2004). A higher po-rosity value of 0.7 was assumed for the coarse medium,based also on an in situ tracer test performed by vanDriel (2004). The pore volume of the fine particle re-actors were thus estimated at 0.10 m3 (0.21 m3 3 0.47)and the coarse particle reactors at 0.15 m3 (0.21 m3 30.7). The reactors were unlined and drainage pipes wereagain installed into their upper surfaces (Fig. 2b) so thatwater levels could be maintained lower than the adja-cent water table. The drainage pipes consisted of 8-cm-diam. perforated PVC (polyvinyl chloride) pipe that wascapped at both ends and was fitted with a drainage tubeof 0.6-cm-o.d. polyethylene tubing. The smaller diame-ter tubing facilitated the measurement of the lowerflow rates that occurred in these reactors. Piezometers of1.3-cm-diam. PVC pipe with 5-cm-long screened tipswere installed into the bottom of each reactor to allowmonitoring of the influent ground water composition(Fig. 2b). Additionally, water table wells and multiplepiezometer bundles similar to those at the Woodstocksite were installed near the creek and in the adjacentfarm fields (Fig. 1) to establish the ground water flowdirection and aquifer water quality parameters.
MonitoringThe Woodstock reactor was monitored weekly to
monthly during the 20-mo period from April 2002 toDecember 2003 for NO3–N concentrations, flow rate,and temperature. Influent water was drawn from thepiezometer tip located 20 cm below the bottom of thereactive medium (Fig. 2a), while outflow water was
sampled from the drainage pipe. Samples were filtered(0.45 mm) immediately on collection, stored in 20-mLpolyethylene containers, and kept refrigerated untilanalysis, which occurred within 2 wk of collection. Ex-cept during Month 7 (13 Nov.–12 Dec. 2002) when semi-quantitative NO3–N values were obtained using a fieldtest kit (Kit K-6902, CHEMetrics, Calverton, VA), NO3–N analyses were performed at the Soil and NutrientLaboratory, University of Guelph, ON. These were doneusing a colorimetric method (Cd reduction) with an auto-analyzer (Model TRAACS 800, Technicon InstrumentsCorp., Tarrytown, NY), using standards that provided adetection limit of 0.01 mg L21. Water temperature wasmeasured using a digital temperature meter (ModelWD-35607-10, Oakton Instruments, Vernon Hills, IL).Flow rate was measured from the outlet pipe using acalibrated container and stopwatch. A more detailedsampling of the Woodstock reactor was undertakenduring Month 13 of operation (4 May 2003), at whichtime depth profiles of temperature, pH, Eh, NO3–N, andalkalinity were obtained through the reactor. The Eh andpH were measured in the field using a digital pH/mVmeter (Model 20, Barnant Co., Barrington, IL). The pHprobe was calibrated after every five to seven samplesusing buffers of pH 4 and 7 and Eh readings werechecked against Zobell’s solution (Nordstrom, 1977).Alkalinity was measured in the field by titration of fil-tered samples with 1.6 M H2SO4 to pH 4.6. DuringMonths 11 to 14 (March–June 2003), the flow ratethrough the reactor was deliberately varied in the rangeof 50 to 700 mL min21 by manipulating the elevation ofthe drainage pipe. This was done to assess the effect ofvariations in hydraulic retention time (HRT) on theamount of NO3–N removed. This flow rate range equatesto HRT of 0.3 to 5 d. Nineteen sampling events wereundertaken during the period of flow manipulation,which generated most of the data from which reactionrates were determined. On all occasions . 0.5 pore vol-umes passed through the reactor at the modified flowrate before sampling, and on 16 of 19 occasions, .1.5pore volumes passed through before sampling.The Caddy-Bott Creek reactors were sampled five to
eight times for NO3–N content, flow rate, and temper-ature between 4 and 31 Oct. 2003, 4 mo after their in-stallation, when a period of relatively stable flow wasachieved. Reactor 5 did not flow adequately and wasexcluded from the trial. Samples were collected and flowrates were measured by attaching a plastic bag to thedrainage tubes, otherwise measurement techniques andlaboratory analyses were the same as at the Woodstocksite. A standard t-test, assuming normal distribution, wasused to assess the significance of reaction rate differ-ences between the fine- and coarse-particle reactors.Sediment samples were collected at both sites for
analysis of grain size distribution and OC contents.These were obtained from grab samples collected duringexcavation of the reactor pits and, at the Caddy-BottCreek site, also from a continuous, 0.7-m-long, undis-turbed sediment core retrieved from the creek bed atthe CD 6 location (Fig. 1). The core was obtained using a5-cm-diam. aluminum core tube advanced into the
Reproducedfrom
JournalofEnvironmentalQuality.PublishedbyASA,CSSA,andSSSA.Allcopyrights
reserved.
3VAN DRIEL ET AL.: RIPARIAN ZONE NITRATE TREATMENT
Galley Proof JEQ q05-0027
sediment by percussion and was sectioned into 5-cm-long increments for grain size and OC analyses. The OCwas analyzed at the University of Guelph Soil andNutrient Laboratory by measuring mass loss on ignition(Heiri et al., 2001), which provided a detection limit of0.01% dry wt. Grain size distribution was determinedby dry sieving the Caddy-Bott Creek samples and byhydrometer analysis (Lambe, 1951) of the Woodstocksamples, which were generally finer grained. Hydraulicconductivity was estimated from the grain size datausing the Hazen method (Freeze and Cherry, 1979,p. 350). Most of the grain size analyses (11) were under-taken at the Caddy-Bott Creek site to provide K valuesfor the numerical flow model, whereas fewer (two) werecompleted at the Woodstock site.
Ground Water Flow ModelA two-dimensional finite-element ground water flow
model (FLONET version 5.0, Molson and Frind, 2000),which solves for steady-state hydraulic head, streamfunctions, and ground water velocity distribution, wasused to simulate ground water flow in the cross-sectionalplane transverse to Caddy-Bott Creek and approxi-mately parallel to the direction of ground water flowindicated on Fig. 1. The modeled domain was 10 m longand 1 m in depth below the water table, and focused onthe local flow system immediately adjacent to the creek.It utilized a 2121-node grid (101 nodes in the horizontaldirection and 21 in the vertical direction), with 4000uniform triangular elements. The objective of the mod-eling exercise was to illustrate how ground water under-flow can occur when low-K stream alluvium is presentand how flow paths change when these low-K sedimentsare breached. Field data from the site, including waterlevel measurements and K values determined from thegrain size data, were used to establish the boundary con-ditions and the approximate relative K distribution forthe modeled domain.
RESULTS AND DISCUSSIONWoodstock Site
Ground Water Flow
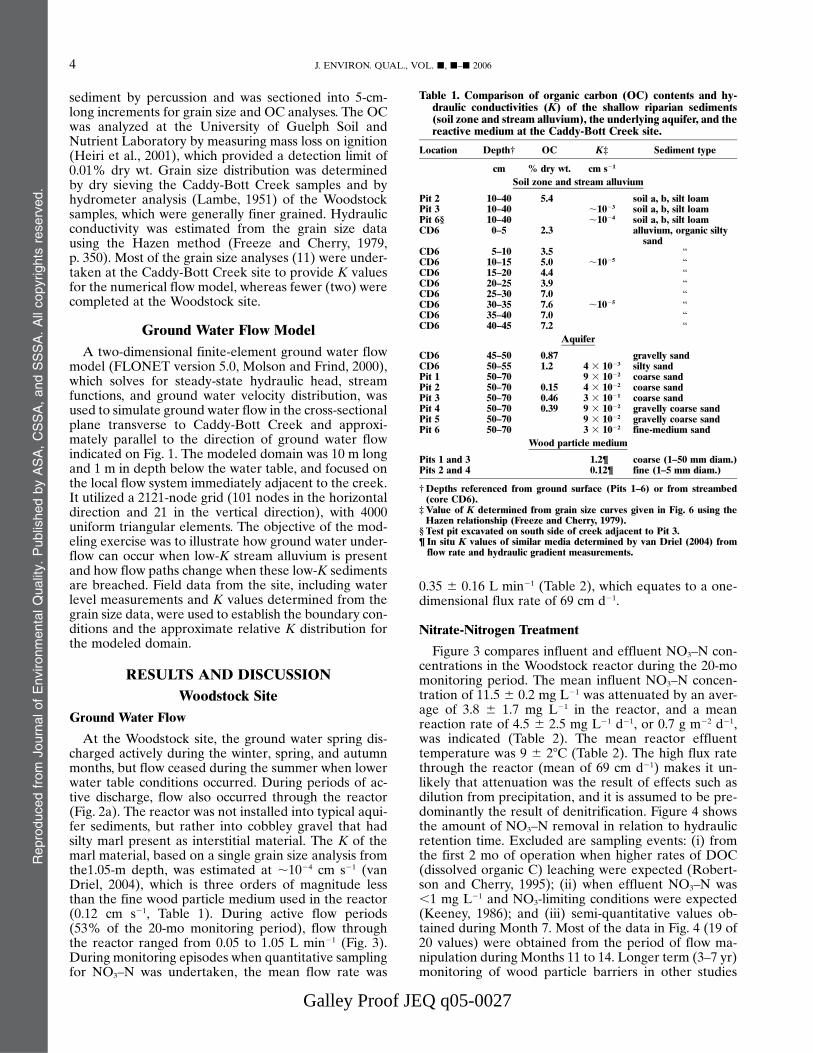
At the Woodstock site, the ground water spring dis-charged actively during the winter, spring, and autumnmonths, but flow ceased during the summer when lowerwater table conditions occurred. During periods of ac-tive discharge, flow also occurred through the reactor(Fig. 2a). The reactor was not installed into typical aqui-fer sediments, but rather into cobbley gravel that hadsilty marl present as interstitial material. The K of themarl material, based on a single grain size analysis fromthe1.05-m depth, was estimated at ,1024 cm s21 (vanDriel, 2004), which is three orders of magnitude lessthan the fine wood particle medium used in the reactor(0.12 cm s21, Table 1). During active flow periods(53% of the 20-mo monitoring period), flow throughthe reactor ranged from 0.05 to 1.05 L min21 (Fig. 3).During monitoring episodes when quantitative samplingfor NO3–N was undertaken, the mean flow rate was
0.35 6 0.16 L min21 (Table 2), which equates to a one-dimensional flux rate of 69 cm d21.
Nitrate-Nitrogen Treatment
Figure 3 compares influent and effluent NO3–N con-centrations in the Woodstock reactor during the 20-momonitoring period. The mean influent NO3–N concen-tration of 11.5 6 0.2 mg L21 was attenuated by an aver-age of 3.8 6 1.7 mg L21 in the reactor, and a meanreaction rate of 4.5 6 2.5 mg L21 d21, or 0.7 g m22 d21,was indicated (Table 2). The mean reactor effluenttemperature was 9 6 28C (Table 2). The high flux ratethrough the reactor (mean of 69 cm d21) makes it un-likely that attenuation was the result of effects such asdilution from precipitation, and it is assumed to be pre-dominantly the result of denitrification. Figure 4 showsthe amount of NO3–N removal in relation to hydraulicretention time. Excluded are sampling events: (i) fromthe first 2 mo of operation when higher rates of DOC(dissolved organic C) leaching were expected (Robert-son and Cherry, 1995); (ii) when effluent NO3–N was,1 mg L21 and NO3-limiting conditions were expected(Keeney, 1986); and (iii) semi-quantitative values ob-tained during Month 7. Most of the data in Fig. 4 (19 of20 values) were obtained from the period of flow ma-nipulation during Months 11 to 14. Longer term (3–7 yr)monitoring of wood particle barriers in other studies
Table 1. Comparison of organic carbon (OC) contents and hy-draulic conductivities (K) of the shallow riparian sediments(soil zone and stream alluvium), the underlying aquifer, and thereactive medium at the Caddy-Bott Creek site.
Location Depth† OC K‡ Sediment type
cm % dry wt. cm s21
Soil zone and stream alluvium
Pit 2 10–40 5.4 soil a, b, silt loamPit 3 10–40 ,1023 soil a, b, silt loamPit 6§ 10–40 ,1024 soil a, b, silt loamCD6 0–5 2.3 alluvium, organic silty
sandCD6 5–10 3.5 “CD6 10–15 5.0 ,1025 “CD6 15–20 4.4 “CD6 20–25 3.9 “CD6 25–30 7.0 “CD6 30–35 7.6 ,1025 “CD6 35–40 7.0 “CD6 40–45 7.2 “
Aquifer
CD6 45–50 0.87 gravelly sandCD6 50–55 1.2 4 3 1023 silty sandPit 1 50–70 9 3 1022 coarse sandPit 2 50–70 0.15 4 3 1022 coarse sandPit 3 50–70 0.46 3 3 1021 coarse sandPit 4 50–70 0.39 9 3 1022 gravelly coarse sandPit 5 50–70 9 3 1022 gravelly coarse sandPit 6 50–70 3 3 1022 fine-medium sand
Wood particle medium
Pits 1 and 3 1.2¶ coarse (1–50 mm diam.)Pits 2 and 4 0.12¶ fine (1–5 mm diam.)
†Depths referenced from ground surface (Pits 1–6) or from streambed(core CD6).
‡Value of K determined from grain size curves given in Fig. 6 using theHazen relationship (Freeze and Cherry, 1979).
§ Test pit excavated on south side of creek adjacent to Pit 3.¶ In situ K values of similar media determined by van Driel (2004) fromflow rate and hydraulic gradient measurements.
Reproducedfrom
JournalofEnvironmentalQuality.PublishedbyASA,CSSA,andSSSA.Allcopyrights
reserved.
4 J. ENVIRON. QUAL., VOL. j, j–j 2006
Galley Proof JEQ q05-0027
(Robertson et al., 2000, 2005a; Schipper and Vojvodic-Vukovic, 2001) indicate that removal rates observedafter ,1 yr of operation are likely to be representativeof long-term steady-state conditions. Figure 4 indicatesthat NO3–N removal was generally proportional to HRTup to,1.5 d, after which removal appeared to approach
an asymptotic value of ,6 mg L21. Robertson et al.(2005a), however, report much larger amounts of NO3–N removal of up to,100 mg L21 in similar wood particlereactors treating septic tank effluent. Thus, it is unlikelythat some limitation to N removal exists at these lowerconcentrations. Rather, the three data points on Fig. 4that indicate lower reaction rates are those with thelowest flow rates (80–100 mL min21). These may repre-sent sampling episodes when flow rates declined a shortperiod before sampling, due to water table fluctuationsor fouling of the outlet tubing, and equilibrium at thelower flow rates had not yet been established.Depth profiling through theWoodstock reactor (Fig. 5)
showed that NO3–N concentrations were remarkablyconsistent in the aquifer below the reactor (11.4–11.9 mgL21), but then NO3–N decreased upward through thereactor to a minimum value of 7.9 mg L21 at the top of thereactor. It is unclear why NO3
2 removal appearedfocused in the top half of the reactor, but could berelated to flow path heterogeneities in the medium.Depth profiling of NO3–N in other wood particle reactorshas indicated more uniform removal (van Driel, 2004).This evidence suggests that little or no denitrification was
Fig. 3. Flow rates and NO3–N attenuation in the Woodstock reactorduring 20 mo of operation, beginning 25 Apr. 2002.
Table 2. Flow characteristics and NO3–N removal in the Woodstock and Caddy-Bott Creek reactors.
Reactor NO3–N removal
Pit Vol. Medium n† Flow rate‡ HRT§ Temp. Input NO3–N Amount Rate¶
L mL min21 cm d21 d �C mg L21 mg L21 d21 g m22 d21
Woodstock
730 fine 20 350 6 160 69 1.0 6 0.7 9 6 2 11.5 6 0.2 3.8 6 1.7 4.5 6 2.5 0.7Caddy-Bott Creek
Pit 1 210 coarse 6 18 6 3 9 5.6 6 1.1 13 6 1 28.8 6 10.6 18.3 6 5.9 3.2 6 0.7 1.5Pit 2 210 fine 8 69 6 34 33 1.4 6 0.6 13 6 1 23.7 6 12.8 14.6 6 11.2 9.9 6 6.0 3.5Pit 3 210 coarse 5 41 6 30 20 4.4 6 2.9 13 6 1 35.1 6 5.1 20.6 6 7.6 7.8 6 5.4 3.4Pit 4 210 fine 6 33 6 13 16 2.6 6 1.0 13 6 1 29.6 6 8.6 12.1 6 5.0 5.0 6 2.1 1.8
†Number of measurements during active flow: Woodstock site monitoring period 25 Apr. 2002 to 9 Dec. 2003, excluding first 2 mo of operation, semi-quantitative analyses during Month 7, and monitoring events with low flow (,50 mL min21) or effluent NO3–N ,1 mg L21; Caddy-Bott Creek sitemonitoring period 4 to 31 Oct. 2003, data from van Driel (2004).
‡Values reported are the means and standard deviations.§Hydraulic retention time; mean value calculated from individual sampling events assuming effective porosity of 0.47 for the fine medium and 0.70 for thecoarse medium.
¶Mean values calculated from individual sampling events.
Fig. 4. Nitrate-N attenuation vs. hydraulic retention time in theWoodstock reactor. Data from the first 2 mo of operation, semi-quantitative analyses from Month 7, and monitoring events wheneffluent NO3–N was,1 mg L21 or flow rate was,50 mL min21 areexcluded.
Reproducedfrom
JournalofEnvironmentalQuality.PublishedbyASA,CSSA,andSSSA.Allcopyrights
reserved.
5VAN DRIEL ET AL.: RIPARIAN ZONE NITRATE TREATMENT
Galley Proof JEQ q05-0027
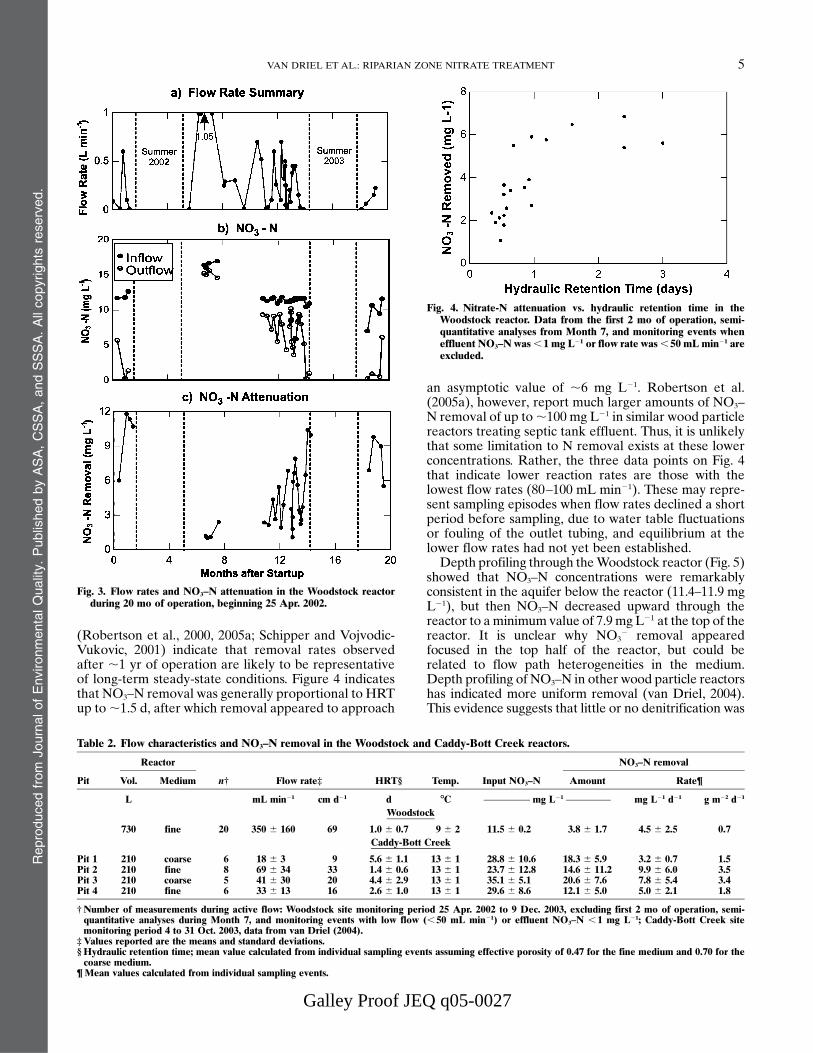
occurring in the underlying sediments, which had low OCcontent (0.66% dry wt at 1.05-m depth, van Driel, 2004).The zone of NO3 depletion in the reactor is accompaniedby an increase in alkalinity, from ,70 to 97 mg L21 asCaCO3, and sporadically lower Eh values, as lowas142 mV (Fig. 5), both of which are consistent withdenitrifying conditions (Mitsch and Gosselink, 2000).Removal of 4 mg L21 of NO3–N would be expected togenerate 18mg L21 of alkalinity (fromEq. [1]) if all of theCO2 generated dissolves. This is reasonably close to theincrease observed, considering the data scatter. Inprevious studies of wood particle barriers, isotopic en-richment of 15N in the residual NO3 has also providedevidence of denitrification (Robertson et al., 2000). Littlechange in pH was observed in the reactor compared withthe underlying sediments (7.1–7.5).
Caddy-Bott Creek SiteGround Water Flow
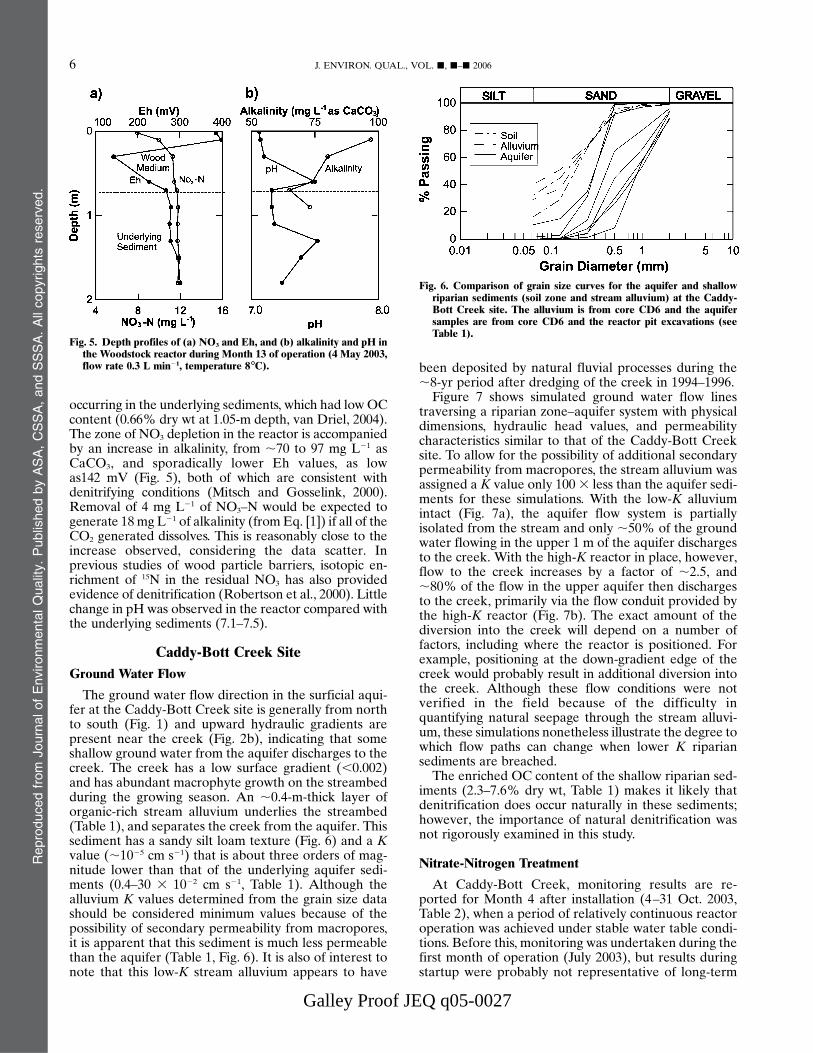
The ground water flow direction in the surficial aqui-fer at the Caddy-Bott Creek site is generally from northto south (Fig. 1) and upward hydraulic gradients arepresent near the creek (Fig. 2b), indicating that someshallow ground water from the aquifer discharges to thecreek. The creek has a low surface gradient (,0.002)and has abundant macrophyte growth on the streambedduring the growing season. An ,0.4-m-thick layer oforganic-rich stream alluvium underlies the streambed(Table 1), and separates the creek from the aquifer. Thissediment has a sandy silt loam texture (Fig. 6) and a Kvalue (,1025 cm s21) that is about three orders of mag-nitude lower than that of the underlying aquifer sedi-ments (0.4–30 3 1022 cm s21, Table 1). Although thealluvium K values determined from the grain size datashould be considered minimum values because of thepossibility of secondary permeability from macropores,it is apparent that this sediment is much less permeablethan the aquifer (Table 1, Fig. 6). It is also of interest tonote that this low-K stream alluvium appears to have
been deposited by natural fluvial processes during the,8-yr period after dredging of the creek in 1994–1996.
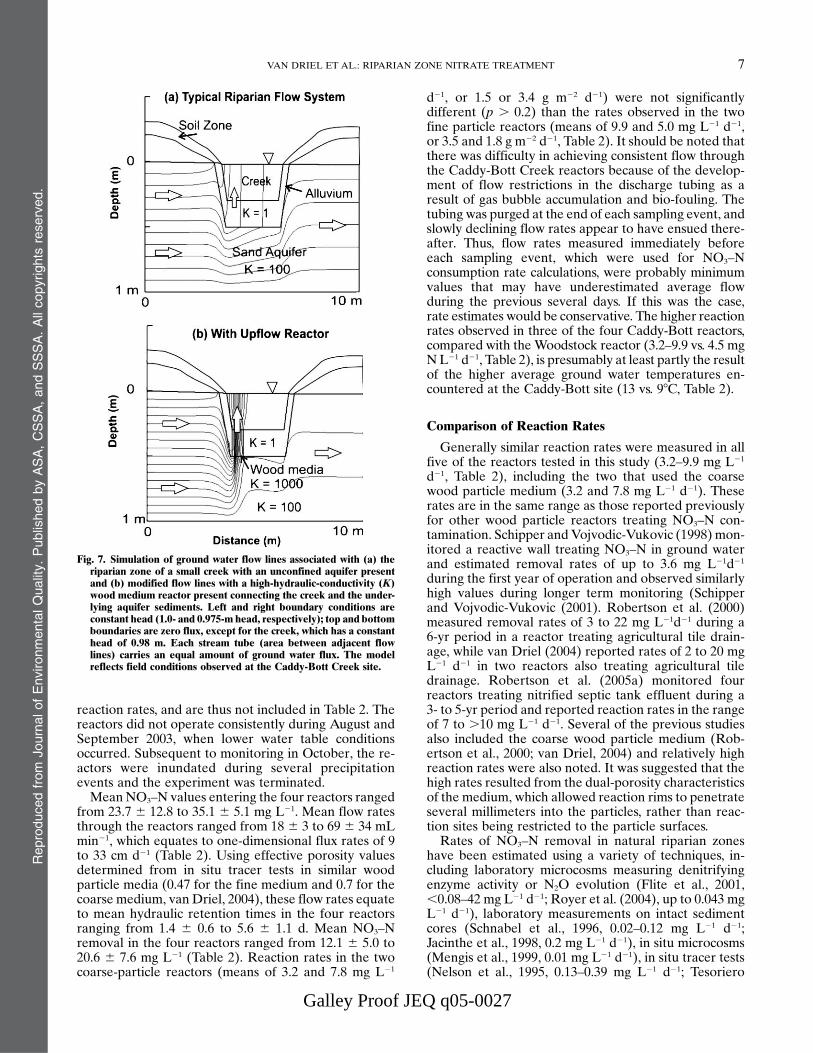
Figure 7 shows simulated ground water flow linestraversing a riparian zone–aquifer system with physicaldimensions, hydraulic head values, and permeabilitycharacteristics similar to that of the Caddy-Bott Creeksite. To allow for the possibility of additional secondarypermeability from macropores, the stream alluvium wasassigned a K value only 1003 less than the aquifer sedi-ments for these simulations. With the low-K alluviumintact (Fig. 7a), the aquifer flow system is partiallyisolated from the stream and only ,50% of the groundwater flowing in the upper 1 m of the aquifer dischargesto the creek. With the high-K reactor in place, however,flow to the creek increases by a factor of ,2.5, and,80% of the flow in the upper aquifer then dischargesto the creek, primarily via the flow conduit provided bythe high-K reactor (Fig. 7b). The exact amount of thediversion into the creek will depend on a number offactors, including where the reactor is positioned. Forexample, positioning at the down-gradient edge of thecreek would probably result in additional diversion intothe creek. Although these flow conditions were notverified in the field because of the difficulty inquantifying natural seepage through the stream alluvi-um, these simulations nonetheless illustrate the degree towhich flow paths can change when lower K ripariansediments are breached.
The enriched OC content of the shallow riparian sed-iments (2.3–7.6% dry wt, Table 1) makes it likely thatdenitrification does occur naturally in these sediments;however, the importance of natural denitrification wasnot rigorously examined in this study.
Nitrate-Nitrogen Treatment
At Caddy-Bott Creek, monitoring results are re-ported for Month 4 after installation (4–31 Oct. 2003,Table 2), when a period of relatively continuous reactoroperation was achieved under stable water table condi-tions. Before this, monitoring was undertaken during thefirst month of operation (July 2003), but results duringstartup were probably not representative of long-term
Fig. 5. Depth profiles of (a) NO3 and Eh, and (b) alkalinity and pH inthe Woodstock reactor during Month 13 of operation (4 May 2003,flow rate 0.3 L min21, temperature 8�C).
Fig. 6. Comparison of grain size curves for the aquifer and shallowriparian sediments (soil zone and stream alluvium) at the Caddy-Bott Creek site. The alluvium is from core CD6 and the aquifersamples are from core CD6 and the reactor pit excavations (seeTable 1).
Reproducedfrom
JournalofEnvironmentalQuality.PublishedbyASA,CSSA,andSSSA.Allcopyrights
reserved.
6 J. ENVIRON. QUAL., VOL. j, j–j 2006
Galley Proof JEQ q05-0027
reaction rates, and are thus not included in Table 2. Thereactors did not operate consistently during August andSeptember 2003, when lower water table conditionsoccurred. Subsequent to monitoring in October, the re-actors were inundated during several precipitationevents and the experiment was terminated.
Mean NO3–N values entering the four reactors rangedfrom 23.7 6 12.8 to 35.1 6 5.1 mg L21. Mean flow ratesthrough the reactors ranged from 18 6 3 to 69 6 34 mLmin21, which equates to one-dimensional flux rates of 9to 33 cm d21 (Table 2). Using effective porosity valuesdetermined from in situ tracer tests in similar woodparticle media (0.47 for the fine medium and 0.7 for thecoarse medium, vanDriel, 2004), these flow rates equateto mean hydraulic retention times in the four reactorsranging from 1.4 6 0.6 to 5.6 6 1.1 d. Mean NO3–Nremoval in the four reactors ranged from 12.1 6 5.0 to20.6 6 7.6 mg L21 (Table 2). Reaction rates in the twocoarse-particle reactors (means of 3.2 and 7.8 mg L21
d21, or 1.5 or 3.4 g m22 d21) were not significantlydifferent (p . 0.2) than the rates observed in the twofine particle reactors (means of 9.9 and 5.0 mg L21 d21,or 3.5 and 1.8 g m22 d21, Table 2). It should be noted thatthere was difficulty in achieving consistent flow throughthe Caddy-Bott Creek reactors because of the develop-ment of flow restrictions in the discharge tubing as aresult of gas bubble accumulation and bio-fouling. Thetubing was purged at the end of each sampling event, andslowly declining flow rates appear to have ensued there-after. Thus, flow rates measured immediately beforeeach sampling event, which were used for NO3–Nconsumption rate calculations, were probably minimumvalues that may have underestimated average flowduring the previous several days. If this was the case,rate estimates would be conservative. The higher reactionrates observed in three of the four Caddy-Bott reactors,compared with the Woodstock reactor (3.2–9.9 vs. 4.5 mgNL21 d21, Table 2), is presumably at least partly the resultof the higher average ground water temperatures en-countered at the Caddy-Bott site (13 vs. 98C, Table 2).
Comparison of Reaction Rates
Generally similar reaction rates were measured in allfive of the reactors tested in this study (3.2–9.9 mg L21
d21, Table 2), including the two that used the coarsewood particle medium (3.2 and 7.8 mg L21 d21). Theserates are in the same range as those reported previouslyfor other wood particle reactors treating NO3–N con-tamination. Schipper andVojvodic-Vukovic (1998) mon-itored a reactive wall treating NO3–N in ground waterand estimated removal rates of up to 3.6 mg L21d21
during the first year of operation and observed similarlyhigh values during longer term monitoring (Schipperand Vojvodic-Vukovic (2001). Robertson et al. (2000)measured removal rates of 3 to 22 mg L21d21 during a6-yr period in a reactor treating agricultural tile drain-age, while van Driel (2004) reported rates of 2 to 20 mgL21 d21 in two reactors also treating agricultural tiledrainage. Robertson et al. (2005a) monitored fourreactors treating nitrified septic tank effluent during a3- to 5-yr period and reported reaction rates in the rangeof 7 to .10 mg L21 d21. Several of the previous studiesalso included the coarse wood particle medium (Rob-ertson et al., 2000; van Driel, 2004) and relatively highreaction rates were also noted. It was suggested that thehigh rates resulted from the dual-porosity characteristicsof the medium, which allowed reaction rims to penetrateseveral millimeters into the particles, rather than reac-tion sites being restricted to the particle surfaces.Rates of NO3–N removal in natural riparian zones
have been estimated using a variety of techniques, in-cluding laboratory microcosms measuring denitrifyingenzyme activity or N2O evolution (Flite et al., 2001,,0.08–42 mg L21 d21; Royer et al. (2004), up to 0.043 mgL21 d21), laboratory measurements on intact sedimentcores (Schnabel et al., 1996, 0.02–0.12 mg L21 d21;Jacinthe et al., 1998, 0.2 mg L21 d21), in situ microcosms(Mengis et al., 1999, 0.01 mg L21 d21), in situ tracer tests(Nelson et al., 1995, 0.13–0.39 mg L21 d21; Tesoriero
Reproducedfrom
JournalofEnvironmentalQuality.PublishedbyASA,CSSA,andSSSA.Allcopyrights
reserved.
Fig. 7. Simulation of ground water flow lines associated with (a) theriparian zone of a small creek with an unconfined aquifer presentand (b) modified flow lines with a high-hydraulic-conductivity (K)wood medium reactor present connecting the creek and the under-lying aquifer sediments. Left and right boundary conditions areconstant head (1.0- and 0.975-m head, respectively); top and bottomboundaries are zero flux, except for the creek, which has a constanthead of 0.98 m. Each stream tube (area between adjacent flowlines) carries an equal amount of ground water flux. The modelreflects field conditions observed at the Caddy-Bott Creek site.
7VAN DRIEL ET AL.: RIPARIAN ZONE NITRATE TREATMENT
Galley Proof JEQ q05-0027
et al., 2000, 0.53 mg L21 d21) and field mass balanceestimates (Peterjohn and Correll, 1984, 0.035 mg L21
d21; Jorden et al., 1993, 0.031–0.072 mg L21 d21;Tesoriero et al., 2000, 0.0038–0.01 mg L21 d21; Fliteet al., 2001, 0.42–2.9 mg L21 d21). Only a few of theseestimates for natural riparian zones approach the ratesmeasured in our reactors. Flite et al. (2001) reportedNO3–N consumption as high as 42 mg L21 d21 in lab-oratory microcosms using soil A horizon material im-pacted by NO3
2 from domestic wastewater, and at thesame site estimated consumption of 0.4 to 2.9 mg L21 d21
based on field mass balance considerations. Most otherreported rates are much lower than the direct in situvalues obtained in our study. It is important to point out,however, that although natural rates may be lower, thelarge areal extent of many riparian zones can still pro-vide for substantial mass removal. Where unit conver-sions were required for the above rate comparisons, theriparian zone sediments were assumed to be 1.0 m indepth, with soil particle density of 2.65 g cm21 and po-rosity of 0.35, unless specified otherwise.
Long-Term OperationIf it is assumed that all of the observed NO3–N loss is
the result of denitrification (Eq. [1]), the approximatelifespan of these reactors can be estimated based ontheir contained Cmass and rate of NO3–N removal (e.g.,Robertson et al., 2000). Using the mean flow and re-moval rates from Table 2, NO3–N consumption in theWoodstock reactor, when operating, was 1.9 g d21, whichwould require 2.0 g C d21. If the reactor operates 53% ofthe time (193 d yr21), annual C consumption would be400 g. The Woodstock reactor contains ,90 kg of OC(,120 kg C m23 3 0.73 m3), thus about 0.4% would beconsumed annually. Likewise, the mean flow andremoval rates in the Caddy-Bott Creek reactors indicateNO3–N consumption of 0.47 to 1.22 g d21, which wouldrequire 0.50 to 1.2 g C d21. If these reactors alsooperated 53% of the time, annual C consumption wouldbe 97 to 230 g C yr21. Each reactor contains ,25 kg C(120 kg C m23 3 0.21 m3), thus 0.4 to 0.9% would beconsumed annually. These calculations are presented fordiscussion purposes only, as it is uncertain what fractionof the OC will ultimately be suitably labile to supportdenitrification and other reactions, such as reduction ofdissolved O2 and SO4
22, will also consume C. None-theless, the potential for long-term operation is illus-trated. Robertson et al. (2000) documented up to 7 yr ofoperation of four wood-medium reactors treating NO3
2
from septic systems and agricultural tile drainage with-out noting an obvious decline in treatment effectivenessduring that period. Schipper and Vojvodic-Vukovic(2001) documented 5 yr of operation of a wood particlewall treating ground water NO3
2 and observed consis-tent removal during that period. Successful long-termoperation of reactors such as these will more likely de-pend on hydraulic factors related to clogging from gasbubble accumulation, bio-fouling, and inundation. Fu-ture demonstrations should further address longer termhydraulic performance.
CONCLUSIONS AND RECOMMENDATIONSThis study has demonstrated the feasibility of using
wood-particle reactors to passively augment NO32 re-
moval in riparian zones. Reactive media with K valuesan order of magnitude or more greater than associatedriparian sediments can have a substantial ability to cap-ture ground water flow within riparian environments.At the ground water temperatures encountered in thisstudy (9–138C), the reactors achieved mean NO3–N re-moval rates of 3.2 to 9.9 mg L21d21 (0.7–3.5 g m22 d21),which are higher than the removal rates reported formost natural riparian zones. Similarly high reaction ratesobserved in the coarse-particle reactors suggests that thecoarse medium can be used to achieve improved flowconvergence without sacrificing treatment performance.The challenge of achieving consistent and controllableflow through such reactors should be lessened in largerinstallations with higher flow rates. At some sites, it maybe preferable to site the reactors farther away from thestream edge to minimize flow variations and inundationproblems associated with stream fluctuations. The useof variable-height discharge tubing appears to be aneffective technique for assisting with flow control. Thereactors contain sufficientOC to potentially sustain deni-trification for a number of years.
Simplicity of construction and the low cost of the re-active medium could allow reactors such as these to beconsidered for larger scale, cost-effective NO3
2 controlat some sites, particularly where natural denitrification isinadequate. At sites where natural denitrification alreadyoccurs, however, the use of engineered systems shouldbe considered carefully. Although natural removal ratesmay be lower, the larger size of many riparian zones,compared with any reactive barrier likely to be con-structed, already provides for considerable mass remov-al in many cases. This raises the possibility that totalmass removal could actually decrease after installationof a reactive barrier if substantial ground water is di-verted into the barrier and much shorter overall hy-draulic retention times in the denitrifying environmentensue. Additional studies should further examine theimportance of natural denitrification in riparian zoneswhere thicker aquifers are present.
REFERENCESBlowes, D.W., W.D. Robertson, C.J. Ptacek, and C. Merkley. 1994.
Removal of agricultural nitrate from tile-drainage effluent waterusing in-line bioreactors. J. Contam. Hydrol. 15:207–221.
Bohlke, J.K., and J.M. Denver. 1995. Combined use of groundwaterdating, chemical, and isotopic analyses to resolve the history andfate of nitrate contamination in two agricultural watersheds, Atlan-tic Coastal Plain, Maryland. Water Resour. Res. 31:2319–2339.
Canter, L.W. 1996. Nitrates in groundwater. Lewis Publ., New York.Ehrlich, H.L. 1990. Geomicrobiology. 2nd ed. Marcel Dekker,
New York.Fleischer, S., and L. Stibe. 1989. Agriculture kills marine fish in the
1980’s. Who is responsible for fish kills in the year 2000? Ambio 18:3347–3350.
Flite, O.P., III, R.D. Shannon, R.R. Schnabel, and R.R. Parizek. 2001.Nitrate removal in a riparian wetland of the Appalachian Valleyand Ridge physiographic province. J. Environ. Qual. 30:254–261.
Freeze, R.A., and J.A. Cherry. 1979. Groundwater. Prentice Hall,Englewood Cliffs, NJ.
Reproducedfrom
JournalofEnvironmentalQuality.PublishedbyASA,CSSA,andSSSA.Allcopyrights
reserved.
8 J. ENVIRON. QUAL., VOL. j, j–j 2006
Galley Proof JEQ q05-0027
Gold, A.J., P.A. Jacinthe, P.M. Groffman, W.R. Wright, and R.H.Puffer. 1998. Patchiness in groundwater nitrate removal in a ripa-rian forest. J. Environ. Qual. 27:146–155.
Groffman, P.M., G. Howard, A.J. Gold, and W.M. Nelson. 1991. Mi-crobial NO3 processing in shallow ground water in a riparian forest.J. Environ. Qual. 25:1309–1316.
Heiri, O., A.F. Lotter, and G. Lemcke. 2001. Loss on ignition as amethod for estimating organic and carbonate content of sediments:Reproducibility and comparability of results. J. Paleolimnol. 25:101–110.
Hill, A.R. 1996. Nitrate removal in stream riparian zones. J. Environ.Qual. 25:743–755.
Jacinthe, P.A., P.M. Groffman, A.J. Gold, and A. Mosier. 1998.Patchiness in microbial nitrogen transformations in groundwater ina riparian forest. J. Environ. Qual. 27:156–164.
Jorden, T.E., D.L. Correll, and D.E. Weller. 1993. Nutrient intercep-tion by a riparian forest receiving inputs from adjacent cropland.J. Environ. Qual. 22:467–473.
Keeney, D. 1986. Sources of nitrate to groundwater. Crit. Rev. Environ.Control 16:257–304.
Lambe, T.W. 1951. Soil testing for engineers. John Wiley & Sons,New York.
Lowrance, R.R. 1992. Groundwater NO3 and denitrification in acoastal riparian forest. J. Environ. Qual. 21:401–405.
Mengis, M., S.L. Schiff, M. Harris, M.C. English, R. Aravena, R.J.Elgood, and A. MacLean. 1999. Multiple geochemical and isotopicapproaches for assessing ground water NO3
2 elimination in a ripar-ian zone. Ground Water 37:448–457.
Mitsch, W.J., and J.G. Gosselink. 2000. Wetlands. 3rd ed. J. Wiley &Sons, Toronto, ON, Canada.
Molson, J., and E.O. Frind. 2000. FLONET; User guide version 5.0.Two-dimensional steady-state flownet model. Dep. of EarthSciences, Univ. of Waterloo, Waterloo, ON, Canada.
Nelson, W.M., A.J. Gold, and P.M. Groffman. 1995. Spatial andtemporal variation in groundwater nitrate removal in a riparianforest. J. Environ. Qual. 24:691–699.
Nordstrom, D.K. 1977. Thermodynamic redox equilibria of Zobell’ssolution. Geochim. Cosmochim. Acta 41:1835–1841.
Ontario Stewardship Centre. 2004. Agriculture and wildlife: CaddyBott agricultural drain for wildlife habitat enhancement. Project22-13. Ontario Stewardship Centre, ON, Canada. Available at www.stewardshipcentre.on.ca/allDemoProjects/demoDisplay.asp?request_no=206 (verified 26 Oct. 2005).
Osborne, L.L., and D.A. Kovacic. 1993. Riparian vegetated bufferstrips in water-quality restoration and stream management. Fresh-water Biol. 29:243–258.
Panno, S.V., and W.R. Kelly. 2004. Nitrate and herbicide loading intwo groundwater basins of Illinois’ sinkhole plain. J. Hydrol.(Amsterdam) 290:229–242.
Peterjohn, W.T., and D.L. Correll. 1984. Nutrient dynamics in an agri-cultural watershed: Observations on the role of a riparian forest.Ecology 65:1466–1475.
Puckett, L.J., T.K. Cowdery, P.B. McMahon, L.H. Tornes, and J.D.Stoner. 2002. Using chemical, hydrologic, and age dating analysisto delineate redox processes and flow paths in the riparian zoneof a glacial outwash aquifer–stream system. Water Resour. Res. 38:9-1–9-20.
Robertson, W.D., D.W. Blowes, and C.J. Ptacek. 1994. Treatment ofcontaminated agricultural run-off. U.S. Patent 5 330 651. Dateissued: 19 July.
Robertson, W.D., D.W. Blowes, C.J. Ptacek, and J.A. Cherry. 2000.Long-term performance of in situ reactive barriers for nitrate re-mediation. Ground Water 38:689–695.
Robertson, W.D., and J.A. Cherry. 1995. In situ denitrification of septic-system nitrate using reactive porous media barriers: Field trials.Ground Water 33:99–111.
Robertson, W.D., G.I. Ford, and P.S. Lombardo. 2005a. Wood-basedfilter for nitrate removal in septic systems. Trans. ASAE 48:121–128.
Robertson, W.D., N. Yeung, P.W. van Driel, and P.S. Lombardo. 2005b.High permeability layers for remediation of ground water: Go wide,not deep. Ground Water 43:574–581.
Royer, T.V., J.L. Tank, and M.B. David. 2004. Transport and fateof nitrate in headwater agricultural streams in Illinois. J. Environ.Qual. 33:1296–1304.
Sado, E.V., and U.J. Vagners. 1972. Surficial geology of the St. Mary’sarea. Map sheet 40P/3. Ontario Ministry of Natural Resources,Toronto, ON, Canada.
Schipper, L.A., G.F. Barkle, J.C. Hadfield, M. Vojvodic-Vukovic, andC.P. Burgess. 2004. Hydraulic constraints on the performance of agroundwater denitrification wall for nitrate removal from shallowgroundwater. J. Contam. Hydrol. 69:263–279.
Schipper, L.A., and M. Vojvodic-Vukovic. 1998. Nitrate removal fromgroundwater using a denitrification wall amended with sawdust:Field trial. J. Environ. Qual. 27:664–668.
Schipper, L.A., and M. Vojvodic-Vukovic. 2001. Five years of nitrateremoval, denitrification and carbon dynamics in a denitrificationwall. Water Res. 35:3473–3477.
Schnabel, R.R., L.F. Cornish, W.L. Stout, and J.A. Shaffer. 1996.Denitrification in a grassed and a wooded valley and ridge, riparianecotone. J. Environ. Qual. 25:1230–1235.
Simmons, R.C., A.J. Gold, and P.M. Groffman. 1992. Nitrate dynamicsin riparian forests: Groundwater studies. J. Environ. Qual. 21:659–665.
Tesoriero, A.J., H. Liebscher, and S.E. Cox. 2000. Mechanisms andrate of denitrification in an agricultural watershed: Electron andmass balance along groundwater flow paths. Water Resour. Res.36:1545–1559.
van Driel, P.W. 2004. Enhancing denitrification of agricultural tiledrainage and discharging groundwater in riparian zones using woodmedia reactors. MS thesis. Dep. of Earth Sci., Univ. of Waterloo,Waterloo, ON, Canada.
Young, R.A., T. Huntrods, and W. Anderson. 1980. Effectiveness ofvegetated buffer strips in controlling pollution from feedlot runoff.J. Environ. Qual. 9:483–487.
Reproducedfrom
JournalofEnvironmentalQuality.PublishedbyASA,CSSA,andSSSA.Allcopyrights
reserved.
9VAN DRIEL ET AL.: RIPARIAN ZONE NITRATE TREATMENT
Galley Proof JEQ q05-0027