De Beukelaer, C. (2014) “Creative Industries in ‘Developing’ Countries: Questioning Country...
22
This article was downloaded by: [University of Leeds] On: 03 January 2015, At: 03:25 Publisher: Routledge Informa Ltd Registered in England and Wales Registered Number: 1072954 Registered office: Mortimer House, 37-41 Mortimer Street, London W1T 3JH, UK Click for updates Cultural Trends Publication details, including instructions for authors and subscription information: http://www.tandfonline.com/loi/ccut20 Creative industries in “developing” countries: Questioning country classifications in the UNCTAD creative economy reports Christiaan De Beukelaer a a Institute of Communications Studies, University of Leeds, Leeds, UK Published online: 28 May 2014. To cite this article: Christiaan De Beukelaer (2014) Creative industries in “developing” countries: Questioning country classifications in the UNCTAD creative economy reports, Cultural Trends, 23:4, 232-251, DOI: 10.1080/09548963.2014.912043 To link to this article: http://dx.doi.org/10.1080/09548963.2014.912043 PLEASE SCROLL DOWN FOR ARTICLE Taylor & Francis makes every effort to ensure the accuracy of all the information (the “Content”) contained in the publications on our platform. However, Taylor & Francis, our agents, and our licensors make no representations or warranties whatsoever as to the accuracy, completeness, or suitability for any purpose of the Content. Any opinions and views expressed in this publication are the opinions and views of the authors, and are not the views of or endorsed by Taylor & Francis. The accuracy of the Content should not be relied upon and should be independently verified with primary sources of information. Taylor and Francis shall not be liable for any losses, actions, claims, proceedings, demands, costs, expenses, damages, and other liabilities whatsoever or howsoever caused arising directly or indirectly in connection with, in relation to or arising out of the use of the Content. This article may be used for research, teaching, and private study purposes. Any substantial or systematic reproduction, redistribution, reselling, loan, sub-licensing, systematic supply, or distribution in any form to anyone is expressly forbidden. Terms &
Transcript of De Beukelaer, C. (2014) “Creative Industries in ‘Developing’ Countries: Questioning Country...

This article was downloaded by: [University of Leeds]On: 03 January 2015, At: 03:25Publisher: RoutledgeInforma Ltd Registered in England and Wales Registered Number: 1072954 Registeredoffice: Mortimer House, 37-41 Mortimer Street, London W1T 3JH, UK
Click for updates
Cultural TrendsPublication details, including instructions for authors andsubscription information:http://www.tandfonline.com/loi/ccut20
Creative industries in “developing”
countries: Questioning country
classifications in the UNCTAD creative
economy reports
Christiaan De Beukelaera
a Institute of Communications Studies, University of Leeds, Leeds,UKPublished online: 28 May 2014.
To cite this article: Christiaan De Beukelaer (2014) Creative industries in “developing” countries:Questioning country classifications in the UNCTAD creative economy reports, Cultural Trends, 23:4,232-251, DOI: 10.1080/09548963.2014.912043
To link to this article: http://dx.doi.org/10.1080/09548963.2014.912043
PLEASE SCROLL DOWN FOR ARTICLE
Taylor & Francis makes every effort to ensure the accuracy of all the information (the“Content”) contained in the publications on our platform. However, Taylor & Francis,our agents, and our licensors make no representations or warranties whatsoever as tothe accuracy, completeness, or suitability for any purpose of the Content. Any opinionsand views expressed in this publication are the opinions and views of the authors,and are not the views of or endorsed by Taylor & Francis. The accuracy of the Contentshould not be relied upon and should be independently verified with primary sourcesof information. Taylor and Francis shall not be liable for any losses, actions, claims,proceedings, demands, costs, expenses, damages, and other liabilities whatsoever orhowsoever caused arising directly or indirectly in connection with, in relation to or arisingout of the use of the Content.
This article may be used for research, teaching, and private study purposes. Anysubstantial or systematic reproduction, redistribution, reselling, loan, sub-licensing,systematic supply, or distribution in any form to anyone is expressly forbidden. Terms &

Conditions of access and use can be found at http://www.tandfonline.com/page/terms-and-conditions
Dow
nloa
ded
by [U
nive
rsity
of L
eeds
] at 0
3:25
03
Janu
ary
2015

Creative industries in “developing” countries: Questioning countryclassifications in the UNCTAD creative economy reports
Christiaan De Beukelaer*
Institute of Communications Studies, University of Leeds, Leeds, UK
The UNCTAD Creative Economy Reports (CERs) are arguably the most influential policy-oriented texts on the global scope and potential of the creative economy. They containarguments for greater policy attention to the creative economy worldwide and statistical datato illustrate their claims. These reports argue that the creative economy is an area of growth,not only in “developed”, but also in “developing” economies. The central argument of thisarticle is that the way the country classification used in the CERs increases the share of“developing countries” in global creative goods exports in contrast to The Organisation forEconomic Co-operation and Development (OECD) and The United Nations DevelopmentProgramme (UNDP) classifications. When singling out China, the share of these countriesdecreases even further. According to The United Nations Conference on Trade andDevelopment (UNCTAD), in 2010, 41 “developed” countries account for 51.18 per cent and158 “developing” countries for 48.03 per cent of the global creative economy with 17economies in transition accounting for 0.79 per cent. This obfuscates reality and obstructsthe creation of evidence-based policies relevant to the creative industries. The classificationof developed and developing countries is redrawn in accordance with building on data onthe export of creative goods, provided by UNCTADstat. This article proposes that a morecorrect, balanced, and disaggregated outlook on the classification of countries is neededbecause one single “developing country” (China) is the single biggest exporter of creativegoods in the world (25.51 per cent in 2010) yet the 49 “least developed countries” accountfor merely 0.11 per cent of creative goods exports (in 2010) while they comprise 880million people (or some 12 per cent of the world’s population). In conclusion, it is arguedthat different kinds of developing countries need different approaches and policies.Reference is made to Burkina Faso to illustrate this point.
Keywords: creative economy; creative industries; cultural industries; UNCTAD; humandevelopment; culture
The UNCTAD creative economy reports
The Economist picked up the optimistic discourse about the global creative economy. In an articleon the music industries in “Africa”, the newspaper indicated that:
A 2010 UN report claims that demand for music and other “creative industry” products has remainedstable during the global recession, and global exports of creative goods and services, e.g. music, morethan doubled between 2002 and 2008. The report concluded that for developing countries, creativeindustries could prove to be “one of the most dynamic sectors of world commerce”. (The Economist,2011, emphasis mine)
© 2014 Taylor & Francis
*Email: [email protected]
Cultural Trends, 2014Vol. 23, No. 4, 232–251, http://dx.doi.org/10.1080/09548963.2014.912043
Dow
nloa
ded
by [U
nive
rsity
of L
eeds
] at 0
3:25
03
Janu
ary
2015

This article aims to challenge this optimistic tone. Yet it will neither argue that there is nogrowth in this sector in developing countries, nor will it aim to undermine the efforts made tobank on cultural and creative potential throughout the world. The claim is, however, that acloser look at the data is needed to draw more balanced and context-dependent conclusions.Some “developing countries” (such as China) are doing well, yet some (Burkina Faso, forexample) show less advancement in these statistics. The differences between countries andwithin regions will serve as a basis to provide a more accurate and constructive reading onthe (scarcely available) data on the cultural and creative industries (CCIs) worldwide. Theclassification of developed and developing countries presented in the Creative EconomyReports (UNCTAD & UNDP, 2008, 2010) increases the absolute and relative shares of devel-oping countries in the global creative economy. This obfuscates reality and obstructs the cre-ation of evidence-based policies relevant to the creative industries. The core of this argumentis built on a critical reinterpretation of the data presented in the Creative Economy Reports(henceforth “CERs” or “Reports”) and the datasets available on the UNCTADstat website.1
As such, exactly the same data are used as in the Reports, yet different conclusions will bedrawn.2
The Creative Economy Reports aim to provide those working in, on, and for the creativesector with data to feed into well-informed policies. Moreover, they offer political arguments topay greater attention to this cultural-cum-economic sector, and provide academics, consultants,and policymakers with a wealth of data to develop empirically informed (comparative) ana-lyses. The online availability of these data through the UNCTADstat interface facilitatesaccess. It is thus no great surprise that many turn to The United Nations Conference onTrade and Development (UNCTAD) and the CERs for information, data, and examples onthe creative economy.
Many countries take the notion of the cultural or creative economy as a key element intheir (sustainable) development strategies. Arterial Network, a pan African umbrella organ-ization for the cultural sector, has organized the annual African Creative Economy confer-ence since 2011.3 The Lebanese capital Beirut has its own creative city strategy thatcapitalizes on the cultural economy to revitalize parts of the urban area (Hill, 2008).Burkina Faso (2010), on the other hand, explicitly ascribed the cultural industries a consider-able role in its national development strategy.4 The Secretariat of the Pacific Communityrecognized the CCIs as an important economic sector (SPC, 2011). The Caribbean(CARICOM) countries took up the cultural industries in their free trade agreements withthe European Union (KEA, 2011). In South-East Asia, Indonesia set up a Ministry forTourism and Creative Economy in 2011.5 China has been focusing on the CCIs since2001 (Hui, 2006; Keane, 2013). And the group of ACP countries runs a support programorganized by their secretariat and funded through their structural cooperation with the Euro-pean Commission Directory General for Development Cooperation. However, it remainsunclear to what extent these policies are taken seriously and move beyond mere discursiveoptimism about the potential of the sector.
These are but a few examples, as attention to the CCIs is more rule than an exception today,when the expedience of culture seems hegemonic (Yúdice, 2003). While the CERs are not alonein influencing the debate –many actions have been taken prior to their publication – they did helppushing the policy agenda on a global level. Yet academic engagement with the rapidly spreadingimportance of the CCIs is lagging behind. Key academic works on the CCIs have generally paiddisproportionally little attention to countries beyond the (often Anglophone) West (see, forexample, Hesmondhalgh, 2013). Other titles are the exceptions that confirm the rule (Barrow-clough & Kozul-Wright, 2008; Flew, 2013).
Cultural Trends 233
Dow
nloa
ded
by [U
nive
rsity
of L
eeds
] at 0
3:25
03
Janu
ary
2015
What is the problem, exactly?
The way developed and developing countries are classified in the CERs unjustly increases theshare of developing countries. According to UNCTAD, in 2010, 41 developed countriesaccount for 51.18 per cent and 158 developing countries for 48.03 per cent of the global creativeeconomy with 17 economies in transition accounting for a mere 0.79 per cent – that is, accordingto the country classification provided in the UNCTAD CERs, and in the UNCTADstat database(see Table 2). The classification used is the one provided by UNdata. Yet no rationale for the div-ision of countries is given in the CERs on the UNdata website.6
However, in the same year, following the classification system of the Development AidCommittee (DAC) of the Organisation for Economic Co-operation and Development (OECD),developed countries account for 62.71 per cent and developing countries account for 37.29 percent of global creative goods exports (see Table 6). Here, the basis for classification is simple:those countries receiving official development aid (recognized by the OECD-DAC) are develop-ing countries.
The United Nations Development Programme (UNDP) Human Development Reports (HDR),arguably providing the most balanced and refined outlook on the problematic classification ofdeveloping countries, provide a demarcation only marginally different from that of the OECD.Developed countries account for 60.81 per cent of global exports in creative goods in 2010,while developing countries have a 37.25 per cent share. Of the remaining countries, accountingfor 1.48 per cent, no Human Development Index (HDI) data is available (see Table 7).
First of all, it is problematic that OECD and UNDP provide similar classifications that differsignificantly from the developing/developed dichotomy put forward in the UNCTAD CreativeEconomy Reports. Building on OECD-DAC and UNDP classifications provides a far more accu-rate and nuanced basis to understand which specific countries fare well in the global creativeeconomy and which do not.
China provides a case in point. Given the vast share of this country in global trade, it may beuseful to exclude the country from the developing/developed dichotomy. Based on the CER classi-fication the country represents 25.51 per cent of the global exports in creative goods in 2010, ren-dering it the single biggest creative goods exporter, while developing countries have to settle at acombined share of 22.50 per cent in the same year. Following the OECD classification, the share ofdeveloping countries drops to a mere 11.58 per cent. Drawing on the UNDP classification, devel-oping countries account for 13.22 per cent of global exports in creative goods. All developingcountries minus China thus represent around 12 per cent of global exports in the sector, and not22.51 per cent excluding and 48.03 per cent including China as presented in the CERs.
Whether or not China is excluded from the equation, the CERs overestimate the share ofdeveloping countries in global creative goods exports. This is problematic, primarily for tworeasons. First, this overestimation may foster the idea that developing countries already have alarge share of the global market, and that most policy attention should be paid to strengtheningthe domestic workings of the sector. It is, however, clear that global imbalances are rife, withsome 880 million people in 49 “least developed countries” (LDCs) producing a mere 0.11 percent of the global creative goods exports. Second, there is a risk of inverse causation when pro-moting creative industries as a tool for development. Bakker (2008) argues that economic growthincreased leisure time and spiked demand; urbanization subsequently helped turning this demandinto consumption. And the large share of a young population further increased this demand, asthose under 30 form a big potential market. Many “developing” countries have young popu-lations, but these often lack spending power and/or leisure time. Bakker’s argument should notbe transposed to any country, as socio-economic development can take different ways of evol-ving. Yet, the role of increased leisure time and excess spending power merits further scrutiny.
234 C. De Beukelaer
Dow
nloa
ded
by [U
nive
rsity
of L
eeds
] at 0
3:25
03
Janu
ary
2015
Issues with data extend well beyond classification though. The collection of data remains pro-blematic in many countries (Jerven, 2013) and much economic activity takes place in the informalsphere. This article does not underestimate the importance of this issue, yet uses the available datato question the ways classifications are used. The results of this research would, however, lookvery different if informal economies could be taken into account.
Boosting the impact of the creative economy
The pioneering interest of Australia and the UK in the creative economy is locally embedded, andis not easily transferred (Pratt, 2009), yet the ideas have been picked up widely. The Cool Brit-annia approach is, however, not without critique (Oakley, 2004), and neither are the CERs. Trem-blay (2011) argues that the inclusion of some types of commodities (i.e. design) in the creativeeconomy definition of the CERs unjustly increases the economic scope of the sector.7
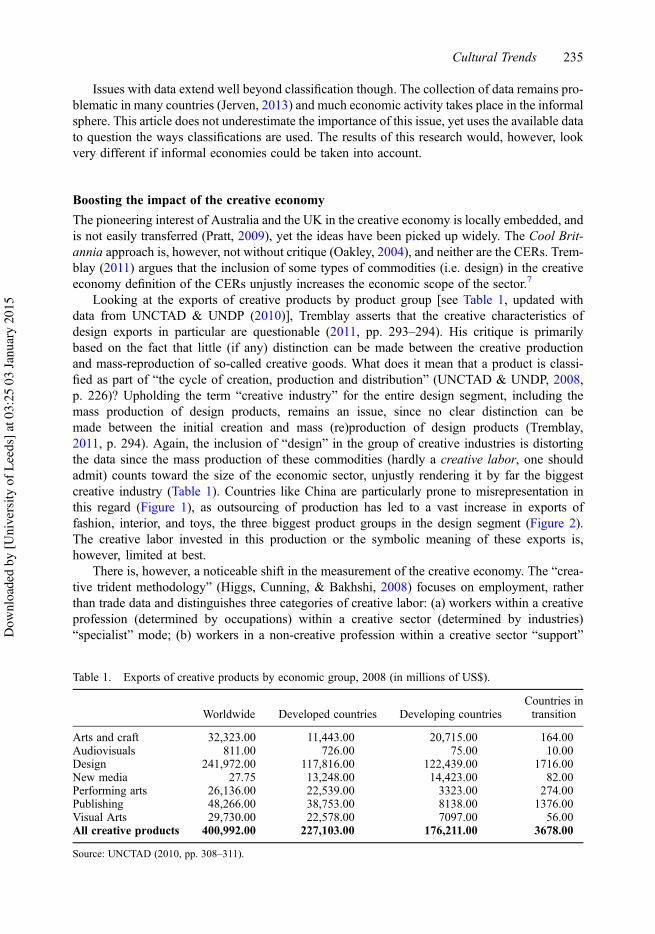
Looking at the exports of creative products by product group [see Table 1, updated withdata from UNCTAD & UNDP (2010)], Tremblay asserts that the creative characteristics ofdesign exports in particular are questionable (2011, pp. 293–294). His critique is primarilybased on the fact that little (if any) distinction can be made between the creative productionand mass-reproduction of so-called creative goods. What does it mean that a product is classi-fied as part of “the cycle of creation, production and distribution” (UNCTAD & UNDP, 2008,p. 226)? Upholding the term “creative industry” for the entire design segment, including themass production of design products, remains an issue, since no clear distinction can bemade between the initial creation and mass (re)production of design products (Tremblay,2011, p. 294). Again, the inclusion of “design” in the group of creative industries is distortingthe data since the mass production of these commodities (hardly a creative labor, one shouldadmit) counts toward the size of the economic sector, unjustly rendering it by far the biggestcreative industry (Table 1). Countries like China are particularly prone to misrepresentation inthis regard (Figure 1), as outsourcing of production has led to a vast increase in exports offashion, interior, and toys, the three biggest product groups in the design segment (Figure 2).The creative labor invested in this production or the symbolic meaning of these exports is,however, limited at best.
There is, however, a noticeable shift in the measurement of the creative economy. The “crea-tive trident methodology” (Higgs, Cunning, & Bakhshi, 2008) focuses on employment, ratherthan trade data and distinguishes three categories of creative labor: (a) workers within a creativeprofession (determined by occupations) within a creative sector (determined by industries)“specialist” mode; (b) workers in a non-creative profession within a creative sector “support”
Table 1. Exports of creative products by economic group, 2008 (in millions of US$).
Worldwide Developed countries Developing countriesCountries intransition
Arts and craft 32,323.00 11,443.00 20,715.00 164.00Audiovisuals 811.00 726.00 75.00 10.00Design 241,972.00 117,816.00 122,439.00 1716.00New media 27.75 13,248.00 14,423.00 82.00Performing arts 26,136.00 22,539.00 3323.00 274.00Publishing 48,266.00 38,753.00 8138.00 1376.00Visual Arts 29,730.00 22,578.00 7097.00 56.00All creative products 400,992.00 227,103.00 176,211.00 3678.00
Source: UNCTAD (2010, pp. 308–311).
Cultural Trends 235
Dow
nloa
ded
by [U
nive
rsity
of L
eeds
] at 0
3:25
03
Janu
ary
2015

mode; and (c) workers in a creative occupation outside the creative industries “embedded” mode(Higgs et al., 2008, p. 27). This method is, however, of limited use in the global context, asreliable and complete data on employment are often lacking.
It is clear from the analysis above that some reservation should be expressed when lookinginto the data presented in the CERs. However, attention should also be paid to the geo-politicallayer to the debate.8 The remainder of the article is divided into two sections. First, the demar-cation of developing/developed countries is questioned. Second, a more bottom-up approach isused to explore the difficulties in Burkina Faso as it tries to strengthen its cultural industries.
Developing or developed: Illustrating the need for nuance
Throughout the introduction above, I made the argument that the classification of developed anddeveloping countries of the CERs is at odds with OECD and UNDP classification systems. This
Figure 2. Chinese “design” exports in 2010.Source: UNCTADstat 2013 – aggregated by the author.
Figure 1. Creative goods exports China in 2010.Source: UNCTADstat 2013 – aggregated by the author.
236 C. De Beukelaer
Dow
nloa
ded
by [U
nive
rsity
of L
eeds
] at 0
3:25
03
Janu
ary
2015

classification has considerable impact on the understanding of the divide between countries and,more importantly, of possible policy approaches toward the creative industries in different socio-economic contexts. This section provides an introductory discussion of distinction between “devel-oped” and “developing” and contrasts datasets as presented in the CERs toOECD/DAC andUNDPclassification systems. This forms the basis for a reinterpretation of data provided by the CERs andthe way the balance of developed and developing countries changes when using OECD/DAC andUNDP classifications. Subsequently, this exercise will be repeated with China singled out. This isnecessary because the second biggest economy in the world and the single biggest exporter of crea-tive goods (US$97,753 million) is counted as a developing country.9
Developed or developing?
The statistical annex of the CERs shows that Japan and Israel are presented as the two sole “devel-oped” countries of Asia (UNCTAD & UNDP, 2010, p. 299). This implies that countries such asthe Republic of Korea (GNI US$19,650 in PPP, HDI rank 15),10 Singapore (US$36,030, HDIrank 26), Hong Kong SAR (US$31,410, HDI rank 13), Qatar (US$69,750, HDI rank 37), andthe UAE (US$41,940, HDI rank 30) are classified as developing countries, even though thesecountries rank higher than many countries that are presented as “developed” in the CERs (e.g.Malta, Estonia, Hungary, and Poland).11 Prior to empirically illustrating the issue in detail, differ-ent key country classification systems are outlined.12
UNCTAD creative economy reports classification
Table 2 shows that, following CER classification, the balance between developed and developingcountries is shifting on a global basis.
The Creative Economy Reports provide a classification of countries in three categories: devel-oped (Table 3) and developing countries (Table 4), and economies in transition (Table 5). The
Table 2. Creative goods exports, CER classification, in US$ millions.
Developed Developing Transition Total
2002 123,169.04 73,890.29 1180.54 198,239.8862.13% 37.27% 0.60% 100.00%
2003 135,503.36 89,020.15 1371.92 225,895.4359.98% 39.41% 0.61% 100.00%
2004 152,618.74 107,106.80 1911.21 261,636.7558.33% 40.94% 0.73% 100.00%
2005 164,907.86 123,261.72 2184.86 290,354.4456.80% 42.45% 0.75% 100.00%
2006 179,295.94 134,630.14 2397.89 316,323.9756.68% 42.56% 0.76% 100.00%
2007 211,036.88 156,275.10 2741.36 370,053.3457.03% 42.23% 0.74% 100.00%
2008 227,170.99 177,910.80 3700.99 408,782.7755.57% 43.52% 0.91% 100.00%
2009 184,801.17 162,943.59 2900.30 350,645.0652.70% 46.47% 0.83% 100.00%
2010 196,142.11 184,044.26 3022.01 383,208.3851.18% 48.03% 0.79% 100.00%
Source: UNCTADstat 2012.
Cultural Trends 237
Dow
nloa
ded
by [U
nive
rsity
of L
eeds
] at 0
3:25
03
Janu
ary
2015

Table 4. Developing countries.
Developing countries
AfricaAmericas excluding Northern AmericaCaribbeanCentral AmericaSouth AmericaAsia excluding JapanOceania excluding Australia and New Zealand
Source: UNdata http://unstats.un.org/unsd/methods/m49/m49regin.htm
Table 5. Countries in transition.
Countries in Transition
Commonwealth of Independent States (CIS)ArmeniaAzerbaijanBelarusKazakhstanKyrgyzstanRepublic of MoldovaRussian FederationTajikistanTurkmenistanUkraineUzbekistan
Transition countries of South-Eastern EuropeAlbaniaBosnia and HerzegovinaCroatiaMontenegroSerbiaThe Former Yugoslav Republic of Macedonia
Source: UNdata http://unstats.un.org/unsd/methods/m49/m49regin.htm
Table 3. Developed countries.
Developed countries
Northern AmericaEuropeJapanAustralia and New Zealand
Source: UNdata http://unstats.un.org/unsd/methods/m49/m49regin.htm
238 C. De Beukelaer
Dow
nloa
ded
by [U
nive
rsity
of L
eeds
] at 0
3:25
03
Janu
ary
2015
explanatory note on the statistical annex of the 2010 CER covers only methodological issues inthe measurement of the creative economy sectors. No indication is given on what particular basiscountries are classified. It is clear, however, that the classification follows the grouping presentedby UNdata.
UNdata articulates the lack of a clear rationale for this classification as follows:
There is no established convention for the designation of “developed” and “developing” countries orareas in the United Nations system. In common practice, Japan in Asia, Canada and the United Statesin northern America, Australia and New Zealand in Oceania, and Europe are considered “developed”regions or areas. In international trade statistics, the Southern African Customs Union is also treated asa developed region and Israel as a developed country; countries emerging from the former Yugoslaviaare treated as developing countries; and countries of eastern Europe and of the Commonwealth ofIndependent States (code 172) in Europe are not included under either developed or developingregions. (UNdata, 2013)13
Overall, Table 2 shows how developed countries saw their relative share in global creativegoods exports decrease by 10.95 percentage points over the period between 2002 and 2010.Over the same period the relative share of developing countries increased with 10.76 percentagepoints and economies in transition increased with 0.19 percentage points. While the successes ofmany developing countries and regions are stressed, it is asserted that much is yet to be done toharness the full potential (UNCTAD & UNDP, 2010, p. 257). It would, as a result, seem sensibleto argue that developing countries have relatively gained most of the growing global creativeeconomy over the past decade. Yet, the need remains to disaggregate and show which countriesaccount for this change.
OECD development aid committee
The OECDDAC defines developed countries as those who do not receive any development aid fromany of the OECD countries. The OECD/DAC closely monitors the amount of development fundscountries receive, and howmuchOECDcountries spendon international cooperation.Thecalculationof these amounts is highly complex, for the flows of Official Development Assistance (ODA) com-prise technical cooperation, development food aid, humanitarian aid, debt forgiveness, administrativecosts, contributions to multilateral institutions, and bilateral loans (de Haan, 2009, p. 24).
All OECD member states (including the Republic of Korea, listed as a developing country inthe CERs) spend a share of their GDP on international development assistance.14 Countriesreceiving ODA are listed according to income categories, ranging from the relatively well-offUpper Middle-Income Countries, via Lower Middle-Income Countries, Other Low-IncomeCountries, to Least Developed Countries. All countries listed as receiving ODA will thus beregarded as “developing” countries.
Table 6 shows how developed countries saw their relative share in creative goods exportsdecreases with 13.75 percentage points, from 76.46 per cent to 62.71 per cent over the lastdecade. Developing countries, in contrast saw an increase in their relative share from 23.54 percent to 37.29 per cent between 2002 and 2010. These numbers significantly differ from the rela-tive (and absolute) shares quoted in the CERs in Table 2. The biggest share, and ditto increase, isfound in the group of Lower Middle-Income Countries (which comprises China).
UNDP human development index
When looking at development issues beyond mere economic indicators and measures, theUNDP’s HDI provides detailed data. These indicators form the basis of the HDR, published
Cultural Trends 239
Dow
nloa
ded
by [U
nive
rsity
of L
eeds
] at 0
3:25
03
Janu
ary
2015

yearly since 1990. The HDI is a composite index, comprising income (in PPP), life expectancy,and education (aggregating literacy and primary school enrolment rates).
The HDI was developed by Mahbub ul Haq, influenced by the writings of Amartya Sen andMarta Nussbaum. In short, Sen argues “what people can positively achieve is influenced by econ-omic opportunities, political liberties, social powers, and the enabling conditions of good health,basic education, and the encouragement and cultivation of initiatives” (Sen, 1999, p. 5). Moreimportantly, Nussbaum adds,
because countries respond to public rankings that affect their international reputation, the crude [GDP]approach encouraged them to work for economic growth alone, without attending to the living stan-dards of their poorer inhabitants, and without addressing issues such as health and education, whichtypically do not improve with economic growth. (Nussbaum, 2011, p. ix)
While the more systematic HDI merely covers the economic opportunities, health (with lifeexpectancy as a proxy), and basic education, the HDR still provide a far more balancedoutlook on human wellbeing than the singular focus on GDP per capita ever will. Since 2010,the HDIs are also adjusted for income inequality and gender inequality, adding another importantset of layers to the understanding of global differences in wellbeing. Even though the HDRprovide an overall balanced and accurate reading of the situation across countries, the HDIremains a rather rudimentary approach, leaving human rights, political participation, etc. to beexplored separately, and often less systematically.
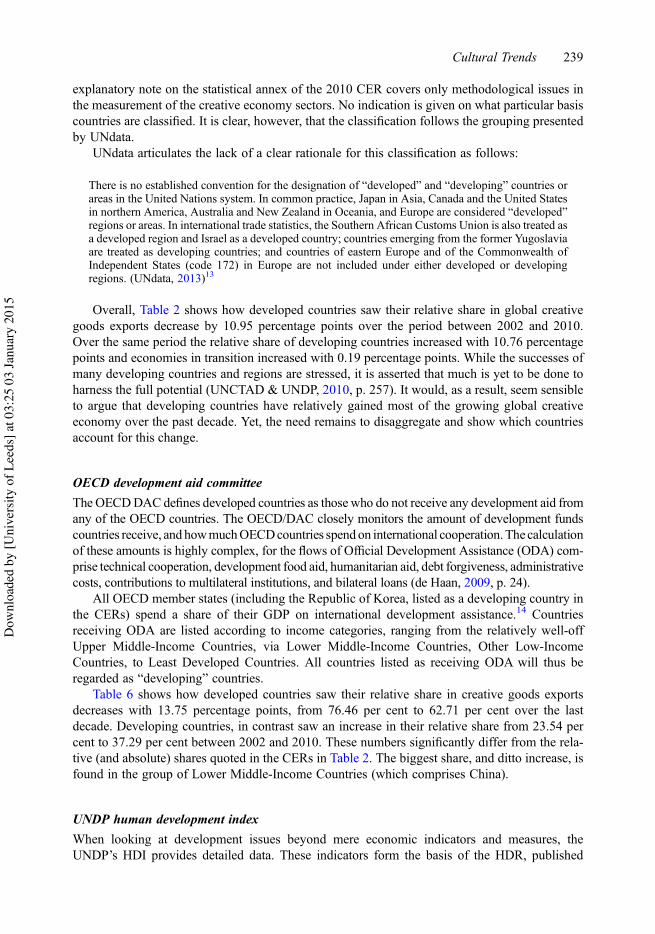
When classifying countries according to HDI data (Table 7), the relative share of developedcountries in the global creative economy drops by 14.66 percentage points between 2002 and2010, from 75.47 per cent to 60.81 per cent. The aggregate of countries with High (+0.02 percen-tage points), Medium (+13.16 percentage points), and Low (+0.02 percentage points) humandevelopment increased with 13.20 percentage points in the same period.
The HDI allows for a less rigid interpretation of the performance of countries, as there is noabsolute divide between developed and developing countries. The grouping is much rather
Table 6. Creative goods exports, OECD/DAC classification, in US$ millions.
No aid UMIC LMIC OLIC LDC Total
2002 151,564.74 9769.74 36,367.24 11.02 85.30 198,239.8876.46% 4.93% 18.35% 0.01% 0.04% 100.00%
2003 165,718.49 10,184.34 48,079.70 1091.60 174.92 225,895.4373.36% 4.51% 21.28% 0.48% 0.08% 100.00%
2004 188,217.46 12,180.48 57,895.89 2463.96 207.19 261,636.7571.94% 4.66% 22.13% 0.94% 0.08% 100.00%
2005 203,243.12 13,411.18 69,540.78 3175.70 271.37 290,354.4470.00% 4.62% 23.95% 1.09% 0.09% 100.00%
2006 217,398.90 14,698.28 79,280.14 3815.88 302.86 316,323.9768.73% 4.65% 25.06% 1.21% 0.10% 100.00%
2007 257,073.73 16,909.52 90,638.31 4223.24 353.64 370,053.3469.47% 4.57% 24.49% 1.14% 0.10% 100.00%
2008 279,388.38 18,858.69 104,372.14 4844.03 371.55 408,782.7768.35% 4.61% 25.53% 1.18% 0.09% 100.00%
2009 226,477.28 15,729.53 102,228.27 5111.01 406.97 350,645.0664.59% 3865.04% 29.15% 1.46% 0.12% 100.00%
2010 240,320.29 17,372.71 122,842.42 1503.28 415.24 383,208.3862.71% 4.53% 32.06% 0.39% 0.11% 100.00%
Source: UNCTADstat 2012, aggregated by the author.
240 C. De Beukelaer
Dow
nloa
ded
by [U
nive
rsity
of L
eeds
] at 0
3:25
03
Janu
ary
2015
organized on a scale ranging from Very High over High and Medium to Low Human Develop-ment. As it is quite a challenge to decide where to set the threshold, a more “conservative” and amore “contentious” reading of the same data is possible. In the first – rather conservative – case,only countries with Very High levels of HDI are seen as “developed”. In the second – and perhapsmore contentious – case, also those countries with High levels of HDI are seen as “developed”.The group of countries with High levels of HDI include Brazil, Mexico, Turkey, Saudi Arabia,Libya, and Uruguay, just to name a few. Even when taking a more conservative approach, theshare of developed countries is significantly bigger here than in the CER approach: 75.47 percent versus 62.13 per cent in 2002 and 60.81 per cent versus 51.18 per cent in 2010. Perhapsthe CERs could also eschew a categorical division between developed and developing countries,and allow for a more holistic reading of development.
Summing up
This section highlighted how the relative and absolute shares of developed and developingcountries fluctuate depending on the definition, demarcation, and classification used. It is clearthat the classifications of the OECD/DAC and the UNDP provide a very different reading ofthe share of developing countries in the global exports of creative goods. Even when turningto a more nuanced demarcation, one category of “developing” countries, however, sees aphenomenal rise in absolute and relative numbers: the Lower Middle-Income (OECD/DAC) orMedium Human Development group. The following subsection will clarify why precisely thisgroup saw such an increase.
China as a “developing country”?
Throughout the entire period for which creative product export data are available fromUNCTAD, China has been the single biggest exporter. Moreover, during the period from2002 to 2010, the relative share of China in the exports of creative goods increased by 9.20
Table 7. Creative goods exports, UNDP classification, in US$ millions.
VH H M L No data Total
2002 149,618.83 11,508.75 36,133.92 10.55 882.06 198,239.8875.47% 5.81% 18.23% 0.01% 0.44% 100.00%
2003 163,496.23 13,194.73 46,934.72 22.50 1006.36 225,895.4372.38% 5.84% 20.78% 0.01% 0.45% 100.00%
2004 182,434.70 15,643.58 58,067.59 27.68 4234.94 261,636.7569.73% 5.98% 22.19% 0.01% 1.62% 100.00%
2005 197,678.65 17,039.80 69,830.94 40.57 4039.77 290,354.4468.08% 5.87% 24.05% 0.01% 1.39% 100.00%
2006 211,251.92 18,980.49 79,775.83 30.38 4297.45 316,323.9766.78% 6.00% 25.22% 0.01% 1.36% 100.00%
2007 250,455.25 20,792.67 92,105.13 82.62 4601.58 370,053.3467.68% 5.62% 24.89% 0.02% 1.24% 100.00%
2008 272,590.90 23,626.93 105,883.04 233.88 4638.50 408,782.7766.68% 5.78% 25.90% 0.06% 1.13% 100.00%
2009 219,686.70 19,479.47 104,594.67 124.91 5156.65 350,645.0662.65% 5.56% 29.83% 0.04% 1.47% 100.00%
2010 233,042.86 22,357.90 120,289.07 120.02 5653.10 383,208.3860.81% 5.83% 31.39% 0.03% 1.48% 100.00%
Source: UNCTADstat 2012, aggregated by the author.
Cultural Trends 241
Dow
nloa
ded
by [U
nive
rsity
of L
eeds
] at 0
3:25
03
Janu
ary
2015

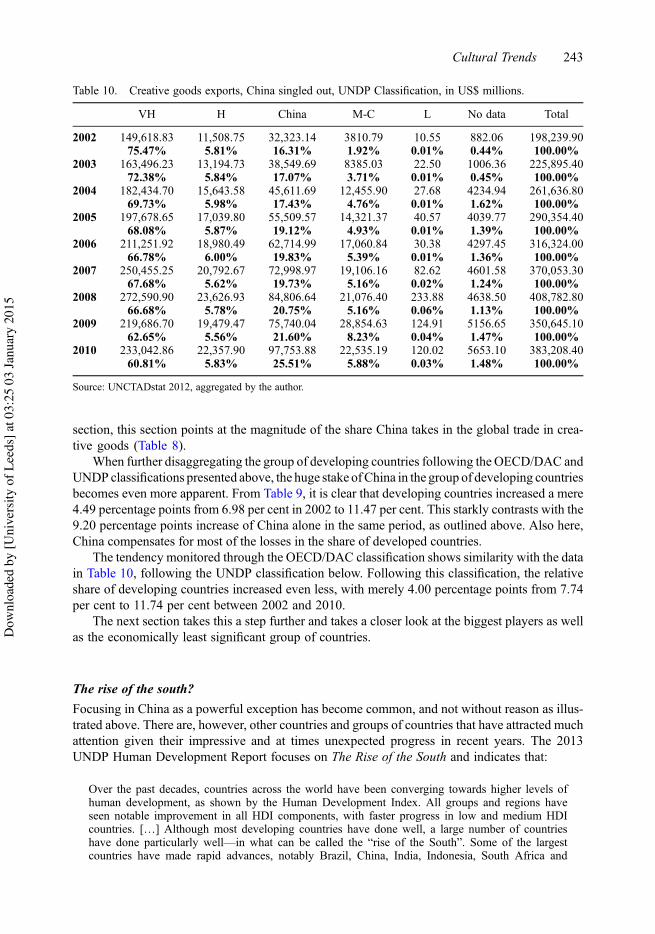
percentage points from 16.31 per cent to 25.51 per cent. This increase amounts to the majorityof the relative increase of the share of the developing countries following the CER classificationas shown in Table 9. The remaining developing countries increased their relative share only by1.53 percentage points. The combined share of developed countries and China falls to 76.69 percent in 2010, down from 78.44 per cent in 2002, indicating that China alone compensates foralmost the entire loss of the relative share of developed countries’ exports of creative goods.While the presence and importance of other “power blocs” will be scrutinized in the following
Table 8. Creative goods exports, CER classification, China singled out, in US$ millions.
Developed Developing-C China Transition Total
2002 123,169.04 41,567.15 32,323.14 1180.54 198,239.8862.13% 20.97% 16.31% 0.60% 100.00%
2003 135,503.36 50,470.46 38,549.69 1371.92 225,895.4359.98% 22.34% 17.07% 0.61% 100.00%
2004 152,618.74 61,495.11 45,611.69 1911.21 261,636.7558.33% 23.50% 17.43% 0.73% 100.00%
2005 164,907.86 67,752.15 55,509.57 2184.86 290,354.4456.80% 23.33% 19.12% 0.75% 100.00%
2006 179,295.94 71,915.15 62,714.99 2397.89 316,323.9756.68% 22.73% 19.83% 0.76% 100.00%
2007 211,036.88 83,276.13 72,998.97 2741.36 370,053.3457.03% 22.50% 19.73% 0.74% 100.00%
2008 227,170.99 93,104.16 84,806.64 3700.99 408,782.7755.57% 22.78% 20.75% 0.91% 100.00%
2009 184,801.17 87,203.55 75,740.04 2900.30 350,645.0652.70% 24.87% 21.60% 0.83% 100.00%
2010 196,142.11 86,209.38 97,753.88 3022.01 383,208.3851.18% 22.50% 25.51% 0.79% 100.00%
Source: UNCTADstat 2012, aggregated by the author.
Table 9. Creative goods exports, China singled out, OECD/DAC classification, in US$ millions.
No aid UMIC China LMIC-C OLIC LDC Total
2002 151,564.74 9769.74 32,323.14 4044.11 11.02 85.30 198,239.9076.46% 4.93% 16.31% 2.04% 0.01% 0.04% 100.00%
2003 165,718.49 10,184.34 38,549.69 9530.01 1091.60 174.92 225,895.4073.36% 4.51% 17.07% 4.22% 0.48% 0.08% 100.00%
2004 188,217.46 12,180.48 45,611.69 12,284.20 2463.96 207.19 261,636.8071.94% 4.66% 17.43% 4.70% 0.94% 0.08% 100.00%
2005 203,243.12 13,411.18 55,509.57 14,031.21 3175.70 271.37 290,354.4070.00% 4.62% 19.12% 4.83% 1.09% 0.09% 100.00%
2006 217,398.90 14,698.28 62,714.99 16,565.15 3815.88 302.86 316,324.0068.73% 4.65% 19.83% 5.24% 1.21% 0.10% 100.00%
2007 257,073.73 16,909.52 72,998.97 17,639.34 4223.24 353.64 370,053.3069.47% 4.57% 19.73% 4.77% 1.14% 0.10% 100.00%
2008 279,388.38 18,858.69 84,806.64 19,565.50 4844.03 371.55 408,782.8068.35% 4.61% 20.75% 4.79% 1.18% 0.09% 100.00%
2009 226,477.28 15,729.53 75,740.04 26,488.23 5111.01 406.97 350,645.1064.59% 4.49% 21.60% 7.55% 1.46% 0.12% 100.00%
2010 240,320.29 17,372.71 97,753.88 25,088.54 1503.28 415.24 383,208.4062.71% 4.53% 25.51% 6.55% 0.39% 0.11% 100.00%
Source: UNCTADstat 2012, aggregated by the author.
242 C. De Beukelaer
Dow
nloa
ded
by [U
nive
rsity
of L
eeds
] at 0
3:25
03
Janu
ary
2015
section, this section points at the magnitude of the share China takes in the global trade in crea-tive goods (Table 8).
When further disaggregating the group of developing countries following the OECD/DAC andUNDP classifications presented above, the huge stake ofChina in the group of developing countriesbecomes even more apparent. From Table 9, it is clear that developing countries increased a mere4.49 percentage points from 6.98 per cent in 2002 to 11.47 per cent. This starkly contrasts with the9.20 percentage points increase of China alone in the same period, as outlined above. Also here,China compensates for most of the losses in the share of developed countries.
The tendency monitored through the OECD/DAC classification shows similarity with the datain Table 10, following the UNDP classification below. Following this classification, the relativeshare of developing countries increased even less, with merely 4.00 percentage points from 7.74per cent to 11.74 per cent between 2002 and 2010.
The next section takes this a step further and takes a closer look at the biggest players as wellas the economically least significant group of countries.
The rise of the south?
Focusing in China as a powerful exception has become common, and not without reason as illus-trated above. There are, however, other countries and groups of countries that have attracted muchattention given their impressive and at times unexpected progress in recent years. The 2013UNDP Human Development Report focuses on The Rise of the South and indicates that:
Over the past decades, countries across the world have been converging towards higher levels ofhuman development, as shown by the Human Development Index. All groups and regions haveseen notable improvement in all HDI components, with faster progress in low and medium HDIcountries. […] Although most developing countries have done well, a large number of countrieshave done particularly well—in what can be called the “rise of the South”. Some of the largestcountries have made rapid advances, notably Brazil, China, India, Indonesia, South Africa and
Table 10. Creative goods exports, China singled out, UNDP Classification, in US$ millions.
VH H China M-C L No data Total
2002 149,618.83 11,508.75 32,323.14 3810.79 10.55 882.06 198,239.9075.47% 5.81% 16.31% 1.92% 0.01% 0.44% 100.00%
2003 163,496.23 13,194.73 38,549.69 8385.03 22.50 1006.36 225,895.4072.38% 5.84% 17.07% 3.71% 0.01% 0.45% 100.00%
2004 182,434.70 15,643.58 45,611.69 12,455.90 27.68 4234.94 261,636.8069.73% 5.98% 17.43% 4.76% 0.01% 1.62% 100.00%
2005 197,678.65 17,039.80 55,509.57 14,321.37 40.57 4039.77 290,354.4068.08% 5.87% 19.12% 4.93% 0.01% 1.39% 100.00%
2006 211,251.92 18,980.49 62,714.99 17,060.84 30.38 4297.45 316,324.0066.78% 6.00% 19.83% 5.39% 0.01% 1.36% 100.00%
2007 250,455.25 20,792.67 72,998.97 19,106.16 82.62 4601.58 370,053.3067.68% 5.62% 19.73% 5.16% 0.02% 1.24% 100.00%
2008 272,590.90 23,626.93 84,806.64 21,076.40 233.88 4638.50 408,782.8066.68% 5.78% 20.75% 5.16% 0.06% 1.13% 100.00%
2009 219,686.70 19,479.47 75,740.04 28,854.63 124.91 5156.65 350,645.1062.65% 5.56% 21.60% 8.23% 0.04% 1.47% 100.00%
2010 233,042.86 22,357.90 97,753.88 22,535.19 120.02 5653.10 383,208.4060.81% 5.83% 25.51% 5.88% 0.03% 1.48% 100.00%
Source: UNCTADstat 2012, aggregated by the author.
Cultural Trends 243
Dow
nloa
ded
by [U
nive
rsity
of L
eeds
] at 0
3:25
03
Janu
ary
2015
Turkey. But there has also been substantial progress in smaller economies, such as Bangladesh, Chile,Ghana, Mauritius, Rwanda and Tunisia. (UNDP, 2013, p. 1)
BRIC countries (Brazil, Russia, India, and China) have seen steady growth. More remarkableis that they did not see a significant decrease of exports during the global financial turmoil thatstarted in 2008–2009. This contrasts sharply with the overall drop in creative goods exports inthat period. Particularly the G8 and the European Union have seen considerable export losses,with slow recovery since the onset of the “crisis”.
Table 11 illustrates that while alsoChina’s exports dropped in 2009, notably India generated posi-tive growth during and after the crisis (with an increase of almost 100 per cent in one year). But alsothe G77 have shown to be rather resilient throughout this period. Unsurprisingly, these regions haverapidly growingmiddle classes (UNDP, 2013, p. 14) that consume and produce goods and services inthe creative economy. The group of 49 LDCs, in contrast, only accounts for 0.11 per cent of the globalcreative goods exports in 2010, up from 0.04 per cent in 2002 and kept on growing steadily through-out the “crisis”. The “South” is on the rise, but some countries rise less than others. The followingsection will discuss what this tiny share in the global creative economy means for the 49 LDCsand the 880 million (around 12 per cent of the global population)15 people living there.
Developing the creative economy in Burkina Faso
The term “developing” has long been used as euphemism for “underdeveloped”. Testament to thisis the fact that the nomenclature has taken a different form for countries that are showing moreprogress in human development. Thus the BRIC, MIST, and N-11 countries16 are called “emer-ging”, and the most recent UNDP Human Development Report speaks of the “rise” of the south.The long and contentious history of these concepts extends far beyond the scope of this article andthey already been discussed at length elsewhere (Escobar, 1995; Esteva, 2010; Nederveen Pie-terse, 2010). From the previous sections, it should be clear that a rigid developed–developingdichotomy is not very helpful to understand ongoing change and it does not help understandingwhy some countries are doing less well. Yet the argument can be made that “we all want to live indeveloping countries” (Neuwirth, 2013, p. 130), based on the idea that “developing” semanticallysignals a certain dynamism that “developed” misses. This is a point that needs to be taken intoaccount, since it is surely more appealing to live in a country that is evolving. Yet doing awaywith this opposition does not really show very well how vast social, human, and economic dis-parities can be understood in this outlook on the world. While we may agree that no country hasreached a stable point of development, we should acknowledge that prevailing inequalities needexplicit attention, even though a rigid developed–developing divide barely helps in this regard.
The creative economy: The chicken or the egg?
When focusing on the creative economy as a globally feasible development option, one rather impor-tant element may be ignored: The growth of CCIs in the so-called developed countries, generallyfollowed economic development, and not the other way around. The argument is made thatdemand for entertainment follows three pairs of explanations (Bakker, 2008):
. Economic growth and increased leisure time spiked demand.
. Urbanization helped turning this demand into consumption.
. Hike of young population increased demand further – as under-30s are a big (potential)market.
244 C. De Beukelaer
Dow
nloa
ded
by [U
nive
rsity
of L
eeds
] at 0
3:25
03
Janu
ary
2015

Table 11. Country groups, in US$ millions.
Regions 2002 2003 2004 2005 2006 2007 2008 2009 2010
G8 83,892.10 90,376.56 101,774.59 112,553.26 122,626.40 144,313.32 152,715.26 124,280.46 131,818.42G20 127,416.84 145,559.67 167,470.75 189,775.76 209,161.98 243,353.22 265,184.75 232,282.90 259,700.29G77 64,773.63 79,314.54 96,880.56 112,270.73 123,203.77 143,474.92 163,191.60 150,978.06 170,876.47EU (European Union) 86,139.03 97,861.54 110,456.85 117,509.31 128,155.02 151,389.01 163,724.69 132,586.86 139,605.64BRIC 33,880.37 44,692.24 54,495.58 65,478.12 74,280.59 85,403.98 97,169.87 95,601.75 113,754.29Brazil 739.16 886.79 1152.43 1193.31 1169.41 1210.90 1222.07 928.22 929.97Russian Federation 818.07 852.09 1073.75 1245.17 1372.76 1480.77 1733.61 1330.93 1274.05India 4403.67 6657.72 7530.07 9023.42 9713.34 9407.55 17,602.56 13,796.38China 32,323.14 38,549.69 45,611.69 55,509.57 62,714.99 72,998.97 84,806.64 75,740.04 97,753.88Least developed countries 85.30 174.92 207.51 271.43 304.02 354.44 373.23 406.97 416.36Total 198,239.88 225,895.43 261,636.75 290,354.44 316,323.97 370,053.34 408,782.77 350,645.06 383,208.38
Source: UNCTADstat 2012.
Cultural
Trends245
Dow
nloa
ded
by [U
nive
rsity
of L
eeds
] at 0
3:25
03
Janu
ary
2015

A clear example of this evolution is the film industry (Bakker, 2008; Cook, 2004). The industrialadvancements that allowed for the technical emergence of moving picture entertainment coincidedwith increased productivity, less working hours, and higher wages. As a result, there was a ratherbig market for cultural texts to be consumed in an increasingly urban context. The CERs, alongsidemanyother initiativespromoting the creative industries on aglobal scale, seem tomake that very argu-ment in reverse: these very industries will be a motor of development, rather than the result of it.Should the data thus not be approached differently, by arguing that increased cultural consumptionand flourishing cultural industries follow a socio-economically prospering society, and not viceversa? This is exactly the idea that is explored in this closing section.
Four pre-emptive remarks should be made. First, the intention is not to make an abstract teleo-logical argument. It is not because theWestern world has seen a certain evolution that “developing”countries will follow the same path, yet the validity of Bakker’s argument should be exploredbeyond the West. Second, while the empirical data on the city of Ouagadougou cannot count asan unproblematic exemplar for all LDCs, it remains a useful illustration of how the culturalecology is structured and evolving. Third, Burkina Faso, which serves as an illustration, focuseson the internal market, while the CERs focus on international trade. They are, however, linked.A strong internal market ensures knowhow to deal with success abroad and allows a healthybalance between local content and imports. Fourth, this argument is not an either/or story. Theclaim is rather that there should be far greater attention to the preconditions for aflourishing culturaland creative economy rather than the results it yields, without dismissing existing success stories.
The case of Burkina Faso
The cultural and creative potential of people and countries could be harnessed through the creativeeconomy. While some succeed at using this potential, others do not. The question in this context iswhy some developing countries have not (yet) managed to develop their creative industries.Why dothey not profit muchmore from their rich cultural traditions and popular culture?What are the under-lying reasons?Many of the reasons can be ascribed to the history and social context of the countries:
[D]eveloping countries face huge obstacles, such as lack of investment and entrepreneurial skills,inadequate infrastructure, absence of appropriate financing mechanisms and weak institutional andlegal frameworks to support the growth of the creative industries. (UNCTAD & UNDP, 2010, p. 224)
At the same time, the limited potential for countries in the South is stressed:
As a result, access by Southern countries to the benefits of growth in the global creative economy hasbeen limited at best. Indeed, there is a danger that when these countries are brought into internationalmarket networks, they will be relegated to the lowest value-adding stages in the value chain.(UNCTAD & UNDP, 2010, pp. 224–225)
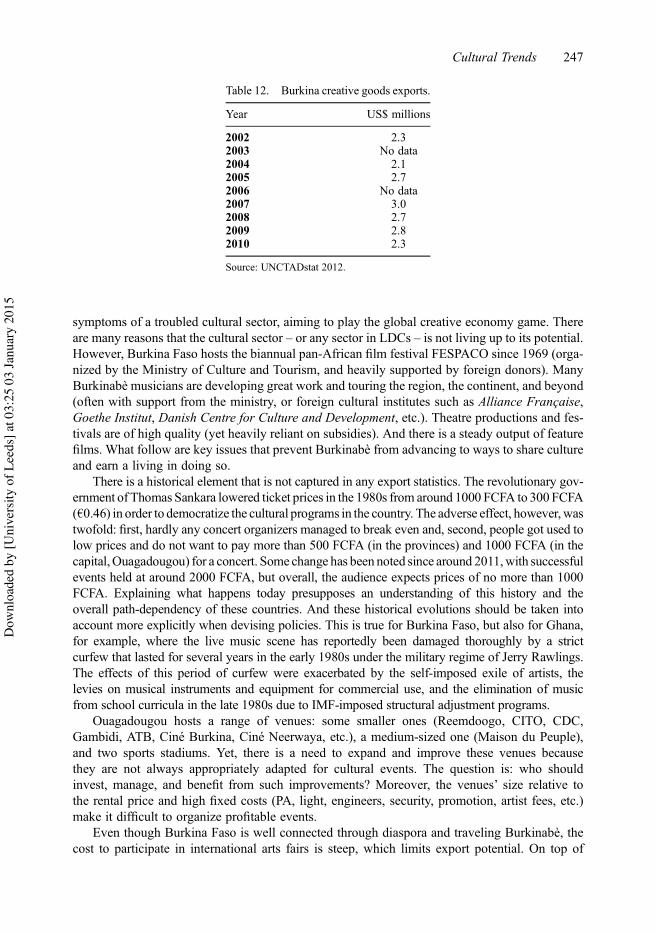
In spite of these known difficulties, the share of developing countries is still exaggerated in theCERs and the potential for these countries is underlined. Yet Table 12, for example, illustrates thatBurkina Faso has seen no significant increase in creative goods exports in the period 2002–2010.
During fieldwork encounters in Burkina Faso, reference was often made to crude oil, gold,ores, cocoa, coffee, diamonds, and other archetypical developing country riches. Culture, itwas argued, is pretty much in the same position: there is ample potential. But few people canmake the investment needed to turn the “rich cultural resources” into flourishing cultural indus-tries, and even less are inclined to do so. As a result, and similar to resource extraction, the exper-tise to produce books, CDs, films, etc. to an international standard is limited. These are the
246 C. De Beukelaer
Dow
nloa
ded
by [U
nive
rsity
of L
eeds
] at 0
3:25
03
Janu
ary
2015
symptoms of a troubled cultural sector, aiming to play the global creative economy game. Thereare many reasons that the cultural sector – or any sector in LDCs – is not living up to its potential.However, Burkina Faso hosts the biannual pan-African film festival FESPACO since 1969 (orga-nized by the Ministry of Culture and Tourism, and heavily supported by foreign donors). ManyBurkinabè musicians are developing great work and touring the region, the continent, and beyond(often with support from the ministry, or foreign cultural institutes such as Alliance Française,Goethe Institut, Danish Centre for Culture and Development, etc.). Theatre productions and fes-tivals are of high quality (yet heavily reliant on subsidies). And there is a steady output of featurefilms. What follow are key issues that prevent Burkinabè from advancing to ways to share cultureand earn a living in doing so.
There is a historical element that is not captured in any export statistics. The revolutionary gov-ernment of Thomas Sankara lowered ticket prices in the 1980s from around 1000 FCFA to 300FCFA(!0.46) in order to democratize the cultural programs in the country. The adverse effect, however, wastwofold: first, hardly any concert organizers managed to break even and, second, people got used tolow prices and do not want to pay more than 500 FCFA (in the provinces) and 1000 FCFA (in thecapital,Ouagadougou) for a concert. Some change has been noted since around 2011,with successfulevents held at around 2000 FCFA, but overall, the audience expects prices of no more than 1000FCFA. Explaining what happens today presupposes an understanding of this history and theoverall path-dependency of these countries. And these historical evolutions should be taken intoaccount more explicitly when devising policies. This is true for Burkina Faso, but also for Ghana,for example, where the live music scene has reportedly been damaged thoroughly by a strictcurfew that lasted for several years in the early 1980s under the military regime of Jerry Rawlings.The effects of this period of curfew were exacerbated by the self-imposed exile of artists, thelevies on musical instruments and equipment for commercial use, and the elimination of musicfrom school curricula in the late 1980s due to IMF-imposed structural adjustment programs.
Ouagadougou hosts a range of venues: some smaller ones (Reemdoogo, CITO, CDC,Gambidi, ATB, Ciné Burkina, Ciné Neerwaya, etc.), a medium-sized one (Maison du Peuple),and two sports stadiums. Yet, there is a need to expand and improve these venues becausethey are not always appropriately adapted for cultural events. The question is: who shouldinvest, manage, and benefit from such improvements? Moreover, the venues’ size relative tothe rental price and high fixed costs (PA, light, engineers, security, promotion, artist fees, etc.)make it difficult to organize profitable events.
Even though Burkina Faso is well connected through diaspora and traveling Burkinabè, thecost to participate in international arts fairs is steep, which limits export potential. On top of
Table 12. Burkina creative goods exports.
Year US$ millions
2002 2.32003 No data2004 2.12005 2.72006 No data2007 3.02008 2.72009 2.82010 2.3
Source: UNCTADstat 2012.
Cultural Trends 247
Dow
nloa
ded
by [U
nive
rsity
of L
eeds
] at 0
3:25
03
Janu
ary
2015
this, it can require several years to build an international network and start yielding considerable“return on investment”.
Equally, there is a relative lack of spending power. This means that not too many people canregularly afford to pay a 500 FCFA (!0.76) to 2000 FCFA (!3.05) concert ticket or a 1000 FCFA(!1.52) cinema ticket. This may seem little, yet considering that a middle-class employee com-monly earns some 100,000 FCFA (!152.45) a month, they cannot easily attend events and pro-ductions on a regular basis. This means that the local market is fiercely competitive and that only afew people can make a living out of this. It furthermore limits the possibilities to develop newinitiatives and experiments, for the risk is just too big, and the possibility to have a steadyflow of low-risk events to fall back on is often lacking. This, of course, raises the questionhow public and private engagement in the cultural sector should be balanced.
The issues lie not exclusively beyond the immediate power of those working in the sector.Many cultural enterprises lack transparent accounting and many of them operate below theradar of the tax office. This has two major consequences: First, governments do not see thefull scope and importance of the sector for the national economy in economic data. Second, inves-tors are not easily convinced of the worth of the sector; because a large share of the profits is notformally recorded, nor do they pass always pass through bank accounts.
It is perhaps unsurprising that investment is hard to come by. There is a general lack of trust offinancial institutions in the cultural sector. The Guarantee Fund for Cultural Industries (based atthe ECOWAS Bank for Investment and Development in Lomé, Togo) guarantees repayment of 80per cent of loans in case of default or non-repayment.17 But banks remain suspicious, and this isnot entirely without reason, because repayment has been a challenge in the rare cases that a bankloan has been given with backing of the fund.
At the same time, most music heard on the streets, in the maquis (pubs), and in the clubs hailsfrom Côte d’Ivoire and Nigeria. At lunch, the country is hooked to the Mexican telenovela Teresa.And on Saturday night, competition to get a seat at Cine Burkina to watch a Burkinabè movie canbe fierce, but the hyperlocal setting and relatively low production quality (lagging behind on theimproving Lagos-based Nollywood) make it unsurprising that these films have limited appealbeyond the borders of the country. In short, it takes a lot to develop a creative economy andjoin the league of the big players – if that is possible at all. Competition is hardly fair for the49 LDCs (including Burkina Faso) that together account for merely 0.11 per cent of the creativegoods exports, while big players like China dominate the market with 25.52 per cent of exports inthe sector. Addressing the political economy of the sector should be a central issue when promot-ing the development of creative industries around the world.
Cultural industries form a feasible development option indeed, but not all “developing”countries have the same means to harness that potential. And, more importantly, there is aneed to explore if the so-called preconditions to develop cultural industries could be part of thegreater development these industries are meant to help attaining.
Conclusions
The creative economy has gone global. Or the creative economy discourse at least. The UNCTADCreative Economy Reports highlight the relevance of this sector in many countries and providedample quantitative evidence that was hard to find, and even harder to compare. Previously, it hasbeen argued that the inclusion of certain product groups in the shift from cultural to creative indus-tries is problematic (Garnham, 2005; Tremblay, 2011), while this article makes the case that alsothe geographical demarcation used in the Reports is flawed.
This classification of countries is problematic for several reasons. First, it uses a classificationthat simply does not make sense. The Republic of Korea, Hong Kong, and Singapore (among
248 C. De Beukelaer
Dow
nloa
ded
by [U
nive
rsity
of L
eeds
] at 0
3:25
03
Janu
ary
2015

many others) are not developing countries, and should not be treated or classified as such – incontrast to what is done in the CERs. Second, China is the world’s second biggest economyand first exporter of creative goods and should be highlighted as an exception in the analysisof the data, and not simply put forward as a developing country. Third, the extremely limitedshare (0.11 per cent in 2012) of the 49 LDCs in global creative goods exports, relative to itslarge share of the world’s population (880 million or some 12 per cent), is troubling. How canthese countries profit from this sector, which bridges cultural and economic traits? In whatways can these often-fragile countries be supported in their attempts to unlock the potential ofcultural practices? And in what ways can these countries hope to develop cultural industries ina context where only a small middle class exists and the majority of the population does nothave the surplus disposable income, available leisure time, or the habit to spend on culture?18
In response to these questions it can be argued that in the context of LDCs, the creativeeconomy is probably not primarily a driver of development, but rather an indicator. If there isa sizable middle class with spending power and education concentrated in cities, a contextexists in which music, books, theatre, movies, advertisement, etc. will be in demand. As such,greater human development will almost automatically encourage the development of activitiesand the creation of cultural goods that can be profitable.
The way countries are classified in global reports on the creative economy should thus be farmore detailed and balanced, because China and Burkina Faso are simply not part of the same cat-egory. And the inclusion of some “developed” countries (with very high levels of HDI) such asSingapore and South Korea should not feature in the group of developing countries at all. Simi-larly, intra-national imbalances and social inequalities regarding access to and participation in thecreative industries merit greater attention.
In conclusion, the focus on the CCIs should be part on a holistic set of initiatives aimed toadvance human development. It is clear that policies and initiatives in China are, and need tobe, much different from those in Burkina Faso. But an adequate assessment of the complexityof the field should precede the further development of apt measures. More importantly, beyondthe averages of growth and export numbers, it should not be forgotten that the creativeeconomy is about far more than trade alone. It is also conveys symbolic meaning. And thismeaning may help to articulate what kind of social and economic life we envisage, which is asmuch part of development as anything else. Because we want bread; but we want movies too.
AcknowledgementsA previous version of this article has been presented at the Sixth International Conference of Cultural PolicyResearch at the University of Jyväskylä in 2010, where Pertti Alasuutari provided helpful comments. Theauthor wishes to thank David Hesmondhalgh, David Lee, Jan Baetens, Fred Truyen, Kate Oakley,Anamik Saha, Eleonora Belfiore, Emile Raguidissida Zida, Francisco d’Almeida, Constanza Parra, andToussaint Nothias for comments on the text and/or the ideas conveyed therein. Many thanks as well tothree anonymous reviewers for their constructive engagement with the argument. This research has beenfunded through a doctoral scholarship awarded by the Institute of Communications Studies, University ofLeeds. The European Cultural Foundation, the Risksbankens Jubileumsfund, and ENCATC providedadditional funding through their joint Cultural Policy Research Award (2012) and the Roger DillemansFund at the University of Leuven granted an Excellence Scholarship (2010–2011).
Notes1. http://unctadstat.unctad.org/2. This article builds on data on international trade in the creative economy. The data used for this study
are drawn from UNCTADstat, the UNCTAD online statistical database that comprises all raw dataused to compile the statistical annexes of the CERs. As such, the article advances the understanding
Cultural Trends 249
Dow
nloa
ded
by [U
nive
rsity
of L
eeds
] at 0
3:25
03
Janu
ary
2015
of the global creative economy in exactly the same way as the CERs: by aggregating trade data bycountries and groups of countries. The author is thus unable to account for any possible inaccuraciesor, more importantly, gaps in the raw data. Given the limitations of space, the scope of this article isrestricted to the exports of creative goods. As such, the available data on imports or net exports of crea-tive goods are not discussed, nor that on the trade in creative services or overall growth rates in thecreative economy. Reference to Human Development classification, as used by the UNDP refers todata available in the 2009 edition of the Human Development Report. This Report was publishedon 5 October 2009, leaving ample time to the editors of the 2010 CER to include the provideddata. The OECD Development Aid Committee classification of aid recipient refers to the data availableon 1 January 2009, for the same reasons as expressed above. For a table providing an overview ofcountries according to these classifications, contact the author via email. The empirical data onBurkina Faso build on extensive fieldwork by the author in the cultural/creative sector in its capitalOuagadougou throughout 2013.
3. www.arterialnetwork.org4. See De Beukelaer (2013) for background information.5. http://www.budpar.go.id/asp/index.asp6. http://unstats.un.org/unsd/methods/m49/m49regin.htm7. An earlier and longer version of his article was published in French, under the title Industries Cul-
turelles, économie créative et société de l’information (Tremblay, 2008).8. Previously, De Beukelaer (2012) addressed the problematic relation between the cultural industries and
the position of culture in development studies and practice. This element will not be addressed in thisarticle, in spite of its relevance.
9. The USA comes second, with less than a third (US$32,049 million) of the exports of China in 2010.10. The numbers given indicate the average income per capita in purchasing power parity (PPP) in 2009
according to the World Bank. http://data.worldbank.org/indicator/NY.GNP.PCAP.CD/countries/1 W?order=wbapi_data_value_2009%20wbapi_data_value&sort=desc&display=default
11. The observations made above are based on data provided through the classification list of developed/developing countries in the CERs in contrast to income-based data provided by the World Bank.
12. See Annex 1 for a full overview of all countries and their CER/OECD-DAC/UNDP classification.Some countries have insufficient data to calculate their HDI rank, and are thus marked as “NODATA”.
13. UNCTADmaintains the classification for international trade statistics yet refers to countries that are partof the SouthernAfrican CustomsUnion as developing and classifies countries emerging from the formerYugoslavia as economies in transition, alongside Commonwealth of Independent States and Albania(while Slovenia, also former Yugoslavia, is classified as a developed country). Moreover, the classifi-cation of countries of eastern Europe in the CERs is to a large extent at odds with what is presentedby UNdata, where the above countries are argued to be neither developed nor developing (and thus pre-sumably in transition even though this is not clearly defined). Yet the following countries of ‘easternEurope’ (UNdata, 2013): Bulgaria, CzechRepublic,Hungary, Poland,Romania, andSlovakia are classi-fied as developed, while only Belarus, Republic of Moldova, Russian Federation, and Ukraine are seenas in transition (UNCTAD&UNDP, 2010, p. 299). NB: no single EU country is developing or in tran-sition, whereas the rest of the Central and South-East European region is in either of these categories.
14. For full official data see http://www.oecd.org/statistics/, and for OECD/DAC details for 2010 see:http://www.oecd.org/dac/aidstatistics/47452876.xls
15. http://www.unohrlls.org/en/ldc/16. BRIC = Brazil, Russia, India, and China; MIST =Mexico, Indonesia, South Korea, and Turkey; N-11 =
Next eleven: Bangladesh, Egypt, Indonesia, Iran, Mexico, Nigeria, Pakistan, Philippines, Turkey,South Korea, and Vietnam.
17. http://www.bidc-ebid.com/en/fondsculturel.php18. The answers to these questions lie beyond the scope of this article. The author will, however, publish a
report with the European Cultural Foundation in 2014 that engages with them in greater detail.
ReferencesBakker, G. (2008). Entertainment industrialised: The emergence of the international film industry 1890–
1940. Cambridge: Cambridge University Press.Barrowclough, D., & Kozul-Wright, Z. (Eds.). (2008). Creative industries and developing countries: Voice
choice and economic growth. London: Routledge.
250 C. De Beukelaer
Dow
nloa
ded
by [U
nive
rsity
of L
eeds
] at 0
3:25
03
Janu
ary
2015

Burkina Faso. (2010). Stratégie de Croissance Accélérée et de Développement Durable. Ouagadougou:Gouvernement du Burkina Faso.
Cook, D. A. (2004). A history of narrative film. New York, NY: W. W. Norton.De Beukelaer, C. (2012). The cosmopolitan homo economicus and the global creative economy: Some
remarks from a postcolonial perspective. In G. Hagoort, A. Thomassen, & R. Kooyman (Eds.),Pioneering minds worldwide: The entrepreneurial principles of the cultural and creative industries(pp. 19–24). Delft: Eburon.
De Beukelaer, C. (2013). Culture and development in Burkina Faso: Social and economic impacts explored.Cultural Trends, 22(3–4), 250–258. doi:10.1080/09548963.2013.819651
De Haan, A. (2009). How the aid industry works: An introduction to international development. Sterling,VA: Kumarian Press.
Escobar, A. (1995). Encountering development: The making and unmaking of the Third World. Princeton,NJ: Princeton University Press.
Esteva, G. (2010). Development. In W. Sachs (Ed.), The development dictionary (2nd ed., pp. 1–23).New York, NY: Zed Books.
Flew, T. (2013). Global creative industries. Cambridge: Polity Press.Garnham, N. (2005). From cultural to creative industries. International Journal of Cultural Policy, 11(1),
15–29. doi:10.1080/10286630500067606Hesmondhalgh, D. (2013). The cultural industries (3rd ed.). London: Sage.Higgs, P., Cunning, S., & Bakhshi, H. (2008). Beyond the creative industries: Mapping the creative economy.
London: NESTA. Retrieved from http://www.nesta.org.uk/library/documents/beyond-creative-industries-report.pdf
Hill, S. (2008). Creative Lebanon: A framework for future prosperity. Beirut: British Council.Hui, D. (2006). From cultural to creative industries: Strategies for Chaoyang district Beijing. International
Journal of Cultural Studies, 9(3), 317–331. doi:10.1177/1367877906066878Jerven, M. (2013). Poor numbers: How we are misled by African development statistics and what to do
about it. Ithaca, NY: Cornell University Press.KEA. (2011). Implementing cultural provisions of CARIFORUM-EU EPA. How do they benefit the
Caribbean cultural sector? (No. 118). Maastricht: ECDPM.Keane, M. (2013). Creative industries in China: Art design and media. Cambridge: Polity Press.Nederveen Pieterse, J. (2010). Development theory. London: Sage.Neuwirth, R. (2013). Global governance and the creative economy: The developing versus developed
country dichotomy revisited. Frontiers of Legal Research, 1(1), 127–144.Nussbaum, M. (2011). Creating capabilities: The human development approach. Cambridge, MA: Belknap
Press of Harvard University Press.Oakley, K. (2004). Not so cool Britannia: The role of the creative industries in economic development.
International Journal of Cultural Studies, 7(1), 67–77. doi:10.1177/1367877904040606Pratt, A. C. (2009). Policy transfer and the field of the cultural and creative industries: What can be learned
from Europe? In L. Kong & J. O’Connor (Eds.), Creative economies creative cities (Vol. 98, pp. 9–23).Dordrecht: Springer Netherlands.
Sen, A. (1999). Development as freedom. Oxford: Oxford University Press.SPC. (2011). Regional consultation on the cultural industries. Noumea: Secretariat of the Pacific
Community.The Economist. (2011). Music in Africa: Searching for a new sound. Retrieved 11 March 2013, from http://
www.economist.com/blogs/baobab/2011/11/music-africaTremblay, G. (2008). Industries culturelles économie créative et sociéte de l’information. Global Media
Journal – Canadian Edition, 1(1), 65–88.Tremblay, G. (2011). Creative statistics to support creative economy politics. Media Culture & Society, 33
(2), 289–298. doi:10.1177/0163443710386519UNCTAD & UNDP. (2008). Creative economy report 2008: The challenge of assessing the creative
economy: Towards informed policy-making (No. UNCTAD/DITC/2008/2). Geneva: United Nations.UNCTAD & UNDP. (2010). Creative economy report 2010: Creative economy: A feasible development
option (No. UNCTAD/DITC/TAB/2010/3). Geneva: United Nations.UNdata. (2013). UNdata.United Nations statistical database. Retrieved 20 July 2013, from http://unstats.un.
orgUNDP. (2013). The rise of the South: Human progress in a diverse world. New York, NY: Author.Yúdice, G. (2003). The expediency of culture: Uses of culture in the global era. Durham, NC: Duke
University Press.
Cultural Trends 251
Dow
nloa
ded
by [U
nive
rsity
of L
eeds
] at 0
3:25
03
Janu
ary
2015