3-Year-olds' comprehension, production, and generalization ...
Upload
independentCategory
view
0download
0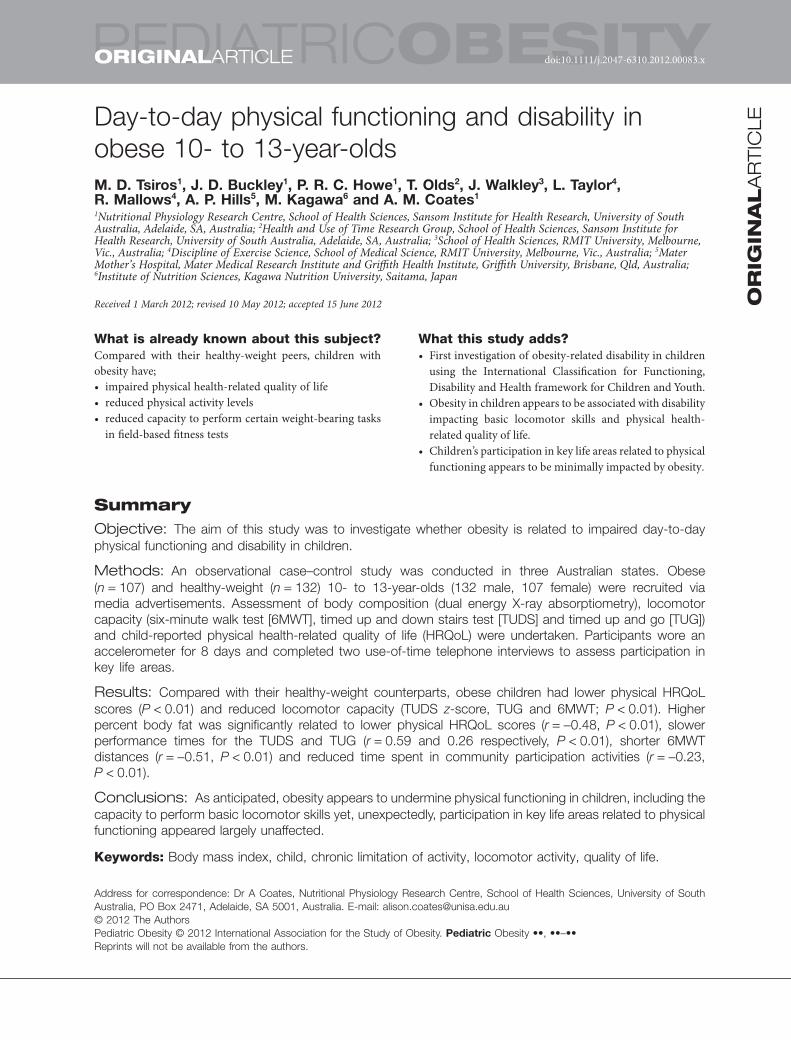
Day-to-day physical functioning and disability inobese 10- to 13-year-oldsM. D. Tsiros1, J. D. Buckley1, P. R. C. Howe1, T. Olds2, J. Walkley3, L. Taylor4,R. Mallows4, A. P. Hills5, M. Kagawa6 and A. M. Coates1
1Nutritional Physiology Research Centre, School of Health Sciences, Sansom Institute for Health Research, University of SouthAustralia, Adelaide, SA, Australia; 2Health and Use of Time Research Group, School of Health Sciences, Sansom Institute forHealth Research, University of South Australia, Adelaide, SA, Australia; 3School of Health Sciences, RMIT University, Melbourne,Vic., Australia; 4Discipline of Exercise Science, School of Medical Science, RMIT University, Melbourne, Vic., Australia; 5MaterMother’s Hospital, Mater Medical Research Institute and Griffith Health Institute, Griffith University, Brisbane, Qld, Australia;6Institute of Nutrition Sciences, Kagawa Nutrition University, Saitama, Japan
Received 1 March 2012; revised 10 May 2012; accepted 15 June 2012
What is already known about this subject?Compared with their healthy-weight peers, children withobesity have;• impaired physical health-related quality of life• reduced physical activity levels• reduced capacity to perform certain weight-bearing tasks
in field-based fitness tests
What this study adds?• First investigation of obesity-related disability in children
using the International Classification for Functioning,Disability and Health framework for Children and Youth.
• Obesity in children appears to be associated with disabilityimpacting basic locomotor skills and physical health-related quality of life.
• Children’s participation in key life areas related to physicalfunctioning appears to be minimally impacted by obesity.
SummaryObjective: The aim of this study was to investigate whether obesity is related to impaired day-to-dayphysical functioning and disability in children.
Methods: An observational case–control study was conducted in three Australian states. Obese(n = 107) and healthy-weight (n = 132) 10- to 13-year-olds (132 male, 107 female) were recruited viamedia advertisements. Assessment of body composition (dual energy X-ray absorptiometry), locomotorcapacity (six-minute walk test [6MWT], timed up and down stairs test [TUDS] and timed up and go [TUG])and child-reported physical health-related quality of life (HRQoL) were undertaken. Participants wore anaccelerometer for 8 days and completed two use-of-time telephone interviews to assess participation inkey life areas.
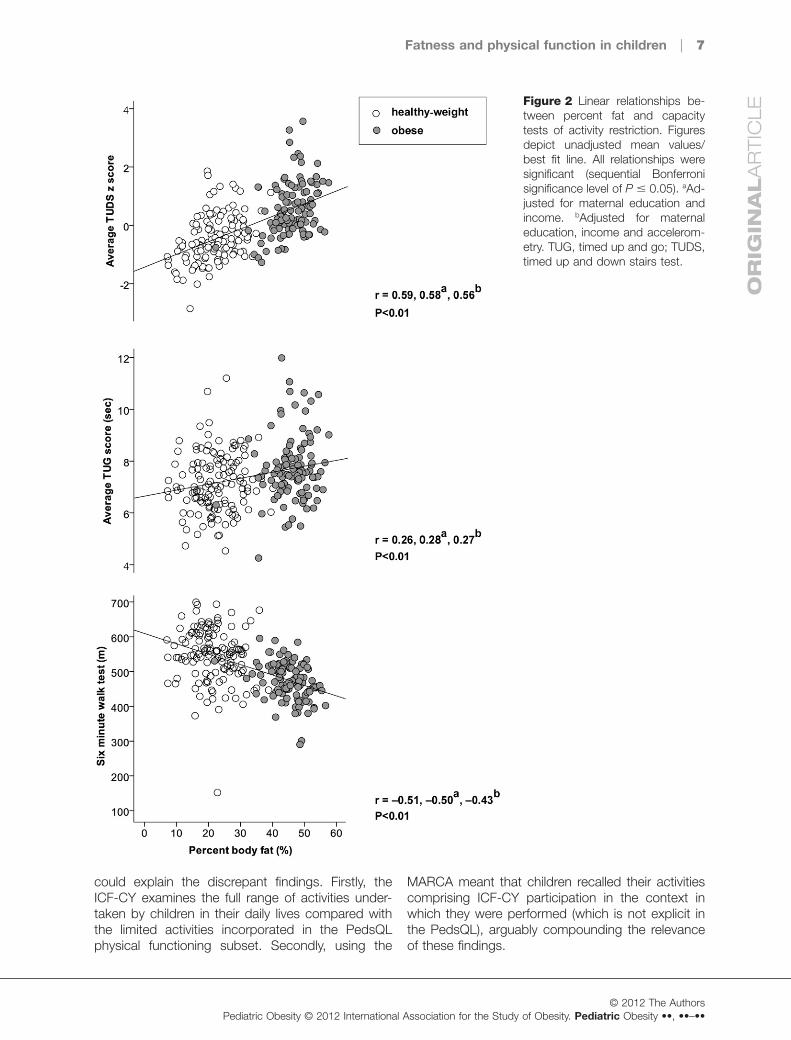
Results: Compared with their healthy-weight counterparts, obese children had lower physical HRQoLscores (P < 0.01) and reduced locomotor capacity (TUDS z-score, TUG and 6MWT; P < 0.01). Higherpercent body fat was significantly related to lower physical HRQoL scores (r = -0.48, P < 0.01), slowerperformance times for the TUDS and TUG (r = 0.59 and 0.26 respectively, P < 0.01), shorter 6MWTdistances (r = -0.51, P < 0.01) and reduced time spent in community participation activities (r = -0.23,P < 0.01).
Conclusions: As anticipated, obesity appears to undermine physical functioning in children, including thecapacity to perform basic locomotor skills yet, unexpectedly, participation in key life areas related to physicalfunctioning appeared largely unaffected.
Keywords: Body mass index, child, chronic limitation of activity, locomotor activity, quality of life.
Address for correspondence: Dr A Coates, Nutritional Physiology Research Centre, School of Health Sciences, University of SouthAustralia, PO Box 2471, Adelaide, SA 5001, Australia. E-mail: [email protected]© 2012 The AuthorsPediatric Obesity © 2012 International Association for the Study of Obesity. Pediatric Obesity ••, ••–••Reprints will not be available from the authors.
PEDIATRICOBESITY ORIGINALARTICLE doi:10.1111/j.2047-6310.2012.00083.x
OR
IGIN
AL
AR
TIC
LE

Introduction
Childhood obesity is a major public health concern indeveloped countries (1). In adults, obesity is associ-ated with physical disability (2,3), but its impact onphysical functioning and disability in childhood isunclear (4). The International Classification of Func-tioning, Disability and Health framework for Childrenand Youth (ICF-CY) provides a means of exploringday-to-day functioning, defined as ‘activity’ and ‘par-ticipation’, encompassing all life areas (5). ‘Activity’refers to a particular task or action undertaken by anindividual, whereas ‘participation’ represents a per-son's ‘engagement in a life situation’. Any restrictionin activity or participation constitutes ‘disability’.
As the ICF-CY framework has not been used inprevious paediatric obesity research, the concepts ofdisability and participation have not been explored.Previous research on children's participation inphysical activity has reported weak inverse relation-ships between weight status and overall physicalactivity (6,7). Participation in physical activity repre-sents only a small component of children's function-ing and was not a focus in the present study. WhileICF-CY activity restriction has not been explicitlyinvestigated, field-based fitness testing has shownthat obese children have a reduced capacity toperform activities requiring them to move or supporttheir mass, such as walking or running (4,8).However, many of the tasks assessed have beenhighly specific (e.g. long jump, plate tapping), bearinglittle resemblance to activities commonly undertakenby children in their daily lives.
Evaluating the impact of obesity on physical well-being (i.e. physical health-related quality of life[HRQoL]) as perceived by the child is also of keyimportance. Although external to the ICF-CY frame-work, HRQoL tools provide insight into activity andparticipation restrictions experienced as assessmentitems predominantly relate to these domains. Ourearlier review (9) found a strong inverse relationshipbetween mean child-reported physical HRQoL andmean body mass index (BMI) (r = -0.9, P = 0.01)(9). Subsequent studies have confirmed that obesechildren have impaired physical HRQoL comparedwith healthy-weight peers (10–13) and that physicalfunctioning improves with weight reduction (13–15).However, HRQoL tools alone do not sufficientlyexplore activity and participation restrictions giventhat they typically assess a limited range of life areas/activities. Therefore, the current study investigatedwhether obese children have impaired physical func-tioning and restrictions in participation in key lifeareas/activities compared with healthy-weight peers.
We hypothesized that children with obesity (com-pared with healthy-weight peers) have (i) lower physi-cal HRQoL; (ii) capacity restrictions in common dailylocomotor activities and (iii) participation limitations inlife areas relating to physical functioning.
MethodsAn observational case–control design was utilized.Obese and healthy-weight children (defined usingInternational Obesity Task Force [IOTF] criteria (16))aged 10–13 years were recruited via newspaperadvertisements, school newsletters, media releases,flyers and a hospital paediatric clinic from three Aus-tralian states (South Australia [SA], Victoria andQueensland) between February 2008 and August2009. Children were excluded if they were under-weight (17), overweight (16), had an intellectual/neurological impairment, a history/presence of earinfections, balance disturbance or acute injuryrequiring medical attention (e.g. fracture, sprain) inthe past 6 months, a diagnosed medical cause fortheir obesity (e.g. hypothyroidism) or had under-taken weight-loss/obesity treatment in the last 3months. Ethical approval was obtained from theUniversity of South Australia (UniSA), RMIT Univer-sity, Queensland University of Technology (QUT) andFlinders Medical Centre Human Research EthicsCommittees.
Anthropometry and body composition
Anthropometric measures followed the protocolsof the International Society for the Advancementof Kinanthropometry (18). Height was measuredwith a wall-mounted stadiometer (Heightronics,QuickMedical, Issaquah, WA, USA, or SECA 22,Hamburg, Germany) to the nearest 0.1 cm, with par-ticipants barefoot. Body mass was measured usingelectronic digital scales (Tanita BWB 600 or TANITAultimate scale 2000 scales, Tanita Corporation,Tokyo, Japan) to the nearest 0.1 kg, with participantswearing only a hospital gown and underwear. Par-ticipants were classified as obese or healthy-weightbased on BMI (kg m-2) using the IOTF criteria (16).BMI z-scores were calculated based on the UnitedStates Centre for Disease Control and Preventionreference data (19).
Body composition was assessed using dualenergy X-ray absorptiometry (DXA; Lunar Prodigy,General Electric, Madison, WI, USA) with standardsoftware (ENCORE 2003, version 7.52, GeneralElectric, Madison, WI, USA). Whole body scans wereanalyzed to determine percent body/tissue fat (%)and non-bone fat-free lean tissue mass (FFM; kg).
2 | M. D. Tsiros et al.O
RIG
INA
LA
RT
ICL
E
© 2012 The AuthorsPediatric Obesity © 2012 International Association for the Study of Obesity. Pediatric Obesity ••, ••–••

Participants were scanned wearing underwear and ahospital gown.
Physical activity
Physical activity was assessed using uniaxial accel-erometers (Actigraph®, version 2.2 model 7164, MTIHealth Services, Fort Walton Beach, FL, USA), whichhave a strong inter-instrument reliability (intra-classcorrelation coefficient [ICC]: 0.87) (20) and moderatevalidity (r = 0.50–0.74) (21,22) in children aged 6–16years. Participants wore the Actigraph on their righthip for eight consecutive days (including overnight),removing it only for water-based activities. Data werecollected in 1-min epochs during the school term,avoiding school holidays. Minimum data inclusioncriteria consisted of �4 weekdays plus Saturday andSunday, with �10 eligible hours (>3000 counts h-1)of wear-time per day. Eligible data were then reducedto average counts per hour per day to account for adiffering number of hours awake per day. Weightedaverages of weekday and weekend day counts perhour were then calculated separately to provide anindication of overall activity (weekly average countsper hour). Weekdays (i.e. school days) and weekenddays (i.e. non-school days) were weighted equally toreflect the typical average annual pattern.
Demographics/background information
Parents completed a questionnaire to collect infor-mation about household income, maternal educa-tion, child medications and any medical conditions.Pubertal development was self-assessed using theTanner scale (23).
Activity capacity restrictions
The ICF-CY framework (5) was used to define activity(and participation). Capacity to perform locomotoractivities (walking/moving) was of specific interest.
Timed up and down stairs test
The timed up and down stairs test (TUDS) evaluatesbasic functional mobility with excellent reliability(ICC � 0.94) and moderate to good construct valid-ity (Spearman's rho: 0.57–0.78) in 8- to 14-year-olds(24). Participants were provided with a demonstra-tion and standard instructions to ascend anddescend 15 steps ‘quickly, but safely’ using a self-selected method. Total time was recorded to thenearest 0.1 s. The average of two trials wasexpressed as a z-score relative to other participantsat the same data collection site to account for slightvariations in step dimensions between sites.
Six-minute walk test
The six-minute walk test (6MWT) assesses mobilityand has good reliability in paediatric populationsaged 8–16 years (ICC: 0.84–0.96) (25,26). Althoughvalidated as a cardiorespiratory fitness measure (25),validity as a functional mobility test was establishedin the current sample against the TUDS (r = 0.42,P = 0.01). Following a demonstration and standardinstructions, participants walked back and forthbetween two markers on a 10-m track, receivingstandardized verbal encouragement each minute. At6 min, the total distance walked was calculated tothe nearest 0.1 m.
Timed up and go test
The timed up and go (TUG) is a test of functionalmobility in children with good test–retest reliability(ICC: 0.83) and moderate construct validity (Spear-man's rho: -0.52) in children aged 3–19 years (27).Participants were seated with a knee angle of 90° ina height-adjustable armless chair. A demonstrationand standardized verbal instructions were given. Par-ticipants moved from sitting to standing and walked3 m to touch a point on a wall opposite before return-ing to sit down (27). The average of three timed trials(measured to the nearest 0.1 s) was taken.
Participation limitation (performance)
The Multimedia Activity Recall for Children and Ado-lescents (MARCA) was used to assess participation(performance). The MARCA is a computerized 24-hself-report use-of-time tool that has strong reliability(ICC: 0.88–0.94) and moderate validity (Spear-man's rho: 0.36–0.45) in 9- to 13-year-olds (28). TheMARCA was interviewer-administered by telephoneon two occasions with participants recalling the priortwo days, capturing a total of two school days andtwo non-school days in a given week during theschool term (minimum inclusion criteria was oneschool day and one non-school day). Each day wassegmented using waking/sleeping, meal/break andschool times. Participants chose from over 250 activi-ties in time slices �5 min, and specified the intensity(light, hard or medium) and perceived physical diffi-culty experienced completing the task (on a 0–10rating scale). Interviewers were blinded to the weightstatus of participants (i.e. obese vs. healthy-weight).
MARCA data were reduced into the most relevantICF-CY activity/participation ‘chapter’. Only thoseICF-CY chapters with a strong bias towards physicalfunctioning were selected for analysis (mobility,self-care, domestic life and community/social/civic
Fatness and physical function in children | 3
OR
IGIN
AL
AR
TIC
LE
© 2012 The AuthorsPediatric Obesity © 2012 International Association for the Study of Obesity. Pediatric Obesity ••, ••–••

life). Key variables for each ICF-CY chapter of interestincluded ‘average time spent per day’ in minutes and‘average perceived physical difficulty weighted fortime spent’. Physical difficulty was weighted for timespent to account for the possibility that children mayspend less time engaging in activities they find morephysically challenging (or vice versa). School day andnon-school day data were equally weighted.
Physical HRQoL
Physical HRQoL was assessed using the physicalfunctioning subset of the PedsQLTM version 4.0(Generic Core Scales). The PedsQL has extensivelyestablished internal consistency (a: 0.7–0.9) andconstruct validity in children aged 2–16 years (29).Respondents recorded how much of a problem eachitem/activity had been for them during the pastmonth using a 5-point Likert scale. The mean ofcompleted items was calculated to gain a physicalfunctioning score ranging from 0 to 100, with higherscores representing better functioning.
Statistical analysis
Analyses were conducted using SPSS version 17 forWindows (International Business Machines Corpora-tion [IBM], Atmonk, New York, USA). Missing valueswere imputed using expectation maximization algo-rithms after data were confirmed as missing com-pletely at random (MCAR) using Little's MCAR test(30) (P = 0.61). Unadjusted differences between thegroups were evaluated using the Student'sindependent-samples t-test (normally distributeddata) or Mann–Whitney U-test (non-normally distrib-uted data). Analyses were adjusted for potential con-founding variables that were significantly different
between groups (accelerometry, maternal educationand household income) using analysis of covari-ance (ANCOVA). Participation outcomes were onlyadjusted for maternal education/household incomeas physical activity forms a component of participa-tion. Non-normally distributed data (that could not betransformed) were ranked before using ANCOVA.Relationships between activity/participation/physicalHRQoL and percent body fat were examined usinglinear regression and adjusted for potential con-founding variables. Significance was set at P � 0.05,and with multiple tests, type I error was controlled forusing a post hoc sequential Bonferroni procedure(31). Data from boys and girls were pooled, as wedid not expect gender to modify the relationshipbetween obesity and physical function given the ageand sexual immaturity of this sample. This was con-firmed by a post hoc sensitivity analysis revealingcomparable results for boys and girls when examin-ing relationships between percent fat and physicalfunction outcomes and obese/healthy-weight differ-ences. Data were not split by age given the homo-geneous age range of the sample.
ResultsThe final data set included 239 obese and healthy-weight (Fig. 1) predominantly non-treatment-seekingchildren (n = 233). Age, gender, height and puber-tal development did not differ between groups(P � 0.13) (Table 1). However, the obese group hadlower mean accelerometry counts (P < 0.01), mater-nal education (P = 0.01) and household income(P < 0.01). As expected, mass, BMI, percent fat andFFM were all greater in the obese compared with thehealthy-weight group (P < 0.01) (Table 1).
Figure 1 Summary of participantrecruitment and participation.Twenty-eight healthy-weight partici-pants were declined due to recruit-ment quota being met. *n = 13were excluded after eligibility wasre-checked using measured bodymass index against InternationalObesity Task Force criteria (16).QUT, Queensland University ofTechnology; RMIT, RMIT Univer-sity; UniSA, University of SouthAustralia.
4 | M. D. Tsiros et al.O
RIG
INA
LA
RT
ICL
E
© 2012 The AuthorsPediatric Obesity © 2012 International Association for the Study of Obesity. Pediatric Obesity ••, ••–••
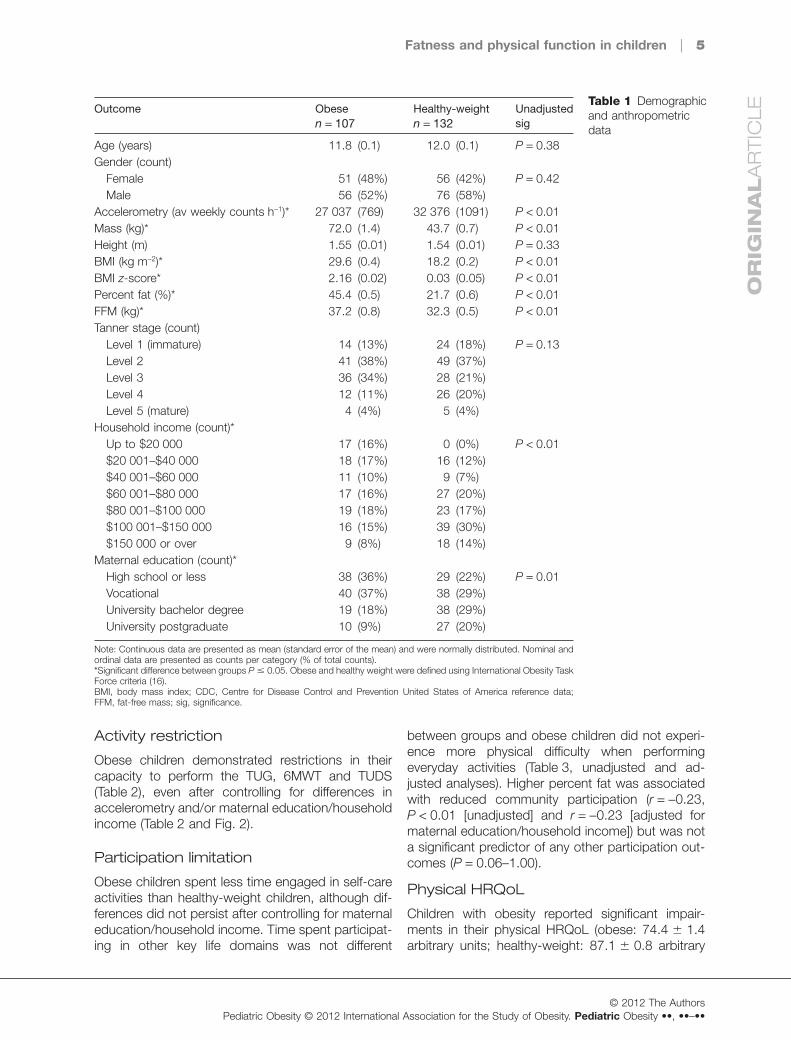
Activity restriction
Obese children demonstrated restrictions in theircapacity to perform the TUG, 6MWT and TUDS(Table 2), even after controlling for differences inaccelerometry and/or maternal education/householdincome (Table 2 and Fig. 2).
Participation limitation
Obese children spent less time engaged in self-careactivities than healthy-weight children, although dif-ferences did not persist after controlling for maternaleducation/household income. Time spent participat-ing in other key life domains was not different
between groups and obese children did not experi-ence more physical difficulty when performingeveryday activities (Table 3, unadjusted and ad-justed analyses). Higher percent fat was associatedwith reduced community participation (r = -0.23,P < 0.01 [unadjusted] and r = -0.23 [adjusted formaternal education/household income]) but was nota significant predictor of any other participation out-comes (P = 0.06–1.00).
Physical HRQoL
Children with obesity reported significant impair-ments in their physical HRQoL (obese: 74.4 � 1.4arbitrary units; healthy-weight: 87.1 � 0.8 arbitrary
Table 1 Demographicand anthropometricdata
Outcome Obesen = 107
Healthy-weightn = 132
Unadjustedsig
Age (years) 11.8 (0.1) 12.0 (0.1) P = 0.38Gender (count)
Female 51 (48%) 56 (42%) P = 0.42Male 56 (52%) 76 (58%)
Accelerometry (av weekly counts h-1)* 27 037 (769) 32 376 (1091) P < 0.01Mass (kg)* 72.0 (1.4) 43.7 (0.7) P < 0.01Height (m) 1.55 (0.01) 1.54 (0.01) P = 0.33BMI (kg m-2)* 29.6 (0.4) 18.2 (0.2) P < 0.01BMI z-score* 2.16 (0.02) 0.03 (0.05) P < 0.01Percent fat (%)* 45.4 (0.5) 21.7 (0.6) P < 0.01FFM (kg)* 37.2 (0.8) 32.3 (0.5) P < 0.01Tanner stage (count)
Level 1 (immature) 14 (13%) 24 (18%) P = 0.13Level 2 41 (38%) 49 (37%)Level 3 36 (34%) 28 (21%)Level 4 12 (11%) 26 (20%)Level 5 (mature) 4 (4%) 5 (4%)
Household income (count)*Up to $20 000 17 (16%) 0 (0%) P < 0.01$20 001–$40 000 18 (17%) 16 (12%)$40 001–$60 000 11 (10%) 9 (7%)$60 001–$80 000 17 (16%) 27 (20%)$80 001–$100 000 19 (18%) 23 (17%)$100 001–$150 000 16 (15%) 39 (30%)$150 000 or over 9 (8%) 18 (14%)
Maternal education (count)*High school or less 38 (36%) 29 (22%) P = 0.01Vocational 40 (37%) 38 (29%)University bachelor degree 19 (18%) 38 (29%)University postgraduate 10 (9%) 27 (20%)
Note: Continuous data are presented as mean (standard error of the mean) and were normally distributed. Nominal andordinal data are presented as counts per category (% of total counts).*Significant difference between groups P � 0.05. Obese and healthy weight were defined using International Obesity TaskForce criteria (16).BMI, body mass index; CDC, Centre for Disease Control and Prevention United States of America reference data;FFM, fat-free mass; sig, significance.
Fatness and physical function in children | 5
OR
IGIN
AL
AR
TIC
LE
© 2012 The AuthorsPediatric Obesity © 2012 International Association for the Study of Obesity. Pediatric Obesity ••, ••–••
units; P � 0.01 for adjusted and unadjustedanalyses). There was a moderate inverse relation-ship between percent fat and physical HRQoL(Fig. 3).
DiscussionThis observational study supports the hypothesisthat obesity is associated with disability as defined bythe ICF-CY; children with obesity had reducedcapacity to perform common locomotor tasks andimpaired physical HRQoL. However, contrary toexpectations, there was minimal evidence of partici-pation limitations and increased physical difficulty inkey life chapters relating to physical functioning.
Activity restriction
Increasing adiposity was associated with poorerperformance in tests of activity restriction (TUG/TUDS/6MWT). Obese and healthy-weight groupcomparisons revealed that walking was impairedwith obese children covering 14% less distanceduring the 6MWT. These findings confirm previousreports of impaired walk/run capacity (32–34) inobese children, although the 6MWT arguably hasgreater functional relevance, assessing mobility overa period of time which more closely resembles activi-ties of daily living (25). Children with obesity hadgreater difficulty negotiating stairs in the TUDS, amore conventional activity than the Margaria StairTest used in previous studies (35,36). Even the rela-tively simple task of getting up from a chair, walking3 m and returning to sit was mildly impaired in theobese group (-7% TUG).
Physical HRQoL
Confirming previous reports (9) and studies usingIOTF criteria (11,37–40), obese children reportedpoorer physical HRQoL than their healthy-weightcounterparts. Physical HRQoL decreased withincreasing adiposity, suggesting that children may
find many of the basic physical functions reflected inphysical HRQoL (such as walking, running andchores) more difficult as the burden of excess fatincreases. While other studies have reported similarrelationships (r = -0.23 to -0.54) (41–45), measuresof weight status have been limited to less accurateadiposity indicators such as BMI z-score.
Participation limitation
Given the decrements in physical HRQoL and loco-motor functioning in children with obesity, it wassurprising that children's participation in key lifechapters appeared largely unaffected by obesity.Children with obesity reported spending less timeengaged in self-care activities than their healthy-weight peers, but these differences were small(~7 min day–1) and were attributable to theirlower socioeconomic status (maternal education/household income). Higher adiposity was weaklyassociated with reduced community participation;however, this domain was heavily weighed towardsrecreation/leisure activities, thus reflecting thereduced physical activity levels in obese children(6,7). Reductions in community participation mayalso reflect reduced social functioning, supported byHRQoL research reporting decrements in socialfunctioning with increasing adiposity (9).
Unexpectedly, obesity was not associated withgreater self-reported physical difficulty when partici-pating in key life chapters. Perhaps children withobesity ‘normalize’ their experiences having accom-modated to engagement in these activities over time.Alternatively, obese children may have overstatedtheir functioning, not wanting to admit experiencinggreater physical difficulty for fear of stigmatization. Insummary, while obese children have a restrictedcapacity to undertake certain locomotor activities,the demands of their day-to-day environment mayenable them to overcome many restrictions.
Despite overlap between physical HRQoL andICF-CY participation, some fundamental differences
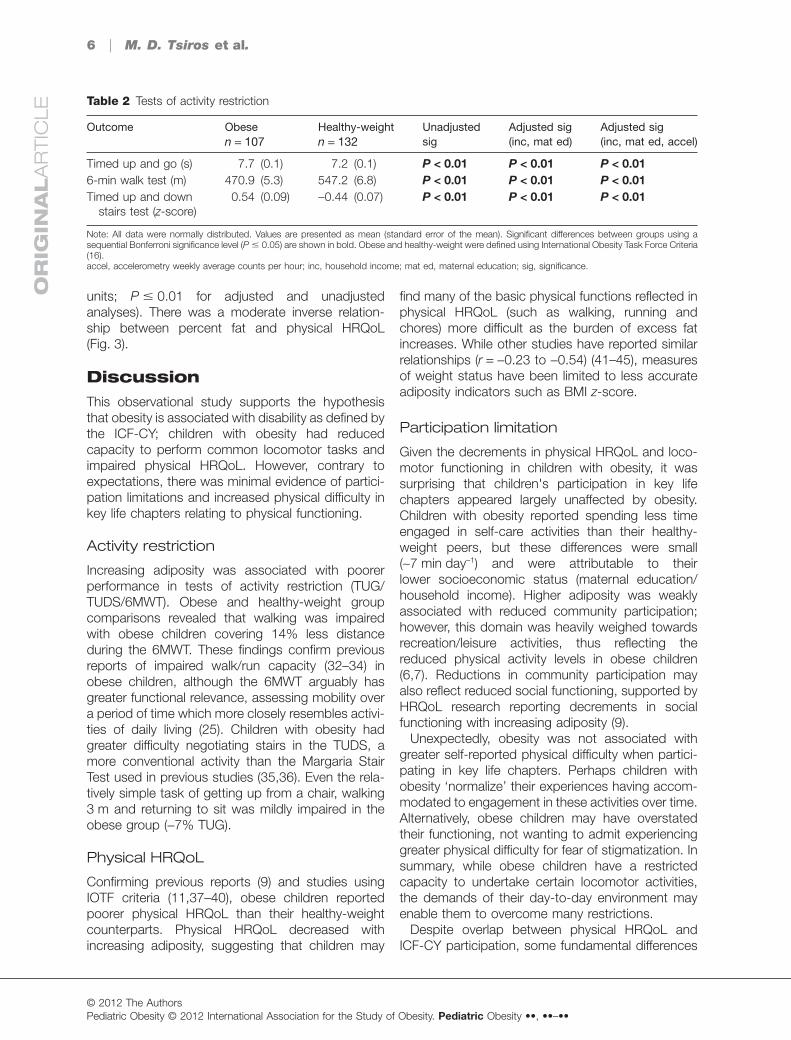
Table 2 Tests of activity restriction
Outcome Obesen = 107
Healthy-weightn = 132
Unadjustedsig
Adjusted sig(inc, mat ed)
Adjusted sig(inc, mat ed, accel)
Timed up and go (s) 7.7 (0.1) 7.2 (0.1) P < 0.01 P < 0.01 P < 0.016-min walk test (m) 470.9 (5.3) 547.2 (6.8) P < 0.01 P < 0.01 P < 0.01Timed up and down
stairs test (z-score)0.54 (0.09) -0.44 (0.07) P < 0.01 P < 0.01 P < 0.01
Note: All data were normally distributed. Values are presented as mean (standard error of the mean). Significant differences between groups using asequential Bonferroni significance level (P � 0.05) are shown in bold. Obese and healthy-weight were defined using International Obesity Task Force Criteria(16).accel, accelerometry weekly average counts per hour; inc, household income; mat ed, maternal education; sig, significance.
6 | M. D. Tsiros et al.O
RIG
INA
LA
RT
ICL
E
© 2012 The AuthorsPediatric Obesity © 2012 International Association for the Study of Obesity. Pediatric Obesity ••, ••–••
could explain the discrepant findings. Firstly, theICF-CY examines the full range of activities under-taken by children in their daily lives compared withthe limited activities incorporated in the PedsQLphysical functioning subset. Secondly, using the
MARCA meant that children recalled their activitiescomprising ICF-CY participation in the context inwhich they were performed (which is not explicit inthe PedsQL), arguably compounding the relevanceof these findings.
Figure 2 Linear relationships be-tween percent fat and capacitytests of activity restriction. Figuresdepict unadjusted mean values/best fit line. All relationships weresignificant (sequential Bonferronisignificance level of P � 0.05). aAd-justed for maternal education andincome. bAdjusted for maternaleducation, income and accelerom-etry. TUG, timed up and go; TUDS,timed up and down stairs test.
Fatness and physical function in children | 7
OR
IGIN
AL
AR
TIC
LE
© 2012 The AuthorsPediatric Obesity © 2012 International Association for the Study of Obesity. Pediatric Obesity ••, ••–••

To summarize, unlike adults, participation limita-tions in physical functioning were not obvious inthis sample of obese 10- to 13-year-olds. Whethersuch participatory limitations start to emerge aschildren progress through adolescence and intoadulthood warrants exploration, along with theunderlying mechanisms behind any functionaldecline, in order to inform effective preventionstrategies.
Strengths and limitations
Previous paediatric obesity research has not usedthe ICF-CY framework [the international standard fordescribing disability/functioning (5)], meaning partici-pation limitations in key life areas have not beenpreviously explored. Suitable tools to assess partici-pation in typically developing children are scarce andthe MARCA use-of-time tool was selected as it does
Table 3 Participationdata assessed usingthe MultimediaActivity Recall forChildren and Adoles-cents (MARCA)
MARCA outcome Obesen = 107
Healthy weightn = 132
Unadjustedsig
Adjusted sig(inc, mat ed)
Average time spent(minutes per day)
ICF-CY self-care* 82.2 (2.0) 89.6 (1.8) P = 0.01 P = 0.11ICF-CY domestic† 35.0 (35.0) 30.6 (40.6) P = 0.33 P = 0.23ICF-CY mobility† 13.8 (20.0) 13.8 (18.5) P = 0.61 P = 0.63ICF-CY community* 186.0 (8.9) 202.5 (7.3) P = 0.15 P = 0.23
Average physical difficultyweighed for time spent
ICF-CY self-care† 0.04 (0.4) 0.03 (0.4) P = 0.71 P = 0.22ICF-CY domestic† 0.4 (1.1) 0.4 (0.9) P = 0.76 P = 0.66ICF-CY mobility† 0.3 (1.0) 0.3 (1.1) P = 0.62 P = 0.54ICF-CY community† 1.5 (1.6) 1.2 (1.4) P = 0.62 P = 0.83
Note: School weekday and non-school day data were weighted evenly.*Normally distributed data [shown as mean (standard error of the mean)].†Non-normally distributed data [shown as median (interquartile range)]. Significant differences between groups using asequential Bonferroni significance level (P � 0.01) are shown in bold. Obese and healthy-weight were defined usingInternational Obesity Task Force Criteria (16).ICF-CY, International Classification of Disability and Functioning Children and Youth Version; inc, income; mat ed, maternaleducation; MARCA, Multimedia Activity Recall for Children and Adolescents; sig, significance.
Figure 3 Linear relationship be-tween percent fat and child physicalhealth-related quality of life. Figuredepicts unadjusted mean values/best fit line. All unadjusted andadjusted relationships were signifi-cant (P < 0.01). aAdjusted for mater-nal education and income. bAdjustedfor maternal education, income andaccelerometry. PEDSQL, PediatricQuality of Life Inventory.
8 | M. D. Tsiros et al.O
RIG
INA
LA
RT
ICL
E
© 2012 The AuthorsPediatric Obesity © 2012 International Association for the Study of Obesity. Pediatric Obesity ••, ••–••
not make rigid assumptions about what childrendo during their day and also assesses participationfrom the viewpoint of individuals who alone knowand understand their own functioning (46). Futureresearch could also consider parent/teacher-proxyreports as complementary assessments. Furtherstrengths of this study include the triangulatedapproach to the assessment of children's function-ing, examination of capacity activity restrictions ofmaximal functional relevance, improved generaliz-ability due to the use of IOTF criteria (16) and a moreaccurate estimation of adiposity using DXA (47).Despite these strengths, limitations still exist.Namely, the reduction of participation data to key lifeareas may have been too broad to highlight obesity-induced limitations/difficulties. For instance, obese/healthy-weight differences in moderate-to-vigorousphysical activity and screen time considered sepa-rately have been shown elsewhere (48), but were outof scope here. Furthermore, while this study focusedon physical functioning, the key life areas investi-gated invariably reflect psychosocial functioning asparticipation is the by-product of individuals interact-ing with their physical and social environment (46).Additionally, the MARCA, being a self-report tool, issubject to recall biases. However, strategies to mini-mize bias were employed, including day segmenta-tion and the requirement of having to account for all24 h in a day (49). Finally, other factors beyond thescope of the current investigation such as ethnicitycould also impact study findings.
In conclusion, this study confirms that obesity inthis age group of children is coupled with impairedphysical HRQoL and activity restrictions in basiclocomotor activities such as walking, climbing stairsand moving between seated and upright postures,constituting some level of ‘disability’. However, whenextending beyond the clinical setting, to examineparticipation in key life areas relating to physicalfunctioning, 10- to 13-year-olds did not appear toexperience the same participation limitations andincreased physical difficulty with daily tasks known tobe associated with adult obesity. There is consider-able scope for future investigations of children'sparticipation in life activities relating to physical func-tioning that would be particularly suited to mixedqualitative and quantitative methods. Evaluatingwhether children's participation varies according tothe severity of their obesity, how long they have beenobese and whether obesity-related participationlimitations become more apparent as children pro-gress through adolescence remains to be explored.Whether gender-related differences in functioningalso start to emerge in adolescence when greater
diversity may be expected would also be of interest.Finally, it is particularly pertinent to identify the age ofonset, and causes of obesity-related participationlimitations and worsening disability known to beassociated with adult obesity, so that targeted pre-vention strategies can be implemented to preservephysical functioning.
Future researchrecommendationsExamine whether children's participation and physi-cal functioning• varies with obesity chronicity and severity;• deteriorates as children progress throughadolescence.Regarding known adult obesity-related disability,identify• the age of onset;• associated risk factors/causes to enable earlyintervention.
Conflict of InterestStatementNone.
AcknowledgementsThis study was funded by a seeding grant from thePhysiotherapy Research Foundation and internalfunds (ATN Centre for Metabolic Fitness). Dr Marga-rita Tsiros was supported by an Australian PostGraduate Award. The Quality of Life study describedin this paper was carried out using the PedsQLdeveloped by Dr James W. Varni. Thanks are due toProfessor Adrian Esterman (for the advice on statis-tical analysis) and to Dr Paul Grimshaw (for thegeneral advice on study design). Technical assist-ance was provided with thanks by Ms Keren Knee-bone, Ms Emily Vaughton, Dr Rachel Wood, DrSarah Shultz, Mr Kaine Grigg, Ms Fiona Spargo andMs Kate Greenway.
References1. Ebbeling CB, Pawlak DB, Ludwig DS. Childhoodobesity: public-health crisis, common sense cure. Lancet2002; 360: 473–482.2. Trogdon JG, Finkelstein EA, Hylands T, Dellea PS,Kamal-Bahl SJ. Indirect costs of obesity: a review of thecurrent literature. Obes Rev 2008; 9: 489–500.3. Ells LJ, Lang R, Shield JP, et al. Obesity and disability –a short review. Obes Rev 2006; 7: 341–345.4. Tsiros MD, Coates AM, Howe PR, Grimshaw PN,Buckley JD. Obesity: the new childhood disability? ObesRev 2010; 12: 26–36.
Fatness and physical function in children | 9
OR
IGIN
AL
AR
TIC
LE
© 2012 The AuthorsPediatric Obesity © 2012 International Association for the Study of Obesity. Pediatric Obesity ••, ••–••
5. WHO. International Classification of Functioning, Dis-ability and Health: Children and Youth Version. WorldHealth Organisation Press: Geneva, 2007.6. Rowlands AV, Ingledew DK, Eston RG. The effect oftype of physical activity measure on the relationshipbetween body fatness and habitual physical activity inchildren: a meta-analysis. Ann Hum Biol 2000; 27: 479–497.7. Elgar FJ, Roberts C, Moore L, Tudor-Smith C. Seden-tary behaviour, physical activity and weight problems inadolescents in Wales. Public Health 2005; 119: 518–524.8. Poulsen AA, Desha L, Ziviani J, et al. Fundamentalmovement skills and self-concept of children who are over-weight. Int J Pediatr Obes 2011; 6: e464–e471.9. Tsiros MD, Olds T, Buckley JD, et al. Health-relatedquality of life in obese children and adolescents. Int J Obes(Lond) 2009; 33: 387–400.10. Riazi A, Shakoor S, Dundas I, Eiser C, McKenzie SA.Health-related quality of life in a clinical sample of obesechildren and adolescents. Health Qual Life Outcomes2010; 8: 134.11. Wake M, Canterford L, Patton GC, et al. Comorbidi-ties of overweight/obesity experienced in adolescence:longitudinal study. Arch Dis Child 2010; 95: 162–168.12. Wille N, Bullinger M, Holl R, et al. Health-related qualityof life in overweight and obese youths: results of a multi-center study. Health Qual Life Outcomes 2010; 8: 36.13. Yackobovitch-Gavan M, Nagelberg N, Demol S, PhillipM, Shalitin S. Influence of weight-loss diets with differentmacronutrient compositions on health-related quality of lifein obese youth. Appetite 2008; 51: 697–703.14. Loux TJ, Haricharan RN, Clements RH, et al. Health-related quality of life before and after bariatric surgery inadolescents. J Pediatr Surg 2008; 43: 1275–1279.15. Quinlan NP, Kolotkin RL, Fuemmeler BF, CostanzoPR. Psychosocial outcomes in a weight loss camp foroverweight youth. Int J Pediatr Obes 2009; 4: 134–142.16. Cole TJ, Bellizzi MC, Flegal KM, Dietz WH. Establish-ing a standard definition for child overweight and obesityworldwide: international survey. BMJ 2000; 320: 1240–1243.17. Cole TJ, Flegal KM, Nicholls D, Jackson AA. Bodymass index cut offs to define thinness in children andadolescents: international survey. BMJ 2007; 335: 194.18. Norton K, Olds T. Anthropometrica: A Textbook ofBody Measurement for Sports and Health Courses. UNSWPress: Sydney, 1996.19. National Centre for Health Statistics. Centres fordisease control and prevention growth charts.2000. [WWW document]. URL http://www.cdc.gov/growthcharts/ (accessed 5 February 2007).20. Trost SG, Ward DS, Moorehead SM, Watson PD,Riner W, Burke JR. Validity of the computer science andapplications (CSA) activity monitor in children. Med SciSports Exerc 1998; 30: 629–633.21. Janz KF. Validation of the CSA accelerometer forassessing children's physical activity. Med Sci SportsExerc 1994; 26: 369–375.
22. Puyau MR, Adolph AL, Vohra FA, Butte NF. Validationand calibration of physical activity monitors in children.Obes Res 2002; 10: 150–157.23. Tanner JM. Growth at Adolescence, 2nd edn. Black-well Scientific: London, 1962.24. Zaino CA, Marchese VG, Westcott SL. Timed up anddown stairs test: preliminary reliability and validity of a newmeasure of functional mobility. Pediatr Phys Ther 2004;16: 90–98.25. Li AM, Yin J, Yu CCW, et al. The six-minute walk testin healthy children: reliability and validity. Eur Respir J 2005;25: 1057–1060.26. Morinder G, Mattsson E, Sollander C, Marcus C,Larsson UE. Six-minute walk test in obese children andadolescents: reproducibility and validity. Physiother Res Int2009; 14: 91–104.27. Williams E, Carroll S, Reddihough D, Phillips B, GaleaM. Investigation of the timed ‘up & go’ test in children. DevMed Child Neurol 2005; 47: 518–524.28. Ridley K, Olds TS, Hill A. The Multimedia activity recallfor children and adolescents (MARCA): development andevaluation. Int J Behav Nutr Phys Act 2006; 3: 10.29. Varni J, Burwinkle T, Seid M, Skarr D. The PedsQL 4.0as a pediatric population health measure: feasibility, reli-ability, and validity. Ambul Pediatr 2003; 3: 329–341.30. Little RJ. A test of missing completely at random formultivariate data with missing values. J Am Stat Assoc1988; 83: 1198–1202.31. Rice WR. Analyzing tables of statistical tests. Evolution1989; 43: 223–225.32. Norman A-C, Drinkard B, McDuffie JR, Ghorbani S,Yanoff LB, Yanovski JA. Influence of excess adiposity onexercise fitness and performance in overweight childrenand adolescents. Pediatrics 2005; 115: e690–e696.33. Olds T, Dollman J. Are changes in distance-run per-formance of Australian children between 1985 and 1997explained by changes in fatness? Pediatr Exerc Sci 2004;16: 201–209.34. Westerstahl M, Barnekow-Bergkvist M, Hedberg G,Jansson E. Secular trends in body dimensions and physi-cal fitness among adolescents in Sweden from 1974 to1995. Scan J Med Sci Sports 2003; 13: 128–137.35. Chatterjee S, Mandal A, Das N. Physical and motorfitness level of Indian school-going boys. J Sports MedPhys Fitness 1993; 33: 268–277.36. Sartorio A, Agosti F, De Col A, Lafortuna CL. Age- andgender-related variations of leg power output and bodycomposition in severely obese children and adolescents.J Endocrinol Invest 2006; 29: 48–54.37. Williams J, Wake M, Hesketh K, Maher E, Waters E.Health-related quality of life of overweight and obese chil-dren. JAMA 2005; 293: 70–76.38. de Beer M, Hofsteenge GH, Koot HM, Hirasing RA,Delemarre-van de Waal HA, Gemke R. Health-related-quality-of-life in obese adolescents is decreased andinversely related to BMI. Acta Paediatr 2007; 96: 710–714.39. Wake M, Hardy P, Sawyer MG, Carlin JB. Comorbidi-ties of overweight/obesity in Australian preschoolers: a
10 | M. D. Tsiros et al.O
RIG
INA
LA
RT
ICL
E
© 2012 The AuthorsPediatric Obesity © 2012 International Association for the Study of Obesity. Pediatric Obesity ••, ••–••
cross-sectional population study. Arch Dis Child 2009; 93:502–507.40. Fazah A, Jacob C, Moussa E, El-Hage R, Youssef H,Delamarche P. Activity, inactivity and quality of life amongLebanese adolescents. Pediatr Int 2010; 52: 573–578.41. Zeller MH, Modi AC. Predictors of health-relatedquality of life in obese youth. Obesity (Silver Spring) 2006;14: 122–130.42. Pinhas-Hamiel O, Singer S, Pilpel N, Fradkin A, ModanD, Reichman B. Health-related quality of life among chil-dren and adolescents: associations with obesity. Int JObes (Lond) 2006; 30: 267–272.43. Schwimmer JB, Burwinkle TM, Varni JW. Healthrelated quality of life of severely obese children and ado-lescents. JAMA 2003; 289: 1813–1819.44. Tyler C, Johnston CA, Fullerton G, Foreyt JP. Reducedquality of life in very overweight Mexican American adoles-cents. J Adolesc Health 2007; 40: 366–368.45. Dalton WT, 3rd, Schetzina KE, Pfortmiller DT, SlawsonDL, Frye WS. Health Behaviors and health-related quality
of life among middle school children in Southern Appala-chia: data from the Winning with Wellness Project. JPediatr Psychol 2011; 36: 677–686.46. Forsyth R, Jarvis S. Participation in childhood. ChildCare Health Dev 2002; 28: 277–279.47. Lobstein T, Baur L, Uauy R. Obesity in children andyoung people: a crisis in public health. Report for theInternational Obesity Task Force Childhood ObesityWorking Group. Obes Rev 2004; 5: 4–104.48. Anderson SE, Economos CD, Must A. Active play andscreen time in US children aged 4 to 11 years in relation tosociodemographic and weight status characteristics: anationally representative cross-sectional analysis. BMCPublic Health 2008; 8: 366.49. Olds TS, Ferrar KE, Schranz NK, Maher CA. Obeseadolescents are less active than their normal-weight peers,but wherein lies the difference? J Adolesc Health 2011; 48:189–195.
Fatness and physical function in children | 11
OR
IGIN
AL
AR
TIC
LE
© 2012 The AuthorsPediatric Obesity © 2012 International Association for the Study of Obesity. Pediatric Obesity ••, ••–••
Copyright © 2022 FDOKUMEN