Planning for Housing Development in Brazil: Planning, Policy and Implementation
Upload
khangminh22Category
view
1download
0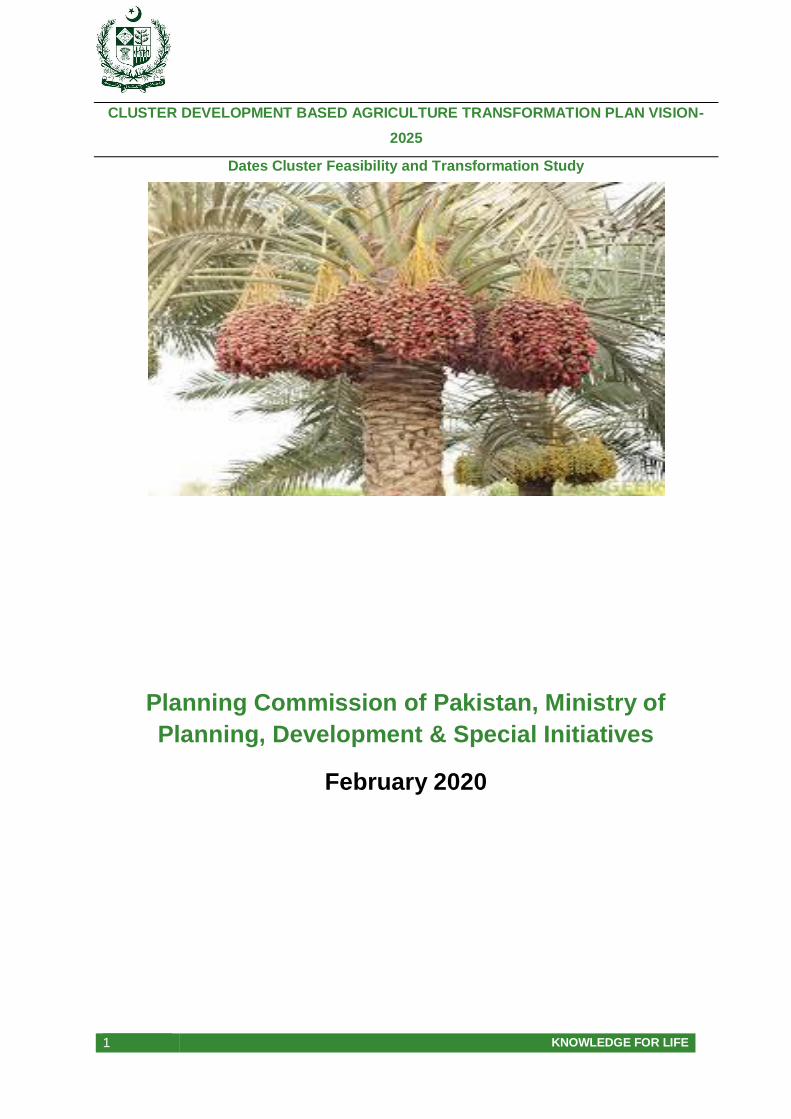
1 KNOWLEDGE FOR LIFE
CLUSTER DEVELOPMENT BASED AGRICULTURE TRANSFORMATION PLAN VISION-
2025
Dates Cluster Feasibility and Transformation Study
Planning Commission of Pakistan, Ministry of
Planning, Development & Special Initiatives
February 2020

2 KNOWLEDGE FOR LIFE
3 KNOWLEDGE FOR LIFE
FOREWORD In many developed and developing countries, the cluster-based development approach has become the basis for the transformation of various sectors of the economy including the agriculture sector. This approach not only improves efficiency of development efforts by enhancing stakeholders’ synergistic collaboration to resolve issues in the value chain in their local contexts, but also helps to gather resources from large number of small investors into the desirable size needed for the cluster development. I congratulate the Centre for Agriculture and Bioscience International (CABI) and its team to undertake this study on Feasibility Analysis for Cluster Development Based Agriculture Transformation. An important aspect of the study is
the estimation of resources and infrastructure required to implement various interventions along the value chain for the development of clusters of large number of agriculture commodities. The methodology used in the study can also be applied as a guide in evaluating various investment options put forward to the Planning Commission of Pakistan for various sectors, especially where regional variation is important in the project design.
4 KNOWLEDGE FOR LIFE
FOREWORD To improve enhance Pakistan’s competitiveness in the agriculture sector in national and international markets, the need to evaluate the value chain of agricultural commodities in the regional contexts in which these are produced, marketed, processed and traded was long felt. The Planning Commission of Pakistan was pleased to sponsor this study on the Feasibility Analysis for Cluster Development Based Agriculture Transformation to fill this gap. The
study aims to cover a large number of agriculture commodities spread in various clusters throughout the country.
I truly hope that the policies, strategies, and interventions suggested in this report will facilitate the federal and provincial governments to chalk out and implement plans for cluster-based transformation of the agriculture sector.
5 KNOWLEDGE FOR LIFE
FOREWORD This is part of the series of studies on 33 agriculture commodities undertaken for the purpose of preparing a cluster-based transformation plan based on the regional realities in the entire value chain including production, processing, value addition, and marketing. I congratulate the whole team of the project especially the Team Lead, Dr. Mubarik Ali to undertake and successfully complete this monumental study. We are thankful to all commodity specialists who have contributed to this assignment. The CABI Project officers Mr. Yasar Saleem Khan and Ms. Aqsa Yasin deserve appreciation. I truly believe that this study will serve as a basis to make and implement plans for cluster-based agriculture transformation. I hope you will enjoy reading the study and it can help you making your investment decisions along the value chain of various agriculture commodities. Dr. Babar Ehsan Bajwa
Regional Director CAB International
6 KNOWLEDGE FOR LIFE
FOREWORD This report is part of the series of studies on 33 agriculture commodities to prepare the agriculture transformation plan by incorporating regional realities at the cluster level. In the report, the clusters of various commodities are identified and characterized, and viable investment options along the value chain of each cluster are proposed. For this purpose, the study team has analyzed macro data, reviewed the literature, and made extensive consultation with stakeholders along the value chain. Foreign and local internationally reputed consultants, Dr. Derek Byerlee and Dr. Kijiro. Otsuka and national consultant Mr. Sohail Moghal were also engaged to understand the cluster-based development approach and conduct cluster-based feasibility analysis. An EXCEL-based Model was developed which was validated by our national consultants. Separate viabilities for individual technologies and products suggested in each commodity are also estimated. This humongous task would not have been possible to complete without the excellent cooperation and facilities provide by CABI, the hard work of commodity specialists and our research team especially Mr. Yasar Saleem Khan and Ms Aqsa Yasin. The true reward of our hard work is the implementation of the proposed policies, strategies and interventions to develop agriculture commodity clusters in the country.
Dr. Mubarik Ali Team Leader Cluster Development Based Agriculture Transformation Plan-Vision 2020 Project Planning Commission of Pakistan and
CAB International
7 KNOWLEDGE FOR LIFE
ACKNOWLEDGEMENT
It is not possible to mention the names of all those who collaborated with us in completing this
report, but my foremost gratitude goes to numerous stakeholders along the value chain who
generously shared the information about barley production, marketing, trade and value chain.
Without their support, this report would not have reached to the level of present quality.
My sincere thanks go to Planning Commission of Pakistan for this initiative and especially
financial assistance to complete the project activities. Here I am especially thankful to Dr.
Muhammad Azeem Khan (Ex-Member, Food Security and Climate Change, Planning
Commission of Pakistan), Dr. Aamir Arshad (Chief Agriculture, Planning Commission of
Pakistan), Mr. Muhammad Akram Khan (Project Director; CDBAT project) and other CDBAT
project team member Mr. Muhammad Arif (Research Associate) and Dr. Habib Gul (Research
Associate) for successful coordination and support for the project.
I am also grateful to Centre for Agriculture and Bioscience International (CABI) and its
Regional Director for Central and West Asia, Dr. Babar Ehsan Bajwa and CABI team especially
Mr. Yasar Saleem Khan for selecting me as commodity specialist for this task and offering
outstanding cooperation, support and advice during all the stages of this project. However, the
research team takes the responsibility of any shortcoming left in the report.
Dr. Muhammad Javed Tareen
Senior Author
Citation:
Tareen Javed Muhammad, Ali Mubarik, Farooq Umar and Yasin Aqsa, (2020) Dates Cluster Feasibility and Transformation Study. In Ali Mubarik, (ed.) (2020) Cluster Development Based Agriculture Transformation Plan Vision-2025. Project No. 131(434)PC/AGR/CDBAT-120/2018.
Unpublished Report, Planning Commission of Pakistan, Islamabad, Pakistan and Centre for Agriculture and Biosciences International (CABI), Rawalpindi, Pakistan.

8 KNOWLEDGE FOR LIFE
DISCLAIMER
This report is prepared by using the data from various published and unpublished sources and that obtained during the consultations with stakeholders. The research team took utmost care to arrive at the figures to be used, but is not responsible for any variation of the data in this report than those reported in other sources. Moreover, the views expressed in this report are purely of the authors and do not reflect the official views of the Planning Commission of Pakistan, Ministry of Planning Development and Special Initiatives or the Centre for Agriculture and Bioscience International (CABI).
9 KNOWLEDGE FOR LIFE
TABLE OF CONTENTS FOREWORD.............................................................................................................................. 6
ACKNOWLEDGEMENT ............................................................................................................. 7
LIST OF TABLES ..................................................................................................................... 13
LIST OF FIGURES .................................................................................................................. 15
LIST OF ACRONYMS .............................................................................................................. 16
EXECTIVE SUMMARY ............................................................................................................ 17
1. INTRODUCTION ............................................................................................................ 20
1.1. Dates as a Fruit ............................................................................................... 20
1.2. Dates Production in Pakistan ........................................................................... 21
1.3. Dates Trade of Pakistan .................................................................................. 24
1.4. Dates in Global Perspectives ........................................................................... 25
1.5. Global Production and Trade ........................................................................... 26
1.6. Dates Consumption ......................................................................................... 28
1.7. Need for the Study........................................................................................... 29
2. OBJECTIVES ................................................................................................................. 30
3. METHODOLOGY............................................................................................................ 31
4. REVIEW OF LITERATURE ............................................................................................. 32
5. CLUSTER IDENTIFICATION AND ITS CHARACTERISTICS ......................................... 33
5.1. Identification of Dates Clusters ........................................................................ 33
5.2. Comparison of the Dates Clusters ................................................................... 34
5.2.1. Sindh Dates Clusters ......................................................................................... 43
5.2.2. Balochistan Dates Clusters ................................................................................ 44
5.2.3. Punjab and KP Dates Clusters ................................................................... 46
5.3. Dates Marketing and Value Chains ................................................................. 47
5.3.1. Producers ................................................................................................... 47
5.3.2. Pre-harvest contractors .............................................................................. 47
5.3.3. Commission agents .................................................................................... 47
5.3.4. Wholesalers................................................................................................ 48
5.3.5. Retailers ..................................................................................................... 48
5.3.6. Auction of Dates ......................................................................................... 48
5.3.7. Dates contracting system ........................................................................... 49
5.4. SWOT Analysis ............................................................................................... 49
5.4.1. Overview .................................................................................................... 49
10 KNOWLEDGE FOR LIFE
5.4.2. SWOT Analysis of Sindh Cluster ................................................................ 50
5.4.3. SWOT Analysis of Balochistan Cluster ....................................................... 54
5.4.4. SWOT Analysis of Punjab-KP Dates Cluster .............................................. 58
6. CHALLENGES FACED BY THE CLUSTERS ................................................................. 63
6.1. Climate Change and Water Shortage .............................................................. 63
6.2. Weak Research and Extension........................................................................ 63
6.3. Constraints at the Production Level ................................................................. 64
6.4. Constraints at the Processing and value Addition Levels ................................. 65
6.5. Marketing and Trading Constraints .................................................................. 66
7. CLUSTER DEVELOPMENT POTENTIAL ....................................................................... 68
7.1. Overview ......................................................................................................... 68
7.2. Potential of Expanding Production ................................................................... 68
7.2.1. Improved Varieties and Management Practices .......................................... 68
7.2.2. Renovation of Gardens ............................................................................... 71
7.3. Reduction in Post-Harvest Losses ................................................................... 71
7.4. Demand Potential ............................................................................................ 72
7.5. Enhanced Processing and Value Addition ....................................................... 72
7.6. Harnessing the Export Potential ...................................................................... 73
8. CLUSTER DEVELOPMENT STRATEGIES .................................................................... 74
8.1. Plan ................................................................................................................. 74
8.2. Policies ............................................................................................................ 74
8.3. Strengthening of Date palm Research ............................................................. 75
8.4. Organizing farmers’ Entrepreneur Groups ....................................................... 75
8.5. Renovation of the Present Orchards ................................................................ 76
8.6. Capacity Building of Stakeholders ................................................................... 76
8.7. Controlling Post-Harvest Losses...................................................................... 77
8.8. Solar Drying of Chohara and Fresh Dates ....................................................... 78
8.9. Linking Traders with High-End Markets ........................................................... 79
9. FEASIBILITY ANALYSIS OF CLUSTER DEVELOPMENT ............................................. 80
9.1. Punjab-KP Cluster ........................................................................................... 80
9.1.1. Baseline Status or Prevailing Situation ....................................................... 80
9.1.2. Interventions and their Benefits .................................................................. 81
9.1.2.1. Intervention-1: Orchards Renovation with High Density Plantation ............. 81
9.1.2.2. Intervention-2: Raising Productivity by Better Management Practices ........ 81
9.1.2.3. Intervention-3: Reducing Post-Harvest Losses ........................................... 82
11 KNOWLEDGE FOR LIFE
9.1.2.4. Intervention-4: Improving quality of dates for domestic and international
market ........................................................................................................ 83
9.1.2.5. Intervention-5: Introducing the Solar Tunnel Dates Drying .......................... 83
9.1.2.6. Intervention-6: Improving Value Addition by Introducing Packhouses for
Export Market ............................................................................................. 84
9.1.3. Summary of the Benefits from Interventions ............................................... 85
9.1.4. Costs Associated with Interventions ........................................................... 85
9.1.4.1. Intervention-1: Orchards Renovation with High Density Plantation ............. 85
9.1.4.2. Intervention-2: Raising Productivity by Better Management Practices ........ 86
9.1.4.3. Intervention-3: Reducing Post-Harvest Losses ........................................... 87
9.1.4.4. Intervention-4: Introducing Tunnel Solar Dates Drying ................................ 87
9.1.4.5. Intervention-5: Improving Value Addition by Introducing Dates Pack Houses88
9.1.5. Summary of the Costs of Interventions ....................................................... 88
9.1.6. Net Economic Benefits of Interventions ...................................................... 89
9.1.7. Investment Needs for Cluster Development................................................ 89
9.1.8. Economic Viability of Development Plan ..................................................... 90
9.2. Sindh Dates Cluster (Khairpur Focal Point) ..................................................... 90
9.2.1. Baseline Status or Prevailing Situation ....................................................... 90
9.2.2. Benefits Side of Proposed Interventions ..................................................... 91
9.2.2.1. Intervention-1: Orchards Renovation with High Density Plantation ............. 91
9.2.2.2. Intervention-2: Raising Productivity by Better Management Practices ........ 92
9.2.2.3. Intervention-3: Reducing Post-Harvest Losses ........................................... 93
9.2.2.4. Intervention-4: Improving quality of dates for domestic marketing and
international trade ....................................................................................... 93
9.2.2.5. Intervention-5: Introducing Solar Tunnel Dates Drying ................................ 94
9.2.2.6. Intervention-6: Improving Value Addition of Dates by Introducing Pack
Houses for Export Market ........................................................................... 95
9.2.3. Summary of the Benefits from Interventions ............................................... 96
9.2.4. Costs Associated with Proposed Interventions ........................................... 96
9.2.4.1. Intervention-1: Orchards Renovation with High Density Plantation ............. 96
9.2.4.2. Intervention-2: Raising Productivity by Better Management Practices ........ 97
9.2.4.3. Intervention-3: Reducing Post-Harvest Losses ........................................... 98
9.2.4.4. Intervention-4: Introducing Solar Tunnel Dates Drying ................................ 99
9.2.4.5. Intervention-5: Improved Value Addition of Dates by Introducing Dates Pack
Houses ....................................................................................................... 99
9.2.5. Summary of the Costs of Interventions ..................................................... 100
9.2.6. Net Economic Benefits ............................................................................. 100
12 KNOWLEDGE FOR LIFE
9.2.7. Investments Need for Cluster Development.............................................. 100
9.2.8. Economic Viability of Development Plan ................................................... 101
9.3. Balochistan Dates Cluster (Turbat and Panjgur as Focal Point)..................... 102
9.3.1.1. Baseline Status or Prevailing Situation ..................................................... 102
9.3.2. Benefits Side of Proposed Interventions ................................................... 102
9.3.1.1. Intervention-1: Orchards Renovation with High Density Plantation ........... 102
9.3.1.2. Intervention-2: Raising Productivity by Better Management Practices ...... 103
9.3.1.3. Intervention-3: Reducing Post-Harvest Losses ......................................... 104
9.3.1.4. Intervention-4: Improving quality of dates for domestic marketing and
international trade ..................................................................................... 104
9.3.1.5. Intervention-5: Introducing Solar Tunnel Dates Drying .............................. 105
9.3.1.6. Intervention-6: Improving Value Addition of Fresh Dates by Introducing
Packhouses for Export Market .................................................................. 106
9.3.3. Summary of the Benefits from Interventions ............................................. 107
9.3.4. Costs Associated with Proposed Interventions ......................................... 107
9.3.4.1. Intervention-1: Orchards Renovation with High Density Plantation ........... 107
9.3.4.2. Intervention-2: Raising Productivity by Better Management Practices ...... 108
9.3.4.3. Intervention-3: Controlling Post-Harvest Losses ....................................... 109
9.3.4.4. Intervention-4: Introducing Solar Tunnel Dates Drying .............................. 109
9.3.4.5. Intervention-5: Improved Value Addition of Dates by Introducing Dates Pack
Houses ..................................................................................................... 110
9.3.5. Summary of the Costs of Interventions ..................................................... 110
9.3.6. Net Economic Benefits after Offsetting Direct Value Chain Costs of
Development Interventions ....................................................................... 111
9.3.7. Investments Need to be Made for Cluster Development ........................... 111
9.3.8. Economic Viability of Dates Cluster Development Plan ............................ 112
10. CONCLUSION .............................................................................................................. 113
11. ANNEXURES ............................................................................................................... 116
Annexure 1: List of Stakeholders consulted ........................................................................... 116
Annexure 2. List of References .............................................................................................. 118
Annexure-3: Farm size composition of different focal districts in dates clusters if Punjab, Sindh
and Balochistan ..................................................................................................................... 121
Annexure-4: Itemized distribution of high priced date orchard plantation ................................ 122
Annexure-5: Feasibility Study for Dates pack house .............................................................. 123
Annexure-6: Dates drying units (Chohara making) ................................................................. 136
Annexure-7: Temperature and Rainfall Patterns Across Clusters................................................139
13 KNOWLEDGE FOR LIFE
LIST OF TABLES
Table 1: Top Ten Produced Fruits in Pakistan, 2017-18 ........................................................... 22
Table 2: Area and Production of Dates Across Provinces in Pakistan, 2017-18 ....................... 22
Table 3: Provincial Trend in Dates Production During 2001-15 ................................................ 23
Table 4: Trade and Trade Balance of Dates in Pakistan during 2001-17 .................................. 24
Table 5: Comparison of World vs. Pakistan’s in Dates Production Sector, 2017 ...................... 25
Table 6: Trend in the Global Dates Production and Export During 2001-16 ............................. 26
Table 7: Top Ten Dates Producing Countries of the World, 2017 ............................................. 27
Table 8: Top Dates Exporting Countries of the World, 2017 ..................................................... 27
Table 9: Top Ten Dates Importing Countries of the World, 2017 .............................................. 28
Table 10: Change in Per Capita Consumption of Dates During 2001-13 .................................. 28
Table 11: District wise Area, production of Yield of Dates in Pakistan, 2015-16 ....................... 34
Table 12: Characteristic and Comparison of Dates Clusters .................................................... 35
Table 13: SWOT Analysis of Dates Cluster in Sindh ................................................................ 50
Table 14: SWOT Analysis of Dates Cluster in Balochistan ....................................................... 54
Table 15: SWOT Analysis of Punjab-KP Cluster in Punjab and Khyber Pakhtunkhwa ............. 58
Table 16: Gaps and Constraints at Production Level................................................................ 65
Table 17: Gaps and Constraints at Trading Level .................................................................... 67
Table 18: Targets of dates cluster plan .................................................................................... 74
Table 19: Yearly Baseline Status at the Muzaffargarh Focal Point of Punjab-KP Cluster ......... 80
Table 20: Yearly Returns from Orchards Renovation with High Density Plantation of Modern
Varieties in Muzaffargarh District Dates Cluster in Punjab ....................................................... 81
Table 21: Yearly Returns from Better Orchard Management in Muzaffargarh District Dates
Cluster in Punjab ...................................................................................................................... 82
Table 22: Yearly Returns from Controlling Post-Harvest Losses in Muzaffargarh District Dates
Cluster of Punjab ..................................................................................................................... 82
Table 23: Trends in Supplies of Quality Dates from the Foal Point (Muzaffargarh District) of the
Punjab-KP Cluster ................................................................................................................... 83
Table 24: Yearly Returns from Solar Drying of Dates in the Focal Point of Punjab-KP Cluster . 84
Table 25: Yearly Returns from Value Addition of Dry Dates (by Passing Through Pack Houses)
in the Focal point of Punjab-KP Cluster .................................................................................... 84
Table 26: Yearly Expected Gross Returns from the Interventions in the Focal Point of Punjab-
KP Cluster ................................................................................................................................ 85
Table 27: Yearly Costs of Orchards Renovation with Modern Varieties Plantation in the Focal
Point of Punjab-KP Cluster....................................................................................................... 86
14 KNOWLEDGE FOR LIFE
Table 28: Yearly Costs of Better Orchard Management in the Focal Point of Punjab-KP
Cluster ..................................................................................................................................... 87
Table 29: Yearly Costs of Controlling Post-Harvest Losses in the Focal Point of Punjab-KP
Cluster ..................................................................................................................................... 87
Table 30: Yearly Costs of Value Addition by Solar Tunnel Dates in the Focal Point of Punjab-KP
Cluster ..................................................................................................................................... 88
Table 31: Yearly Costs of Value Addition by Introducing Pack Houses in in the Focal Point of
Punjab-KP Cluster ................................................................................................................... 88
Table 32: Gross Value of Expected Costs of Dates Cluster Development Interventions in the
Focal Point of Punjab-KP Cluster ............................................................................................. 88
Table 33: Net-Economic Benefits after Offsetting the Direct Value Chains Costs of Development
Interventions in the Focal Point of Punjab-KP Cluster .............................................................. 89
Table 34: Public Investment Needed for the Development of the Focal point of Punjab-KP
Cluster ..................................................................................................................................... 89
Table 35: Net-Present Value and Internal Rate of Returns on the Costs and Investments in
Muzaffargarh District Dates Cluster of Punjab .......................................................................... 90
Table 36: Yearly Baseline Status of Dates Cluster in the Focal Point of Sindh Cluster ............. 91
Table 37: Yearly Returns from Dates Orchards Renovation with High Density Plantation of
Modern Varieties in in the Focal Point of Sindh Cluster ............................................................ 92
Table 38: Yearly Returns from Better Orchard Management in the Focal Point of Sindh
Cluster ..................................................................................................................................... 92
Table 39: Yearly Returns from Controlling Post-Harvest Losses in the Focal Point of Sindh
Cluster ..................................................................................................................................... 93
Table 40: Trends in Supplies of Quality Dates from the Focal Point of Sindh Cluster ............... 94
Table 41: Yearly Returns from Solar Drying of Dates in the Focal Point of Sindh Cluster ......... 95
Table 42: Yearly Returns from Value Addition in Dry Dates by Passing through Pack Houses for
Export Market from the Focal Point of Sindh Cluster ................................................................ 95
Table 43: Yearly Expected Gross Returns (M. US$) from the Focal Point of Sindh Cluster ...... 96
Table 44: Yearly Costs of Orchards Renovation with Modern Varieties Plantation in the Focal
Point of Sindh Cluster .............................................................................................................. 97
Table 45: Yearly Costs of Better Orchard Management in the Focal Point of Sindh Cluster ..... 98
Table 46: Yearly Costs of Controlling Post-Harvest Losses in the Focal Point of Sindh Cluster 98
Table 47: Yearly Costs of Solar Tunnel Drying in the Focal Point of Sindh Cluster .................. 99
Table 48: Yearly Costs of Value Addition by Introducing Pack Houses in the Focal Point of
Sindh Cluster ........................................................................................................................... 99
Table 49: Gross Value of Expected Costs (M. US$) of Dates Cluster Development Interventions
in the Focal Point of Sindh Cluster ......................................................................................... 100
Table 50: Net-Economic Benefits after Offsetting the Direct Value Chains Costs of Development
Interventions in the Focal Point of Sindh Cluster .................................................................... 100
15 KNOWLEDGE FOR LIFE
Table 51: Public Investment Needed for the Development of the Focal Point of Sindh
Cluster ................................................................................................................................... 101
Table 52: Net-Present Value and Internal Rate of Returns of Costs and Investments Incurred in
the Focal Point of Sindh Cluster ............................................................................................. 101
Table 53: Yearly Baseline Status of Dates Clusters in the Focal Point of Balochistan Cluster 102
Table 54: Yearly Returns from Orchards Renovation with High Density Plantation of Modern
Varieties in the Focal Point of Balochistan Cluster ................................................................. 103
Table 55: Yearly Returns from Better Orchard Management in the Focal Point of Balochistan
Cluster ................................................................................................................................... 103
Table 56: Yearly Returns from Controlling Post-Harvest Losses in the Focal Point of
Balochistan Cluster ................................................................................................................ 104
Table 57: Trends in Supplies of Quality Fresh Dates from the Focal Point of Balochistan
Cluster ................................................................................................................................... 105
Table 58: Yearly Returns from Solar Drying of Dates in the Focal Point of Balochistan
Cluster ................................................................................................................................... 105
Table 59: Yearly Returns from Value Addition in Dates by Passing through Pack Houses for
Export Market from the Focal Point of Balochistan Cluster ..................................................... 106
Table 60: Yearly Expected Gross Returns (M. US$) from Dates Cluster Development
Interventions in the Focal Point of Balochistan Cluster ........................................................... 107
Table 61: Yearly Costs of Orchards Renovation with Modern Varieties Plantation in the Focal
Point of Balochistan Cluster ................................................................................................... 107
Table 62: Yearly Costs of Better Orchard Management in the Focal Point of Balochistan
Cluster ................................................................................................................................... 108
Table 63: Yearly Costs of Controlling Post-Harvest Losses in the Focal Point of Balochistan
Cluster ................................................................................................................................... 109
Table 64: Yearly Costs of Value Addition by Solar Tunnel Drying of in the Focal Point of
Balochistan Cluster ................................................................................................................ 109
Table 65: Yearly Costs of Value Added Fresh Dates Production in the Focal Point of
Balochistan Cluster ................................................................................................................ 110
Table 66: Gross Value of Expected Costs (M. US$) of Dates Cluster Development Interventions
in the Focal Point of Balochistan Cluster ................................................................................ 110
Table 67: Net-Economic Benefits after Offsetting the Direct Value Chains Costs of Development
Interventions in the Focal Point of Balochistan Cluster ........................................................... 111
Table 68: Public Investment Needed for the Development of the Focal Point of Balochistan
Cluster ................................................................................................................................... 111
Table 69: Net-Present Value and Internal Rate of Returns of Costs and Investments Incurred in
the Focal Point of Balochistan Cluster .................................................................................... 112
LIST OF FIGURES Figure 1: Map of Pakistan showing dates production & marketing areas ................................. 33
16 KNOWLEDGE FOR LIFE
Figure 2: Domestic dates marketing System in Pakistan (Source: Khushk et al., 2009) ........... 49
Figure 3: Process flow of post-harvest handling of dates ....................................................... 124
Figure 4: Loading Dock .......................................................................................................... 126
Figure 6: Field Packing .......................................................................................................... 126
Figure 5: Large scale packing line .......................................................................................... 126
Figure 7: Small scale packing line .......................................................................................... 126
Figure 8: Automatic washer.................................................................................................... 127
Figure 9: Map of the dates packhouse ................................................................................... 129
LIST OF ACRONYMS CPEC China Pakistan Economic Corridor
DRDI Dates Research and Development Institute
FAO Food and Agriculture Organization of the United Nations
GAP Good Agricultural Practices
GB Gilgit Baltistan
Ha Hectare
IRR Internal Rate of Return
Kg Kilo gram
KP Khyber Pakhtunkhwa
M. Million(s)
MIS Market Information System
NGO Non-Governmental Organization
NPV Net Present Value
PFVA Pakistan Fruit & Vegetable Association
SWOT Strengths Weaknesses Opportunities Threats
UAE United Arab Emrat
USA United States of America
17 KNOWLEDGE FOR LIFE
EXECTIVE SUMMARY According to last latest available statistics, global production of dates was 8.2 million tonnes from
more than 1.3 million ha with an average yield of 6.1 tonnes per ha. Pakistan stands at 6th position
among the largest dates producing countries in the world. In Pakistan dates are grown at 98
thousand ha, with 541 thousand tonnes of production and an average yield of 5.5 tonnes per ha.
Globally, 1.25 million tonnes of dates worth of US$1.48 billion were exported during 2017.
Currently, the top dates producing countries are Egypt, Iran, Algeria and Saudi Arabia, while Iran,
UAE, Pakistan and Iraq are top dates exporting countries. On the other hand, India, UAE,
Morocco and France are leading dates importing countries both in quantity and the value terms.
In Pakistan the yield per ha declined at the rate 2.1% per annum vis-à-vis international average
yield improvement at 0.4% per annum. Pakistan’s yield is now 13% lower than the world average
yield. Trade in dates from Pakistan seems performed relatively well during the period because of
the expansion in the export of dates and shrinking its imports, which has improved the trade
balance of Pakistan both in terms of dates quantity and its value at quite a high rate of around
11%. The export of dates from Pakistan has reached to US$108 million in 2017. Such a high
growth in the export of dates is not sustainable because of its declining per ha yield in the country.
Moreover, Pakistani dates in international markets fetch only 60% of the world average export
price indicating issues in its value chain resulting in poor quality dates. Expansion in export along
with declining production has reduced the per capita consumption of dates in Pakistan by about
42%, although its high demand during the Ramadan time persists.
Based on the above background and the importance of dates production in marginal areas of
Pakistan where it is cultivated by relatively small poor farmers and its declining competitiveness
in international market, Planning Commission of Pakistan has initiated this study to analyse the
entire value chain of dates including production, marketing, value addition, processing, and trade,
identify the gaps and potential along the chain, and suggest economically viable policy,
technological and institutional interventions to enhance the competitiveness of Pakistani dates in
international market. This analysis is conducted on cluster basis to incorporate the regional
variation in production, marketing and processing opportunities in each cluster while suggesting
interventions along the value chain. To achieve the objectives of the study, large number of
stakeholders along the dates were consulted, data related to dates production, marketing, trade
etc. were analysed, and literature were reviewed. An EXL based model was also developed to
estimate the economic feasibility of various interventions in each cluster.
Although dates are grown in all the four provinces of Pakistan, but its cultivation as a commercial
crop is concentrated in few districts in each province which are largely marginal with low crop
productivity. Based on the available district-level production data, three dates producing clusters
i.e., Khairpur as Sindh Cluster, Turbat & Panjgur as Balochistan Cluster and Muzaffargarh as
Punjab Cluster are identified for detailed analysis.
In consultation with stakeholders, several challenges of dates industry of Pakistan from
production to harvesting and marketing are identified in this study. On production side, weak
research and extension capacities, absence of the mechanism to replace old with new high-
yielding varieties, lack of nurseries with certified mother-blocks, water scarcity especially in
Baluchistan cluster, traditional methods of spathes selection and pollination, non-covering of fruit
18 KNOWLEDGE FOR LIFE
bunches during rainy season (rather preferring to pick for making chohara or other low quality
products), and bunch-pruning are the main challenges. On marketing side, lack of value chain
segments including farm-level cold storage, improper packing and presentation are major
constraints, which eventually lead the product in the low-end markets of the world. Gloomy
prospects of traditional export to India are also a challenge. Dates drying under the open sky and
lack of processing infrastructure at village level and capacity to operate these infrastructures are
the main issues on processing side.
To overcome these constraints and keeping in view the cluster-specific environment,
interventions are proposed at the respective focal point of each cluster for making the dates a
competitive and export oriented commodity of Pakistan. These interventions include: a)
restoration of existing orchards with plants of higher yielding, modern and exotic varieties; b)
training farmers for adopting improved orchard management practices; c) controlling harvest and
post-harvest losses by adopting better pollination strategies and fruit bunch management; d)
shifting to solar tunnel dates drying; e) employment state-of-the-art packaging technologies and
linking of stakeholders with markets. With these measures, the general quality and presentation
of Pakistani dates in international high-end market shall improve.
In order to implement these interventions at the focal points, total project investments needed is
US$108.144 million. Out of the total investment, about 28% are proposed to be borne by the
federal and provincial governments and remaining 72% by the private sector. The federal
government will bear 30% of the total cost, while the provincial governments will bear remaining
70% through their respective annual development plans.
As a result, after the successful implementation of the 5-years long proposed project, it is
anticipated that during 10th year, more than 260 thousand additional dates will be produced from
all the production enhancing interventions. In total, nearly 266 thousand tonnes very high quality
dates (chohara and fresh dates) shall be available for processing through 214 pack houses. The
dates so shall be produced, be able to get better price in both the domestic and international
markets. This improvement in production will generate thousands of additional jobs in rural areas.
The proposed interventions as a package is economically viable in all the dates clusters, their
total Net Present Values (NPVs) are estimated at US$ 145.56 Million. The overall Internal Rate
of Return (IRR) for all the clusters is 34.27%. The cluster level economic analysis can be seen in
the Summary Sheet given below. In addition to economic benefits, the cluster upgradation
program shall also provide income and employment generating opportunities to local
communities.
To make this initiative successful, it is imperative to adopt the integrated cluster approach by
attempting to resolve the issues of whole value chain at local level. Strengthening the dates
related research facilities, building capacities of all stakeholders along the value chain, organize
Farmers’ Entrepreneur Group (FEGs) and arrange loans so that stakeholders can fund the
additional operational costs induced by the upgradation investments would be the key factors for
the success of the Up-gradation Plan.
19 KNOWLEDGE FOR LIFE
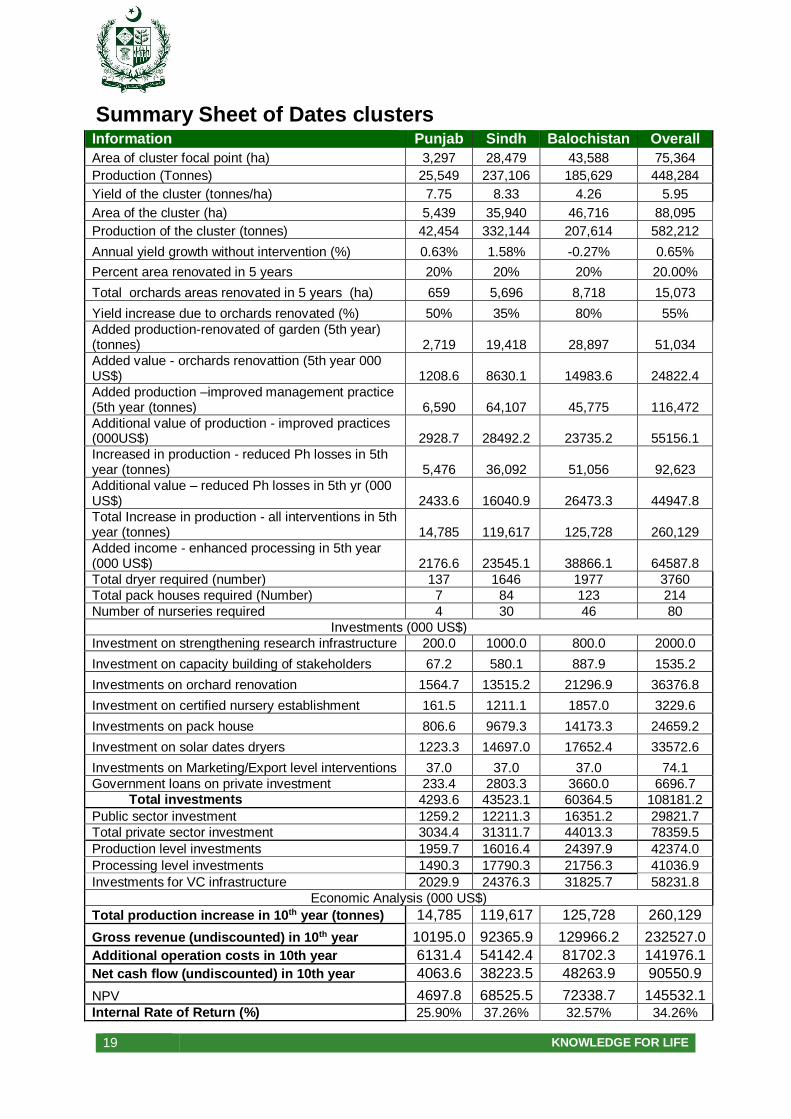
Summary Sheet of Dates clusters
Information Punjab Sindh Balochistan Overall
Area of cluster focal point (ha) 3,297 28,479 43,588 75,364
Production (Tonnes) 25,549 237,106 185,629 448,284
Yield of the cluster (tonnes/ha) 7.75 8.33 4.26 5.95
Area of the cluster (ha) 5,439 35,940 46,716 88,095
Production of the cluster (tonnes) 42,454 332,144 207,614 582,212
Annual yield growth without intervention (%) 0.63% 1.58% -0.27% 0.65%
Percent area renovated in 5 years 20% 20% 20% 20.00%
Total orchards areas renovated in 5 years (ha) 659 5,696 8,718 15,073
Yield increase due to orchards renovated (%) 50% 35% 80% 55%
Added production-renovated of garden (5th year) (tonnes) 2,719 19,418 28,897 51,034
Added value - orchards renovattion (5th year 000 US$) 1208.6 8630.1 14983.6 24822.4
Added production –improved management practice (5th year (tonnes) 6,590 64,107 45,775 116,472
Additional value of production - improved practices (000US$) 2928.7 28492.2 23735.2 55156.1
Increased in production - reduced Ph losses in 5th year (tonnes) 5,476 36,092 51,056 92,623
Additional value – reduced Ph losses in 5th yr (000 US$) 2433.6 16040.9 26473.3 44947.8
Total Increase in production - all interventions in 5th year (tonnes) 14,785 119,617 125,728 260,129
Added income - enhanced processing in 5th year (000 US$) 2176.6 23545.1 38866.1 64587.8
Total dryer required (number) 137 1646 1977 3760
Total pack houses required (Number) 7 84 123 214
Number of nurseries required 4 30 46 80
Investments (000 US$)
Investment on strengthening research infrastructure 200.0 1000.0 800.0 2000.0
Investment on capacity building of stakeholders 67.2 580.1 887.9 1535.2
Investments on orchard renovation 1564.7 13515.2 21296.9 36376.8
Investment on certified nursery establishment 161.5 1211.1 1857.0 3229.6
Investments on pack house 806.6 9679.3 14173.3 24659.2
Investment on solar dates dryers 1223.3 14697.0 17652.4 33572.6
Investments on Marketing/Export level interventions 37.0 37.0 37.0 74.1
Government loans on private investment 233.4 2803.3 3660.0 6696.7 Total investments 4293.6 43523.1 60364.5 108181.2
Public sector investment 1259.2 12211.3 16351.2 29821.7
Total private sector investment 3034.4 31311.7 44013.3 78359.5
Production level investments 1959.7 16016.4 24397.9 42374.0
Processing level investments 1490.3 17790.3 21756.3 41036.9
Investments for VC infrastructure 2029.9 24376.3 31825.7 58231.8
Economic Analysis (000 US$)
Total production increase in 10th year (tonnes) 14,785 119,617 125,728 260,129
Gross revenue (undiscounted) in 10th year 10195.0 92365.9 129966.2 232527.0
Additional operation costs in 10th year 6131.4 54142.4 81702.3 141976.1
Net cash flow (undiscounted) in 10th year 4063.6 38223.5 48263.9 90550.9
NPV 4697.8 68525.5 72338.7 145532.1
Internal Rate of Return (%) 25.90% 37.26% 32.57% 34.26%
20 KNOWLEDGE FOR LIFE
1. INTRODUCTION
1.1. Dates as a Fruit
Date palm or Dates (Phoenix dactylifera L.) --- is an oval shaped, reddish-yellow, highly
delicious, sweet fruit grown on date palm tree - is a popular drupe fruit belonging to Arecaceae
family. It is one of the oldest known fruit crop in the arid regions of the Arabian Peninsula,
North Africa and the Middle East (Zohary and Hopf, 2000). Though the exact origin of dates
cultivation is not known, the earliest record from Iraq (Mesopotamia) shows that dates culture
was probably established as early as 3000 BCE (Wrigley, 1995) that spread throughout the
Arabian Peninsula, North Africa and the Middle East. Dates culture has apparently spread into
Egypt by the middle of the second millennium BCE. The spread of dates cultivation later
accompanies of the spread of Islam and reach southern Spain and Pakistan. The Spanish
were the first to introduce date palm outside the Arabian Peninsula, Norther Africa, the Middle
East, South Asia and carrying them to America (Nixon, 1951). During the past three centuries,
dates were also introduced to new production areas in Australia, India, Pakistan, Mexico,
South Africa, South America, and the United States. Dates are the main source of income and
staple food for local population in many countries in which they are cultivated and have played
significant role in the economy, society and environment of those countries (Chao and
Krueger, 2007).
Dates are considered to be one of the most important food for the human being, particularly
those living in least developed regions and facing harsh climates like deserts. Nutritionally1, it
abundantly contains vitamins A, B, C, E & K and minerals like iron, calcium, magnesium,
sodium and zinc. Dates are not only consumed fresh but also used for making different
products like dry dates or chohara, pickles, juices, jam, cider etc. Due to its potential of
replenishing energy and instantly revitalizing the body, in Muslim societies and Islamic
countries, fresh dates are most consumed in the month of Ramadan for breaking the fast in
the evening. In Pakistan, dry dates as chohara are commonly sold on shops at the shrines as
a gift from the shrine, offered to the guests invited in wedding parties, while in Hindu
communities, it is used in the religious rituals at the shrines, particularly at Diwali. Multiple
types of dates are grown and consumed in the world. Some of the important ones are:
Anbarah, Afandi, Berhi, Ajwah, Helya, Gharr, Baidh, Helwah, Barny, Jebaily, Menaify,
Mushkouth, Zaewy, Wananah, Maktoomi (https://ecob.com.br/ top-10-date-producing-
countries-in-the-world/).
Date palm tree has numerous uses and many useful products are produced from it (Chao and
Krueger, 2007). For instance, its leaves are used for making roofs, mats, staple dishes, hand
1 The fruit is rich in dietary fiber, which prevents LDL cholesterol absorption in the gut. Additionally, the fiber
diet works as a bulk laxative. It, thus, helps protect the colon mucous membrane from cancer-causing chemicals binding to it in the colon. They contain health benefiting flavonoid polyphenolic antioxidants known as tannins.
Tannins are known to possess anti-infective, anti-inflammatory, and anti-hemorrhagic (prevent easy bleeding
tendencies) properties. They compose antioxidant flavonoids such as ß-carotene, lutein, and zeaxanthin. These
antioxidants found to have the ability to protect cells and other structures in the body from harmful effects of
oxygen-free radicals. Thus, eating dates found to offer some protection from colon, prostate, breast, endometrial,
lung, and pancreatic cancers. date fruits are also rich in minerals like calcium, manganese, copper, and
magnesium.
21 KNOWLEDGE FOR LIFE
fans, baskets, packaging material, ropes and fences (PHEDB, 2008). Its trunk can be used in
constructing houses and bridges and as packing material for local transportation of vegetables
and fruits (Anwar, 2006). Its terminal buds and young leaves can be cooked as vegetables,
while rachises are used for paper making (El Hadrami and Al Khayri, 2012; Khairi et al., 2011).
Moreover, dates cultivation in orchards offer good employment opportunities for the local labor
force during flowering, harvest and its marketing & processing (Jain, 2012).
Dates can grow well in very hot and dry climates, and are relatively tolerant of salty and
alkaline soils. Date palms require a long, intensely hot summer with little rain and very low
humidity during the period from pollination to harvest, but with abundant underground water
near the surface or irrigation. One old saying describes the date palm as growing with “its feet
in the water and its head in the fire”. Such conditions are found in the oases and wadis of the
date palm’s center of origin in the Middle East. Date palms can grow from 12.7°C to 27.5°C
average temperature, withstanding up to 50oC and sustaining short periods of frost at
temperatures as low as –5oC. The ideal temperature for the growth of the date palm, during
the period from pollination to fruit ripening, range from 21oC to 27oC average temperature.
date palm likes warm climate for a relatively longer period, however, rains during flowering
and fruit ripening stages are harmful for this fruit. dates are widely grown in the arid regions
between 15oN and 35oN, from Morocco in the west to India in the east or location is at 100 -
200 meters above sea level (Zaid and de Wet, 2002a)
Date palm is dioecious in nature with separate male and female trees, where pollination mostly
takes place by wind and insects. However, for good fruit production, 60–80 % of female
flowers need to be manually pollinated (Nixon and Carpenter, 1978; Zaid and de Wet, 2002b).
Pollen also has a metaxenia effect for getting good shape, fruit size, fruit development and its
ripening time (Nixon 1934, 1936). Many dates varieties produce fruits even without pollination,
but slender in size with imperfect seed (without embryo & endosperm) and ripen very late
(Swingle, 1928).
Ecologically, the areas well suited to dates cultivation include those where: i) location is at 100
- 200 meters above sea level; ii) prevailing temperature ranges from 3oC to 45oC; iii) rainfall
ranges from 200 mm to 250 mm; and, iv) the soils are sandy loam and clay loam. It can also
be grown in the soils having high salts. Date palm likes warm climate for a relatively longer
period, however, rains during flowering and fruit ripening stages are harmful for this fruit.
1.2. Dates Production in Pakistan
In Pakistan, in terms of area, dates is 6th most produced fruit in the country, although its rank
goes to 6th in term of production (Table 1). Date palm is cultivated in a wide range of cropping
and farming systems such as oases in the deserts, groves, home gardens, as a mono-crop
and an intercrop (Abouziena et al., 21010; Bhansali, 2010). In Pakistan, date palm is cultivated
in arid and semi-arid regions which are characterized by long and hot summers with no or at
most low rainfall, and very low relative humidity level during the ripening period. Exceptional
high temperatures (± 56 °C) are well endured by a date palm for several days under irrigation.
More than 300 date varieties are known to exist in the country of which the twelve most
commercially important cultivars are: Karbalaen, Aseel, Muzawati, Fasli, Begum Jhangi,
Halawi, Dashtiari, Sabzo, Koharba, Jaan Swore, Rabai, and Dhakki (Ata, 2011). These
cultivars possess unique aroma, colors, sizes, shapes and tastes. This diversity in dates of
22 KNOWLEDGE FOR LIFE
Pakistan is yet to be exploited through research and exploring of neighboring international
markets for export purpose.
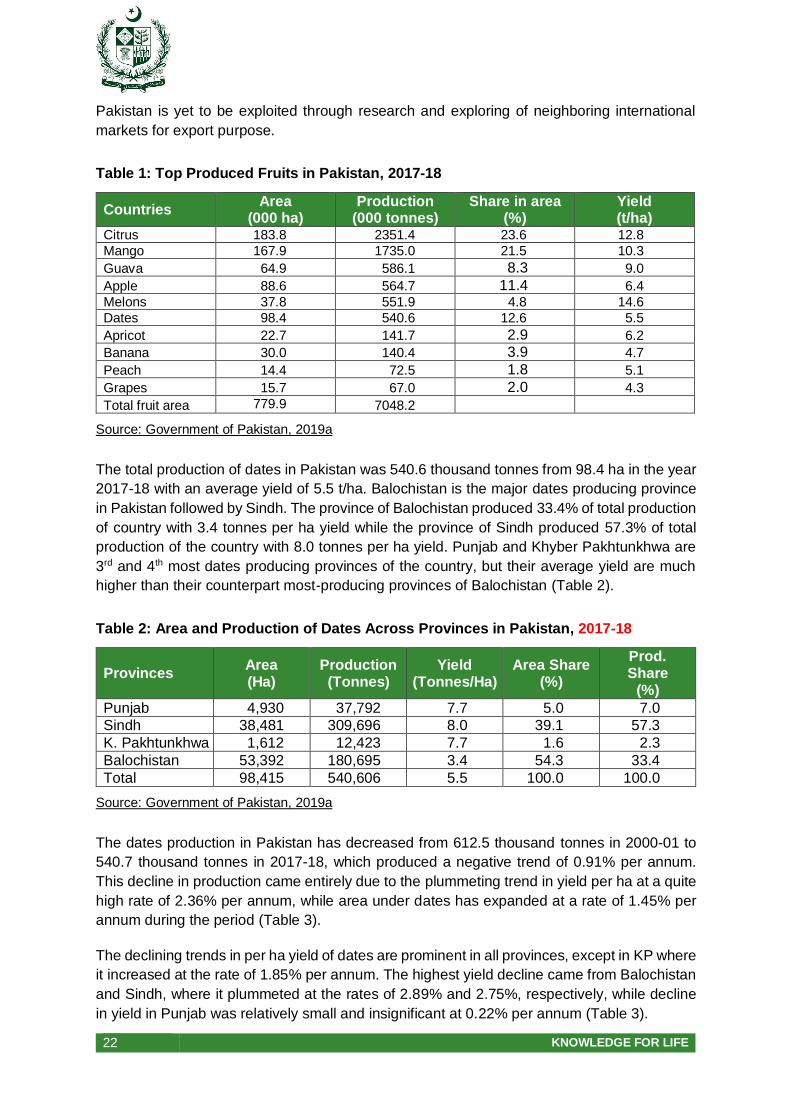
Table 1: Top Produced Fruits in Pakistan, 2017-18
Countries Area
(000 ha) Production
(000 tonnes) Share in area
(%) Yield (t/ha)
Citrus 183.8 2351.4 23.6 12.8
Mango 167.9 1735.0 21.5 10.3
Guava 64.9 586.1 8.3 9.0
Apple 88.6 564.7 11.4 6.4
Melons 37.8 551.9 4.8 14.6
Dates 98.4 540.6 12.6 5.5
Apricot 22.7 141.7 2.9 6.2
Banana 30.0 140.4 3.9 4.7
Peach 14.4 72.5 1.8 5.1
Grapes 15.7 67.0 2.0 4.3
Total fruit area 779.9 7048.2
Source: Government of Pakistan, 2019a
The total production of dates in Pakistan was 540.6 thousand tonnes from 98.4 ha in the year
2017-18 with an average yield of 5.5 t/ha. Balochistan is the major dates producing province
in Pakistan followed by Sindh. The province of Balochistan produced 33.4% of total production
of country with 3.4 tonnes per ha yield while the province of Sindh produced 57.3% of total
production of the country with 8.0 tonnes per ha yield. Punjab and Khyber Pakhtunkhwa are
3rd and 4th most dates producing provinces of the country, but their average yield are much
higher than their counterpart most-producing provinces of Balochistan (Table 2).
Table 2: Area and Production of Dates Across Provinces in Pakistan, 2017-18
Provinces Area (Ha)
Production (Tonnes)
Yield (Tonnes/Ha)
Area Share (%)
Prod. Share
(%)
Punjab 4,930 37,792 7.7 5.0 7.0
Sindh 38,481 309,696 8.0 39.1 57.3
K. Pakhtunkhwa 1,612 12,423 7.7 1.6 2.3
Balochistan 53,392 180,695 3.4 54.3 33.4
Total 98,415 540,606 5.5 100.0 100.0
Source: Government of Pakistan, 2019a
The dates production in Pakistan has decreased from 612.5 thousand tonnes in 2000-01 to
540.7 thousand tonnes in 2017-18, which produced a negative trend of 0.91% per annum.
This decline in production came entirely due to the plummeting trend in yield per ha at a quite
high rate of 2.36% per annum, while area under dates has expanded at a rate of 1.45% per
annum during the period (Table 3).
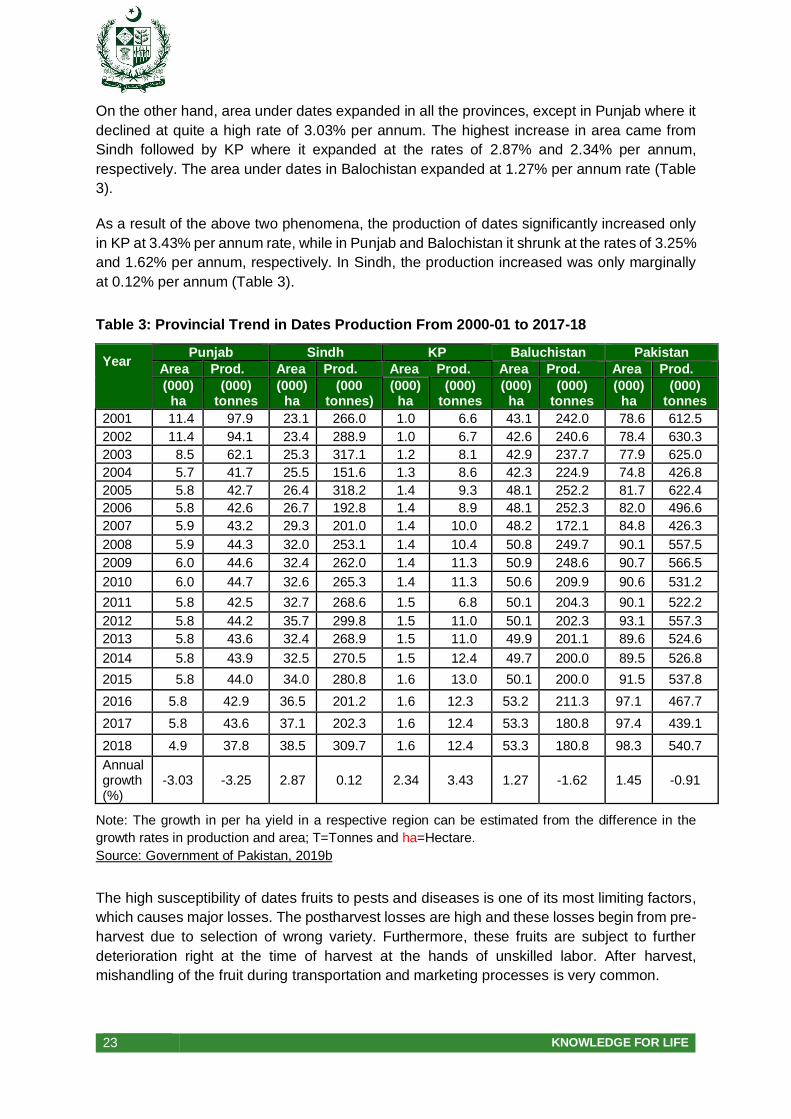
The declining trends in per ha yield of dates are prominent in all provinces, except in KP where
it increased at the rate of 1.85% per annum. The highest yield decline came from Balochistan
and Sindh, where it plummeted at the rates of 2.89% and 2.75%, respectively, while decline
in yield in Punjab was relatively small and insignificant at 0.22% per annum (Table 3).
23 KNOWLEDGE FOR LIFE
On the other hand, area under dates expanded in all the provinces, except in Punjab where it
declined at quite a high rate of 3.03% per annum. The highest increase in area came from
Sindh followed by KP where it expanded at the rates of 2.87% and 2.34% per annum,
respectively. The area under dates in Balochistan expanded at 1.27% per annum rate (Table
3).
As a result of the above two phenomena, the production of dates significantly increased only
in KP at 3.43% per annum rate, while in Punjab and Balochistan it shrunk at the rates of 3.25%
and 1.62% per annum, respectively. In Sindh, the production increased was only marginally
at 0.12% per annum (Table 3).
Table 3: Provincial Trend in Dates Production From 2000-01 to 2017-18
Year
Punjab Sindh KP Baluchistan Pakistan
Area Prod. Area Prod. Area Prod. Area Prod. Area Prod.
(000) ha
(000) tonnes
(000) ha
(000 tonnes)
(000) ha
(000) tonnes
(000) ha
(000) tonnes
(000) ha
(000) tonnes
2001 11.4 97.9 23.1 266.0 1.0 6.6 43.1 242.0 78.6 612.5
2002 11.4 94.1 23.4 288.9 1.0 6.7 42.6 240.6 78.4 630.3
2003 8.5 62.1 25.3 317.1 1.2 8.1 42.9 237.7 77.9 625.0
2004 5.7 41.7 25.5 151.6 1.3 8.6 42.3 224.9 74.8 426.8
2005 5.8 42.7 26.4 318.2 1.4 9.3 48.1 252.2 81.7 622.4
2006 5.8 42.6 26.7 192.8 1.4 8.9 48.1 252.3 82.0 496.6
2007 5.9 43.2 29.3 201.0 1.4 10.0 48.2 172.1 84.8 426.3
2008 5.9 44.3 32.0 253.1 1.4 10.4 50.8 249.7 90.1 557.5
2009 6.0 44.6 32.4 262.0 1.4 11.3 50.9 248.6 90.7 566.5
2010 6.0 44.7 32.6 265.3 1.4 11.3 50.6 209.9 90.6 531.2
2011 5.8 42.5 32.7 268.6 1.5 6.8 50.1 204.3 90.1 522.2
2012 5.8 44.2 35.7 299.8 1.5 11.0 50.1 202.3 93.1 557.3
2013 5.8 43.6 32.4 268.9 1.5 11.0 49.9 201.1 89.6 524.6
2014 5.8 43.9 32.5 270.5 1.5 12.4 49.7 200.0 89.5 526.8
2015 5.8 44.0 34.0 280.8 1.6 13.0 50.1 200.0 91.5 537.8
2016 5.8 42.9 36.5 201.2 1.6 12.3 53.2 211.3 97.1 467.7
2017 5.8 43.6 37.1 202.3 1.6 12.4 53.3 180.8 97.4 439.1
2018 4.9 37.8 38.5 309.7 1.6 12.4 53.3 180.8 98.3 540.7
Annual growth (%)
-3.03 -3.25 2.87 0.12 2.34 3.43 1.27 -1.62 1.45 -0.91
Note: The growth in per ha yield in a respective region can be estimated from the difference in the
growth rates in production and area; T=Tonnes and ha=Hectare.
Source: Government of Pakistan, 2019b
The high susceptibility of dates fruits to pests and diseases is one of its most limiting factors,
which causes major losses. The postharvest losses are high and these losses begin from pre-
harvest due to selection of wrong variety. Furthermore, these fruits are subject to further
deterioration right at the time of harvest at the hands of unskilled labor. After harvest,
mishandling of the fruit during transportation and marketing processes is very common.
24 KNOWLEDGE FOR LIFE
1.3. Dates Trade of Pakistan
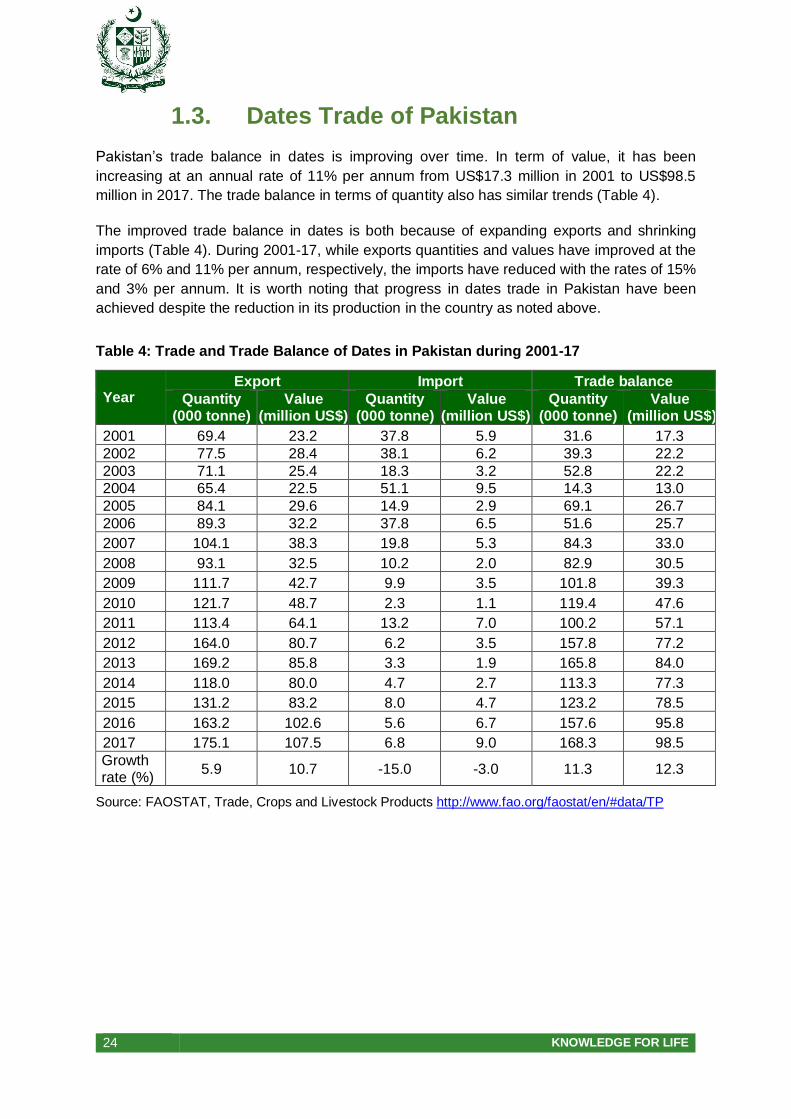
Pakistan’s trade balance in dates is improving over time. In term of value, it has been
increasing at an annual rate of 11% per annum from US$17.3 million in 2001 to US$98.5
million in 2017. The trade balance in terms of quantity also has similar trends (Table 4).
The improved trade balance in dates is both because of expanding exports and shrinking
imports (Table 4). During 2001-17, while exports quantities and values have improved at the
rate of 6% and 11% per annum, respectively, the imports have reduced with the rates of 15%
and 3% per annum. It is worth noting that progress in dates trade in Pakistan have been
achieved despite the reduction in its production in the country as noted above.
Table 4: Trade and Trade Balance of Dates in Pakistan during 2001-17
Year Export Import Trade balance
Quantity (000 tonne)
Value (million US$)
Quantity (000 tonne)
Value (million US$)
Quantity (000 tonne)
Value (million US$)
2001 69.4 23.2 37.8 5.9 31.6 17.3
2002 77.5 28.4 38.1 6.2 39.3 22.2
2003 71.1 25.4 18.3 3.2 52.8 22.2
2004 65.4 22.5 51.1 9.5 14.3 13.0
2005 84.1 29.6 14.9 2.9 69.1 26.7
2006 89.3 32.2 37.8 6.5 51.6 25.7
2007 104.1 38.3 19.8 5.3 84.3 33.0
2008 93.1 32.5 10.2 2.0 82.9 30.5
2009 111.7 42.7 9.9 3.5 101.8 39.3
2010 121.7 48.7 2.3 1.1 119.4 47.6
2011 113.4 64.1 13.2 7.0 100.2 57.1
2012 164.0 80.7 6.2 3.5 157.8 77.2
2013 169.2 85.8 3.3 1.9 165.8 84.0
2014 118.0 80.0 4.7 2.7 113.3 77.3
2015 131.2 83.2 8.0 4.7 123.2 78.5
2016 163.2 102.6 5.6 6.7 157.6 95.8
2017 175.1 107.5 6.8 9.0 168.3 98.5
Growth rate (%)
5.9 10.7 -15.0 -3.0 11.3 12.3
Source: FAOSTAT, Trade, Crops and Livestock Products http://www.fao.org/faostat/en/#data/TP
25 KNOWLEDGE FOR LIFE
1.4. Dates in Global Perspectives
Among the most produced fruits in the world, dates is 17th most produced on the globe2
(http://www.statista.com/statistics/264001/worldwide-production-of-fruit-by-variety/). Pakistan
stands at 6th position among the largest dates producing countries in the world (Table 7).
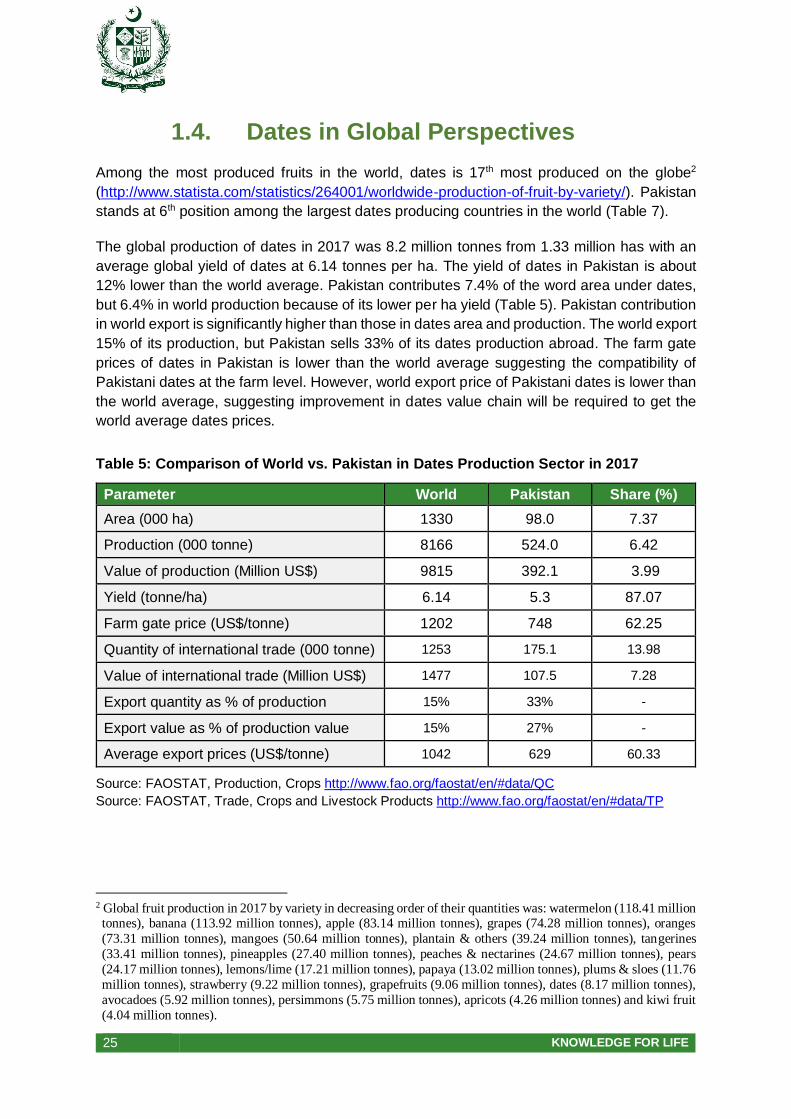
The global production of dates in 2017 was 8.2 million tonnes from 1.33 million has with an
average global yield of dates at 6.14 tonnes per ha. The yield of dates in Pakistan is about
12% lower than the world average. Pakistan contributes 7.4% of the word area under dates,
but 6.4% in world production because of its lower per ha yield (Table 5). Pakistan contribution
in world export is significantly higher than those in dates area and production. The world export
15% of its production, but Pakistan sells 33% of its dates production abroad. The farm gate
prices of dates in Pakistan is lower than the world average suggesting the compatibility of
Pakistani dates at the farm level. However, world export price of Pakistani dates is lower than
the world average, suggesting improvement in dates value chain will be required to get the
world average dates prices.
Table 5: Comparison of World vs. Pakistan in Dates Production Sector in 2017
Parameter World Pakistan Share (%)
Area (000 ha) 1330 98.0 7.37
Production (000 tonne) 8166 524.0 6.42
Value of production (Million US$) 9815 392.1 3.99
Yield (tonne/ha) 6.14 5.3 87.07
Farm gate price (US$/tonne) 1202 748 62.25
Quantity of international trade (000 tonne) 1253 175.1 13.98
Value of international trade (Million US$) 1477 107.5 7.28
Export quantity as % of production 15% 33% -
Export value as % of production value 15% 27% -
Average export prices (US$/tonne) 1042 629 60.33
Source: FAOSTAT, Production, Crops http://www.fao.org/faostat/en/#data/QC
Source: FAOSTAT, Trade, Crops and Livestock Products http://www.fao.org/faostat/en/#data/TP
2 Global fruit production in 2017 by variety in decreasing order of their quantities was: watermelon (118.41 million tonnes), banana (113.92 million tonnes), apple (83.14 million tonnes), grapes (74.28 million tonnes), oranges
(73.31 million tonnes), mangoes (50.64 million tonnes), plantain & others (39.24 million tonnes), tangerines
(33.41 million tonnes), pineapples (27.40 million tonnes), peaches & nectarines (24.67 million tonnes), pears
(24.17 million tonnes), lemons/lime (17.21 million tonnes), papaya (13.02 million tonnes), plums & sloes (11.76
million tonnes), strawberry (9.22 million tonnes), grapefruits (9.06 million tonnes), dates (8.17 million tonnes),
avocadoes (5.92 million tonnes), persimmons (5.75 million tonnes), apricots (4.26 million tonnes) and kiwi fruit
(4.04 million tonnes).
26 KNOWLEDGE FOR LIFE
1.5. Global Production and Trade
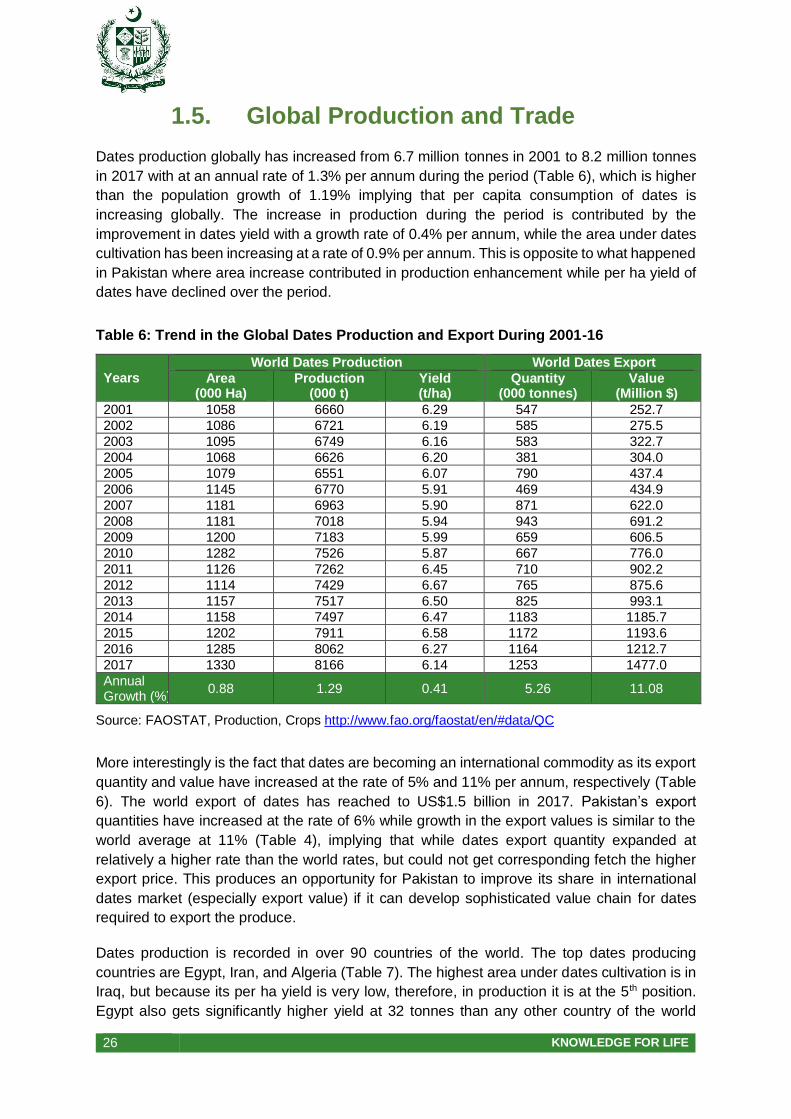
Dates production globally has increased from 6.7 million tonnes in 2001 to 8.2 million tonnes
in 2017 with at an annual rate of 1.3% per annum during the period (Table 6), which is higher
than the population growth of 1.19% implying that per capita consumption of dates is
increasing globally. The increase in production during the period is contributed by the
improvement in dates yield with a growth rate of 0.4% per annum, while the area under dates
cultivation has been increasing at a rate of 0.9% per annum. This is opposite to what happened
in Pakistan where area increase contributed in production enhancement while per ha yield of
dates have declined over the period.
Table 6: Trend in the Global Dates Production and Export During 2001-16
Years World Dates Production World Dates Export
Area (000 Ha)
Production (000 t)
Yield (t/ha)
Quantity (000 tonnes)
Value (Million $)
2001 1058 6660 6.29 547 252.7
2002 1086 6721 6.19 585 275.5
2003 1095 6749 6.16 583 322.7
2004 1068 6626 6.20 381 304.0
2005 1079 6551 6.07 790 437.4
2006 1145 6770 5.91 469 434.9
2007 1181 6963 5.90 871 622.0
2008 1181 7018 5.94 943 691.2
2009 1200 7183 5.99 659 606.5
2010 1282 7526 5.87 667 776.0
2011 1126 7262 6.45 710 902.2
2012 1114 7429 6.67 765 875.6
2013 1157 7517 6.50 825 993.1
2014 1158 7497 6.47 1183 1185.7
2015 1202 7911 6.58 1172 1193.6
2016 1285 8062 6.27 1164 1212.7
2017 1330 8166 6.14 1253 1477.0
Annual Growth (%)
0.88 1.29 0.41 5.26 11.08
Source: FAOSTAT, Production, Crops http://www.fao.org/faostat/en/#data/QC
More interestingly is the fact that dates are becoming an international commodity as its export
quantity and value have increased at the rate of 5% and 11% per annum, respectively (Table
6). The world export of dates has reached to US$1.5 billion in 2017. Pakistan’s export
quantities have increased at the rate of 6% while growth in the export values is similar to the
world average at 11% (Table 4), implying that while dates export quantity expanded at
relatively a higher rate than the world rates, but could not get corresponding fetch the higher
export price. This produces an opportunity for Pakistan to improve its share in international
dates market (especially export value) if it can develop sophisticated value chain for dates
required to export the produce.
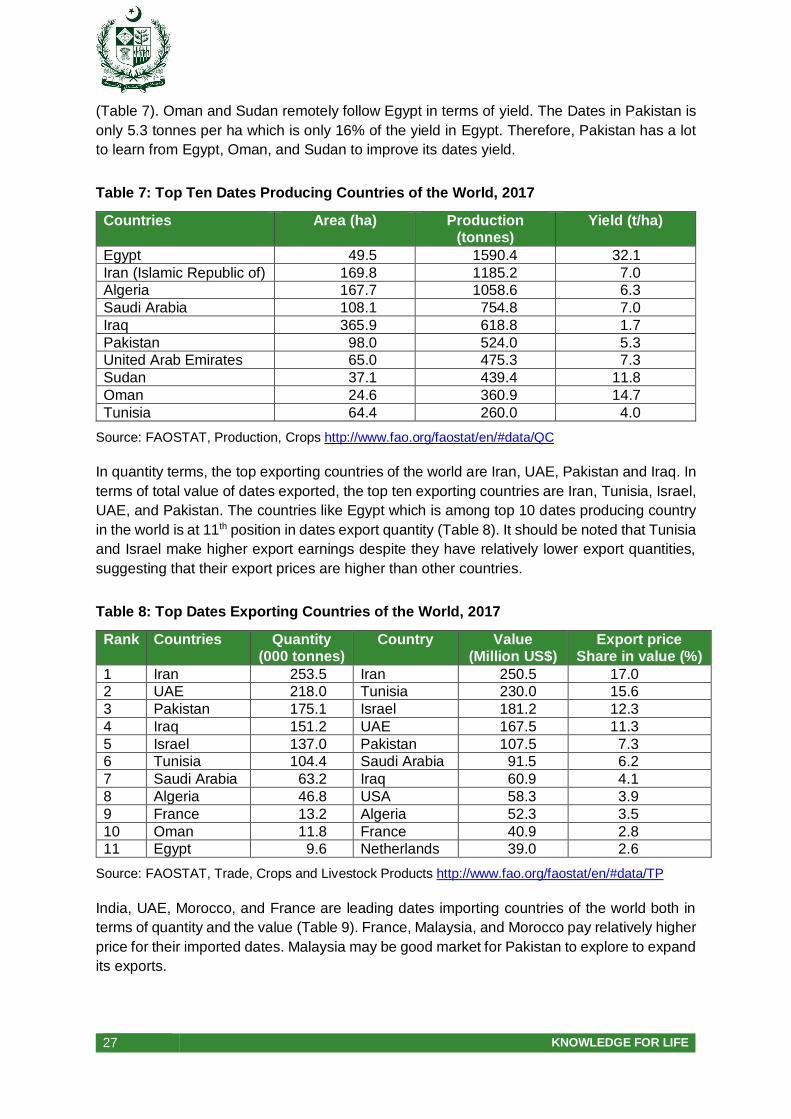
Dates production is recorded in over 90 countries of the world. The top dates producing
countries are Egypt, Iran, and Algeria (Table 7). The highest area under dates cultivation is in
Iraq, but because its per ha yield is very low, therefore, in production it is at the 5th position.
Egypt also gets significantly higher yield at 32 tonnes than any other country of the world
27 KNOWLEDGE FOR LIFE
(Table 7). Oman and Sudan remotely follow Egypt in terms of yield. The Dates in Pakistan is
only 5.3 tonnes per ha which is only 16% of the yield in Egypt. Therefore, Pakistan has a lot
to learn from Egypt, Oman, and Sudan to improve its dates yield.
Table 7: Top Ten Dates Producing Countries of the World, 2017
Countries Area (ha) Production (tonnes)
Yield (t/ha)
Egypt 49.5 1590.4 32.1
Iran (Islamic Republic of) 169.8 1185.2 7.0
Algeria 167.7 1058.6 6.3
Saudi Arabia 108.1 754.8 7.0
Iraq 365.9 618.8 1.7
Pakistan 98.0 524.0 5.3
United Arab Emirates 65.0 475.3 7.3
Sudan 37.1 439.4 11.8
Oman 24.6 360.9 14.7
Tunisia 64.4 260.0 4.0
Source: FAOSTAT, Production, Crops http://www.fao.org/faostat/en/#data/QC
In quantity terms, the top exporting countries of the world are Iran, UAE, Pakistan and Iraq. In
terms of total value of dates exported, the top ten exporting countries are Iran, Tunisia, Israel,
UAE, and Pakistan. The countries like Egypt which is among top 10 dates producing country
in the world is at 11th position in dates export quantity (Table 8). It should be noted that Tunisia
and Israel make higher export earnings despite they have relatively lower export quantities,
suggesting that their export prices are higher than other countries.
Table 8: Top Dates Exporting Countries of the World, 2017
Rank Countries Quantity (000 tonnes)
Country Value (Million US$)
Export price Share in value (%)
1 Iran 253.5 Iran 250.5 17.0
2 UAE 218.0 Tunisia 230.0 15.6
3 Pakistan 175.1 Israel 181.2 12.3
4 Iraq 151.2 UAE 167.5 11.3
5 Israel 137.0 Pakistan 107.5 7.3
6 Tunisia 104.4 Saudi Arabia 91.5 6.2
7 Saudi Arabia 63.2 Iraq 60.9 4.1
8 Algeria 46.8 USA 58.3 3.9
9 France 13.2 Algeria 52.3 3.5
10 Oman 11.8 France 40.9 2.8
11 Egypt 9.6 Netherlands 39.0 2.6
Source: FAOSTAT, Trade, Crops and Livestock Products http://www.fao.org/faostat/en/#data/TP
India, UAE, Morocco, and France are leading dates importing countries of the world both in
terms of quantity and the value (Table 9). France, Malaysia, and Morocco pay relatively higher
price for their imported dates. Malaysia may be good market for Pakistan to explore to expand
its exports.
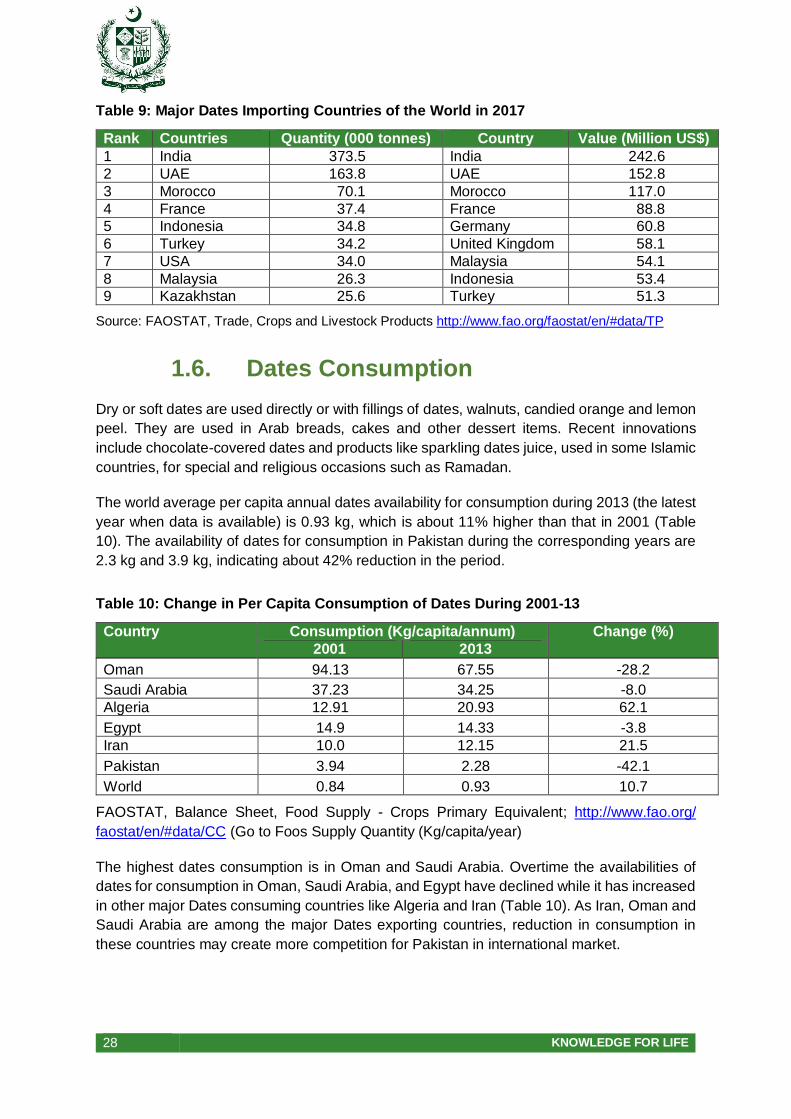
28 KNOWLEDGE FOR LIFE
Table 9: Major Dates Importing Countries of the World in 2017
Rank Countries Quantity (000 tonnes) Country Value (Million US$)
1 India 373.5 India 242.6
2 UAE 163.8 UAE 152.8
3 Morocco 70.1 Morocco 117.0
4 France 37.4 France 88.8
5 Indonesia 34.8 Germany 60.8
6 Turkey 34.2 United Kingdom 58.1
7 USA 34.0 Malaysia 54.1
8 Malaysia 26.3 Indonesia 53.4
9 Kazakhstan 25.6 Turkey 51.3
Source: FAOSTAT, Trade, Crops and Livestock Products http://www.fao.org/faostat/en/#data/TP
1.6. Dates Consumption
Dry or soft dates are used directly or with fillings of dates, walnuts, candied orange and lemon
peel. They are used in Arab breads, cakes and other dessert items. Recent innovations
include chocolate-covered dates and products like sparkling dates juice, used in some Islamic
countries, for special and religious occasions such as Ramadan.
The world average per capita annual dates availability for consumption during 2013 (the latest
year when data is available) is 0.93 kg, which is about 11% higher than that in 2001 (Table
10). The availability of dates for consumption in Pakistan during the corresponding years are
2.3 kg and 3.9 kg, indicating about 42% reduction in the period.
Table 10: Change in Per Capita Consumption of Dates During 2001-13
Country Consumption (Kg/capita/annum) Change (%)
2001 2013
Oman 94.13 67.55 -28.2
Saudi Arabia 37.23 34.25 -8.0
Algeria 12.91 20.93 62.1
Egypt 14.9 14.33 -3.8
Iran 10.0 12.15 21.5
Pakistan 3.94 2.28 -42.1
World 0.84 0.93 10.7
FAOSTAT, Balance Sheet, Food Supply - Crops Primary Equivalent; http://www.fao.org/
faostat/en/#data/CC (Go to Foos Supply Quantity (Kg/capita/year)
The highest dates consumption is in Oman and Saudi Arabia. Overtime the availabilities of
dates for consumption in Oman, Saudi Arabia, and Egypt have declined while it has increased
in other major Dates consuming countries like Algeria and Iran (Table 10). As Iran, Oman and
Saudi Arabia are among the major Dates exporting countries, reduction in consumption in
these countries may create more competition for Pakistan in international market.
29 KNOWLEDGE FOR LIFE
1.7. Need for the Study
Summarizing the macro analysis, we conclude that dates production in Pakistan is in crisis
during 2000s because of its declining production trend while per ha yield has depressed quite
significantly at 2.1% per annum rate. On the other hand, world average dates yield is improving
at the rate of 0.4% per annum. Once at par with the average world yield, Pakistani yield is now
13% lower than the world average. Trade in dates from Pakistan, however, has performed
relatively well during the period because of the expansion in the export dates and shrink in its
imports, which has improved the trade balance of Pakistan both in terms of dates quantity and
its value at quite a high rate of 11% and 12%, respectively.
However, such a high growth in the export of dates is not sustainable because of the declining
per ha yield in the country. Expansion in export along with declining production has reduced
the per capita consumption of dates in Pakistan by about 42%, which cannot be continued
unabated as Pakistani people do like to consume dates especially in the month of Ramadan
and during marriage ceremonies. Moreover, Pakistani dates in international markets fetch
lower price which is now only 60% of the world average.
Based on the importance of dates production in marginal areas cultivated by relatively small
poor farmers and its declining competitiveness in international market, Planning Commission
of Pakistan has initiated this study to analyze the whole value chain of Dates including
production, marketing, value addition, processing, and trade, identify the gaps and potential
along the chain, and suggest economically viable policy, technological, and institutional
interventions to enhance the competitiveness of Pakistani dates in international market. This
analysis is conducted on cluster basis to incorporate the regional variation in production,
marketing, and processing opportunities while suggesting interventions along the value chain.
30 KNOWLEDGE FOR LIFE
2. OBJECTIVES This study has been conducted to contribute in the Cluster Development Based
Agriculture Transformation Plan Vision-2025. The following objectives of the study are given
as under:
a) To identify major dates production clusters in Pakistan based on their production.
b) To characterize and conduct SWOT analysis of each dates cluster.
c) To identify infrastructure, institutional, technological, and policy issures of each cluster.
d) To evaluate the real potential of dates value chain.
e) To recommend infrastructure, institutional, technological and policy interventions to
harness the cluster potentials.
f) To conduct economic and social feasibility of the suggested interventions and
recommend policy measures.
31 KNOWLEDGE FOR LIFE
3. METHODOLOGY The presented data, field and other related information regarding characteristics, gaps,
potentials and required interventions for development of dates cluster were gathered from
following sources:
1. The primary data was gathered from field visits of farmers, meetings with farmers,
stakeholders, researchers, extension agents, exporters, office bearers of farmer’s
associations, NGOs and higher authorities. and internet search engines. For the sake
of in-depth discussion and information group discussions were also organized besides
several meetings with farmers and other stakeholders (see Annexure 1 for the list of
stakeholders consulted).
2. To collect detailed information, a questionnaire was developed and information was
gathered thereof.
3. Macro data related to dates were also analyzed to see the trends in dates production,
trade, consumption, etc. at the national and international level. The data in this analysis
were mainly used from FAO and Agricultural Statistics of Pakistan.
4. Literature was extensively reviewed for consultation and references (See Annexure 2
for the list of literature reviewed in this study).
Moreover, the following generic parameters and indicators were used while collecting the data:
World dates industry perspective.
The dates industry analysis and its potentials.
Dates cost of production, harvesting, postharvest and processing of dates data
was collected from farmers and other stakeholders.
Data was also collected from government directorates of Economics & Marketing,
Postharvest & Food Technology, Wholesalers, Retailers and processers.
Production constraints, harvesting, transportation of dates, marketing issues,
trading export failures, and processing data was obtained from all the stakeholders.
The recommendations have been made on the basis of local and national indices
and international parameters.

32 KNOWLEDGE FOR LIFE
4. REVIEW OF LITERATURE The bilateral trade between China and Pakistan is quite imbalance and fully in favor of China.
That is why Pakistan has asked China to encourage its agricultural products into Chinese
market which will enhance one-sided contracted volume of trade from Pakistan side. In this
respect China-Pakistan Economic Corridor (CPEC) is potential platform for both countries to
benefit from therefore, China and Pakistan have principally agreed to widen agro based
cooperation and adoption to fast-track trade in agricultural products (The News, 18th October,
2018). But to meet the export targets, Pakistan has to apply the protocols under International
Plant Protection Convention (IPPC), which is a major requirement for the export of agricultural
products (FAO, 2009).
Major portion of dates is not subjected to any processing operation except pressing and this
still holds truth. Around 40% postharvest losses occur in dates. Dates are classified as
climacteric fruit (Serrano et al., 2001), which requires special treatments after harvesting for
longer shelf life. Furthermore, micronutrients are not applied to dates whereas these
significantly increase fruit production, fruit size and quality (Khayyat et al., 2007).
There a trade war situation is prevailing between the two world economic giants and one of
them is a very close neighboring friend to Pakistan and likely to be in need of Pakistani
products especially agricultural products. The CPEC is one of the potential opportunities for
the destination of Pakistani products especially fruits, vegetables and dairy and poultry
products.
According to All Pakistan Fruit & Vegetable (Exporters & Importers) Association (PFVA),
Balochistan can export US$ 1 billion worth of fruits and vegetables annually. Therefore, PFVA
in the start of this year visited Balochistan and held a series of meetings with the stakeholders
for paving the way for the agricultural products of Balochistan including dates to be marketed
in international markets.
During our consultation process the farmers of dates expressed their concerns that besides
water scarcity. Major pests of this crop are also posing great threat. Dubas Bug, Lesser Date
Moth, red palm weevil, Rhinoceros beetles and Scale insects have been reported as major
dates pests in Balochistan (Khan, et. al., 2018). The severity of these insect attacks sometimes
cause sprays on this precious crop. Thanks to dry climate of most of dates growing areas, no
major disease has been mentioned by the farmers of dates. About more than one decade ago
Dubas bug entered in Balochistan through Iran in the bordering area of Panjgur and
devastated the dates crop by infesting them severely. This bug has spread from Iraq and
entered in Pakistan through Iran. The Balochistan Agriculture Research Institute, Quetta, took
the preventive measures and confined the pest within same area but for total control still more
is needed to be done. Furthermore, for sustainable preventive measures, research capacity,
extension capabilities and farmers’ agriculture literacy is needed to be enhanced for good
agriculture practices and food security.

33 KNOWLEDGE FOR LIFE
5. CLUSTER IDENTIFICATION AND ITS CHARACTERISTICS
5.1. Identification of Dates Clusters
As stated earlier, Balochistan is contributing 33.4% of dates of Pakistan while the rest of 67%
dates are produced in Sindh (57.3%), Punjab (7.0%) and Khyber Pakhtunkhwa (2.3%). Main
dates growing districts in the order of area concentration are Turbat, Khairpur, Panjgur,
Muzaffergarh, Sukkur, Awaran, Gwadar, Dera Ismail Khan, Jhang, and Bhakkar (Table 11).
Most of these districts are on or in close proximity to CPEC routes meaning thereby that the
dates of Pakistan would have access to world’s biggest population’s market of China in the
near future.
Based on the district level data on dates, following three clusters are identified in Figure-1 and
Table 9:
1. Baluchistan cluster includes Turbat, Panjgur, Awaran and Gwadar districts with
Turbat and Panjgur as its focal points. Around 86% of dates area in Balochistan is
concentrated in this cluster while 45% of dates area of the province lies in Turbat. This
cluster is on the western route of CPEC.
2. Sindh cluster includes Khairpur and Sukkur with Khairpur as its focal point. About
98% of dates area in the province is concentrated in this cluster, while 89% is coming
from Khairpur. The district is in close proximity to the Western CPEC route.
3. Punjab and KP cluster includes Muzaffargarh, Jhang, Layyah and D.I. Khan with
Muzaffargarh as its focal point. About 72% of the provincial area (or 6% of the country
area) of dates comes from this cluster while 44% comes just from Muzaffargarh. D.I.
Khan is also in close proximity of CPEC route. The cluster has the highest per ha yield
of dates among all the clusters.
Figure 1: Map of Pakistan showing dates production & marketing areas
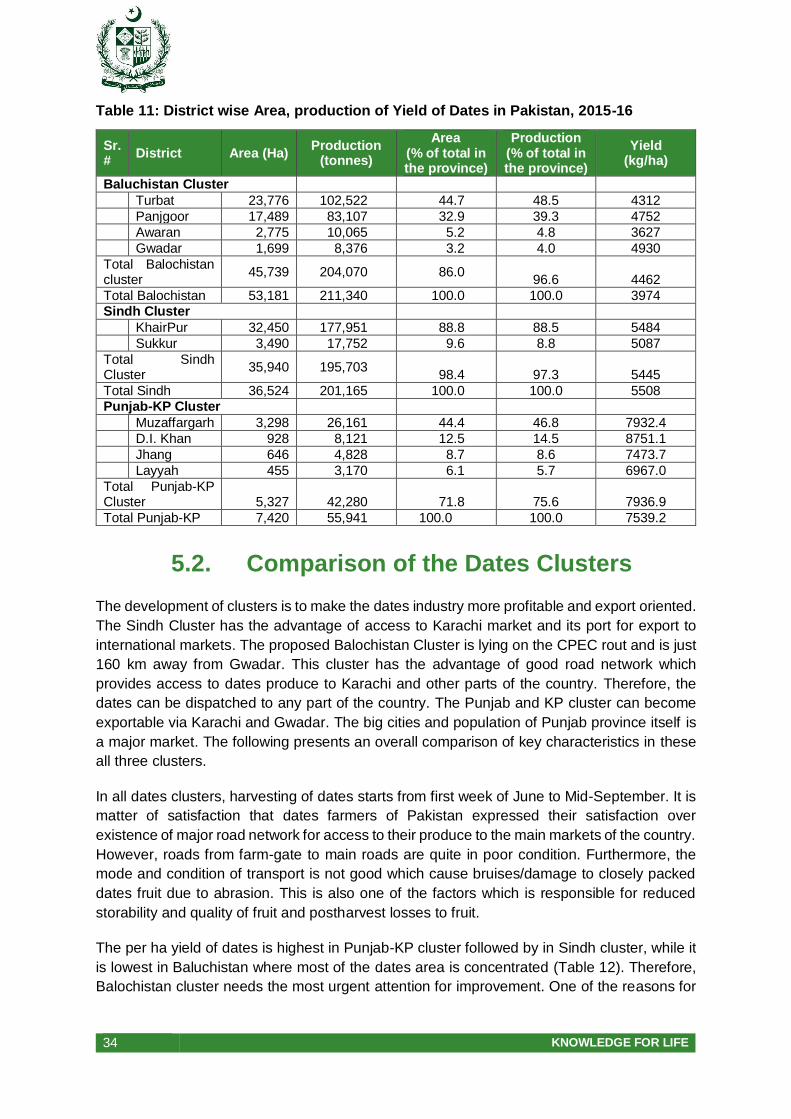
34 KNOWLEDGE FOR LIFE
Table 11: District wise Area, production of Yield of Dates in Pakistan, 2015-16
Sr. #
District Area (Ha) Production
(tonnes)
Area (% of total in the province)
Production (% of total in the province)
Yield (kg/ha)
Baluchistan Cluster
Turbat 23,776 102,522 44.7 48.5 4312
Panjgoor 17,489 83,107 32.9 39.3 4752
Awaran 2,775 10,065 5.2 4.8 3627
Gwadar 1,699 8,376 3.2 4.0 4930
Total Balochistan cluster
45,739 204,070 86.0 96.6 4462
Total Balochistan 53,181 211,340 100.0 100.0 3974 Sindh Cluster
KhairPur 32,450 177,951 88.8 88.5 5484
Sukkur 3,490 17,752 9.6 8.8 5087
Total Sindh Cluster
35,940 195,703 98.4 97.3 5445
Total Sindh 36,524 201,165 100.0 100.0 5508 Punjab-KP Cluster
Muzaffargarh 3,298 26,161 44.4 46.8 7932.4
D.I. Khan 928 8,121 12.5 14.5 8751.1
Jhang 646 4,828 8.7 8.6 7473.7
Layyah 455 3,170 6.1 5.7 6967.0
Total Punjab-KP Cluster 5,327 42,280 71.8 75.6 7936.9
Total Punjab-KP 7,420 55,941 100.0 100.0 7539.2
5.2. Comparison of the Dates Clusters
The development of clusters is to make the dates industry more profitable and export oriented.
The Sindh Cluster has the advantage of access to Karachi market and its port for export to
international markets. The proposed Balochistan Cluster is lying on the CPEC rout and is just
160 km away from Gwadar. This cluster has the advantage of good road network which
provides access to dates produce to Karachi and other parts of the country. Therefore, the
dates can be dispatched to any part of the country. The Punjab and KP cluster can become
exportable via Karachi and Gwadar. The big cities and population of Punjab province itself is
a major market. The following presents an overall comparison of key characteristics in these
all three clusters.
In all dates clusters, harvesting of dates starts from first week of June to Mid-September. It is
matter of satisfaction that dates farmers of Pakistan expressed their satisfaction over
existence of major road network for access to their produce to the main markets of the country.
However, roads from farm-gate to main roads are quite in poor condition. Furthermore, the
mode and condition of transport is not good which cause bruises/damage to closely packed
dates fruit due to abrasion. This is also one of the factors which is responsible for reduced
storability and quality of fruit and postharvest losses to fruit.
The per ha yield of dates is highest in Punjab-KP cluster followed by in Sindh cluster, while it
is lowest in Baluchistan where most of the dates area is concentrated (Table 12). Therefore,
Balochistan cluster needs the most urgent attention for improvement. One of the reasons for

35 KNOWLEDGE FOR LIFE
low yield in Balochistan is that orchards are not properly laid out. In Punjab and KP cluster,
farmers in the early stage of the garden, intercrop dates fields with wheat and vegetables.
The cultivation method in all the three clusters, especially in Balochistan is still conventional.
The grower still plants old varieties which are prevailing in the cluster for more than 50 years.
Despite the existence of high efficiency irrigation systems, irrigation methods have not
changed, still flooding method is applied. The farmers of the cluster do not test their soil and
water, and in Balochistan cluster no such facility exists in the area. Fertilizers are used
injudiciously and the quality of fertilizer is also compromised. On the other hand, farmers spray
their orchards as preemptive measures without pest scouting which results in loss of money
without much benefit. The research and extension wings do work in the cluster but they are
working with very meager funds and capacity to address farmers’ issues.
Table 12: Characteristic and Comparison of Dates Clusters
Salient Features Sindh Cluster Baloch. Cluster Punjab-KP Cluster
Districts Khairpur and Sukkur
Turbat, Panjgur, Awaran and Gwadar
Muzaffargarh, D.I. Khan,Jhang, Bhakkar
Focal point district/Tehsil/ Mouza
Khairpur Turbat Muzaffargarh
Focal point area (ha) 32,450 23,776 3,298 Focal point production (tonnes)
177,951 102,522 26,161
Area of the cluster (ha) 36,524 46,716 5,439 Production of the cluster (tonnes)
201,165 207,614 42,454
Av. yield of the cluster (t/ha) 5.51 4.44 7.80 Percentage of the crop area that lies in the cluster (dates area of the cluster/dates area in the country)
37.01% 48.10% 5.60%
% of the total cropped area under dates in the cluster
10.94% 44.62% 0.17%
Geographical and Environmental Factors
Calcareous river alluvium, clay silt soil.
Alluvial, silt clay and light sandy soil
Loam and sandy loam
Plains. Mountainous and plains.
Plains
Climate of these two dates growing areas is very hot/tropical in summer and pleasant in winter.
The climate of these four areas is quite similar and arid to hyper arid. These areas receive mostly winter rains with hot to very hot summers/ tropical.
The climate these four areas are almost similar and very hot/tropical.
Mostly areas of dates orchards are irrigated with ground water.
Irrigation is dependent on ground water table level. For irrigation, the ground water is pumped by tube wells in addition to
Most of the dates growing areas are abundant with river water and some receive glacier water.

36 KNOWLEDGE FOR LIFE
trational Karez system.
Precious ground water is pumped and the water used is fit for irrigation.
Precious groundwater & high costs of pumping from very low depths in most of areas.
Quality surface water is available.
Average rainfall 90-110 mm. Most of the rain occur in winter.
Average rainfall 50–170 mm per year.
Average rainfall 150 and 250 mm per annum in Muzaffargarh and D.I. Khan respectively.
Temperature rises up to 40-45°C during summer but drops to 7°C during winter. Dry hot and cool nights are typical in summer.
Temperatures frequently rises > 43°C during Mid-May and Mid-August. In winters, temperature goes drops to 10oC, particularly during nights.
Temperature frequently rises 42°C in summer and drops 5°C in winter normally.
No dust storm occurs.
Strong winds and dust storms may occur in winter.
Dust storms occur in Bhakkar & Muzaffargarh and sand dunes are also formed.
Mostly dry during the fruiting season of June-August
Dry and hot weather during May through July and very rarely receive monsoon rainfall.
Most of the areas remain dry during summer, while Muzaffargarh receives most of the rainfall in the July and August.
Dates Growers A good majority of marginal and small sized farming households (See Annexure-3)
A notably good proportion of farming households belong to marginal and smalled groups (See Annexure-3)
Majority of the farming households belong to marginal and small size groups (See Annexure-3)
No dates specific growers association however, Farmer’s Association do exist with name of Sind Abadgar Board.
Turbat Dates Growers Association.
No formal Dates Growers Associations.
Availability of abundant labor for dates production practices, especially at the time of harvesting.
Availability of abundant labor for dates production practices, especially at the time of harvesting.
Labor is provided by households themselves, however, in some areas where big orchards exist
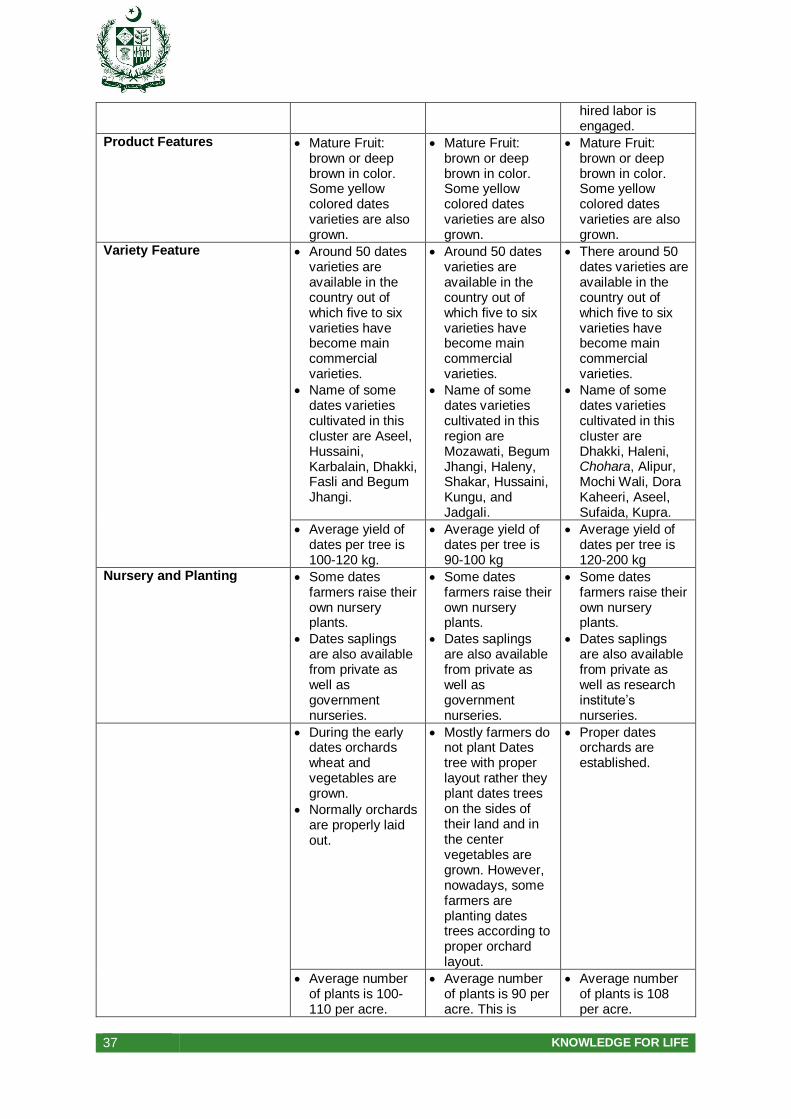
37 KNOWLEDGE FOR LIFE
hired labor is engaged.
Product Features Mature Fruit: brown or deep brown in color. Some yellow colored dates varieties are also grown.
Mature Fruit: brown or deep brown in color. Some yellow colored dates varieties are also grown.
Mature Fruit: brown or deep brown in color. Some yellow colored dates varieties are also grown.
Variety Feature Around 50 dates varieties are available in the country out of which five to six varieties have become main commercial varieties.
Name of some dates varieties cultivated in this cluster are Aseel, Hussaini, Karbalain, Dhakki, Fasli and Begum Jhangi.
Around 50 dates varieties are available in the country out of which five to six varieties have become main commercial varieties.
Name of some dates varieties cultivated in this region are Mozawati, Begum Jhangi, Haleny, Shakar, Hussaini, Kungu, and Jadgali.
There around 50 dates varieties are available in the country out of which five to six varieties have become main commercial varieties.
Name of some dates varieties cultivated in this cluster are Dhakki, Haleni, Chohara, Alipur, Mochi Wali, Dora Kaheeri, Aseel, Sufaida, Kupra.
Average yield of dates per tree is 100-120 kg.
Average yield of dates per tree is 90-100 kg
Average yield of dates per tree is 120-200 kg
Nursery and Planting Some dates farmers raise their own nursery plants.
Dates saplings are also available from private as well as government nurseries.
Some dates farmers raise their own nursery plants.
Dates saplings are also available from private as well as government nurseries.
Some dates farmers raise their own nursery plants.
Dates saplings are also available from private as well as research institute’s nurseries.
During the early dates orchards wheat and vegetables are grown.
Normally orchards are properly laid out.
Mostly farmers do not plant Dates tree with proper layout rather they plant dates trees on the sides of their land and in the center vegetables are grown. However, nowadays, some farmers are planting dates trees according to proper orchard layout.
Proper dates orchards are established.
Average number of plants is 100-110 per acre.
Average number of plants is 90 per acre. This is
Average number of plants is 108 per acre.
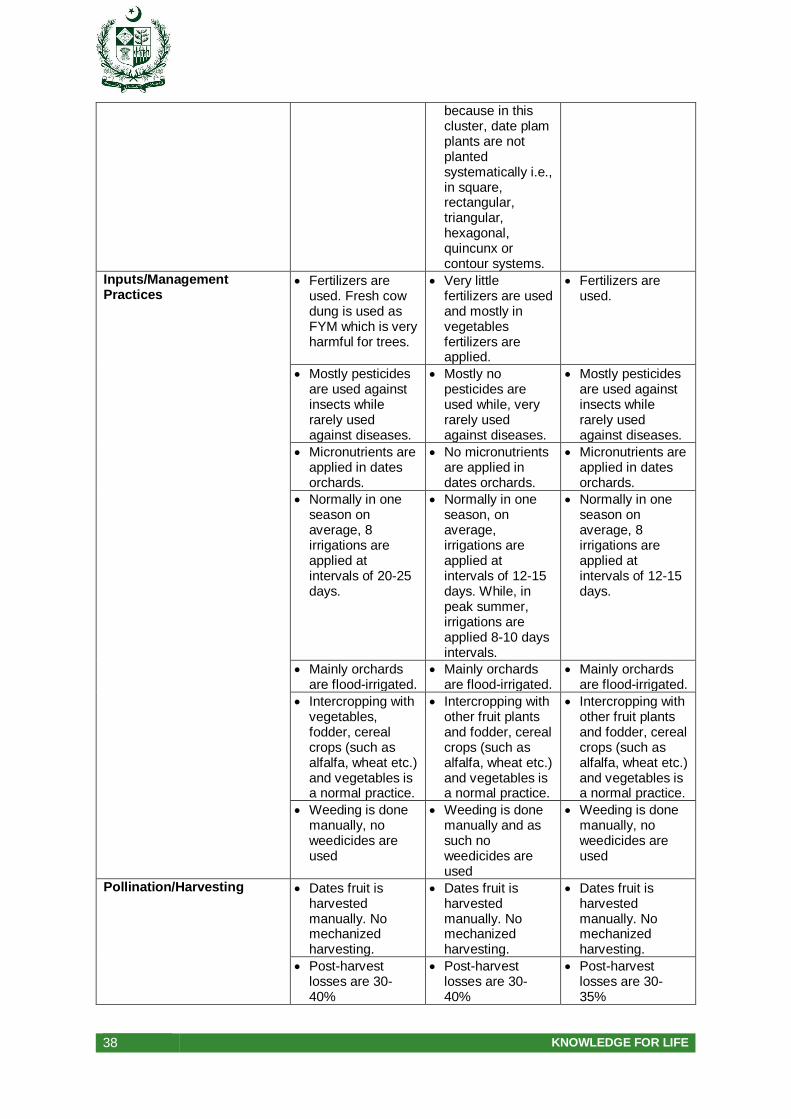
38 KNOWLEDGE FOR LIFE
because in this cluster, date plam plants are not planted systematically i.e., in square, rectangular, triangular, hexagonal, quincunx or contour systems.
Inputs/Management Practices
Fertilizers are used. Fresh cow dung is used as FYM which is very harmful for trees.
Very little fertilizers are used and mostly in vegetables fertilizers are applied.
Fertilizers are used.
Mostly pesticides are used against insects while rarely used against diseases.
Mostly no pesticides are used while, very rarely used against diseases.
Mostly pesticides are used against insects while rarely used against diseases.
Micronutrients are applied in dates orchards.
No micronutrients are applied in dates orchards.
Micronutrients are applied in dates orchards.
Normally in one season on average, 8 irrigations are applied at intervals of 20-25 days.
Normally in one season, on average, irrigations are applied at intervals of 12-15 days. While, in peak summer, irrigations are applied 8-10 days intervals.
Normally in one season on average, 8 irrigations are applied at intervals of 12-15 days.
Mainly orchards are flood-irrigated.
Mainly orchards are flood-irrigated.
Mainly orchards are flood-irrigated.
Intercropping with vegetables, fodder, cereal crops (such as alfalfa, wheat etc.) and vegetables is a normal practice.
Intercropping with other fruit plants and fodder, cereal crops (such as alfalfa, wheat etc.) and vegetables is a normal practice.
Intercropping with other fruit plants and fodder, cereal crops (such as alfalfa, wheat etc.) and vegetables is a normal practice.
Weeding is done manually, no weedicides are used
Weeding is done manually and as such no weedicides are used
Weeding is done manually, no weedicides are used
Pollination/Harvesting Dates fruit is harvested manually. No mechanized harvesting.
Dates fruit is harvested manually. No mechanized harvesting.
Dates fruit is harvested manually. No mechanized harvesting.
Post-harvest losses are 30-40%
Post-harvest losses are 30-40%
Post-harvest losses are 30-35%
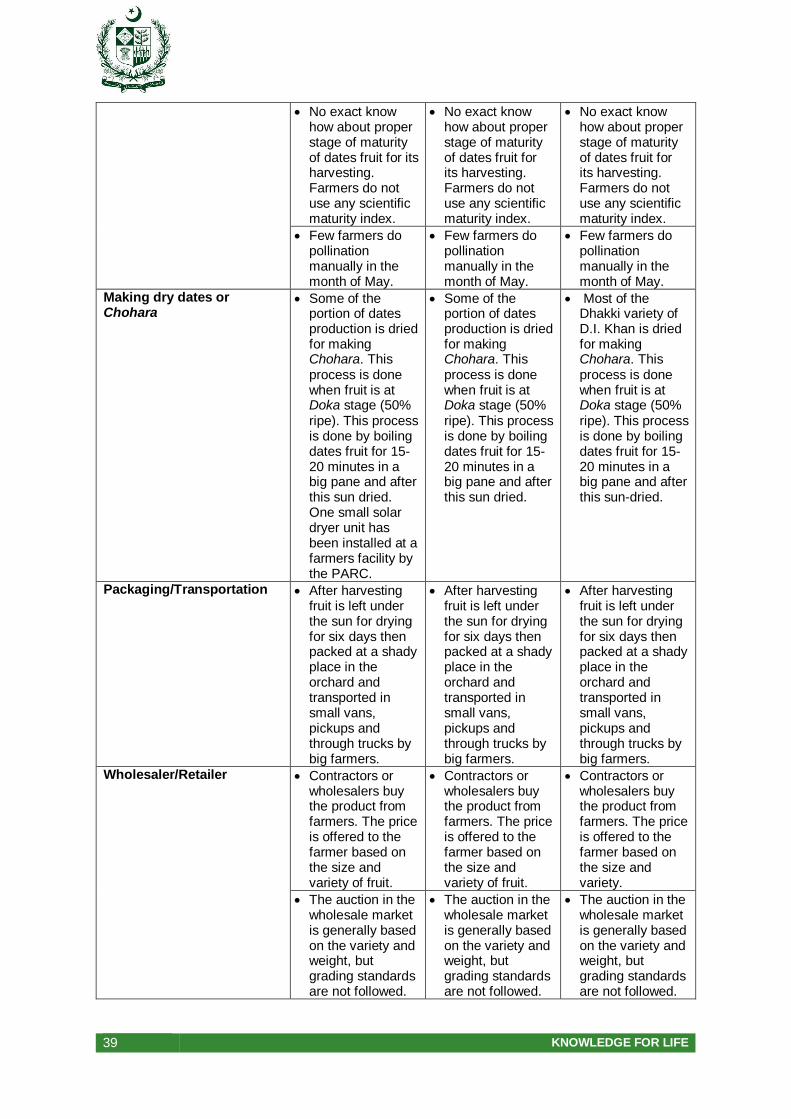
39 KNOWLEDGE FOR LIFE
No exact know how about proper stage of maturity of dates fruit for its harvesting. Farmers do not use any scientific maturity index.
No exact know how about proper stage of maturity of dates fruit for its harvesting. Farmers do not use any scientific maturity index.
No exact know how about proper stage of maturity of dates fruit for its harvesting. Farmers do not use any scientific maturity index.
Few farmers do pollination manually in the month of May.
Few farmers do pollination manually in the month of May.
Few farmers do pollination manually in the month of May.
Making dry dates or Chohara
Some of the portion of dates production is dried for making Chohara. This process is done when fruit is at Doka stage (50% ripe). This process is done by boiling dates fruit for 15-20 minutes in a big pane and after this sun dried. One small solar dryer unit has been installed at a farmers facility by the PARC.
Some of the portion of dates production is dried for making Chohara. This process is done when fruit is at Doka stage (50% ripe). This process is done by boiling dates fruit for 15-20 minutes in a big pane and after this sun dried.
Most of the Dhakki variety of D.I. Khan is dried for making Chohara. This process is done when fruit is at Doka stage (50% ripe). This process is done by boiling dates fruit for 15-20 minutes in a big pane and after this sun-dried.
Packaging/Transportation After harvesting fruit is left under the sun for drying for six days then packed at a shady place in the orchard and transported in small vans, pickups and through trucks by big farmers.
After harvesting fruit is left under the sun for drying for six days then packed at a shady place in the orchard and transported in small vans, pickups and through trucks by big farmers.
After harvesting fruit is left under the sun for drying for six days then packed at a shady place in the orchard and transported in small vans, pickups and through trucks by big farmers.
Wholesaler/Retailer Contractors or wholesalers buy the product from farmers. The price is offered to the farmer based on the size and variety of fruit.
Contractors or wholesalers buy the product from farmers. The price is offered to the farmer based on the size and variety of fruit.
Contractors or wholesalers buy the product from farmers. The price is offered to the farmer based on the size and variety.
The auction in the wholesale market is generally based on the variety and weight, but grading standards are not followed.
The auction in the wholesale market is generally based on the variety and weight, but grading standards are not followed.
The auction in the wholesale market is generally based on the variety and weight, but grading standards are not followed.
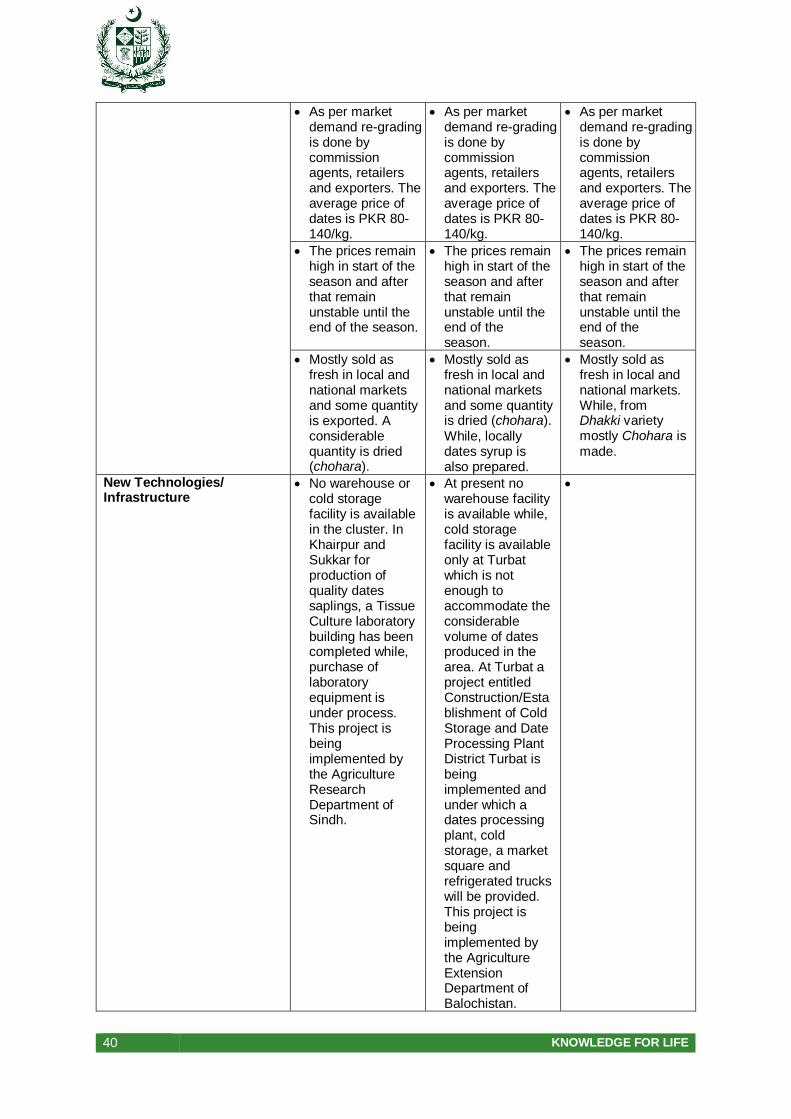
40 KNOWLEDGE FOR LIFE
As per market demand re-grading is done by commission agents, retailers and exporters. The average price of dates is PKR 80-140/kg.
As per market demand re-grading is done by commission agents, retailers and exporters. The average price of dates is PKR 80-140/kg.
As per market demand re-grading is done by commission agents, retailers and exporters. The average price of dates is PKR 80-140/kg.
The prices remain high in start of the season and after that remain unstable until the end of the season.
The prices remain high in start of the season and after that remain unstable until the end of the season.
The prices remain high in start of the season and after that remain unstable until the end of the season.
Mostly sold as fresh in local and national markets and some quantity is exported. A considerable quantity is dried (chohara).
Mostly sold as fresh in local and national markets and some quantity is dried (chohara). While, locally dates syrup is also prepared.
Mostly sold as fresh in local and national markets. While, from Dhakki variety mostly Chohara is made.
New Technologies/ Infrastructure
No warehouse or cold storage facility is available in the cluster. In Khairpur and Sukkar for production of quality dates saplings, a Tissue Culture laboratory building has been completed while, purchase of laboratory equipment is under process. This project is being implemented by the Agriculture Research Department of Sindh.
At present no warehouse facility is available while, cold storage facility is available only at Turbat which is not enough to accommodate the considerable volume of dates produced in the area. At Turbat a project entitled Construction/Establishment of Cold Storage and Date Processing Plant District Turbat is being implemented and under which a dates processing plant, cold storage, a market square and refrigerated trucks will be provided. This project is being implemented by the Agriculture Extension Department of Balochistan.
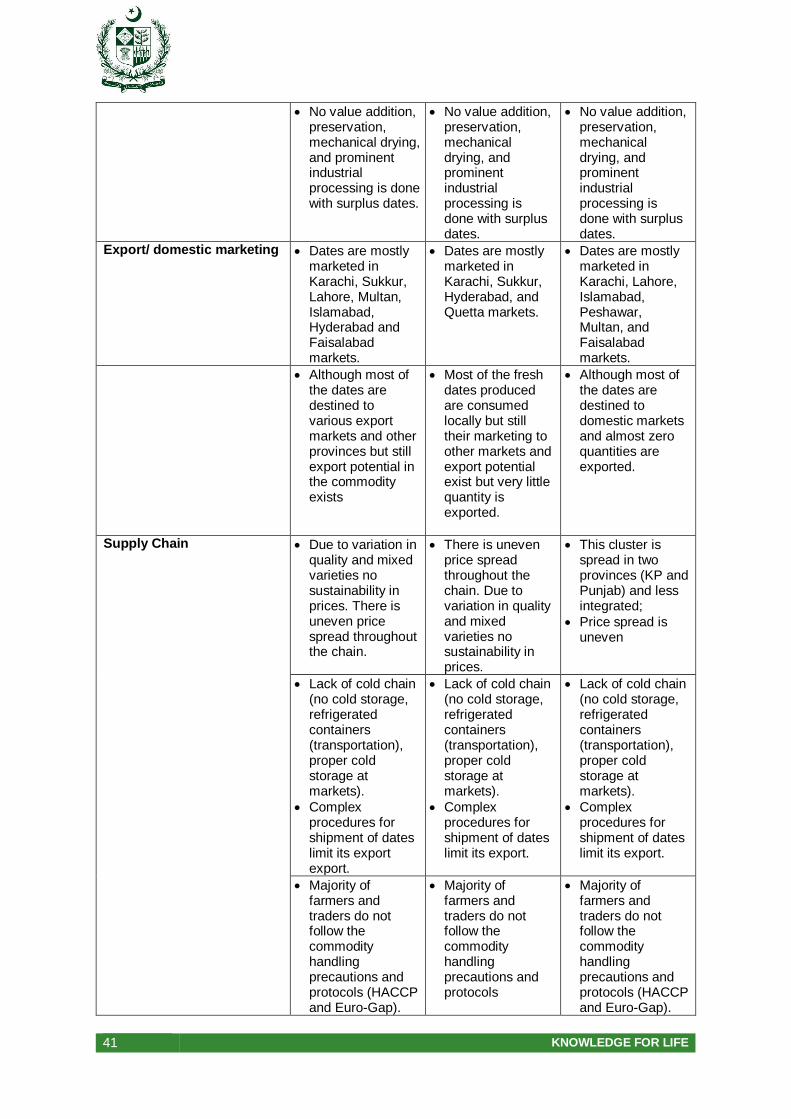
41 KNOWLEDGE FOR LIFE
No value addition, preservation, mechanical drying, and prominent industrial processing is done with surplus dates.
No value addition, preservation, mechanical drying, and prominent industrial processing is done with surplus dates.
No value addition, preservation, mechanical drying, and prominent industrial processing is done with surplus dates.
Export/ domestic marketing Dates are mostly marketed in Karachi, Sukkur, Lahore, Multan, Islamabad, Hyderabad and Faisalabad markets.
Dates are mostly marketed in Karachi, Sukkur, Hyderabad, and Quetta markets.
Dates are mostly marketed in Karachi, Lahore, Islamabad, Peshawar, Multan, and Faisalabad markets.
Although most of the dates are destined to various export markets and other provinces but still export potential in the commodity exists
Most of the fresh dates produced are consumed locally but still their marketing to other markets and export potential exist but very little quantity is exported.
Although most of the dates are destined to domestic markets and almost zero quantities are exported.
Supply Chain Due to variation in quality and mixed varieties no sustainability in prices. There is uneven price spread throughout the chain.
There is uneven price spread throughout the chain. Due to variation in quality and mixed varieties no sustainability in prices.
This cluster is spread in two provinces (KP and Punjab) and less integrated;
Price spread is uneven
Lack of cold chain (no cold storage, refrigerated containers (transportation), proper cold storage at markets).
Complex procedures for shipment of dates limit its export export.
Lack of cold chain (no cold storage, refrigerated containers (transportation), proper cold storage at markets).
Complex procedures for shipment of dates limit its export.
Lack of cold chain (no cold storage, refrigerated containers (transportation), proper cold storage at markets).
Complex procedures for shipment of dates limit its export.
Majority of farmers and traders do not follow the commodity handling precautions and protocols (HACCP and Euro-Gap).
Majority of farmers and traders do not follow the commodity handling precautions and protocols
Majority of farmers and traders do not follow the commodity handling precautions and protocols (HACCP and Euro-Gap).
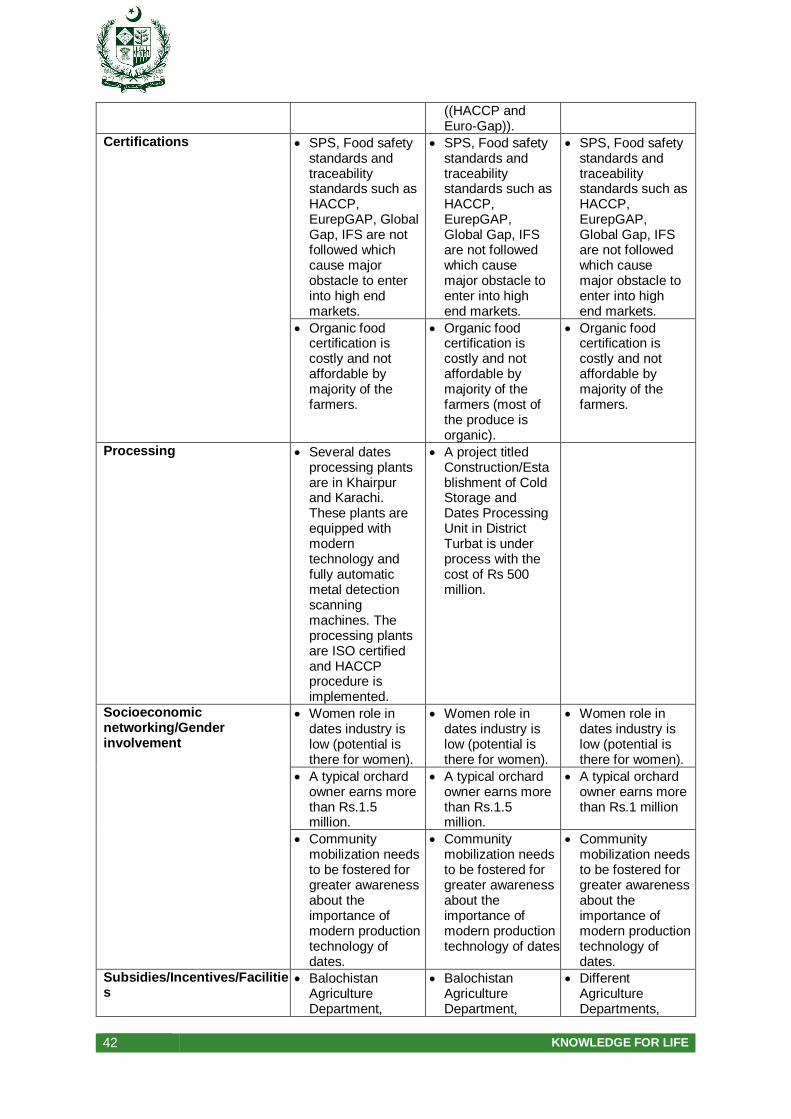
42 KNOWLEDGE FOR LIFE
((HACCP and Euro-Gap)).
Certifications SPS, Food safety standards and traceability standards such as HACCP, EurepGAP, Global Gap, IFS are not followed which cause major obstacle to enter into high end markets.
SPS, Food safety standards and traceability standards such as HACCP, EurepGAP, Global Gap, IFS are not followed which cause major obstacle to enter into high end markets.
SPS, Food safety standards and traceability standards such as HACCP, EurepGAP, Global Gap, IFS are not followed which cause major obstacle to enter into high end markets.
Organic food certification is costly and not affordable by majority of the farmers.
Organic food certification is costly and not affordable by majority of the farmers (most of the produce is organic).
Organic food certification is costly and not affordable by majority of the farmers.
Processing Several dates processing plants are in Khairpur and Karachi. These plants are equipped with modern technology and fully automatic metal detection scanning machines. The processing plants are ISO certified and HACCP procedure is implemented.
A project titled Construction/Establishment of Cold Storage and Dates Processing Unit in District Turbat is under process with the cost of Rs 500 million.
Socioeconomic networking/Gender involvement
Women role in dates industry is low (potential is there for women).
Women role in dates industry is low (potential is there for women).
Women role in dates industry is low (potential is there for women).
A typical orchard owner earns more than Rs.1.5 million.
A typical orchard owner earns more than Rs.1.5 million.
A typical orchard owner earns more than Rs.1 million
Community mobilization needs to be fostered for greater awareness about the importance of modern production technology of dates.
Community mobilization needs to be fostered for greater awareness about the importance of modern production technology of dates.
Community mobilization needs to be fostered for greater awareness about the importance of modern production technology of dates.
Subsidies/Incentives/Facilities
Balochistan Agriculture Department,
Balochistan Agriculture Department,
Different Agriculture Departments,
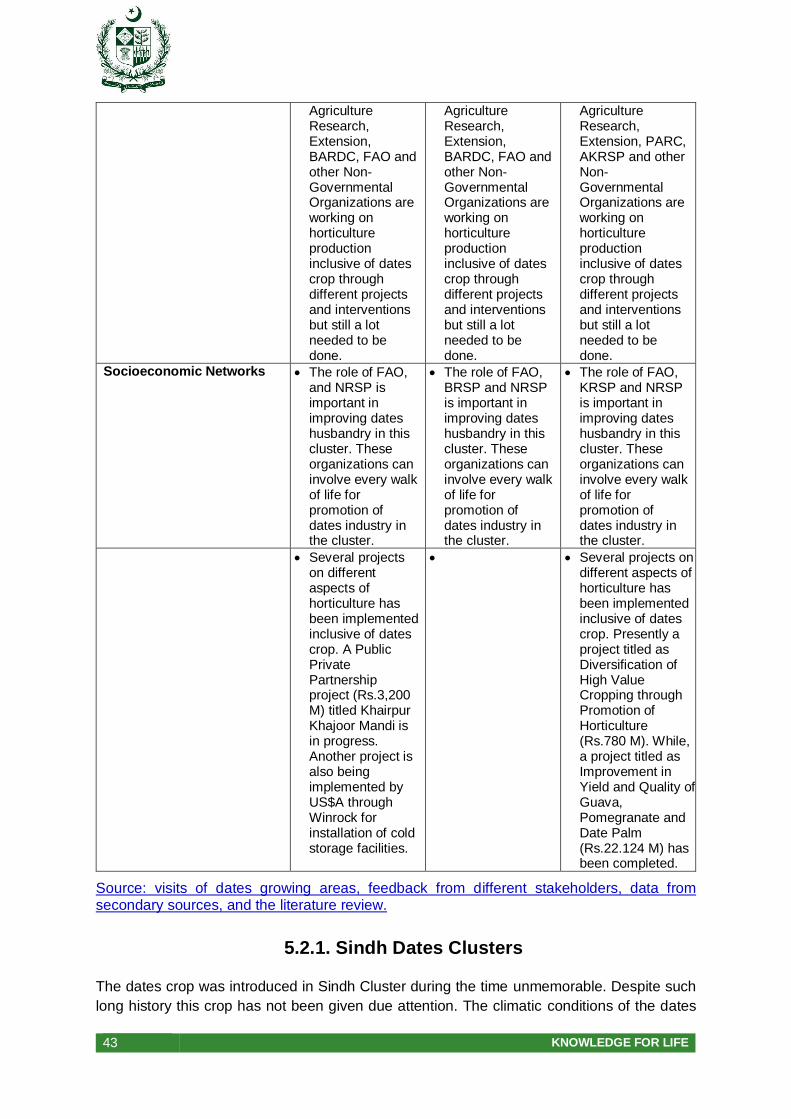
43 KNOWLEDGE FOR LIFE
Agriculture Research, Extension, BARDC, FAO and other Non-Governmental Organizations are working on horticulture production inclusive of dates crop through different projects and interventions but still a lot needed to be done.
Agriculture Research, Extension, BARDC, FAO and other Non-Governmental Organizations are working on horticulture production inclusive of dates crop through different projects and interventions but still a lot needed to be done.
Agriculture Research, Extension, PARC, AKRSP and other Non-Governmental Organizations are working on horticulture production inclusive of dates crop through different projects and interventions but still a lot needed to be done.
Socioeconomic Networks The role of FAO, and NRSP is important in improving dates husbandry in this cluster. These organizations can involve every walk of life for promotion of dates industry in the cluster.
The role of FAO, BRSP and NRSP is important in improving dates husbandry in this cluster. These organizations can involve every walk of life for promotion of dates industry in the cluster.
The role of FAO, KRSP and NRSP is important in improving dates husbandry in this cluster. These organizations can involve every walk of life for promotion of dates industry in the cluster.
Several projects on different aspects of horticulture has been implemented inclusive of dates crop. A Public Private Partnership project (Rs.3,200 M) titled Khairpur Khajoor Mandi is in progress. Another project is also being implemented by US$A through Winrock for installation of cold storage facilities.
Several projects on different aspects of horticulture has been implemented inclusive of dates crop. Presently a project titled as Diversification of High Value Cropping through Promotion of Horticulture (Rs.780 M). While, a project titled as Improvement in Yield and Quality of Guava, Pomegranate and Date Palm (Rs.22.124 M) has been completed.
Source: visits of dates growing areas, feedback from different stakeholders, data from secondary sources, and the literature review.
5.2.1. Sindh Dates Clusters
The dates crop was introduced in Sindh Cluster during the time unmemorable. Despite such
long history this crop has not been given due attention. The climatic conditions of the dates
44 KNOWLEDGE FOR LIFE
growing areas of Sindh suit best to dates crop and that is why dates varieties thrived well and
became cultivars but potential yield has yet not been achieved. However, at present this crop
has become an industry which has engaged thousands of farmers, laborers, traders and
relevant allied services providers. The Balochistan cluster produce quality dates and most of
harvested crop is marketed in other parts of the country and exported as well. It has also been
learnt that the quality dates of Balochistan are also brought in Sukkur market and then after
sorting and proper packaging exported to USA.
The paid visits to the clusters provided an opportunity for in-depth observations of loopholes
of existing industry. During the said visits, meetings with growers and other stakeholders
provided insight about the dates industry of the area. This crop is main source of living to
people engaged in it but the farmers still do not receive the due return from this important crop.
They were not happy with the existing value chain of the crop and marketing facilities. They
were also complaining about unfair marketing system.
For diversification in dates crop it is essential to introduce new cultivars. For export purpose it
is very important to cultivate those varieties which are the demand of targeted international
markets. However, existing cultivars have also potential export commodities but production
technology and value chain is poor. In the Sindh Cluster a large number of small farmers are
engaged in dates cultivation and they produce considerable volume of dates while, their
marketing cost is very high. There no Farmer Enterprise exist to manage inputs in bulk like
pesticides, fertilizers, packaging materials, branding, transportation and marketing of their
small volume produce. The Sindh dates cluster is the most important cluster in terms of both
production and area but no considerable attention has yet been given to this crop. A
considerable volume of dates of both Balochistan and Sindh clusters are exported mainly from
Karachi port. But the current exported volume is relatively small compared to its production.
There are certain limits to increase existing dates production using current technologies but
both horizontal and vertical increase in dates production is possible by adopting modern
production technology and besides this, improvement in product quality and marketing
diversification is also possible. Small presently export of dates to several countries which
include both fresh and dried dates can be enhanced. There is potential for value addition in
dates through improved production, processing, product development and good marketing
practices. Farmers have moderate levels of skills in orchard management with no or less
appropriate technology for harvesting.
5.2.2. Balochistan Dates Clusters
Turbat (focal point of the cluster) after Khairpur produces dates fruit from single largest area
of the country, however, per unit area yield very low. This crop has been grown for more than
200 years. The prominent dates varieties are Muzawti, Begum Jhangi, Karaba, Hussaini,
Gogna, Haleni, and Shaker. With Turbat, as a focal point some other promising areas of dates
growing have also been clustered with this cluster i.e., Punjgur, Awaran and Gwadar. The
main dates cultivar is ‘Begum Jhangi’ which is of small size but possess good taste and
keeping quality. This cultivar is used for industrial purpose and is being exported to the United
States of America from Karachi and Sukkur. If similar industry is established in this cluster the
dates farmers will definitely benefit from this intervention which will ultimately boost this crop.
45 KNOWLEDGE FOR LIFE
There is also enough potential for production enhancement and quality of dates by improving
production technologies and value chain which can increase per unit area yield and improve
quality. Presently most of the harvested crop (in some cases postharvest losses exceed even
50%) is wasted due to absence of value chain and proper marketing of dates. Another reason
is lack of processing of dates that is why it is estimated that 50% of dates fruit is wasted during
the different segments of value chain. At present there a processing unit is being established
at Turbat by the Agriculture & Cooperatives Extension Wing, Balochistan which will indeed
decrease the postharvest losses and increase marketing opportunities.
For quality dates production the climatic conditions of this cluster areas are suited best and
that is why several varieties thrived well and became cultivars. Now, this crop has become an
industry which has engaged thousands of farmers, laborers, traders and relevant allied
services and service providers. The paid visits to this cluster and other clusters provided an
opportunity for in-depth observations of loopholes of this important industry. During the said
visits, meetings with growers and public and private stakeholders provided insight and more
know how about the crop. This crop is main source of living for the people engaged in it but
for last few persistent drought years caused a looming fear over farmers of Turbat and Panjgur
and other areas of Balochistan.
Despite persistent drought and other miseries, the cultivation of dates is increasing in some
areas but the cultivation methods are still conventional which are needed to be changed with
modern cultivation technologies. Even the irrigation methods are not changed i.e., still flooding
method is applied, and farmers have no soil testing ideas nor do they have such any facility in
the area. Fertilizers are used injudiciously and the quality of fertilizer is also compromised. It
is also a fact that fresh cow dung is used in date palm orchards to make soil pulverize but
instead of any benefit from this practice tree roots get polluted and an enemy insect emerges
that destroys the roots of the trees which results in loss of young bearing trees. It has been
observed that in this cluster mostly date trees are not planted with proper layout rather they
are planted on the border of fodder or other field crops meaning thereby that their main crop
is sown in the center while dates tree are planted as a secondary crop. It is also fact that the
farmers rarely apply FYM or fertilizers to the dates trees.
It is pertinent to mention that the growers still plant old varieties which are prevailing in the
cluster for more than last 50-60 years. For diversification in dates crop it is essential to
introduce new varieties. For export purpose it is very important to cultivate those varieties
which are the demand of targeted international markets. In all clusters a large number of small
farmers are engaged in dates cultivation and they produce considerable volume of dates while,
their marketing cost is very high and even there no any platform (enterprise) is available for
collection of their fruit in bulk and presented or marketed these small volumes in better form
and large quantity. It is also a fact that there no such intervention exist that manage inputs in
bulk like pesticides, fertilizers, packing and packaging materials, branding, transportation and
marketing. This is also a fact that small growers work hard in their small orchards for best
quality production which can be an advantage. The above mentioned clusters of dates are
very important in terms of both production and area but no considerable attention has yet been
given to their development.

46 KNOWLEDGE FOR LIFE
5.2.3. Punjab and KP Dates Clusters
The other important dates areas are Muzaffargarh (focal point, D.I. Khan which is
administratively a territory of KP), Jhang and Bhakkar has highest per unit area yield as
compared to above mentioned clusters but far lower than other important dates producing
countries. It is matter of satisfaction that dates grown in Punjab and D.I. Khan’s yield very high
than rest of the country but this can be further improved by introduction of modern production
technologies and new improved local and exotic varieties.
Dates have been grown in this cluster for more than 100 years. The climatic conditions of this
cluster areas suit best to dates crop but very few varieties prevail. In D.I. Khan the ‘Dhakki’
cultivar is very promising and popular for its larger size and pleasant taste. The yellowish color
of this variety is very attractive and most of the fruit is dried (called Chohara) and exported
(The dried dates of Dhakki, 2015).
Despite widespread cultivation of dates in this cluster for last several decades but the
cultivation methods are still conventional which is needed to be changed with modern
cultivation technologies. The irrigation methods are not changed i.e., still flooding method is
prevailing, normally farmers do not get their soil tested from soil laboratories. However, in
Punjab, farmers do have access to soil testing laboratories set up by the Agriculture
Department Research Wing. The application of fertilizers is not done judiciously and the quality
of fertilizer is also compromised.
In spite of these production level deficiencies, the dates have become an industry which has
engaged thousands of farmers, laborers, traders and relevant allied services and service
providers. The harvested quality of dates is marketed in other parts of the country particularly
in Islamabad, Karachi, Peshawar, and Lahore. The dates growers of this area have the
leverage to dispatch their produce to main cities of Punjab like Lahore, Rawalpindi and
Faisalabad. The paid visits to this cluster and other clusters provided an opportunity for in-
depth observations of loopholes of existing industry. During the said visits, meetings with
growers and other stakeholders provided insight about dates crop. This crop is main source
of living to people engaged in it but they do not receive due returns. The dates growing farmers
of this cluster are naturally bestowed with abundant quality river water therefore, water is
plenty and free of cost.
It is also matter of fact that growers of this cluster still plant old varieties which are prevailing
in the cluster for last more than 40 years. For diversification in dates crop it is essential to
introduce new cultivars and for the purpose certified nurseries are needed to be established
in the private sector. While, some good businessmen are doing nursery business very
diligently but need training and support from Agriculture Department and public sector. For
export purpose it is very important to cultivate those varieties which are the demand of targeted
markets. In Muzaffargarh Cluster (including D. I Khan) a large number of small farmers are
engaged in dates cultivation and they produce considerable volume of dates but their
marketing cost is very high while, there no any platform (enterprises) is available for collection
of their produce for presentation or marketing of these small volumes. There no Enterprise for
farmers exist to manage inputs in bulk like pesticides, fertilizers, packaging materials,
branding, transportation of their produce, and marketing. This is fact that small growers work
hard in their small orchards for best quality production which could be an advantage. The
47 KNOWLEDGE FOR LIFE
Punjab cluster of dates is an important cluster in terms of both production and area of Pakistan
but no considerable attention has yet been given to this important crop.
The Punjab cluster (including D.I. Khan) has many advantages like availability of plenty of
water, favorable climate, and available vibrant markets favor this crop. Therefore, special
attention is required to be paid to this crop for its vertical and horizontal production.
5.3. Dates Marketing and Value Chains3
Dates value chain begins from producers and ends when it came into the hands of the final
consumers. The dates of Balochistan are marketed in Karachi and Sukkur markets while the
dates of Sindh, Punjab, and Khyber Pakhtunkhwa are mostly marketed in Sukkur, Karachi,
Islamabad, Lahore and Peshawar markets. The market of Sukkur receives quality dates
supply from Khairpur, Turbat and Punjgur dates, after sorting and processing, are exported to
United States of America where these are further processed.
The relative role of various stakeholders in the chain is given below.
5.3.1. Producers
Date palm cultivation is carried out by large number of producers geographically spread over
all provinces of the country. Dates producers mainly belong to farming families. Majority of the
dates farmers sell the harvesting rights of the dates to pre-harvest contractors at flowering
stage. Very small proportion of producers directly market the produce by themselves.
5.3.2. Pre-harvest contractors
They play key role in marketing of dates in the country. These are mostly local people, to the
farming community but engaged in trading business. They acquire marketing experience
informally --- learning by doing. On the basis on their experience, they decide about where to
sell the produce most profitably. He is also responsible for bearing harvest and post-harvest
losses as well as other market risks.
5.3.3. Commission agents
Commission agents maintain contacts with interregional wholesale markets and possess
comprehensive and accurate information. Commission agents are the principal agency around
which all marketing activities revolve. They perform their activities on commission basis in the
fruits & vegetables markets’ premises and do not accept any type of goods, while selling the
produce brought by producers or contractors. Besides dates, they also deal in other fruits and
vegetables. They are well equipped with telephone, cell phone and other communication
facilities. Though the hardware of commission agents’ shop sized 10 × 12 meters, but
consisted of simple table, a few chairs, a register showing daily transactions and a locker.
However, they possess big stores, sometimes in the market but mostly outside the market.
3 Major proportion of this section is taken from Khushk et al., 2009.
48 KNOWLEDGE FOR LIFE
5.3.4. Wholesalers
They buy and sell large quantities of the farm produce. Usually they perform their business in
wholesale and terminal markets. Besides dates, they deal in several other commodities such
as fruits, vegetables and other agricultural produce within inter-regional markets. In some
cases, they supply produce to processing industries, exporters and retailers. They maintain
their business contracts with commission agents in wholesale markets (for buying purposes)
and retailers of the area (for selling purposes). The buying is mostly done on credit basis,
which is paid back after receiving payments from the retailers.
5.3.5. Retailers
They are the last functionary in the marketing channel of any produce in Pakistan. They gather
small quantities of various produce from different wholesalers in the various markets and sell
small quantities of various items according to the demand of the consumers in the area. They
maintain direct contacts with the consumers and set prices of various commodities/products
on the basis of quality and quantity/packing sizes. A small proportion of retailers are also street
hawkers, who selling their produce by putting on wheel barrow or four-wheeled cart. Now-a-
days, in big cities, some fruits and vegetables retailers also doing their retailing business on
Suzuki carry (loaders) and try to cover large area (ranging from streets and squares in
residential colonies to standing on roadsides.
5.3.6. Auction of Dates
As soon as the dates reaches the market, representative of the contacted commission agent
approaches the truck, ask few questions about whose farm’s the produce is brought and
present it for auction in the market. One or few bags or cartonnes are randomly taken from
the consignment and opened in front of the auctioning participants or the buyers who inspect
its filling layers. Mostly the bag is teared longitudinally so that all the packing from top to bottom
becomes visible, while in case of cartonne, it is either opened entirely or from the side --- for
examining the quality of the material packed in different layers. After the visual (sometimes
tasting the dates) satisfaction, the auction begins from the lowest offer and keep rising till no
further higher offer is announced from the buyers. Then the commission agent (or his
representative) asks the owner, whether he accepts the highest bid offered or not. If he agrees,
then the commodity title is transferred to his name and some token money is paid on spot. In
open auction, the participating buyers are wholesalers, retailers and shopkeepers. Clear price
difference can be observed on the basis of variety, grading, packaging, location of the
production point, the owner of the orchard, stage of the season and timing of the auction.
Generally, early and late season dates as well as period close of Ramadan receive good price.
In secrete auction, the bids are placed in code words or pressing the fingers/rubbing the hands
of the commission by the buyers in different ways. Sometimes the bidders cover his hand and
the hand of the commission agent with a piece of cloth and indicate the offered price with
rubbing the fingers. In secrete auction, producers and contractors do not know the actual price
of their produce, but they must accept the price reported by the commission agent to him.
Secrete auctioning is practiced in two scenarios: i) when the commission agent attempts to
buy the produce by himself, but in the name of some fictitious buyers; ii) when the commission
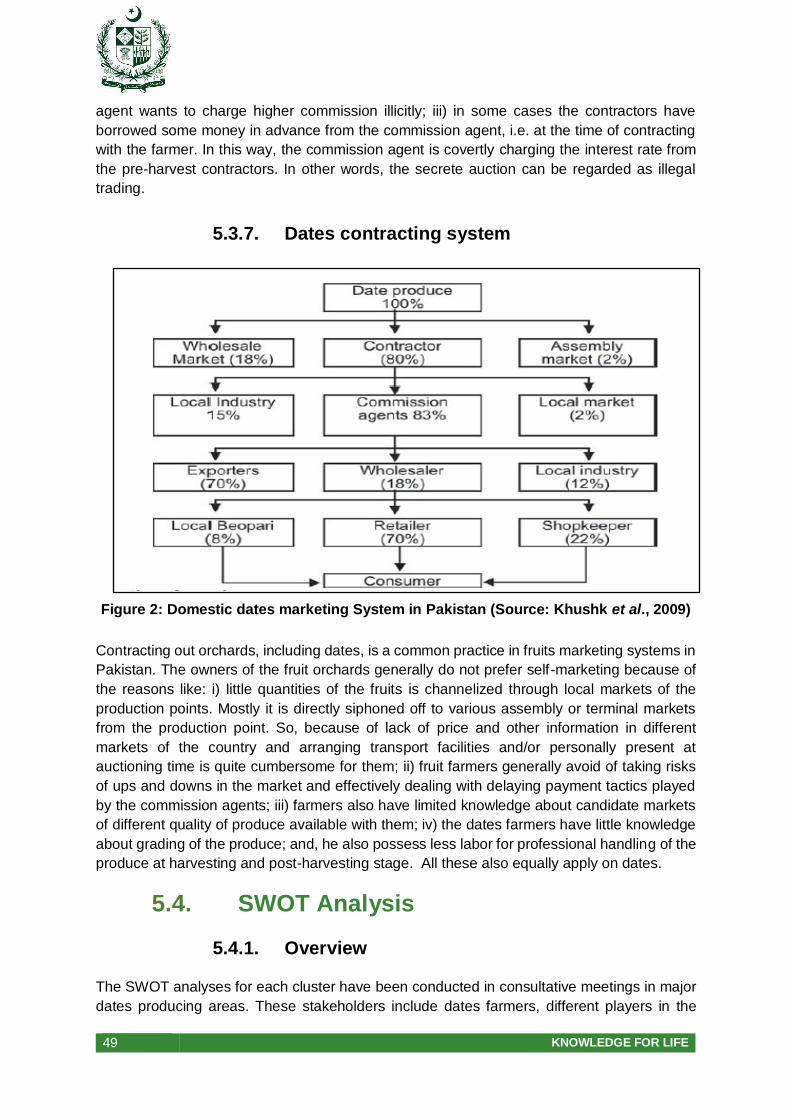
49 KNOWLEDGE FOR LIFE
agent wants to charge higher commission illicitly; iii) in some cases the contractors have
borrowed some money in advance from the commission agent, i.e. at the time of contracting
with the farmer. In this way, the commission agent is covertly charging the interest rate from
the pre-harvest contractors. In other words, the secrete auction can be regarded as illegal
trading.
5.3.7. Dates contracting system
Figure 2: Domestic dates marketing System in Pakistan (Source: Khushk et al., 2009)
Contracting out orchards, including dates, is a common practice in fruits marketing systems in
Pakistan. The owners of the fruit orchards generally do not prefer self-marketing because of
the reasons like: i) little quantities of the fruits is channelized through local markets of the
production points. Mostly it is directly siphoned off to various assembly or terminal markets
from the production point. So, because of lack of price and other information in different
markets of the country and arranging transport facilities and/or personally present at
auctioning time is quite cumbersome for them; ii) fruit farmers generally avoid of taking risks
of ups and downs in the market and effectively dealing with delaying payment tactics played
by the commission agents; iii) farmers also have limited knowledge about candidate markets
of different quality of produce available with them; iv) the dates farmers have little knowledge
about grading of the produce; and, he also possess less labor for professional handling of the
produce at harvesting and post-harvesting stage. All these also equally apply on dates.
5.4. SWOT Analysis
5.4.1. Overview
The SWOT analyses for each cluster have been conducted in consultative meetings in major
dates producing areas. These stakeholders include dates farmers, different players in the
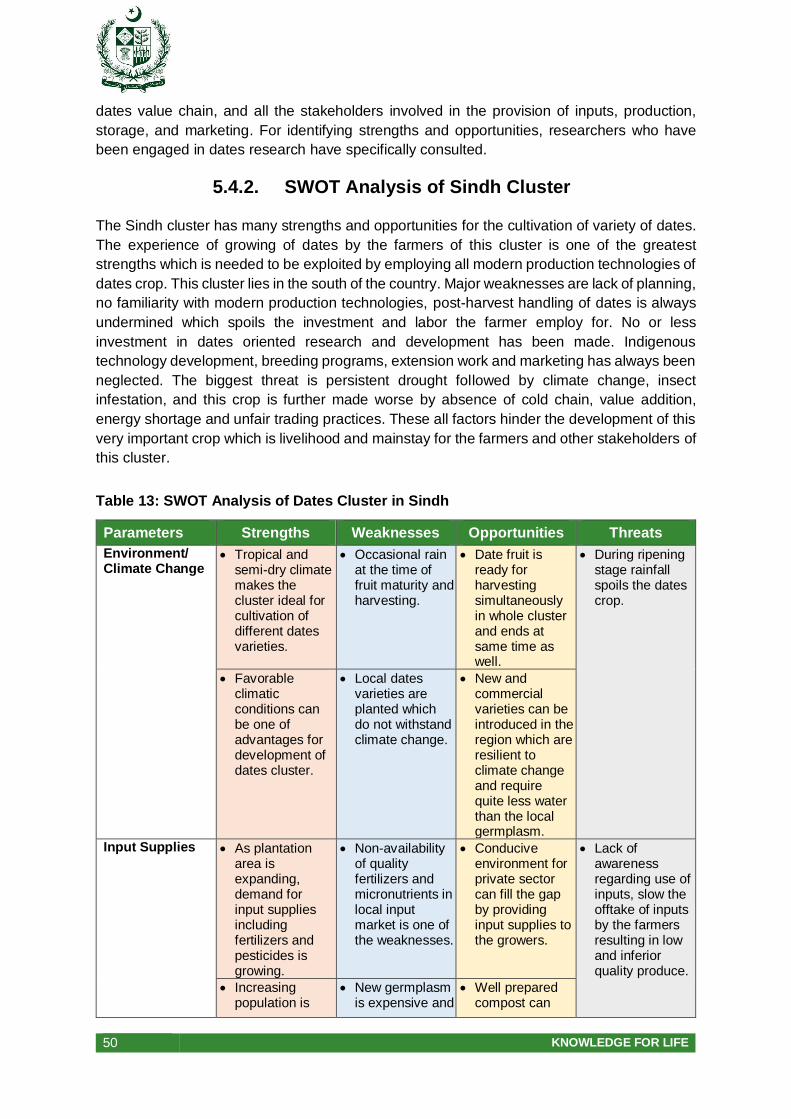
50 KNOWLEDGE FOR LIFE
dates value chain, and all the stakeholders involved in the provision of inputs, production,
storage, and marketing. For identifying strengths and opportunities, researchers who have
been engaged in dates research have specifically consulted.
5.4.2. SWOT Analysis of Sindh Cluster
The Sindh cluster has many strengths and opportunities for the cultivation of variety of dates.
The experience of growing of dates by the farmers of this cluster is one of the greatest
strengths which is needed to be exploited by employing all modern production technologies of
dates crop. This cluster lies in the south of the country. Major weaknesses are lack of planning,
no familiarity with modern production technologies, post-harvest handling of dates is always
undermined which spoils the investment and labor the farmer employ for. No or less
investment in dates oriented research and development has been made. Indigenous
technology development, breeding programs, extension work and marketing has always been
neglected. The biggest threat is persistent drought followed by climate change, insect
infestation, and this crop is further made worse by absence of cold chain, value addition,
energy shortage and unfair trading practices. These all factors hinder the development of this
very important crop which is livelihood and mainstay for the farmers and other stakeholders of
this cluster.
Table 13: SWOT Analysis of Dates Cluster in Sindh
Parameters Strengths Weaknesses Opportunities Threats
Environment/ Climate Change
Tropical and semi-dry climate makes the cluster ideal for cultivation of different dates varieties.
Occasional rain at the time of fruit maturity and harvesting.
Date fruit is ready for harvesting simultaneously in whole cluster and ends at same time as well.
During ripening stage rainfall spoils the dates crop.
Favorable climatic conditions can be one of advantages for development of dates cluster.
Local dates varieties are planted which do not withstand climate change.
New and commercial varieties can be introduced in the region which are resilient to climate change and require quite less water than the local germplasm.
Input Supplies As plantation area is expanding, demand for input supplies including fertilizers and pesticides is growing.
Non-availability of quality fertilizers and micronutrients in local input market is one of the weaknesses.
Conducive environment for private sector can fill the gap by providing input supplies to the growers.
Lack of awareness regarding use of inputs, slow the offtake of inputs by the farmers resulting in low and inferior quality produce.
Increasing population is
New germplasm is expensive and
Well prepared compost can
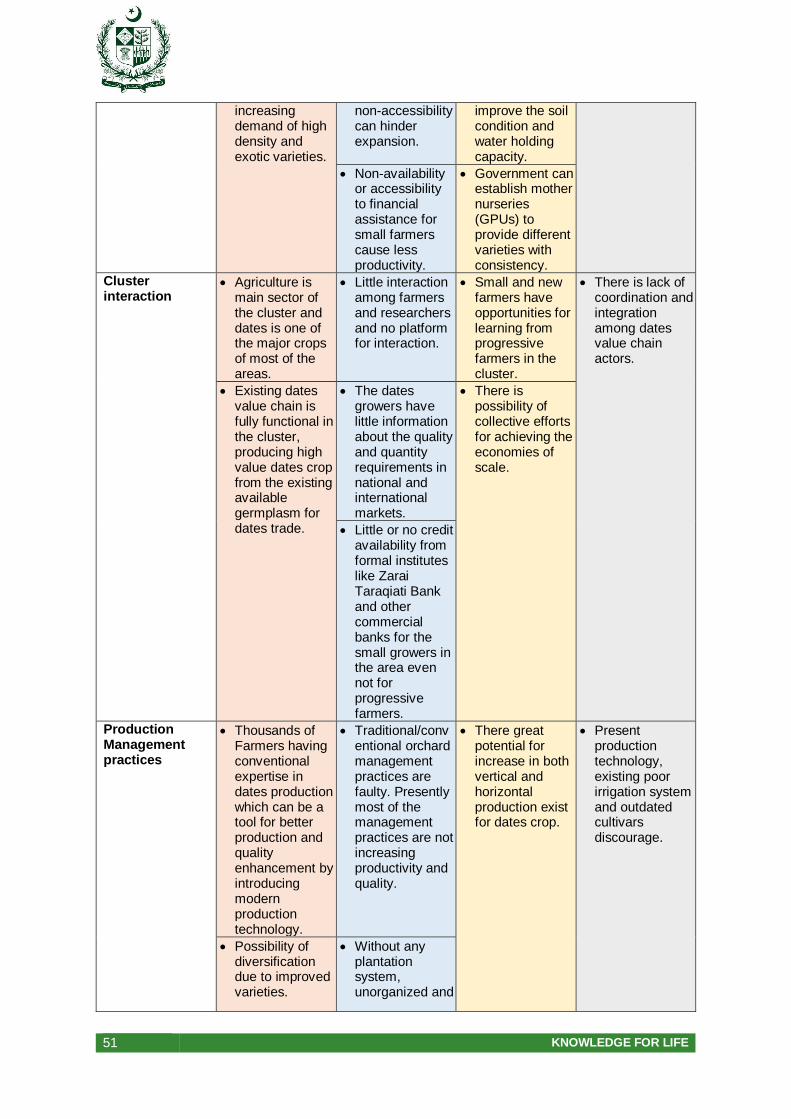
51 KNOWLEDGE FOR LIFE
increasing demand of high density and exotic varieties.
non-accessibility can hinder expansion.
improve the soil condition and water holding capacity.
Non-availability or accessibility to financial assistance for small farmers cause less productivity.
Government can establish mother nurseries (GPUs) to provide different varieties with consistency.
Cluster interaction
Agriculture is main sector of the cluster and dates is one of the major crops of most of the areas.
Little interaction among farmers and researchers and no platform for interaction.
Small and new farmers have opportunities for learning from progressive farmers in the cluster.
There is lack of coordination and integration among dates value chain actors.
Existing dates value chain is fully functional in the cluster, producing high value dates crop from the existing available germplasm for dates trade.
The dates growers have little information about the quality and quantity requirements in national and international markets.
There is possibility of collective efforts for achieving the economies of scale.
Little or no credit availability from formal institutes like Zarai Taraqiati Bank and other commercial banks for the small growers in the area even not for progressive farmers.
Production Management practices
Thousands of Farmers having conventional expertise in dates production which can be a tool for better production and quality enhancement by introducing modern production technology.
Traditional/conventional orchard management practices are faulty. Presently most of the management practices are not increasing productivity and quality.
There great potential for increase in both vertical and horizontal production exist for dates crop.
Present production technology, existing poor irrigation system and outdated cultivars discourage.
Possibility of diversification due to improved varieties.
Without any plantation system, unorganized and

52 KNOWLEDGE FOR LIFE
mixed plantation in orchards.
There is potential to handle the challenge of existing per unit area yield, which can increase production by many fold.
Lack of concentration on soil health improvement and less than optimal dose of fertilizers.
There are opportunities for private sector to provide extension services. Service Providers can also be an opportunity.
Pre- and post-harvest losses due to lack of skills and infrastructure (storage facilities) cause wastage i.e., nearly 40% of total production
Transportation The cluster has the strength to supply the produce to any part of the country. In future CPEC is also an opportunity.
The conditions of existing access roads to main high ways are not good.
Availability of paper boxes (corrugated) in the market already being used in other fruits and currently being used for packing the dates.
Floods during monsoon season cause blockage of roads which hamper produce supply and destroy the produce as well.
No existence of cold chain system. No temperature, humidity and proper transportation system.
High transportation cost and fluctuation in transportation fares.
Quality dates are produced and presentation can be improved.
The cluster is dates producing center but without any cold chain and cold storage.
Marketing Existing marketing potentials are encouraging to fetch good prices for quality dates of the cluster.
Dates growers sell their produce at throw away prices due to unawareness of high value market. No MIS.
Contract system has the potential to manage quality produce flow in the market with the help of commission agents’ financial support.
Small farmers have reservations against high value markets.
No grading system exists and fruit is packed with A grade at top
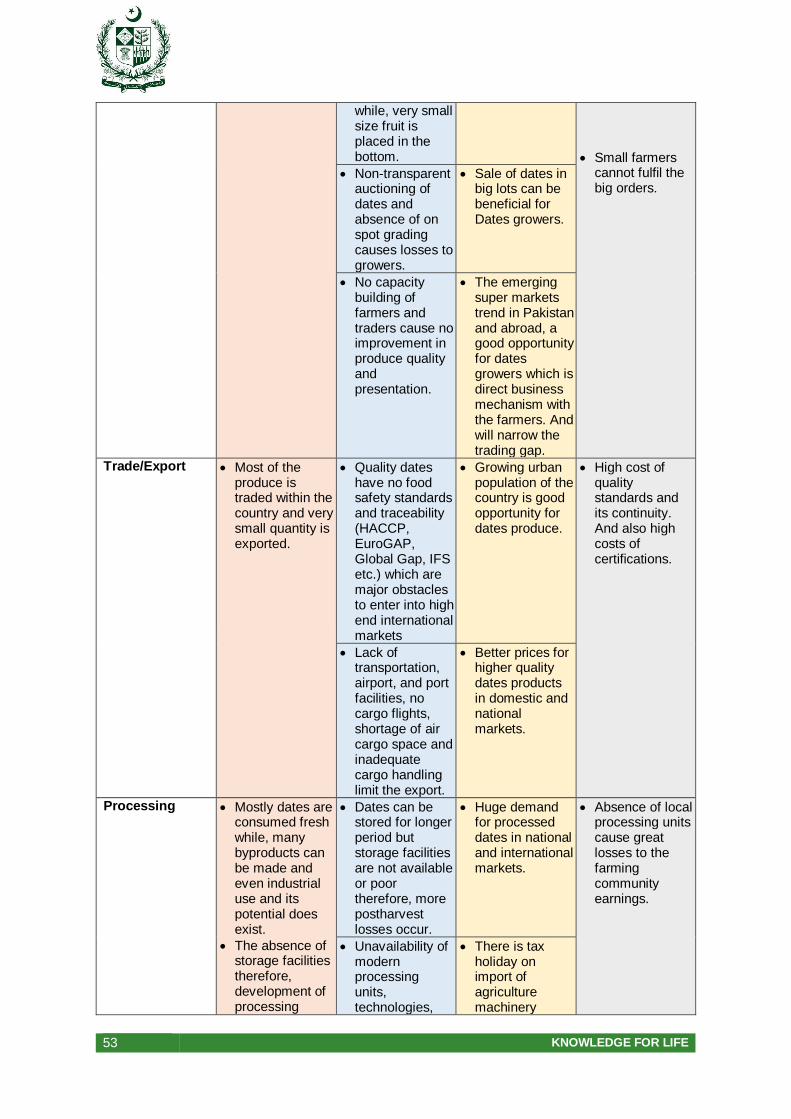
53 KNOWLEDGE FOR LIFE
while, very small size fruit is placed in the bottom.
Small farmers cannot fulfil the big orders.
Non-transparent auctioning of dates and absence of on spot grading causes losses to growers.
Sale of dates in big lots can be beneficial for Dates growers.
No capacity building of farmers and traders cause no improvement in produce quality and presentation.
The emerging super markets trend in Pakistan and abroad, a good opportunity for dates growers which is direct business mechanism with the farmers. And will narrow the trading gap.
Trade/Export Most of the produce is traded within the country and very small quantity is exported.
Quality dates have no food safety standards and traceability (HACCP, EuroGAP, Global Gap, IFS etc.) which are major obstacles to enter into high end international markets
Growing urban population of the country is good opportunity for dates produce.
High cost of quality standards and its continuity. And also high costs of certifications.
Lack of transportation, airport, and port facilities, no cargo flights, shortage of air cargo space and inadequate cargo handling limit the export.
Better prices for higher quality dates products in domestic and national markets.
Processing Mostly dates are consumed fresh while, many byproducts can be made and even industrial use and its potential does exist.
The absence of storage facilities therefore, development of processing
Dates can be stored for longer period but storage facilities are not available or poor therefore, more postharvest losses occur.
Huge demand for processed dates in national and international markets.
Absence of local processing units cause great losses to the farming community earnings.
Unavailability of modern processing units, technologies,
There is tax holiday on import of agriculture machinery
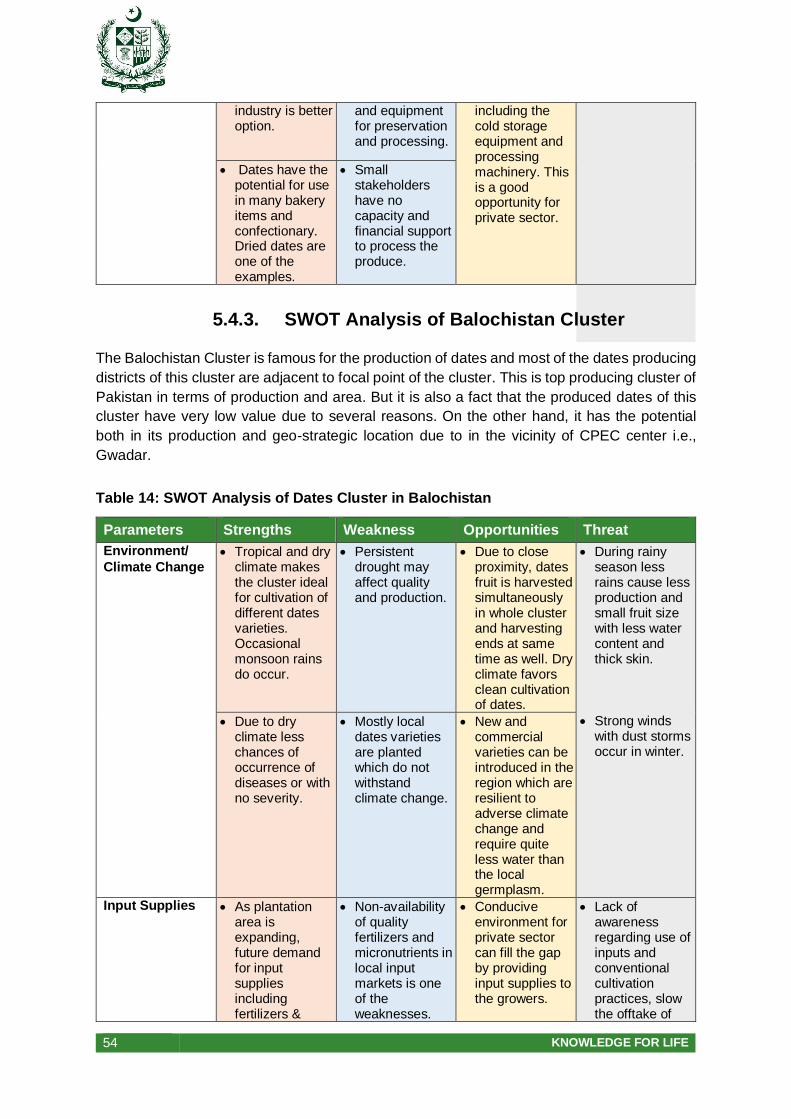
54 KNOWLEDGE FOR LIFE
industry is better option.
and equipment for preservation and processing.
including the cold storage equipment and processing machinery. This is a good opportunity for private sector.
Dates have the potential for use in many bakery items and confectionary. Dried dates are one of the examples.
Small stakeholders have no capacity and financial support to process the produce.
5.4.3. SWOT Analysis of Balochistan Cluster
The Balochistan Cluster is famous for the production of dates and most of the dates producing
districts of this cluster are adjacent to focal point of the cluster. This is top producing cluster of
Pakistan in terms of production and area. But it is also a fact that the produced dates of this
cluster have very low value due to several reasons. On the other hand, it has the potential
both in its production and geo-strategic location due to in the vicinity of CPEC center i.e.,
Gwadar.
Table 14: SWOT Analysis of Dates Cluster in Balochistan
Parameters Strengths Weakness Opportunities Threat
Environment/
Climate Change Tropical and dry
climate makes the cluster ideal for cultivation of different dates varieties. Occasional monsoon rains do occur.
Persistent drought may affect quality and production.
Due to close proximity, dates fruit is harvested simultaneously in whole cluster and harvesting ends at same time as well. Dry climate favors clean cultivation of dates.
During rainy season less rains cause less production and small fruit size with less water content and thick skin.
Strong winds with dust storms occur in winter.
Due to dry climate less chances of occurrence of diseases or with no severity.
Mostly local dates varieties are planted which do not withstand climate change.
New and commercial varieties can be introduced in the region which are resilient to adverse climate change and require quite less water than the local germplasm.
Input Supplies As plantation area is expanding, future demand for input supplies including fertilizers &
Non-availability of quality fertilizers and micronutrients in local input markets is one of the weaknesses.
Conducive environment for private sector can fill the gap by providing input supplies to the growers.
Lack of awareness regarding use of inputs and conventional cultivation practices, slow the offtake of
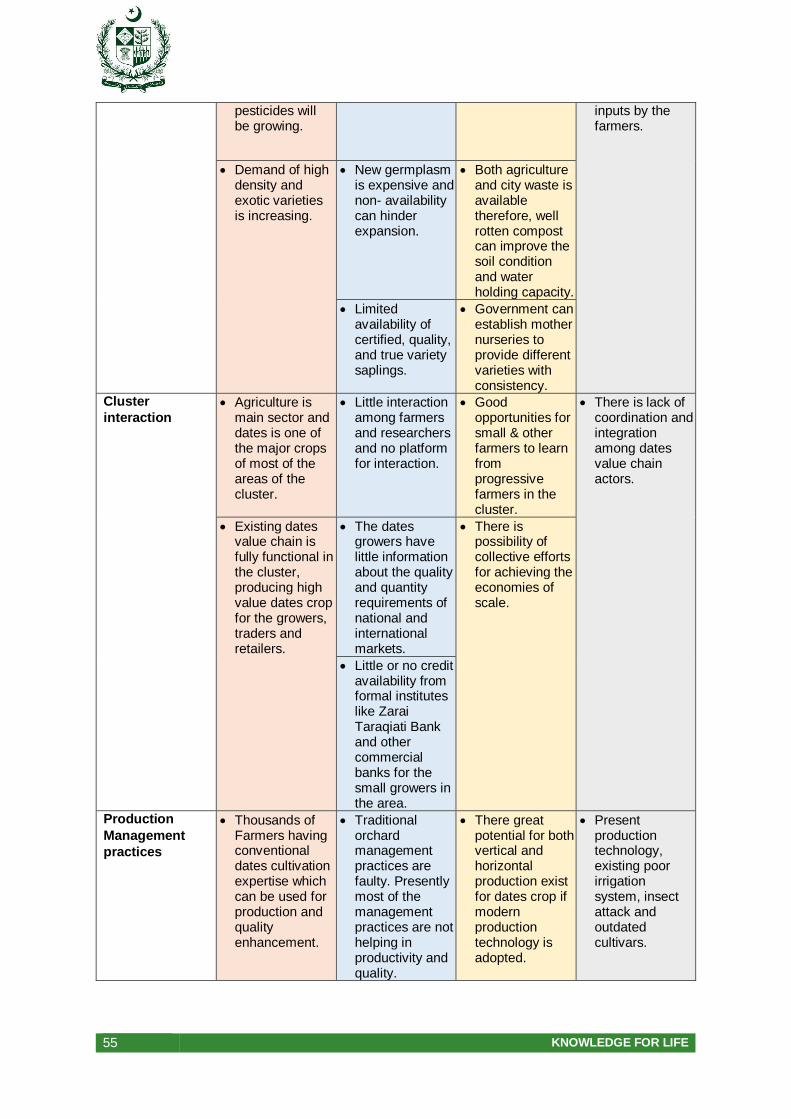
55 KNOWLEDGE FOR LIFE
pesticides will be growing.
inputs by the farmers.
Demand of high density and exotic varieties is increasing.
New germplasm is expensive and non- availability can hinder expansion.
Both agriculture and city waste is available therefore, well rotten compost can improve the soil condition and water holding capacity.
Limited availability of certified, quality, and true variety saplings.
Government can establish mother nurseries to provide different varieties with consistency.
Cluster
interaction Agriculture is
main sector and dates is one of the major crops of most of the areas of the cluster.
Little interaction among farmers and researchers and no platform for interaction.
Good opportunities for small & other farmers to learn from progressive farmers in the cluster.
There is lack of coordination and integration among dates value chain actors.
Existing dates value chain is fully functional in the cluster, producing high value dates crop for the growers, traders and retailers.
The dates growers have little information about the quality and quantity requirements of national and international markets.
There is possibility of collective efforts for achieving the economies of scale.
Little or no credit availability from formal institutes like Zarai Taraqiati Bank and other commercial banks for the small growers in the area.
Production
Management
practices
Thousands of Farmers having conventional dates cultivation expertise which can be used for production and quality enhancement.
Traditional orchard management practices are faulty. Presently most of the management practices are not helping in productivity and quality.
There great potential for both vertical and horizontal production exist for dates crop if modern production technology is adopted.
Present production technology, existing poor irrigation system, insect attack and outdated cultivars.

56 KNOWLEDGE FOR LIFE
Possibility of diversification in improved varieties.
Dates are planted without any system or unorganized and mixed plantation in orchards.
There is potential in coping up with the challenge of existing per unit area yield that increasing by many fold through modern production technology.
Lack of soil health improvement or less than optimal dose of fertilizer.
There are opportunities for private sector to provide extension services such as service Providers can also be an opportunity and other allied services.
Pre- and post-harvest losses due to lack of skills and infrastructure (storage facilities); losses/wastages are nearly 40% of total production
Transportation The cluster has the strength to supply the produce to any part of the country. In future CPEC is also an opportunity.
Existing access roads to main high ways condition is not good.
Availability of paper boxes (cartons) in the market already being used in some other fruits and currently being used for packing the dates in small scale.
Floods during monsoon season cause blockage of roads which hamper produce supply and destroy the produce as well.
No existence of cold chain system. No maintenance/control of temperature, humidity and proper transportation system.
High transportation cost and fluctuation in transportation fares.
Quality dates are produced and presentation can be improved.
The cluster is dates producing center but without any cold chain and almost no cold storage facility.
Marketing Existing markets have potentials for better returns but improved practices and fair business environment can fetch good
Dates growers sell their produce at throw away prices due to unawareness of high value market. No Market
Contract system has the potential to manage quality produce flow in the market with the help of commission
Small farmers have reservations against high value markets.
Their produce is always ignored.
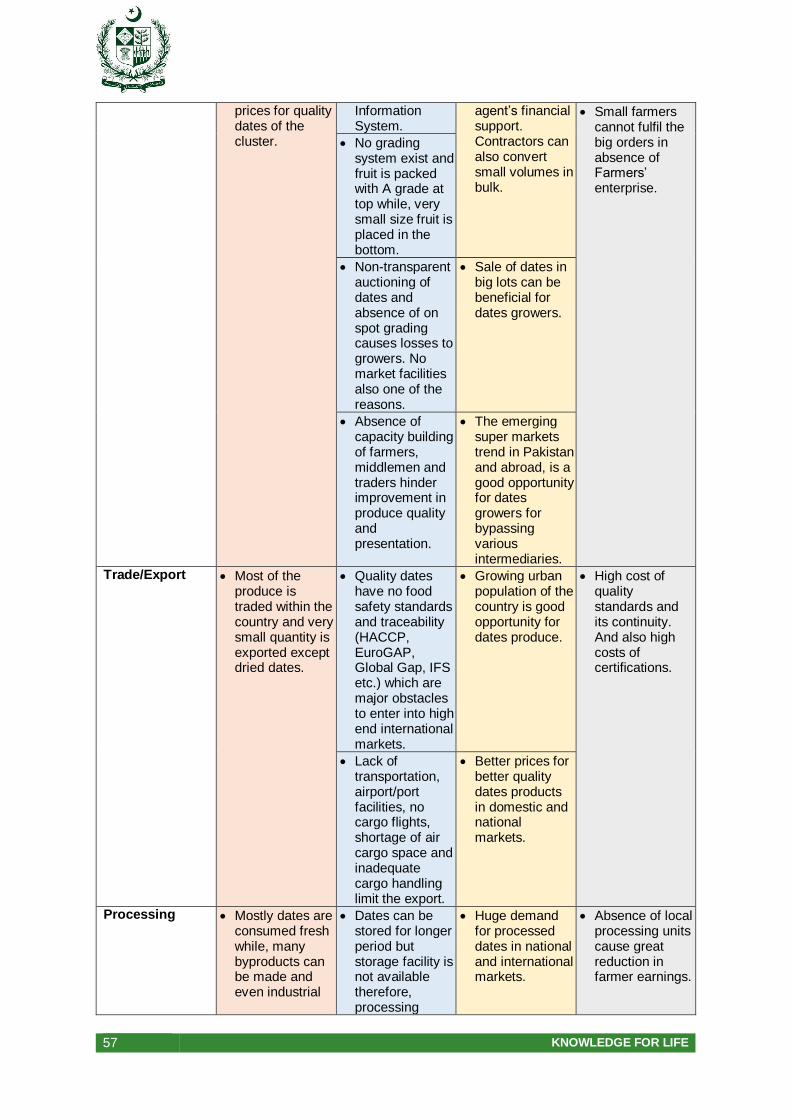
57 KNOWLEDGE FOR LIFE
prices for quality dates of the cluster.
Information System.
agent’s financial support. Contractors can also convert small volumes in bulk.
Small farmers cannot fulfil the big orders in absence of Farmers’ enterprise.
No grading system exist and fruit is packed with A grade at top while, very small size fruit is placed in the bottom.
Non-transparent auctioning of dates and absence of on spot grading causes losses to growers. No market facilities also one of the reasons.
Sale of dates in big lots can be beneficial for dates growers.
Absence of capacity building of farmers, middlemen and traders hinder improvement in produce quality and presentation.
The emerging super markets trend in Pakistan and abroad, is a good opportunity for dates growers for bypassing various intermediaries.
Trade/Export Most of the produce is traded within the country and very small quantity is exported except dried dates.
Quality dates have no food safety standards and traceability (HACCP, EuroGAP, Global Gap, IFS etc.) which are major obstacles to enter into high end international markets.
Growing urban population of the country is good opportunity for dates produce.
High cost of quality standards and its continuity. And also high costs of certifications.
Lack of transportation, airport/port facilities, no cargo flights, shortage of air cargo space and inadequate cargo handling limit the export.
Better prices for better quality dates products in domestic and national markets.
Processing Mostly dates are consumed fresh while, many byproducts can be made and even industrial
Dates can be stored for longer period but storage facility is not available therefore, processing
Huge demand for processed dates in national and international markets.
Absence of local processing units cause great reduction in farmer earnings.
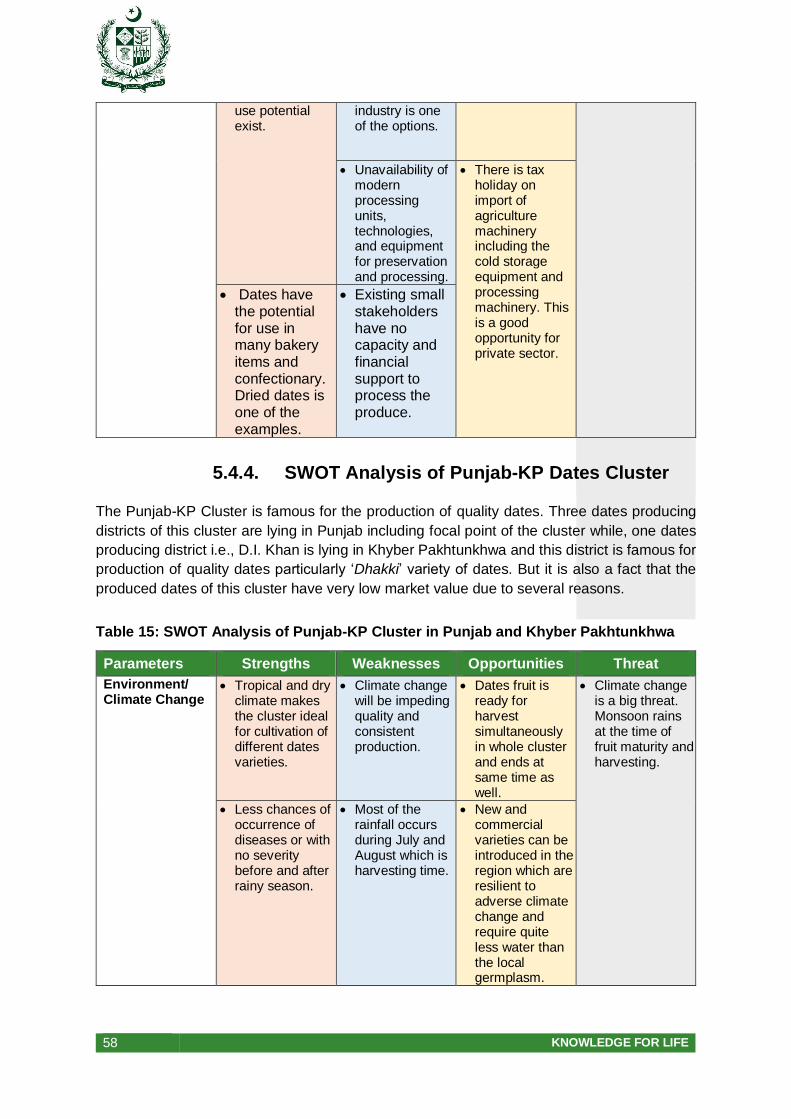
58 KNOWLEDGE FOR LIFE
use potential exist.
industry is one of the options.
Unavailability of modern processing units, technologies, and equipment for preservation and processing.
There is tax holiday on import of agriculture machinery including the cold storage equipment and processing machinery. This is a good opportunity for private sector.
Dates have the potential for use in many bakery items and confectionary. Dried dates is one of the examples.
Existing small stakeholders have no capacity and financial support to process the produce.
5.4.4. SWOT Analysis of Punjab-KP Dates Cluster
The Punjab-KP Cluster is famous for the production of quality dates. Three dates producing
districts of this cluster are lying in Punjab including focal point of the cluster while, one dates
producing district i.e., D.I. Khan is lying in Khyber Pakhtunkhwa and this district is famous for
production of quality dates particularly ‘Dhakki’ variety of dates. But it is also a fact that the
produced dates of this cluster have very low market value due to several reasons.
Table 15: SWOT Analysis of Punjab-KP Cluster in Punjab and Khyber Pakhtunkhwa
Parameters Strengths Weaknesses Opportunities Threat
Environment/ Climate Change
Tropical and dry climate makes the cluster ideal for cultivation of different dates varieties.
Climate change will be impeding quality and consistent production.
Dates fruit is ready for harvest simultaneously in whole cluster and ends at same time as well.
Climate change is a big threat. Monsoon rains at the time of fruit maturity and harvesting.
Less chances of occurrence of diseases or with no severity before and after rainy season.
Most of the rainfall occurs during July and August which is harvesting time.
New and commercial varieties can be introduced in the region which are resilient to adverse climate change and require quite less water than the local germplasm.
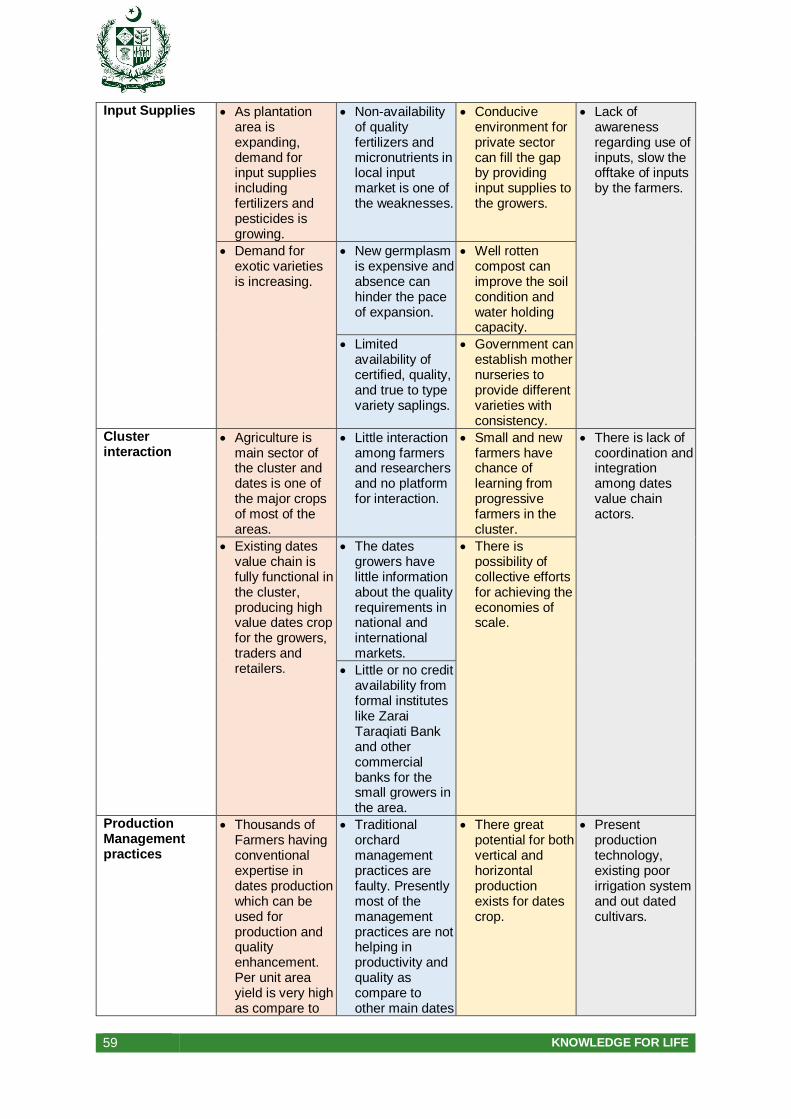
59 KNOWLEDGE FOR LIFE
Input Supplies As plantation area is expanding, demand for input supplies including fertilizers and pesticides is growing.
Non-availability of quality fertilizers and micronutrients in local input market is one of the weaknesses.
Conducive environment for private sector can fill the gap by providing input supplies to the growers.
Lack of awareness regarding use of inputs, slow the offtake of inputs by the farmers.
Demand for exotic varieties is increasing.
New germplasm is expensive and absence can hinder the pace of expansion.
Well rotten compost can improve the soil condition and water holding capacity.
Limited availability of certified, quality, and true to type variety saplings.
Government can establish mother nurseries to provide different varieties with consistency.
Cluster interaction
Agriculture is main sector of the cluster and dates is one of the major crops of most of the areas.
Little interaction among farmers and researchers and no platform for interaction.
Small and new farmers have chance of learning from progressive farmers in the cluster.
There is lack of coordination and integration among dates value chain actors.
Existing dates value chain is fully functional in the cluster, producing high value dates crop for the growers, traders and retailers.
The dates growers have little information about the quality requirements in national and international markets.
There is possibility of collective efforts for achieving the economies of scale.
Little or no credit availability from formal institutes like Zarai Taraqiati Bank and other commercial banks for the small growers in the area.
Production Management practices
Thousands of Farmers having conventional expertise in dates production which can be used for production and quality enhancement. Per unit area yield is very high as compare to
Traditional orchard management practices are faulty. Presently most of the management practices are not helping in productivity and quality as compare to other main dates
There great potential for both vertical and horizontal production exists for dates crop.
Present production technology, existing poor irrigation system and out dated cultivars.
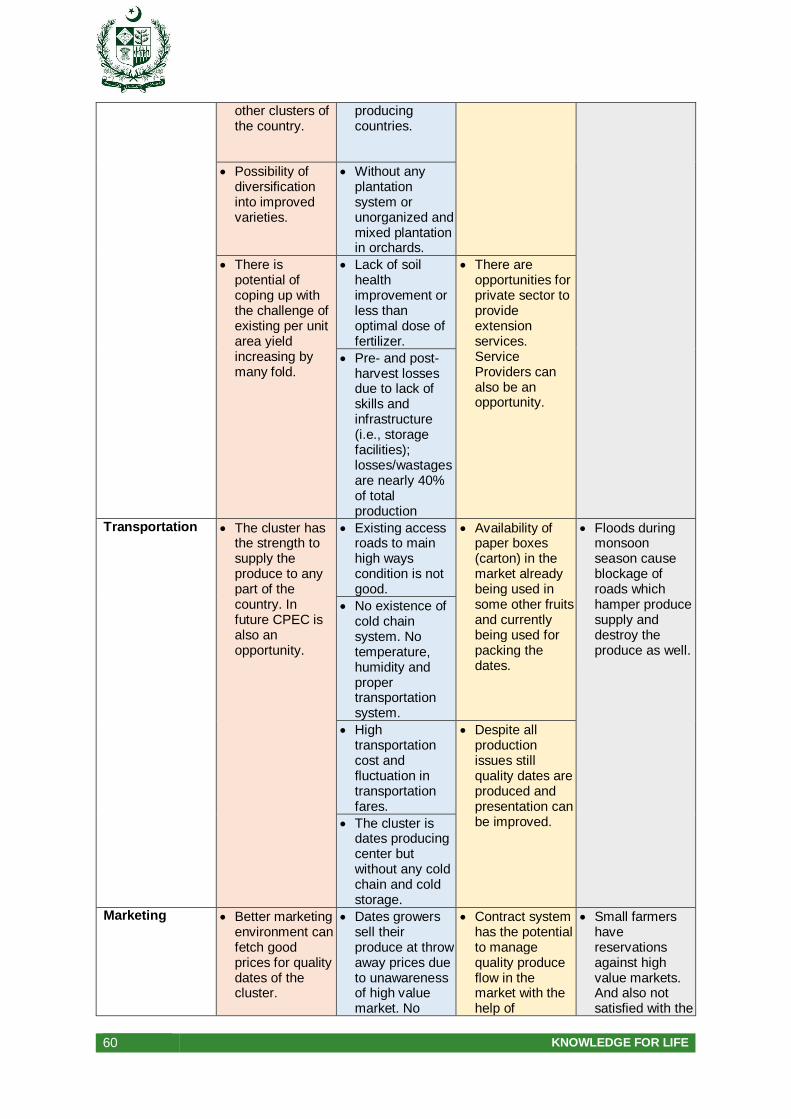
60 KNOWLEDGE FOR LIFE
other clusters of the country.
producing countries.
Possibility of diversification into improved varieties.
Without any plantation system or unorganized and mixed plantation in orchards.
There is potential of coping up with the challenge of existing per unit area yield increasing by many fold.
Lack of soil health improvement or less than optimal dose of fertilizer.
There are opportunities for private sector to provide extension services. Service Providers can also be an opportunity.
Pre- and post-harvest losses due to lack of skills and infrastructure (i.e., storage facilities); losses/wastages are nearly 40% of total production
Transportation The cluster has the strength to supply the produce to any part of the country. In future CPEC is also an opportunity.
Existing access roads to main high ways condition is not good.
Availability of paper boxes (carton) in the market already being used in some other fruits and currently being used for packing the dates.
Floods during monsoon season cause blockage of roads which hamper produce supply and destroy the produce as well.
No existence of cold chain system. No temperature, humidity and proper transportation system.
High transportation cost and fluctuation in transportation fares.
Despite all production issues still quality dates are produced and presentation can be improved. The cluster is
dates producing center but without any cold chain and cold storage.
Marketing Better marketing environment can fetch good prices for quality dates of the cluster.
Dates growers sell their produce at throw away prices due to unawareness of high value market. No
Contract system has the potential to manage quality produce flow in the market with the help of
Small farmers have reservations against high value markets. And also not satisfied with the
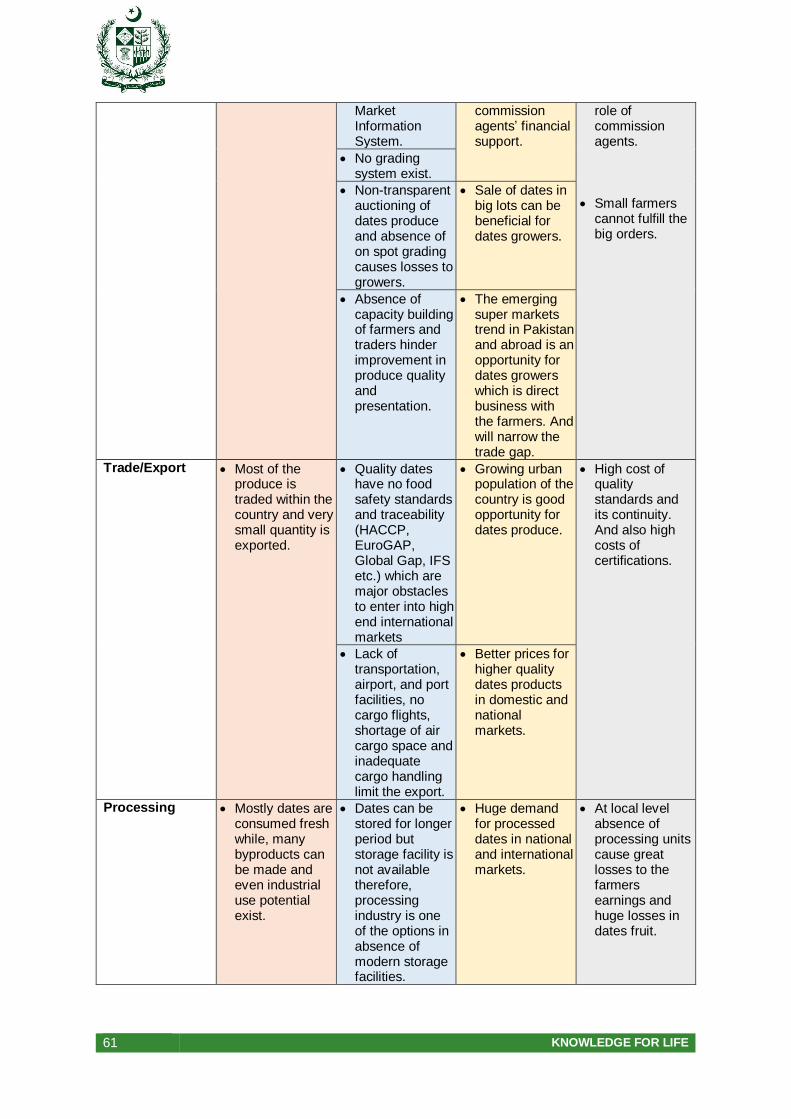
61 KNOWLEDGE FOR LIFE
Market Information System.
commission agents’ financial support.
role of commission agents.
Small farmers cannot fulfill the big orders.
No grading system exist.
Non-transparent auctioning of dates produce and absence of on spot grading causes losses to growers.
Sale of dates in big lots can be beneficial for dates growers.
Absence of capacity building of farmers and traders hinder improvement in produce quality and presentation.
The emerging super markets trend in Pakistan and abroad is an opportunity for dates growers which is direct business with the farmers. And will narrow the trade gap.
Trade/Export Most of the produce is traded within the country and very small quantity is exported.
Quality dates have no food safety standards and traceability (HACCP, EuroGAP, Global Gap, IFS etc.) which are major obstacles to enter into high end international markets
Growing urban population of the country is good opportunity for dates produce.
High cost of quality standards and its continuity. And also high costs of certifications.
Lack of transportation, airport, and port facilities, no cargo flights, shortage of air cargo space and inadequate cargo handling limit the export.
Better prices for higher quality dates products in domestic and national markets.
Processing Mostly dates are consumed fresh while, many byproducts can be made and even industrial use potential exist.
Dates can be stored for longer period but storage facility is not available therefore, processing industry is one of the options in absence of modern storage facilities.
Huge demand for processed dates in national and international markets.
At local level absence of processing units cause great losses to the farmers earnings and huge losses in dates fruit.
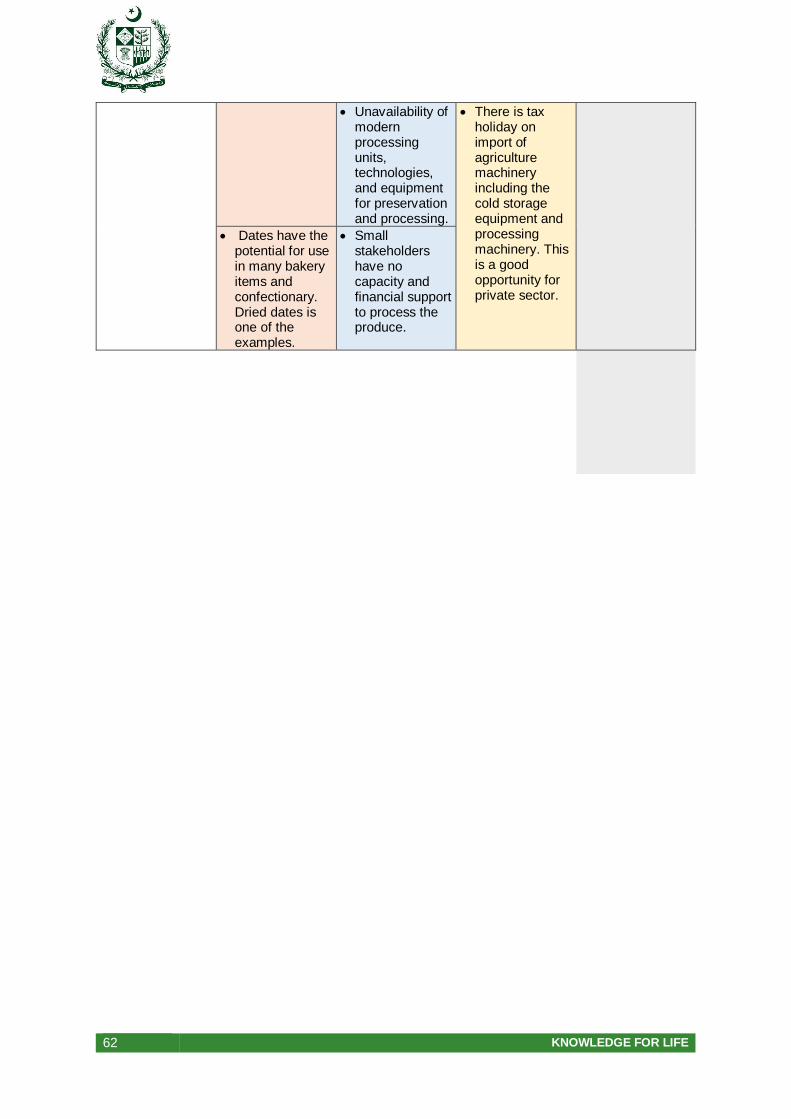
62 KNOWLEDGE FOR LIFE
Unavailability of modern processing units, technologies, and equipment for preservation and processing.
There is tax holiday on import of agriculture machinery including the cold storage equipment and processing machinery. This is a good opportunity for private sector.
Dates have the potential for use in many bakery items and confectionary. Dried dates is one of the examples.
Small stakeholders have no capacity and financial support to process the produce.
63 KNOWLEDGE FOR LIFE
6. CHALLENGES FACED BY THE CLUSTERS
6.1. Climate Change and Water Shortage
All the three dates clusters of Pakistan are identical in many ways while differences and varied
modes of opportunities do also exist. The foremost similarity is the climate which suits to dates
cultivation in most areas of these clusters. However, climate change is a near future threat
and in this regard as scientists say that climate change related issues will further augment in
future. On average most of the areas of these clusters are growing dates for more than a
century. But after such a long time cultivation experience, these clusters still could not
overcome the issues faced by the dates industry of these clusters. Both more or less rains
cause drastic reduction in production of dates and this is due to climate change and it is
estimated that in coming future Pakistan will receive more rains than past i.e., changes in
rainfall patterns (Saifullah, 2017).
One common constraint faced by this crop in these clusters is imposed by nature i.e., water
scarcity, flooding and limited land resource. The Punjab-KP Cluster is blessed with plenty of
water mainly from canal system, but lifting of water from subsurface is beoming expensive. In
Balochistan dates cluster, non-availability of surface irrigation water is major hindrance to
enhance its production. In this cluster, the available of water is precious with no access to
canal/Kareez water and limited ground water and its expensive extracted through wells and
tube wells. Thus dates crop is dependent on seasonal rains. For revolutionary changes and
development in dates industry it is imperative to introduce high efficiency irrigation systems,
new varieties and solar system for water extraction. This fear is common in all the stakeholders
in Balochistan that solar energy system will extract the whole remaining aquifer water. The
reply to the said fear is, above mentioned interventions.
The orchards in Sindh dates cluster are irrigated with Rohri Right Bank Canal, which has
relatively low cost. In addition to water shortage, dates clusters may face the challenge of new
insects and diseases and shift in crop cycle in future due to climate change,.
6.2. Weak Research and Extension
In Punjab, Sindh, KP and Balochistan, a setup on dates research do exist generally under the
provincial Agriculture Research Institutes.
1. Arid Zone Research Institute, Bhakkar, Punjab and Horticultural Research Institute at
Bahawalpur, Punjab do conduct some research on Dates. This research institutes are
working on development of new dates varieties and production technologies of existing
varieties. At present a project is being implemented for introduction of new exotic
varieties which will after adoptability these varieties will certainly contribute in future
quality production of this crop. At Bahawalpur Research Institute about 40 varieties
including 21 exotic ones are available.
64 KNOWLEDGE FOR LIFE
2. The Khairpur and Sukkar areas of Sindh are main dates growing area. The Date Palm
Research Institute at Khairpur is working on dates research. The Aseel vaierty of dates
of this cluster is very popular for its size and taste.
3. The Directorates of Agriculture Research at Turbat, Panjgur and Kharan, in
Balochistan. These directorates are involved in research on different aspects of dates
crop. As there more than 60 different dates varieties are available at the farms of these
directorates, and which require more research and investment on this crop for
enhancement of quality production of dates. Especially, Mozawati and Begum Jhangi
varieties have remarkable potentials which need to be given priority. These
directorates are involved in dissemination of research outcomes to the dates growers
of the respective areas. New exotic varieties are also being tested at the farms of these
directorates.
4. The KP province has only one dates district i.e., Dera Ismail Khan which is famous for
Dhakki variety of dates. This dates district is served by Agriculture Research Institute,
Dera Ismail Khan. This institute is working on development of varieties and nursery
raising technologies.
Among all the above institutes, the date palm research is relatively more advanced at Date
Palm Research Institute, Khairpur, while at other institutes/stations, there is not much research
on standardizing the improved dates management practices by variety especially on
harvesting and input use. Moreover, research on dates value chain is almost completely
missing. There is a need to develop protocols on harvesting, grading, packing, drying,
transportation, storage, etc. This will certainly minimize the postharvest losses and better
marketing of the commodity. But prior to these measures like modern production technologies
for dates and both latest and conventional breeding programs are necessary. Moreover,
protocols for tissue culture production of dates nursery need to be developed urgently. This is
necessary to expand the area under dates. Capacity building of researchers will play key role
in the development of dates industry/clusters.
In addition there is little capacity of the provincial extension system to guide farmers in quality
dates production, and its handling along the value chain. It is also a fact that research institutes
are not generating that much data and information on production technologies meant for
transfer technology. Moreover, little support is available on how to set up and run the quality
value chain infrastructure. As the economics and marketing system is maintained on extension
side in some provinces so, MIS (market information system) is needed to be strengthened.
6.3. Constraints at the Production Level
Different provincial Agriculture Departments have introduced several new and exotic dates
varieties in all three Dates clusters but only a few varieties prevail in farmers’ orchard. With
the passage of time, varieties loose or degrade their yielding and quality potentials. To
replenish the orchards, high yielding germplasm is very essential while, currently dates
industry lack such ability due to absence of any such mechanism of varietal replacement.
After the 18th amendment to the constitution of Pakistan, like many other departments,
agriculture has also become a provincial subject. Therefore, the Agriculture Departments have
65 KNOWLEDGE FOR LIFE
the responsibility and mandate to prioritize the research and development for the
underdeveloped dates industry. Contrary to increased burden on the provincial research
system, research institutes receive very little budget for operational purposes which has further
dwindled after devolution. There are highly qualified researchers in these institutes but lack of
funds make them idle. Hence, management practices for dates could not be standardized so
far, although extension system is available moderately in every cluster.
There are a number of problems and limitations for the development of date palm industry
ranging from production to harvesting, processing and packaging. However, the problems vary
among the four provinces. Monsoon rains during the ripening of dates fruit are always the
most serious risk and the largest challenge faced by Pakistani Dates growers. Irregular rainfall
from the end of June to August can destroy the entire crop whether on the trees or cured on
mats (Abul-Soad et al., 2015). In Punjab-KP cluster, in addition to monsoon rains, the humid
climate of above 60% relative humidity and low temperature during fruit development and
ripening stages, reduce fruit quality (Abul-Soad, 2013). The use of bunch covers is expensive.
The non-availability of tissue-cultured date palm of local elite cultivars is another hindrance in
dates production enhancement as farmers are using low quality suckers.
Table 16: Gaps and Constraints at Production Level
Sr. # Parameters Sindh Cluster Balochistan Cluster Punjab-KP
Cluster
1 New germplasm Difficult to access Difficult to access Difficult to access
2 Mother nurseries or GPUs
Very few Very few Very few
3 Orchard size/type Large/standard Large/small & irregular Small/mixed crop
4 Certified plants Commercial production
Limited availability Limited availability
5 Standardization of management practices
Not done Not Done Not Done
6 Extension services Moderate Moderate Good/weak
7 Commercial inputs Moderate use Moderate Moderate/no use
8 Rain and humdidity High risk of rain and humidity
Less risk High rik fo rain and humidity
9 Low temperature at ripening stage
Medium risk High risk Medium risk
10 Labor input Hired Hired Hired
6.4. Constraints at the Processing and
value Addition Levels
Processing of dates not only refers to its processed products but also to basic treatments
given for hygienic and quality control purposes, as well as stabilization for a longer shelf life.
These basic and essential steps include fumigation, cleaning or washing, drying, sorting and
grading, and packaging. In Punjab-KP cluster, about 80% of Dhakki cultivar of D.I. Khan
66 KNOWLEDGE FOR LIFE
production is sun-dried (fruit is cured in boiling water for 15-20 minutes and then sun dried).
In other clusters, considerable volume of dates is also dried mainly for export (same procedure
for drying is used as mentioned above). But largely, fresh dates are packed in cartons and
polythene packs and transported through open trucks for marketing in big cities of Pakistan
without much value addition.
Modern equipment and mechanical lines of factories, limited number of high-quality local
cultivars, hygiene and lack of cold storage facilities are major problems facing the dates
processing sector in Pakistan (Abul-Soad et al., 2015). Bad presentation of the produce is the
major constraints in further expanding export especially to high-quality markets. At present
farmers just manually pack their dates in polythene or corrugated cartons while, most of the
farmers and traders skip important processing, washing, drying, grading, packaging,
transportation protocols and never use any labeling and trade mark. In the absence of these
technologies it is not possible to maintain the quality and standards of dates crop.
Dates are required to be stored at 5-8°C and same temperature is also required during
transportation. However, there is no cold chain process or farm-level cold storage in any
cluster, except few in Balochistan Cluster that was established under a cold chain project on
cost sharing basis which accommodate very little quantities of dates.
To meet the big orders or capture big or potential markets both in country and foreign, close
collaboration among traders and farmers is imperative which is currently lacking.
6.5. Marketing and Trading Constraints
The postharvest handling and storage of dates is not according to HACCP
conditions/standards. Very little quantities of this produce is stored in cold storage in
Balochistan and Sindh Clusters, while in Punjab-KP Cluster the cold chain system is
completely absent. In the Balochistan and Punjab-KP (Punjab area) clusters, formal regulated
marketing system does exist where traders are bound to conduct their businesses under the
licenses issued by the authorities. But in Sindh Cluster no such mechanism exists. For earlier
two clusters there are opportunities for trading in dates under the regulated system established
by the governments. In Balochistan, government is trying to establish fruit and vegetables
markets at district level which will create healthy environment for dates marketing.
Naturally traders strive to earn the highest margins by buying at the lowest prices and selling
at the highest prices. But very little attention is paid on product differentiation and quality
aspects to achieve premium prices. For better marketing, modern and advanced
communication technologies and internet services are easily accessible but no Marketing
Information System (MIS) exist in Balochistan Cluster. Labor is available on permanent and
seasonal basis, and financial services to traders are provided by both formal and informal
banking institutions.
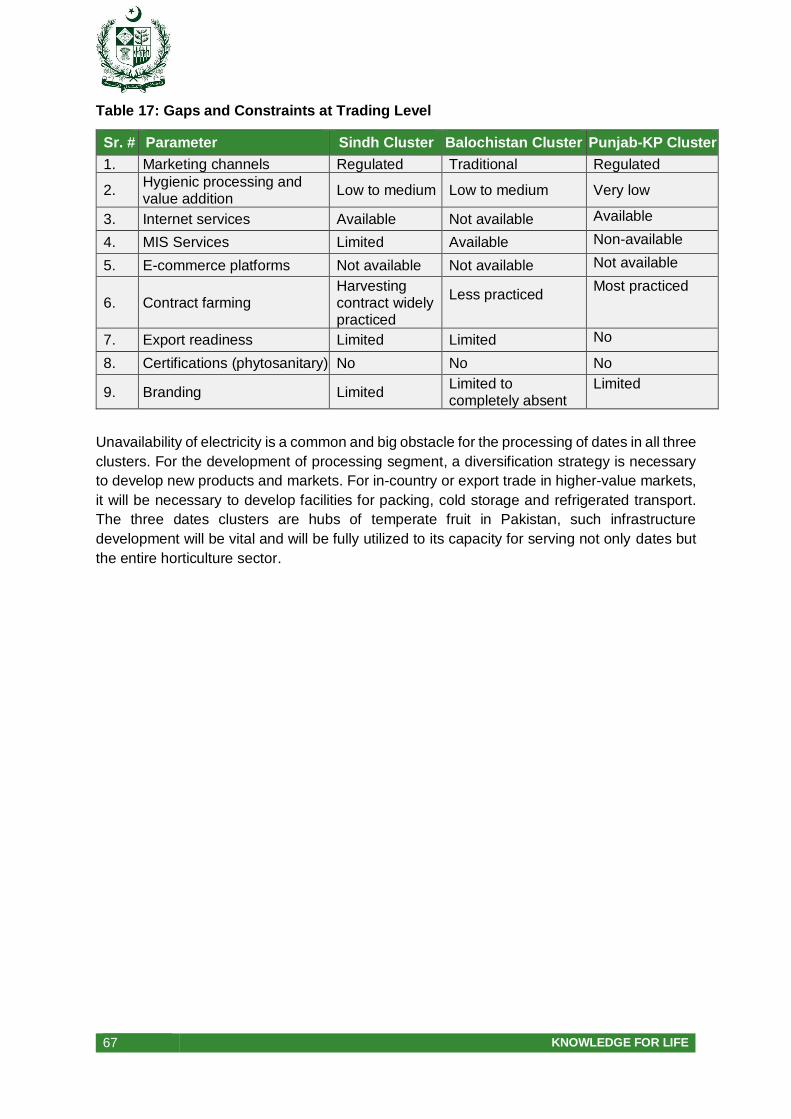
67 KNOWLEDGE FOR LIFE
Table 17: Gaps and Constraints at Trading Level
Sr. # Parameter Sindh Cluster Balochistan Cluster Punjab-KP Cluster
1. Marketing channels Regulated Traditional Regulated
2. Hygienic processing and value addition
Low to medium Low to medium Very low
3. Internet services Available Not available Available
4. MIS Services Limited Available Non-available
5. E-commerce platforms Not available Not available Not available
6. Contract farming Harvesting contract widely practiced
Less practiced
Most practiced
7. Export readiness Limited Limited No
8. Certifications (phytosanitary) No No No
9. Branding Limited Limited to completely absent
Limited
Unavailability of electricity is a common and big obstacle for the processing of dates in all three
clusters. For the development of processing segment, a diversification strategy is necessary
to develop new products and markets. For in-country or export trade in higher-value markets,
it will be necessary to develop facilities for packing, cold storage and refrigerated transport.
The three dates clusters are hubs of temperate fruit in Pakistan, such infrastructure
development will be vital and will be fully utilized to its capacity for serving not only dates but
the entire horticulture sector.
68 KNOWLEDGE FOR LIFE
7. CLUSTER DEVELOPMENT POTENTIAL
7.1. Overview
The strategic locations of all three clusters are very important and advantages should be taken
from. Some of the areas are lying strategically on CPEC routes. The Balochistan, D.I. Khan
and Sindh routes are close to Gwadar and CPEC routes, and these routes facilitate the export
of dates to Middle East and Far East Asia, Afghanistan and Iran while, the Punjab Cluster is
bordering with India. These opportunities provide an edge to dates crop for future competition
both locally and internationally thus making Pakistan a hub for trade in dates and other
commodities. The clusters lying in Balochistan has the capability to expand both vertically and
horizontally due to availability of plenty of land along with favorable climatic conditions,
existence of main high ways network, round the year availability of labor, clean and diseases
free environment etc. The Punjab-KP cluster is lying in two different administrative setups but
possess tremendous potentials for sustainable cultivation of dates due to availability of plenty
of water, round the year labor availability, well experienced dates growers etc.
In this section it has been tried to evaluate the potentials of all the three clusters in terms of
production, demand, quality and market side of dates value chain, export alignment of the
crop, and processing possibilities. Both quantitative and qualitative analyses are presented to
explain the nature of active, dormant and inactive segments of the dates value chains in the
said clusters.
7.2. Potential of Expanding Production
As noted earlier, the current dates average yield of Pakistan is around 5.5 t/ha which is much
lower than the world average yield of 6.1 t/ha. The yield is particularly very low in Balochistan.
Although, Punjab and Sindh clusters get higher yield than the world average, but these yield
levels, according to the stakeholders including farmers and researchers, are much lower than
the potential yields and the yield obtained by other countries of the world having similar
environment like Pakistan. For instance, per ha yield of dates in Egypt is more than 32 t/ha.
7.2.1. Improved Varieties and Management
Practices
Both the provincial and federal Agricultural Research Institutes do exist in Balochistan, Sindh
and Punjab and are working for setting the technologies aimed at increasing productivity of
dates in the province. These activities generally under Provincial Horticulture Institutes are
able to collect limited germplasm of dates. Many advanced production technologies, such as
pollination, and good quality dates varieties such as Muzawati, Aseel, Begum Jhangi and
Dhakki already exist which according to researchers can easily double the yield. Moreover, if
management practices of dates are standardized and promoted, it can further enhance its per
ha yield.
69 KNOWLEDGE FOR LIFE
Date orchards need special care for almost round the year4. Date palms are dioecious (i.e. the
male and female parts called spathes) are on separate plants. The selection and use of proper
spathes5 is very important. Dates growers traditionally harvest male spathes 1-2 days after
their opening and place them in shade and moisture free-area for drying. Strands are then
detached and stored till needed for the pollination of female inflorescences. Considerable
scope exists in training the farmers in spathe selection, pollination. The pollination service
provides or pollinators are also need to be trained from achieving quality dates production
from the area. After pollination, dates fruit development progresses through five different
stages that takes about 6-8 months from fruit setting till maturity, i.e. Hababauk6, Kimri7,
Khalal8/Bisr/Doka, Rutab or Dang9 and
Tamar10 (Figure-4). The fruit become edible in the last three stages as a result of decrease in
bitterness, increased sweetness and improved tenderness and succulence. These stages are
sensitive to rainfall. Summer monsoon rains always cause problem for the date crop,
4 Date palm requires a long intensely hot summer with little rain and very low humidity from pollination to harvest
but sufficient wetting of root zone. The ideal temperature ranges from 21oC to 27oC. Commercially, few male
trees are grown the dates gardens and pollens are collected for the artificial pollination - critical for the success
of production. Artificial pollination can be done by the traditional method or by using some mecanized device.
Fruit quality mainly depend on the quality of pollen used. Growers typically obtain male spathes at the
beginning of the season from the market and they are mostly price conscious (Figure-3). Considerable scope,
therefore, exists in training or capacity building of farming community and the pollinators in selection and storing the spathes. After pollination, bunches are often tied to the leaf stalks to support the weight of the fruit.
Fruit thinning is also recommended to decrease alternate bearing, increase fruit size, improve fruit quality,
advance fruit ripening and facilitate bunch management. Fruit thinning can be carried out three ways” removal
of entire bunches, reduction in the number of strands per bunch and reduction in the number of fruit per strands
(Chao and Krueger, 2007; Abul-Soad, 2015).
5 The flower stalks of both male and female dates trees are produced inside a spathe. The spathe emerges from the
axils of the leaves in early spring in mature date palms. The date palm flowers from within the long stout spathe
which, on bursting exposes may thickly crowded floral branchlets inside.
6 The Hababauk stage begins with the fruit appearance and continues for 4-5 week. The fruit is of round shape,
whitish-cream colour with green strips.
7 The Kimri stage ppears in the first 17 weeks after pollination. At this stage, the fruit is young, elongaged, greenish in colour, hard in texture and with about 85% moisture. Fruit weight increases significantly and the
tannine concentration is high. Although the fruit is inedible for direct consumption at this stage, however, it can
be sued for making chutney (sauce) or pickles.
8 The Khalal or Bisr or Doka stage comes during next 6 weeks. At this stage, the date fruit gains maximum size
and weight, color becomes a typical yellow, purplish-pink or red depending on the cutivar, with hard texture.
The sugar contents increases slowly and becomes mainly sucrose. So, the fruit is physiologically mature, hard
and crisp, yellowish in colour with moisture contents as 45% to 65%. This Doka stage fruit can be consumed
as raw fresh fruit or they can be used for jam, butter, or dates syrup.
9 In the next 4 weeks, Rutab or Dang stage develops. The dates lose water with half of the fruit becoming soft,
sweeter and darker in colour (light brown), or less astringent. Sucrose converts to reducing sugars and protein,
fat and ash percentage decreases. This stage is the start of ripening. So, the fruit is partially browned and
softened, moisture contents reduced to 30% to 40%. Dates of many cultivars at Rutab stage are eaten as fresh and processed into jam, butter, date bars and date paste.
10 The Tamar/Tamr/Tamer is the final stage which lasts for 2 weeks. At this stage, the fruit gains maximum total
solids, highest sweetness, astringency, dark brown clor, soft texture and a typical wrinkled shape. There is a
high concentration of glucose and fructose, with no or very low sucrose. The percentage of protein, fat and ash
are less as compared to Rutab stage. Owing to low moisture and high sugar content, dates of this stage have
good storage stability, i.e. about one year at room temperature, if properly packed/stored. Tamar dates are
yellowish brown to dark brown, texture from sof flexible to compact and moisture contents are below 20%.
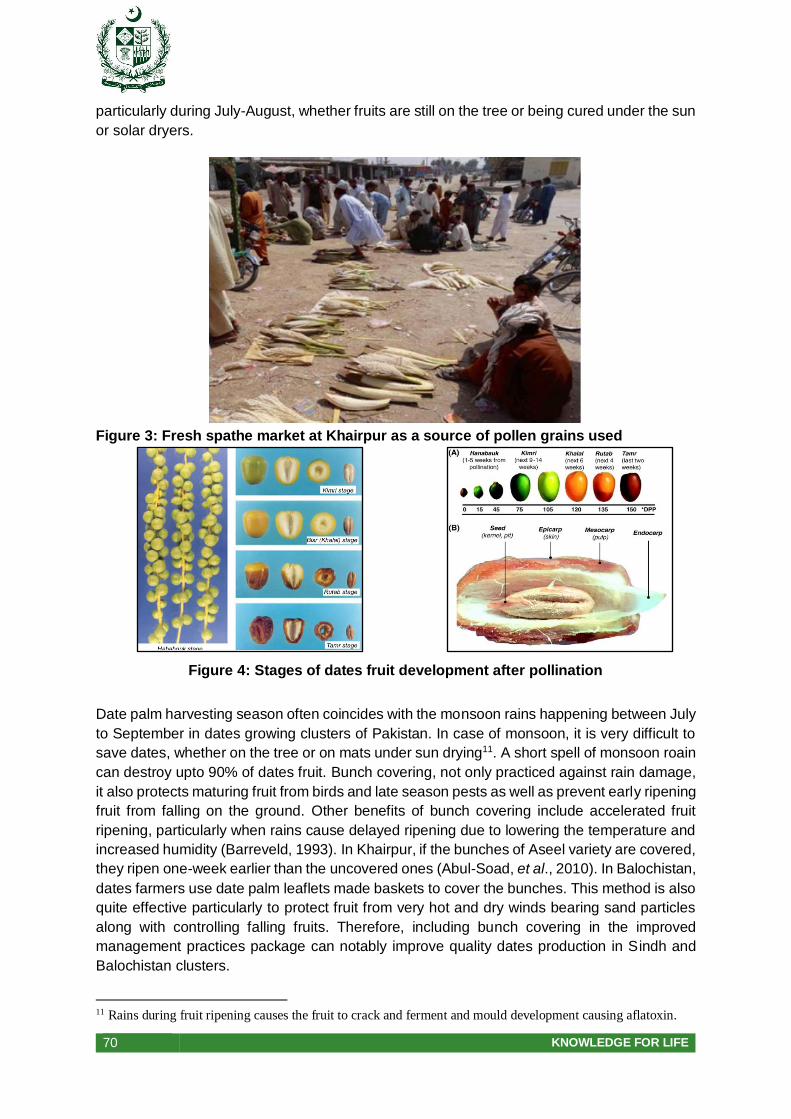
70 KNOWLEDGE FOR LIFE
particularly during July-August, whether fruits are still on the tree or being cured under the sun
or solar dryers.
Figure 3: Fresh spathe market at Khairpur as a source of pollen grains used
Figure 4: Stages of dates fruit development after pollination
Date palm harvesting season often coincides with the monsoon rains happening between July
to September in dates growing clusters of Pakistan. In case of monsoon, it is very difficult to
save dates, whether on the tree or on mats under sun drying11. A short spell of monsoon roain
can destroy upto 90% of dates fruit. Bunch covering, not only practiced against rain damage,
it also protects maturing fruit from birds and late season pests as well as prevent early ripening
fruit from falling on the ground. Other benefits of bunch covering include accelerated fruit
ripening, particularly when rains cause delayed ripening due to lowering the temperature and
increased humidity (Barreveld, 1993). In Khairpur, if the bunches of Aseel variety are covered,
they ripen one-week earlier than the uncovered ones (Abul-Soad, et al., 2010). In Balochistan,
dates farmers use date palm leaflets made baskets to cover the bunches. This method is also
quite effective particularly to protect fruit from very hot and dry winds bearing sand particles
along with controlling falling fruits. Therefore, including bunch covering in the improved
management practices package can notably improve quality dates production in Sindh and
Balochistan clusters.
11 Rains during fruit ripening causes the fruit to crack and ferment and mould development causing aflatoxin.
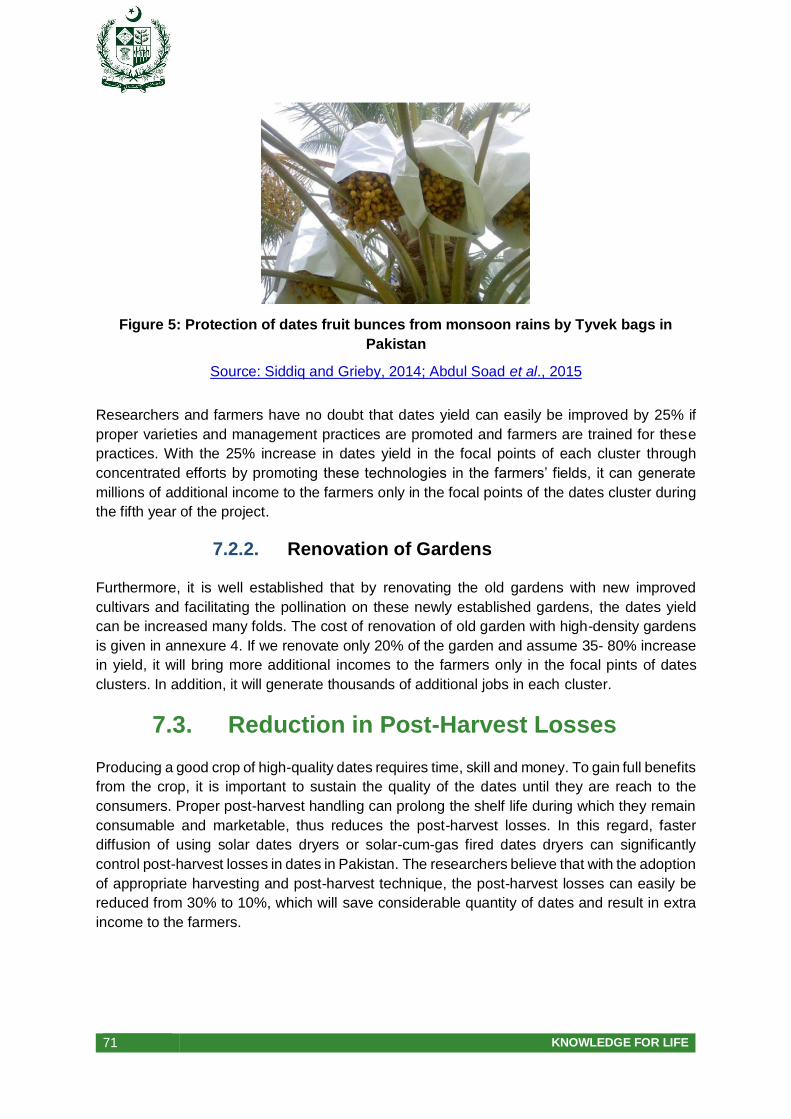
71 KNOWLEDGE FOR LIFE
Figure 5: Protection of dates fruit bunces from monsoon rains by Tyvek bags in
Pakistan
Source: Siddiq and Grieby, 2014; Abdul Soad et al., 2015
Researchers and farmers have no doubt that dates yield can easily be improved by 25% if
proper varieties and management practices are promoted and farmers are trained for these
practices. With the 25% increase in dates yield in the focal points of each cluster through
concentrated efforts by promoting these technologies in the farmers’ fields, it can generate
millions of additional income to the farmers only in the focal points of the dates cluster during
the fifth year of the project.
7.2.2. Renovation of Gardens
Furthermore, it is well established that by renovating the old gardens with new improved
cultivars and facilitating the pollination on these newly established gardens, the dates yield
can be increased many folds. The cost of renovation of old garden with high-density gardens
is given in annexure 4. If we renovate only 20% of the garden and assume 35- 80% increase
in yield, it will bring more additional incomes to the farmers only in the focal pints of dates
clusters. In addition, it will generate thousands of additional jobs in each cluster.
7.3. Reduction in Post-Harvest Losses
Producing a good crop of high-quality dates requires time, skill and money. To gain full benefits
from the crop, it is important to sustain the quality of the dates until they are reach to the
consumers. Proper post-harvest handling can prolong the shelf life during which they remain
consumable and marketable, thus reduces the post-harvest losses. In this regard, faster
diffusion of using solar dates dryers or solar-cum-gas fired dates dryers can significantly
control post-harvest losses in dates in Pakistan. The researchers believe that with the adoption
of appropriate harvesting and post-harvest technique, the post-harvest losses can easily be
reduced from 30% to 10%, which will save considerable quantity of dates and result in extra
income to the farmers.
72 KNOWLEDGE FOR LIFE
7.4. Demand Potential
As noted in the Introduction Section, per capita consumption of dates in the country has
declined significantly by 42% during the 2000s because of the reduced production, increased
export, and lower imports of dates in the country. This trend cannot be continued unabated
because of the people’s preferences for dates especially during the Ramadan month and on
marriages. Therefore, expansion in production due to above interventions will be a great relief
for the country to stop the declining trend in dates consumption.
Moreover, as we have noticed earlier that Pakistan’s exports of dates since 2001 is increasing
by 11% per annum rate, which is expected to continue because of the similar increase in
international demand for dates during the period, if Pakistan is able to meet the quality
requirements of the demand. To continue exporting with this rate, however, Pakistan needs to
expand its production quite significantly.
Therefore, we believe that absorbing the expanded production by 40-50% during next five
years through the introduction of new varieties, improved management practices, renovation
of gardens, and reduced post-harvest losses will not be a problem as it can be used to stop
the declining per capita consumption, feeding the burgeoning population, and continue
exporting the dates at a fast rate.
7.5. Enhanced Processing and Value
Addition
The date palm sector requires a paradigm shift towards varietal development, value addition
and packaging to create more space in a competitive international market. Although some big
factories of dates processing have been established in Karachi and Khairpur, but small scale
value addition at the village level is missing in all the three clusters. Small scale dates
processing technologies, like for example, dates solar drying and dates pack house which
includes grading, sorting, washing, drying, and packaging are available. The fixed cost of
dates pack house of capacity 540 tonnes per season (or 1.2 tonne per batch each batch last
for 5 days assuming 150 days season) is about US$125000 with an operating cost for the
whole season at around US$225000. Similarly, the dates solar drier with a capacity of 300kg
per hour running for 12 hours a day and 150 days in a season with a total capacity of 36 tonnes
per season will have fixed cost of around US$7500 with an operating cost for the whole season
at around US$ 11000. The detailed feasibilities of the dates pack house is explained in
Annexure 5, while the feasibility calculation for the dates drier is given with MS-EXCEL Model
sheet.
The farmers of Pakistan are very poor and illiterate so adoption of these processing and value
addition technologies is very difficult. Therefore, it is imperative to organize the farmers in
groups and incentivize these technologies for their adoption. The public sector cannot do this
alone so, it will be imperative that private sector and NGOs come forward with win-win solution
by investing and developing infrastructure for introduction of processing and value addition
technologies.
73 KNOWLEDGE FOR LIFE
The promotion of processing industry within the cluster will minimize the postharvest losses
considerably. By this new economic activity can be promoted and employment will also be
generated for unemployed youth of the cluster.
7.6. Harnessing the Export Potential
Realizing the health benefits of dates, the worldwide demand of date has been on the rise
since 2001. As noted earlier, Pakistan export significant amount of its dates production (35%)
to the world market, but most of its export is to low-end market like India, Afghanistan and
UAE where Pakistani exports earn 60% of the world average export price. This implies that
considerable potential exists in fetching good price through improving the quality (through
quality improvement and maintenance through improved production and postharvest
technology adoption; value addition and processing).
Pakistan can easily expand its export by targeting the high-end markets like Malaysia and
Indonesia. However, to penetrate in the expanding high-end dates market, Pakistan has to
proactively adopt commercial strategies by linking its traders with international market, which
are explained in the next section, and invest on improving its value chain as suggested above.
Moreover, it has to improve its per ha yield and reduce production cost to become
internationally competitive.
Our discussion with traders suggested that as first step, the emphasis should be laid on
enhancing the quality of dry (Chohara) and fresh dates, rather than concentrating upon
enhancing export-production ratio. Once our quality standards are established in high-end
international markets, then it would be easy to expand export-production ratio. As a trickle
down effect, the farmers’ returns will also increase, which shall induce adoption of improved
management practices and renovating their orchards with new dates varieties and better
yielding plants.

74 KNOWLEDGE FOR LIFE
8. CLUSTER DEVELOPMENT STRATEGIES
8.1. Plan
After discussion with stakeholders, following dates development plan with fixed targets to be
achieved is specified (Table 18).
Table 18: Targets of dates cluster plan
S. No. Targets for Dates Cluster Development
1. Renovation of 20% old orchards and increasing the yield on these by 80%
compared to the old orchards.
2. Increasing the per ha yield of dates by at least 25% over a period of next five
years on the old gardens through improved management practices.
3. Reducing post-harvest losses from the current 30-40% level to 15-20% in
various clusters.
8.2. Policies
It is imperative to set an agriculture policy that guide both the public and private sectors for
investment in different fruit industries for its business regulation and infrastructure
development. In dates following policy steps need to be take:
Strengthening of agriculture research on dates is needed in each cluster, especially
on collecting new germplasm, developing protocols for tissue culture nursery
production, standardizing the farm management practices especially fertilizer,
micronutrient and water application, protocols for harvesting, packaging,
transportation, and storage for various dates varieties, etc.
Building capacities of stakeholders along the value chain, especially farmers,
pollination services providers, date drying technologies, traders, and processors to
produce and handle quality dates fresh-produce and its products. For this purpose,
capacities of extension department in each cluster will be enhanced by including
experts on value chain development as extension experts in the department.
Provision of Marketing Information System (MIS) on dates production, trade, and
quality trends as well as emerging technologies.
Provision of E-commerce facility
Provision of special incentives for value chain infrastructure development.
75 KNOWLEDGE FOR LIFE
8.3. Strengthening of Date palm Research
There in Pakistan several research institutes are working on dates varieties evolvement and
development. Despite limited resources several dates varieties have been evolved and got
registered by different research institutes. Research can play a leading role in the development
of dates value chain development and performance of these varieties are remarkable both
quantity and quality wise. But still a lot is needed to be done. Keeping in view the climate
change and rise in demand of this important commodity, the evolvement of new varieties is
imperative. Therefore, more attention and resources are required to be invested to boost
research activities. Particularly, breeding and agronomic aspects are needed to be given more
attention. It is also a dilemma that postharvest aspect of the commodity almost remained
neglected and that’s why more than 30% postharvest losses occur in this crop. It can generate
new high-yielding technologies, standardize improved management practices in production,
processing, and marketing, and it can also help in capacity building of stakeholders. Because
Sindh is the major dates growing area in Pakistan, therefore, it is suggested to strengthen the
Datepalm Research Institute in Khairpur into a Datepalm Research and Development Institute
(DRDI). The Center should be made an autonomous body under the Board of Directors
chaired by a pronounced business man and members taken from the private sector and dates
growing provinces. The institute should collect and distribute dates germplasm of various
characteristics to public and private sectors in other provinces especially in Balochistan,
Punjab12 and KP, undertake research on issues related to the whole value chain, generate
information about dates marketing in domestic and international markets and new emerging
technology trends. Target oriented research should be encouraged. The research on dates in
Punjab and Balochistan need to be strengthened in the guidance of DRDI in Khairpur.
8.4. Organizing farmers’ Entrepreneur
Groups
Farmers Entrepreneur Groups (FEGs) can play important role in helping farmers to overcome
the economies of scale issues, collect investments from small farmers for processing and
value chain infrastructure, capacity building of farmers, and start contract farming by ensuring
value chain. To establish the FEGs following are suggested:
Farmers Entrepreneur Groups will be organized at the union council level in dates
growing areas with the help of NGOs like NRSP who have main focus on social
mobilization.
Incentives through the FEGs will be provided to build basic dates value chain and
processing infrastructure like dates pack-houses, dates solar driers, etc.
Management of the processing infrastructure will be through a hired manager selected
by the FEGs through consensus but initially trained and paid by the government.
The members of the groups will be trained as demanded by the majority of FEGs. They
can pick any or all of the training modules including good agricultural practices, IPM
12 In Punjab, recently under an R&D project, tissue cultured plants of elite date varieties like Ajwa, Anbarah,
Khalas, Barhi, Medijael and Ghanami shall be distributed to farmers
76 KNOWLEDGE FOR LIFE
on pest, mechanical drying of dates, etc. These modules will be developed by the
specially hired experts for this purpose.
The groups will be encouraged to start quality- and fixed price-based contract with
dates traders. The main responsibility of FEGs would be to ensure quality of dates.
8.5. Renovation of the Present Orchards
The existing date palm orchard are characterized with varieties with low yield potential and
low market price. It is proposed to replace these with high priced cultivars by planting more
productive trees of improved varieties which produce high priced dates. These cultivars will
be established on high efficiency irrigation systems to increase the date area. It is assumed
that an encouraging response to this intervention shall come from the farmers’ side. The target
is that 20% date palm area in every provincial clusters shall be renovated in 5 years’ period.
For the purpose, the following measures needs to be taken:
Signing of Memorandum of Understanding with countries like USA, Spain and
Australia for research and scientific collaboration and germplasm exchange
particularly high density and more productive germplasm.
Importing the date varieties characterized with different harvest times, higher yield from
countries like Saudi Arabia, Iraq and Egypt.
Establishing mother orchards at provincial agriculture research institutes and private
nurseries having good business experience and reputation.
Providing financial support to private nurseries for propagation of certified nursery
plants of improved imported varieties for provision to the farmers.
Providing financial support to the farmers in renovation of their orchards with high
priced varieties plants on 50:50 cost sharing basis under project approach.
8.6. Capacity Building of Stakeholders
As noted earlier, farmers in each cluster generally are following decades old orchard and
nursery management practices. The nurseries are not raised using appropriate protocol by
farmers or nursery men to obtain helathy and disease free nurseries. Similarly, traders and
processors, as noted earlier, do not adopt appropriate practices to keep the dates quality intact
until it reaches to consumer’s table.
Capacities of all stakeholders along the value chain will be improved. To promote improved
management practices, these will be standardized at the experiment station first, and then the
impact of these practices will be demonstrated at farmers’ field through FEGs, and member
farmers will be trained to adopt these practices. Similarly, certified nurseries with true-to-type
mother-block will be established at the experiment station and nursery men will be trained to
supply true-to-type healthy dates nurseries. For this purpose, truth-in-labling system will be
implemented and monitored by the extension department in each cluster. The traders and
processors will be trained for also be trained on quality value chain managment system.
77 KNOWLEDGE FOR LIFE
For this purpose, public agricultural extension department and the agricultural advisory
services will be activated and private sector will be involved to promote these practices to
farmers, and other value chain agents. It is anticipated that these efforts will improve 25%
yield per ha of dates in 5 years’ period in each cluster. For this, the following measures will be
taken:
Standardizing the improved management practices at the experiment station,
especially about the use of appropriate farm manure, artificial pollination of dates trees,
pesticide micronutrient, fertilizer use and harvesting methods. Broachers and movies
will be prepared by the experts on improved management practices, and private sector
will be engaged to demonstrate and train farmers in line with the developed literature
by the experts. The public sector extension will pay the role in monitoring the training
and demonstration activities by the private sector.
Standardizing the nursery establishment with certified mother blocks at the experiment
station, and trained the nursey men/women about modern nursery management
practices with the maintenance of certified mother blocks. Possibility of tissue culture
based nursery production will be explored, and if successful, private sector will be
trained to established tissue culture-based nurseries.
Training of traders, processors, and other stakeholders on quality value-chain
management system, especially on appropriate grading, packaging, storing, and
transportation protocols.
Educating farmers for applying decomposed farm yard manure and recommended
doses of fertilizers on regular basis for soil health.
Organizing trainings of the farmers and service providers in facilitating pollination
through artificial pollination in the date palm orchards.
Applying sprays of recommended chemicals, when and wherever needed and
biological control of some major pests.
Developing schedule of drip irrigation based on the soil, climate, etc.
8.7. Controlling Post-Harvest Losses
Even the best post-harvest techniques can only maintain the quality, not improve it. Therefore,
quality of fruit as harvested must be ensured at the harvesting stage to maintain it throughout
the value chain. Selection of appropriate climate and harvesting at the correct time using
appropriate harvesting techniques are essential to produce good quality dates.
At present, date is harvested manually by hand, which damages the tree and affects the fruit
quality significantly. After harvesting, dates is normally transported and stored in bulk after
filling in plastic sacks in the orchard. These bags are not resistant to moisture and insect
attack. The dates should be packed after proper drying in open air to remove excessive
moisture. All this results into the loss of a notably high proportion of fruit in the supply chain.
Under the improved post-harvest management practices, the harvesting labor will be trained
in better harvesting methods by educating them about the signs of appropriately mature fruit.
The payment method shall also be changed from quantitative to qualitative & graded-based.
78 KNOWLEDGE FOR LIFE
Moreover, the fruit packaging method shall be changed from plastic sack to air tight and gas
tight bags. Farmers will also be trained on improved grading (size and maturity based). It is
assumed that market shall also positively respond to these practices by offering relatively
higher prices for the better sorted, graded and packed dates than those packed in conventional
plastic sacks. It is anticipated that the proposed intervention under consideration shall result
in controlling post-harvest losses from 10% to 20% in each cluster.
In this regard, following specific measures will be taken:
Organizing trainings of the dates harvesting labor to teach them about the appropriate
stages at which the dates should be harvested.
Providing financial support to use appropriate packing material at relatively cheaper
rates.
Providing financial support to service providers in transport and forked loading and
unloading sectors.
Encouraging farm-level storages with appropriate temperature control for dates
storing.
8.8. Solar Drying of Chohara and Fresh
Dates
Drying of food items is an ancient technique to preserve them for later use. Dates are
harvested in monsoon season (July-August) which does not allow dates to be ripened on the
tree due to high humidity in ambient air (Tamar stage). Mostly dates are harvested at 50-60%
moisture contents (Khalal stage) and are sundried in open to attain 20-24% moisture contents
(Markhand et al., 2015). In this method, dates are spread on palm leaf mates and are exposed
to sun rays (Ibupoto et al., 2015). Open sun drying technique, the oldest technique being
utilized for dehydration of agricultural produce in most of the developing countries, has many
disadvantages like: product spoiled due to rain, wind, dust and moisture; animal and bird
infestation; insect attack; direct radiation of sun may also cause hardening of upper layer of
agricultural produce (Sharma et al., 2009). This method requires large surface area and
causes drudgery. The open sun drying also results in high post-harvest losses.
The appropriate alternative to open sun drying is solar drying in closed chamber for
dehydration of agricultural produce. Solar dryers are more efficient, requires less time for
drying and protects the produce from abrupt weather changes. It also results in good quality
dried dates (Srinivasan and Balusamy, 2015). Use of solar energy is encouraged as it is
environment friendly, free of cost and abundantly available in most parts of the world. Pakistan
has tremendous potential of solar energy, especially in southern Punjab, Sindh and
Balochistan. Solar irradiation received by these areas has value over 2 MWh m-2 per annum;
with 3000 clear sunny hours per year (Malik and Maqbool, 2013). The solar-cum-gas fired
dates drying is a further development made by the Pakistan Agricultural Research Council,
Islamabad (Akhtar, 2017). The potential markets for processed dates have been identified in
the previous section. The following strategies are suggested to promote processing of dates
as a cottage industry in rural areas:
79 KNOWLEDGE FOR LIFE
Fifty cottage level dates processing units will be established along with due gadgets
(e.g. washer, grader, solar dehydrator etc.) for storing/dehydrating the dates. For this,
20% subsidy will be provided to FEGs, and remaining investment will come from the
members of the FEGs on voluntary basis.
Collection of dates processed in rural areas and its packaging will be encouraged at
small scale industry in peri-urban areas who will collect the processed dates from many
manufacturing points in rural areas. The established firms will market the processes
dates and distribute it to various destinations of the country throughout the year and
abroad under its own brands. For this interest free loans will be provided to the
distributors.
Training and certification of dates processing in food safety and quality management
system so that SPS certified processed dates are available from the cottage industry
in the date cluster areas.
Introduction of GI (Geographical Identification) registration and certification in the date
cluster areas.
8.9. Linking Traders with High-End Markets
The projection of Pakistani dates in international market shall be made through increasing
participation in international exhibitions, providing information about international markets, and
establishing e-commerce portals. It is expected that these measures along with the above
measures for the purpose of improving dates quality for achieving better prices our dates.
Following measures are suggested for this purpose:
Establishing e-commerce portal where FEGs and traders can directly contact and trade
with international buyers.
Establishing information portals regarding trends in dates production, quality requirements,
prices, emerging production technologies, production costs, etc. in major dates producing,
Dates exporting and dates importing countries of the world.
Providing due information like, variety, nutritional information, certifications about non-
usage of harmful chemicals in production and processing, child labor, etc.
Introduction of Pakistani brands of dates with attractive names and packaging in the
international food exhibitions.
Providing financial and policy support to the potential dates exporters for successful
participation in international food exhibitions and sponsored trip to expanding markets.
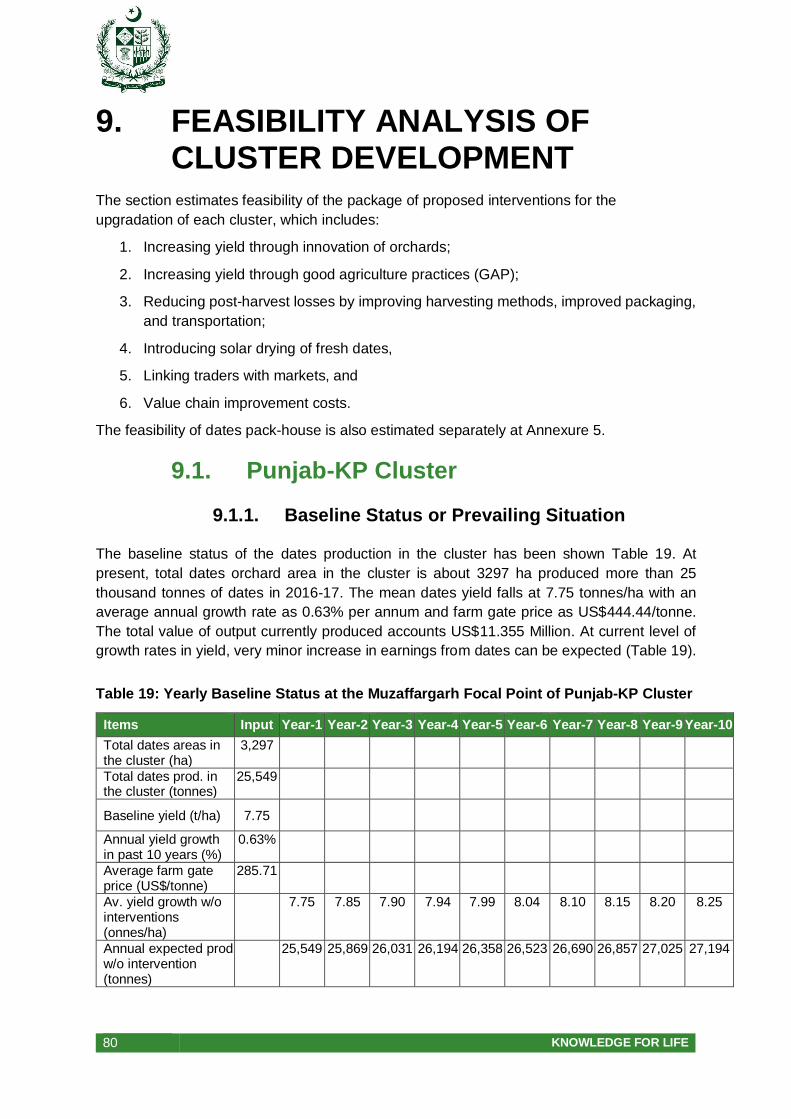
80 KNOWLEDGE FOR LIFE
9. FEASIBILITY ANALYSIS OF CLUSTER DEVELOPMENT
The section estimates feasibility of the package of proposed interventions for the
upgradation of each cluster, which includes:
1. Increasing yield through innovation of orchards;
2. Increasing yield through good agriculture practices (GAP);
3. Reducing post-harvest losses by improving harvesting methods, improved packaging,
and transportation;
4. Introducing solar drying of fresh dates,
5. Linking traders with markets, and
6. Value chain improvement costs.
The feasibility of dates pack-house is also estimated separately at Annexure 5.
9.1. Punjab-KP Cluster
9.1.1. Baseline Status or Prevailing Situation
The baseline status of the dates production in the cluster has been shown Table 19. At
present, total dates orchard area in the cluster is about 3297 ha produced more than 25
thousand tonnes of dates in 2016-17. The mean dates yield falls at 7.75 tonnes/ha with an
average annual growth rate as 0.63% per annum and farm gate price as US$444.44/tonne.
The total value of output currently produced accounts US$11.355 Million. At current level of
growth rates in yield, very minor increase in earnings from dates can be expected (Table 19).
Table 19: Yearly Baseline Status at the Muzaffargarh Focal Point of Punjab-KP Cluster
Items Input Year-1 Year-2 Year-3 Year-4 Year-5 Year-6 Year-7 Year-8 Year-9 Year-10
Total dates areas in the cluster (ha)
3,297
Total dates prod. in the cluster (tonnes)
25,549
Baseline yield (t/ha) 7.75
Annual yield growth in past 10 years (%)
0.63%
Average farm gate price (US$/tonne)
285.71
Av. yield growth w/o interventions (onnes/ha)
7.75 7.85 7.90 7.94 7.99 8.04 8.10 8.15 8.20 8.25
Annual expected prod w/o intervention (tonnes)
25,549 25,869 26,031 26,194 26,358 26,523 26,690 26,857 27,025 27,194
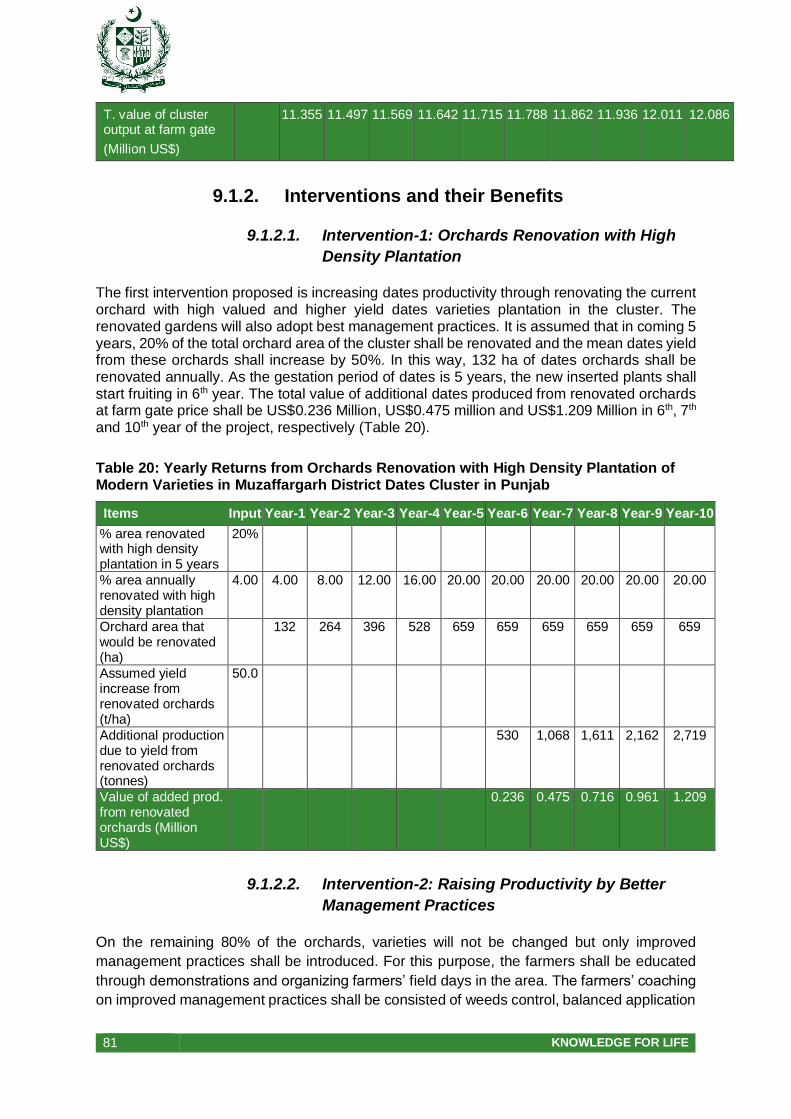
81 KNOWLEDGE FOR LIFE
T. value of cluster output at farm gate
(Million US$)
11.355 11.497 11.569 11.642 11.715 11.788 11.862 11.936 12.011 12.086
9.1.2. Interventions and their Benefits
9.1.2.1. Intervention-1: Orchards Renovation with High
Density Plantation
The first intervention proposed is increasing dates productivity through renovating the current orchard with high valued and higher yield dates varieties plantation in the cluster. The renovated gardens will also adopt best management practices. It is assumed that in coming 5 years, 20% of the total orchard area of the cluster shall be renovated and the mean dates yield from these orchards shall increase by 50%. In this way, 132 ha of dates orchards shall be renovated annually. As the gestation period of dates is 5 years, the new inserted plants shall start fruiting in 6th year. The total value of additional dates produced from renovated orchards at farm gate price shall be US$0.236 Million, US$0.475 million and US$1.209 Million in 6th, 7th and 10th year of the project, respectively (Table 20).
Table 20: Yearly Returns from Orchards Renovation with High Density Plantation of Modern Varieties in Muzaffargarh District Dates Cluster in Punjab
Items Input Year-1 Year-2 Year-3 Year-4 Year-5 Year-6 Year-7 Year-8 Year-9 Year-10
% area renovated with high density plantation in 5 years
20%
% area annually renovated with high density plantation
4.00 4.00 8.00 12.00 16.00 20.00 20.00 20.00 20.00 20.00 20.00
Orchard area that would be renovated (ha)
132 264 396 528 659 659 659 659 659 659
Assumed yield increase from renovated orchards (t/ha)
50.0
Additional production due to yield from renovated orchards (tonnes)
530 1,068 1,611 2,162 2,719
Value of added prod. from renovated orchards (Million US$)
0.236 0.475 0.716 0.961 1.209
9.1.2.2. Intervention-2: Raising Productivity by Better
Management Practices
On the remaining 80% of the orchards, varieties will not be changed but only improved
management practices shall be introduced. For this purpose, the farmers shall be educated
through demonstrations and organizing farmers’ field days in the area. The farmers’ coaching
on improved management practices shall be consisted of weeds control, balanced application
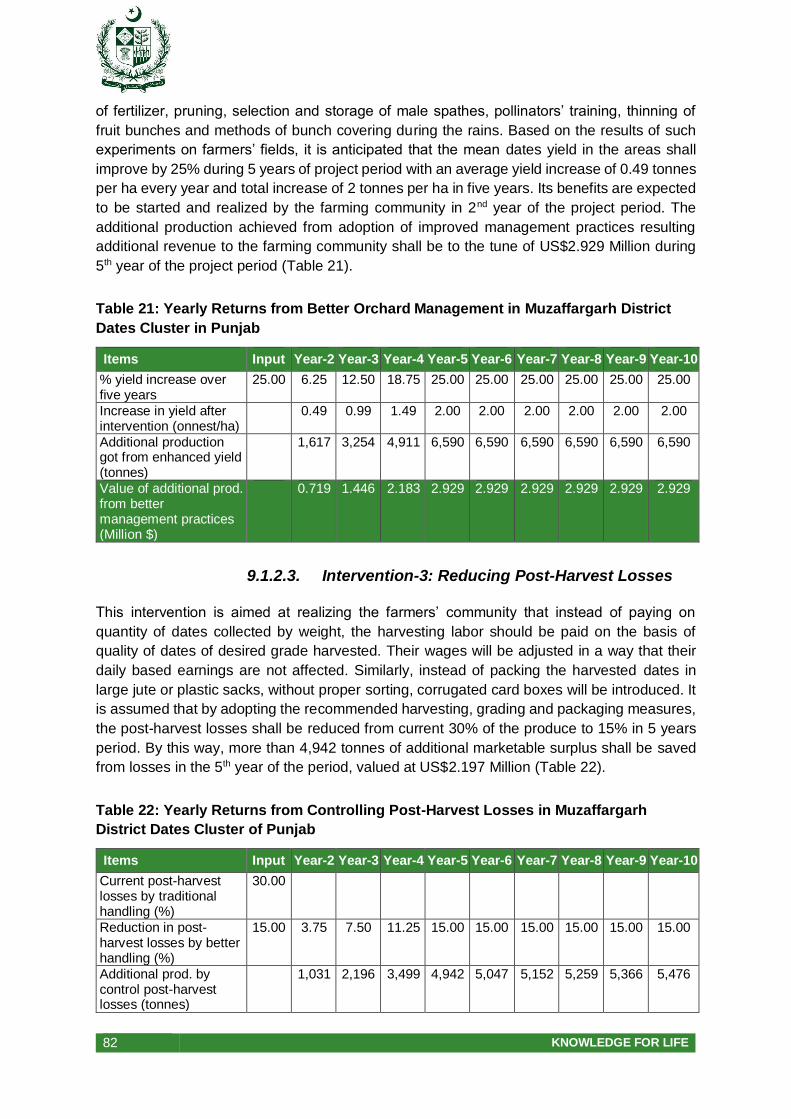
82 KNOWLEDGE FOR LIFE
of fertilizer, pruning, selection and storage of male spathes, pollinators’ training, thinning of
fruit bunches and methods of bunch covering during the rains. Based on the results of such
experiments on farmers’ fields, it is anticipated that the mean dates yield in the areas shall
improve by 25% during 5 years of project period with an average yield increase of 0.49 tonnes
per ha every year and total increase of 2 tonnes per ha in five years. Its benefits are expected
to be started and realized by the farming community in 2nd year of the project period. The
additional production achieved from adoption of improved management practices resulting
additional revenue to the farming community shall be to the tune of US$2.929 Million during
5th year of the project period (Table 21).
Table 21: Yearly Returns from Better Orchard Management in Muzaffargarh District
Dates Cluster in Punjab
Items Input Year-2 Year-3 Year-4 Year-5 Year-6 Year-7 Year-8 Year-9 Year-10
% yield increase over five years
25.00 6.25 12.50 18.75 25.00 25.00 25.00 25.00 25.00 25.00
Increase in yield after intervention (onnest/ha)
0.49 0.99 1.49 2.00 2.00 2.00 2.00 2.00 2.00
Additional production got from enhanced yield (tonnes)
1,617 3,254 4,911 6,590 6,590 6,590 6,590 6,590 6,590
Value of additional prod. from better management practices (Million $)
0.719 1.446 2.183 2.929 2.929 2.929 2.929 2.929 2.929
9.1.2.3. Intervention-3: Reducing Post-Harvest Losses
This intervention is aimed at realizing the farmers’ community that instead of paying on
quantity of dates collected by weight, the harvesting labor should be paid on the basis of
quality of dates of desired grade harvested. Their wages will be adjusted in a way that their
daily based earnings are not affected. Similarly, instead of packing the harvested dates in
large jute or plastic sacks, without proper sorting, corrugated card boxes will be introduced. It
is assumed that by adopting the recommended harvesting, grading and packaging measures,
the post-harvest losses shall be reduced from current 30% of the produce to 15% in 5 years
period. By this way, more than 4,942 tonnes of additional marketable surplus shall be saved
from losses in the 5th year of the period, valued at US$2.197 Million (Table 22).
Table 22: Yearly Returns from Controlling Post-Harvest Losses in Muzaffargarh
District Dates Cluster of Punjab
Items Input Year-2 Year-3 Year-4 Year-5 Year-6 Year-7 Year-8 Year-9 Year-10
Current post-harvest losses by traditional handling (%)
30.00
Reduction in post-harvest losses by better handling (%)
15.00 3.75 7.50 11.25 15.00 15.00 15.00 15.00 15.00 15.00
Additional prod. by control post-harvest losses (tonnes)
1,031 2,196 3,499 4,942 5,047 5,152 5,259 5,366 5,476

83 KNOWLEDGE FOR LIFE
Value of additional prod. from renovated orchards (M. US$)
0.458 0.976 1.555 2.197 2.243 2.290 2.337 2.385 2.434
9.1.2.4. Intervention-4: Improving quality of dates for
domestic and international market
This intervention involves supplying better quality dry and fresh dates in the domestic and for
the international trade. The underlying purposes of this intervention are: i) to tackle the rising
influx of better quality dates from Iran, Iraq and other countries dates in our domestic market;
ii) gradually coming out of low-end international markets, particularly in view of falling Indian
interests in our dry and fresh dates; iii) escalation of the standards of Pakistani dates in
international market in general as other dates producing countries are also striving for that.
Therefore, in near future no direct benefits in terms of better prices are not expected, except
sustaining our supplies in the current importing countries, as well as looking for new markets
for compensating the declining demands from Indian markets. In Punjab province, 90% of total
dates production is utilized for chohara making. The trends in supplies so generated from
Muzaffargarh district’s dates cluster is given in Table 23 below.
Table 23: Trends in Supplies of Quality Dates from the Foal Point (Muzaffargarh
District) of the Punjab-KP Cluster
Items Input Year-2 Year-3 Year-4 Year-5 Year-6 Year-7 Year-8 Year-9 Year-10
Chohara purpose doka production as percentage of total production (%)
90.00
Chohara purpose doka available (tonnes)
25,665 28,333 31,145 34,101 34,821 35,549 36,285 37,029 37,781
Current exports from the cluster (tonnes)
0.00 0.00 0.00 0.00 0.00 0.00 0.00 0.00 0.00 0.00
Exports quality dates to be produced over five years (% prod.)
20.00 5.00 10.00 15.00 20.00 20.00 20.00 20.00 20.00 20.00
Export quality dates produced (tonnes)
1,283 2,833 4,672 6,820 6,964 7,110 7,257 7,406 7,556
Total expected volume to be exported (%)
10.00 2.50 5.00 7.50 10.00 10.00 10.00 10.00 10.00 10.00
Quantity to be sold in domestic high-end market (10% of the domestic market) (tonnes)
642 1,417 2,336 3,410 4,353 5,332 6,350 7,406 8,501
Total qty. of quality dry dates available from the cluster for solar drying (tonnes)
1,925 4,250 7,008 10,230 11,317 12,442 13,607 14,812 16,057
9.1.2.5. Intervention-5: Introducing the Solar Tunnel
Dates Drying
This intervention involves supplying solar dryers at the union council levels to FEGS at 20%
subsidy and collecting the processed dates by some packaging industry from these small

84 KNOWLEDGE FOR LIFE
units. It is presumed that in 5-year project period, the 20% of total dates produced in the
cluster shall be processed for making chohara, which will later on shall be solar dried. By the
5th year, about 10,230 tonnes of dates shall be available for chohara dates production, which
will be process through solar drying and 6,241 tonnes of chohara dates shall be produced.
This will generate additional benefit to the farming community to the tune of US$1.387 Million
during 5th year of the project (Table 24). A total of 137 solar driers is planned to be distributed
on subsidy during the project period by incurring US$1.223 Million on the dryers.
Table 24: Yearly Returns from Solar Drying of Dates in the Focal Point of Punjab-KP
Cluster
Items Input Year-2 Year-3 Year-4 Year-5 Year-6 Year-7 Year-8 Year-9 Year-10
Quantity of dates available for solar tunnel drying of chohara (tonnes)
1,925 4,250 7,008 10,230 11,317 12,442 13,607 14,812 16,057
Coversion factor (1.61 tonnes of chohara = t tonne solar dried)
1.61
Total volume of solar dried chohara produced (onnes)
1,174 2,592 4,275 6,241 6,903 7,590 8,300 9,035 9,795
Value of dry dates after deducting raw material cost (M. $)
777.78 0.261 0.576 0.950 1.387 1.534 1.687 1.844 2.008 2.177
9.1.2.6. Intervention-6: Improving Value Addition by
Introducing Packhouses for Export Market
Under this intervention the quality of fresh dates will be enhanced through improved value
addition like proper grading, packaging, branding, storing, etc. by passing fresh dates through
pack-houses. In this intervention value addition of all the additional improved quality dates
available shall be carried out in the project period. Under this intervention, the progressive
farmers or dates businessmen of high repute shall be encouraged to enter in the export of
dates from the sample cluster. For this purpose, pack houses will be provided at a subsidy of
20% to those FEGs who can arrange the remaining 80% cost. A total of 7 pack houses are
planned to be provided to the FEGs in this cluster costing about US$0.807 Million. Assuming
that the intervention is successfully implemented, then nearly 6,241 tonnes of dates shall be
treated for value addition from the cluster during 5th year of the project period, making
additional value of US$0.922 Million (Table 25).
Table 25: Yearly Returns from Value Addition of Dry Dates (by Passing Through Pack
Houses) in the Focal point of Punjab-KP Cluster
Items Input Year-2 Year-3 Year-4 Year-5 Year-6 Year-7 Year-8 Year-9 Year-10
Qty. of Chohara to be value added through pack house (tonne)
1,174 2,592 4,275 6,241 6,903 7,590 8,300 9,035 9,795
Conversion factor [1.00 tonne solar
0.95%
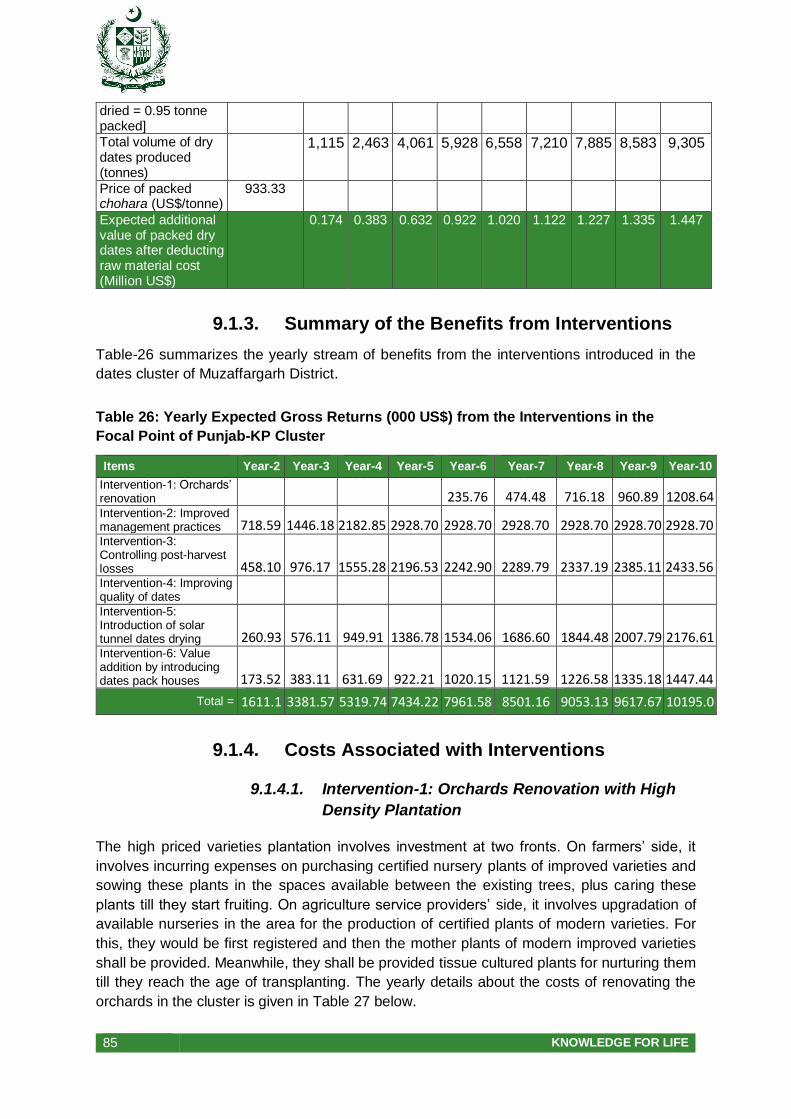
85 KNOWLEDGE FOR LIFE
dried = 0.95 tonne packed]
Total volume of dry dates produced (tonnes)
1,115 2,463 4,061 5,928 6,558 7,210 7,885 8,583 9,305
Price of packed chohara (US$/tonne)
933.33
Expected additional value of packed dry dates after deducting raw material cost (Million US$)
0.174 0.383 0.632 0.922 1.020 1.122 1.227 1.335 1.447
9.1.3. Summary of the Benefits from Interventions
Table-26 summarizes the yearly stream of benefits from the interventions introduced in the
dates cluster of Muzaffargarh District.
Table 26: Yearly Expected Gross Returns (000 US$) from the Interventions in the
Focal Point of Punjab-KP Cluster
Items Year-2 Year-3 Year-4 Year-5 Year-6 Year-7 Year-8 Year-9 Year-10
Intervention-1: Orchards’ renovation 235.76 474.48 716.18 960.89 1208.64
Intervention-2: Improved management practices 718.59 1446.18 2182.85 2928.70 2928.70 2928.70 2928.70 2928.70 2928.70
Intervention-3: Controlling post-harvest losses 458.10 976.17 1555.28 2196.53 2242.90 2289.79 2337.19 2385.11 2433.56
Intervention-4: Improving quality of dates
Intervention-5: Introduction of solar tunnel dates drying 260.93 576.11 949.91 1386.78 1534.06 1686.60 1844.48 2007.79 2176.61
Intervention-6: Value addition by introducing dates pack houses 173.52 383.11 631.69 922.21 1020.15 1121.59 1226.58 1335.18 1447.44
Total = 1611.1 3381.57 5319.74 7434.22 7961.58 8501.16 9053.13 9617.67 10195.0
9.1.4. Costs Associated with Interventions
9.1.4.1. Intervention-1: Orchards Renovation with High
Density Plantation
The high priced varieties plantation involves investment at two fronts. On farmers’ side, it
involves incurring expenses on purchasing certified nursery plants of improved varieties and
sowing these plants in the spaces available between the existing trees, plus caring these
plants till they start fruiting. On agriculture service providers’ side, it involves upgradation of
available nurseries in the area for the production of certified plants of modern varieties. For
this, they would be first registered and then the mother plants of modern improved varieties
shall be provided. Meanwhile, they shall be provided tissue cultured plants for nurturing them
till they reach the age of transplanting. The yearly details about the costs of renovating the
orchards in the cluster is given in Table 27 below.
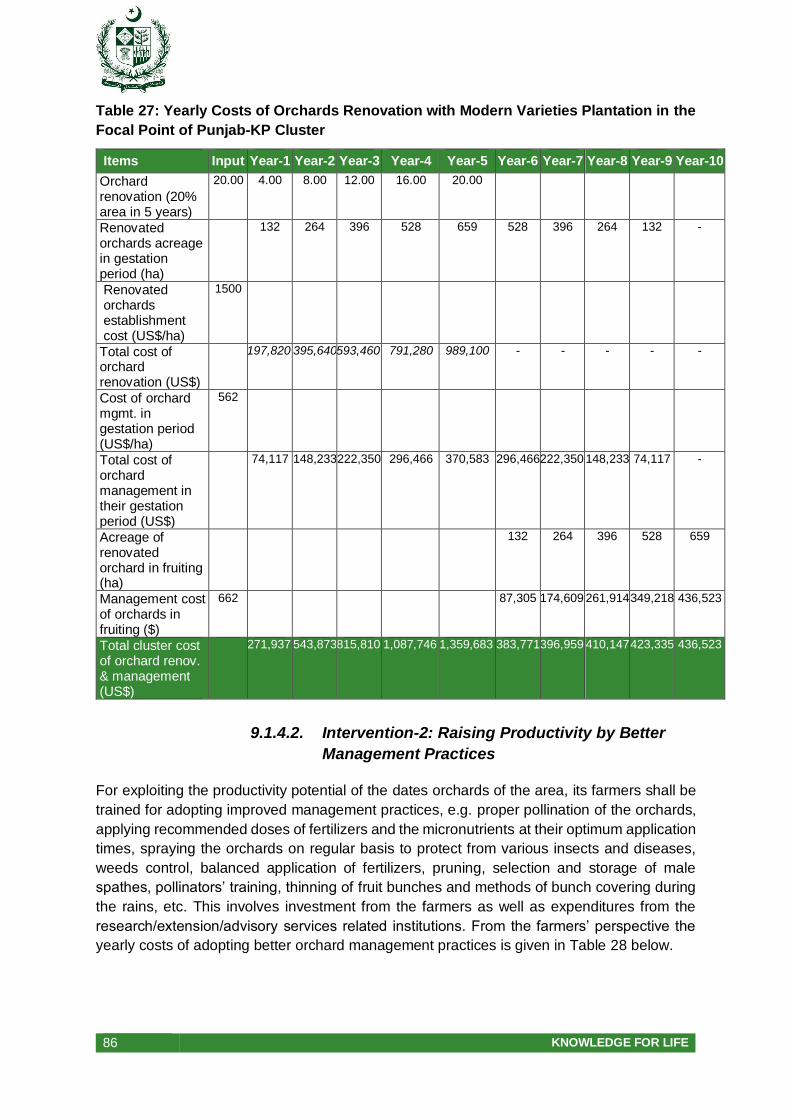
86 KNOWLEDGE FOR LIFE
Table 27: Yearly Costs of Orchards Renovation with Modern Varieties Plantation in the
Focal Point of Punjab-KP Cluster
Items Input Year-1 Year-2 Year-3 Year-4 Year-5 Year-6 Year-7 Year-8 Year-9 Year-10
Orchard renovation (20% area in 5 years)
20.00 4.00 8.00 12.00 16.00 20.00
Renovated orchards acreage in gestation period (ha)
132 264 396 528 659 528 396 264 132 -
Renovated orchards establishment cost (US$/ha)
1500
Total cost of orchard renovation (US$)
197,820 395,640 593,460 791,280 989,100 - - - - -
Cost of orchard mgmt. in gestation period (US$/ha)
562
Total cost of orchard management in their gestation period (US$)
74,117 148,233 222,350 296,466 370,583 296,466 222,350 148,233 74,117 -
Acreage of renovated orchard in fruiting (ha)
132 264 396 528 659
Management cost of orchards in fruiting ($)
662
87,305 174,609 261,914 349,218 436,523
Total cluster cost of orchard renov. & management (US$)
271,937 543,873 815,810 1,087,746 1,359,683 383,771 396,959 410,147 423,335 436,523
9.1.4.2. Intervention-2: Raising Productivity by Better
Management Practices
For exploiting the productivity potential of the dates orchards of the area, its farmers shall be
trained for adopting improved management practices, e.g. proper pollination of the orchards,
applying recommended doses of fertilizers and the micronutrients at their optimum application
times, spraying the orchards on regular basis to protect from various insects and diseases,
weeds control, balanced application of fertilizers, pruning, selection and storage of male
spathes, pollinators’ training, thinning of fruit bunches and methods of bunch covering during
the rains, etc. This involves investment from the farmers as well as expenditures from the
research/extension/advisory services related institutions. From the farmers’ perspective the
yearly costs of adopting better orchard management practices is given in Table 28 below.
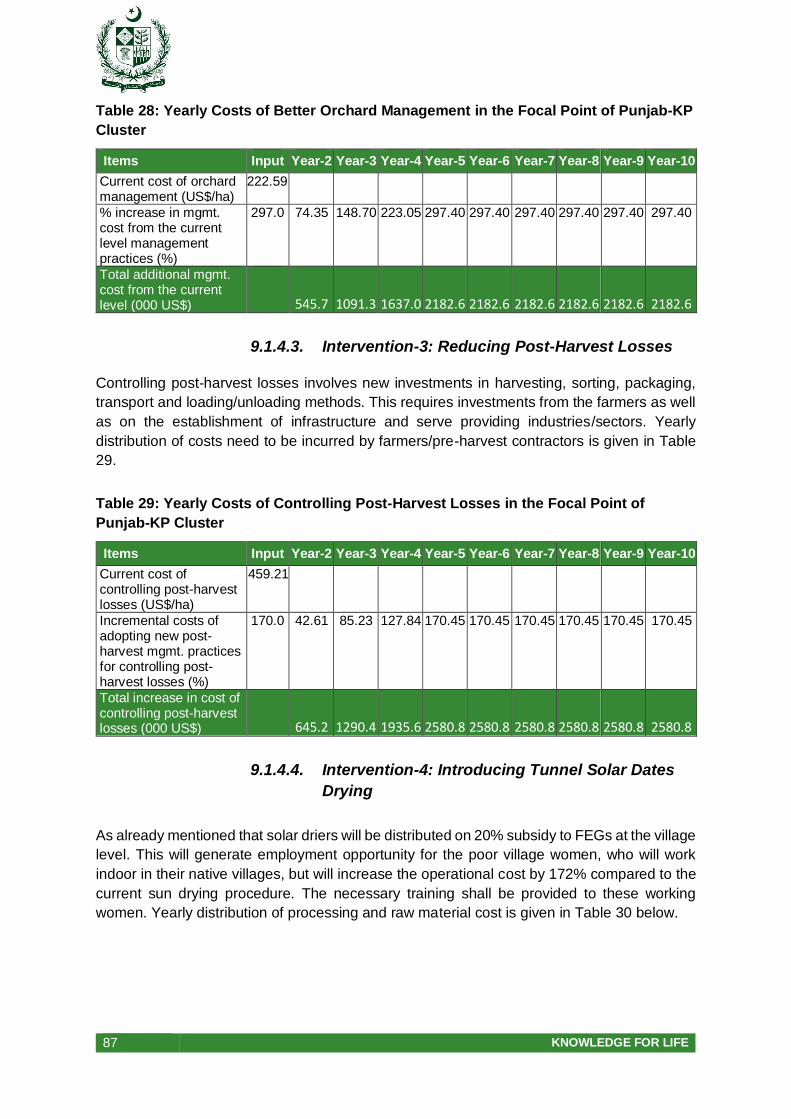
87 KNOWLEDGE FOR LIFE
Table 28: Yearly Costs of Better Orchard Management in the Focal Point of Punjab-KP
Cluster
Items Input Year-2 Year-3 Year-4 Year-5 Year-6 Year-7 Year-8 Year-9 Year-10
Current cost of orchard management (US$/ha)
222.59
% increase in mgmt. cost from the current level management practices (%)
297.0 74.35 148.70 223.05 297.40 297.40 297.40 297.40 297.40 297.40
Total additional mgmt. cost from the current level (000 US$)
545.7 1091.3 1637.0 2182.6 2182.6 2182.6 2182.6 2182.6 2182.6
9.1.4.3. Intervention-3: Reducing Post-Harvest Losses
Controlling post-harvest losses involves new investments in harvesting, sorting, packaging,
transport and loading/unloading methods. This requires investments from the farmers as well
as on the establishment of infrastructure and serve providing industries/sectors. Yearly
distribution of costs need to be incurred by farmers/pre-harvest contractors is given in Table
29.
Table 29: Yearly Costs of Controlling Post-Harvest Losses in the Focal Point of
Punjab-KP Cluster
Items Input Year-2 Year-3 Year-4 Year-5 Year-6 Year-7 Year-8 Year-9 Year-10
Current cost of controlling post-harvest losses (US$/ha)
459.21
Incremental costs of adopting new post-harvest mgmt. practices for controlling post-harvest losses (%)
170.0 42.61 85.23 127.84 170.45 170.45 170.45 170.45 170.45 170.45
Total increase in cost of controlling post-harvest losses (000 US$)
645.2 1290.4 1935.6 2580.8 2580.8 2580.8 2580.8 2580.8 2580.8
9.1.4.4. Intervention-4: Introducing Tunnel Solar Dates
Drying
As already mentioned that solar driers will be distributed on 20% subsidy to FEGs at the village
level. This will generate employment opportunity for the poor village women, who will work
indoor in their native villages, but will increase the operational cost by 172% compared to the
current sun drying procedure. The necessary training shall be provided to these working
women. Yearly distribution of processing and raw material cost is given in Table 30 below.
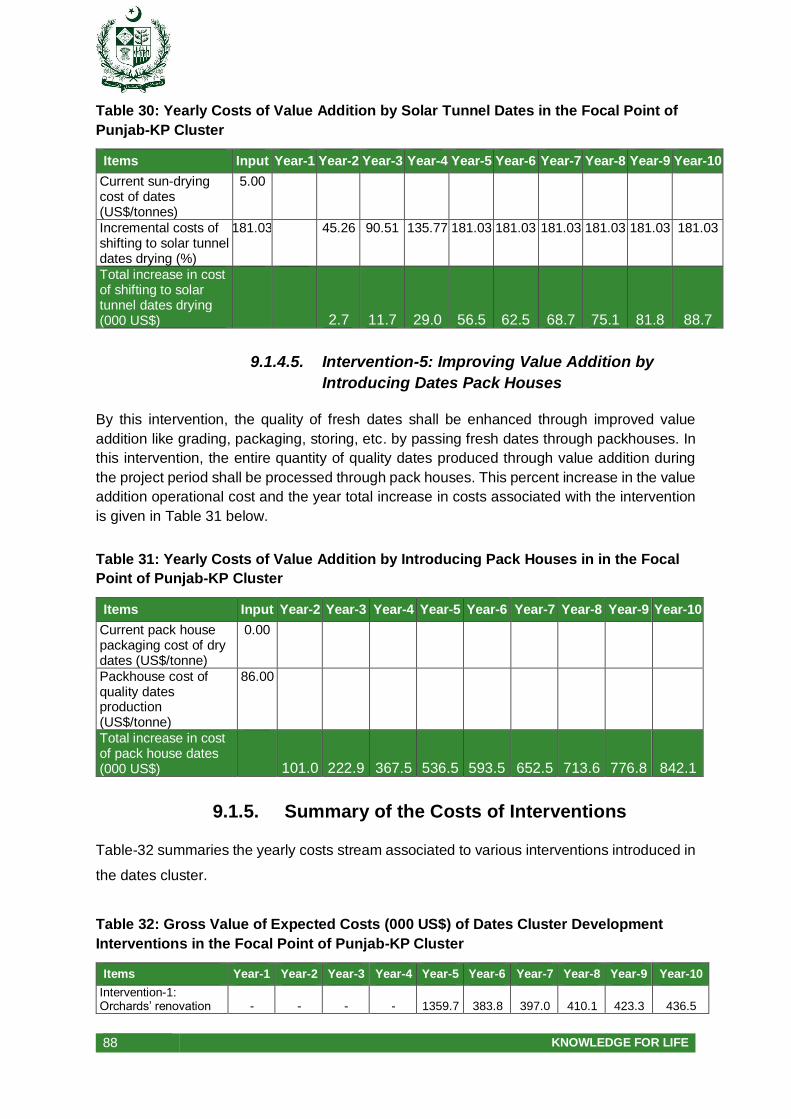
88 KNOWLEDGE FOR LIFE
Table 30: Yearly Costs of Value Addition by Solar Tunnel Dates in the Focal Point of
Punjab-KP Cluster
Items Input Year-1 Year-2 Year-3 Year-4 Year-5 Year-6 Year-7 Year-8 Year-9 Year-10
Current sun-drying cost of dates (US$/tonnes)
5.00
Incremental costs of shifting to solar tunnel dates drying (%)
181.03 45.26 90.51 135.77 181.03 181.03 181.03 181.03 181.03 181.03
Total increase in cost of shifting to solar tunnel dates drying (000 US$)
2.7 11.7 29.0 56.5 62.5 68.7 75.1 81.8 88.7
9.1.4.5. Intervention-5: Improving Value Addition by
Introducing Dates Pack Houses
By this intervention, the quality of fresh dates shall be enhanced through improved value
addition like grading, packaging, storing, etc. by passing fresh dates through packhouses. In
this intervention, the entire quantity of quality dates produced through value addition during
the project period shall be processed through pack houses. This percent increase in the value
addition operational cost and the year total increase in costs associated with the intervention
is given in Table 31 below.
Table 31: Yearly Costs of Value Addition by Introducing Pack Houses in in the Focal
Point of Punjab-KP Cluster
Items Input Year-2 Year-3 Year-4 Year-5 Year-6 Year-7 Year-8 Year-9 Year-10
Current pack house packaging cost of dry dates (US$/tonne)
0.00
Packhouse cost of quality dates production (US$/tonne)
86.00
Total increase in cost of pack house dates (000 US$)
101.0 222.9 367.5 536.5 593.5 652.5 713.6 776.8 842.1
9.1.5. Summary of the Costs of Interventions
Table-32 summaries the yearly costs stream associated to various interventions introduced in
the dates cluster.
Table 32: Gross Value of Expected Costs (000 US$) of Dates Cluster Development
Interventions in the Focal Point of Punjab-KP Cluster
Items Year-1 Year-2 Year-3 Year-4 Year-5 Year-6 Year-7 Year-8 Year-9 Year-10
Intervention-1: Orchards’ renovation - - - - 1359.7 383.8 397.0 410.1 423.3 436.5
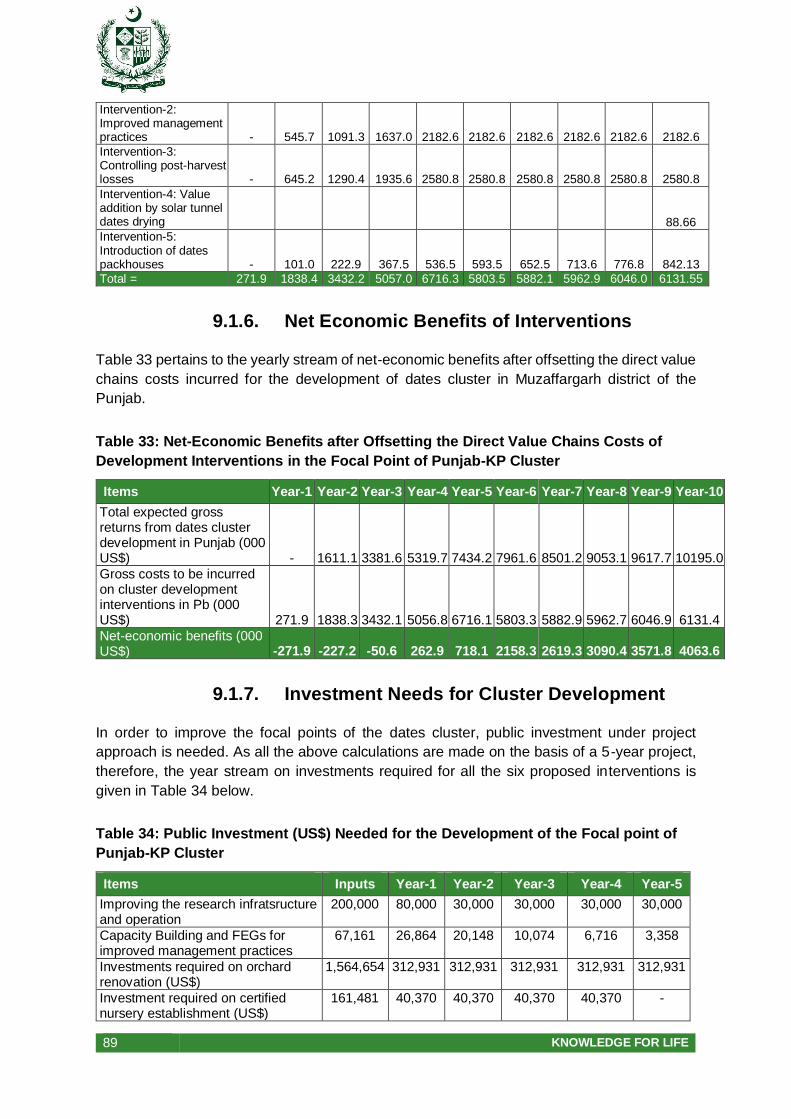
89 KNOWLEDGE FOR LIFE
Intervention-2: Improved management practices - 545.7 1091.3 1637.0 2182.6 2182.6 2182.6 2182.6 2182.6 2182.6
Intervention-3: Controlling post-harvest losses - 645.2 1290.4 1935.6 2580.8 2580.8 2580.8 2580.8 2580.8 2580.8
Intervention-4: Value addition by solar tunnel dates drying 88.66
Intervention-5: Introduction of dates packhouses - 101.0 222.9 367.5 536.5 593.5 652.5 713.6 776.8 842.13
Total = 271.9 1838.4 3432.2 5057.0 6716.3 5803.5 5882.1 5962.9 6046.0 6131.55
9.1.6. Net Economic Benefits of Interventions
Table 33 pertains to the yearly stream of net-economic benefits after offsetting the direct value
chains costs incurred for the development of dates cluster in Muzaffargarh district of the
Punjab.
Table 33: Net-Economic Benefits after Offsetting the Direct Value Chains Costs of
Development Interventions in the Focal Point of Punjab-KP Cluster
Items Year-1 Year-2 Year-3 Year-4 Year-5 Year-6 Year-7 Year-8 Year-9 Year-10
Total expected gross returns from dates cluster development in Punjab (000 US$) - 1611.1 3381.6 5319.7 7434.2 7961.6 8501.2 9053.1 9617.7 10195.0
Gross costs to be incurred on cluster development interventions in Pb (000 US$) 271.9 1838.3 3432.1 5056.8 6716.1 5803.3 5882.9 5962.7 6046.9 6131.4
Net-economic benefits (000 US$) -271.9 -227.2 -50.6 262.9 718.1 2158.3 2619.3 3090.4 3571.8 4063.6
9.1.7. Investment Needs for Cluster Development
In order to improve the focal points of the dates cluster, public investment under project
approach is needed. As all the above calculations are made on the basis of a 5-year project,
therefore, the year stream on investments required for all the six proposed interventions is
given in Table 34 below.
Table 34: Public Investment (US$) Needed for the Development of the Focal point of
Punjab-KP Cluster
Items Inputs Year-1 Year-2 Year-3 Year-4 Year-5
Improving the research infratsructure and operation
200,000 80,000 30,000 30,000 30,000 30,000
Capacity Building and FEGs for improved management practices
67,161 26,864 20,148 10,074 6,716 3,358
Investments required on orchard renovation (US$)
1,564,654 312,931 312,931 312,931 312,931 312,931
Investment required on certified nursery establishment (US$)
161,481 40,370 40,370 40,370 40,370 -

90 KNOWLEDGE FOR LIFE
Investments required on pack house (US$)
806,610 115,230 230,460 230,460 230,460 -
Investment required for solar dates driers
1,223,258 232,151 276,796 330,369 383,942 -
Government loans on private investment
233,435 39,949 58,334 64,495 70,656 -
Total Investments needed on the cluster (US$)
4,256,599 847,495 969,039 1,018,699 1,075,076 346,289
9.1.8. Economic Viability of Development Plan
In Table 35, the discounted value of stream of investments incurred under project approach
and the net-benefits achieved by the farming and non-farm business community are estimated
on yearly basis. It revealed that the Internal Rate of Returns (IRR) for the dates cluster
development in Muzaffargarh district is 26.12 percent clearly indicating an economically viable
project. It clearly implies that it is clearly worth investing into the cluster for the uplift of the
dates production in the area through various proposed farm, domestic and international
marketing level investments.
Table 35: Net-Present Value and Internal Rate of Returns on the Costs and
Investments in Muzaffargarh District Dates Cluster of Punjab
Items Inputs Year-1 Year-2 Year-3 Year-4 Year-5 Year-6 Year-7 Year-8 Year-9 Year-10
Overall net-benefit after deducting all costs & investments incurred in the cluster from the stream of benefits (000 US$) 11678.0 -1119.4 -1196.2
-1069.3 -812.2 371.8 2158.3 2619.3 3090.4 3571.8 4063.6
Discount rate 8.50%
Net-present value (US$)
4,699,139
Internal Rate of Returns (%)
26.12%
9.2. Sindh Dates Cluster (Khairpur Focal
Point)
9.2.1. Baseline Status or Prevailing Situation
The baseline status of the dates production in the cluster has been shown Table 36. At
present, total dates orchard area in the cluster is about 28.5 thousand ha produced nearly 237
thousand tonnes of dates in 2016-17. The mean dates yield falls at 8.33 tonnes/ha with an
average annual growth rate as 1.58% per annum and farm gate price as US$444.44/tonne.
The total value of output currently produced accounts US$105.380 Million. At current level of
growth rates in yield, very minor increase in earnings from dates can be expected (Table 36).
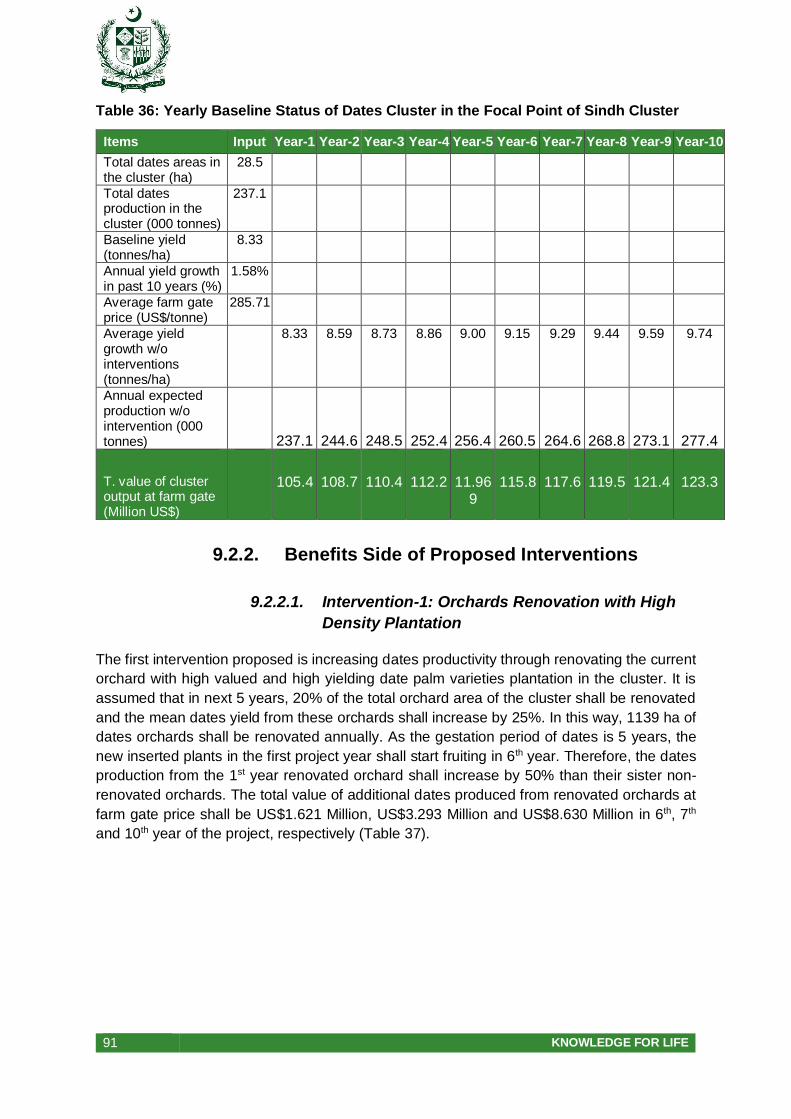
91 KNOWLEDGE FOR LIFE
Table 36: Yearly Baseline Status of Dates Cluster in the Focal Point of Sindh Cluster
Items Input Year-1 Year-2 Year-3 Year-4 Year-5 Year-6 Year-7 Year-8 Year-9 Year-10
Total dates areas in the cluster (ha)
28.5
Total dates production in the cluster (000 tonnes)
237.1
Baseline yield (tonnes/ha)
8.33
Annual yield growth in past 10 years (%)
1.58%
Average farm gate price (US$/tonne)
285.71
Average yield growth w/o interventions (tonnes/ha)
8.33 8.59 8.73 8.86 9.00 9.15 9.29 9.44 9.59 9.74
Annual expected production w/o intervention (000 tonnes)
237.1 244.6 248.5 252.4 256.4 260.5 264.6 268.8 273.1 277.4
T. value of cluster output at farm gate (Million US$)
105.4 108.7 110.4 112.2 11.969
115.8 117.6 119.5 121.4 123.3
9.2.2. Benefits Side of Proposed Interventions
9.2.2.1. Intervention-1: Orchards Renovation with High
Density Plantation
The first intervention proposed is increasing dates productivity through renovating the current
orchard with high valued and high yielding date palm varieties plantation in the cluster. It is
assumed that in next 5 years, 20% of the total orchard area of the cluster shall be renovated
and the mean dates yield from these orchards shall increase by 25%. In this way, 1139 ha of
dates orchards shall be renovated annually. As the gestation period of dates is 5 years, the
new inserted plants in the first project year shall start fruiting in 6th year. Therefore, the dates
production from the 1st year renovated orchard shall increase by 50% than their sister non-
renovated orchards. The total value of additional dates produced from renovated orchards at
farm gate price shall be US$1.621 Million, US$3.293 Million and US$8.630 Million in 6th, 7th
and 10th year of the project, respectively (Table 37).
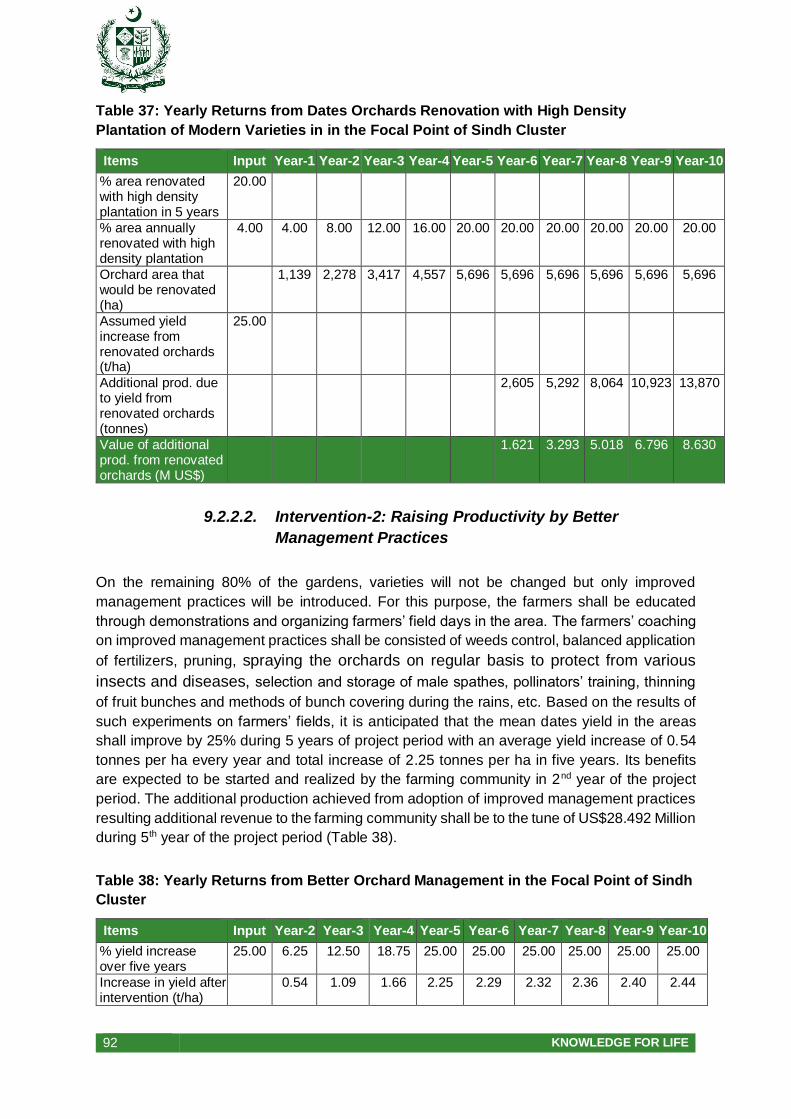
92 KNOWLEDGE FOR LIFE
Table 37: Yearly Returns from Dates Orchards Renovation with High Density
Plantation of Modern Varieties in in the Focal Point of Sindh Cluster
Items Input Year-1 Year-2 Year-3 Year-4 Year-5 Year-6 Year-7 Year-8 Year-9 Year-10
% area renovated with high density plantation in 5 years
20.00
% area annually renovated with high density plantation
4.00 4.00 8.00 12.00 16.00 20.00 20.00 20.00 20.00 20.00 20.00
Orchard area that would be renovated (ha)
1,139 2,278 3,417 4,557 5,696 5,696 5,696 5,696 5,696 5,696
Assumed yield increase from renovated orchards (t/ha)
25.00
Additional prod. due to yield from renovated orchards (tonnes)
2,605 5,292 8,064 10,923 13,870
Value of additional prod. from renovated orchards (M US$)
1.621 3.293 5.018 6.796 8.630
9.2.2.2. Intervention-2: Raising Productivity by Better
Management Practices
On the remaining 80% of the gardens, varieties will not be changed but only improved
management practices will be introduced. For this purpose, the farmers shall be educated
through demonstrations and organizing farmers’ field days in the area. The farmers’ coaching
on improved management practices shall be consisted of weeds control, balanced application
of fertilizers, pruning, spraying the orchards on regular basis to protect from various
insects and diseases, selection and storage of male spathes, pollinators’ training, thinning
of fruit bunches and methods of bunch covering during the rains, etc. Based on the results of
such experiments on farmers’ fields, it is anticipated that the mean dates yield in the areas
shall improve by 25% during 5 years of project period with an average yield increase of 0.54
tonnes per ha every year and total increase of 2.25 tonnes per ha in five years. Its benefits
are expected to be started and realized by the farming community in 2nd year of the project
period. The additional production achieved from adoption of improved management practices
resulting additional revenue to the farming community shall be to the tune of US$28.492 Million
during 5th year of the project period (Table 38).
Table 38: Yearly Returns from Better Orchard Management in the Focal Point of Sindh
Cluster
Items Input Year-2 Year-3 Year-4 Year-5 Year-6 Year-7 Year-8 Year-9 Year-10
% yield increase over five years
25.00 6.25 12.50 18.75 25.00 25.00 25.00 25.00 25.00 25.00
Increase in yield after intervention (t/ha)
0.54 1.09 1.66 2.25 2.29 2.32 2.36 2.40 2.44
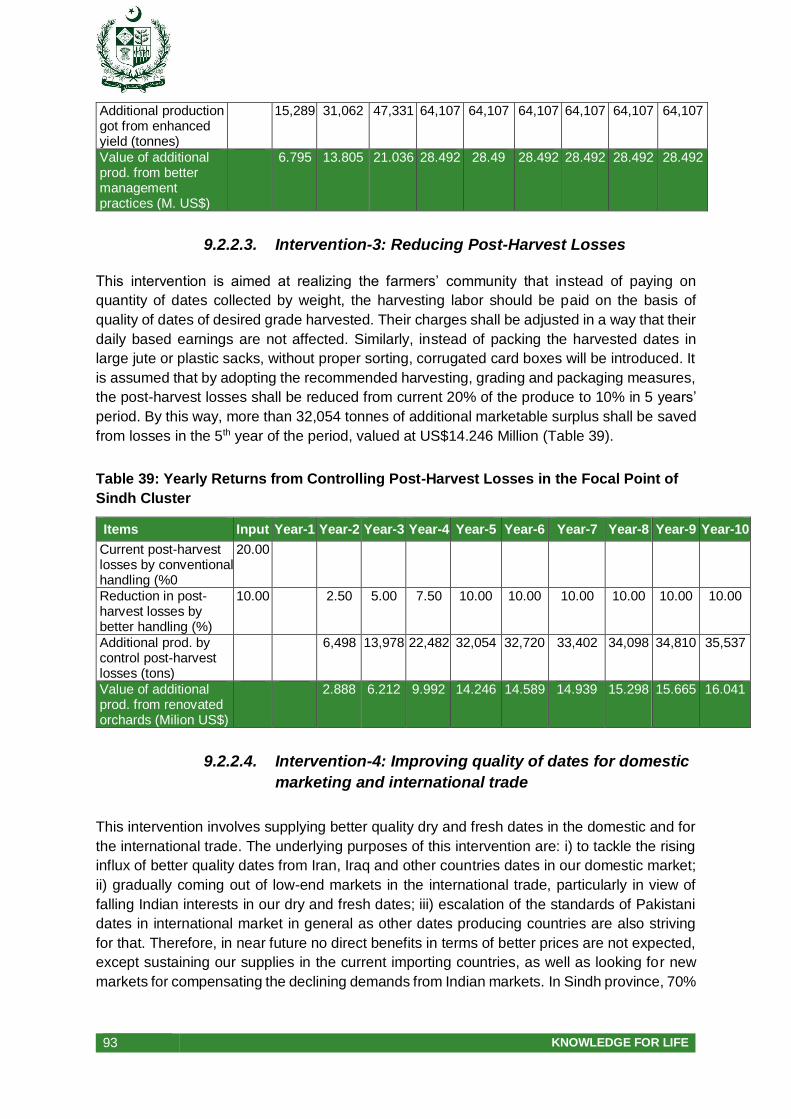
93 KNOWLEDGE FOR LIFE
Additional production got from enhanced yield (tonnes)
15,289 31,062 47,331 64,107 64,107 64,107 64,107 64,107 64,107
Value of additional prod. from better management practices (M. US$)
6.795 13.805 21.036 28.492 28.49 28.492 28.492 28.492 28.492
9.2.2.3. Intervention-3: Reducing Post-Harvest Losses
This intervention is aimed at realizing the farmers’ community that instead of paying on
quantity of dates collected by weight, the harvesting labor should be paid on the basis of
quality of dates of desired grade harvested. Their charges shall be adjusted in a way that their
daily based earnings are not affected. Similarly, instead of packing the harvested dates in
large jute or plastic sacks, without proper sorting, corrugated card boxes will be introduced. It
is assumed that by adopting the recommended harvesting, grading and packaging measures,
the post-harvest losses shall be reduced from current 20% of the produce to 10% in 5 years’
period. By this way, more than 32,054 tonnes of additional marketable surplus shall be saved
from losses in the 5th year of the period, valued at US$14.246 Million (Table 39).
Table 39: Yearly Returns from Controlling Post-Harvest Losses in the Focal Point of
Sindh Cluster
Items Input Year-1 Year-2 Year-3 Year-4 Year-5 Year-6 Year-7 Year-8 Year-9 Year-10
Current post-harvest losses by conventional handling (%0
20.00
Reduction in post-harvest losses by better handling (%)
10.00 2.50 5.00 7.50 10.00 10.00 10.00 10.00 10.00 10.00
Additional prod. by control post-harvest losses (tons)
6,498 13,978 22,482 32,054 32,720 33,402 34,098 34,810 35,537
Value of additional prod. from renovated orchards (Milion US$)
2.888 6.212 9.992 14.246 14.589 14.939 15.298 15.665 16.041
9.2.2.4. Intervention-4: Improving quality of dates for domestic
marketing and international trade
This intervention involves supplying better quality dry and fresh dates in the domestic and for
the international trade. The underlying purposes of this intervention are: i) to tackle the rising
influx of better quality dates from Iran, Iraq and other countries dates in our domestic market;
ii) gradually coming out of low-end markets in the international trade, particularly in view of
falling Indian interests in our dry and fresh dates; iii) escalation of the standards of Pakistani
dates in international market in general as other dates producing countries are also striving
for that. Therefore, in near future no direct benefits in terms of better prices are not expected,
except sustaining our supplies in the current importing countries, as well as looking for new
markets for compensating the declining demands from Indian markets. In Sindh province, 70%

94 KNOWLEDGE FOR LIFE
of total dates production is utilized for chohara making13. The trends in supplies so generated
from Khairpur district’s dates cluster is given in Table 40 below.
Table 40: Trends in Supplies of Quality Dates from the Focal Point of Sindh Cluster
Items Input Year-2 Year-3 Year-4 Year-5 Year-6 Year-7 Year-8 Year-9 Year-10
Chohara purpose doka production as percentage of total production (%)
70.00
Chohara purpose doka available (000tonnrd)
186.5 205.5 225.6 246.8 252.7 258.8 265.0 271.4 277.9
Current exports from the cluster (%)
40.00 40.00 40.00 40.00 40.00 40.00 40.00 40.00 40.00 40.00
Exports quality dates to be produced over five years (% of production)
40.00 40.00 40.00 40.00 40.00 40.00 40.00 40.00 40.00 40.00
Export quality dates produced (000 tonnes)
74.59
82.2 90.2 98.7 101.1 103.5 106.0 108.6 111.2
Total expected volume to be exported (%)
10.00 2.50 5.00 7.50 10.00 10.00 10.00 10.00 10.00 10.00
Quantity to be sold in domestic high-end market (10% of the domestic market) (000 tonnes)
4.66 10.27 16.92 24.68 31.59 38.82 46.38 54.28 62.53
Total qty. of quality dry dates available from the cluster for solar drying (tonnes)
79.26 92.46 107.15 123.41 132.69 14,35 152.4 162,84 173,63
9.2.2.5. Intervention-5: Introducing Solar Tunnel Dates Drying
This intervention involves supplying solar driers at the union council levels to FEGS at 20%
subsidy and collecting the processed dates by some packaging industry from these small
units. It is presumed that in 5-year project period, the 70% of total dates produced in the
cluster shall be processed for making chohara, which will later on shall be solar dried. In this
13 For chohara making, the dates are removed from the bunches at Khalal or Doka stage. It is boiled in big pans
and then either sun-dried under the open sky or using solar tunnel dryers or solar-cum-gas fired tunnel dryers. In
tunnel drying, the quality of dry dates or chohara produced is of better quality, clean, less humid and free from
dust particles.
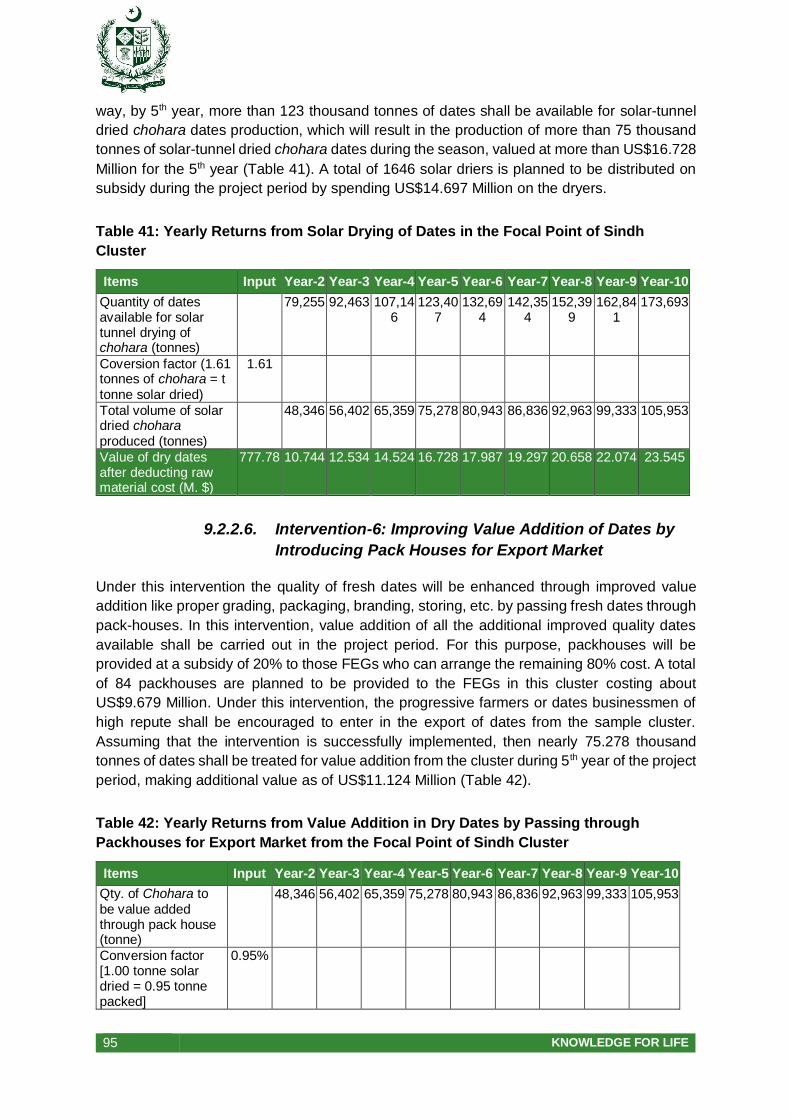
95 KNOWLEDGE FOR LIFE
way, by 5th year, more than 123 thousand tonnes of dates shall be available for solar-tunnel
dried chohara dates production, which will result in the production of more than 75 thousand
tonnes of solar-tunnel dried chohara dates during the season, valued at more than US$16.728
Million for the 5th year (Table 41). A total of 1646 solar driers is planned to be distributed on
subsidy during the project period by spending US$14.697 Million on the dryers.
Table 41: Yearly Returns from Solar Drying of Dates in the Focal Point of Sindh
Cluster
Items Input Year-2 Year-3 Year-4 Year-5 Year-6 Year-7 Year-8 Year-9 Year-10
Quantity of dates available for solar tunnel drying of chohara (tonnes)
79,255 92,463 107,146
123,407
132,694
142,354
152,399
162,841
173,693
Coversion factor (1.61 tonnes of chohara = t tonne solar dried)
1.61
Total volume of solar dried chohara produced (tonnes)
48,346 56,402 65,359 75,278 80,943 86,836 92,963 99,333 105,953
Value of dry dates after deducting raw material cost (M. $)
777.78 10.744 12.534 14.524 16.728 17.987 19.297 20.658 22.074 23.545
9.2.2.6. Intervention-6: Improving Value Addition of Dates by
Introducing Pack Houses for Export Market
Under this intervention the quality of fresh dates will be enhanced through improved value
addition like proper grading, packaging, branding, storing, etc. by passing fresh dates through
pack-houses. In this intervention, value addition of all the additional improved quality dates
available shall be carried out in the project period. For this purpose, packhouses will be
provided at a subsidy of 20% to those FEGs who can arrange the remaining 80% cost. A total
of 84 packhouses are planned to be provided to the FEGs in this cluster costing about
US$9.679 Million. Under this intervention, the progressive farmers or dates businessmen of
high repute shall be encouraged to enter in the export of dates from the sample cluster.
Assuming that the intervention is successfully implemented, then nearly 75.278 thousand
tonnes of dates shall be treated for value addition from the cluster during 5th year of the project
period, making additional value as of US$11.124 Million (Table 42).
Table 42: Yearly Returns from Value Addition in Dry Dates by Passing through
Packhouses for Export Market from the Focal Point of Sindh Cluster
Items Input Year-2 Year-3 Year-4 Year-5 Year-6 Year-7 Year-8 Year-9 Year-10
Qty. of Chohara to be value added through pack house (tonne)
48,346 56,402 65,359 75,278 80,943 86,836 92,963 99,333 105,953
Conversion factor [1.00 tonne solar dried = 0.95 tonne packed]
0.95%
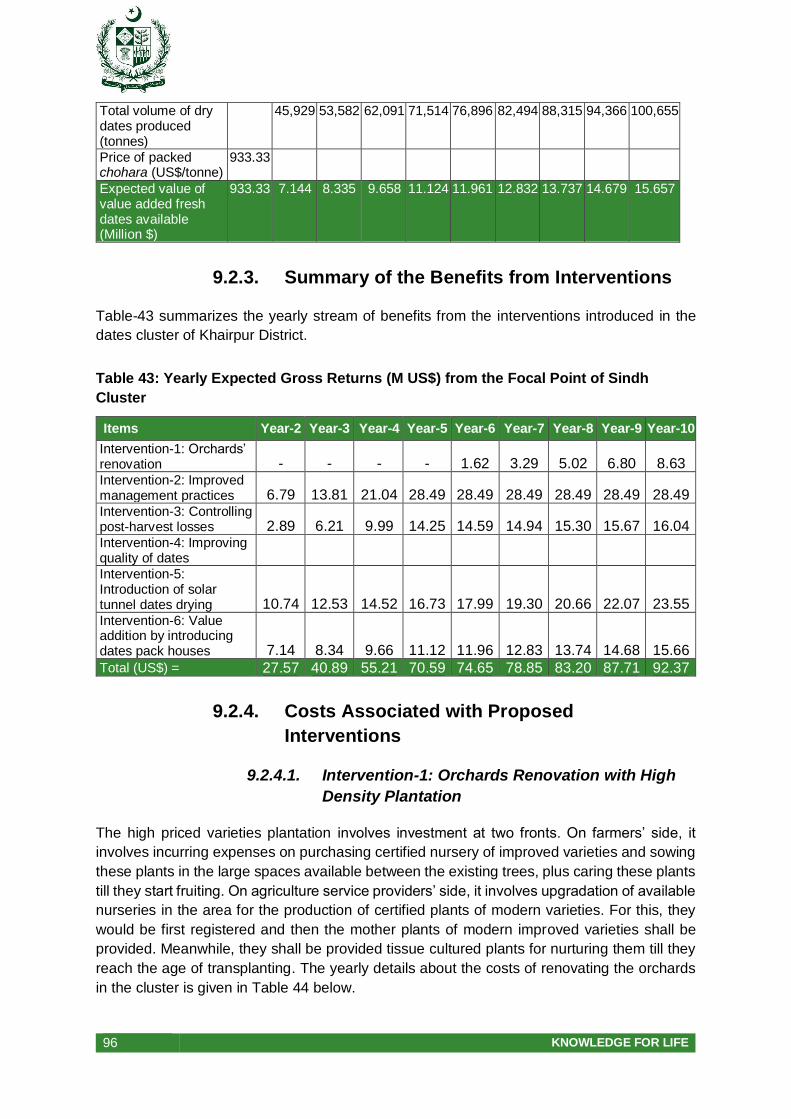
96 KNOWLEDGE FOR LIFE
Total volume of dry dates produced (tonnes)
45,929 53,582 62,091 71,514 76,896 82,494 88,315 94,366 100,655
Price of packed chohara (US$/tonne)
933.33
Expected value of value added fresh dates available (Million $)
933.33 7.144 8.335 9.658 11.124 11.961 12.832 13.737 14.679 15.657
9.2.3. Summary of the Benefits from Interventions
Table-43 summarizes the yearly stream of benefits from the interventions introduced in the
dates cluster of Khairpur District.
Table 43: Yearly Expected Gross Returns (M US$) from the Focal Point of Sindh
Cluster
Items Year-2 Year-3 Year-4 Year-5 Year-6 Year-7 Year-8 Year-9 Year-10
Intervention-1: Orchards’ renovation - - - - 1.62 3.29 5.02 6.80 8.63
Intervention-2: Improved management practices 6.79 13.81 21.04 28.49 28.49 28.49 28.49 28.49 28.49
Intervention-3: Controlling post-harvest losses 2.89 6.21 9.99 14.25 14.59 14.94 15.30 15.67 16.04
Intervention-4: Improving quality of dates Intervention-5: Introduction of solar tunnel dates drying 10.74 12.53 14.52 16.73 17.99 19.30 20.66 22.07 23.55
Intervention-6: Value addition by introducing dates pack houses 7.14 8.34 9.66 11.12 11.96 12.83 13.74 14.68 15.66
Total (US$) = 27.57 40.89 55.21 70.59 74.65 78.85 83.20 87.71 92.37
9.2.4. Costs Associated with Proposed
Interventions
9.2.4.1. Intervention-1: Orchards Renovation with High
Density Plantation
The high priced varieties plantation involves investment at two fronts. On farmers’ side, it
involves incurring expenses on purchasing certified nursery of improved varieties and sowing
these plants in the large spaces available between the existing trees, plus caring these plants
till they start fruiting. On agriculture service providers’ side, it involves upgradation of available
nurseries in the area for the production of certified plants of modern varieties. For this, they
would be first registered and then the mother plants of modern improved varieties shall be
provided. Meanwhile, they shall be provided tissue cultured plants for nurturing them till they
reach the age of transplanting. The yearly details about the costs of renovating the orchards
in the cluster is given in Table 44 below.
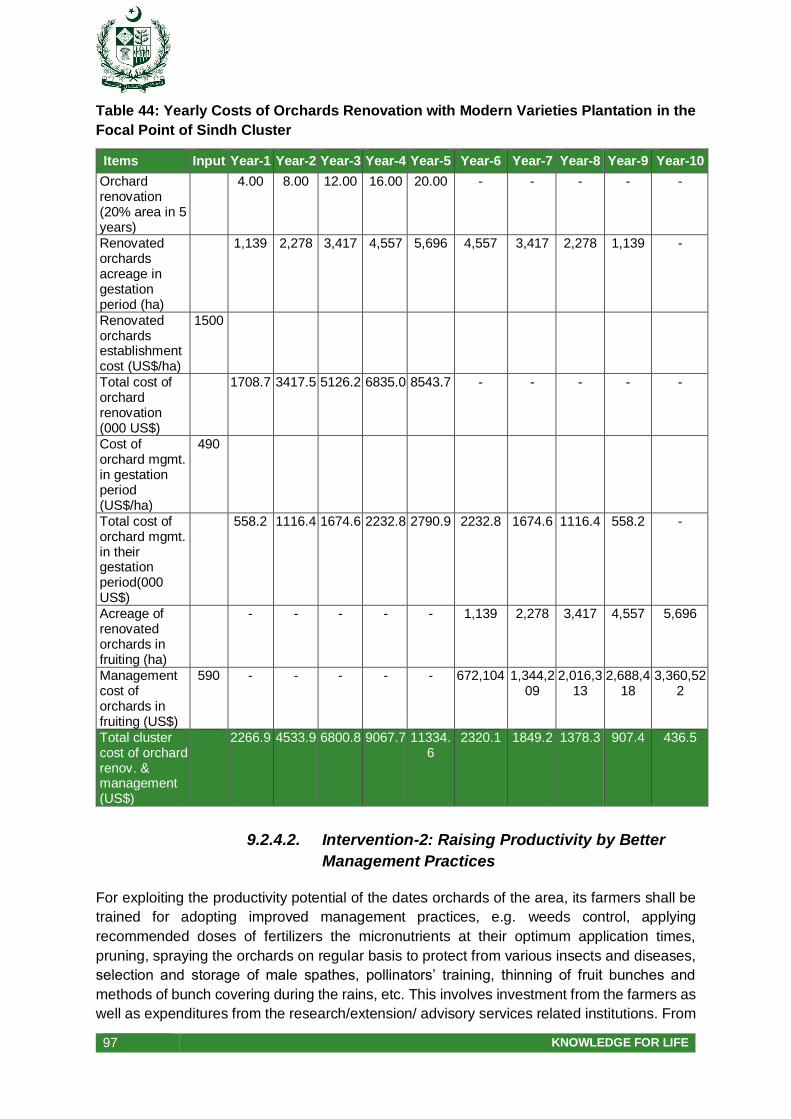
97 KNOWLEDGE FOR LIFE
Table 44: Yearly Costs of Orchards Renovation with Modern Varieties Plantation in the
Focal Point of Sindh Cluster
Items Input Year-1 Year-2 Year-3 Year-4 Year-5 Year-6 Year-7 Year-8 Year-9 Year-10
Orchard renovation (20% area in 5 years)
4.00 8.00 12.00 16.00 20.00 - - - - -
Renovated orchards acreage in gestation period (ha)
1,139 2,278 3,417 4,557 5,696 4,557 3,417 2,278 1,139 -
Renovated orchards establishment cost (US$/ha)
1500
Total cost of orchard renovation (000 US$)
1708.7 3417.5 5126.2 6835.0 8543.7 - - - - -
Cost of orchard mgmt. in gestation period (US$/ha)
490
Total cost of orchard mgmt. in their gestation period(000 US$)
558.2 1116.4 1674.6 2232.8 2790.9 2232.8 1674.6 1116.4 558.2 -
Acreage of renovated orchards in fruiting (ha)
- - - - - 1,139 2,278 3,417 4,557 5,696
Management cost of orchards in fruiting (US$)
590 - - - - - 672,104 1,344,209
2,016,313
2,688,418
3,360,522
Total cluster cost of orchard renov. & management (US$)
2266.9 4533.9 6800.8 9067.7 11334.6
2320.1 1849.2 1378.3 907.4 436.5
9.2.4.2. Intervention-2: Raising Productivity by Better
Management Practices
For exploiting the productivity potential of the dates orchards of the area, its farmers shall be
trained for adopting improved management practices, e.g. weeds control, applying
recommended doses of fertilizers the micronutrients at their optimum application times,
pruning, spraying the orchards on regular basis to protect from various insects and diseases,
selection and storage of male spathes, pollinators’ training, thinning of fruit bunches and
methods of bunch covering during the rains, etc. This involves investment from the farmers as
well as expenditures from the research/extension/ advisory services related institutions. From
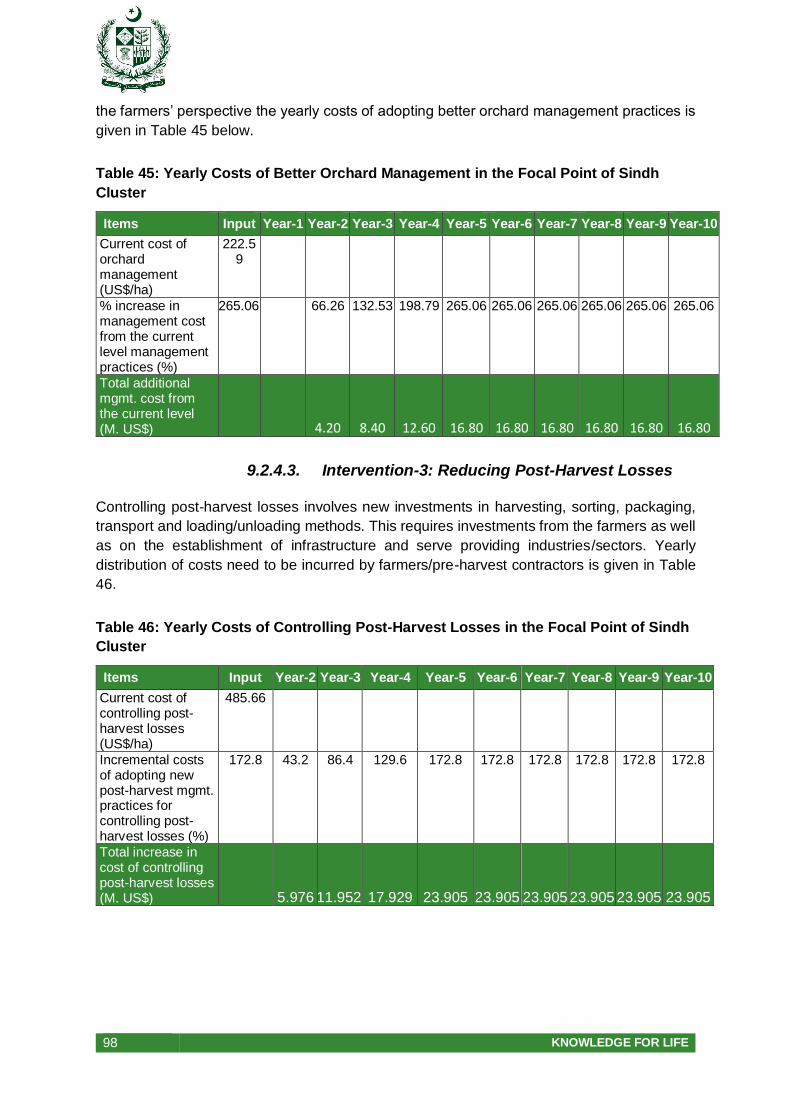
98 KNOWLEDGE FOR LIFE
the farmers’ perspective the yearly costs of adopting better orchard management practices is
given in Table 45 below.
Table 45: Yearly Costs of Better Orchard Management in the Focal Point of Sindh
Cluster
Items Input Year-1 Year-2 Year-3 Year-4 Year-5 Year-6 Year-7 Year-8 Year-9 Year-10
Current cost of orchard management (US$/ha)
222.59
% increase in management cost from the current level management practices (%)
265.06 66.26 132.53 198.79 265.06 265.06 265.06 265.06 265.06 265.06
Total additional mgmt. cost from the current level (M. US$)
4.20 8.40 12.60 16.80 16.80 16.80 16.80 16.80 16.80
9.2.4.3. Intervention-3: Reducing Post-Harvest Losses
Controlling post-harvest losses involves new investments in harvesting, sorting, packaging,
transport and loading/unloading methods. This requires investments from the farmers as well
as on the establishment of infrastructure and serve providing industries/sectors. Yearly
distribution of costs need to be incurred by farmers/pre-harvest contractors is given in Table
46.
Table 46: Yearly Costs of Controlling Post-Harvest Losses in the Focal Point of Sindh
Cluster
Items Input Year-2 Year-3 Year-4 Year-5 Year-6 Year-7 Year-8 Year-9 Year-10
Current cost of controlling post-harvest losses (US$/ha)
485.66
Incremental costs of adopting new post-harvest mgmt. practices for controlling post-harvest losses (%)
172.8 43.2 86.4 129.6 172.8 172.8 172.8 172.8 172.8 172.8
Total increase in cost of controlling post-harvest losses (M. US$)
5.976 11.952 17.929 23.905 23.905 23.905 23.905 23.905 23.905
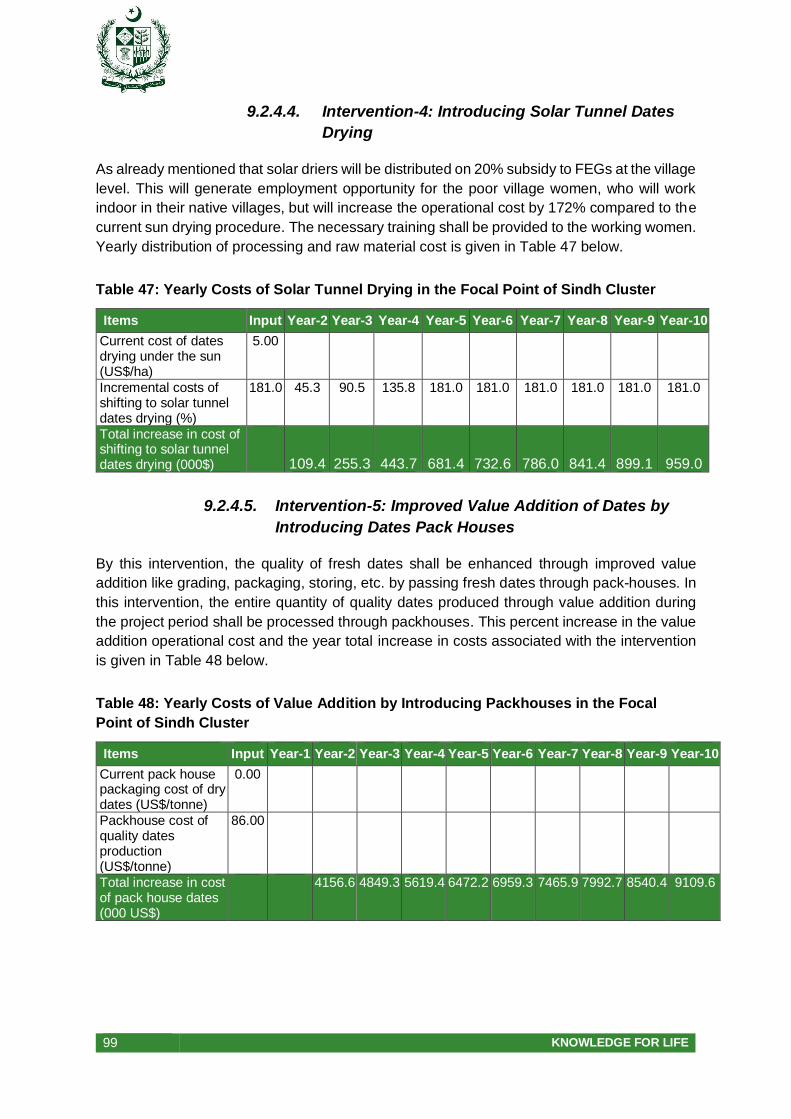
99 KNOWLEDGE FOR LIFE
9.2.4.4. Intervention-4: Introducing Solar Tunnel Dates
Drying
As already mentioned that solar driers will be distributed on 20% subsidy to FEGs at the village
level. This will generate employment opportunity for the poor village women, who will work
indoor in their native villages, but will increase the operational cost by 172% compared to the
current sun drying procedure. The necessary training shall be provided to the working women.
Yearly distribution of processing and raw material cost is given in Table 47 below.
Table 47: Yearly Costs of Solar Tunnel Drying in the Focal Point of Sindh Cluster
Items Input Year-2 Year-3 Year-4 Year-5 Year-6 Year-7 Year-8 Year-9 Year-10
Current cost of dates drying under the sun (US$/ha)
5.00
Incremental costs of shifting to solar tunnel dates drying (%)
181.0 45.3 90.5 135.8 181.0 181.0 181.0 181.0 181.0 181.0
Total increase in cost of shifting to solar tunnel dates drying (000$)
109.4 255.3 443.7 681.4 732.6 786.0 841.4 899.1 959.0
9.2.4.5. Intervention-5: Improved Value Addition of Dates by
Introducing Dates Pack Houses
By this intervention, the quality of fresh dates shall be enhanced through improved value
addition like grading, packaging, storing, etc. by passing fresh dates through pack-houses. In
this intervention, the entire quantity of quality dates produced through value addition during
the project period shall be processed through packhouses. This percent increase in the value
addition operational cost and the year total increase in costs associated with the intervention
is given in Table 48 below.
Table 48: Yearly Costs of Value Addition by Introducing Packhouses in the Focal
Point of Sindh Cluster
Items Input Year-1 Year-2 Year-3 Year-4 Year-5 Year-6 Year-7 Year-8 Year-9 Year-10
Current pack house packaging cost of dry dates (US$/tonne)
0.00
Packhouse cost of quality dates production (US$/tonne)
86.00
Total increase in cost of pack house dates (000 US$)
4156.6 4849.3 5619.4 6472.2 6959.3 7465.9 7992.7 8540.4 9109.6

100 KNOWLEDGE FOR LIFE
9.2.5. Summary of the Costs of Interventions
Table-49 summaries the yearly costs stream associated to various interventions introduced in
the dates cluster.
Table 49: Gross Value of Expected Costs (M. US$) of Dates Cluster Development
Interventions in the Focal Point of Sindh Cluster
Items Year-1 Year-2 Year-3 Year-4 Year-5 Year-6 Year-7 Year-8 Year-9 Year-10
Intervention-1: Orchards’ renovation
2.267 4.534 6.801 9.068 11.335 2.320 1.849 1.378 0.907 0.437
Intervention-2: Improved management practices
- 4.201 8.401 12.602 16.803 16.803 16.803 16.803 16.803 16.803
Intervention-3: Controlling post-harvest losses
- 5.976 11.952 17.929 23.905 23.905 23.905 23.905 23.905 23.905
Intervention-4: Value addition by solar tunnel dates drying
- 0.109 0.255 0.444 0.681 0.733 0.786 0.841 0.899 0.959
Intervention-5: Introduction of dates packhouses
- 4.157 4.849 5.619 6.472 6.959 7.466 7.993 8.540 9.110
Total = 2.267 18.977 32.259 45.662 59.196 51.306 51.981 52.678 53.398 54.142
9.2.6. Net Economic Benefits
Table 50 pertains to the yearly stream of net-economic benefits after offsetting the direct value
chains costs incurred for the development of dates cluster in Khairpur district of the Sindh.
Table 50: Net-Economic Benefits after Offsetting the Direct Value Chains Costs of
Development Interventions in the Focal Point of Sindh Cluster
Items Year-1 Year-2 Year-3 Year-4 Year-5 Year-6 Year-7 Year-8 Year-9 Year-10
Total expected gross returns from dates cluster develop. in Sindh (000 US$)
- 27570.8 40886.5 55210.8 70591.2 74650.8 78853.8 83204.5 87707.1 92365.9
Gross costs to be incurred on cluster development interventions in Sindh (000 US$)
2266.9 18976.8 32259.2 45661.5 59195.8 51305.5 51980.5 52677.9 53398.3 54142.4
Net-economic benefits (000 US$)
-2266.9 8594.0 8627.3 9549.3 11395.4 23345.2 26873.3 30526.7 34308.9 38223.5
9.2.7. Investments Need for Cluster Development
In order to improve the sample dates cluster, public investment under project approach is
needed. As all the above calculations are made on the basis of a 5-year project, therefore, the
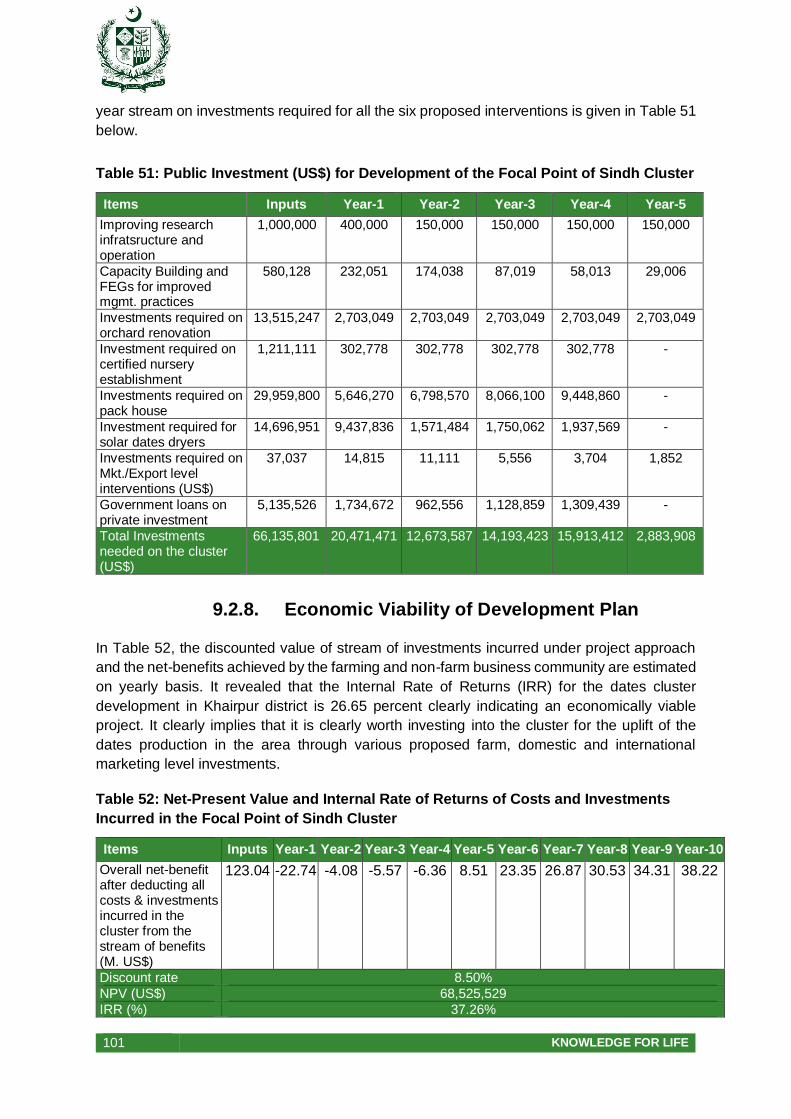
101 KNOWLEDGE FOR LIFE
year stream on investments required for all the six proposed interventions is given in Table 51
below.
Table 51: Public Investment (US$) for Development of the Focal Point of Sindh Cluster
Items Inputs Year-1 Year-2 Year-3 Year-4 Year-5
Improving research infratsructure and operation
1,000,000 400,000 150,000 150,000 150,000 150,000
Capacity Building and FEGs for improved mgmt. practices
580,128 232,051 174,038 87,019 58,013 29,006
Investments required on orchard renovation
13,515,247 2,703,049 2,703,049 2,703,049 2,703,049 2,703,049
Investment required on certified nursery establishment
1,211,111 302,778 302,778 302,778 302,778 -
Investments required on pack house
29,959,800 5,646,270 6,798,570 8,066,100 9,448,860 -
Investment required for solar dates dryers
14,696,951 9,437,836 1,571,484 1,750,062 1,937,569 -
Investments required on Mkt./Export level interventions (US$)
37,037 14,815 11,111 5,556 3,704 1,852
Government loans on private investment
5,135,526 1,734,672 962,556 1,128,859 1,309,439 -
Total Investments needed on the cluster (US$)
66,135,801 20,471,471 12,673,587 14,193,423 15,913,412 2,883,908
9.2.8. Economic Viability of Development Plan
In Table 52, the discounted value of stream of investments incurred under project approach
and the net-benefits achieved by the farming and non-farm business community are estimated
on yearly basis. It revealed that the Internal Rate of Returns (IRR) for the dates cluster
development in Khairpur district is 26.65 percent clearly indicating an economically viable
project. It clearly implies that it is clearly worth investing into the cluster for the uplift of the
dates production in the area through various proposed farm, domestic and international
marketing level investments.
Table 52: Net-Present Value and Internal Rate of Returns of Costs and Investments
Incurred in the Focal Point of Sindh Cluster
Items Inputs Year-1 Year-2 Year-3 Year-4 Year-5 Year-6 Year-7 Year-8 Year-9 Year-10
Overall net-benefit after deducting all costs & investments incurred in the cluster from the stream of benefits (M. US$)
123.04 -22.74 -4.08 -5.57 -6.36 8.51 23.35 26.87 30.53 34.31 38.22
Discount rate 8.50%
NPV (US$) 68,525,529
IRR (%) 37.26%
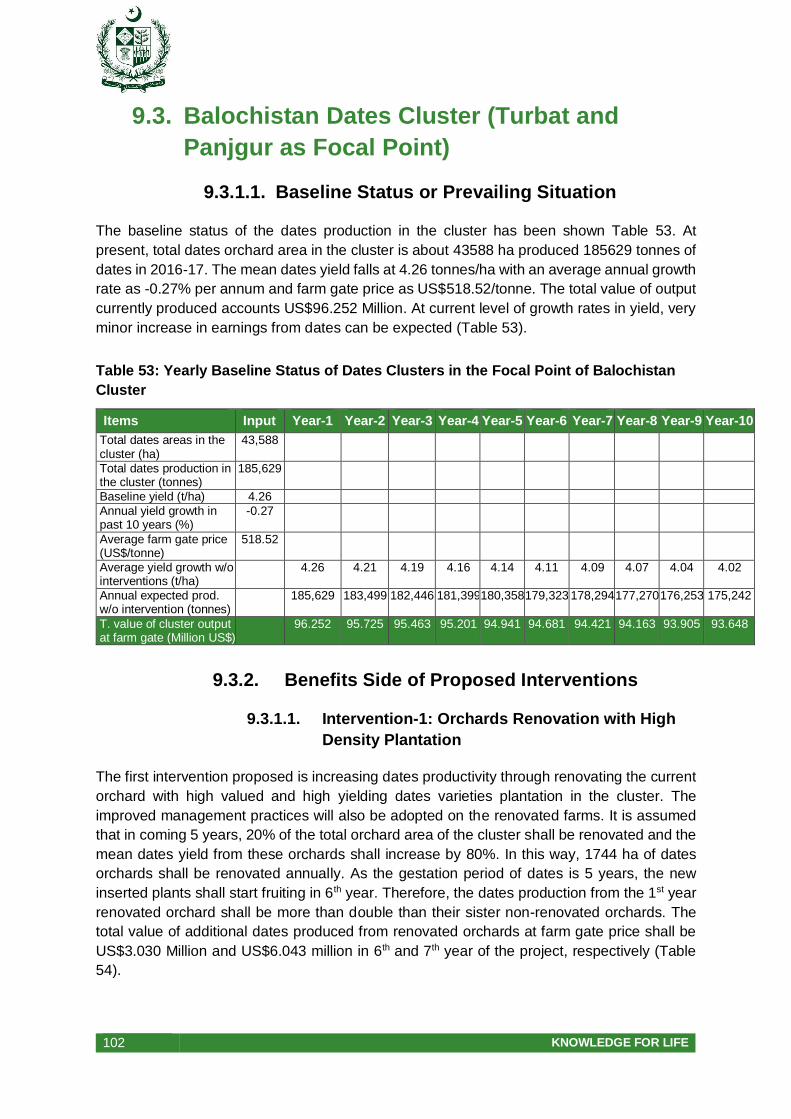
102 KNOWLEDGE FOR LIFE
9.3. Balochistan Dates Cluster (Turbat and
Panjgur as Focal Point)
9.3.1.1. Baseline Status or Prevailing Situation
The baseline status of the dates production in the cluster has been shown Table 53. At
present, total dates orchard area in the cluster is about 43588 ha produced 185629 tonnes of
dates in 2016-17. The mean dates yield falls at 4.26 tonnes/ha with an average annual growth
rate as -0.27% per annum and farm gate price as US$518.52/tonne. The total value of output
currently produced accounts US$96.252 Million. At current level of growth rates in yield, very
minor increase in earnings from dates can be expected (Table 53).
Table 53: Yearly Baseline Status of Dates Clusters in the Focal Point of Balochistan
Cluster
Items Input Year-1 Year-2 Year-3 Year-4 Year-5 Year-6 Year-7 Year-8 Year-9 Year-10
Total dates areas in the cluster (ha)
43,588
Total dates production in the cluster (tonnes)
185,629
Baseline yield (t/ha) 4.26
Annual yield growth in past 10 years (%)
-0.27
Average farm gate price (US$/tonne)
518.52
Average yield growth w/o interventions (t/ha)
4.26 4.21 4.19 4.16 4.14 4.11 4.09 4.07 4.04 4.02
Annual expected prod. w/o intervention (tonnes)
185,629 183,499 182,446 181,399 180,358 179,323 178,294 177,270 176,253 175,242
T. value of cluster output at farm gate (Million US$)
96.252 95.725 95.463 95.201 94.941 94.681 94.421 94.163 93.905 93.648
9.3.2. Benefits Side of Proposed Interventions
9.3.1.1. Intervention-1: Orchards Renovation with High
Density Plantation
The first intervention proposed is increasing dates productivity through renovating the current
orchard with high valued and high yielding dates varieties plantation in the cluster. The
improved management practices will also be adopted on the renovated farms. It is assumed
that in coming 5 years, 20% of the total orchard area of the cluster shall be renovated and the
mean dates yield from these orchards shall increase by 80%. In this way, 1744 ha of dates
orchards shall be renovated annually. As the gestation period of dates is 5 years, the new
inserted plants shall start fruiting in 6th year. Therefore, the dates production from the 1st year
renovated orchard shall be more than double than their sister non-renovated orchards. The
total value of additional dates produced from renovated orchards at farm gate price shall be
US$3.030 Million and US$6.043 million in 6th and 7th year of the project, respectively (Table
54).

103 KNOWLEDGE FOR LIFE
Table 54: Yearly Returns from Orchards Renovation with High Density Plantation of
Modern Varieties in the Focal Point of Balochistan Cluster
Items Input Year-1 Year-2 Year-3 Year-4 Year-5 Year-6 Year-7 Year-8 Year-9 Year-10
% area renovated with high density plantation in 5 years
20.00
% area annually renovated with high density plantation
4.00 4.00 8.00 12.00 16.00 20.00 20.00 20.00 20.00 20.00 20.00
Orchard area to be renovated (ha)
1,744 3,487 5,231 6,974 8,718 8,718 8,718 8,718 8,718 8,718
Assumed yield increase from renovated orchards (t/ha)
80.00
Additional prod. due to yield from renovat. orchards (tonnes)
- - - - - - 5,843 11,654 17,434 23,181 28,897
Value of additional production from renovated orchards (M. US$)
- - - - - - 3.030 6.043 9.040 12.020 14.984
9.3.1.2. Intervention-2: Raising Productivity by Better
Management Practices
On the remaining 80% of the gardens, varieties will not be changed but only improved
management practices will be introduced. For this purpose, the farmers shall be educated
through demonstrations and organizing farmers’ field days in the area. The farmers’ coaching
on improved management practices shall be consisted of weeds control, balanced application
of fertilizers, pruning, spraying the orchards on regular basis to protect from various
insects and diseases, selection and storage of male spathes, pollinators’ training, thinning
of fruit bunches and methods of bunch covering during the rains. Based on the results of such
experiments on farmers’ fields, it is anticipated that the mean dates yield in the areas shall
improve by 25% during 5 years of project period with an average yield increase of 0.26 tonnes
per ha every year and total increase of 1.05 tonnes per ha in five years. Its benefits are
expected to be started and realized by the farming community in 2nd year of the project period.
The additional production achieved from adoption of improved management practices
resulting additional revenue to the farming community is shown in Table 55.
Table 55: Yearly Returns from Better Orchard Management in the Focal Point of
Balochistan Cluster
Items Input Year-1 Year-2 Year-3 Year-4 Year-5 Year-6 Year-7 Year-8 Year-9 Year-10
% yield increase over five years (%)
25.00 6.25 12.50 18.75 25.00 25.00 25.00 25.00 25.00 25.00
Increase in yield after intervention (t/ha)
0.26 0.53 0.79 1.05 1.05 1.04 1.04 1.04 1.04

104 KNOWLEDGE FOR LIFE
Additional production got from enhanced yield (tonnes)
11,538 23,013 34,425 45,775 45,775 45,775 45,775 45,775 45,775
Value of additional prod. from better management practices (Milion $)
5.982 11.932 17.850 23.735 23.735 23.735 23.735 23.735 23.735
9.3.1.3. Intervention-3: Reducing Post-Harvest Losses
This intervention is aimed at realizing the farmers’ community that instead of paying on
quantity of dates collected by weight, the harvesting labor should be paid on the basis of
quality of dates of desired grade harvested. Their charges shall be adjusted in a way that their
daily based earnings are not affected. Similarly, instead of packing the harvested dates in
large jute or plastic sacks, without proper sorting, corrugated card boxes will be introduced. It
is assumed that by adopting the recommended harvesting, grading and packaging measures,
the post-harvest losses shall be reduced from current 30% of the produce to 10% in 5 years’
period. By this way, more than 45,775 tonnes of additional marketable surplus shall be saved
from losses in the 5th year of the period, valued at US$23.735 million (Table 56).
Table 56: Yearly Returns from Controlling Post-Harvest Losses in the Focal Point of
Balochistan Cluster
Items Input Year-1 Year-2 Year-3 Year-4 Year-5 Year-6 Year-7 Year-8 Year-9 Year-10
Current post-harvest losses by traditional handling (%)
30.00
Reduction in post-harvest losses by better handling (%)
10.00 - 5.00 10.00 15.00 20.00 20.00 20.00 20.00 20.00 20.00
Additional prod. by control post-harvest losses (tonnes)
9,808 20,712 32,704 45,775 46,843 47,905 48,962 50,012 51,056
Value of additional prod. from renovated orchards (Milion $)
5.085 10.740 16.958 23.735 24.289 24.840 25.388 25.932 26.473
9.3.1.4. Intervention-4: Improving quality of dates for
domestic marketing and international trade
This intervention involves supplying better quality dry and fresh dates in the domestic and for
the international trade. The underlying purposes of this intervention are: i) to tackle the rising
influx of better quality dates from Iran, Iraq and other countries dates in our domestic market;
ii) gradually coming out of low-end markets in the international trade, particularly in view of
falling Indian interests in our dry and fresh dates; iii) escalation of the standards of Pakistani
dates in international market in general as other dates producing countries are also striving
for that. Therefore, in near future no direct benefits in terms of better prices are not expected,
except sustaining our supplies in the current importing countries, as well as looking for new
markets for compensating the declining demands from Indian markets. In Balochistan
province, 90% of total dates production is utilized for fresh dates making. The trends in
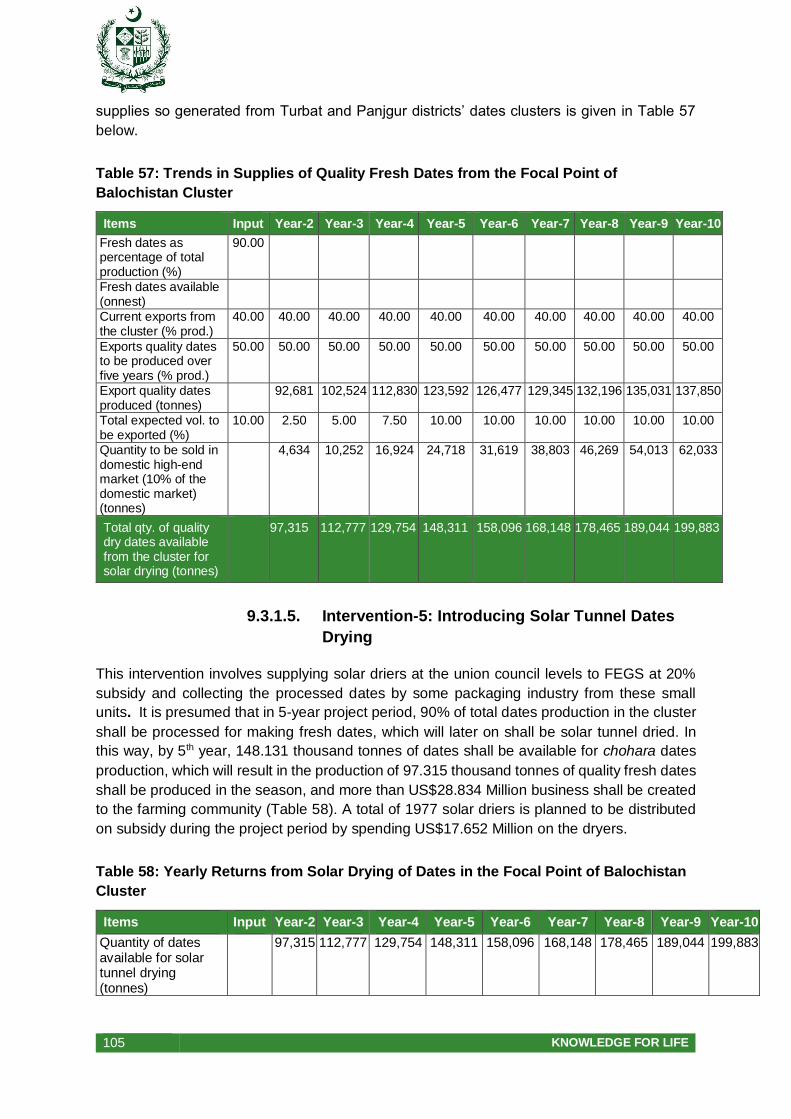
105 KNOWLEDGE FOR LIFE
supplies so generated from Turbat and Panjgur districts’ dates clusters is given in Table 57
below.
Table 57: Trends in Supplies of Quality Fresh Dates from the Focal Point of
Balochistan Cluster
Items Input Year-2 Year-3 Year-4 Year-5 Year-6 Year-7 Year-8 Year-9 Year-10
Fresh dates as percentage of total production (%)
90.00
Fresh dates available (onnest)
Current exports from the cluster (% prod.)
40.00 40.00 40.00 40.00 40.00 40.00 40.00 40.00 40.00 40.00
Exports quality dates to be produced over five years (% prod.)
50.00 50.00 50.00 50.00 50.00 50.00 50.00 50.00 50.00 50.00
Export quality dates produced (tonnes)
92,681 102,524 112,830 123,592 126,477 129,345 132,196 135,031 137,850
Total expected vol. to be exported (%)
10.00 2.50 5.00 7.50 10.00 10.00 10.00 10.00 10.00 10.00
Quantity to be sold in domestic high-end market (10% of the domestic market) (tonnes)
4,634 10,252 16,924 24,718 31,619 38,803 46,269 54,013 62,033
Total qty. of quality dry dates available from the cluster for solar drying (tonnes)
97,315 112,777 129,754 148,311 158,096 168,148 178,465 189,044 199,883
9.3.1.5. Intervention-5: Introducing Solar Tunnel Dates
Drying
This intervention involves supplying solar driers at the union council levels to FEGS at 20%
subsidy and collecting the processed dates by some packaging industry from these small
units. It is presumed that in 5-year project period, 90% of total dates production in the cluster
shall be processed for making fresh dates, which will later on shall be solar tunnel dried. In
this way, by 5th year, 148.131 thousand tonnes of dates shall be available for chohara dates
production, which will result in the production of 97.315 thousand tonnes of quality fresh dates
shall be produced in the season, and more than US$28.834 Million business shall be created
to the farming community (Table 58). A total of 1977 solar driers is planned to be distributed
on subsidy during the project period by spending US$17.652 Million on the dryers.
Table 58: Yearly Returns from Solar Drying of Dates in the Focal Point of Balochistan
Cluster
Items Input Year-2 Year-3 Year-4 Year-5 Year-6 Year-7 Year-8 Year-9 Year-10
Quantity of dates available for solar tunnel drying (tonnes)
97,315 112,777 129,754 148,311 158,096 168,148 178,465 189,044 199,883
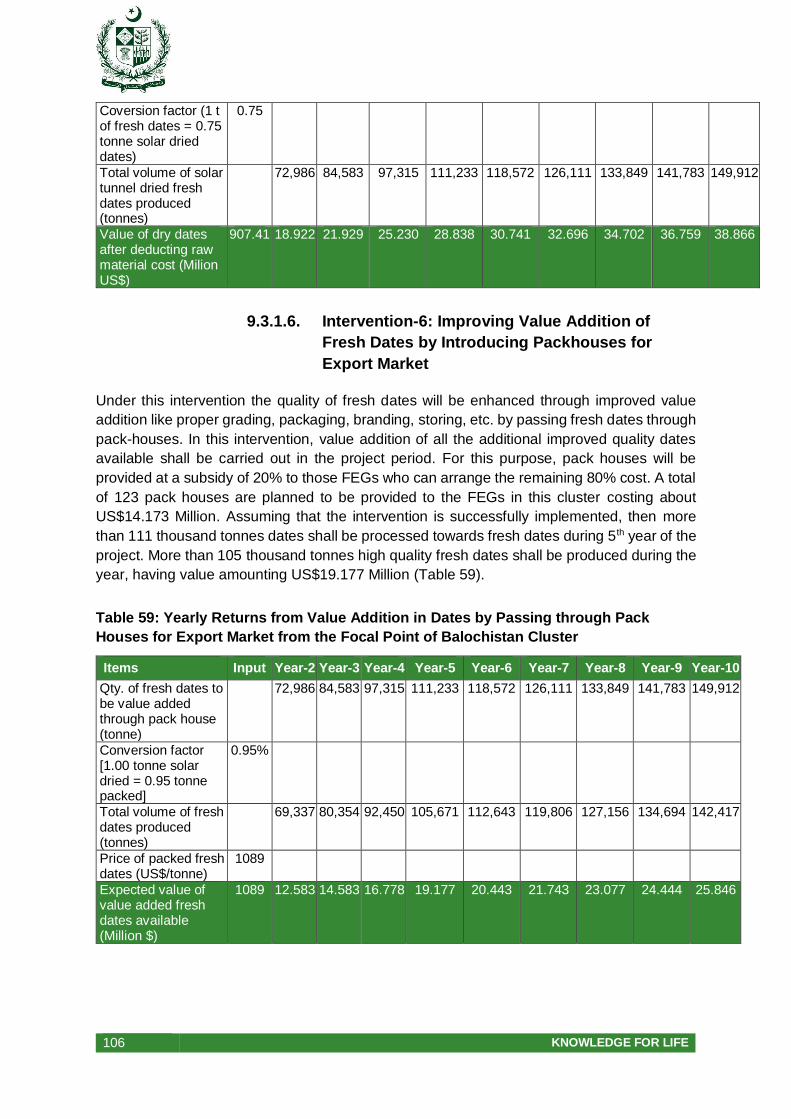
106 KNOWLEDGE FOR LIFE
Coversion factor (1 t of fresh dates = 0.75 tonne solar dried dates)
0.75
Total volume of solar tunnel dried fresh dates produced (tonnes)
72,986 84,583 97,315 111,233 118,572 126,111 133,849 141,783 149,912
Value of dry dates after deducting raw material cost (Milion US$)
907.41 18.922 21.929 25.230 28.838 30.741 32.696 34.702 36.759 38.866
9.3.1.6. Intervention-6: Improving Value Addition of
Fresh Dates by Introducing Packhouses for
Export Market
Under this intervention the quality of fresh dates will be enhanced through improved value
addition like proper grading, packaging, branding, storing, etc. by passing fresh dates through
pack-houses. In this intervention, value addition of all the additional improved quality dates
available shall be carried out in the project period. For this purpose, pack houses will be
provided at a subsidy of 20% to those FEGs who can arrange the remaining 80% cost. A total
of 123 pack houses are planned to be provided to the FEGs in this cluster costing about
US$14.173 Million. Assuming that the intervention is successfully implemented, then more
than 111 thousand tonnes dates shall be processed towards fresh dates during 5th year of the
project. More than 105 thousand tonnes high quality fresh dates shall be produced during the
year, having value amounting US$19.177 Million (Table 59).
Table 59: Yearly Returns from Value Addition in Dates by Passing through Pack
Houses for Export Market from the Focal Point of Balochistan Cluster
Items Input Year-2 Year-3 Year-4 Year-5 Year-6 Year-7 Year-8 Year-9 Year-10
Qty. of fresh dates to be value added through pack house (tonne)
72,986 84,583 97,315 111,233 118,572 126,111 133,849 141,783 149,912
Conversion factor [1.00 tonne solar dried = 0.95 tonne packed]
0.95%
Total volume of fresh dates produced (tonnes)
69,337 80,354 92,450 105,671 112,643 119,806 127,156 134,694 142,417
Price of packed fresh dates (US$/tonne)
1089
Expected value of value added fresh dates available (Million $)
1089 12.583 14.583 16.778 19.177 20.443 21.743 23.077 24.444 25.846

107 KNOWLEDGE FOR LIFE
9.3.3. Summary of the Benefits from Interventions
Table-60 summarizes the yearly stream of benefits from the interventions introduced in the
dates cluster of Turbat and Panjgur Districts.
Table 60: Yearly Expected Gross Returns (Million US$) from Investments on Dates
Cluster Development Interventions in the Focal Point of Balochistan Cluster
Items Year-2 Year-3 Year-4 Year-5 Year-6 Year-7 Year-8 Year-9 Year-10
Intervention-1: Orchards’ renovation
3.0 6.0 9.0 12.0 15.0
Intervention-2: Improved management practices
6.0 11.9 17.9 23.7 23.7 23.7 23.7 23.7 23.7
Intervention-3: Controlling post-harvest losses
5.1 10.7 17.0 23.7 24.3 24.8 25.4 25.9 26.5
Intervention-4: Improving quality of dates
0.0 0.0 0.0 0.0 0.0 0.0 0.0 0.0 0.0
Intervention-5: Introduction of solar tunnel dates drying
18.9 21.9 25.2 28.8 30.7 32.7 34.7 36.8 38.9
Intervention-6: Value addition by introducing dates pack houses
12.6 14.6 16.8 19.2 20.4 21.7 23.1 24.4 25.8
Total (US$) = 42.6 59.2 76.8 95.5 102.3 109.1 116.0 122.9 130.0
9.3.4. Costs Associated with Proposed Interventions
9.3.4.1. Intervention-1: Orchards Renovation with High
Density Plantation
The high priced varieties plantation involves investment at two fronts. On farmers’ side, it
involves incurring expenses on purchasing certified nursery of improved varieties and sowing
these plants in the large spaces available between the existing trees, plus caring these plants
till they start fruiting. On agriculture service providers’ side, it involves upgradation of available
nurseries in the area for the production of certified plants of modern varieties. For this, they
would be first registered and then the mother plants of modern improved varieties shall be
provided. Meanwhile, they shall be provided tissue cultured plants for nurturing them till they
reach the age of transplanting. The yearly details about the costs of renovating the orchards
in the cluster is given in Table 61 below.
Table 61: Yearly Costs of Orchards Renovation with Modern Varieties Plantation in the
Focal Point of Balochistan Cluster
Items Input Year-1 Year-2 Year-3 Year-4 Year-5 Year-6 Year-7 Year-8 Year-9 Year-10
Orchard renovation (% area in 5 years)
20.00 4.00 8.00 12.00 16.00 20.00
Renovated orchards acreage in gestation period (ha)
1,744 3,487 5,231 6,974 8,718 6,974 5,231 3,487 1,744 -
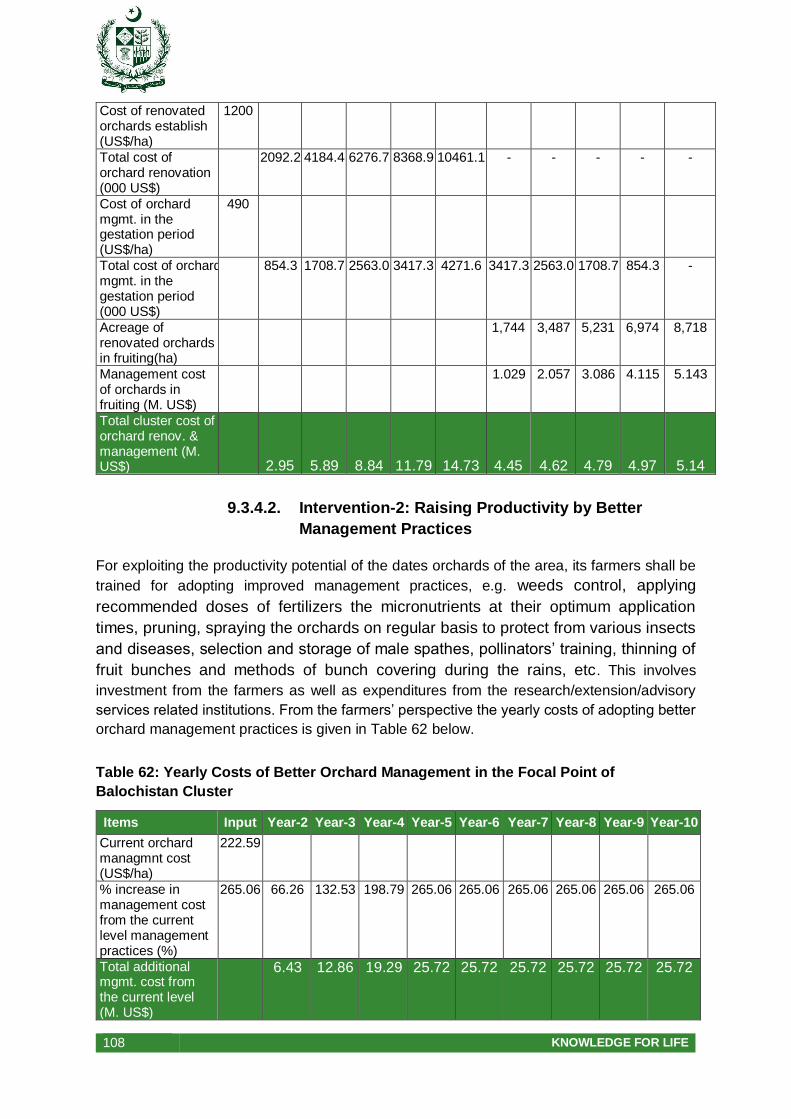
108 KNOWLEDGE FOR LIFE
Cost of renovated orchards establish (US$/ha)
1200
Total cost of orchard renovation (000 US$)
2092.2 4184.4 6276.7 8368.9 10461.1 - - - - -
Cost of orchard mgmt. in the gestation period (US$/ha)
490
Total cost of orchard mgmt. in the gestation period (000 US$)
854.3 1708.7 2563.0 3417.3 4271.6 3417.3 2563.0 1708.7 854.3 -
Acreage of renovated orchards in fruiting(ha)
1,744 3,487 5,231 6,974 8,718
Management cost of orchards in fruiting (M. US$)
1.029 2.057 3.086 4.115 5.143
Total cluster cost of orchard renov. & management (M. US$)
2.95 5.89 8.84 11.79 14.73 4.45 4.62 4.79 4.97 5.14
9.3.4.2. Intervention-2: Raising Productivity by Better
Management Practices
For exploiting the productivity potential of the dates orchards of the area, its farmers shall be
trained for adopting improved management practices, e.g. weeds control, applying
recommended doses of fertilizers the micronutrients at their optimum application
times, pruning, spraying the orchards on regular basis to protect from various insects
and diseases, selection and storage of male spathes, pollinators’ training, thinning of
fruit bunches and methods of bunch covering during the rains, etc. This involves
investment from the farmers as well as expenditures from the research/extension/advisory
services related institutions. From the farmers’ perspective the yearly costs of adopting better
orchard management practices is given in Table 62 below.
Table 62: Yearly Costs of Better Orchard Management in the Focal Point of
Balochistan Cluster
Items Input Year-2 Year-3 Year-4 Year-5 Year-6 Year-7 Year-8 Year-9 Year-10
Current orchard managmnt cost (US$/ha)
222.59
% increase in management cost from the current level management practices (%)
265.06 66.26 132.53 198.79 265.06 265.06 265.06 265.06 265.06 265.06
Total additional mgmt. cost from the current level (M. US$)
6.43 12.86 19.29 25.72 25.72 25.72 25.72 25.72 25.72
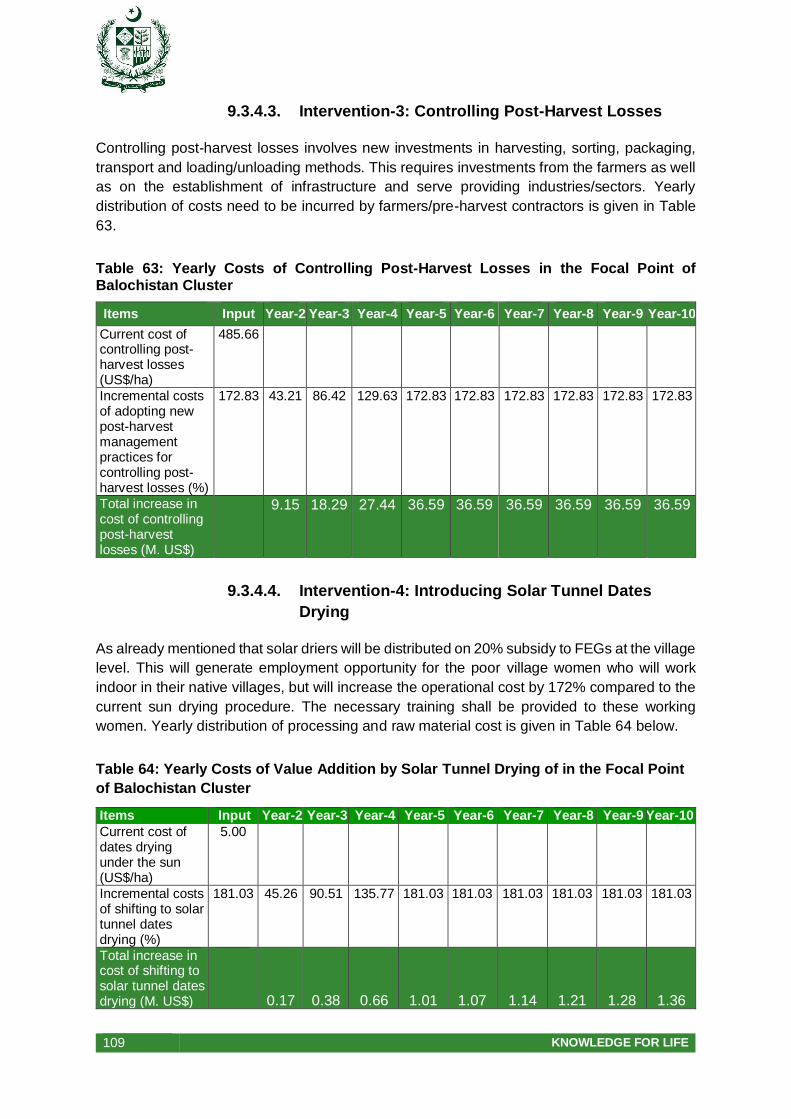
109 KNOWLEDGE FOR LIFE
9.3.4.3. Intervention-3: Controlling Post-Harvest Losses
Controlling post-harvest losses involves new investments in harvesting, sorting, packaging,
transport and loading/unloading methods. This requires investments from the farmers as well
as on the establishment of infrastructure and serve providing industries/sectors. Yearly
distribution of costs need to be incurred by farmers/pre-harvest contractors is given in Table
63.
Table 63: Yearly Costs of Controlling Post-Harvest Losses in the Focal Point of Balochistan Cluster
Items Input Year-2 Year-3 Year-4 Year-5 Year-6 Year-7 Year-8 Year-9 Year-10
Current cost of controlling post-harvest losses (US$/ha)
485.66
Incremental costs of adopting new post-harvest management practices for controlling post-harvest losses (%)
172.83 43.21 86.42 129.63 172.83 172.83 172.83 172.83 172.83 172.83
Total increase in cost of controlling post-harvest losses (M. US$)
9.15 18.29 27.44 36.59 36.59 36.59 36.59 36.59 36.59
9.3.4.4. Intervention-4: Introducing Solar Tunnel Dates
Drying
As already mentioned that solar driers will be distributed on 20% subsidy to FEGs at the village
level. This will generate employment opportunity for the poor village women who will work
indoor in their native villages, but will increase the operational cost by 172% compared to the
current sun drying procedure. The necessary training shall be provided to these working
women. Yearly distribution of processing and raw material cost is given in Table 64 below.
Table 64: Yearly Costs of Value Addition by Solar Tunnel Drying of in the Focal Point
of Balochistan Cluster
Items Input Year-2 Year-3 Year-4 Year-5 Year-6 Year-7 Year-8 Year-9 Year-10
Current cost of dates drying under the sun (US$/ha)
5.00
Incremental costs of shifting to solar tunnel dates drying (%)
181.03 45.26 90.51 135.77 181.03 181.03 181.03 181.03 181.03 181.03
Total increase in cost of shifting to solar tunnel dates drying (M. US$)
0.17 0.38 0.66 1.01 1.07 1.14 1.21 1.28 1.36
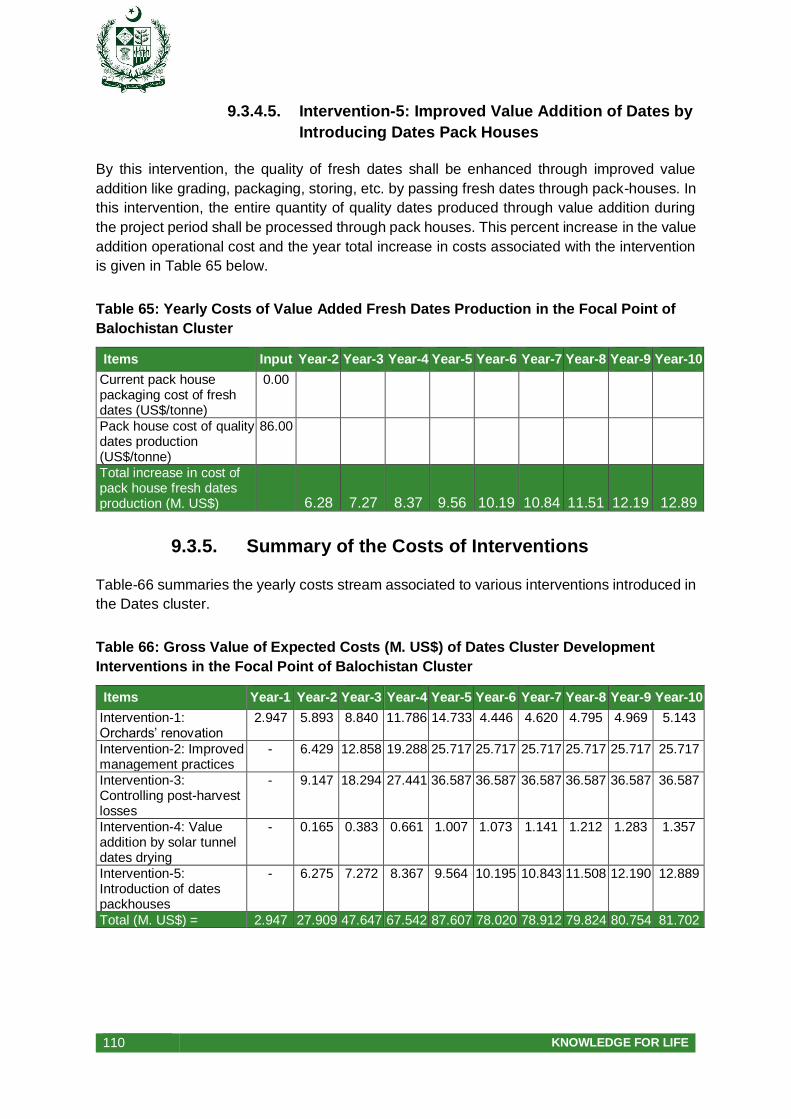
110 KNOWLEDGE FOR LIFE
9.3.4.5. Intervention-5: Improved Value Addition of Dates by
Introducing Dates Pack Houses
By this intervention, the quality of fresh dates shall be enhanced through improved value
addition like grading, packaging, storing, etc. by passing fresh dates through pack-houses. In
this intervention, the entire quantity of quality dates produced through value addition during
the project period shall be processed through pack houses. This percent increase in the value
addition operational cost and the year total increase in costs associated with the intervention
is given in Table 65 below.
Table 65: Yearly Costs of Value Added Fresh Dates Production in the Focal Point of
Balochistan Cluster
Items Input Year-2 Year-3 Year-4 Year-5 Year-6 Year-7 Year-8 Year-9 Year-10
Current pack house packaging cost of fresh dates (US$/tonne)
0.00
Pack house cost of quality dates production (US$/tonne)
86.00
Total increase in cost of pack house fresh dates production (M. US$)
6.28 7.27 8.37 9.56 10.19 10.84 11.51 12.19 12.89
9.3.5. Summary of the Costs of Interventions
Table-66 summaries the yearly costs stream associated to various interventions introduced in
the Dates cluster.
Table 66: Gross Value of Expected Costs (M. US$) of Dates Cluster Development
Interventions in the Focal Point of Balochistan Cluster
Items Year-1 Year-2 Year-3 Year-4 Year-5 Year-6 Year-7 Year-8 Year-9 Year-10
Intervention-1: Orchards’ renovation
2.947 5.893 8.840 11.786 14.733 4.446 4.620 4.795 4.969 5.143
Intervention-2: Improved management practices
- 6.429 12.858 19.288 25.717 25.717 25.717 25.717 25.717 25.717
Intervention-3: Controlling post-harvest losses
- 9.147 18.294 27.441 36.587 36.587 36.587 36.587 36.587 36.587
Intervention-4: Value addition by solar tunnel dates drying
- 0.165 0.383 0.661 1.007 1.073 1.141 1.212 1.283 1.357
Intervention-5: Introduction of dates packhouses
- 6.275 7.272 8.367 9.564 10.195 10.843 11.508 12.190 12.889
Total (M. US$) = 2.947 27.909 47.647 67.542 87.607 78.020 78.912 79.824 80.754 81.702

111 KNOWLEDGE FOR LIFE
9.3.6. Net Economic Benefits after Offsetting Direct
Value Chain Costs of Development Interventions
Table 67 pertains to the yearly stream of net-economic benefits after offsetting the direct value
chains costs incurred for the development of Dates cluster in Turbat and Panjgur Districts of
the Balochistan.
Table 67: Net-Economic Benefits after Offsetting the Direct Value Chains Costs of
Development Interventions in the Focal Point of Balochistan Cluster
Items Year-
1 Year-2 Year-3 Year-4 Year-5 Year-6 Year-7 Year-8 Year-9
Year-10
Total expected gross returns from dates cluster development in Bal. (M. US$)
- 42.579 59.194 76.833 95.511 102.269 109.095 115.987 122.944 129.966
Gross costs to be incurred on cluster development interventions in Bal.(M. US$)
2.947 27.909 47.647 67.542 87.607 78.020 78.912 79.824 80.754 81.702
Net-economic benefits (M. US$)
-2.947 14.669 11.547 9.291 7.903 24.250 30.183 36.163 42.190 48.264
9.3.7. Investments Need to be Made for Cluster
Development
In order to improve the sample Dates cluster, public investment under project approach is
needed. As all the above calculations are made on the basis of a 5-year project, therefore, the
year stream of investments required for all the six proposed interventions is given in Table 68.
Table 68: Public Investment (US$) Needed for the Development of the Focal Point of
Balochistan Cluster
Items Inputs Year-1 Year-2 Year-3 Year-4 Year-5
Improving the research infratsructure & oper.
800,000 320,000 120,000 120,000 120,000 120,000
Capacity Building and FEGs for improved management practices
887,904 355,161 266,371 133,186 88,790 44,395
Investments required on orchard renovation
21,296,903 4,259,381 4,259,381 4,259,381 4,259,381 4,259,381
Investment required on certified nursery estab
1,857,037 464,259 464,259 464,259 464,259
Investments required on pack house
14,173,290 9,333,630 1,497,990 1,613,220 1,728,450
Investment requied for solar dates dryers
17,652,413 11,589,698 1,839,351 2,017,929 2,205,436
Investments required on Marketing/Export level interventions
37,037 14,815 11,111 5,556 3,704 1,852
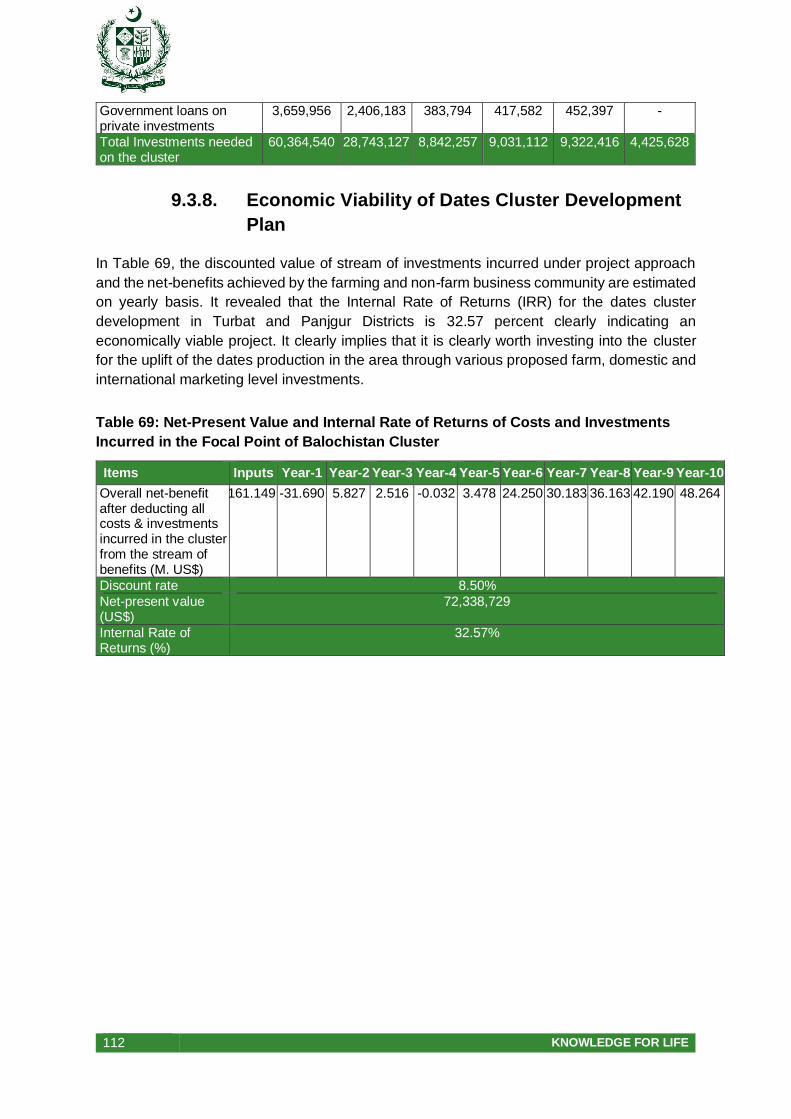
112 KNOWLEDGE FOR LIFE
Government loans on private investments
3,659,956 2,406,183 383,794 417,582 452,397 -
Total Investments needed on the cluster
60,364,540 28,743,127 8,842,257 9,031,112 9,322,416 4,425,628
9.3.8. Economic Viability of Dates Cluster Development
Plan
In Table 69, the discounted value of stream of investments incurred under project approach
and the net-benefits achieved by the farming and non-farm business community are estimated
on yearly basis. It revealed that the Internal Rate of Returns (IRR) for the dates cluster
development in Turbat and Panjgur Districts is 32.57 percent clearly indicating an
economically viable project. It clearly implies that it is clearly worth investing into the cluster
for the uplift of the dates production in the area through various proposed farm, domestic and
international marketing level investments.
Table 69: Net-Present Value and Internal Rate of Returns of Costs and Investments
Incurred in the Focal Point of Balochistan Cluster
Items Inputs Year-1 Year-2 Year-3 Year-4 Year-5 Year-6 Year-7 Year-8 Year-9 Year-10
Overall net-benefit after deducting all costs & investments incurred in the cluster from the stream of benefits (M. US$)
161.149 -31.690 5.827 2.516 -0.032 3.478 24.250 30.183 36.163 42.190 48.264
Discount rate 8.50%
Net-present value (US$)
72,338,729
Internal Rate of Returns (%)
32.57%

113 KNOWLEDGE FOR LIFE
10. CONCLUSION Date palm is an important fruit crop for Pakistan, particularly for the dwellers of marginal areas
in all the four provinces of the country for food security and rural employment concerns. Its
production in Pakistan seems in crisis during 2001-17 because of its declining production.
Trade in dates, however, seems to perform relatively well during the period because of the
expansion in the export of dates at quite a high rate. The export of dates from Pakistan has
reached to US$108 Million in 2017. However, such a high growth in the export of dates is not
sustainable because of its declining per ha yield in the country. Expansion in export along with
declining production has reduced the per capita consumption of dates in Pakistan by about
42%, which cannot be continued unabated as Pakistani people do like to consume dates
especially in the month of Ramadan and during marriage ceremonies. The declining in
productivity, production, per capita availability vis-à-vis improvement in growth in trade and
rising influx of fresh dates from Iran, Iraq and other countries is quite worrisome for the
research, policy and development practitioners in the country. On the other hand, Pakistani
yield is now 13% lower than the world average yield. Moreover, Pakistani dates in international
markets fetch only 60% of the world average export price indicating issues in its value chain
resulting in poor quality dates.
The purpose of the analysis in this study was to conduct end-to-end analysis of the entire
value chain of dates including production, marketing, value addition, processing, and trade,
identify the gaps and potential along the chain, and suggest economically viable policy,
technological, and institutional interventions to enhance the competitiveness of Pakistani
dates in international market. This analysis is conducted on cluster basis to incorporate the
regional variation in production, marketing, and processing opportunities in each cluster while
suggesting interventions along the value chain.
To achieve the objectives of the study, a large number of stakeholders along the dates value
chain were consulted, data related to dates production, marketing, trade, etc. were analyzed,
and literature were reviewed. An MS-EXCEL sheet based model was also developed to
estimate the economic feasibility of various interventions in each cluster. Based on the
available district-level production data, three dates producing clusters i.e., Sindh Cluster,
Balochistan Cluster and Punjab Cluster are identified for detailed analysis.
In consultation with stakeholders, several challenges of dates industry of Pakistan from
production to harvesting and marketing are identified. On production side, water scarcity
especially in Baluchistan dates cluster, traditional methods of spathes selection and
pollination, non-covering of fruit bunches during rainy season (rather than preferring to pick
for making chohara or other low quality/price fetching products), fruit bunch pruning, dates
drying under the open sky, weak research and extension capacities, absence of the
mechanism to replace old with new high-yielding varieties and lack of nurseries with certified
mother-blocks are the main challenges. Lack of processing infrastructure at village level and
capacity to operate these infrastructure are the main issue on processing side. On marketing
side, lack of value chain segments including farm-level cold storage, improper packing and
presentation are major constraints, which eventually lead to selling of our dates low-end
markets in the world. Secondly, Pakistan was historically heavily relying on dry dates export
114 KNOWLEDGE FOR LIFE
to India, and future prospects of this market are also gloomy, in view massive dates plantation
in desert ecologies along with Pakistan’s borders.
To overcome these issues, this study suggests interventions at the cluster level for making
the dates a competitive and export oriented commodity of Pakistan. These interventions
includes renovation of old gardens with high-density quality producing dates orchard,
introducing improved management practices, general improvement in the quality of dry and
fresh dates produced, linking traders with international markets through providing information
portals and e-commerce, and incentivizing dates pack-houses and dates drier at the union
council level through FEGs. It has been observed that the cost of these interventions will not
be too high compared to their returns, thus it will able to pay back the investments made by
generating positive Net Present Value (NPV) and Internal Rate of Return in all three clusters
under consideration.
All three provincial clusters need due upgradation, but keeping in view the composition of
dates varieties grown and agro-ecological conditions. For instance, in Punjab, the degree of
harshness in terms of total rainfall in monsoon season is much higher than Sindh and
Balochistan. In Balochistan dates growing clusters, the higher rainfall occurs only in August
month. In Sindh, the duration of mon-soon rains is considerably long14. The proposed cluster
development strategy is consisted of renovation of existing orchards with plants of higher
yielding, modern and exotic varieties, educating farmers for adopting improved orchard
management practices, controlling harvest and post-harvest losses by adopting better
pollination strategies and fruit bunch management, shifting to solar tunnel dates drying and
employment state-of-the-art packaging technologies. As considerable quantities of our dates
are exported, therefore, with these measures, the general quality and presentation of our dates
in international market shall improve. Moreover, with improve quality dates, we can explore
our space in high-markets in the world, which is now much necessary in view of decline future
prospects of exporting dates to India.
In order to achieve the above delineated objectives and implement various interventions, total
project investments needed are to the tune of US$4.257 Million for Muzaffargarh cluster in
Punjab, US$66.136 Million for Khairpur cluster in Sindh and US$70.129 Million for
Turbat+Panjgur cluster in Balochistan. These investments need to be made in area like: i)
improving the dates related research infrastructure and operations in provinces; ii) capacity
building of the farmers and farmers’ enterprise groups; iii) back-stopping support for renovation
of existing dates orchards; iv) establishment of certified nurseries in the clusters; v)
establishment of pack house facilities in the clusters; vi) provision of solar tunnel dates dryers;
vii) linking farmers’ enterprise groups and traders with domestic and international markets;
and viii) government loans on private investments. It is assumed that in this total investment,
about 28% will be borne by the federal and provincial governments, and remaining 72% by
the private sector. The federal government will bear 70% of the total cost, while the provincial
governments remaining 30% through their respective annual development plans.
14 Average annual rainfall in Muzaffargarh district is 157 mm, 110 mm in Khairpur, 111 mm in Panjgur and 123
mm in Turbat. However, the total monsoon rainfalls during July-September period in Muzaffargarh, Khairpur,
Panjgur and Turbat districts are 88, 63, 32, 29 mm, respectively.
115 KNOWLEDGE FOR LIFE
As a result, after the successful implementation of the 5-years long proposed project, it is
anticipated that during 10th year, more than 51 thousand tonnes of addition dates shall be
achieved from renovated plantation, more than 116 thousand tonnes from the adoption of
improved management practices, and above 92 thousand tonnes from the practicing various
measures aimed at controlling post-harvest losses. In total, nearly 266 thousand tonnes very
high quality dates (chohara and fresh dates) shall be available for processing through 214
pack houses. The dates so shall be produced, be able to better prices in both the domestic
and international markets. This improvement in production will generate thousands of
additional jobs in rural areas.
As far as 5-year project investments are concerned, in total above US$108.144 Million
investment is needed with provincial distribution as US$4.257 Million for Punjab, US$43.523
Million for Sindh, US$60.364 Million for Balochistan clusters. As all the proposed interventions
are individually economically viable in all the provincial dates clusters, therefore, their net
present values (NPVs) were US$ 11.678 Million, US$145.653 Million, US$161.149 Million,
respectively. The overall Internal Rate of Return (IRR) for these clusters was estimated
26.12%, 37.26% and 32.57% for Punjab, Sindh and Balochistan clusters, respectively. This
clearly implies that it is profitable to invest in dates clusters of all three provinces of the country.
Moreover, it shall also provide income and employment generating opportunities for the local
dwellers.
To make this initiative successful, it is imperative to adopt the integrated cluster approach by
strengthening the date palm related research facilities, mobilize provincial extension to enable
them to build capacities of all stakeholders along the value chain, organize Farmers’
Entrepreneur Group (FEGs), and arrange loans so that stakeholders can fund the additional
operational costs induced by the upgradation investments.
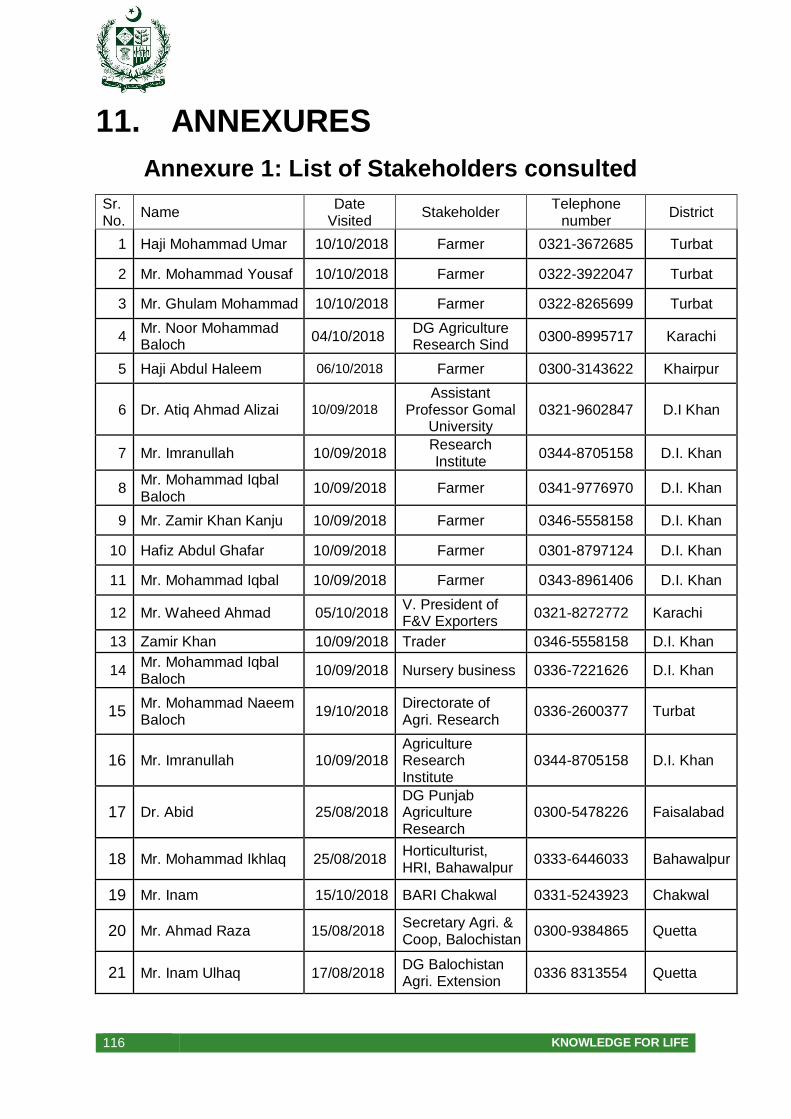
116 KNOWLEDGE FOR LIFE
11. ANNEXURES
Annexure 1: List of Stakeholders consulted
Sr. No.
Name Date
Visited Stakeholder
Telephone number
District
1 Haji Mohammad Umar 10/10/2018 Farmer 0321-3672685 Turbat
2 Mr. Mohammad Yousaf 10/10/2018 Farmer 0322-3922047 Turbat
3 Mr. Ghulam Mohammad 10/10/2018 Farmer 0322-8265699 Turbat
4 Mr. Noor Mohammad Baloch
04/10/2018 DG Agriculture Research Sind
0300-8995717 Karachi
5 Haji Abdul Haleem 06/10/2018 Farmer 0300-3143622 Khairpur
6 Dr. Atiq Ahmad Alizai 10/09/2018
Assistant Professor Gomal
University 0321-9602847 D.I Khan
7 Mr. Imranullah 10/09/2018 Research Institute
0344-8705158 D.I. Khan
8 Mr. Mohammad Iqbal Baloch
10/09/2018 Farmer 0341-9776970 D.I. Khan
9 Mr. Zamir Khan Kanju 10/09/2018 Farmer 0346-5558158 D.I. Khan
10 Hafiz Abdul Ghafar 10/09/2018 Farmer 0301-8797124 D.I. Khan
11 Mr. Mohammad Iqbal 10/09/2018 Farmer 0343-8961406 D.I. Khan
12 Mr. Waheed Ahmad 05/10/2018 V. President of F&V Exporters
0321-8272772 Karachi
13 Zamir Khan 10/09/2018 Trader 0346-5558158 D.I. Khan
14 Mr. Mohammad Iqbal Baloch
10/09/2018 Nursery business 0336-7221626 D.I. Khan
15 Mr. Mohammad Naeem Baloch
19/10/2018 Directorate of Agri. Research
0336-2600377 Turbat
16 Mr. Imranullah 10/09/2018 Agriculture Research Institute
0344-8705158 D.I. Khan
17 Dr. Abid 25/08/2018 DG Punjab Agriculture Research
0300-5478226 Faisalabad
18 Mr. Mohammad Ikhlaq 25/08/2018 Horticulturist, HRI, Bahawalpur
0333-6446033 Bahawalpur
19 Mr. Inam 15/10/2018 BARI Chakwal 0331-5243923 Chakwal
20 Mr. Ahmad Raza 15/08/2018 Secretary Agri. & Coop, Balochistan
0300-9384865 Quetta
21 Mr. Inam Ulhaq 17/08/2018 DG Balochistan Agri. Extension
0336 8313554 Quetta
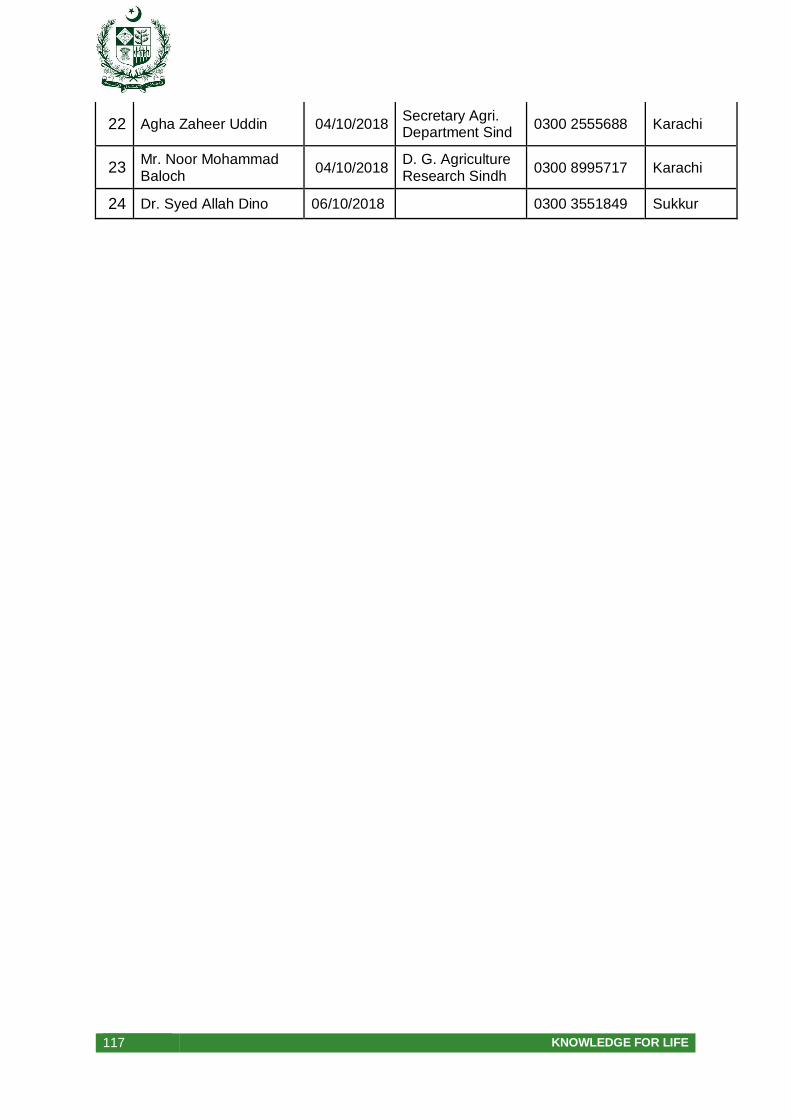
117 KNOWLEDGE FOR LIFE
22 Agha Zaheer Uddin 04/10/2018 Secretary Agri. Department Sind
0300 2555688 Karachi
23 Mr. Noor Mohammad Baloch
04/10/2018 D. G. Agriculture Research Sindh
0300 8995717 Karachi
24 Dr. Syed Allah Dino 06/10/2018 0300 3551849 Sukkur

118 KNOWLEDGE FOR LIFE
Annexure 2. List of References
Abdul-Soad, A.A., Markhand, G.S. and Memon, S., 2010. Du Point Tyve® bags Impact on Daats. Final Report, DuPont Pakistn Operations (Pvt.), Ltd., 2G-4, Johar Town Canal Bank Road, Lahore-54790, Pakistan.
Abul-Soad, A.A., 2011. Date palm in Pakistan, Current status and prospective. Report USAID Pakistan.
Abul-Soad, A.A., 2013. Current Status and Perspective of Date Palm in Pakistan, International Conference on Date Palm: Present Status and Future Prospects. Islamia University Bahawalpur, Bahawalpur, 2-3 September 2013.
Abul-Soad, A.A., S. Mahdi and G.S. Markhand, 2015. Date Palm Status and Perspective in Pakistan, in Date Palm Genetic Resource and Utilization: Volume 2: Asia and Europe
Abouziena H.F.H, Z.A.E. Elham, R.A. Youssef and A.F. Sahab, 2010. Efficacy of Intercropping Mango, Mandarin or Egyptian Clover Plants with Date Palm on Soil Properties, Rhizosphere Microflora and Quality and Quantity of Date Fruits. Journal of American Science, 6(12):230–
238.
Adopted International Standards for Phytosanitary Measures (ISPMs). https://www.ippc.int/en/ core-activities/standards-setting/ispms/#publications.
Agri Hunt (Undated). Post-Harvest Llosses in Fruits and vegetables, in Pakistan: (https://agrihunt.com/articles/pak-agri-outlook/post-harvest-losses-in-fruits-and-vegetables-
in-pakistan.
Agriculture Statistics of Pakistan (2015-16), Ministry of National Food Security and Research, Pakistan: http://www.mnfsr.gov.pk/frmDetails.aspx.
Akhtar, W., M. Qasim, A.H. Qureshi, 2017. Market Linkages for Dates and Banana Value Added Products, Post-harvest Losses Management and Value Addition of Fruits in Catchements of SAARC Countries (Pakistan Component). Research Report, Social Sciences Research Institute, National Agricultural Research Center, Islamabad, December 2017.
Anwar, M.A., 2006. Phoenix dactylifera L: A Bibliometric Study of the Literature on Date Palm. Malaysian Journal of Library and Information Sciences, 11(2): 41-60.
Ata, S., 2011. A Study of Date Palm Market Chain and its Role in Food Security and Livelihoods of Farmers in the South Punjab. M.Sc. (Hons.) Thesis, University of Agriculture, Faisalabad.
Bhansali, R.R. 2010. Date Palm Cultivation in the Changing Scenario of Indian Arid Zones. In: Ramawat K.G. (ed.) “Desert Plants: Biology and Biotechnology”. Springer, Berlin: 433-456.
Barreveld, W.H., 1993. Date Palm Products. Volume 101, FAO Agricultural Services Bulletin, Food and Agricultural Organization of the United Nations, Rome.
Chao, C.C.T. and R.R. Krueger, 2007. The Date Palm (Phoenix dactylifera L.): Overview of Biology, Uses and Cultivation. American Society for Horticulture Science, 43(5): 1077-1082.
Culture (2015). The Dried Dates Of Dhaki, September 01, 2015:
https://gandhara.rferl.org/a/pakistan-the-dried-dates-of-dhaki/27220444.html
El Hadrami A. and J.M. Al Khayri, 2012. Socioeconomic and Traditional Importance of Date Palm. Emirates Journal of Food and Agriculture, 24(5): 371-385.
FAO (Food and Agriculture Organization). (2009) Dates Handling, Processing and Packing.
FAO Agricultural Development Paper No. 72. http://www.fao.org/3/t0681e/t0681e06.htm
119 KNOWLEDGE FOR LIFE
FAOSTAT (Food and Agriculture Organization Statistics) (Retrieved on 29th November 2018)
Production, Crops http://www.fao.org/faostat/en/#data/QC
FAOSTAT, (Food and Agriculture Organization Statistics). 2020. Trade, Crops and Livestock
Products http://www.fao.org/faostat/en/#data/TP.
FAOSTAT, Balance Sheet, Food Supply - Crops Primary Equivalent; http://www.fao.org/ faostat/en/#data/CC
Government of Pakistan, 2019a. Fruits, Vegetables and Condiments Statistics, 2016-17, Economic Wing, Ministry of National Food Security and Research, Government of Pakistan, Islamabad.
Government of Pakistan, 2019b. Agriculture Statistics of Pakistan, 2017-18, Economic Wing, Ministry of National Food Security and Research, Government of Pakistan, Islamabad.
Ibupoto, S.A., W.A. Maitlo and S.A. Memon. 2015. Assessment of the problems of date palm growers and their possible solutions at Khairpur. International Journal of Agricultural Technologies, 11: 823-829.
Jain, S.M., 2012. Date Palm Biotechnology: Current Status and Perspective – An Overview. Emirates Journal of Food and Agriculture, 24(5): 386-399.
Khairi, R., E. Mauret, M.N. Belgacem and F. Mhemmi, 2011. Tunisian Date Palm Rachis Used as an Alternative Source of Fibers for Paper Making Applications. Bio-resources, 6(1): 265-281.
Khan, D., S. Udin, A.G. Lanjar, M. Umer3, N, Ahmed, M. A. Mengal and S. Ahmed. 2018. Insect pests associated with date palm cultivars at district Kech, Balochistan, Pure Appl. Biol., 7(4): 1177-1185, December, 2018: https://www.thepab.org/files/2018/September-
2018/PAB-MS-1803078.pdf
Khayyat, M., Tafazoli, E., Eshghi, S. and Rajae, S. (2007). Effect of Nitrogen, Boron, Potassium and Zinc Sprays on Yield and Fruit Quality of Date Palm. American Eurasian Journal of Agriculture and Environmental Sciences, 2(3): 289-296.
Khushk, A.M., A. Memon and K. Aujla, 2009. Marketing Channels and Margins of Dates in Sindh. Journal of Agriculture Research, 47(3): 293-308.
Malik, S.R., and M.A. Maqbool. 2013. Energy Potential of Pakistan. NFC-IEFR Journal of Engineering Sciences Research, 1: 78-86.
Nixon, R.W. 1934. Metaxenia in Dates. Proceedings of American Society of Horticultural Sciences, 32: 21-26.
Nixon, R.W. 1936. Metaxenian and Interspecific Pollinations in Phoenix. Proceedings of American Society of Horticultural Sciences, 33: 21-26.
Nixon, R.W., 1951. The date palm: ‘‘Tree of Life’’ in the Subtropical Deserts. Economic Botany,
5(3), July-September:274–301.
Nixon, R.W. and J.B. Carpenter, 1978. Growing Dates in the United States. Bulletin No. 207, United States Department of Agriculture, Washington DC.
Pakistan Horticulture Development and Export Board (PHDEB), 2008. Dates Marketing Strategy. [http://www.phdec.org.pk/MktStrategies/Dates.pdf] Accessed on 5th August, 2014.
Saifullah, 2017. Climate Change Impact on Agriculture of Pakistan – Leading Agent to Food Security. International journal of Environmental Sciences & Natural Resources, 6(3): 1-4.
Serrano, M., M. T. Pretel, M.A. Botella and A. Amorós, 2001. Physiochemical Changes during Date Ripening Related to Ethylene Production. Journal of Food Science and Technology International, 7(1): 31-36.
120 KNOWLEDGE FOR LIFE
Sharma, A., C.R. Chen and N.V. Lan. 2009. Solar energy drying systems: A review. Renewable Sustainable Energy Review. 13:1185-1210.
Siddiq, M. and I. Grieby 2014. Overview of Date Fruit Production, Postharvest Handling, Processing and Nutrition. In Muhammad Siddiq, Salah M. Aleid and Adel A. Kader (Eds.). Postharvest Science, Processing Technology and Health Benefits. First Edition. John Wiley & Sons, Ltd.
Srinivasan, R., and T. Balusamy. 2015. Comparative Studies on Open Sun Drying and Forced Type (Mixed Mode) Solar Drying of Bitter Gourd. Journal of Chemical and Pharmaceutical Sciences. 7: 343-346.
Statista: Agriculture>Farming (Undated) Global fruit production in 2018, by selected variety:https://www.statista.com/statistics/264001/worldwide-production-of-fruit-by-variety.
Swingle, W.T., 1928. Metazenia in Date Palm, Possibly a Hormone Action by the Embryo or Endosperm. Journal of Heredity, 19(6), National Academy of Sciences, Washington: 257-288.
Wrigley, G., 1995. Date palm, In J. Smartt and N.W. Simmonds (Eds.). Evolution of crop plants. 2nd Edition, Longman Group, Essex, UK, p. 399–403.
Zaid, A. and P.F. de Wet. 2002a. Climatic Requirements of Date Palm. In: A. Zaid (Ed.). Date Palm Cultivation. Food and Agriculture Organization Plant Production and Protection Paper
no. 156. Food and Agriculture Organization of the United Nations, Rome, Italy: p. 57–72.
Zaid, A. and P.F. de Wet, 2002b. Date Palm Cultivation, Pollination and Bunch Management. Plant Production and Management, Paper No. 156, FAO Rome: 145-175.
Zohary, D. and M. Hopf., 2000. Domestication of Plants in the Old World: The Origin and Spread of Cultivated Plants in West Asia, Europe, and the Nile Valley. Oxford University Press,
Oxon, UK.

121 KNOWLEDGE FOR LIFE
Annexure-3: Farm size composition of different focal
districts in dates clusters if Punjab, Sindh and
Balochistan
District Marginal (upto 5 acres)
Small (> 5 ac. - 12.5 ac.)
Medium (> 12.5 ac -
25 ac.)
Large (> 5 ac. - 12.5 ac.)
Landlords (> 12.5 ac -
25 ac.) Total
Muzaffargarh
Farming population - Numbers Percent
205366
(70.1%)
66908
(22.8%)
15904
(5.4%)
3766
(1.3%)
902
(0.3%)
292846
(100.0%)
Farming Area - Area (acres) Percent
325788
(25.2%)
493368
(38.2%)
263178
(20.4%)
115209
(8.9%)
94651
(7.3%)
1292194
(100.0%) Khairpur
Farming population - Numbers Percent
89688
(73.3%)
26686
(21.8%)
4729
(3.9%)
905
(0.7%)
392
(0.3%)
122400
(100.0%)
Farming Area - Area (acres) Percent
169984 (33.6%)
203735 (40.3%)
79598
(15.7%)
27056 (5.3%)
25765 (5.1%)
506138
(100.0%) Sukkur
Farming population - Numbers Percent
21793
(58.6%)
10947
(29.4%)
2524
(6.8%)
1215
(3.3%)
716
(1.9%)
37195
(100.0%)
Farming Area - Area (acres) Percent
49130
(16.6%)
88695
(30.1%)
40796
(13.8%)
36766
(12.5%)
79761
(27.0%)
295148
(100.0%) Turbat
Farming population - Numbers - Percent
5909
(52.1%)
3049
(26.9%)
1163
(10.3%)
687
(6.1%)
536
(4.7%)
11344
(100.0%)
Farming Area - Area (acres) - Percent
12730 (8.4%)
23457
(15.5%)
19815
(13.1%)
21898
(14.5%)
73435
(48.5%)
151335
(100.0%) Panjgur
Farming population - Numbers Percent
198k
(36.2%)
1848
(33.6%)
915
(16.7%)
545
(9.9%)
197
(3.6%)
5492
(100.0%)
Farming Area - Area (acres) Percent
5212
(7.6%)
14546
(21.3%)
15749
(23.1%)
16856
(24.7%)
15945
(23.3%)
68308
(100.0%)
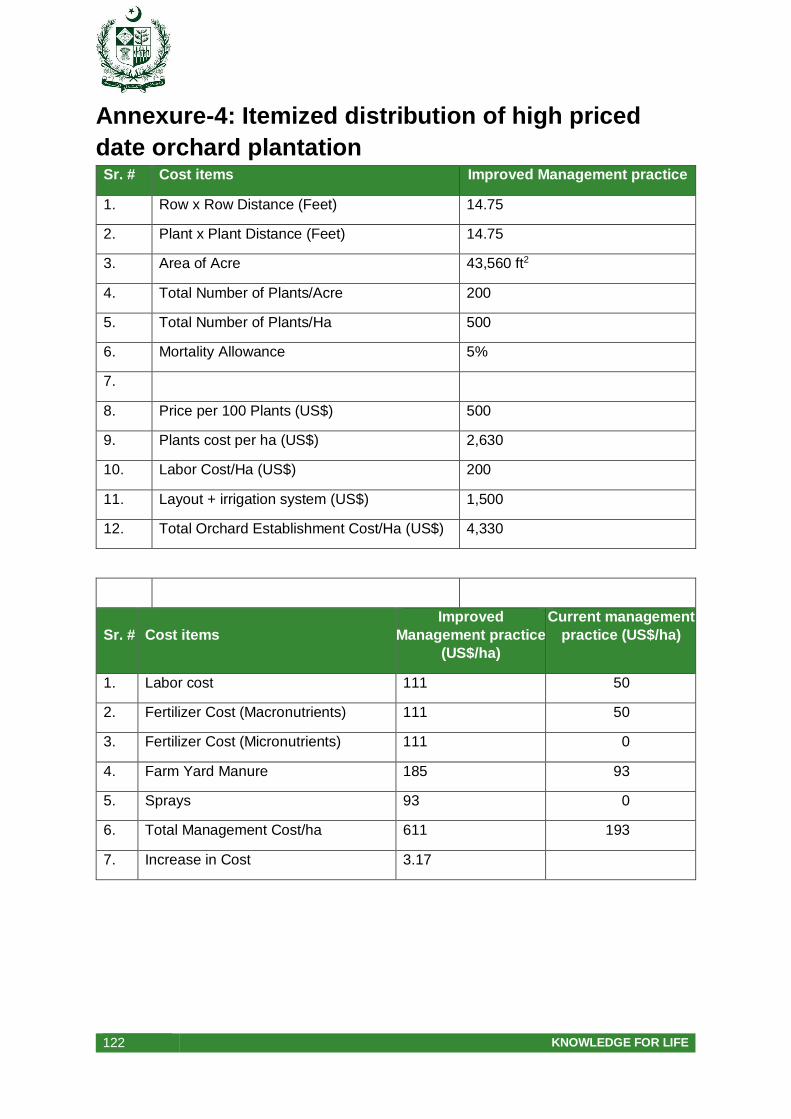
122 KNOWLEDGE FOR LIFE
Annexure-4: Itemized distribution of high priced
date orchard plantation Sr. # Cost items Improved Management practice
1. Row x Row Distance (Feet) 14.75
2. Plant x Plant Distance (Feet) 14.75
3. Area of Acre 43,560 ft2
4. Total Number of Plants/Acre 200
5. Total Number of Plants/Ha 500
6. Mortality Allowance 5%
7.
8. Price per 100 Plants (US$) 500
9. Plants cost per ha (US$) 2,630
10. Labor Cost/Ha (US$) 200
11. Layout + irrigation system (US$) 1,500
12. Total Orchard Establishment Cost/Ha (US$) 4,330
Sr. # Cost items
Improved
Management practice
(US$/ha)
Current management
practice (US$/ha)
1. Labor cost 111 50
2. Fertilizer Cost (Macronutrients) 111 50
3. Fertilizer Cost (Micronutrients) 111 0
4. Farm Yard Manure 185 93
5. Sprays 93 0
6. Total Management Cost/ha 611 193
7. Increase in Cost 3.17
123 KNOWLEDGE FOR LIFE
Annexure-5: Feasibility Study for Dates pack house
Pakistan is the fifth largest producer of dates (Phoenix dactylifera L.) or ‘Khajoor’. Dates have
vast potential of export; the major countries importing both fresh and dried dates from Pakistan
are India, USA, UK, Canada, Germany, Denmark, Malaysia and Indonesia. However, efforts
are required to apply post-harvest management and processing techniques to qualifying the
international standards. The polluted dates with mud which is mostly present on the packed
Pakistani dates was due to the poor handling of fruit during harvest rather than processing.
There are few plants working on dates processing at the “Khairpur‟, however, the standards
of the processed dates in these processing units need to be improved. It is one of the
challenges in front of the industry to increase the price of Pakistani dates to resist the
competent prices of the international market. But, fund is still the main hindrance facing the
research institutes to continue in this sector and conduct the required research whether on the
product of current plants or establish a world-model small processing plant. Prices of early
season dates are always expensive than the mid-season dates. Handling the crop after
harvest is lacking the experience. Subsequently the microbial load of the dates was
dramatically increased before processing and storage which caused problems for processors.
Processing of such dates can be improved through a good treatment for curing away from
boiling process for Chohara making. Subsequently, grading the fruit according to their size is
very important for marketing. There are nowadays modern machines available for dates
processing.
Objectives
The objective of this feasibility study is to provide information to future investors regarding
Low cost Preservation of dates and
Storage of dates by cleaning, Insect pest and diseases inspection, grading, sorting, quality control, packing, cooling, food safety, loading etc.
The diagrammatic process flow is described below;
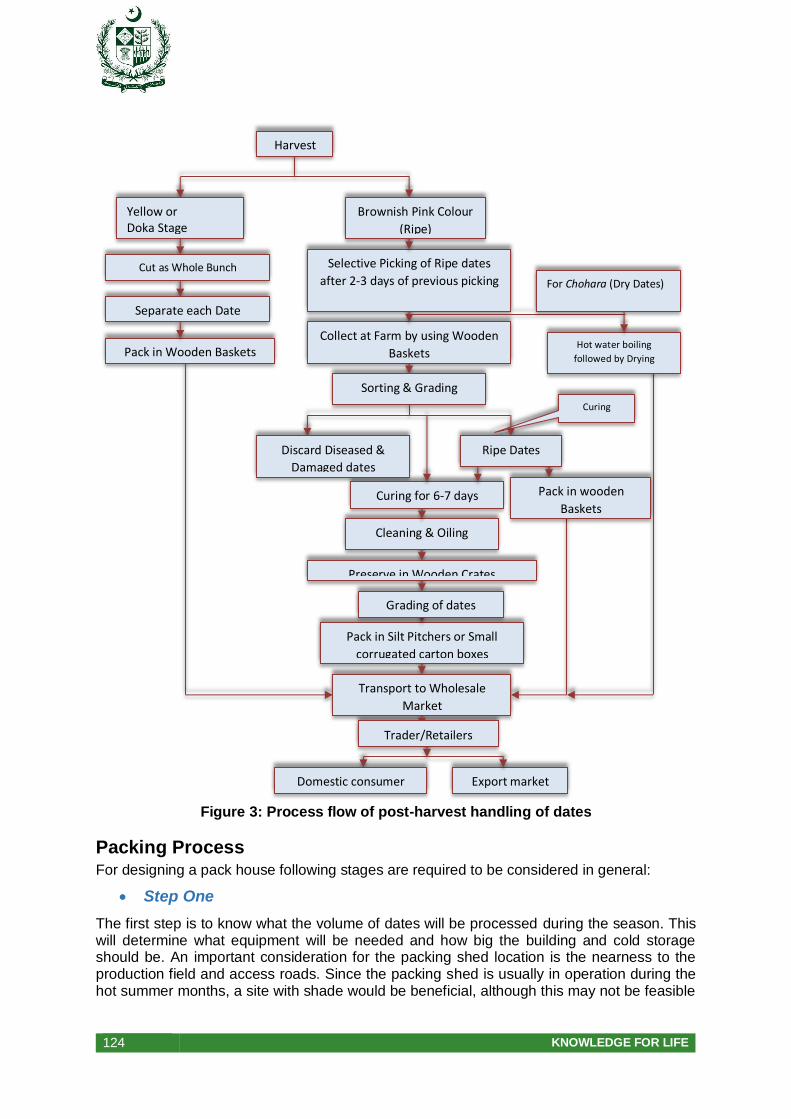
124 KNOWLEDGE FOR LIFE
Figure 3: Process flow of post-harvest handling of dates
Packing Process For designing a pack house following stages are required to be considered in general:
Step One
The first step is to know what the volume of dates will be processed during the season. This will determine what equipment will be needed and how big the building and cold storage should be. An important consideration for the packing shed location is the nearness to the production field and access roads. Since the packing shed is usually in operation during the hot summer months, a site with shade would be beneficial, although this may not be feasible
Curing
Harvest
Yellow or Doka Stage
Cut as Whole Bunch
Separate each Date
Pack in Wooden Baskets
Brownish Pink Colour
(Ripe)
Selective Picking of Ripe dates
after 2-3 days of previous picking
Collect at Farm by using Wooden
Baskets
Sorting & Grading
Discard Diseased &
Damaged dates
Ripe Dates
Curing for 6-7 days
Cleaning & Oiling
Preserve in Wooden Crates
Pack in Silt Pitchers or Small
corrugated carton boxes
Grading of dates
Transport to Wholesale
Market
Trader/Retailers
Domestic consumer
Pack in wooden
Baskets
Hot water boiling
followed by Drying
For Chohara (Dry Dates)
Export market

125 KNOWLEDGE FOR LIFE
for a large operation. To keep the building cool, good ventilation and fans will be needed. Insulation will also help keep the building cool.
Step Two
Next, develop a flow diagram of all the post-harvest handling processes, which will be used with each crop. This diagram will help with the layout development of the packing shed.
The produce should always move in one direction, with no crossovers of the product from each step in the packing operation. This has become more important, as fresh produce handling methods must now include procedures and practices to prevent the spread of pathogens. Since there are no steps, like heating, to eradicate pathogens, action must be taken to prevent contamination and recontamination. There should be one door for receiving produce from the field, and one door for shipping packed produce out.
Step Three
Arrangements must be made for a good water source and adequate utilities. Water used to wash the produce must be potable (safe to drink). An approximately 2-inch main water line with 1-inch laterals is recommended. The floors should be sloped to 6 inches wide drains that are 6- to 8-inches deep. Hot water is needed for cleanup and workers’ personal hygiene. The produce washing water should be chlorinated from 100 to 200 ppm. This recommended level kill pathogens that cause produce decay. However, it is not high enough to kill some food borne pathogens. The chlorine level should be checked throughout the day. As time passes, chlorine ions bind to organic matter and lose their effectiveness. Chlorination can be done by using household bleach, swimming pool chlorine or injection of compressed chlorine gas into the washing water. If a dump tank is used, the water should be changed frequently, especially if root crops or ones that had contact with the ground are being packed. Dirty water creates dirty produce.
Special attention needs to be given to the electrical requirements of the packing shed. It may be housing automated washing and sizing equipment, precooling facilities and cold storage units. The refrigeration equipment for the cold storage and chilling water for hydro-cooling often requires 3-Phase electrical power.
Step Four
The disposal of both liquid and solid waste is an important consideration in designing and setting up a packing shed. Maintaining and conserving water quality becomes an issue for produce operations— how to properly handle wastewater from the packing line can also become a problem. Wastewater should never be dumped into the household septic system or the septic system for the toilets, showers and sinks in the packing facility.
The volume of wastewater will overwhelm these systems and reduce their effectiveness. Floor drains will be needed in the facility to carry wastewater to a separate septic field. The solid waste (culled produce) may be composted, spread on fallow fields or sold as animal feed.
Step Five
Design a receiving area and packing line, which is fit for individual needs. The receiving area should be elevated so that produce can be easily unloaded off the trucks or wagons carrying it from the field.
The height will depend on the vehicles used. Dollies, pallet jacks, and forklifts can then be used to load several harvest containers. The shipping area should also be elevated for easy loading to markets (Figure 2).
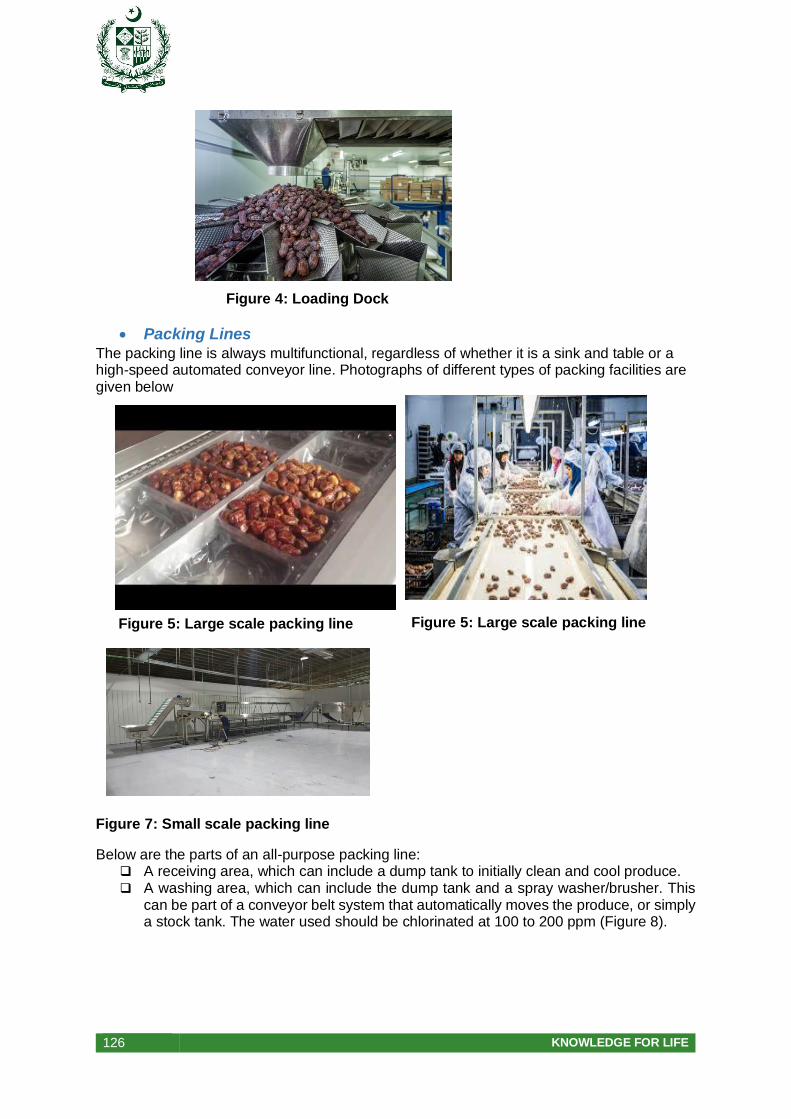
126 KNOWLEDGE FOR LIFE
Packing Lines
The packing line is always multifunctional, regardless of whether it is a sink and table or a high-speed automated conveyor line. Photographs of different types of packing facilities are given below
Figure 7: Small scale packing line
Below are the parts of an all-purpose packing line: A receiving area, which can include a dump tank to initially clean and cool produce. A washing area, which can include the dump tank and a spray washer/brusher. This
can be part of a conveyor belt system that automatically moves the produce, or simply a stock tank. The water used should be chlorinated at 100 to 200 ppm (Figure 8).
Figure 4: Loading Dock
Figure 5: Large scale packing line Figure 5: Large scale packing line
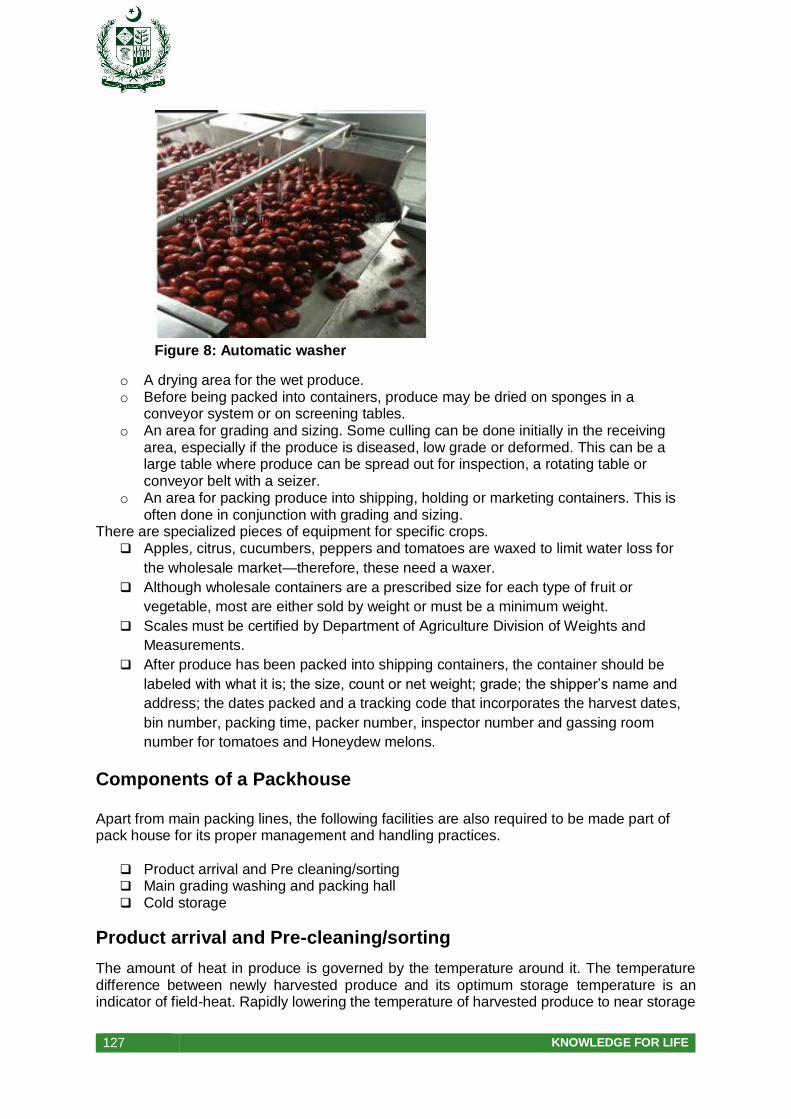
127 KNOWLEDGE FOR LIFE
o A drying area for the wet produce. o Before being packed into containers, produce may be dried on sponges in a
conveyor system or on screening tables. o An area for grading and sizing. Some culling can be done initially in the receiving
area, especially if the produce is diseased, low grade or deformed. This can be a large table where produce can be spread out for inspection, a rotating table or conveyor belt with a seizer.
o An area for packing produce into shipping, holding or marketing containers. This is often done in conjunction with grading and sizing.
There are specialized pieces of equipment for specific crops. Apples, citrus, cucumbers, peppers and tomatoes are waxed to limit water loss for
the wholesale market—therefore, these need a waxer.
Although wholesale containers are a prescribed size for each type of fruit or
vegetable, most are either sold by weight or must be a minimum weight.
Scales must be certified by Department of Agriculture Division of Weights and
Measurements.
After produce has been packed into shipping containers, the container should be
labeled with what it is; the size, count or net weight; grade; the shipper’s name and
address; the dates packed and a tracking code that incorporates the harvest dates,
bin number, packing time, packer number, inspector number and gassing room
number for tomatoes and Honeydew melons.
Components of a Packhouse Apart from main packing lines, the following facilities are also required to be made part of pack house for its proper management and handling practices.
Product arrival and Pre cleaning/sorting Main grading washing and packing hall Cold storage
Product arrival and Pre-cleaning/sorting
The amount of heat in produce is governed by the temperature around it. The temperature difference between newly harvested produce and its optimum storage temperature is an indicator of field-heat. Rapidly lowering the temperature of harvested produce to near storage
Figure 8: Automatic washer
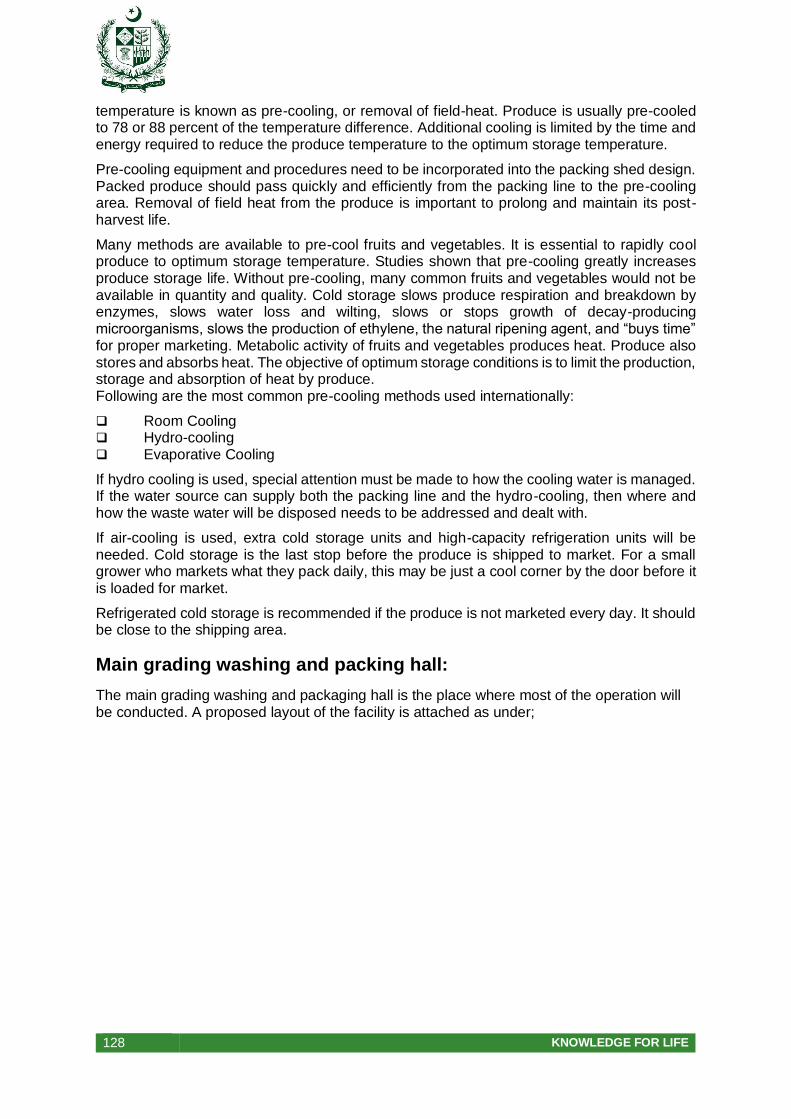
128 KNOWLEDGE FOR LIFE
temperature is known as pre-cooling, or removal of field-heat. Produce is usually pre-cooled to 78 or 88 percent of the temperature difference. Additional cooling is limited by the time and energy required to reduce the produce temperature to the optimum storage temperature.
Pre-cooling equipment and procedures need to be incorporated into the packing shed design. Packed produce should pass quickly and efficiently from the packing line to the pre-cooling area. Removal of field heat from the produce is important to prolong and maintain its post-harvest life.
Many methods are available to pre-cool fruits and vegetables. It is essential to rapidly cool produce to optimum storage temperature. Studies shown that pre-cooling greatly increases produce storage life. Without pre-cooling, many common fruits and vegetables would not be available in quantity and quality. Cold storage slows produce respiration and breakdown by enzymes, slows water loss and wilting, slows or stops growth of decay-producing microorganisms, slows the production of ethylene, the natural ripening agent, and “buys time” for proper marketing. Metabolic activity of fruits and vegetables produces heat. Produce also stores and absorbs heat. The objective of optimum storage conditions is to limit the production, storage and absorption of heat by produce. Following are the most common pre-cooling methods used internationally:
Room Cooling Hydro-cooling Evaporative Cooling
If hydro cooling is used, special attention must be made to how the cooling water is managed. If the water source can supply both the packing line and the hydro-cooling, then where and how the waste water will be disposed needs to be addressed and dealt with.
If air-cooling is used, extra cold storage units and high-capacity refrigeration units will be needed. Cold storage is the last stop before the produce is shipped to market. For a small grower who markets what they pack daily, this may be just a cool corner by the door before it is loaded for market.
Refrigerated cold storage is recommended if the produce is not marketed every day. It should be close to the shipping area.
Main grading washing and packing hall:
The main grading washing and packaging hall is the place where most of the operation will be conducted. A proposed layout of the facility is attached as under;
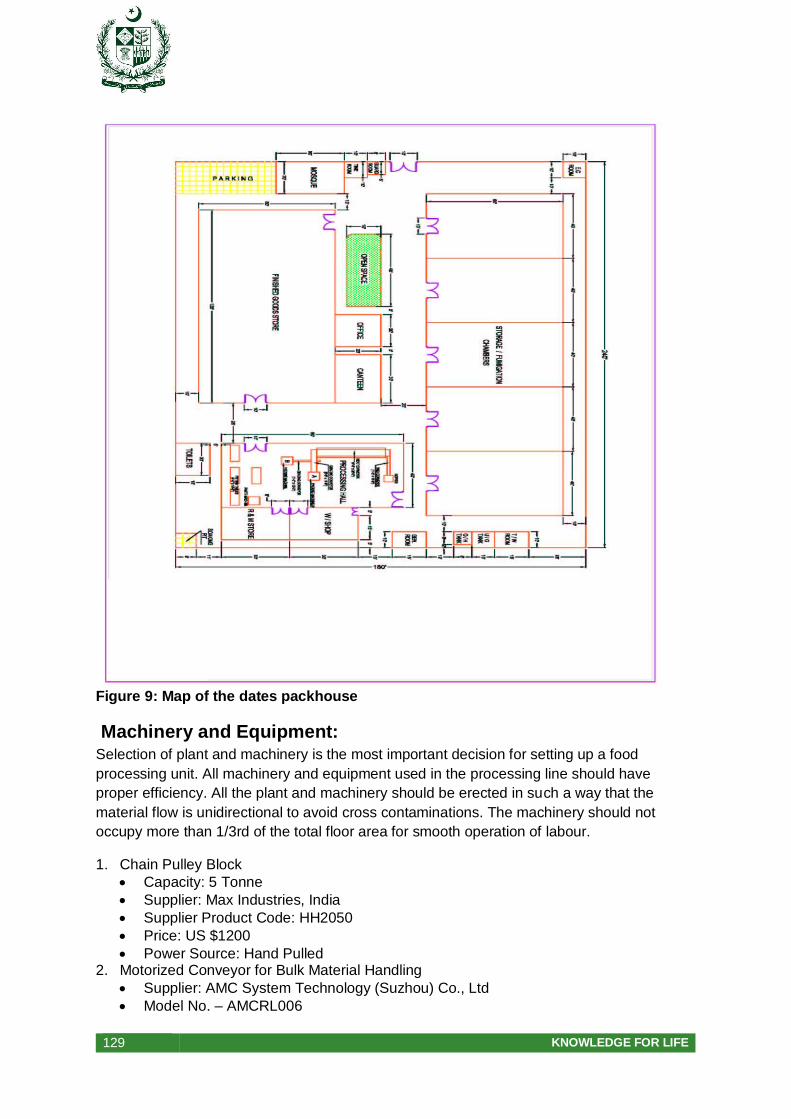
129 KNOWLEDGE FOR LIFE
Figure 9: Map of the dates packhouse
Machinery and Equipment: Selection of plant and machinery is the most important decision for setting up a food
processing unit. All machinery and equipment used in the processing line should have
proper efficiency. All the plant and machinery should be erected in such a way that the
material flow is unidirectional to avoid cross contaminations. The machinery should not
occupy more than 1/3rd of the total floor area for smooth operation of labour.
1. Chain Pulley Block
Capacity: 5 Tonne
Supplier: Max Industries, India
Supplier Product Code: HH2050
Price: US $1200
Power Source: Hand Pulled 2. Motorized Conveyor for Bulk Material Handling
Supplier: AMC System Technology (Suzhou) Co., Ltd
Model No. – AMCRL006
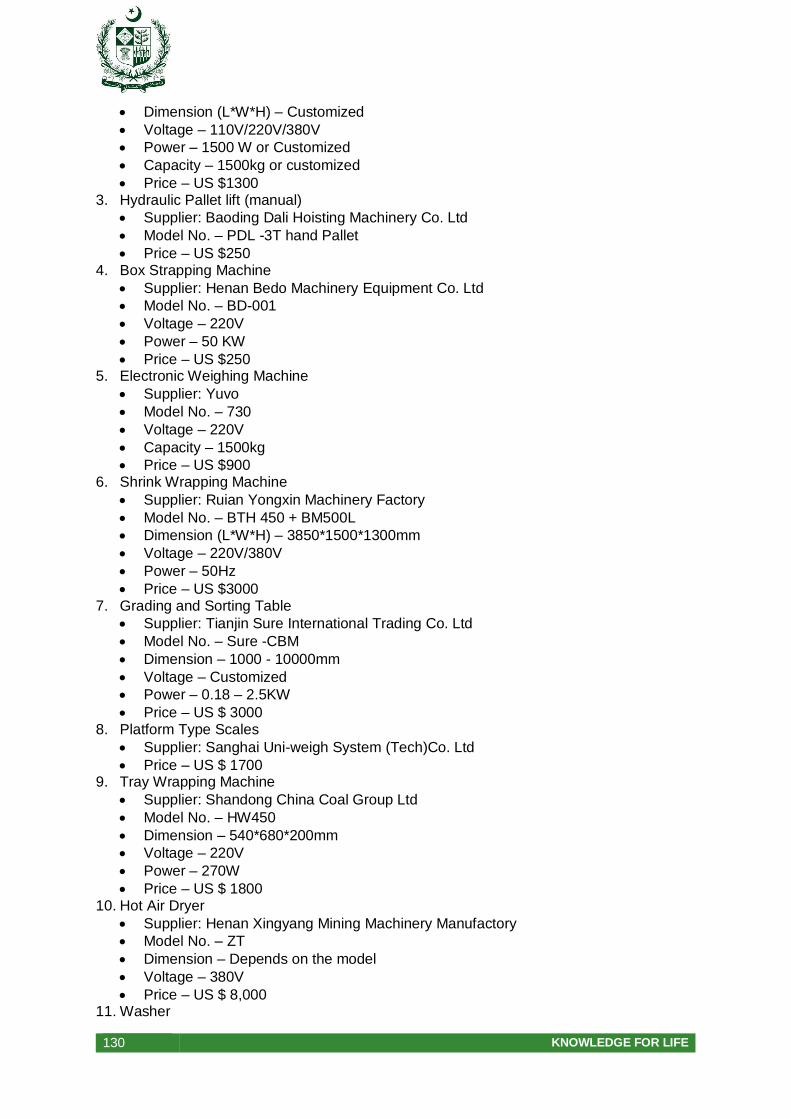
130 KNOWLEDGE FOR LIFE
Dimension (L*W*H) – Customized
Voltage – 110V/220V/380V
Power – 1500 W or Customized
Capacity – 1500kg or customized
Price – US $1300 3. Hydraulic Pallet lift (manual)
Supplier: Baoding Dali Hoisting Machinery Co. Ltd
Model No. – PDL -3T hand Pallet
Price – US $250 4. Box Strapping Machine
Supplier: Henan Bedo Machinery Equipment Co. Ltd
Model No. – BD-001
Voltage – 220V
Power – 50 KW
Price – US $250 5. Electronic Weighing Machine
Supplier: Yuvo
Model No. – 730
Voltage – 220V
Capacity – 1500kg
Price – US $900 6. Shrink Wrapping Machine
Supplier: Ruian Yongxin Machinery Factory
Model No. – BTH 450 + BM500L
Dimension (L*W*H) – 3850*1500*1300mm
Voltage – 220V/380V
Power – 50Hz
Price – US $3000 7. Grading and Sorting Table
Supplier: Tianjin Sure International Trading Co. Ltd
Model No. – Sure -CBM
Dimension – 1000 - 10000mm
Voltage – Customized
Power – 0.18 – 2.5KW
Price – US $ 3000 8. Platform Type Scales
Supplier: Sanghai Uni-weigh System (Tech)Co. Ltd
Price – US $ 1700 9. Tray Wrapping Machine
Supplier: Shandong China Coal Group Ltd
Model No. – HW450
Dimension – 540*680*200mm
Voltage – 220V
Power – 270W
Price – US $ 1800 10. Hot Air Dryer
Supplier: Henan Xingyang Mining Machinery Manufactory
Model No. – ZT
Dimension – Depends on the model
Voltage – 380V
Price – US $ 8,000 11. Washer
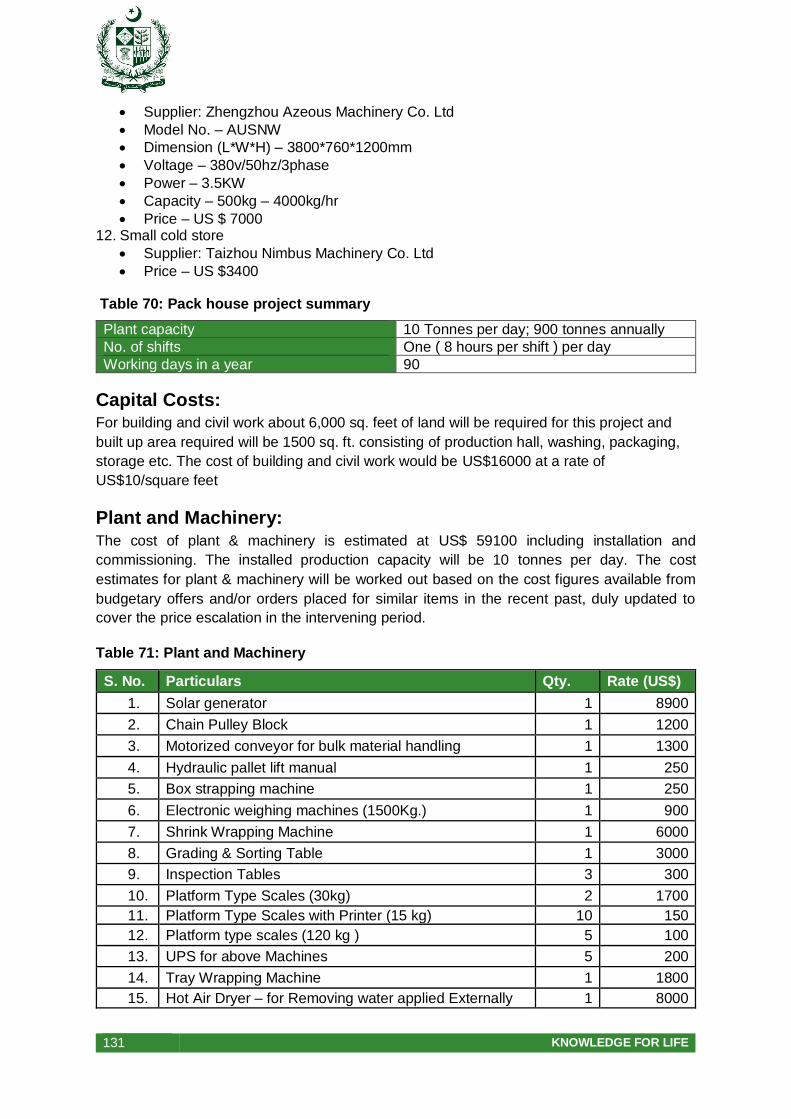
131 KNOWLEDGE FOR LIFE
Supplier: Zhengzhou Azeous Machinery Co. Ltd
Model No. – AUSNW
Dimension (L*W*H) – 3800*760*1200mm
Voltage – 380v/50hz/3phase
Power – 3.5KW
Capacity – 500kg – 4000kg/hr
Price – US $ 7000 12. Small cold store
Supplier: Taizhou Nimbus Machinery Co. Ltd
Price – US $3400
Table 70: Pack house project summary
Plant capacity 10 Tonnes per day; 900 tonnes annually
No. of shifts One ( 8 hours per shift ) per day
Working days in a year 90
Capital Costs: For building and civil work about 6,000 sq. feet of land will be required for this project and
built up area required will be 1500 sq. ft. consisting of production hall, washing, packaging,
storage etc. The cost of building and civil work would be US$16000 at a rate of
US$10/square feet
Plant and Machinery: The cost of plant & machinery is estimated at US$ 59100 including installation and
commissioning. The installed production capacity will be 10 tonnes per day. The cost
estimates for plant & machinery will be worked out based on the cost figures available from
budgetary offers and/or orders placed for similar items in the recent past, duly updated to
cover the price escalation in the intervening period.
Table 71: Plant and Machinery
S. No. Particulars Qty. Rate (US$)
1. Solar generator 1 8900
2. Chain Pulley Block 1 1200
3. Motorized conveyor for bulk material handling 1 1300
4. Hydraulic pallet lift manual 1 250
5. Box strapping machine 1 250
6. Electronic weighing machines (1500Kg.) 1 900
7. Shrink Wrapping Machine 1 6000
8. Grading & Sorting Table 1 3000
9. Inspection Tables 3 300
10. Platform Type Scales (30kg) 2 1700
11. Platform Type Scales with Printer (15 kg) 10 150
12. Platform type scales (120 kg ) 5 100
13. UPS for above Machines 5 200
14. Tray Wrapping Machine 1 1800
15. Hot Air Dryer – for Removing water applied Externally 1 8000

132 KNOWLEDGE FOR LIFE
16. Waxing Unit 1 2500
17. Washer 1 7000
18. Automatic vegetable grading and sorting line (1 tonne per hour)
1 15000
19. Packaging machine, Pouch sealing machine 1 170
20. Cold Storage 1 7000
21. PU Building for Pack house (1500 sq. ft.) 1 16000
22. Ethylene Generator 3 nos. (Sure Ripe) 1 200
23. Ethy-gen II Concentrate (45 cases) 1 200
24. Gastech. Air Sampling Kit Unit 1 no. 1 1 180
25. Ethylene Monitoring Tube - 1 Box 1 180
26. Carbon di-oxide Monitoring Unit 1 400
27. 1 0.04 0.04 30 Additional Dryers for Removing Moisture- 1MT Per Day
1 120
28. Pallets and Bins 3000
Total 86000
Misc. Fixed Asset Costs:
US$ 21500 has been estimated under the heading of miscellaneous fixed assets. The details
of electrical installations for power distribution have been considered commensurate with the
power load and process control requirements. Other miscellaneous fixed assets including
furniture, office machinery & equipment, equipment for water supply, office stationery,
telephone and refreshment, workshop, fire-fighting equipment, etc. will be provided on a lump
sum basis as per information available with the consultants for similar assets. The details of
miscellaneous fixed assets and their associated costs are shown in table below:
Table 72: Miscellaneous fixed asset cost
S. No. Particulars Qty. Rate (US$)
1. Office Equipment 1 2000
2. Furniture and Fixture 1 3000
3. Miscellaneous Accessories 1 2000
4. Vegetable Display Crate 50 150
5. Display Board 5 50
6. Fire Fighting 1 50
7. Computer with Accessories 2 1000
8. ERP System 1 10000
9. Water Treatment Plant – 500 litres per hour 1 1000
10. Loading Tempo 1 250
11. Electrical and water pipes Installation 1 2000 Total 21500
Pre-Operative Expenses:
Expenses incurred prior to commencement of commercial production are covered under this
head that total US$ 31700. Pre-operative expenses include establishment cost, rent, taxes,
traveling expenses and other miscellaneous expenses. It has been assumed that the funds
from various sources shall be available, as required. Based on the project implementation
schedule, the expected completion dates of various activities and the estimated phasing of
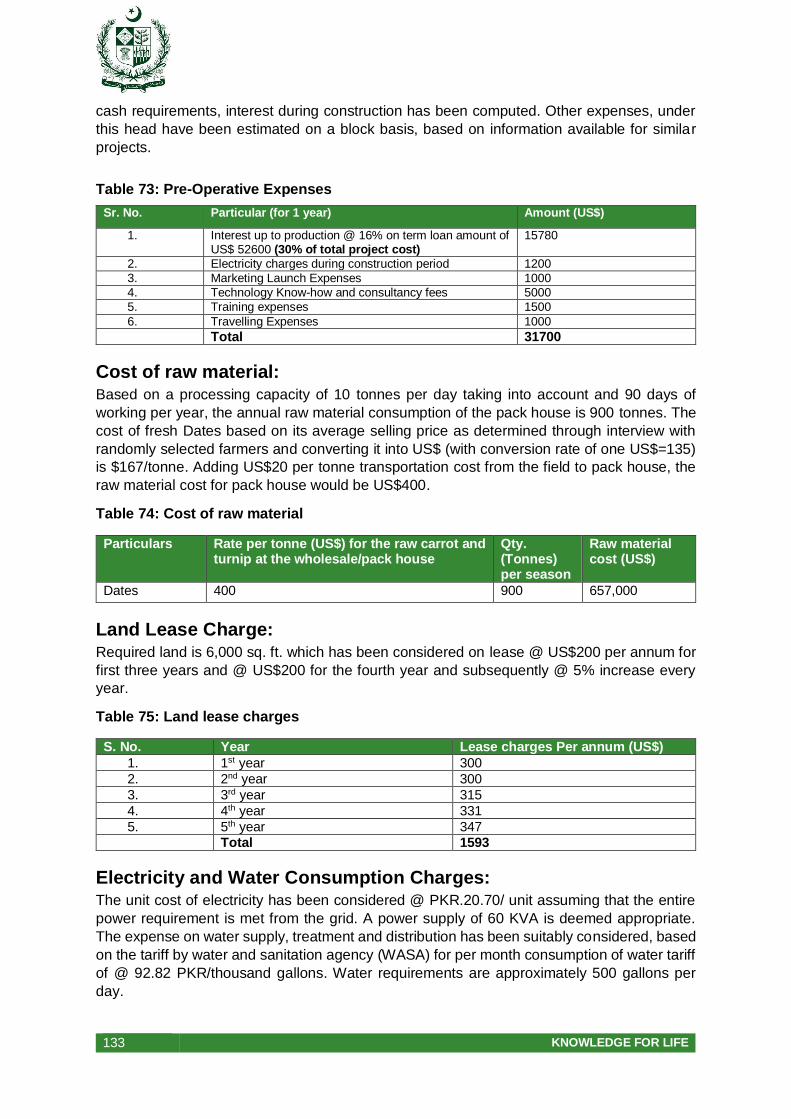
133 KNOWLEDGE FOR LIFE
cash requirements, interest during construction has been computed. Other expenses, under
this head have been estimated on a block basis, based on information available for similar
projects.
Table 73: Pre-Operative Expenses
Sr. No. Particular (for 1 year) Amount (US$)
1. Interest up to production @ 16% on term loan amount of US$ 52600 (30% of total project cost)
15780
2. Electricity charges during construction period 1200
3. Marketing Launch Expenses 1000
4. Technology Know-how and consultancy fees 5000
5. Training expenses 1500
6. Travelling Expenses 1000
Total 31700
Cost of raw material: Based on a processing capacity of 10 tonnes per day taking into account and 90 days of
working per year, the annual raw material consumption of the pack house is 900 tonnes. The
cost of fresh Dates based on its average selling price as determined through interview with
randomly selected farmers and converting it into US$ (with conversion rate of one US$=135)
is $167/tonne. Adding US$20 per tonne transportation cost from the field to pack house, the
raw material cost for pack house would be US$400.
Table 74: Cost of raw material
Particulars Rate per tonne (US$) for the raw carrot and turnip at the wholesale/pack house
Qty. (Tonnes) per season
Raw material cost (US$)
Dates 400 900 657,000
Land Lease Charge: Required land is 6,000 sq. ft. which has been considered on lease @ US$200 per annum for
first three years and @ US$200 for the fourth year and subsequently @ 5% increase every
year.
Table 75: Land lease charges
S. No. Year Lease charges Per annum (US$)
1. 1st year 300
2. 2nd year 300
3. 3rd year 315
4. 4th year 331
5. 5th year 347 Total 1593
Electricity and Water Consumption Charges: The unit cost of electricity has been considered @ PKR.20.70/ unit assuming that the entire
power requirement is met from the grid. A power supply of 60 KVA is deemed appropriate.
The expense on water supply, treatment and distribution has been suitably considered, based
on the tariff by water and sanitation agency (WASA) for per month consumption of water tariff
of @ 92.82 PKR/thousand gallons. Water requirements are approximately 500 gallons per
day.

134 KNOWLEDGE FOR LIFE
Table 76: Electricity and water consumption charges
S. No. Description Amount Per Annum (US$)
1. Power Consumption 4000
2. Water Consumption 200 Total 4200
Human Resource Cost One pack house manager, one accountant for six months, one supervisor for six months
technical staff Salaries & wages (including benefits) for different categories of employees have
been considered based on present day expenses being incurred by other industries in the
vicinity. The breakdown of manpower and incidence of salaries & wages are detailed in the
table Salary & Wages. Salary & wages are increased @ 5% every year
Table 77: Salary and wages
Sr. No. Description Requirement Salary/month (US$)
Salary/annum (US$)
1. Packhouse manager 1 750 9000
2. Accountant 1 520 6240
3. Supervisor 2 740 8880
4. Skilled Workers 4 1200 1440
5. Driver 1 370 4440
6. Security Guard 1 225 5400 Total 3805 48360
Table 78: Cost of Project
Sr. No. Particular Value (US$)
Fixed costs
1. Plant and Machinery 86000
2. Misc. Fixed Assets 21580
3. Pre-operative expenses 52600
Operating costs
1. Cost of raw material 657000
2. Land lease charges 1593
3. Electricity and water consumption 4200
4. Salary and wages (For 180 days) 48360
5. Margin Money for Working Capital 1500
6. Contingencies 5% of Fixed Assets 2158 Total variable costs 874,991
Table 79: Project Income Statement
Revenues Year 0 Year 1 Year 2 Year 3 Year 4 Year
5
Revenue (US$)
Quantity of Dates that goes in value
addition or capacity of pack house
(tonnes)
900 900 900 900 900

135 KNOWLEDGE FOR LIFE
Price of the value added Dates
(US$/tonne)
730 730 730 730 730
Total revenues (US$)
657000 65700
0
65700
0
65700
0
65700
0
Direct varaible Costs
Raw material price (US$/tonne)
400 400 400 400 400
Raw material cost (us$)
360000 360000 360000 360000 0
Packing costs (@PKR10 per 1 kg box)
6667 6667 6667 6667
Labor cost
48360 48360 48360 48360
Electricity and water
4200 4200 4200 4200
1601 1601 1601 1601
Land lease charges (5%) increment on
annual
300 300 315 331 347
Marketing (US$10/tonne)
9000 9000 9000 9000
Office administration 370 370 370 370
430898 430913 430929 430945 400
Gross profit
226102 226087 226071 226055 656600
Indirect fixed cost
Machinery -
16010
0
Licensing and regulatory fee -150 0 0 0 0
Total -
16025
0
0 0 0 0
Grand total cost -160250 430898 430913 430929 430945 0
Net profit (Net cash flow) -
16025
0
226102 226087 226071 226055 65700
0
Discount rate 8.5%
NPV
937,542
IRR
144%
Net profit (Net cash flow) = 657,000 NPV = 937,542 IRR = 144%
Project Viability:
The Internal Rate of Return of the project is estimated at 144%, which is significantly higher
than the bank return rate of 16%. Hence, the project is deemed financially viable. The NPV of
the project is positive (US$937,542) at a discount factor of 16% during the first 5 years of
operation considered. This implies that the project generates sufficient funds to cover all its
cost, including loan repayments and interest payments during the period. This also indicates
that the project is financially viable over the long term.
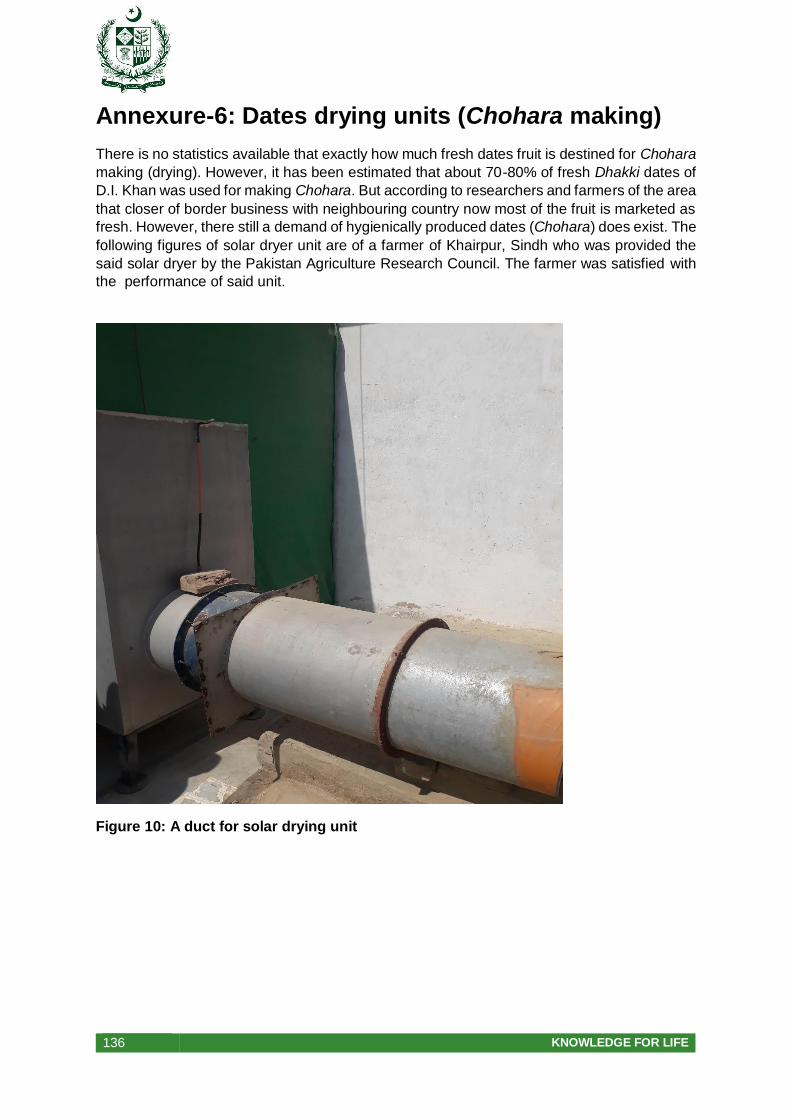
136 KNOWLEDGE FOR LIFE
Annexure-6: Dates drying units (Chohara making)
There is no statistics available that exactly how much fresh dates fruit is destined for Chohara
making (drying). However, it has been estimated that about 70-80% of fresh Dhakki dates of
D.I. Khan was used for making Chohara. But according to researchers and farmers of the area
that closer of border business with neighbouring country now most of the fruit is marketed as
fresh. However, there still a demand of hygienically produced dates (Chohara) does exist. The
following figures of solar dryer unit are of a farmer of Khairpur, Sindh who was provided the
said solar dryer by the Pakistan Agriculture Research Council. The farmer was satisfied with
the performance of said unit.
Figure 10: A duct for solar drying unit

137 KNOWLEDGE FOR LIFE
Figure 11: Exhaust duct for solar drying unit.
Figure 12: Dried dates (Chohara) by using solar drying unit.
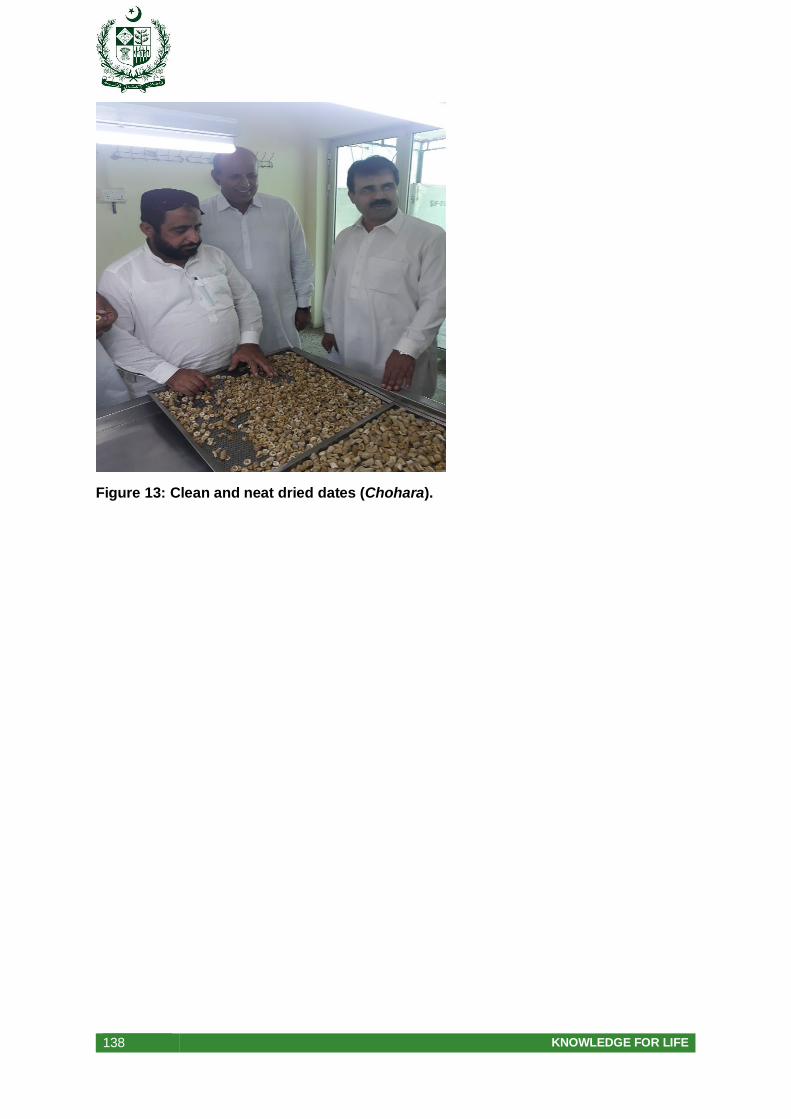
138 KNOWLEDGE FOR LIFE
Figure 13: Clean and neat dried dates (Chohara).
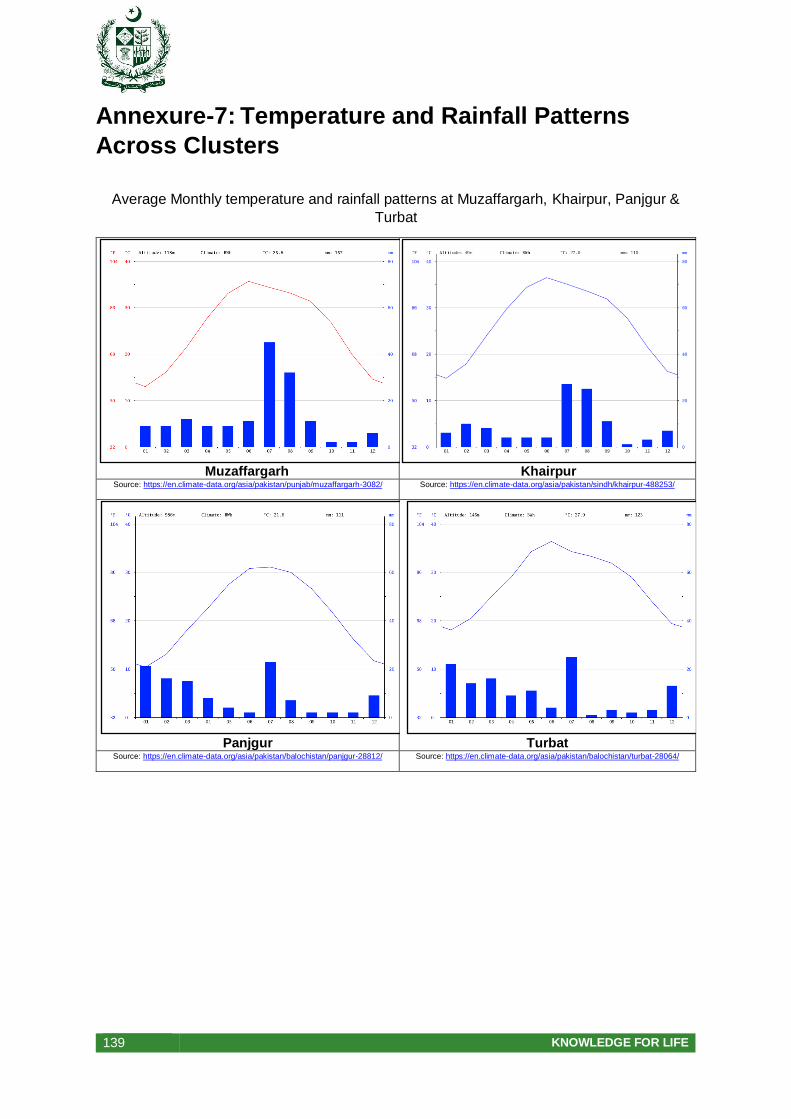
139 KNOWLEDGE FOR LIFE
Annexure-7: Temperature and Rainfall Patterns
Across Clusters
Average Monthly temperature and rainfall patterns at Muzaffargarh, Khairpur, Panjgur &
Turbat
Muzaffargarh
Khairpur
Source: https://en.climate-data.org/asia/pakistan/punjab/muzaffargarh-3082/ Source: https://en.climate-data.org/asia/pakistan/sindh/khairpur-488253/
Panjgur
Turbat
Source: https://en.climate-data.org/asia/pakistan/balochistan/panjgur-28812/ Source: https://en.climate-data.org/asia/pakistan/balochistan/turbat-28064/
Copyright © 2022 FDOKUMEN