Walnut_Cluster_Report.pdf - Ministry of Planning ...
68
KNOWLEDGE FOR LIFE CLUSTER DEVELOPMENT BASED AGRICULTURE TRANSFORMATION PLAN VISION- 2025 Walnut Cluster Feasibility and Transformation Study Planning Commission of Pakistan, Ministry of Planning, Development & Reforms February 2020
-
Upload
khangminh22 -
Category
Documents
-
view
0 -
download
0
Transcript of Walnut_Cluster_Report.pdf - Ministry of Planning ...

KNOWLEDGE FOR LIFE
CLUSTER DEVELOPMENT BASED AGRICULTURE TRANSFORMATION PLAN VISION-
2025
Walnut Cluster Feasibility and Transformation Study
Planning Commission of Pakistan, Ministry of Planning, Development & Reforms
February 2020

1 KNOWLEDGE FOR LIFE
2 KNOWLEDGE FOR LIFE
FOREWORD In many developed and developing countries, the cluster-based development approach has become the basis for the transformation of various sectors of the economy including the agriculture sector. This approach not only improves efficiency of development efforts by enhancing stakeholders’ synergistic collaboration to resolve issues in the value chain in their local contexts, but also helps to gather resources from large number of small investors into the desirable size needed for the cluster development. I congratulate the Centre for Agriculture and Bioscience International (CABI) and its team to undertake this study on Feasibility Analysis for Cluster Development Based Agriculture Transformation. An important aspect of the study is the estimation of resources and infrastructure required to implement various interventions along the value chain for the development of clusters of large number of agriculture commodities. The methodology used in the study can also be applied as a guide in evaluating various investment options put forward to the Planning Commission of Pakistan for various sectors, especially where regional variation is important in the project design.

3 KNOWLEDGE FOR LIFE
FOREWORD To improve enhance Pakistan’s competitiveness in the agriculture sector in national and
international markets, the need to evaluate the value chain of agricultural commodities in the
regional contexts in which these are produced, marketed, processed and traded was long felt.
The Planning Commission of Pakistan was pleased to sponsor this study on the Feasibility
Analysis for Cluster Development Based Agriculture Transformation to fill this gap. The
study aims to cover a large number of agriculture commodities spread in various clusters
throughout the country.
I truly hope that the policies, strategies, and interventions suggested in this report will facilitate
the federal and provincial governments to chalk out and implement plans for cluster-based
transformation of the agriculture sector.

4 KNOWLEDGE FOR LIFE
FOREWORD
This is part of the series of studies on 33 agriculture commodities undertaken for the purpose
of preparing a cluster-based transformation plan based on the regional realities in the entire
value chain including production, processing, value addition, and marketing. I congratulate the
whole team of the project especially the Team Lead, Dr. Mubarik Ali to undertake and
successfully complete this monumental study. We are thankful to all commodity specialists
who have contributed to this assignment. The CABI Project officers Mr. Yasar Saleem Khan
and Ms. Aqsa Yasin deserve appreciation. I truly believe that this study will serve as a basis
to make and implement plans for cluster-based agriculture transformation. I hope you will
enjoy reading the study and it can help you making your investment decisions along the value
chain of various agriculture commodities.
Dr. Babar Ehsan Bajwa
Regional Director
CAB International
5 KNOWLEDGE FOR LIFE
FOREWORD This report is part of the series of studies on 33 agriculture commodities to prepare the
agriculture transformation plan by incorporating regional realities at the cluster level. In the
report, the clusters of various commodities are identified and characterized, and viable
investment options along the value chain of each cluster are proposed. For this purpose, the
study team has analyzed macro data, reviewed the literature, and made extensive consultation
with stakeholders along the value chain. Foreign and local internationally reputed consultants,
Dr. Derek Byerlee and Dr. Kijiro. Otsuka and national consultant Mr. Sohail Moghal were also
engaged to understand the cluster-based development approach and conduct cluster-based
feasibility analysis. An EXCEL-based Model was developed which was validated by our
national consultants. Separate viabilities for individual technologies and products suggested
in each commodity are also estimated. This humongous task would not have been possible to
complete without the excellent cooperation and facilities provide by CABI, the hard work of
commodity specialists and our research team especially Mr. Yasar Saleem Khan and Ms.
Aqsa Yasin. The true reward of our hard work is the implementation of the proposed policies,
strategies and interventions to develop agriculture commodity clusters in the country.
Dr. Mubarik Ali
Team Leader
Cluster Development Based Agriculture
Transformation Plan-Vision 2020 Project
Planning Commission of Pakistan and
CAB International

6 KNOWLEDGE FOR LIFE
ACKNOWLEDGEMENT
It is not possible to mention the names of all those who collaborated with us in completing this
report, but my foremost gratitude goes to numerous stakeholders along the value chain who
generously shared the information about walnut production, marketing, trade and value chain.
Without their support, this report would not have reached to the level of present quality.
My sincere thanks go to Planning Commission of Pakistan for this initiative and especially
financial assistance to complete the project activities. Here I am especially thankful to Dr.
Muhammad Azeem Khan (Ex-Member, Food Security and Climate Change, Planning
Commission of Pakistan), Dr. Aamir Arshad (Chief Agriculture, Planning Commission of
Pakistan), Mr. Muhammad Akram Khan (Project Director; CDBAT project) and other CDBAT
project team member Mr. Muhammad Arif (Research Associate) and Dr. Habib Gul
(Research Associate) for successful coordination and support for the project.
I am also grateful to Centre for Agriculture and Bioscience International (CABI) and its
Regional Director for Central and West Asia, Dr. Babar Ehsan Bajwa and CABI team
especially Mr. Yasar Saleem Khan for selecting me as commodity specialist for this task and
offering outstanding cooperation, support and advice during all the stages of this project.
However, the research team takes the responsibility of any shortcoming left in the report.
Izhar Hunzai
Senior Author
Citation:
Hunzai Izhar, Ali Mubarik. and Yasin Aqsa. (2020). Walnut Cluster Feasibility and Transformation Study. In Ali Mubarik (ed.). (2020). Cluster Development Based Agriculture Transformation Plan Vision-2025. Project No. 131(434) PC/AGR/CDBAT-120/2018. Planning Commission of Pakistan, Islamabad, Pakistan and Centre for Agriculture and Biosciences International (CABI), Rawalpindi, Pakistan.

7 KNOWLEDGE FOR LIFE
DISCLAIMER
This report is prepared by using the data from various published and unpublished sources and
that obtained during the consultations with stakeholders. The research team took utmost care
to arrive at the figures to be used, but is not responsible for any variation of the data in this
report than those reported in other sources. Moreover, the views expressed in this report are
purely of the authors and do not reflect the official views of the Planning Commission of
Pakistan, Ministry of Planning Development and Special Initiatives or the Centre for Agriculture
and Bioscience International (CABI).

8 KNOWLEDGE FOR LIFE
TABLE OF CONTENTS ACKNOWLEDGEMENT ............................................................................................................................ 6
LIST OF TABLES ....................................................................................................................................... 9
LIST OF FIGURES ..................................................................................................................................... 9
LIST OF ACRONYMS .............................................................................................................................. 10
EXECUTIVE SUMMARY ......................................................................................................................... 12
1. INTRODUCTION ................................................................................................................................. 16
1.1 WALNUT PRODUCTION IN PAKISTAN ................................................................................................. 16 1.2 GLOBAL CONTEXT ............................................................................................................................. 19 1.3 NEED OF THE STUDY ........................................................................................................................ 23
2. GOAL AND PURPOSE ...................................................................................................................... 24
3. METHODOLOGY ................................................................................................................................ 25
4. LITERATURE RIVEW ......................................................................................................................... 26
5. CLUSTER IDENTIFICATION AND CHARACTERISTICS .............................................................. 28
5.1 IDENTIFICATION OF WALNUT ............................................................................................................. 28 5.2 COMPARISONS OF CLUSTER CHARACTERISTICS ............................................................................. 29 5.3 DESCRIPTION OF VALUE CHAIN ........................................................................................................ 32
5.3.1. KP Midland Cluster ............................................................................................................... 32 5.3.2. GB Highland Cluster ............................................................................................................. 33
5.4 SWOT ANALYSIS .............................................................................................................................. 34
6. CHALLENGES FACED BY THE CLUSTERS .................................................................................. 39
7. CLUSTER DEVELOPMENT POTENTIAL ........................................................................................ 41
7.1. OVERVIEW ......................................................................................................................................... 41 7.2. PRODUCTION POTENTIAL .................................................................................................................. 41 7.3. IMPROVEMENT IN QUALITY ................................................................................................................ 42 7.4. REDUCTION IN POST-HARVEST LOSSES .......................................................................................... 42 7.5. INTERNATIONAL STANDARDS ............................................................................................................ 42
8. STRATEGIES TO REALIZE THE CLUSTER POTENTIAL ............................................................ 43
8.1. PLAN .................................................................................................................................................. 43 8.2. POLICY REFORMS ............................................................................................................................. 43 8.3. PRODUCTION LEVEL STRATEGIES .................................................................................................... 44 8.4. PROCESSING AND VALUE ADDITION ................................................................................................. 45 8.5. MARKETING AND TRADING/EXPORT STRATEGIES ............................................................................ 46
9. BENEFITS AND COSTS OF CLUSTERING .................................................................................... 47
9.1. INVESTMENT AND RESOURCE NEEDS ............................................................................................... 47 9.2. OPERATIONAL COST AND TOTAL INVESTMENTS............................................................................... 48 9.3. MODEL PARAMETERS AND KEY ASSUMPTIONS ................................................................................ 49 9.4. ECONOMIC AND SOCIAL FEASIBILITY ................................................................................................ 50 9.5. KEY INTERVENTIONS ......................................................................................................................... 50 9.6. CONCLUSION ................................................................................................................................ 50
10. PROGRAMS AND PLANS ................................................................................................................. 51
10.1. ORGANIZATION AND NETWORKING ................................................................................................... 51 10.2. PROGRAM FOR RESEARCH REFORM ................................................................................................ 52

9 KNOWLEDGE FOR LIFE
11. ANNEXURES 54
ANNEX 1. MACRO DATA SOURCES ............................................................................................................. 54 ANNEX 2. LIST OF STAKEHOLDERS CONSULTED ........................................................................................ 55 ANNEXURE-3. LIST OF DATA AND LITERATURE REVIEWED ........................................................................ 56
ANNEXURE-4 A: WALNUT CLUSTER: ANALYSIS FOR ECONOMIC RETURNS AND
FEASIBILITY, GB HIGHLAND ................................................................................... 58
ANNEX 4B: WALNUT CLUSTER: ANALYSIS FOR ECONOMIC RETURNS, KP .............................. 61
ANNEX-5. FEASIBILITY OF WALNUT DESHELLER ............................................................................ 64
LIST OF TABLES Table 1: Major Walnut Producing Provinces in Pakistan .................................................... 16
Table 2: Long Term Production Trends by Main Walnut Growing Provinces, 2016 ............ 18
.Table 3: Trends in walnut trade from Pakistan during 2001-17 .......................................... 18
Table 4: Comparison of World vs. Pakistani Walnut Sector (2016) ...................................... 20
Table 5: Global trends in walnut production during 2001-16 ................................................ 20
Table 6: Global export trends of walnut by type during 2001-17 .......................................... 21
Table 7: Top Walnut Producing Countries of the World ....................................................... 22
Table 8: Top Walnut Exporting Countries of the World ........................................................ 22
Table 9: Top Walnut Importing Countries of the World in terms of US$ Value ..................... 22
Table 10: Walnut Production in Khyber Pakhtunkhwa ......................................................... 28
Table 11: Walnut Production in Gilgit-Baltistan Highland Cluster ........................................ 28
Table 12: Characteristics of the Walnut Cluster ................................................................... 30
Table 13: SWOT Analysis of Walnut Super Cluster ............................................................. 35
Table 14: Proposed Investments for the Development of Northern Walnut Cluster ............. 47
Table 15: Summary of Investment and Operational Costs (Undiscounted US$) .................. 48
Table 16: Key Parameters and Assumptions of Feasibility Model ...................................... 49
Table 17: Economic Returns and Feasibility of Upgradation Plan by Cluster ...................... 50
Table 18: Program for Organization and Networking of Stakeholders ................................. 51
Table 19: Program for Research Reform ............................................................................. 52
LIST OF FIGURES Figure 1: Map of Pakistan Showing Walnut Production & Consumption ............................. 29
Figure 2: Description of Walnut Value Chain in the KP Midland Walnut Cluster ................. 33
Figure 3: Description of Walnut Value Chain in the GB Highland Walnut Cluster ............... 34
Figure 5: A typical walnut tree in Chitral, with a large canopy .............................................. 42

10 KNOWLEDGE FOR LIFE
LIST OF ACRONYMS ADP Annual Development Plan
AKRSP Aga Khan Rural Development Program
AQSIQ Administration of Quality Supervision, Inspection and Quarantine (of China)
CAAS Chinese Academy of Agriculture Sciences
CDF Cluster Development Fund
CGIAR Consultative Groups on International Agriculture Research
CPEC China Pakistan Economic Corridor
CO Community Organization
FFS Farmer Field School
FEG Farmer Enterprise Group
Ha Ha
GAP Good Agriculture Practices
GB Gilgit-Baltistan
GI Geographical Identification
GoP Government of Pakistan
IPPC International Plant Protection Convention
ISPMs International Standards for Phytosanitary Measures
ISO International Standard Organization
KIU Karakorum International University
Kg Kilogram
KKH Karakoram Highway
KP Khyber Pakhtunkhwa
MARC Mountain Agricultural Research Centre
MINFAL Ministry of Food, Agriculture and Livestock
NARC National Agriculture Research Council
NGOs Non-Governmental Organizations
PARC Pakistan Agriculture Research Council
PCSIR Pakistan Council for Scientific and Industrial Research
PKR Pakistani Rupee
PHDEC Pakistan Horticulture Development and Export Company

11 KNOWLEDGE FOR LIFE
R&D Research & Development
SWOT Strengths, Weaknesses, Opportunities, Threats
UAE United Arab Emirates
UK United Kingdom
USA United States of America
US$ United States Dollar
VO Village Organization

12 KNOWLEDGE FOR LIFE
EXECUTIVE SUMMARY
Global production of walnut is 3.46 million tonnes on about 1 million ha, with an average yield
of 3.1 tonnes per ha. In Pakistan, walnut is cultivated on 3.12 thousand ha producing 21.6
thousand tonnes giving an average yield of 6.9 tonnes per ha. Global trade of walnut has
reached to US$ 3.4 billion in 2019. China is the largest producer of walnuts in the world, while
USA is its biggest exporter. The global trade in walnuts has been increasing by 10% over the
last 18 years.
Walnut in Pakistan has not been progressing well during the 2000s. Although its current per
ha yield is double than the world average, but it has been on a steep declining trend at the
rate of 2.0% per annum during the 2000s period. Increase in walnut area in Pakistan has not
been sufficient to compensate the loss in production due to the declining yield, causing the
squeezing in its production at the rate of 1.0% per annum. In contrast, the walnut production
at global level has been expanding at the fast rate of over 7% per annum both due to
expansion in area and improvement in yield. Moreover, the global export of walnut in 2017
has reached to US$ 3.4 billion, Pakistan terribly failed to benefit from this fast-expanding
international walnut market.
As a result of these trends at the national and international levels, Pakistan’s competitive and
comparative position in the world market has been deteriorating since 2001. For example, the
relative position of Pakistan among walnut producing countries (considering the mainland
production only) has downgraded from 13th position in 2001 to 22nd position in 2017. Moreover,
the export of walnut from Pakistan has shrunk to almost nil and imports have skyrocketed
since 2014. As a result, Pakistan’s positive trade surplus in walnut has turned to deficit and
per capita consumption of this extremely healthy fruit has set on a declining trend in the
country. However, Pakistan has great potential to catch up on all these fronts, mainly because
of favourable agro-ecological conditions, connectivity with main walnut market like Hong Kong
through China and cheap labour costs.
Looking at the declining competitiveness of walnut and its potential of generating income
among the poor highland farmers, the Planning Commission of Pakistan initiated this study to
analyse the whole value chain of walnut, identify gaps and potentials, suggest economically
viable interventions to improve the competitiveness of the whole chain and prepare a
transformation plan for the commodity for the purpose of enhancing its competitiveness in the
domestic and international markets. Due to regional variation in its value chain, this analysis
is conducted for the major walnut growing clusters in the country. To achieve the objectives of
the study, macro data were analysed, large number of stakeholders along the value chain
were consulted and related literature were reviewed.
GB and KP are the main walnut growing regions in Pakistan. Two walnut clusters are defined
in this study: i) KP midland cluster comprising of three districts from KP (Swat, Chitral/Kalash
& Kaghan-Naran) with Swat as its central point, and ii) GB highland cluster three districts from
GB (Diamer, Gilgit & Nager). These clusters are characterized in detail in terms of socio-
economic and physical environments in which walnut is grown in each cluster. The walnut
cultivation in these clusters is largely organized on traditional lines. In GB cluster, each farmer

13 KNOWLEDGE FOR LIFE
owned 3-4 trees and organized walnut orchard doesn’t exist, while in KP walnut farmers grow
organized orchard and have relatively bigger in size. KP government has done some
pioneering work to bridge the technology gaps which can unleash huge potential that exists.
As part of this study, several performance gaps are identified in the production, processing
and trading components of the value chain specifically in the technology, market structure and
availability of inputs. These included weak research capacity especially in GB cluster, old low
productivity orchards which produces low quality and un-uniform product, lack of improved
commercial walnut cultivars suitable for the environment and meet market quality demand,
traditional management practices, lack of group action which causes market glut, and absence
of little simple processing like kernel separation and oil processing on modern lines.
In order to bridge these gaps, from production and processing to product and market
development, performance targets have been set and benchmarked on global averages for
yield, quality and export standards. Based on these parameters and keeping in view the
assessed gaps and constraints, specific interventions have been proposed for the walnut
cluster. These interventions include strengthening of research capacity, renovation of old low
density with high-density and high-yielding orchards, establishing certified nurseries,
organizing farmers into Farmers Enterprise Groups (FEGs) and introducing modern deshelling
and walnut oil processing technologies. These interventions are focused on increasing
production, productivity, increasing value-added processing, targeting premium domestic and
export markets. These are to be initiated by government and executed in collaboration with,
and participation of the private sector, farmers, traders and their groups/ associations.
This cluster development plan can be a timely and effective project to extend potential benefits
and new trade opportunities created by CPEC to the interior of the northern mountain belt.
The walnut cluster development program in the region will also be a most effective way to
promote green development. Walnut cultivation promotes agro-forestry with its many
ecological, economic and social benefits, especially relevant to the poor, fragile, remote and
marginalized mountain communities.
The estimated capital investment needed for this walnut cluster development plan is US$
33.62 million, while also requiring US$ 431 million as working capital during the 10 years’
period. About 30% of the total investment will be borne by the public sector in terms of
strengthening research system, capacity building of stakeholders along the value chain,
providing incentives to establish certified nurseries, build modern deshelling and walnut oil
extraction plants in rural areas and offering loans for these infrastructures. We believe that
with the public sector incentives, the private sector will bring the remaining 70% investment
for the development of value chain and manufacturing infrastructure.
These investments will generate far reaching impacts on rural economy in terms of generating
income and employments for all stakeholders along the value chain, promote exports and add
beauty in the mountainous areas of Pakistan. It will generate a positive Net Present Value
(NPV) of US$ 311 million in 10 years’ period with an Internal Rate of Return (IRR) of 100%.
The cluster level impact can be seen in the Cluster Summary Sheet given below. These
impacts will be generated only if the cluster approach is adopted in an integrated way.
Strengthening the walnut research to address the cluster specific issues, organizing the
14 KNOWLEDGE FOR LIFE
producers into Farmers’ Entrepreneur Groups and enhance the capacity of stakeholders to
produce and manage quality walnut will be critical for the success of the up-gradation program.

15 KNOWLEDGE FOR LIFE
Summary sheet of Walnut Cluster`
Information KP Midland GB Highland Overall
Area of the cluster (ha) 630 422 1,052
Production of the cluster (Tonnes) 6,328 2,875 9,203
Yield of the cluster (tonne/ha) 9.82 6.81 8.75
Annual yield growth without intervention (%) 0.40 0.40 0.40
Percent area renovated in 4 years 30 30 30
Area on which orchards would be renovated (ha) 189 127 316
Increase in yield due to orchards renovated (%) 30 30 30.00
Increase in production - orchards renovation (tonne) 612 278 890
Additional value - Orchards renovated (000 US$) 703.6 319.7 1,023.3
Walnut shelled (tonne) 3,552 1,614 5,166
Value of deshelled/processed walnuts in 5th year. (M. US$) 248.7 113.0 361.70
Walnut oil produced in the 5th year (tonne) 13 6 19
Value Walnut oil processed (000 US$) 332.89 151.24 484.13
Total number of deshelling units required 130 59 189
Investment for additional deshelling (000 US$) 15242.5 6917.8 22160.3
Total number of plant required 35 15 50
Investment required for oil processing (000 US$) 4270 1830 6100
Investment on strengthening research (US$) 500,000 500,000 1,000,000
Investment on capacity building trainings (US$) 38,889 26,049 64,938
Investment on renovation of existing garden (US$) 661,500 443,100 1,104,600
Investment on certified walnut nurseries (US$) 52,136 52,136 104,273
Investment on deshelling (US$) 15,223,000 6,917,750 22,140,750
Investment on oil extraction 4,270,000 1,830,000 6,100,000
Government loans on private investment 2,144,230 962,253 3,106,483
Public Investment (M. US$) 6.72 3.34 10.06
Private Investment (M. US$) 16.17 7.39
Total Investments (US$ '000) 22,890 10,731 33,621
Public sector investments 6,724 3,337 10,061.3
Total private sector investment 16,165 7,394 23,559.7
Production level investment 1,213,636 995,236 2,208,873
Processing and value addition level investment 21,637,230 9,710,003 31,347,233
Overall benefits and rate of return
Total increase in production due to all the yield increasing interventions (tonne) 612 278 890
Total operating costs in the 8th year (US$ '000) 97,898 44,502 142,400
Net cash flow (undiscounted) in 8th year (US$ '000) 147336 66972 214308
NPV (M. US$) 214.086 96.692 310.778
Internal Rate of Return (%) 182.64 143.05 165.87

16 KNOWLEDGE FOR LIFE
1. INTRODUCTION Walnuts (Juglans regia L.) belong to the family Juglandaceae. The shell of the fruit that
encloses the kernel is hard and two-halved, just like the brain. In Pakistan, walnuts are grown
mostly in the northern mountain areas, in a semi-wild crop. Very little scientific work has, so
far, gone into the development of this important fruit. Traditional varieties take 10-15 years of
gestation period and grow to become very large trees, which is why they are not grown on
cultivated land, as one walnut tree takes almost one kanal of land, where more than twenty
other fruit trees can be grown.
High summer temperatures cause damage to the fruit and may result in the shrinking of nuts.
Small damage can occur roughly at 100°F (38°C), but greater damage occurs when
temperatures greater than 108°F (42°C) persist. However, different varieties have different
levels of tolerance to high temperatures. Most walnut varieties are tolerant to extremely low
winter temperatures. When in dormancy, they can tolerate average temperatures down to -
10°C without causing serious damage.
Walnuts are a versatile fruit and a number of value-added products can be made from it,
including oil, and as an ingredient in health foods, such as breakfast muesli, shakes,
cereal/fruit bars, cakes, and ice cream. The health benefits of walnuts include increased HDL
(good) cholesterol in the body, prevention of inflammation, improvement in metabolism, weight
management and control of diabetes. Walnuts are also known to improve brain health, and
act as a mood booster.
1.1 Walnut Production in Pakistan
According to FAO statistics, the total production of walnut in mainland Pakistan was 14,171
tonnes, harvested from an area of 1,760 ha. However, these figures do not include production
from Gilgit-Baltistan (GB). When GB’s production of 7,466 tonnes, grown on 1,416 50 ha is
included, the total walnut production of Pakistan adds up to 21,637 tonnes, and Pakistan’s
ranking improves from the 18th to the 13th. The total area devoted to walnut growing in Pakistan
is, thus, about 3,122 ha. The average yield in Pakistan is calculated as 7 tonnes/ha (Table 1)
Table 1: Major Walnut Producing Provinces in Pakistan
Sr. Province Production (tonne)
Production Share (%)
Area (ha) Area share (%)
Yield (tonne/ha)
1 KP 12,656 60 1,500 48 8.44
2 Gilgit-Baltistan 7,466 35 1,416 45 5.27
3 Other (AJK and Balochistan)
1,515 5 206 7 7.35
TOTAL 21,637 100 3,122 100 6.93
The reported yield (tonne/ha) is difficult to calculate as walnut cultivation is widely dispersed and inter-cropped with other fruit trees.
MNFS&R (2017); GGB (2016)

17 KNOWLEDGE FOR LIFE
The largest producer of walnuts is KP province, especially the northern mountain districts,
including Swat, Chitral and Kaghan-Naran, with a 60% share in total production in 2016,
followed by GB, with a share of 35%.1 The remaining 5% is produced in other parts of Pakistan,
especially in northern Balochistan and AJK. The per ha yield of walnut is highest in KP followed
by in other provinces mainly Balochistan. It is lowest in GB.
Most of the walnut trees grown in Pakistan are traditional varieties that are valued both as a
nut/fruit tree, and as a forest trees, used for high quality timber. Traditionally, tree bark is also
used as a teeth cleanser. Yields vary widely, and the averages used here are best estimates.
Walnuts play a key role in the rural economy of remote and marginalized areas. There is
literally very little cost associated with growing walnuts for these farmers, and its benefits (nuts
and timber) are taken as a windfall by farmers. The benefits include a long self-life, virtually
no input costs, including labour and management, and the low opportunity cost of the marginal
land, where walnuts are grown as a semi-wild crop. In addition, farmers use walnuts as a
nutritional supplement to augment their otherwise poor-quality diet, especially during winters,
and small quantities are exchanged for cash to meet other household needs.
Walnuts have remained a neglected commodity for the national research systems, but they
offer significant potential for rural development and poverty reduction in Pakistan, especially
for improving income and employment in the poorer mountain areas of the north.
The trends in walnut production in Pakistan depict a stagnant and declining picture, despite
its potential, as seen in Table 2. At the country level, while there has been an increasing trend
in area under walnut during 2001-16, the per ha yield of walnut experienced a strong negative
trend at the rate of over 1.0% per annum which has set a declining production trend during
the period (Table 2).
Although, per ha yield of walnut experienced declining trends both in KP an GB during 2001-
16, but most of the decline came from KP. On the other hand, there has been a strong positive
trend in area under walnut in GB, while it remained almost stagnant in KP. As a result,
production of walnut declined strongly in KP, while it has moderately positive trend in GB
(Table 2).
1 It is difficult to resolve an apparent discrepancy in the available data that shows almost double the
number of trees in GB than in KP, while the production in KP is almost twice that of GB. This could be
explained, at least partially, by the fact that the figures reported for mainland Pakistan/KP are difficult
to separate from quantities coming from Afghanistan and Iran, because of informal cross-border trade
[https://www.bicc.de/uploads/tx_bicctools/bicc_workPaper_04_2017.pdf].

18 KNOWLEDGE FOR LIFE
Table 2: Long Term Production Trends by Main Walnut Growing Provinces, 2016
Year Gilgit-Baltistan KP+ other Pakistan
Area Prod. Yield Area Prod. Yield Area Prod. Yield
(ha) (tonnes) (tonne/ha) (ha) (tonnes) (tonne/ha) (ha) (tonnes) (tonne/ha)
2001 1,137 6,294 5.54 1,849 19,584 10.59 2,986 25,878 8.67
2002 1,109 6,326 5.70 1,331 13,811 10.38 2,440 20,137 8.25
2003 1,082 6,358 5.88 1,346 13,954 10.37 2,428 20,312 8.37
2004 1,110 6,390 5.76 1,335 13,319 9.98 2,445 19,709 8.06
2005 1,138 6,422 5.64 1,455 14,867 10.22 2,593 21,289 8.21
2006 1,167 6,587 5.64 1,497 14,867 9.93 2,664 21,454 8.05
2007 1,197 6,620 5.53 1,292 15,195 11.76 2,489 21,815 8.76
2008 1,241 6,789 5.47 1,297 12,722 9.81 2,538 19,511 7.69
2009 1,210 6,964 5.75 1,240 12,748 10.28 2,450 19,712 8.04
2010 1,241 6,984 5.63 1,183 10,838 9.16 2,424 17,822 7.35
2011 1,273 7,164 5.63 1,225 10,306 8.41 2,498 17,470 6.99
2012 1,306 7,185 5.50 1,214 10,640 8.76 2,520 17,825 7.07
2013 1,339 7,207 5.38 1,241 9,926 8.00 2,580 17,133 6.64
2014 1,374 7,243 5.27 1,686 10,094 5.99 3,060 17,337 5.67
2015 1,409 7,429 5.27 1,686 14,831 8.80 3,095 22,260 7.19
2016 1,416 7,466 5.27 1,706 14,171 8.31 3,122 21,637 6.93
Averages
(%) 1.79 1.26 -0.54 0.16 -2.25 -2.42 0.90 -1.07 -1.97
Source: The data for Pakistan was taken from FAOSTATS (www.factfish.com/statistic-
country/pakistan/walnuts,+production+quantity); which doesn’t include GB data. Data for KP is obtained from http://www.factfish.com/statistic-country/pakistan/walnuts,+production+quantity. Figures for GB were interpolated from http://www.factfish.com/statistic-country/pakistan/walnuts,+production+quantity.
Partly due to the shrink in domestic production and partly because of the poor international
trade policies and links, the export of walnut after reaching 814 tonnes worth of US$1.3 million
in 2007 has dropped to almost nil in 2017. On the other hand, its imports has skyrocketed from
almost nil until 2013 to 1.7 thousand tonnes worth of US$4.0 million in 2017. This has not only
wiped out all the surplus in walnut trade but created a deficit of about US$4.0 million in 2017
(Table 3). This is a serious situation for not only foreign exchange earnings, but also the poor
people growing walnut in high land marginal areas of Pakistan.
However, increase in walnut imports are not sufficient to substitute the reduced production in
the country. It could merely substitute less than 20% of the total reduced production since
2001 thus causing a decline in per capita consumption of walnut in the country.
.

19 KNOWLEDGE FOR LIFE
Table 3: Trends in walnut trade from Pakistan during 2001-17
Year Exports Imports Trade surplus
Quantity Value Quantity Value Quantity Value
(tonnes) (000 US$ (tonnes) (000 US$ (tonnes) (000 US$
2001 110 102 79 14 31 88
2002 272 192 94 18 178 174
2003 166 161 42 8 124 153
2004 535 449 50 19 485 430
2005 397 401 16 3 381 398
2006 125 197 18 6 107 191
2007 814 1329 25 9 789 1320
2008 322 496 3 1 319 495
2009 295 582 1 1 294 581
2010 535 991 3 6 532 985
2011 36 96 5 11 31 85
2012 131 306 11 24 120 282
2013 153 393 2 7 151 386
2014 169 464 14 41 155 423
2015 50 147 48 153 2 -6
2016 33 99 516 1213 -483 -1114
2017 7 23 1699 4002 -1692 -3979
Source: Food and Agriculture Organization: Trade, Crops and Livestock Products: http://www.fao.org/faostat/en/#data/TP
1.2 Global Context
Global walnut production in 2016 was at 3.45 million tonnes, planted on an estimated area of
1 million ha. This translates into an average yield of 3.46 tonnes per ha. Pakistan’s share in
global walnut area and production is around 0.3% and 0.6%, respectively. During 2016-17,
Pakistan got almost double the per ha walnut yield than the world average. While the world
trade 16%, Pakistan could trade only less 0.01% of its production internationally. Farm gate
price of walnuts in Pakistan is far below the international average, which shows that Pakistan
has a competitive edge at the production level.
Despite this advantage, however, Pakistan’s share in the world walnut export is negligible.
Whatever little quantity Pakistan exports, the export price of Pakistani walnut is only 56% of
the world average (Table 4).
20 KNOWLEDGE FOR LIFE
Table 4: Comparison of World vs. Pakistani Walnut Sector (2016)
Parameter World Pakistan* Share (%)
Area under walnut (000 ha) 999.0 3.12 0.31
Production (000) tonne 3,458 21.64 0.63
Yield (tonne/ha) 3.46 6.93 200.3
Value of production at farm level (Only mainland) (million US$) 15,650 20 0.128
Farm gate price (US$/tonne) 4,525 1,150 25.40
Volume of trade (000) tonne 607 0.01 0.001
Value of international trade (US$ m) 3412 0.023 0.001
Export quantity as % of production (t) 16% 0.1% -
Export value as % of production value (US$ m) 24% 0.1% -
Average export prices (US$/tonne) 5620 3286 58.46
Source: FAOSTAT: Production, Crops: http://www.fao.org/faostat/en/#data/QC
FAOSTAT: Trade, Crops and Livestock Products: http://www.fao.org/faostat/en/#data/TP
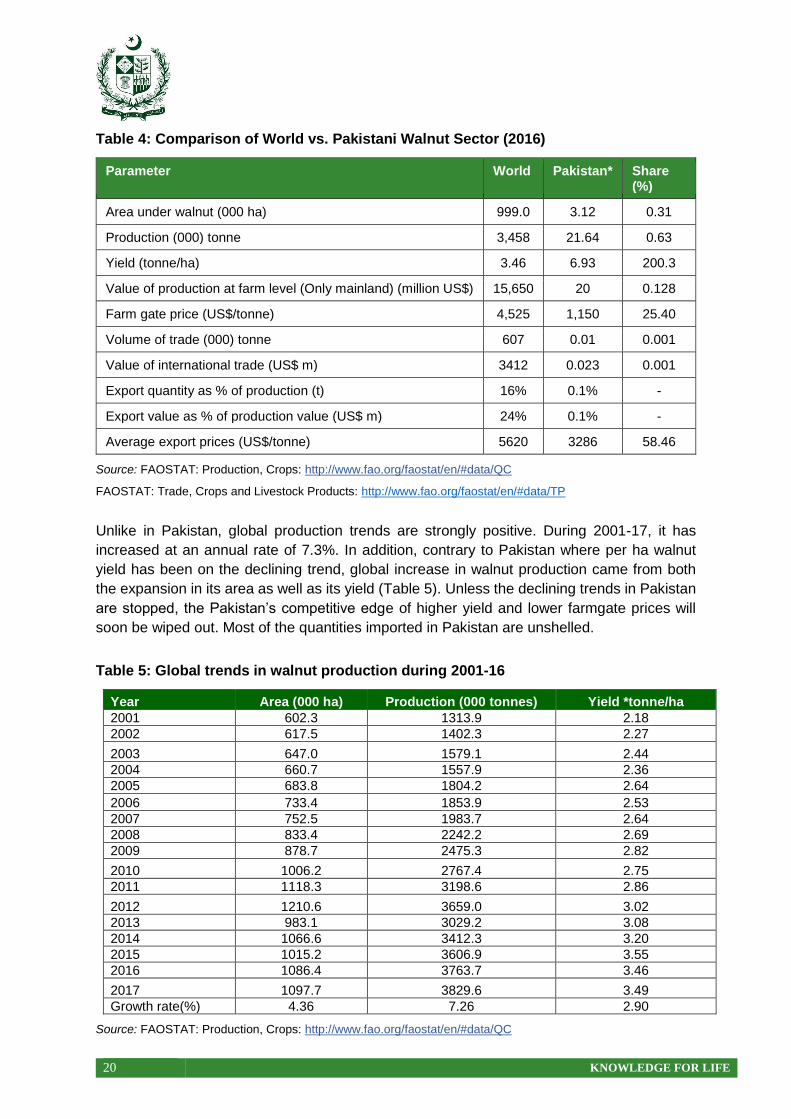
Unlike in Pakistan, global production trends are strongly positive. During 2001-17, it has
increased at an annual rate of 7.3%. In addition, contrary to Pakistan where per ha walnut
yield has been on the declining trend, global increase in walnut production came from both
the expansion in its area as well as its yield (Table 5). Unless the declining trends in Pakistan
are stopped, the Pakistan’s competitive edge of higher yield and lower farmgate prices will
soon be wiped out. Most of the quantities imported in Pakistan are unshelled.
Table 5: Global trends in walnut production during 2001-16
Year Area (000 ha) Production (000 tonnes) Yield *tonne/ha
2001 602.3 1313.9 2.18
2002 617.5 1402.3 2.27
2003 647.0 1579.1 2.44
2004 660.7 1557.9 2.36
2005 683.8 1804.2 2.64
2006 733.4 1853.9 2.53
2007 752.5 1983.7 2.64
2008 833.4 2242.2 2.69
2009 878.7 2475.3 2.82
2010 1006.2 2767.4 2.75
2011 1118.3 3198.6 2.86
2012 1210.6 3659.0 3.02
2013 983.1 3029.2 3.08
2014 1066.6 3412.3 3.20
2015 1015.2 3606.9 3.55
2016 1086.4 3763.7 3.46
2017 1097.7 3829.6 3.49
Growth rate(%) 4.36 7.26 2.90
Source: FAOSTAT: Production, Crops: http://www.fao.org/faostat/en/#data/QC

21 KNOWLEDGE FOR LIFE
Because of the increasing trends at the global level, per capita availability of walnut for
consumption is expected to increase internationally, while in Pakistan as noted earlier it has
decreased due to its declining production trend and not much increase in its import.
The global exports of walnut (both shelled and unshelled) has increased from 171 thousand
tonnes in 2001 tonnes to 607 thousand tonnes in 2017 with an average growth rate of 8.0%
per annum, while the value of walnut export has increased from US$0.4 billion to US$3.4
billion during the period thus producing an average growth rate of 14% per annum (Table 6).
The growth in walnut export quantities are higher than that in production, suggesting t is slowly
becoming an international commercial commodity that is increasingly being consumed
somewhere else than where it is produced.
It is worth noting that export rates in shelled and unshelled walnut, both in quantities and
values, are similar indicating a similar preference for both the products in international market
(Table 6).
Table 6: Global export trends of walnut by type during 2001-17
Year
Shelled Unshelled Total
Quantity Value Quantity Value Quantity Value
(000
tonne) (Million US$)
(000
tonne) (Million US$)
(000
tonne) (Million US$)
2001 75.5 258.7 95.6 165.6 171.1 424.3
2002 91.8 291.2 103.2 171.1 195.0 462.3
2003 96.5 345.1 107.7 190.8 204.2 535.9
2004 118.7 428.7 129.2 257.2 247.9 685.9
2005 137.7 552.1 129.0 278.0 266.7 830.1
2006 147.1 719.2 127.2 290.9 274.2 1010.1
2007 154.3 852.3 139.1 337.6 293.5 1189.9
2008 156.7 900.0 128.1 369.5 284.8 1269.5
2009 176.2 833.6 235.6 612.7 411.8 1446.3
2010 191.4 1062.6 214.3 670.7 405.7 1733.2
2011 186.8 1418.2 244.8 889.5 431.7 2307.7
2012 194.6 1567.0 258.6 894.0 453.2 2461.1
2013 196.7 1619.7 298.1 1148.7 494.8 2768.4
2014 219.6 2021.0 266.2 1149.2 485.8 3170.2
2015 267.2 2149.1 283.1 1033.6 550.3 3182.8
2016 271.4 1760.1 364.2 1214.3 635.6 2974.4
2017 291.9 2260.4 315.3 1152.0 607.2 3412.4
Growth
rate (%) 7.5 13.8 8.6 14.3 8.0 14.0
FAOSTAT: Trade, Crops and Livestock Products: http://www.fao.org/faostat/en/#data/TP
With an estimated 1.785 million tonnes’ production in 2016, China remained the top producer
of walnuts in the world, followed by United States of America and Iran (Table 7). Romania,
Uzbekistan and Ukraine produce highest per ha yield in the world. Pakistan can learn about
the modern walnut orchard management techniques from the Central Asian countries through
CPEC collaborative program across the region.

22 KNOWLEDGE FOR LIFE
Table 7: Top Walnut Producing Countries of the World
Rank Country Area (000 ha) Production (000 tonnes) Yield
(tonne/ha)
1. China 487.0 1785.9 3.67
2. United States 127.5 607.8 4.77
3. Iran 153.6 405.3 2.64
4. Turkey 86.9 195.0 2.25
5. Mexico 83.5 141.8 1.69
6. Ukraine 13.2 108.0 8.18
7. Chile 31.0 73.5 2.37
8. Uzbekistan 5.6 53.1 9.44
9. France 20.3 39.4 1.94
10. Romania 1.7 34.1 20.38
Source: FAOSTAT: Production, Crops: http://www.fao.org/faostat/en/#data/QC
The USA accounts for the highest dollar worth of exported walnuts during 2017 with shipments
of roughly 40% of the global total followed by Mexico and Chile (Table 8).
Table 8: Top Walnut Exporting Countries of the World
Rank Country Export (000 US$) % share
1 United States 1,400 40.3
2 Mexico 587 17.3
3 Chile 463 13.6
4 France 143 4.2
5 Germany 114 3.4
6 China 106 3.1
Source: FAOSTAT, Trade, Crop and Livestock Products, http://www.fao.org/faostat/en/#data/TP
In 2017, Italy remained the top walnut importing country, in dollar value, which imported US$
143 million worth of walnuts, followed by Turkey (Table 9). At least some of these imports
were likely for value added re-exports. Pakistan should explore China and UAE markets for
its walnut export which also have a reasonable walnut imports.
Table 9: Top Walnut Importing Countries of the World in terms of US$ Value
Rank Country Import (000 US$) % share
1 Italy 143,058 19.9
2 Turkey 139,396 19.4
3 Viet Nam 119,220 16.6
4 Mexico 115,908 16.1
5 Germany 43,919 6.1
6 China (Hong Kong SAR) 42,386 5.9
7 Spain 42,266 5.8
8 United Arab Emirates 27,704 3.8
Source: FAOSTAT, Trade, Crop and Livestock Products, http://www.fao.org/faostat/en/#data/TP

23 KNOWLEDGE FOR LIFE
1.3 Need of the Study
From the above macro analysis of the walnut sector at the national and international level, it
can be concluded that walnut in Pakistan is in serious trouble. Although its current per ha yield
is double than the world average, but it has been on a steep declining trend at 2.0% per annum
rate during the 2000s period. Increase in walnut area in Pakistan has not been sufficient to
compensate the loss in production due to the declining yield, causing the squeezing in its
production at a rate of 1.0% per annum. In contrast, the walnut production at global level has
been expanding at the fast rate of over 7% per annum. The global export of walnut in 2017
has reached to US$3.4 billion which has been growing at a rate of 8.0% per annum during
2001-17. Pakistan terribly failed to benefit from the fast expanding international walnut market.
As a result of these trends at the national and international levels, Pakistan’s competitive and
comparative position in the world market has been deteriorating since 2001. For example, the
relative position of Pakistan among walnut producing countries (considering the mainland
production only) has downgraded from 13th position in 2001 to 22nd position in 2017. Moreover,
the export of walnut from Pakistan has shrunk to almost nit and imports has skyrocketed
especially since 2014. As a result, Pakistan’s positive trade surplus in walnut has turned to
trade deficit since 2014 and per capita consumption of this extremely healthy fruit has set on
a declining trend in the country.
In this scenario, the Planning Commission of Pakistan initiated this study to analyse the whole
value chain of walnut, identify gaps and potentials along the chain, and suggest economically
viable interventions to improve the competitiveness of the whole chain. Due to regional
variation in its value chain, this analysis is conducted for the major walnut growing cluster in
the country.

24 KNOWLEDGE FOR LIFE
2. GOAL AND PURPOSE The overall goal of this study is to contribute to the Cluster Development Based Agriculture
Transformation Plan -V2025. The main purpose of the study is to develop a research-based
cluster development plan for the walnut sector. Specific objectives of the study include:
Specific objectives of the study are to:
1. Identify the major clusters of walnut production in Pakistan
2. Characterize and conduct SWOT analysis for the cluster
3. Identify technical and investment gaps in the cluster
4. Assess potential for increased production and value-added processing for trade
5. Suggest investment strategies to reach the assessed potential
6. Conduct economic and social feasibility of the suggested intervention

25 KNOWLEDGE FOR LIFE
3. METHODOLOGY The data and information related to the characteristics, gap, potential and needed
interventions to meet the gaps in walnut clusters were collected from three sources:
a) Macro-data. Relevant macro data were collected from various published and
unpublished reports of government and non-governmental organizations and internet
search on walnut value chain (see Annexure 1, for the macro data sources)
b) Stakeholders Consultations. Primary information was collected through meetings and
consultations, key informant interviews, surveys and focus group discussions using
structured tools and open-ended questionnaires (see Annexure 2 for the list of
stakeholders consulted).
c) Literature Review. The literature related to the functioning, gaps, and interventions in
walnut value chain was reviewed and synthesized (see Annexure 3).
d) The following generic parameters and indicators were used in collecting the data:
Global context of the walnut sector
Production potential and review of walnut sector
Cost of production, harvesting, post-harvest processing of walnut, from producers and
producer groups
Marketing, trading, and processing from traders, wholesalers, retailers, and processors
Issues and constraints relating to production, processing, and trading from all
stakeholders
Benchmarks, synthesis and recommendations, based on the analysis of the
quantitative and qualitative data, using global parameters
The author used these data to first identify major walnut producing regions in the country and,
based on this information, proceeded to identify, characterize and select one or more clusters
for upgradation and development. The next steps included undertaking a SWOT analysis,
describing strengths, weaknesses, opportunities, and threats in the selected cluster/s, as well
as documenting value chain functions and quantifying the cluster potential. Based on these
analyses, specific interventions were proposed for bringing about improvements in each
cluster. The costs and benefits of each intervention are estimated to finally work out the
Internal Rate of Return (IRR) of the whole package. A Walnut Transformation Plan is also
formulated, which identifies sustainable cluster upgrading strategies for the development of
the sector that can help create significant economic opportunities for producers, processors
and all the other stakeholders participating at different points of the value chain.

26 KNOWLEDGE FOR LIFE
4. LITERATURE RIVEW Walnut species are important sources of nuts and timber in the temperate zones across the
world. Walnuts are grown in the northern Pakistan since time immemorial and are one of the
most important nut crops grown in these mountain areas (Abassi, Nadeem and Saleem, et el.)
Most walnut genotypes are heterogamous, either protoandrous (male flowers mature first) or
protogynous (female flowers mature first) and this dichogamy encourages cross pollination
necessitating wind pollination and bloom overlap for good production. Walnut is extremely
sensitive to site conditions and should only be planted on the most suitable frost free, fertile,
well drained and deeply rootable sites (Rahaman, et al., 2009).
In Pakistan almost 226 indigenous walnut varieties are grown in the northern districts of KP,
including Malakand division (districts of Swat, Dir, Bunir, Chitral, Shangla and Malakand),
Kaghan (district Mansehra); in Gilgit-Baltistan (districts of Diamer, Astore, Khaplu, Shigar,
Skardu, Gilgit, Nagar, Hunza and Ghizer, and in the districts of Leepa in Neelum valley and
Muffazarabad in Azad Jammu & Kashmir (Khattak, et. al. 2000).
In its natural habitat in the north, walnut is cultivated in most villages, and it also occurs in the
wild. Wild trees of walnut are found commonly in mixed deciduous and coniferous forests at
altitude ranging from 1,550 m to 3,000 m. The wild walnuts are found in the Kaghan-Naran
Valley, Ayubia National Park, Swat, (especially the region of Kalam and up the tributaries of
the Swat River beyond Kalam, i.e., along the roads to Ushu and to Utror), and Diamer (Ahad,
et al, 1998).
Walnut has high nutritional value. It is rich in proteins (14-24%), fats (52-70%) and vitamins,
especially vitamins B group and E, while in minerals; K and Mg are worth mentioning
Muhammad Ali, Aminullah, et. al., (2010). Important amino acids are glutamic acid, arginine
and leucine. Walnut contains Taurine (2- aminoethylsulfonic acid), an organic acid, that is
involved in many functions, such as homeostatic regulation, thermoregulation, nervous
conduction and protection against oxidative stress in human beings (Cannella and Dernini,
2005). Walnut consists of mostly omega-3 and omega-6 polyunsaturated fatty acids, which
are essential dietary fatty acids and helps in the prevention of coronary heart diseases
(Piccirillo et al., 2005). Nut consumption is also associated with a protective effect against
coronary heart disease, partly due to its high antioxidant content (Davis, et al.,2007).
The walnut wood is regarded to be as one of the most valuable woods in the world for high
grade furniture and joinery and the bark has been used for teeth cleaning and curing gum
diseases. The walnut has traditionally been propagated by seed. Thus, the resultant plants
have marked diversity in nuts size, shape, shell thickness and colour, quality and colour of
kernel and in other morphological attributes (Rahaman, et al.; 2009).
There are no regular orchards of walnut in Gilgit-Baltistan areas. However, Individual walnut
trees are grown along boundaries of fields, channels, and backyards, etc. Significant numbers
of trees are grown on marginal lands in diffused plantations and thus, do not compete with
‘terraced’ farmland. Walnuts are a source of critical nutrition and income for people living in

27 KNOWLEDGE FOR LIFE
the remote and marginalized mountain areas, often cut off from road access and other
services.
The production of walnut is declining overtime (Khan, et al., 2017). Therefore, training of
scientific manpower, breeding of high yielding cultivars, and dissemination of cultural practices
to farming communities is important in order to enhance production area and yield (Khan,
2010).
Mostly, seedlings are locally grown, however some exotic cultivars have also been tried from
time to time at research stations such as `Chandler’, ‘Hartley’, ‘Lam’, `Germisara’, lupanesti’,
`Valerie,‘Odum’, ‘Sere and `Sulemani’ and many local selections like `MS-1′, `MS-2′, ‘MS-18′
from Malakand, `SW1′, `SW-3′ from Swat, `Dir-2′ and ‘Chitral-I’, `Chitral-2′, `Chitral-3′,
`Kurram-1′,‘Kurram-2′, ‘Kurram-3′, ‘Kurram-4′ (Khattak, et al. 2000)

28 KNOWLEDGE FOR LIFE
5. Cluster Identification and Characteristics
5.1 Identification of Walnut
As reported in the introduction of this report, KP and GB are the two main walnut growing
regions. The main walnut production centres are Malakand Division in KP and Diamer and
Gilgit divisions in GB. Following two clusters are identified for detail analysis in this study:
1. KP Midland Cluster: This cluster consists of mainly Malakand division which includes
Swat, parts of the Kaghan valley, and Chitral (Kalash) all having climate ideal for growing
walnuts. Swat is the focal point of the cluster with 50% of the total cluster production from
the district. The average yield of the cluster is nearly 8.44/ha in KP (Table 10).
Table 10: Walnut Production in Khyber Pakhtunkhwa
Sr. District/Location Area (Ha) Production
(tonnes)
Yield
(tonne/ha)
Production
Share %
1 Swat 630 6,328 10.04 50
2 Naran- Kaghan 375 2,911 7.76 23
3 Chitral (Kalash) 240 2,152 8.96 17
Total KP Midland cluster 1245 11391 9.10 90
4 Other non-cluster Districts 255 1,265 4.9 10
Total 1,500 12,656 8.44 100
Source: Ministry of National Food Security and Research http://www.mnfsr.gov.pk/pubDetails.aspx
2. GB Highland Cluster: This cluster includes the whole Gilgit-Baltistan that produces 7,466
tonnes with a production share of 35% walnut in the country. This cluster includes Diamer,
Nagar and Gilgit, with Nagar being its focal point (Table 11), although other districts have
untapped potential for growing walnuts.
Table 11: Walnut Production in Gilgit-Baltistan Highland Cluster
Sr. District/Location Area (ha) Production
(tonnes)
Yield
(tonne/ha) Production Share %
1 Diamer 422 2,875 6.81 38.56
2 Nagar 130 1,034 7.98 13.8
3 Gilgit 90 971 10.79 13.0
Total GB Highland
Cluster 642 4880 7.6 65.4
4 Hunza 53 137 2.60 1.83
5 Ghizer 160 542 3.38 7.26
6 Skardu 76 342 4.50 4.58
7 Shigar 91 355 3.89 4.75
8 Kharmang 225 309 1.37 4.14
8 Ghanche 103 494 4.82 6.62

29 KNOWLEDGE FOR LIFE
9 Astore 66 407 6.14 5.45
Non-cluster districts 774 2586 3.3 34.63
TOTAL GB 1,416 7,466 5.22 100.00
Source: GB Agriculture/Horticulture Data; National Agriculture Research Council (NARC)
More than 99% of the walnuts produced in the country are consumed in the domestic market.
The largest domestic consumption center is Karachi, followed by Lahore, Faisalabad,
Rawalpindi and Islamabad. As a dried fruit product, walnuts produced in Pakistan as well as
coming from Afghanistan and Iran are supplied and sold all over the country (Figure 1).
Figure 1: Map of Pakistan Showing Walnut Production & Consumption
5.2 Comparisons of Cluster
Characteristics
The entire mountain belt of both the cluster is: a) physically and culturally linked, b) has very
similar agro-ecological conditions, c) is connected to the CPEC/ KKH and, d) can benefit from
focused research and development. Hence most of the characteristics are similar with each
other. However, some differences exist which are explained in Table 12.
Being at higher latitude, the GB highland cluster have relatively cooler temperature during
summer and sever winter with higher rainfall as compared in GB midland cluster. Both clusters
have good quality underground water. Walnut growing farmers are relatively bigger and have
proper orchard in KP cluster compared to in GB cluster. The majority of households in the GB
highland mountain valleys own two to four tree each, which plays an important role in their
annual cash flows. A mature tree can produce from 70 kg to 200 kg, and earn the households
PKR 25,000 to PKR 55,000 per annum.

30 KNOWLEDGE FOR LIFE
Table 12: Characteristics of the Walnut Cluster
Salient Features KP Midland Cluster GB Highland Cluster
Product Walnut Walnut
Cluster districts Swat, Chitral, Kaghan-Naran Diamer, Nagar and Gilgit
Area of the cluster (ha)
1,245 642
Production of the cluster (tonnes)
11,391 4880
Average yield of the cluster (Kg/Tree)
9.1 7.6
Percentage of the crop area that lies in the cluster (Walnut area of the cluster/Walnut area in the province)
90% 65%
Percentage of the total cropped area in the cluster (Walnut area in the cluster/total cropped area in the cluster)
10% 7%
Focal point of the cluster
Swat Diamer
Cluster point area (ha)
630 422
Cluster point production (tonne)
6328 2,875
Cluster point yield 10.0 6.8
Cluster point area as a percentage of total cluster area
50% 66%
Geographical and Environmental Factors
Soil type: Sandy loam Soil type: Sandy Loam
Climate Zone: Warm and temperate Steppe and mountainous valleys; temperate
The height of Swat varies from 2500 ft. to 7500 ft., and lies in a colder zone. January is the coldest month of the year when temperature remains 2°C to -2°C. Hottest month is July with an average temperature of 32°C.
Mid-latitude steppe / semi-arid cool climate. Walnut cultivation ranges at altitudes 2500 ft to 8500 ft.
Snow melt/spring water; river water Access to snow-melt/glacial water through water channels/ducts
Good quality surface and ground water
Good quality surface water
Average rainfall is 200 mm to 500 mm per annum
Average snow/rainfall 50 to 150 (2000 mm snow on mountains)
Temperature rises up to 32 °C during summer but drops to -2°C on average during winter
Average temperature rises up to 35 °C during summer but drops to -5°C on average during winter

31 KNOWLEDGE FOR LIFE
Walnut Growers Small to medium land holding size (1 to 10 acres) on average
Small land holding size (<=1 acres) on average
One of main crops grown in Kalash valley Chitral; and one of main sources of income for fruit growers in Swat valley
Two walnut trees owned by average household
The walnut trees are found in large numbers in Maydan, Bahrain, Kalam, Sakhra, Gwalerai, Shawar valleys of Tehsil Matta, Malam Jabba valley Miandam, Fatehpur and Shin areas of Swat; and Bumboret, Brir, Brep areas of Kalash valley
Bogrote in Giglit district, Chalt and Sumair in Nagar district; and Darell and Tangeer in Diamer district are the major producers of walnut in GB
No formal Walnut Growers Association exists in the province
Farmers Enterprise Groups are functional across the region, though no separate Walnut Growers Association
Labor is provided by growing households themselves at the time of harvest
Labor is provided by households themselves at the time of harvest
Product Features Two important Walnut products are Walnut kernels and Walnut Oil. Good quality timber is used for making furniture, when trees are old and cut down
Two important Walnut products are Walnut kernels and Walnut Oil. Good quality timber is used for making furniture, when trees are old and cut down
A lot of work has been done in Swat on improving the walnut production by introducing newer varieties
No rigorous effort is made to improve walnut production practices.
Variety Features Walnut trees found in Swat valley are local. A number of new varieties including Pecan and seeded walnut have introduced in Swat valley. Some nuts are round and smaller in size and some are bigger oval shaped. The nuts have a pungent smell and strong taste
Walnut trees found in GB are all local to the regions that have a hard shell. Data on varieties is not available. Some nuts are round and smaller in size and some are bigger oval shaped. The nuts have a pungent smell and strong taste
Walnut is a high tolerance plant that sustains the temperatures ranging from -2°C to 38°C. Thus, it can be grown in wide-ranging areas in Swat valley.
Walnut is a high tolerance plant that sustains the temperatures ranging from -2°C to 38°C. Sometime when temperature falls below -10oC can have damaging effect on walnut tree.
Mature Fruit: Hard shell with yellow brownish kernel
Mature Fruit: Hard shell with yellow brownish kernel
Nursery and Planting In Swat, walnut grows in wild by seed dispersal mechanism and support by recent interventions to introduce new varieties of walnut
In GB, walnut grows in wild by seed dispersal mechanism since ancient times and concept of grafting and budding is very rare
Most walnut plants are found on marginal lands. Walnut varieties from government and private nurseries are few.
Most walnut plants are found on marginal lands. Walnut varieties from government and private nurseries are unavailable
Random and dispersed plantation. Gestation period in local verities is 10-14 years, while in improved varieties it is 5-7 years
Random and dispersed plantation or marginal lands. Gestation period in local varieties is 14-17 years, while in improved varieties it can be 5-7 years.

32 KNOWLEDGE FOR LIFE
Average number of plants in one acre = 300
Average number of plants in one acre = 200
Inputs/Management Practices
No fertilizers are used for walnut trees. Local varieties are too big in size, taking too much land per tree
No fertilizers are used for walnut trees. Local varieties are too big in size, taking too much land per tree
No pesticides are used for growing walnut in GB
No pesticides are used for growing walnut in GB
Farmers don't use inputs in any significant manner
Farmers don't use inputs in any significant manner
The major irrigation method used is flooding
The major irrigation method used is flooding
Intercropping with other fruit plants and fodder crops (such as alfalfa and grass) is a normal practice
Intercropping with other fruit plants and fodder crops (such as alfalfa and grass) is a normal practice
Walnut trees are seldom pruned, certified or planted in orchards
Walnut trees are seldom pruned, certified, or planted in orchards
5.3 Description of Value Chain
5.3.1. KP Midland Cluster
The walnut tree and its fruit/nuts are important sources of revenue and strengthening the local
economy. Walnut cultivation is oriented towards newer varieties in KP, which the farmers
consider as more valuable than the traditional cultivars. The quality of these varieties is
excellent with higher yields. Walnuts are certainly one of the most promising fruit species with
the high future potential for development due to farmers’ familiarity with their cultivation
through centuries of cultivation, genetic diversity, adaptability, long shelf life, health benefits,
and high demand and value in the market.
In the midland KP cluster, walnut cultivation has great scope for both horizontal and vertical
growth, and to ensure a good and reliable source of income for the local farmers, especially
those who live in remote and inaccessible villages. The walnut produced in the area is mostly
sold in local market with some exports to the down-country.
Almost 50% of marketable walnuts produced is sold with shell, the rest is deshelled to be sold
across the country. The scope for horizontal expansion of the walnut value chain exists with
additional marginal lands available for the walnut plantation in both the clusters.
The scope for vertical expansion of the value exists through value addition and specialization
in walnut products. A number of value-added products can be made from walnut, including
cakes, pastries, walnut milk, walnut oil and others. Whereas, the production of walnut value
chain needs to be expanded, at processing level, efforts for exports are also needed.
Use of modern technology, even to de-shell the walnuts, is very low. Enhancing value adding
services in the walnut sector can generate high economic returns in comparison to the existing
frame conditions.

33 KNOWLEDGE FOR LIFE
Figure 2: Description of Walnut Value Chain in the KP Midland Walnut Cluster
5.3.2. GB Highland Cluster
The GB Highland Walnut cluster has significant potential, in terms of increased production,
productivity and value through vertical horizontal expansion. Here, the growing of walnut is
oriented towards more traditional varieties grown in mixed gardens. Most of the walnut trees
in GB are of large sizes and take more land per tree, which is already scarce. They also take
up to 15 years of gestation period, which is too long. The traditional varieties also vary in
quality, yields and uniformity, features that are not suited for commercial production.
These traditional varieties are needed to be replaced by the small dwarf varieties that have a
smaller size and give a reasonably good production, and also mature much earlier, 5-6 years.
Thus, there is a huge scope for increasing the value-added aspects of the product through
improved varieties, processing and marketing practices.
In GB, the area is highly mountainous and cultivable land is scarce. The scope for horizontal
expansion of the value chain exists if additional marginal land can be irrigated. Due to its
characteristics, walnut is a suitable plant to grow in the additional marginal lands across GB.
Glacial and snow melt irrigation water is widely available in the region that can be lifted
vertically upward to the rangeland (which is more than 50% of land in GB) to bring additional
land under cultivation, subject to availability of sufficient power/energy.
Most of the walnuts produced in the region are sold in the local markets, although some of the
produce is sold in down country markets, especially during the winter season. Low volumes,
quality and uniformity are the main issues in marketing. At smaller scale, several walnut
products, such as Hunza walnut and walnut oil, are made by local entrepreneurs, which needs
to be scaled-up. Exports are another good option, after enhancing quality and uniformity.

34 KNOWLEDGE FOR LIFE
Figure 3: Description of Walnut Value Chain in the GB Highland Walnut Cluster
5.4 SWOT Analysis
5.4.1 Overview
The SWOT analysis was carried out in focus group discussions conducted in both the clusters
with the different stakeholders of the walnut value chain. As strengths and weaknesses are
similar across clusters, we have combined SWOT analysis for both the clusters. The results
are summarized and organized around the value chain functions, including inputs, production,
storage, and marketing. Strengths and opportunities are coupled together; likewise,
weaknesses and threats are combined in the following discussion.
5.4.2 SWOT Analysis
Both the clusters have many strengths and opportunities, including a natural comparative
advantage with respect to agroecological conditions — water, climate, homogenous farming
communities, and proximity to China. Major weaknesses are poor planning, and policy and
priority neglect and inadequate investment in research, technology development/breeding,
extension, marketing, etc. More weaknesses include poor infrastructure for storage,
processing, transportation and weak institutions, especially with regard to regulation, research
and extension services, absence of regulatory measures for quality control of inputs, non-
transparent practices in local market systems, and high cost of transportation and unreliable
supply. Threats are represented by climate change, landslides that cause road blocks for days
and even weeks. These factors generally hold back investment into the value chain, inhibiting
its development (Table 13).
Walnut cultivation is one of the oldest farming practices in these mountain valleys, but the
production was essentially oriented toward subsistence, rather than trading purposes.
Therefore, farmers have traditional farming skills and are generally motivated, but now they

35 KNOWLEDGE FOR LIFE
need assistance in making a transition to commercial production, which needs new technology
and international standards. Availability of improved varieties (both traditional and new) is the
first requirement, as well as research and product development, and developing functioning
linkages between farmers and market agents which create favorable conditions for a
successful cluster (Table 13).
Table 13: SWOT Analysis of Walnut Super Cluster
Parameters Strengths Weaknessess Opportunities Threats
Environment/ Climate Change
Sandy loam soil texture, temperate climate makes the region a suitable place for cultivating and growing different varieties of walnut.
In GB Highland cluster, early and late frost may impact the fruit bearing capacity of walnut trees
Opportunities exist for sharing knowledge, technology, and building strong institutions and business linkages in both the clusters, rivalling Iran and Turkey
Climate related events such as floods, blizzards and avalanches may impact the walnut plantation in some areas
Availability of abundant snow-melt/glacial water from spring to late summers in GB
Walnut trees are grown on marginal lands
Transition, from the subsistence to modern cultivation practices
Input Supplies Because of remoteness and dispersed cultivation, chemical inputs have not penetrated these mountain valleys, especially in the GB highland cluster
Poor planning and absence of a strategy to turn these areas of Pakistan into a significant source of organic walnuts, for which there is good demand in the West and in China, which has been making intensive and extensive use chemical inputs and has poisoned its soils
Improving existing and developing newer, more productive commercial varieties Develop a very large cluster supplying organic walnuts and walnut products to the world. Developing organic inputs, such as biological methods to control disease and upgrading farmyard manure as effective organic fertilizer
Some loss of productivity in going organic
A rich pool of genetic material, which can be used in conjunction with new germplasm
Low priority by the national research systems, which are focused primarily on the five main commodities grown in the plains, and not so
Develop a vision and strategy for mountain agriculture Develop technical and institutional capacities for

36 KNOWLEDGE FOR LIFE
much on temperate fruits and nuts
servicing a large value-conscious cluster
Limited availability of certified, quality, and pure variety seed/seedlings
Government can establish mother nurseries to promote different varieties
Cluster interaction
As few as two trees of walnut are owned by an average household in GB
Limited access to certified seedlings Little interaction among farmers and researchers
Good practices can be adopted from other walnut producing counters in the worlds Strengthen R&D capacity in NARS focused on high value products in the mountain areas
Lack of vision in PCP, PARC and other federal and provincial research and planning institutions Lack optimal coordination and integration of walnut value chain actors Neglect and business as usual mind set of the NARS
Walnut is a high potential sub sector, with a very low base, on which to build a profitable cluster to benefit all the value chain actors, including farmers, traders, and the government
Under-developed, low priority and less understood sub sector at the national level
Possibility of collective efforts for achieving the economies of scale Specialization and modernization in the walnut sub sector, using the cluster approach Poverty reduction and sustainable development in the remote and marginalized mountain areas
No contract farming with defined quantities and quality parameter
Little credit availability from formal institutes for the small growers/farmers in GB
Production Management practices
Farmers having traditional skills in walnut production
Traditional orchard management practices are faulty (notably pruning, layout and fertility management, and irrigation)
Potential for horizontal and vertical expansion potential exist; Road infrastructure improving; matching grants
Goats and cattle grazing openly on marginal lands may damage the small and budding walnut plants Possibility of
diversification into improved varieties
Unorganized and mixed plantation in orchards
Possibility for growth at walnut production level; current average yield is between 70 to 90Kg/Tree
Sub-optimal and no use of fertilizer and pesticides
Opportunity for expanding extension services in private sector at production and harvesting exists
Lack of extension services in private sector for plantation, harvesting, storage and proper de-shelling of walnut

37 KNOWLEDGE FOR LIFE
Transportation
KKH /CPEC connects the region with all major cities in the country
Access roads to remote areas prone to blockages
Availability of paper boxes in the market already being used in certain other fruits and currently is being for packing walnut
Road blockages due to climatic and natural hazards may hamper the transportation to down the country
No proper arrangements for storage and transportation of walnuts
No facilities are airtight packing and refrigeration
The produce is sold as dry fruit across the country, 50% is retained for sale in the local market
Marketing High prices can be earned in local, national and international markets for quality walnut products
Farmers are disconnected from high value markets
Financial support by the commission agents and wholesalers to harvesting contractors can be converted into quality-based delivery contracts
Supermarkets may exclude small farmers from having access high value markets
No proper grading is done
Auctioning in the wholesale market with visual and spot grading
Bulk selling can result in better result for growers
Little capacity of farmers and traders and little quality infrastructure to produce, handle, and market the quality products
Emerging supermarkets can introduce contract with farmers which may improve retailing quality, and reduce postharvest losses and trading margin
Trade/Export Few traders/processors are exporting walnut to other countries; most walnut from GB is traded within the country
Food safety standards and traceability (HACCP, Euro GAP, Global Gap, IFS etc.) are major obstacles to enter into high end international markets
Growing demand for Walnut products in domestic markets
High cost of certifications and quality standards
Lack of proper standards for gradation and quality control in national market is a major constraint.
Better prices for higher quality walnut products in domestic/national market
Processing The walnut is consumed as a dry fruit/nut. Another key product is walnut oil that can be
Unshelled walnut as has a shelf life of a few months if properly refrigerated
Huge demand for processed walnut products within in national and international markets
Processing of walnut potentially by large may corporations may impact the
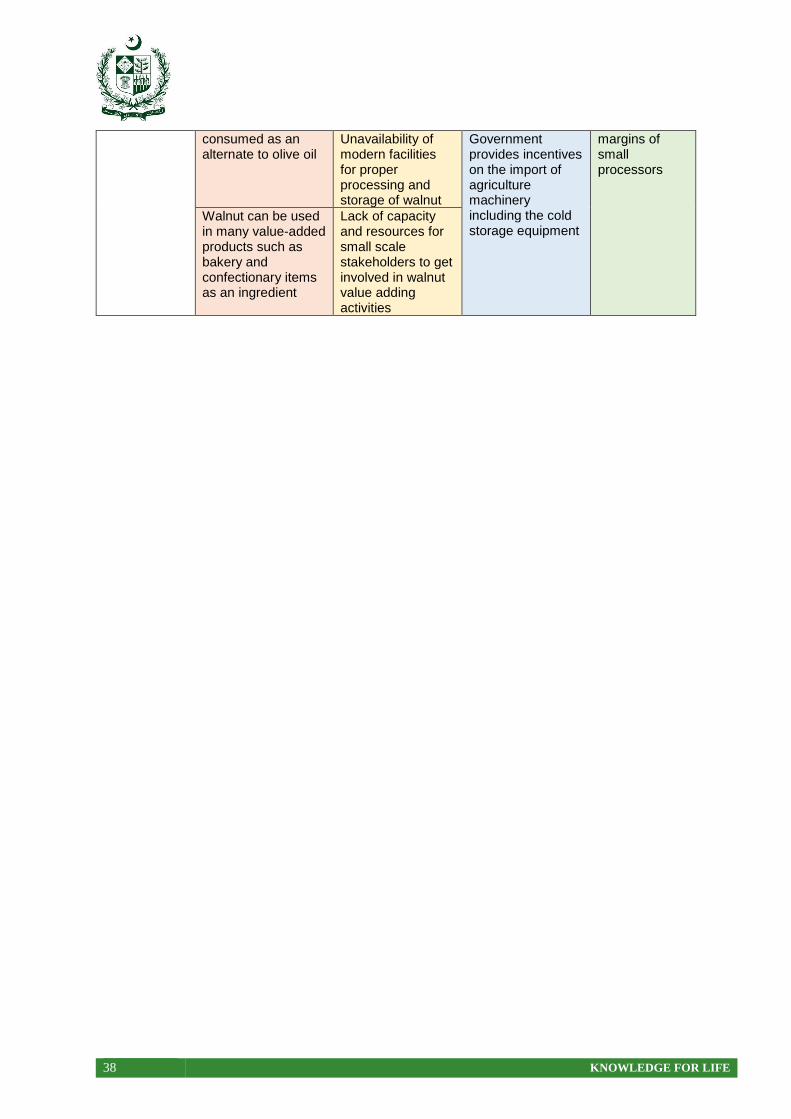
38 KNOWLEDGE FOR LIFE
consumed as an alternate to olive oil
Unavailability of modern facilities for proper processing and storage of walnut
Government provides incentives on the import of agriculture machinery including the cold storage equipment
margins of small processors
Walnut can be used in many value-added products such as bakery and confectionary items as an ingredient
Lack of capacity and resources for small scale stakeholders to get involved in walnut value adding activities

39 KNOWLEDGE FOR LIFE
6. CHALLENGES FACED BY THE CLUSTERS
The majority of producers in both the cluster are small farmers, having very few trees and a
product that lacks quality, uniformity, and quantity. There are no producer or marketing
associations, for accessing production and processing technology, market intelligence, and
collective marketing with more bargaining power. Due to this problem the producers are bound
to sell their produce to local shopkeepers and middlemen with lower prices. They are also
unable to add value to their produce, such as kernel separation, oil extraction and attractive
packing due to lack of knowledge and awareness, which deprive them from additional income
that is appropriated by the savvier middlemen and traders from down country.
The Agricultural Research Institute (ARI) in Mingora, Swat, has undertaken pioneering
breeding program, and developed improved commercial varieties. Government has also
established a nursery in Kallam, Swat that provides germplasm for newer walnut varieties in
the valley. So, the technology is already tested and available which can be transferred to both
the clusters, if adequate financial resources can be made available. The scope of this R&D
infrastructure can be expended to GB, where research capacity is very weak. Since walnut
propagation is achieved from seeds, it is not that difficult to supply certified seed to government
and private nurseries in GB.
The technologies needed for production, processing, packaging and storage needed
upgrading in both clusters. There are very few entrepreneurs, who are investing in innovative
technologies to develop new value-added walnut products in both the clusters. Market
linkages are heavily reliant on the tenacity of the individual processor/exporters creating a
constricted market structure in both the clusters.
It is generally considered that walnut doesn’t need cold storage or refrigeration. But in fact,
the refrigeration keeps the freshness and nutritional quality of walnut for at least six months.
In the absence of proper refrigerated storage, the nutritional value of walnut can deteriorate.
The de-stoned walnut has to be kept at around 15°C to maintain its freshness. Based on these
standards, the handling and storage of walnuts can be improved in both the cluster, with
cheaper options, such as underground storage, in which temperatures can be maintained at
lower levels, without the use of refrigeration, because of higher elevations.
Whilst there is little horizontal coordination between competing wholesalers, there is a certain
amount of vertical coordination in the supply chain. For example, GB wholesalers will advance
cash to smaller traders to source walnut. The same practice is also common with contractors
who in certain cases buy the standing crop in KP. There is also little coordination between
wholesalers in supplying walnuts to the national market, which often leads to oversupply and
depress prices, especially immediately harvest. Storage can also help regulate the supply.
Traders do not have any long-term binding agreements with suppliers or buyers - all orders
are one-off transactions.

40 KNOWLEDGE FOR LIFE
Information and communication technologies and internet services are still very poor in these
remote areas, but they are improving. Labor is available on a permanent and seasonable basis
and financial services to traders are provided by both formal and informal banking institutions.

41 KNOWLEDGE FOR LIFE
7. CLUSTER DEVELOPMENT
POTENTIAL
7.1. Overview
In this section, an attempt has been made to evaluate this potential in terms of production,
quality and market side of the walnut value chain, based on the targets set in chapter 2 for
incremental improvements in the cluster performance.
7.2. Production Potential
Although available (but unreliable) data suggests otherwise, a negative yield gap is likely to
exist between Pakistan’s and the global average yields. The global average yield is 3.45
tonnes/ha, whereas Pakistan’s yield is reported to be 6.93 tonne/ha – thus Pakistan appears
to have a higher yield than the global average. As reported elsewhere in this report, this is
misleading as data on yields are calculated by dividing the total production from the harvested
acreage. In Pakistan, the walnut cultivation is by and large, random and dispersed; hence it is
difficult to come up with reliable figures on walnut acreage and yields. Experts and farmers
consulted for this report are equally perplexed on why yields are higher, but the consensus
seems to be that yields in Pakistan cannot be higher than the global average, because the
walnut sector is dominated by the traditional cultivars that tend to be low in productivity, and
there are many other gaps, from the use of technology, inputs and management practices.
One this is sure that walnut is an ignored sector in Pakistan, despite its many ecological,
economic and social benefits.
Therefore, one of the key interventions of this initiative is to re-plant better and High Yield
Varieties (HYV) of walnut trees on 60% of the land under walnut cultivation and establishing
certified new orchards. The re-plantation with the mobilization of farmers in target districts will
be done in five year. The walnut plants have a gestation period of 5 year after which they start
bearing the fruit. A key recommendation is to introduce dwarf and short-gestation varieties, to
drive down the average gestation period, and to drive up average yields/ productivity. As the
new plantations increase, old trees, many of them very old and unproductive, can be harvested
and turned into high quality and high value timber.
This increase in production can be absorbed by increased demand in the cities, expected
growth in e-commence and in the growing health food market in Pakistan. In 2016, Pakistan
imported 492 tonnes of in shell and 24 tonnes of deshelled walnuts, valued at US$ 1.3 million
and US$ 82,000 respectively, according to FAO.2 The informal imports from Afghanistan and
Iran are not included in these figures. Moreover, walnut imports from China are already hitting
the market in Pakistan. Pakistan needs to improve its walnut production as a hedge against
neighbouring countries’ flooding its market. Increasing production is expected to be consumed
within Pakistan in a variety of food products, hence no exports are envisaged in this plan,
2 http://www.fao.org/faostat/en/#data/TP

42 KNOWLEDGE FOR LIFE
beyond the natural growth. Walnut oil is a high-value product and can be developed as an
import substitute for olive oil in Pakistan.
7.3. Improvement in Quality
The first and most essential step in the value-added processing is to deshell the product, using
new technology. Processing 50% of the production and selling it in high-end domestic markets
should generate US$ 14.55 million in the value chain per year at the end of the project,
compared to US$ 9.33 revenue from the same quantity sold unprocessed.
7.4. Reduction in Post-Harvest Losses
One of the major concerns in agriculture in the country is high post-harvest losses. Although
these losses are relatively low in nuts compared to fresh products, they are losses,
nevertheless, and, with improved post-harvest technologies and management practices, these
losses can be halved, from an average of 10% to 5%.
7.5. International Standards
To improve the quality and price of walnuts to international level, we have to adopt
international quality standards at each segment of the value chain. The primary standard is
IPPC - the International Plant Protection Convention - is the international treaty under which
common standards are developed for pest control in plants and plant products across
international borders. For walnuts, specifically, the guidelines developed the United Nations
Economic Commission for Europe (UNECE), are the gold standard. Pakistan can benefit by
following UNECE standards for international trade, to encourage farmers to aim for high-
quality production, improve profitability and protect stakeholders’ interests. UNECE standards
are used by Governments, producers, traders, importers and exporters, and other
international organizations. They cover a wide range of agricultural products, including fresh
fruit and vegetables, dry and dried produce, seed potatoes, meat, cut flowers, eggs and egg
products.
Figure 4: A typical walnut tree in Chitral, with a large canopy
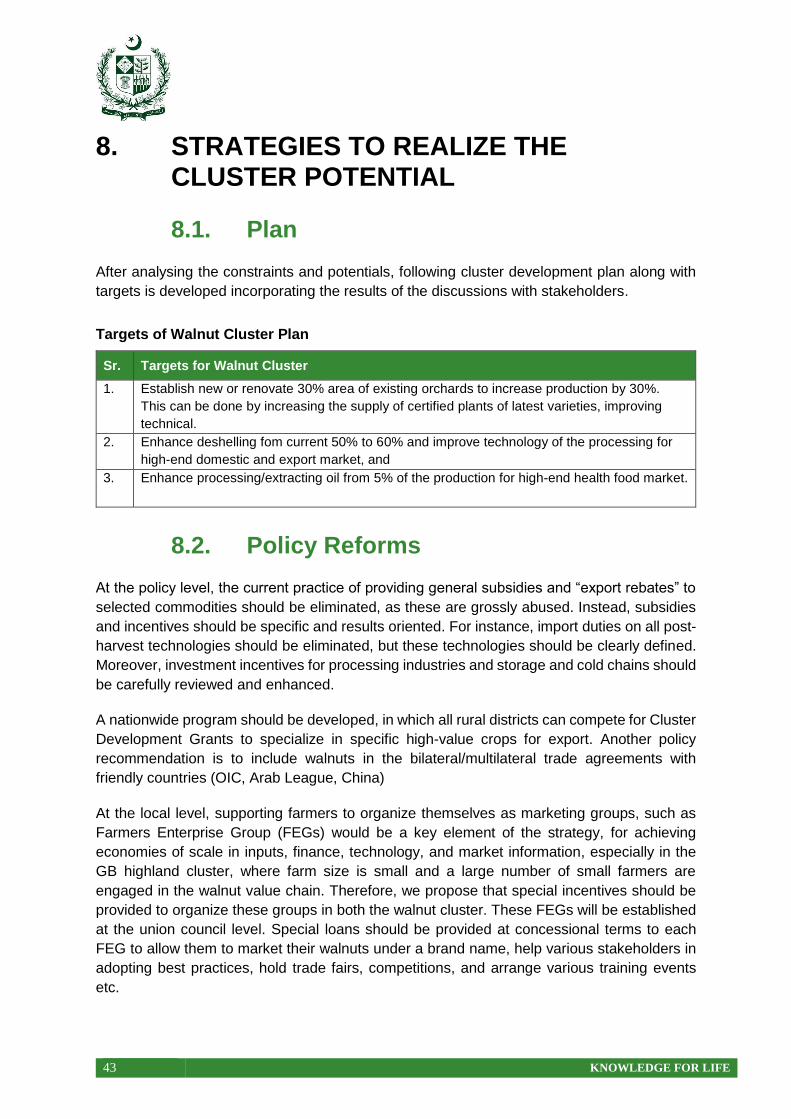
43 KNOWLEDGE FOR LIFE
8. STRATEGIES TO REALIZE THE CLUSTER POTENTIAL
8.1. Plan
After analysing the constraints and potentials, following cluster development plan along with
targets is developed incorporating the results of the discussions with stakeholders.
Targets of Walnut Cluster Plan
Sr. Targets for Walnut Cluster
1. Establish new or renovate 30% area of existing orchards to increase production by 30%.
This can be done by increasing the supply of certified plants of latest varieties, improving
technical.
2. Enhance deshelling fom current 50% to 60% and improve technology of the processing for
high-end domestic and export market, and
3. Enhance processing/extracting oil from 5% of the production for high-end health food market.
8.2. Policy Reforms
At the policy level, the current practice of providing general subsidies and “export rebates” to
selected commodities should be eliminated, as these are grossly abused. Instead, subsidies
and incentives should be specific and results oriented. For instance, import duties on all post-
harvest technologies should be eliminated, but these technologies should be clearly defined.
Moreover, investment incentives for processing industries and storage and cold chains should
be carefully reviewed and enhanced.
A nationwide program should be developed, in which all rural districts can compete for Cluster
Development Grants to specialize in specific high-value crops for export. Another policy
recommendation is to include walnuts in the bilateral/multilateral trade agreements with
friendly countries (OIC, Arab League, China)
At the local level, supporting farmers to organize themselves as marketing groups, such as
Farmers Enterprise Group (FEGs) would be a key element of the strategy, for achieving
economies of scale in inputs, finance, technology, and market information, especially in the
GB highland cluster, where farm size is small and a large number of small farmers are
engaged in the walnut value chain. Therefore, we propose that special incentives should be
provided to organize these groups in both the walnut cluster. These FEGs will be established
at the union council level. Special loans should be provided at concessional terms to each
FEG to allow them to market their walnuts under a brand name, help various stakeholders in
adopting best practices, hold trade fairs, competitions, and arrange various training events
etc.

44 KNOWLEDGE FOR LIFE
A common intervention recommended for the walnut cluster is to form a national Walnut
Association, or Walnut Association of Pakistan (WAP). This entity should have a website of its
own and work to promote best practices, share knowledge, market information, technology
and lobby with government for enabling policies, on behalf of its members. AAP should also
develop Apps for marketing, and also represent walnut growers and traders in international
fairs and events.
8.3. Production Level Strategies
The primary production strategy is to narrow the yield gap with the global average. The plan
is to increase the yields by 50% from the current base in ten years. This will be done by:
a) Importing high quality germplasm. As stated in Section 5.2 of this report, the ARI in
Mangora, Swat has done pioneering work in screening and selecting a number of local
and exotic varieties. The imported varieties include Chandler, Hartley, Lam,
Germisara, lupanesti, Valerie, Odum, Sere and Sulemani (the last one from
Afghanistan). There are also local selections, such as MS-1, MS-2, MS-18 from
Malakand, SW-1, SW-3′ from Swat, Dir-2 and Chitral-I, Chitral-2, Chitral-3, Kurram-1,
Kurram-2, Kurram-3, Kurram-4 Qazi, M.I. (2007). This work needs strengthening and
extension to all the walnut growing areas, especially to the GB highland cluster, where
farmers need new varieties having traits of high yields, dwarf sizes of the trees, and
tolerance to late and early frost, and resistant to common diseases.
b) Development and supply of latest and certified varieties to farmers. A strong
relationship between ARI and MARC needs to be established for undertaking joint R&D
in the entire cluster. This program will initially rely on the selection of high yielding
material from a wide array of germplasm collected, but later it will do some breeding
work in developing new varieties. The advance lines (not varieties) will be handed over
to NARC for testing these in different districts of GB and finalize the varieties suitable
for the GB highland cluster. After finalizing the varieties at the research station by some
independent evaluators, the provincial research system will also demonstrate these
varieties under the farmers’ field and allow the farmers to select the better varieties for
propagation. This program should be implemented in conjunction with the selective
breeding of the most suitable local varieties; hybrids can also be created by crossing
the local with new varieties to produce better results.
c) Widespread distribution of new varieties. Parent blocks should be established at
government nurseries; commercial nurseries should also be supported to set up
mother blocks and multiply certified plants for sale to farmers under the truth-in-label
rules. In ten years, 70% of the land with walnut plantation is to go through replantation
so as to increase the yield by 50% in seven to eleven years.
d) Promoting proper orchards certified under International Standards for Phytosanitary
Measures (ISPMs). In each district, at least 5 commercial gardens each of 0.2 acre
should be established at 75:25 cost sharing basis with farmers bearing the 75% cost.
45 KNOWLEDGE FOR LIFE
e) Appropriate training in nursery and orchard management. Model nurseries should be
developed used as demonstration and technology diffusion points for promoting good
agricultural practices. The model nurseries should be used farmers field schools (FFS),
where farmers and researcher can co-experiment and learn latest scientific practices.
It will be highly desirable to invite experts from China and other countries to help put in
place specific phytosanitary / organic standards needed for export to China /other
countries in these demonstration plots. Moreover, about 100 farmers should be
provided on-hand training in each walnut growing district.
8.4. Processing and Value Addition
By processing and value addition, we mean harvesting at the right time, sorting, grading,
deshelling, cool and dry storage, and retail packaging and then establishing a reliable supply
chain to deliver the product from the farmgate, all the way to super markets in Islamabad,
Lahore and other cites, or to the air cargo facilities for export. In this way, not only higher prices
are ensured but also the product’s shelf life is extended, and transportation and retail level
losses are reduced.
Deshelled walnuts can be packaged into small heat-sealed bags as a healthy ready-to-eat
snack. Opportunities for product development are largely unlimited, from improving the quality,
packaging and marketing of walnuts, to making new products and seeking new markets,
especially in the whole food, organic and ingredients market niches. Therefore, the main value
addition and processing strategy would be to deshell and extract oil from at least 5% of the
production coming from both the cluster.
This will be achieved by:
a) Incentivizing the private sector to establish processing units. In each walnut growing
district, at least one automatic processing unit will be established, which will include
equipment for automatic sorting, grading, de-shelling, oil extraction and vacuum
packaging. The centre will be established in partnership with the FEGs on cost sharing
basis. All machinery will be provided on loan to the FEGs, which will be recovered in
ten years provided the FEGs share 50% of the cost of the building for the cold chain
and remaining 50% costs will be shared by the government.
b) Promoting walnut uses in the food industry. Walnut is used in a wide range of food
products which must be promoted systematically. For instance, walnut oil and other
walnut products can be promoted as a health product (improves HDL, or ‘good
cholesterol’) in a country like Pakistan, where hyper tension is a huge problem among
the population.
c) Branding of walnut products. Each FEG will get its product branded and cost of
branding will be initially borne by the FEGs and charged from the farmers who will sell
their whole or processed walnuts. For branding, the ‘Mountain Healthy’ and ‘Organic
Food’ business models are additional options to improve the value for the farmer
groups and other value chain actors. Certifications for IPPC, Phytosanitary, Organic,
Fairtrade, and Geographical Indication’ can be pursued as other value-added

46 KNOWLEDGE FOR LIFE
strategies. GI can be used on products that have a specific geographic origin and
possess qualities or a reputation that are intrinsically due to that place of origin.
Himalaya, Karakoram, Hindu-Kush can be such GI labels, which are well known in the
world.
d) Holding competition and rewards for processors. Special competition will be held and
rewards will be provided for outstanding processors and exporters of walnuts. These
competitions will be held at district-level and then concluded at the cluster level.
e) Forming a Walnut Association of Pakistan. This should be a joint activity for both parts
of the cluster, which should have a website and develop its own marketing apps.
8.5. Marketing and Trading/Export
Strategies
a) Providing market information. A small unit will be established in the department of
agriculture consisting of three scientists (marketing specialist, economist, and
information analysist) with supporting staff. It will regularly provide information to the
stakeholders about international market requirements (i.e., standards, price, potential
buyers, etc.).
b) Holding competition and rewards for exporters. Special competition will be held and
rewards will be provided for outstanding exporters and processors of walnuts and
walnut products. These competitions will be held at the cluster level.
c) To improve the quality. It is proposed to provide support in producing high quality
walnuts with international standards at the FEG level, for high end domestic market
and for export. To meet these standards, the following interventions and mechanisms
are suggested.
d) Incentives for adopting best practices and certification regimes. International best
practices and certification regimes are to be adopted in all segments of the value chain,
especially in production, logistic, and marketing to become competitive in national and
international markets. For this, special investments are required to adopt and certify
these practices. Special tax incentives will be provided to establish certification
companies at the cluster level. The government will incentivize various stakeholders
along the value chain to adopt these practices by paying 25% of the machinery cost
recommended by the certification agencies at various levels. However, farmers have
to agree to pay for any additional infrastructure, labour, and monitoring costs.
e) Training stakeholders to adopt ISPMs. International consultants will be engaged by the
Federal Government to spell out requirements at production, processing,
transportation, storage, and marketing levels and provide training of trainers who in
turn, will train farmers, processors, traders, exporters, etc. to adopt the ISPMs
standards. One hundred farmers and 25 other stakeholders will be trained to adopt the
ISPMs in each district every year.

47 KNOWLEDGE FOR LIFE
9. BENEFITS AND COSTS OF CLUSTERING
Following three direct interventions are suggested to achieve the targets of the walnut
upgradation programs:
1. Provision of true to type walnut nursery plant of improved varieties with incentives to
renovate the old walnut gardens;
2. Modernize the walnut deshelling industry in rural areas
3. Establish the walnut oil units in rural areas.
This section discusses the costs associated with these cluster development interventions. This
also identifies resources for achieving the targets given in section 8. An economic and social
impact analysis has also been conducted that evaluates the benefits of the walnut cluster
development interventions in the GB highland and KP midland clusters.
9.1. Investment and Resource Needs
A public-private investment strategy is needed to support the cluster development efforts in
the walnut clusters. A capital investment of US$ 33.6 million is needed to upgrade both the
walnut clusters. Out of this, US$ 22.9 million will be needed to upgrade the KP midland cluster
and US$ 10.7 million for the GB highland cluster. The highest investment would be required
to upgrade the walnut shelling industry (Table 14).
This plan will require to establish research stations, certified nursery, in each cluster, 189
deshelling units, and 50 oil extraction plants. The details of these resources by cluster is given
in Table 14.
Table 14: Proposed Investments for the Development of Northern Walnut Cluster
Description
Quantity Unit
Unit Cost US$
KP Midland GB Highland Total
Quantity
Cost (US$ million)
Quantity Cost (US$ million)
Quantity Cost (US$ million)
Capital Costs
Strenghtening research
Research institute (RI)
0.50 1 RI in each cluster
0.50 1 0.50 2 1.00
Capacity nuilding of stakeholders
Ha 12.35 630 0.038 422 0.026 1052 0.064
Rennovation of exisiting orchard area-Plant cost.
Ha 1750 189 0.662 127 0.443 316 1.11

48 KNOWLEDGE FOR LIFE
Establishment of certified walnut nurseries
Nursery Number
52136 1 0.052 1 0.052
2 0.104
Desheling costs
Deshelling Plant (No.)
117100
130 15.22 59 6.92 189 22.24
Oil extraction costs
Oil extraction plant number
122000
35 4.28
15 1.83 50 6,11
Government loans
2.14
0.96 - 3.10
Total 22.89 10.73 - 33.62
Out of this, about 30% will be provided by federal and provincial governments in the form of
strengthening research, capacity building of stakeholders, providing 20% subsidy on building
modern deshelling plants, oil extraction plants, establishing certified nurseries, and providing
interest free loans for the first year of investment. We expect that these investments will excite
the remaining 70% of the total investment in the private sector. For the public sector
investment, a Cluster Development Fund (CDF) will be established under PCP. The seed
money for CDF should come from CPEC investments.
9.2. Operational Cost and Total Investments
It must be noted that these investments above are capital investments (CAPI), not operational
costs (OPC) that includes production costs or value chain costs, such as taking care of the
renovated gardens, processing and value addition activities, raw and packaging material,
transportation, distribution, financial costs (the working capital). The total operational cost
required to implement the plan would be US$531 million (undiscounted) in 10 years (Table
15). All these costs are substantial, and borne by the farmers and value chain actors. As these
costs are expected to increase as a result of new investments, famers and other value chain
actors need access to credit, which is typically not available from formal financial institutions.
These costs are detailed in Feasibility Model (Annexes 4). A revolving credit fund can be
established in partnership with public sector banks. Alternatively, the government can provide
loan guarantees to value chain actors to obtain credit from private banks, who will be
responsible for due diligence.
Table 15: Summary of Investment and Operational Costs (Undiscounted US$)
Investment Cost (US$ ‘million)
KP Midland Cluster GB Highland Cluster Total
CAPI Investment 22.89 10.73 33.62
OPC Investment 296.07 134.95 431.02
Total investment 318.96 145.68 564.64
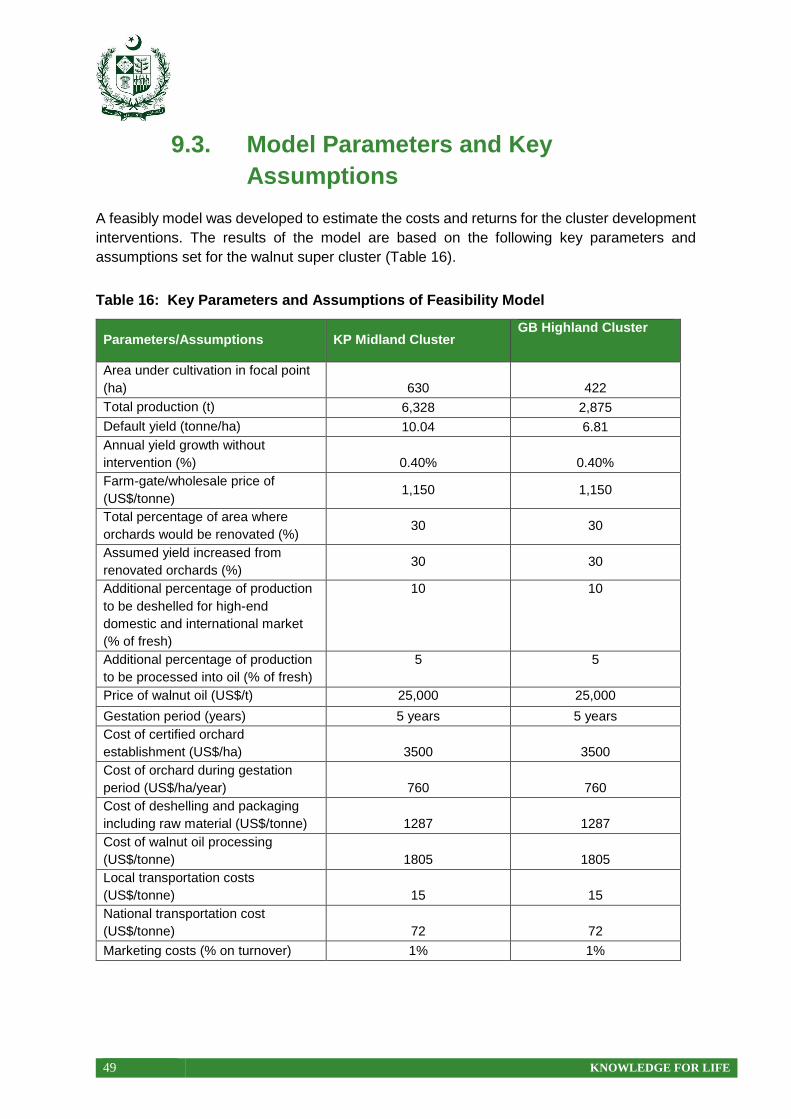
49 KNOWLEDGE FOR LIFE
9.3. Model Parameters and Key
Assumptions
A feasibly model was developed to estimate the costs and returns for the cluster development
interventions. The results of the model are based on the following key parameters and
assumptions set for the walnut super cluster (Table 16).
Table 16: Key Parameters and Assumptions of Feasibility Model
Parameters/Assumptions KP Midland Cluster GB Highland Cluster
Area under cultivation in focal point
(ha) 630 422
Total production (t) 6,328 2,875
Default yield (tonne/ha) 10.04 6.81
Annual yield growth without
intervention (%) 0.40% 0.40%
Farm-gate/wholesale price of
(US$/tonne) 1,150 1,150
Total percentage of area where
orchards would be renovated (%) 30 30
Assumed yield increased from
renovated orchards (%) 30 30
Additional percentage of production
to be deshelled for high-end
domestic and international market
(% of fresh)
10 10
Additional percentage of production
to be processed into oil (% of fresh)
5 5
Price of walnut oil (US$/t) 25,000 25,000
Gestation period (years) 5 years 5 years
Cost of certified orchard
establishment (US$/ha) 3500 3500
Cost of orchard during gestation
period (US$/ha/year) 760 760
Cost of deshelling and packaging
including raw material (US$/tonne) 1287 1287
Cost of walnut oil processing
(US$/tonne) 1805 1805
Local transportation costs
(US$/tonne) 15 15
National transportation cost
(US$/tonne) 72 72
Marketing costs (% on turnover) 1% 1%

50 KNOWLEDGE FOR LIFE
9.4. Economic and Social Feasibility
The investments proposed in the previous section are expected to generate substantial
economic, social and environmental (tree cover) returns. As discussed in the previous
chapters, the key objective of cluster development is to improve the overall efficiency of the
walnut sector in the country. This efficiency shall be realized as a result of measures taken at
production, processing and marketing levels.
Table 17 provides a summary of the expected costs and returns for the cluster. For details,
please refer to Annex 4A and 4B in this Report.
Table 17: Economic Returns and Feasibility of Upgradation Plan by Cluster
Parameters KP Midland GB Highland Overall
Total undiscounted Gross Revenue (Million US$) 501.94 228.05 729.99
Total undiscounted operating costs (Million US$) 198.04 90.36 288.40
Total undiscounted investments (Million US$) 18.43 8.76 27.19
Cash undiscounted flow (Million US$) 285.47 128.92 414.39
Discount rate (%) 8.5% 8.5% 8.5
NPV (US$) 214.09 96.69 310,78
IRR (%) 183% 143% 166
9.5. Key Interventions
This study separately estimates the feasibility of walnut deshelling machines and walnut oil
extraction. The feasibility of both the product is given in Annexure 5 and 6, respectively.
Deshelling is highly feasible as its Internal rate of return (IRR) turns out to be 101%, while
investment on deshelling plant can also generate an IRR of 17%.
9.6. CONCLUSION
To conclude, the overall economic, social and environmental impact of the cluster
development program is positive, sustainable and long lasting. This can be achieved if the
country can invest in R&D, organize producers, enhance capacity of stakeholders, and
provided processing and quality infrastructure. This can enhance incomes of the farmers,
middlemen, and traders, and generate foreign exchange for the country and new employment
opportunities in the walnut growing mountain areas of Pakistan.

51 KNOWLEDGE FOR LIFE
10. Programs and Plans This report presented an overview of the potential of walnut sector in Pakistan. Identified the
walnut clusters as part of the V2025 of GoP. Discussed the gaps and constraints of identified
walnut clusters in GB and KP. Gave recommendations for cluster development in both the
clusters; and estimated the economic and social impact of the cluster development
interventions that shall set new frame conditions at production, processing, and marketing
level of walnut value chain in both the clusters. In support of the findings and recommendations
presented in previous chapters, the following plans and programs are proposed for further
value addition.
In support of the strategies and interventions proposed in chapter 8 of this report, the following
programs/plans are recommended to further strengthen the interventions and to creating
greater opportunities for participation and learning.
10.1. Organization and Networking
The following program is proposed for organization of stakeholders at different levels of value
chain.
Table 18: Program for Organization and Networking of Stakeholders
Sr. Area of Action Purpose Institutions to be involved
Priority
1. Gilgit Baltistan Highland cluster
1.1
Form Walnut Farmer Enterprise Groups (FEGs) at grassroots level. 4 FEGs in total with each having a membership of at least 25 farmers. GB has 4 walnut producing districts, and thus 1 FEGs per district
Organization of Walnut farming community for collective action
Village Organizations (VOs), LSOs, NGOs (AKRPS), DoA GB, Department of rural development GB.
Short to medium term (1 to 2 years)
1.2
Form Walnut Processors and Traders Association at market/business level. At least 4 processors should be initially involved.
Improve coordination between the stakeholders of Walnut value chain
DoA GB, NGOs, Private Sector
Short to medium term (1 to 2 years)
2. KP Midland Cluster
2.1
Form Walnut Farmer Enterprise Groups (FEGs) at grassroots level. 4 FEGs in total with 1 FEG in each walnut producing district and FEG each having a membership of at least 30 farmers.
Organization of Walnut farming community for collective action
NGOs, DoA KP, Department of rural development KP.
Short to medium term (1 to 2 years)
2.2
Form Walnut Processors and Traders Association at market/business level. At least 4 processors (1 processor in each walnut producing district) should be initially involved.
Improve coordination between the stakeholders of Walnut value chain
DoA KP, NGOs, Private Sector
Short to medium term (1 to 2 years)

52 KNOWLEDGE FOR LIFE
10.2. Program for Research Reform
The following program indicative areas for further research to strengthen the walnut cluster in
the two regions are proposed along with the estimated costs.
Table 19: Program for Research Reform
S#. Identification of Areas for Further Research
Research Purpose/ Priority
Indicative Research Institutions
1. Gilgit Baltistan High Land Cluster
1.1
Identify suitable cultivars for mountain areas
Develop strategy for quickly distributing improved seedlings
Walnut production improvement (Short to medium term (1 to 2 years)
MARC, PARC, KIU, DoA Gilgit Baltistan
1.2
Develop training modules
Develop formats for Farmer Field Schools (FFS) for on-farm training of Walnut producers
Improve Orchard Management and On-farm Processing Skills (Short to medium term (1 to 2 years)
MARC, DoA Gilgit Baltistan
1.3 Survey for identification of
target group of 4 processors
Product Diversification from Processed walnuts (Short to medium term (1 to 2 years)
Private businesses, DoA Gilgit Baltistan, MARC
1.4
Consultation with processors to assess interest in establishing a Fruit Processor Association
Scoping survey to identify new products and potential buyers
Create market Linkages for quality Processed Walnut (Domestic and Export) Medium to long Term (2 to 5 years)
Private businesses, DoA Gilgit Baltistan, MARC, Export promotion board, Embassies
1.5
Identify suitable fresh fruit traders to support the cluster
Identify suitable fresh fruit buyers to link with in premium markets through a market survey
Consultation to decide on implementation strategy – wholesale market or individual traders
Identify most suitable cold storage and fresh fruit trading technology
Develop Cold-Chain Infrastructure for Fresh Fruit Trading Medium to long Term (2 to 5 years)
FEG clusters; Farmer Associations; Business associations and cooperatives.
1.6
Research into Climate change related negative impacts such as new diseases and shifts in crop cycle
Investigate into climate related negative impacts on horticulture Medium to Long term (2 to 5 years)
MARC, DoA Gilgit Baltistan, research institutions
2. KP Midland Cluster
2.1 Survey for identification target
group of 4 processors
Product diversification from processed walnuts
Private businesses, DoA KP

53 KNOWLEDGE FOR LIFE
Short to medium term (1 to 2 years)
2.2
Consultation with processors to assess interest in establishing a Fruit Processor Association
Scoping survey to identify new products and potential buyers
Create market Linkages for quality processed walnut (Domestic and Export) Medium to long Term (2 to 5 years)
Private business, DoA KP, Export Promotion Board, Embassies
2.3
Identify suitable fresh fruit traders to supporting the cluster
Identify suitable fresh fruit buyers to link with in premium markets through a market survey
Consultation to decide on implementation strategy – wholesale market or individual traders
Identify most suitable cold storage and fresh fruit trading technology
Develop Cold-Chain Infrastructure for Fresh Fruit Trading Medium to long Term (2 to 5 years)
FEG clusters; Farmer Associations; Business associations and cooperatives.
2.4
Research into Climate change related negative impacts such as new diseases and shifts in crop cycle
Investigate into climate related negative impacts on horticulture Medium to Long term (2 to 5 years)
DoA KP, P&D department, Research Institutions

54 KNOWLEDGE FOR LIFE
11. Annexures
Annexure-1. Macro Data Sources
AGRISTATISTICS (2012-14) District-wise data on walnut: http://www.amis.pk/Agristatistics/DistrictWise/2012-2014/Walnut.html
FAOSTAT (Food and Agriculture Organization Statistics) (2018) Production, Crops
http://www.fao.org/faostat/en/#data/QC
FAOSTAT, (Food and Agriculture Organization Statistics). 2020. Trade, Crops and Livestock
Products http://www.fao.org/faostat/en/#data/TP
GGB (Government of Gilgit and Baltistan) (2015). GGB Survey Report (2014), Agriculture
Statistics Cell, Department of Agriculture, Gilgit-Baltistan.
MNFS&R (Ministry of National Food Security and Research). (2017). Fruit, Vegetable, and
Condiment Statistics (2015-16), Economic Wing, Ministry of National Food Security and
Research, Pakistan. http://www.mnfsr.gov.pk/frmDetails.aspx
Food and Agriculture Organization (FAO) and International Plant Protection Convention (IPPC) (2020). Adopted Standards (ISPMs) downloaded from https://www.ippc.int/en/core-activities/standards-setting/ispms/#publications

55 KNOWLEDGE FOR LIFE
Annexure-2. List of Stakeholders Consulted The following stakeholders were consulted during this feasibility study exercise
Sr. Name Title Location Contact
1. Asghar Ali Director, DoA Gilgit 0306 3069900
2. Melad Karim COP, Sadpara Development Project Skardu 0302 5430003
3. Ahsan Mir PD, GBTI (IFAD) Gilgit 0345 5456795
4. Muzaffar u din GM, AKRSP Gilgit 0345 8521990
5. Mr. Kamal Din CEO KADO Hunza 0300 0227770
6. Ali Khan Member Village Organization Gilgit 0355 5748194
7. Ahmed Ali Member Village Organization Skardu 0355 5395968
8. Nisar Hussain Member Village Organization Skardu 0355 5268583
9. Tahir Hussain Member Village Organization Skardu 0355 4105784
10. Mohd Ibrahim Member Village Organization Baltistan 0355 5386884
11. Mohd Anwar Member Village Organization Baltistan 0344 2898336
12. Mustafa Member Village Organization Baltistan 0355 5436846
13. Ejaz Member Village Organization Baltistan 0355 5661724
14. Mumtaz Member Village Organization Baltistan 0355 5678946
15. Rehmatullah Member Village Organization Baltistan 0346 6593878
16. Gulzar Member Village Organization Baltistan 0355 5197358
17. Ghulam Ahmed SDP Skardu 0314 3141519
18. Waseem Abbas AKRSP Skardu 0345 5936050
19. Israr-uddin Chitral, entrepreneur KP 0343 1365656
20. Ali Sher Khan Chitral, farmer KP 0346 9891750
21. Irfan Khan Swat KP

56 KNOWLEDGE FOR LIFE
Annexure-3. List of Data and Literature Reviewed Abbasi, N., S. Basharat and H., Ishfaq. (2014). FOLLOWING THE WALNUT FOOTPRINTS IN PAKISTAN.
Ahad, S.F., M. Ayaz, and Z. K. Rehman, (1998) Performance of walnut varieties under climatic condition of Malakand division [Pakistan]. Agriculture Station Swat, PARC.
Ali, M., A. Ullah, H. Ullah, F. Khan, I. Syed, L. Ali, and S. Ahmad. (2010). Fruit Properties and Nutritional Composition of Some Walnut Cultivars Grown in Pakistan. Pakistan Journal of Nutrition. 9. 10.3923/pjn.2010.240.244.
Applicable discount rate set by SBP accessed on 25-Oct-2018 from the following web link: http://www.sbp.org.pk/ecodata/index2.asp
Currency Exchange Rates: http://www.xe.com Davis, L., L. D. Toit, M.P., Janine, W. Francois, H. Susanna, and J. Johann. (2007). The effects of high walnut and cashew nut diets on the antioxidant status of subjects with metabolic syndrome. European journal of nutrition. 46. 155-64. 10.1007/s00394-007-0647-x.
Economic transformation initiative by IFAD: https://operations.ifad.org/documents/654016/44a8f48a-91f8-45ad-8d2b-e4499c7892bf Evaluation of walnut production technology for Kohistan, Pakistan (2007) Accessed from http://agris.fao.org/agris
Food and Agriculture Organization: Production, Crops: http://www.fao.org/faostat/en/#data/QC
Food and Agriculture Organization: Trade, Crops and Livestock Products: http://www.fao.org/faostat/en/#data/TP
K.A. Nisar, et al, “Screening and Evaluation of Exotic and Indigenous Walnut Genotype and Varieties”: https://juniperpublishers.com/artoaj/pdf/ARTOAJ.MS.ID.555709.pdf
Khan, N., B. Nadia, M. Anjum, I. A. Khan, K. Imtiaz, R. B. Latif, and Abdul. (2017). Screening and Evaluation of Exotic and Indigenous Walnut Genotype and Varieties.
Khan, W.M., I.A. Khan, H, Ahmad, H. Ali, S. Ghafoor, M. Afzal, F.A. Khan, M. Shah, and S.G.
Afridi (2010), “Estimation of Genetic Diversity in Walnut”; Pak. J. Bot., 42(3): 1791-1796, 2010:
http://www.pakbs.org/pjbot/PDFs/42(3)/PJB42(3)1791.pdf
Khattak MS, S.W. Ali, M. Shah (2000) Genetic biodiversity in the segregating population of walnut (Juglans regia L.) at Kurram Agency, Parachinar. Pakistan J Bio Sci 3(6): 965-966.
Leslie, C. A. (1991) The Details on Walnut Varieties, Walnut Database, University of California, DAVIS: https://ucanr.edu/sites/cawalnut/AuthorsFL/LeslieCA/
Morning Post, Walnut: An Economic Growth Potential in District Swat. Accessed at: http://morningpost.pk/eng/?p=1318
Muhiudin, Qamar, (2011). “Marketing of Agriculture Products in Pakistan: Theory and Practice (2011): https://www.researchgate.net/publication/229059737_Marketing_of_Agriculture_Products_in_Pakistan_Theory_and_Practice
Pakistan Observer; GB economy largely depends on dry fruits, agriculture, March 27, 2017. Accessed From:https://pakobserver.net/gb-economy-largely-depends-on-dry-fruits-agriculture/
Rahaman, K.N., A. Ali, J.B. Khan, and R. Alam (2009), Response of various indigenous walnut genotypes to graft take success. Sarhad J. Agric. 25(3): 399-403.

57 KNOWLEDGE FOR LIFE
Sultan, I., B. Farida (2016). Climate Change Impact on Mountain Biodiversity: A Special
Reference to Gilgit-Baltistan of Pakistan, Journal of Mountain Area Research,
https://www.researchgate.net/publication/307633889_Journal_of_Mountain_Area_Research
_CLIMATE_CHANGE_IMPACT_ON_MOUNTAIN_BIODIVERSITY_A_SPECIAL_REFEREN
CE_TO_GILGIT-BALTISTAN_OF_PAKISTAN
WTX (World’s Walnut Exports Data http://www.worldstopexports.com/top-walnuts-exporters-by-country/

1 KNOWLEDGE FOR LIFE
Annexure-4 A: Walnut Cluster: Analysis for Economic Returns and Feasibility, GB Highland
Analysis for Economic Returns, Costs and Investments in GB Input value Increment Year 1 Year 2 Year 3 Year 4 Year 5 Year 6 Year 7 Year 8 Year 9 Y10
Baseline Situation (2016): Acreage, yield, production and value
Area under walnut cultivation (base year 2016) (ha)
422
1,887
1,887
1,887
1,887
1,887
1,887
1,887
1,887
1,887
1,887
Production (tonne)
2,875
16,271
16,271
16,271
16,271
16,271
16,271
16,271
16,271
16,271
16,271
Default yield (tonne/ha) 6.81 6.81
6.87
6.92
6.98
7.03
7.09
7.15
7.20
7.26
7.32
Growth in yield 0.40%
Expected production without intervention (tonne/ha)
2,875
2,898
2,921
2,945
2,968
2,992
3,016
3,040
3,064
3,089
Farmgate price (US$/tonne)
1,150
Total value of production at farmgate before intervention (US$) 3,306,250 3,332,700 3,359,362 3,386,236 3,413,326 3,440,633 3,468,158 3,495,903 3,523,871 3,552,062
Increase production by rennovating/ replanting 30% of total orchard area with HYVs
Total percentage of area where orchards would be renovated in five years 30%
Incremental for area
Percentage of area for orchard renovation (%) 6% 6% 12% 18% 24% 30%
Area on which orchards would be renovated (ha)
25.32
50.64
75.96
101.28
126.60
Assumed yield increased from renovated orchards (%) 30% 6% (Gestation Period)
Additional production from renovated garden (t)
54
109
164
221
278
Expected additional value aof production due to renovation of garden (US$)
61,931
124,854
188,779
253,719
319,686
Value added processing and quality improvement for high end domestic and export markets
Incremental
Percentage of production processed (deshelled and packed) for high-end domestic and export market (%) 10% 2.5%
Incremental percentage of production to be deshelled and packed every year (%) 2.5% 5% 8% 10% 10% 10% 10% 10% 10%
Conversion factor 45%
Walnut production to be used for deshelling and packing (t)
72
146
221
297
6,492
12,787
19,182
25,678
32,277

59 KNOWLEDGE FOR LIFE
Price of deshelled and packed walnut (US$/tonne) 3500
Revenue from deshelled/ processed walnuts domestic market (US$)
253,575
511,207
772,945
1,038,838
22,723,137
44,754,318
67,136,543
89,874,020
112,971,000
% of the inshell walnuts processed to produce oil 5% 1.3%
Percentage of shelled walnuts processed to produce oil every year 1.3% 3% 4% 5% 5% 5% 5% 5% 5%
Shelled walnuts to be used in oil every year (t)
1
4
8
15
325
639
959
1,284
1,614
Moisture content 90.0%
Dried walnut
1
3
7
13
292
575
863
1,156
1,452
Conversion factor from fresh walnut to oil (10% moisture content and 8.33% oil from dried walnut) 8.33%
Production of walnut oil produced (t) 0.1 0.3 0.6 1.1 1.2 2.4 3.6 4.8 6.0
Price of walnut oil (US$/tonne)
25,000
Value from oil making (US$) 1697 6844 15522 27815 30421 59915 89879 120319 151240
Total expected incremental returns from all interventions (US$ '000)
255,272
518,051
788,467
1,066,653
22,815,489
44,939,086
67,415,201
90,248,058
113,441,925
Operating costs
Acreage in gestation
25
51
76
101
127
101
76
51
25
Cost on the management of young garden
760
19,243
38,486
57,730
76,973
96,216
76,973
57,730
38,486
19,243
Cost of renovating the garden -Labor and other input cost only (US$/tonne)
3,500
88,620
88,620
88,620
88,620
88,620
Deshelling with raw material costs (US$/tonne)
1,287
93,231
187,954
284,187
381,947
8,354,567
16,454,723
24,683,947
33,043,786
41,535,803
Oil extraction with raw material (US$/tonne)
1,805
1,635
6,592
14,952
26,793
586,068
1,154,290
1,731,565
2,318,003
2,913,714

60 KNOWLEDGE FOR LIFE
Local transportation costs (US$/tonne)
15
1
4
9
17
18
36
54
72
91
National transportation cost (US$/tonne)
72
0
0
1
1
1
2
4
5
6
Marketing costs (% on turnover) 1%
8,320
16,650
24,970
33,300
33,340
33,370
33,390
33,390
33,390
Total operating costs (US$ '000)
88.6
211.1
338.3
470.5
607.7 9,070.2 17,719.4 26,506.7 35,433.7 44,502.2
Capital Costs Unit cost
(US$) increment
Strengthening research 500,000 200,000.0 150,000.0 50,000.0 50,000.0 50,000.0
Capacity Building trainings for improved management practices (comprehensive campaign every year)
26049 10420 7815 3907 2605 1302
Renovation /replantation of existing orchard area-Plant cost only (US$/ha)
443100 3,500
88,620
88,620
88,620
88,620
88,620
Establishment of certified walnut nurseries 52136 52136
Deshelling costs 6,917,750 59
-
-
-
-
- 1,289,750 1,407,000 1,407,000 1,407,000 1,407,000
Oil extraction costs
1,830,000 15
-
-
-
-
-
366,000
366,000
366,000
366,000
366,000
Government loans on private investment 962,253
-
-
-
-
-
182,133
195,030
195,030
195,030
195,030
Total Investments (US$ '000)
10,731,288
351
246
143
141
140
1,838
1,968
1,968
1,968
1,968
Total Gross Revenue (000 US$) 228,046
255
518
788
1,067
22,815
44,939
67,415
90,248 113,442
Total operating costs (US$ '000)
90,358
211
338
470
608
9,070
17,719
26,507
35,434
44,502
Total Capital Investments (US$ '000) 8,763
351
246
143
141
140
1,838
1,968
1,968
1,968
1,968
Cash Flow (US$ '000) 128,926 -
351 -
202
37
177
319
11,907
25,252
38,940
52,846
66,972
Discount rate 8.5%
NPV (US$ '000) 96,693
IRR 143%

61 KNOWLEDGE FOR LIFE
Annexure 4 B: Walnut Cluster: Analysis for Economic Returns, KP
Analysis for Economic Returns, Costs and Investments in GB Input value Increment Year 1 Year 2 Year 3 Year 4 Year 5 Year 6 Year 7 Year 8 Year 9 Y10
Baseline Situation (2016): Acreage, yield, production and value
Area under walnut cultivation (base year 2016) (ha)
630
1,887
1,887
1,887
1,887
1,887
1,887
1,887
1,887
1,887
1,887
Production (tonne)
6,328
16,271
16,271
16,271
16,271
16,271
16,271
16,271
16,271
16,271
16,271
Default yield (tonne/ha) 10.04 10.04
10.12
10.21
10.29
10.37
10.45
10.54
10.62
10.71
10.79
Growth in yield 0.40%
Expected production without intervention (tonne/ha)
6,328
6,379
6,430
6,481
6,533
6,585
6,638
6,691
6,745
6,798
Wholesale price (US$/tonne)
1,150
Total value of production at farmgate before intervention (US$)
7,277,200
7,335,418
7,394,101
7,453,254
7,512,880
7,572,983
7,633,567
7,694,635
7,756,192
7,818,242
Increase production by rennovating/ replanting 30% of total orchard area with HYVs
Total percentage of area where orchards would be renovated in five years 30%
Incremental for area
Percentage of area for orchard renovation (%) 6% 6% 12% 18% 24% 30%
Area on which orchards would be renovated (ha)
37.80
75.60
113.40
151.20
189.00
Assumed yield increased from renovated orchards (%) 30% 6% (Gestation Period)
Additional production from renovated garden (t)
119
239
361
486
612
Expected additional value aof production due to renovation of garden (US$)
136,314
274,808
415,510
558,446
703,642
Value added processing and quality improvement for high end domestic and export markets
Incremental
Percentage of production processed (deshelled and packed) for high-end domestic and export market (%) 10% 2.5%
Incremental percentage of production to be deshelled and packed every year (%) 2.5% 5% 8% 10% 10% 10% 10% 10% 10%
Conversion factor 45%

62 KNOWLEDGE FOR LIFE
Walnut production to be used for deshelling and packing (t)
159
321
486
653
14,290
28,145
42,220
56,519
71,044
Price of deshelled and packed walnut (US$/tonne) 3500
Revenue from deshelled/ processed walnuts domestic market (US$)
558,130
1,125,189
1,701,286
2,286,529
50,014,613
98,506,200
147,770,451
197,816,626
248,654,083
% of the inshell walnuts processed to produce oil 5% 1.3%
Percentage of shelled walnuts processed to produce oil every year 1.3% 3% 4% 5% 5% 5% 5% 5% 5%
Shelled walnuts to be used in oil every year (t)
2
8
18
33
714
1,407
2,111
2,826
3,552
Moisture content 90.0%
Dried walnut
2
7
16
29
643
1,267
1,900
2,543
3,197
Conversion factor from fresh walnut to oil (10% moisture content and 8.33% oil from dried walnut) 8.33%
Production of walnut oil produced (t) 0.1 0.6 1.4 2.4 2.7 5.3 7.9 10.6 13.3
Price of walnut oil (US$/tonne)
25,000
Value from oil making (US$) 3736 15063 34164 61222 66957 131875 197828 264827 332886
Total expected incremental returns from all interventions (US$ '000)
561,866
1,140,253
1,735,450
2,347,750
50,217,883
98,912,883
148,383,789
198,639,899
249,690,610
Operating costs
Acreage in gestation
38
76
113
151
189
151
113
76
38
Cost on the management of young garden
760
28,728
57,456
86,184
114,912
143,640
114,912
86,184
57,456
28,728
Cost of renovating the garden -Labour and other input cost only (US$/tonne)
3,500
132,300
132,300
132,300
132,300
132,300
Deshelling with raw material costs (US$/tonne)
1,287
205,206
413,696
625,508
840,683
18,388,764
36,217,561
54,330,441
72,730,810
91,422,108
Oil extraction with raw material (US$/tonne)
1,805
3,599
14,510
32,909
58,973
1,289,962
2,540,642
3,811,251
5,102,026
6,413,211
Local transportation costs (US$/tonne)
15
2
9
20
37
40
79
119
159
200
National transportation cost (US$/tonne)
72
0
1
1
2
3
5
8
11
13
Marketing costs (% on turnover) 1%
8,320
16,650
24,970
33,300
33,340
33,370
33,390
33,390
33,390
Total operating costs (US$ '000)
132.3
378.2
634.6
901.9
1,180.2
19,855.7
38,906.6
58,261.4
77,923.9
97,897.6
Capital Costs Unit cost (US$) increment

63 KNOWLEDGE FOR LIFE
Strengthening research
500,000
200,000.0
150,000.0
50,000.0
50,000.0
50,000.0
Capacity Building trainings for improved management practices (comprehensive campaign every year)
38889 15556 11667 5833 3889 1944
Renovation /replantation of existing orchard area-Plant cost only (US$/ha)
661500
3,500
132,300
132,300
132,300
132,300
132,300
Establishment of certified walnut nurseries 52136 52136
Deshelling costs
15,223,000
130
-
-
-
-
-
2,927,500
3,044,600
3,044,600
3,044,600
3,161,700
Oil extraction costs
4,270,000 35
-
-
-
-
-
854,000
854,000
854,000
854,000
854,000
Government loans on private investment
2,144,230
-
-
-
-
-
415,965
428,846
428,846
428,846
441,727
Total Investments (US$ '000)
22,890
400
294
188
186
184
4,197
4,327
4,327
4,327
4,457
Total Gross Revenue (000 US$) 501,940
562
1,140
1,735
2,348
50,218
98,913 148,384 198,640 249,691
Total operating costs (US$ '000) 198,042
378
635
902
1,180
19,856
38,907
58,261
77,924
97,898
Total Capital Investments (US$ '000)
18,432
400
294
188
186
184
4,197
4,327
4,327
4,327
4,457
Cash Flow (US$ '000) 285,465 -
400 -
110
317
647
983
26,165
55,679
85,795 116,389 147,336
Discount rate 8.5%
NPV (US$ '000) 214,087
IRR 183%

64 KNOWLEDGE FOR LIFE
Annexure-5. Feasibility of Walnut Desheller
Capacity of walnut oil extraction per day (t of walnut) 6
Processing season (t) 90
Quantity of raw walnut that can be processed (t) 540
Year1 Year 2 Year 3 Year 4 Year 5 Year 6 Year 7 Year 8 Year 9 Year 10
Quantity of walnut walnut that can be processed (t) 540 540 540 540 540 540 540 540 540 540
Converttion factor from un-hulled to hulled 45% 45% 45% 45% 45% 45% 45% 45% 45% 45%
Reducing water content (5%) 95% 95% 95% 95% 95% 95% 95% 95% 95% 95%
Quantity of shelled walnut produced with required moisture level (T) 231
231
231
231
231
231
231
231
231 231
Price of raw unshelled walnut @ Rs.300/kg 1150 1150 1150 1150 1150 1150 1150 1150 1150 1150
Price of shelled walnut (US$/tonne) 3500 3500 3500 3500 3500 3500 3500 3500 3500 3500
Price of the walnut shells Rs. 100 per 40 kg (US$/tonne) 19 19 19 19 19 19 19 19 19 19
Revenues (US$) shelled walnut 807975 807975 807975 807975 807975 807975 807975 807975 807975 807975
Revenue from walnut shells 5500 5500 5500 5500 5500 5500 5500 5500 5500 5500
Total Revenue (US$) 813475 813475 813475 813475 813475 813475 813475 813475 813475 813475
Direct varaible costs
Raw material cost (US$) 621000 621000 621000 621000 621000 621000 621000 621000 621000 621000
Cost of operational capital (10% of the raw material cost) 5175 5175 5175 5175 5175 5175 5175 5175 5175 5175
Raw material transportation cost @US$15 per tonne (US$/TONNE) 8100 8100 8100 8100 8100 8100 8100 8100 8100 8100
Packing costs (@PKR5 per kg plastic packing) 8550 8550 8550 8550 8550 8550 8550 8550 8550 8550
Labor cost 23333 23333 23333 23333 23333 23333 23333 23333 23333 23333
Electricity and water @US$1500/month 18000 18000 18000 18000 18000 18000 18000 18000 18000 18000
Maintinance (1% of the machinery, equipment and furniture cost) 7855 7855 7855 7855 7855 7855 7855 7855 7855 7855
Land lease charges (5% increment on annual) 200 210 221 232 243 255 268 281 295 310

65 KNOWLEDGE FOR LIFE
Marketing @ US$ 10 per tonne 2,309 2,309
2,309
2,309
2,309
2,309
2,309
2,309
2,309 2,309
Office administration 370 370 370 370 370 370 370 370 370 370
Total variable cost including raw material 694892 694902 694913 694924 694935 694947 694960 694974 694988 695002
Gross profit 813475 813475 813475 813475 813475 813475 813475 813475 813475 813475
Indirect fixed cost
Machinery -117100
Licensing and regulatiry fee -150 0 0 0 0 0 0 0 0 0 0
Total -117250 0 0 0 0 0 0 0 0 0 0
Grand total cost -117250 694892 694902 694913 694924 694935 694947 694960 694974 694988 695002
Net profit (Net cash flow) -117250 118583 118573 118562 118551 118540 118528 118515 118501 118487 118473
NPV 0.085 608,781
IRR 101%
Additional operating cost including raw material 694892 694902 694913 694924 694935
per unit operating cost of value addition (US$/tonne) 1286.83741

66 KNOWLEDGE FOR LIFE
Annex 6. Feasibility of Oil Processing Plant
Capacity of walnut (shelled) processed per day (t of walnut) 1
Processing season (days) 100
Processing capacity of the whole season (t of shelled walnut) 100
Description Year1 Year 2 Year 3 Year 4 Year 5 Year 6 Year 7 Year 8 Year 9
Year 10
Processing capacity of the whole season (t of shelled walnut)
100 100 100 100 100 100 100 100 100 100
Reducing water content (5%) 95% 95% 95% 95% 95% 95% 95% 95% 95% 95%
Hulled walnut produced with required moisture level (T)
95
95
95
95
95
95
95
95
95
95
Conversion factor from hulled walnut to oil (T)
8% 8% 8% 8% 8% 8% 8% 8% 8% 8%
Quantity of walnut oil produced (t) per season
7.91
7.9
7.9
7.9
7.9
7.9
7.9
7.9
7.9
7.9
Price of the walnut oil @Rs. 2500 per kg (US$/tonne)
25000 25000 25000 25000 25000 25000 25000 25000 25000 25000
Price of raw shelled walnut 1600 1600 1600 1600 1600 1600 1600 1600 1600 1600
Price of the walnut cakes/powder@Rs. 40 per kg (US$/tonne)
148 148 148 148 148 148 148 148 148 148
Revenues (US$) from oil
197838 197838 197838 197838 197838 197838 197838 197838 197838 197838
Revenue from walnut straw 12902 12902 12902 12902 12902 12902 12902 12902 12902 12902
Total Revenue (US$) 210739 210739 210739 210739 210739 210739 210739 210739 210739 210739

67 KNOWLEDGE FOR LIFE
Direct variable costs
Raw material transportation cost @US$3 per tonne (US$/TONNE)
300 300 300 300 300 300 300 300 300 300
Raw material cost (US$) 160000 160000 160000 160000 160000 160000 160000 160000 160000 160000
Packing costs (@PKR20 per litre glass bottle packing)
1172 1172 1172 1172 1172 1172 1172 1172 1172 1172
Labour cost 15000 15000 15750 16538 17364 18233 19144 20101 21107 22162
Electricity and water 2200 2200 2200 2200 2200 2200 2200 2200 2200 2200
Maintenance (1% of the machinery, equipment and furniture cost)
1220 1220 1220 1220 1220 1220 1220 1220 1220 1220
Land lease charges (5% increment on annual)
200 210 221 232 243 255 268 281 295 310
Marketing @ US$ 10 per tonne 79 79 79 79 79 79 79 79 79 79
Office administration 370 370 370 370 370 370 370 370 370 370
Total variable cost including raw material 180542 180552 181312 182111 182949 183830 184754 185725 186744 187814
Gross profit 210739 210739 210739 210739 210739 210739 210739 210739 210739 210739
Indirect fixed cost
Machinery -122000
Licensing and regulatory fee -150 0 0 0 0 0 0 0 0 0 0
Total -122150 0 0 0 0 0 0 0 0 0 0
Grand total cost -122150 180542 180552 181312 182111 182949 183830 184754 185725 186744 187814
Net profit (Net cash flow) -122150 30197 30187 29427 28628 27790 26909 25985 25014 23995 22925
NPV 8.5% 54,704
IRR 17%
Additional operating cost including raw material
180542 180552 181312 182111 182949
per unit operating cost of value addition (US$/tonne)
1805.418757