Database Query Analysis and Optimization in a Large Scale ...
84
Database Query Analysis and Optimization in a Large Scale Information System Case Study on Large Scale DHIS2 Implementations Mohamed Ameen Thesis submitted for the degree of Master in Informatics:Programming and System Architecture 60 credits Department of Informatics Faculty of mathematics and natural sciences UNIVERSITY OF OSLO Autumn 2021
-
Upload
khangminh22 -
Category
Documents
-
view
3 -
download
0
Transcript of Database Query Analysis and Optimization in a Large Scale ...
Database Query Analysis andOptimization in a Large Scale
Information System
Case Study on Large Scale DHIS2Implementations
Mohamed Ameen
Thesis submitted for the degree ofMaster in Informatics:Programming and System
Architecture60 credits
Department of InformaticsFaculty of mathematics and natural sciences
UNIVERSITY OF OSLO
Autumn 2021

Database Query Analysisand Optimization in a
Large Scale InformationSystem
Case Study on Large Scale DHIS2Implementations
Mohamed Ameen

© 2021 Mohamed Ameen
Database Query Analysis and Optimization in a Large Scale InformationSystem
http://www.duo.uio.no/
Printed: Reprosentralen, University of Oslo
AbstractInformation Systems play an integral role in several aspects of busi-
nesses and society. They provide valuable insights by collecting and an-alyzing data and help optimal decision makings. With the advancementin technologies, the scale of information systems also increases. Modern re-quirements of Information systems demand high scalability to support verylarge-scale needs. Large-scale essentially means the data volume is largeand data access frequency is very high. Resolving bottlenecks and avoid-ing common pitfalls in Information systems is the key to achieving higherscalability.
DHIS2 is a web application originally designed for collecting, aggregat-ing, and analyzing statistical health data. DHIS2 is used in more than 73different countries, each with its implementation and use cases. Due to thecovid pandemic, the demand for a scalable DHIS2 system increased andCovid contact tracing and Covid vaccination tracking. Even though DHIS2is used mainly in the Health domain, there are also implementations ofDHIS2 in other sectors like Education. Some of these implementationsneed to support a country-wide scale. Such large-scale DHIS2 implementa-tions frequently suffer from performance issues and bottlenecks.
This thesis aims to study the types of performance issues faced by large-scale Information Systems. I focus on various large-scale DHIS2 imple-mentations and investigate the bottlenecks both on the application sideand database side of DHIS2. The thesis also aims at finding out optimiza-tion techniques and changes to improve performance and clear these bot-tlenecks. The results of this research are generalized in such a way thatthey can be applied to any Information system and not just DHIS2. Theresults show successful optimization changes and how much of an impactthese changes have had on the performance of real-world large-scale DHIS2implementations. Qualitative analysis of the performance improvement isdone to understand the impact of each optimization.
i
AcknowledgementsFirst, I would like to give a big thanks to my supervisor Sundeep Sahay
for his guidance throughout the research. I was very new to Academic writ-ing. He guided me in the right direction and gave me valuable insights intohow best to express my work.
I would also like to thank the DHIS2 Core Development team for theircollaboration in this research. Thanks to Bob Joliffe for his valuable inputsto my research. His experience helped me learn a lot and contribute to as-sisting several country implementations. A big thanks to Gintare Vilkelyteand Stian Sandvold of the DHIS2 Core team. Collaborating with them wasone of the best experiences throughout this research work. Special thanksto all the HISP Nodes and System administrators of the DHIS2 implemen-tations part of my research. Pamod Amarakoon from HISP Sri Lanka andBarnabas from HISP Nigeria were very supportive and were happy to an-swer all of my queries. This research work would not have been possiblewithout all of you.
Last but not least, I want to thank my wife, Shamna, and my daughter,Ayana, for encouraging and supporting me continuously throughout thisthesis work. They have kept me motivated during my research work withtheir positive and kind words.
ii
Contents
1 Introduction 11.1 Motivation . . . . . . . . . . . . . . . . . . . . . . . . . . . . . . 11.2 Research Question, Objective and Scope . . . . . . . . . . . . . 21.3 Thesis Structure and Overview . . . . . . . . . . . . . . . . . . 3
2 Background 42.1 DHIS2 Platform . . . . . . . . . . . . . . . . . . . . . . . . . . . 4
2.1.1 Technology . . . . . . . . . . . . . . . . . . . . . . . . . . 42.1.2 Functionality . . . . . . . . . . . . . . . . . . . . . . . . 5
2.2 DHIS2 Implementations . . . . . . . . . . . . . . . . . . . . . . 6
3 Research Methodology 83.1 Research Process and Collaboration . . . . . . . . . . . . . . . 83.2 Ethical Obligation and Challenges . . . . . . . . . . . . . . . . 10
4 Literature Review 124.1 Bottlenecks . . . . . . . . . . . . . . . . . . . . . . . . . . . . . . 124.2 Performance Analysis . . . . . . . . . . . . . . . . . . . . . . . . 124.3 Optimization . . . . . . . . . . . . . . . . . . . . . . . . . . . . . 134.4 Limitations . . . . . . . . . . . . . . . . . . . . . . . . . . . . . . 144.5 Summary . . . . . . . . . . . . . . . . . . . . . . . . . . . . . . . 15
5 Performance Analysis 165.1 Data Source Bottlenecks . . . . . . . . . . . . . . . . . . . . . . 21
5.1.1 In-Efficient Queries . . . . . . . . . . . . . . . . . . . . . 215.1.2 Absence of Indexes . . . . . . . . . . . . . . . . . . . . . 24
5.2 Application Bottlenecks . . . . . . . . . . . . . . . . . . . . . . 325.2.1 In-efficient API Access Pattern . . . . . . . . . . . . . . 335.2.2 ORM Pitfalls . . . . . . . . . . . . . . . . . . . . . . . . . 365.2.3 In-Efficient Resource Utilization . . . . . . . . . . . . . 39
6 Optimizations and Results 426.1 Database Optimizations . . . . . . . . . . . . . . . . . . . . . . 44
6.1.1 Query Rewriting . . . . . . . . . . . . . . . . . . . . . . . 446.1.2 Indexing . . . . . . . . . . . . . . . . . . . . . . . . . . . 466.1.3 Summary of Results . . . . . . . . . . . . . . . . . . . . 54
6.2 Application Optimizations . . . . . . . . . . . . . . . . . . . . . 556.2.1 Efficient API Access Pattern . . . . . . . . . . . . . . . . 556.2.2 Avoiding ORM pitfalls . . . . . . . . . . . . . . . . . . . 576.2.3 Connection Pooling . . . . . . . . . . . . . . . . . . . . . 586.2.4 Summary of Results . . . . . . . . . . . . . . . . . . . . 60
7 Discussion 61
8 Conclusion 68
A Appendix 72
iii
List of Tables1 Three Principal Layers in the context of DHIS2 . . . . . . . . 162 DHIS2 Tracker Metadata Concepts . . . . . . . . . . . . . . . . 173 DHIS2 Tracker Data Concepts . . . . . . . . . . . . . . . . . . 204 SMART goals for DHIS2 optimizations . . . . . . . . . . . . . . 425 Database Optimization Results . . . . . . . . . . . . . . . . . . 546 Application Optimization Results . . . . . . . . . . . . . . . . . 60
iv

Listings1 Identified In-Efficient Query . . . . . . . . . . . . . . . . . . . . 222 Slow Query reported by Nigeria DHIS2 Vaccination Instance 243 Slow attribute search query reported by Rwanda DHIS2 Vac-
cination Instance . . . . . . . . . . . . . . . . . . . . . . . . . . 264 Slow QR Code search query reported by Nigeria DHIS2 Vac-
cination Instance . . . . . . . . . . . . . . . . . . . . . . . . . . 295 Request Payload example for single event data value update
API . . . . . . . . . . . . . . . . . . . . . . . . . . . . . . . . . . 366 Java code snippet showing a common ORM anti-pattern . . . 387 Optimized Rewritten Query . . . . . . . . . . . . . . . . . . . . 458 Creating a functional index on lower(value) . . . . . . . . . . . 499 Creating a partial trigram gin index on lower(value) . . . . . . 5110 Creating a trigram gin index on a jsonb column for a specific
attribute . . . . . . . . . . . . . . . . . . . . . . . . . . . . . . . 5211 Request Payload example for Event Update API that collec-
tively updates all event data values . . . . . . . . . . . . . . . 56
v
List of Figures1 Number of DHIS2 Tracker implementations over the years . . 72 Entity-Relationship diagram of tables in DHIS2 Tracker . . . 193 Query plan node that consumes the most time . . . . . . . . . 254 Query plan node details showing the filter applied . . . . . . . 265 The bottleneck Query plan node in Rwanda . . . . . . . . . . 276 Query plan node details showing the like comparison filter
with double ended wildcard (%) . . . . . . . . . . . . . . . . . . 287 Query plan node in Nigeria that shows bottleneck with QR
code searches . . . . . . . . . . . . . . . . . . . . . . . . . . . . 308 Query plan node details from Nigeria showing the like com-
parison filter with double ended wildcard (%) . . . . . . . . . . 319 Tracker Capture App in Sri-Lanka with 5 to 10 input fields . 3410 Updated input fields shown with green background colour in
Tracker Capture App . . . . . . . . . . . . . . . . . . . . . . . . 3511 Response timing of single event data value update API . . . . 3612 Glowroot Slow Trace showing 1GB Memory allocated for a
single API request . . . . . . . . . . . . . . . . . . . . . . . . . . 4013 Munin dashboard showing CPU struggling due to sub-optimal
resource utilization . . . . . . . . . . . . . . . . . . . . . . . . . 4114 B-Tree index structure . . . . . . . . . . . . . . . . . . . . . . . 4715 Using bitmaps for table access through multiple indexes . . . 4916 Optimized Query plan node in Rwanda showing the new in-
dex being used effectively. . . . . . . . . . . . . . . . . . . . . . 5117 Optimized Query plan node in Nigeria showing the new index
being used effectively. . . . . . . . . . . . . . . . . . . . . . . . . 5318 Rewritten App user interface for collective event data values
updation. . . . . . . . . . . . . . . . . . . . . . . . . . . . . . . . 5519 Response timing of Event Update API that collectively up-
dates all event data values . . . . . . . . . . . . . . . . . . . . . 5720 Lower Memory allocation for the purpose-built API as recorded
by Glowroot . . . . . . . . . . . . . . . . . . . . . . . . . . . . . 5821 Glowroot Guage chart showing the effect of the optimization
on CPU load . . . . . . . . . . . . . . . . . . . . . . . . . . . . . 5922 How ORM works . . . . . . . . . . . . . . . . . . . . . . . . . . 6523 How NORM works . . . . . . . . . . . . . . . . . . . . . . . . . 6624 Statistics from field, presented by Lars Øverland, Tech Lead
DHIS2, during the DHIS2 Symposium 2021 [24] . . . . . . . . 7225 Performance Improvement from 2.34.3 to 2.34.4, presented by
Lars Øverland, Tech Lead DHIS2, during the DHIS2 Sympo-sium 2021 [24] . . . . . . . . . . . . . . . . . . . . . . . . . . . . 73
26 Munin dashboard showing Disk Latency issue in Sri Lankathat caused excessive database locking. [12] . . . . . . . . . . . 73
vi
AcronymsAPI Application Programming Interface.
APM Application Performance Management.
CPU Central Processing Unit.
CSS Cascading Style Sheets.
DHIS2 Digital Health Information Software 2.
GIN Generalized Inverted Index.
HIS Health Information Systems.
HISP Health Information System Program.
HMIS Health Management Information System.
HTML HyperText Markup Language.
IoC Inversion of Control.
IS Information Systems.
IT Information Technology.
JEE Java Enterprise Edition.
JRE Java Runtime Environment.
MOH Ministry of Health.
NGO Non-Governmental Organisation.
ORM Object-Relational Mapping.
QA Quality Assurance.
REST Representational State Transfer.
SQL Structured Query Language.
SSD Solid State Drive.
UiO University of Oslo.
WAR Web ARchive.
WHO World Health Organisation.
vii
1 IntroductionModern Information Systems (IS) are used in various fields and with
varying scopes. It plays an integral role in business and society. It pro-vides valuable insights by collecting and analyzing data and helps in opti-mal decision-making. Information systems occasionally suffer from perfor-mance bottlenecks due to high data volume or high data access rates. Withthe advancement in technologies, IS should be able to scale up to supportlarge-scale concrete implementations. Resolving bottlenecks and avoidingcommon performance pitfalls in Information systems is the key to achievinghigher scalability. One such large scale IS is the Digital Health InformationSoftware 2 (DHIS2).
DHIS2 is a global platform developed by the research group Health In-formation System Program (HISP) under the Department of Informatics atthe University of Oslo (UiO) for collecting and aggregating health statis-tics. Governments in over 73 countries have adopted DHIS2 [8]. Thesecountries are primarily but not limited to developing countries in Africaand Asia. Several prominent NGO’s, including the World Health Organi-sation (WHO), have adopted DHIS2 for their data collection, aggregation,and analysis needs.
Such global adoption of DHIS2 has led to the establishment of severalconcrete implementations on varying scales across the globe. Some imple-mentations cater to a small region, like a district/state/province, within acountry, whereas other implementations cater to nationwide scope support-ing the whole population of that country. When the scale of a DHIS2 imple-mentation increases, so do the performance issues faced by that instance.
1.1 MotivationScalability is a Non-functional requirement for any large-scale Informa-
tion System. There is always room for optimizations that can improve thescalability of an enterprise application. The usefulness of any applicationquickly deters if it has severe bottlenecks and cannot sustain the real-worldpractical load. Some of the major bottlenecks are due to well-known anti-patterns and developer errors. One of my motivations was to help users oflarge-scale Information systems to achieve their desired productivity.
As part of my case study, I focus on large-scale DHIS2 implementations.DHIS2 is the world’s most used health information management systemthat aids in the public health of numerous countries. It continues to grow,and more countries are adopting the platform. The continued adoptionand growth of DHIS2 in various countries and the diverse implementationsmake scalability and availability high priority non-functional requirementsfor DHIS2.
Over the years, DHIS2 is also being used at a national scale by Ministryof Health (MOH) of the respective countries for collecting, aggregating, and
1
analyzing their country health data. Such large-scale implementation of-ten faces performance issues that block them from using DHIS2 temporar-ily. These may either be due to server crashes, slow response times, orunavailability of any kind. Due to such performance issues when adoptingon a large-scale, other countries or governments may get discouraged touse DHIS2 for their large-scale needs. In a time-critical implementation,there have been reports where users of DHIS2 have had to either switchto paper-based reporting or excel based recording and suffer a decrease intheir productivity due to performance issues that affect DHIS2 usability.These bottlenecks have to be investigated and resolved to ensure DHIS2continues to influence the different socio-economic efforts across the globe.I wanted to support the performance analysis investigations and bottleneckresolutions for large-scale implementations so that DHIS2 continues to beused effectively for even larger scale requirements and domains.
1.2 Research Question, Objective and ScopeThe objective of this thesis is to analyze and optimize database queries in
large-scale Information Systems. I focus on DHIS2 implementations, as itfits the criteria of a large-scale Information System interacting with a rela-tional database. I analyze the different database queries involved in theInformation system and attempt to resolve the performance bottlenecksusing optimization techniques available in the existing literature. I alsoempirically evaluate how several optimization changes have had an impacton the performance of this large-scale DHIS2 implementations. The analy-sis is then generalized to make it applicable to any large-scale InformationSystem.
In this thesis, I focus on the following three research questions:
1. What are the different performance issues faced by a large-scale In-formation System? How does it affect the user’s day-to-day work?
2. What are some of the optimization techniques available to mitigateperformance bottlenecks in a large-scale Information System like DHIS2?
3. What is the impact of the optimizations on DHIS2?
To address these research questions, I look at the DHIS2 version 2.34and 2.35 along with PostgreSQL version 10.
The scope of this thesis is limited to the actual DHIS2 application sourcecode and the PostgreSQL database. Other factors like Networking prob-lems, Data storage or disk latencies, or other infrastructure-related bottle-necks or performance issues are outside the scope of this thesis.
2
1.3 Thesis Structure and OverviewThis thesis contains the following chapters
Chapter 1: Introduction The current chapter briefs about my mo-tivation and why I chose to focus on large-scale DHIS2 implementations. Ialso explain the research questions, objective, and scope of this thesis.
Chapter 2: Background In this chapter, I introduce the DHIS2platform and briefly look at its history and how it has evolved into the go-tohealth information system. I touch upon the technology and functionalityof DHIS2 along with some insights into the real-world concrete large-scaleDHIS2 implementations that form the basis of my research.
Chapter 3: Research Methodology In this chapter, I presentthe research methodology that I used and the different data collection meth-ods. I also explain the collaboration, ethical obligations, and challengesfaced during the research process.
Chapter 4: Literature Review In this chapter, I present a reviewof existing literature that is related to my work. I conclude with a summaryof my contribution to the literature.
Chapter 5: Performance Analysis In this chapter, I focus onperformance analysis and identifying issues and bottlenecks faced by large-scale production DHIS2 instances and how it affects DHIS2 usability. Ihave characterized the performance issues into categories and subcate-gories to explain them in detail.
Chapter 6: Optimizations and Results In this chapter, I ex-plain the different optimizations that resolved the performance issues en-listed in Chapter 4. Empirical evaluation of the optimizations is detailed.
Chapter 7: Discussion In this chapter, I discuss the identified bot-tlenecks, the optimizations applied, and the results of the optimizations. Ialso give a brief explanation of some of the limitations of some optimiza-tions. I answer the research questions in this chapter.
Chapter 8: Conclusion In this chapter, I conclude the thesis witha summary of my work and how it answers the research questions. I alsohint at some suggested future work.
3
2 Background2.1 DHIS2 Platform
HISP originated in South Africa in 1996 as a project for improving healthservices for the post-apartheid period in South Africa [1]. Researchers fromthe University of Oslo were part of the HISP team. HISP saw the need for aunified health information system as a way to battle inequity in healthcare.These resulted in the origin of DHIS. They started developing a system forcollecting and aggregating health data and introduced it in three healthdistricts in Cape Town, South Africa, in 1998. DHIS continued to growduring the early 2000s and spread to multiple countries in Africa and Asia.The early DHIS system was used primarily for routine health reporting.The scale of the system was also quite small and was often limited to healthfacilities in certain districts alone. The frequency of reporting was alsoquite less, often once a month. The optimizations done for the early DHISsystem were mainly around analytics processing. Transactional processingwas not a feature in DHIS in the earlier system. Early DHIS served as anOLAP (Online Analytical Processing) system like a data warehouse insteadof an OLTP (Online Transaction Processing) system.
2.1.1 TechnologyDHIS2 is a flexible platform written primarily in Java. Any system where
there exists a Java Runtime Environment (JRE) can run DHIS2 with aJava-enabled server or servlet container. A relational database accompa-nies the Java backend. PostgreSQL is the supported database[11].
The Java backend consists of a set of RESTful Web API to interact withvarious resources and perform functions within the DHIS2 system. TheDHIS2 core also consists of core apps created with web technologies likeJavascript, CSS and HTML5. Both core apps and the Java backend arebundled together in the form of a Web ARchive (WAR) format. The pri-mary technologies and frameworks used in developing DHIS2 backend areJava Enterprise Edition (JEE) technology, Spring Inversion of Control (IoC)Framework and Hibernate Object-Relational Mapping (ORM) Framework[25].
The performance of the RESTful APIs affects the overall performance ofa DHIS2 instance. The performance of individual database queries affectsthe performance of the corresponding RESTful APIs.
4
2.1.2 FunctionalityDHIS2 is used to collect, validate, analyze, and present data. It is pri-
marily used for aggregate and patient-based data for health informationmanagement purposes. Some of its key features are[27]:
• ”Provide data entry tools which can either be in the form of standardlists or tables or can be customized to replicate paper forms.”
• ”Supports data collection and analysis of transactional or disaggre-gated data.”
• ”Flexible and dynamic (on-the-fly) data analysis in the analytics mod-ules (like GIS, Pivot Tables, Data Visualizer, Event reports).”
• ”Using the DHIS2 Web-API, allows for integration with external soft-ware and extension of the core platform through the use of customapps.”
• ”Further modules can be developed and integrated as per user needs,either as part of the DHIS2 portal user interface or a more loosely-coupled external application interacting through the DHIS2 Web-API.”
The initial DHIS was designed for the specific situation in South Africa.HISP saw the need for modifications as the design did not sufficiently sup-port the diverse needs of other nations. Modularity and flexibility becameessential design goals for the next iteration. HISP wanted the system tobe easily tailored and configured to suit any administration. In 2004 theystarted the development of DHIS2 as a modular web application. It wasreleased in 2006 and has been in continuous development from then un-til today[2]. Over the years, countries and other implementations saw theneed for online transaction processing features in DHIS2. These includedthe capability to track a specific entity over a period and to be able to cap-ture and fetch data associated with the tracked entity. The early DHIS wasnever optimized for high transaction rates until OLTP requirements wereneeded.
Currently, DHIS2 has two main components. The Aggregate componenthas analytical processing capabilities. The Tracker component has onlinetransactional processing capabilities. The Aggregate component is similarto any traditional Health Management Information System (HMIS), wheredata is reported in aggregate format. For example, the total number ofcases of a specific disease in a given district for one month was capturedon paper forms and submitted to a central office for manual entry into adatabase. This kind of data collection was necessary when computers andthe internet were a rarity. But the time delay in reporting made it difficultto take prompt action for addressing any issues that the data revealed. Theaggregated nature of the data also made it impossible to isolate and follow-up with an individual patient or case. Here is where the Tracker componentprovides a solution.
5
DHIS2 Tracker is a component that expands the DHIS2 data model fromaggregate to individual-level data that turns DHIS2 into a powerful tool formanaging patient care workflows on a facility or community level. For ex-ample, within a Tracker program, you can configure SMS reminders, trackmissed appointments and generate visit schedules for individual patients.The Tracker component also provides a simple tool for sharing critical clin-ical health data across multiple health facilities, including linking Trackerto an Electronic Medical Record (EMR) system.
In this thesis, DHIS2 Tracker versions 2.34 and 2.35 were analyzed forperformance bottlenecks.
2.2 DHIS2 ImplementationsThere are several DHIS2 Implementations across the globe. At the time
of writing this thesis, DHIS2 serves as the primary solution for collectingand analyzing health data in over 70 countries [9]. In some countries, thereare national-level implementations for specific contexts like Measles Immu-nization or Covid Contact tracing. Some countries may also have multipleimplementations for various contexts. For example, Sri Lanka has separateDHIS2 implementations for Covid Vaccination Tracking and Covid Contacttracing. Similarly, there are countries where DHIS2 is used both in theHealth domain and Education domain as separate implementations.
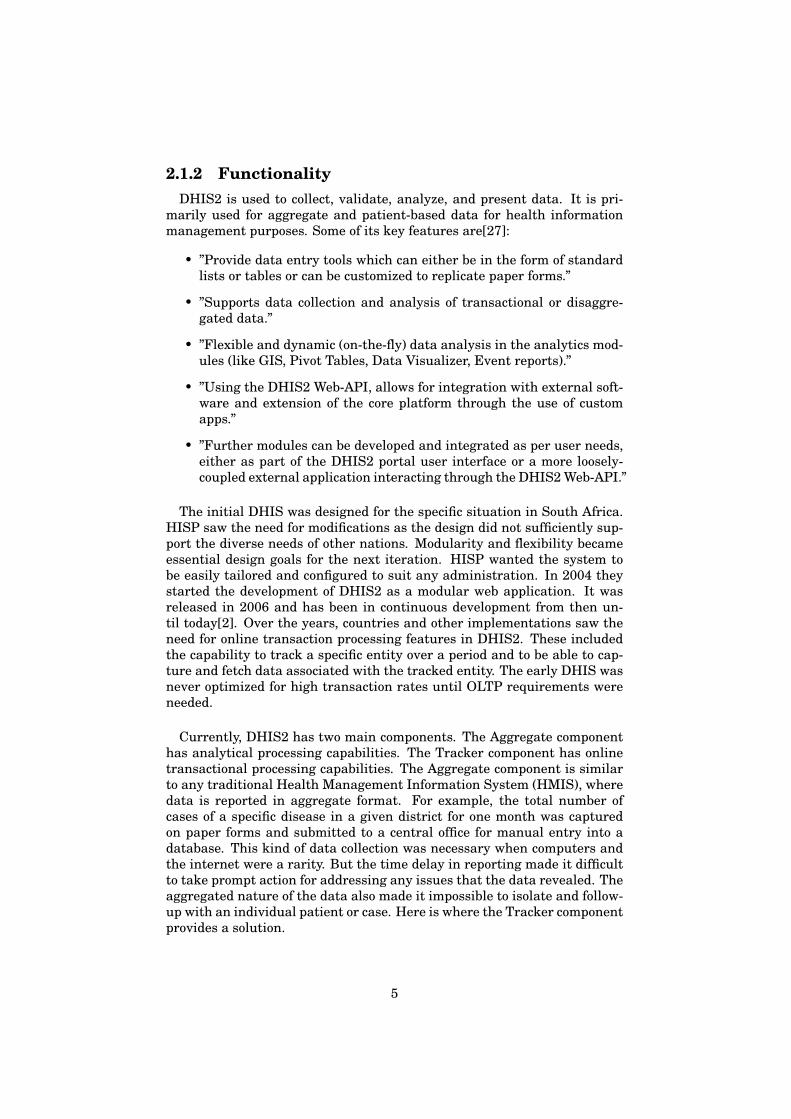
DHIS2 implementations around the globe use either one or both of thecomponents of DHIS2. Although the DHIS2 Tracker was first developedin 2010, there were very few implementations using it initially. Since2016 there has been an increased demand and requirement of the DHIS2Tracker module for several concrete implementations. The figure 1 showsthe rise in the adoption of the DHIS2 Tracker module from 2010 to 2021[10].The number of implementations using DHIS2 has almost doubled everyyear since 2016. The Covid Pandemic outbreak in 2019 resulted in sev-eral concrete DHIS2 Tracker implementations created for Covid ContactTracing and Covid Vaccination Tracking. These national-level implementa-tions have politically high visibility. Performance bottlenecks faced by suchhigh-profile national-scale instances are not just an inconvenience, but anational crisis. Therefore the context of this thesis is important and time-critical. Performance analysis and optimization of database queries had tobe completed in hours and days rather than weeks and months. This wasalso a motivation for me as I was able to work with the DHIS2 Core Teamto help the different countries to ensure their national health efforts likeVaccination campaigns and Immunization campaigns become a success.
This kind of global adoption also increases the demand for better scala-bility. During my thesis work, I was able to support multiple large-scaleimplementations when they faced a crisis due to bottlenecks and perfor-mance issues in DHIS2. Some of the performance issues only surface onlarge-scale implementation. Those were the areas of potential improve-ment and optimization. In small-scale implementations, such botttlenecks
6
Figure 1: Number of DHIS2 Tracker implementations over the years
remain hidden. The performance issues explored and investigated in thisthesis were mainly from the following large-scale DHIS2 Tracker imple-mentations
• Bangladesh - Measles Immunization Tracking Instance [28]
• Sri Lanka - Covid Vaccination Tracking instance [29]
• Rwanda - Covid Vaccination Tracking instance [30]
• Nigeria - Covid Vaccination Tracking instance
• PEPFAR - DATIM instance
Supporting the large-scale implementations when they face performanceissues is crucial for the continued adoption and growth of DHIS2. Theseperformance issues make DHIS2 unusable in most cases, which forces coun-tries to look for alternatives like paper-based reporting. Such incidents alsodiscourage future potential implementers from using DHIS2 on their large-scale information system requirements.
In the next chapter, I define the research methodology used and explainthe steps involved in the research process. I also list the data collectionmethods used for this thesis.
7
3 Research MethodologyThis chapter describes the research methodology used in this thesis. I
also describe the different data collection methods used for this work. Iexplain how the data collected were analyzed to achieve the optimizationgoals and answer the research questions. I reflect on some ethical andlawful considerations along with describing challenges faced during the re-search work.
The main objective of the study was to identify and resolve performancebottlenecks in a large-scale enterprise application. Bottleneck identifica-tion was scoped to include the Application Code and the Database interac-tions. To illustrate the issues and analyze the impacts of optimizations, Iused several large-scale DHIS2 implementations as the basis for my study.
Empirical research is a type of research methodology that uses verifi-able evidence to arrive at research outcomes. In other words, this type ofresearch relies solely on evidence obtained through observation or scien-tific data collection methods. Empirical research on the research questionsstated in section 1.2 has been done. I have chosen the DHIS2 Tracker mod-ule as the context of my research. This was chosen because it fits perfectlyinto the category of Large Scale Information systems and because of its rel-evance in these pandemic times. I observed various large-scale DHIS2 im-plementations to perform my case study. Due to the recent Covid pandemic,it was very important to help identify bottlenecks and resolve them withoptimizations as fast as possible. Several countries were using DHIS2 fortheir Covid Vaccination tracking needs as well as other use cases. DHIS2 isan open-source information system software and serves as a digital globalpublic good. Hence, ensuring scalability by bottleneck optimization is nec-essary for DHIS2 to remain a useful global public good.
This work does not follow analytical, mathematical optimization meth-ods, but is rather based on an empirical approach. My approach was basedon first identifying performance bottlenecks and limitations in large-scaledata-intensive enterprise applications and then designing and implement-ing techniques to overcome these limitations. I focus on DHIS2 as part ofmy case study and the optimizations and findings are then generalized sothat they can be applied for most enterprise applications that interact witha relational database.
3.1 Research Process and CollaborationI work in the DHIS2 core development team. This gives me valuable
insights and first-hand information on the performance bottlenecks andlimitations that several large-scale DHIS2 implementations are facing. Ivolunteered to take part in performance analysis and experimenting opti-mizations to overcome these bottlenecks along with others in the DHIS2Core development team. This thesis was completed in collaboration withthe DHIS2 Core development, Quality Assurance (QA) team, and System
8
administrators (HISP Teams) of various large-scale DHIS2 implementa-tions.
First, I conducted a literature study of recent research papers on the lim-itations and potential optimizations for large-scale enterprise applicationsthat use the ORM framework and interact with relational databases. Theresults of this study allowed me to become familiar with the best practicesand expert recommendations on large-scale applications. It also revealedcommon anti-patterns that gave me an insight into possible problems totackle. To identify a potential bottleneck, I along with the DHIS2 core de-velopment team used monitoring tools like Glowroot and Munin and alsoreferred to relevant log files when required. After having collected can-didate opportunities for performance improvement, we verified the exis-tence of the bottleneck, by experimenting on our simulated performancetest environment. Once we had confirmed the presence of a shortcoming,we experimented with various optimization techniques to improve perfor-mance depending on the type of bottleneck. Next, we implemented theoptimization technique, while trying to generalize it and ensure use-caseindependence. Finally, we evaluated our implementation by comparing themodified system which uses our optimization technique, to the original un-modified system. For the evaluation, we used both the synthetic environ-ment and the real-world environment, where possible. In most cases, weused total execution time as the performance measure and also computedoverheads separately, when necessary.
When a performance issue is reported by System administrators of large-scale DHIS2 implementations, we first identify the underlying root causeof the specific performance bottleneck. Then optimization possibilities wereevaluated. In some cases, the evaluations were done and tested on the ac-tual production implementation of DHIS2 to make sure the bottleneck isresolved. Based on the evaluation results, the optimizations were releasedalong with the subsequent patch release of DHIS2 software. For the eval-uation, we used a test database representative of a real-world large-scaleDHIS2 implementation database. All comparisons and figures of optimiza-tion impact were done using the same application environment to ensure afair comparison of performance parameters.
We set up a performance testing environment backed by a database thatapproximately represented real-world DHIS2 databases of large-scale in-stances. This simulated environment helped us to benchmark optimiza-tions and analyze various performance metrics. During workload testing,workloads must be repeatable and easily reproducible to simulate multiplealternative scenarios with identical settings. We were able to reproduceseveral issues from the field in the performance environment and analyzethem in isolation in our performance test environment. We could exper-iment with various optimization techniques for the identified bottlenecksand the impacts could be studied in a controlled manner.
9

There were multiple sources in the data collection process. They arelisted below
1. I was in touch with system administrators of several large-scale DHIS2implementations. System administrators of DHIS2 implementationsin Rwanda, Sri Lanka, and Nigeria were all cooperative and support-ive of my research work. We had several informal discussions andinformation sharing using the Slack messaging platform.
2. Glowroot access was provided for observation in several large-scaleDHIS2 implementations. Glowroot provides a very useful dashboardwith Slow traces and breakdown of various performance metrics. Queryprocessing times, wait/block times, memory allocation, etc are some ofthe metrics shown in Glowroot slow trace. These slow traces can beexported, saved, and shared. Glowroot also has graphs to show theheap memory utilization and CPU load among other things. Requestand Response payload will not be saved by Glowroot which ensuresno confidential data (or Personally Identifiable Information) is visiblein the Glowroot dashboard. However, request parameters that mayinclude sub-strings of names and phone numbers will potentially beseen. But those were not exported or saved and were only used toidentify the access pattern to be able to reproduce them in a simu-lated environment.
3. Application logs and PostgreSQL logs were shared by System main-tainers to help the investigation. Only the relevant error stack tracesin the logs were shared and this reduces the risk of sharing any confi-dential information.
4. Access to production database or their infrastructure was not required.System administrators were very cooperative to share query plansand other relevant information related to our performance analysis.This ensured that they had complete control of the data shared andcan anonymize relevant data in case it was needed.
5. We created a performance testing environment that simulated a real-world DHIS2 Covid implementation database. This helped us experi-ment with several optimization approaches and evaluate the best can-didate.
6. We conducted several formal and informal meetings, which involved amix of QA engineers, System Administrators, Product managers, andmembers from the DHIS2 Core development team.
3.2 Ethical Obligation and ChallengesI ensured that no sensitive data are included in this thesis. The data
that is presented in the listings are anonymous and do not characterize asPII data. I have only collected material relevant to the scope of the thesis.Observations of different performance metrics under varying data accesspatterns and data dynamics were done on production databases. WheneverI have received production data samples for analysis, I have made sure
10
to delete them after recording my observation. It was important to studyand observe real-world production-grade applications to understand theirbehavior under load and unique data access patterns.
We faced several challenges throughout this work. First and foremostwere the time constraints and urgency. In most cases, the issues were re-ported by large-scale implementations and I was part of the reactive effortsto identify the bottleneck and implement possible optimization suitable forthe problem. Secondly, there were several large-scale DHIS2 implementa-tions used for my thesis case study. This meant that the data dynamics,volume, and access patterns were not the same. So all the optimizationtechniques had to be made generalized as much as possible to make themapplicable for all the systems. In some cases, our synthetic performancetest environment did not accurately represent the real-world problem. Insuch instances, we had to seek the help of the system administrators of theaffected implementation to get more information and context of the prob-lem. The biggest challenge among all was infrastructure inconsistenciesand issues related to infrastructure. Most of the country implementationswere hosted in a private cloud environment maintained by the governmentor parastatal authorities. Some of the performance issues were caused bythe infrastructure and it had a ripple effect on the application and databasebottlenecks.
For the experiments, we focused on DHIS2 version 2.34 and 2.35. Theexact version depended on the affected version reported from the field. Tofacilitate reproducibility, the performance test environment can be down-loaded from the link provided in Appendix. The corresponding DHIS2 ap-plication WAR files can be downloaded from the DHIS2 downloads URLlinked in the Appendix. The performance test environment was set up invirtual machines in a cloud environment. For brevity, most of the long list-ings of queries and query plans have been trimmed in the main section.The original full queries and query plans are added in the Appendix.
In the next chapter, we define what we mean by ”performance analysis”,”bottleneck” and ”optimization” in the context of this thesis. I also reviewexisting literature related to my research topic in the next chapter.
11
4 Literature ReviewThis chapter presents a review of literature that is deemed appropriate
for the topics concerned in this thesis. Firstly, the relevant terminologiesare defined, namely bottleneck, performance analysis, and optimization.Then a review of existing literature covering the different concepts follows.And finally, a summary of the literature review that explains my contribu-tion to the literature.
4.1 BottlenecksIn software terms, a bottleneck occurs when the capacity of an applicationor a computer system is limited by a single component, like the neck of abottle slowing down the overall water flow. The bottleneck has the low-est throughput of all parts of the transaction path. Therefore developerswill try to avoid bottlenecks and direct effort towards locating and tuningexisting bottlenecks. Sometimes this happens after the software has beendeployed in a live environment to be used by real traffic. Tracking downbottlenecks is called performance analysis.
4.2 Performance AnalysisCortellessa et al. explain the difference between System vs Software Per-
formance Analysis [6]. In System performance analysis, when a bottleneckis identified, the prevalent corrective actions mainly concern the hardwareplatform and its load. For example, to relieve an overloaded CPU, it is usu-ally suggested to increase the multiplicity of the CPU or, in the best case,to deviate part of its load (through a load balancing system) toward lessstressed CPUs.
On the other hand, in Software performance analysis, when a bottleneckis identified, the corrective action or suggestion is to introduce a changein the software rather than the system hardware. For example, excessivememory utilization can also be relieved by modifying the software to utilizememory more effectively.
Software performance analysis looks at how a specific program is per-forming daily and chronicles what slows down performance and causes er-rors now and what could pose a problem in the future. Performance issuesare not always built into the software in a way that can easily be spottedthrough the QA process. Instead, it is something that can emerge over timeafter the project has been deployed and under diverse load. This thesisfocuses on software performance analysis on large-scale DHIS2 implemen-tations.
Several tools exist for performance analysis for various software tech-nologies. In this thesis, the following external tools were used for analyzingthe performance of DHIS2.
12
• Glowroot is an open-source Application Performance Management (APM)tool useful for monitoring Java-based applications [23]. It supportsprofiling Java applications. Glowroot dashboards were used exten-sively to monitor and observe the real traffic of large-scale DHIS2 im-plementations.
• Locust [17] is an open-source load testing tool that allows you to defineuser behavior and swarm your system with millions of simultaneoususers. We used Locust to stress test DHIS2 and simulate workloadscomparable with large-scale DHIS2 implementations.
• Apache Jmeter [14] is open-source software and a 100% pure Java ap-plication designed to load test functional behavior and measure per-formance. Jmeter was used locally on my laptop for some ad-hoc stresstesting.
• YourKit Java Profile [31] is a fully-featured low overhead profiler forJava EE and Java SE platforms. YourKit was used to profile our per-formance test environment during stress tests.
Koci et al. state a data-driven approach to measure usability of WebAPIs[19]. Out of the six usability attributes elaborated in their work, theEfficiency attribute directly correlates to the performance of a Web API. Therelevant sub-attributes are efficiency In Task Execution and efficiency em-phIn Tied Up resources. Both of these metrics are significant when analyz-ing the performance of software through its exposed Web-APIs. In this the-sis, response time and resource utilization are the main factors evaluatedwhen analyzing the performance of DHIS2. In their work, Koci et al. havealso done a case study design on DHIS2 where they apply their proposedapproach of measuring usability attributes by processing API logs. How-ever, the case study is limited to computing the metrics for the know-abilityattribute alone and not the efficiency attribute. This thesis can thereforecomplement their work by computing some of the metrics for the efficiencyattribute of Web-APIs (non-exhaustively) in DHIS2.
Disk type and FileSystem type have an impact on transaction processingperformance in PostgreSQL which is proven by Smolinksi’s work with Stor-age space configuration [22]. However, as mentioned in the first chapter,storage configuration falls under infrastructure which is outside the scopeof this research work. This thesis focuses on the DHIS2 application sourcecode and the interaction with the PostgreSQL database.
4.3 OptimizationPerformance Optimization is the process of modifying a software system
to make it work more efficiently and execute more rapidly. Performance op-timization is key in having an efficiently functional application. It is doneby monitoring and analyzing the performance of an application and iden-tifying ways to improve it. Performance optimization generally focuses onimproving just one or two aspects of the system’s performance, e.g executiontime, memory usage, disk space, bandwidth, etc. This will usually require
13
a trade-off where one aspect is implemented at the expense of others. Forexample, increasing the size of the cache improves run-time performance,but also increases memory consumption.
There are numerous works on standard performance issues caused bycommon anti-patterns. These works also detail the optimizations that canbe applied to eliminate the common anti-patterns. Using an Object-Relationalmapping framework like Hibernate makes it more vulnerable to introduc-ing such anti-patterns. Tse-Hsun Chen et al. have detected performanceanti-patterns for applications developed using Object-Relational Mapping[5]. Their work specifically is focused on Java and Hibernate. ORM hasalways been a topic of performance analysis. The overhead required to mapobjects to their relational counterparts, and the amount of non-transparentlogic contained in it makes it vulnerable to being a bottleneck. The samekind of analysis, as well as a performance aware refactoring, was done byBoyuan Chen et al. in their Industrial Experience Report [4]. However,their work was more focused on PHP and its ORM framework named Lau-rel. Gorodnichev et al. explore the use of ORM in their work[16] and con-clude that if ORM is used competently by experienced developers then theoverhead or impact on performance is negligible. This further reinforcesthe need to detect and remove anti-patterns in an ORM-backed applicationlike DHIS2.
There are also numerous works on optimizing and configuring PostgreSQLdatabase effectively [3, 21, 20]. However, all of these works explain differ-ent database configurations and query optimizations and suggest options.Since there is no one-size-fits-all configuration, fine-tuning the configura-tion and database schema for a large-scale DHIS2 instance is not triv-ial. This thesis translated the suggestions from their work into actionablepoints for specific large-scale DHIS2 implementations involved in my casestudy.
The work that is very closely related to my thesis work is by Dombrovskayaet al. that not only focuses on PostgreSQL Query Optimization but alsodelves into common pitfalls and anti-patterns of applications working withPostgreSQL [12]. I have extended their work by empirically analyzing theimpact of various optimizations on a real-world large-scale time-critical in-formation system like DHIS2.
4.4 LimitationsDHIS2 is a complex information system with varying scopes and con-
texts. As mentioned in the previous sections, more than 73 countries areusing DHIS2 for collecting and analyzing health-related data. The scopeof this thesis is limited to identifying the application and database querybottlenecks. All infrastructure-related bottlenecks are out of scope for thisthesis. The different large-scale DHIS2 implementations are hosted by thecorresponding countries on secure private cloud environments or physicalservers. There are large-scale implementations hosted in the AWS cloud
14
platform and also on local physical machines with Linux. We do not havedirect access to the systems or any sort of control on how much resourcesare provided for the instances. It is completely up to the implementers todecide how they want to size their system. There are some standard guide-lines provided for setting up a DHIS2 instance.
The optimizations, wherever possible, are released as version upgrades.However, several implementations are reluctant to upgrade their versionsto get these optimization benefits. There are states in India (Uttar Pradeshand Orissa) that are still using older DHIS2 versions like 2.28 that are notactively supported anymore. However, they wish to remain in the old ver-sion as they feel their requirements are satisfied with that version and donot want to upgrade to a more recent version bringing with it more com-plexities and sophisticated features. Such implementations will never havethe benefit of the optimizations done during this research work until theirpolicies change and they upgrade to the latest DHIS2 versions.
We also know that countries like Nepal and Ethiopia are stuck in DHIS2version 2.30. This is because Nepal and Ethiopia have their native calen-dars which were supported until 2.30. These countries need date pickers fortheir native calendars. From version 2.30, front-end applications were mod-ernized to be implemented with ReactJS and related frameworks. However,ReactJS does not have libraries for the Nepalese/Ethiopian calendar. Thereis no Material-UI support or library, which caused DHIS2 to drop supportfor native calendars from DHIS2 version 2.31. This technical limitation hasforced Ethiopia and Nepal to continue using DHIS2 version 2.30. They areunable to upgrade to a better-performing version.
There are also limitations concerting governance and policies by the Coun-try implementations. HISP teams can only provide recommendations. Theultimate decision is always made by the higher officials in a country andthose decisions can be affected or influenced in many ways. Such infras-tructural issues, governance, and policies are outside our control and alsooutside the scope of this research work.
4.5 SummaryThis chapter introduced the reader to the concepts of bottleneck, per-
formance analysis, and optimization. It also presents a review of exist-ing literature on these concepts that are related to my research topic. Asfar as my search goes, there is no existing literature that details perfor-mance bottlenecks and evaluates the impact of optimization techniqueson production-grade large-scale information systems like DHIS2. Throughthis case study, I have detailed some of the performance issues identified,the optimizations that were applied, and the impact of these optimizationson large-scale DHIS2 implementations.
15
5 Performance AnalysisAn enterprise application will have several layers that constitute the en-
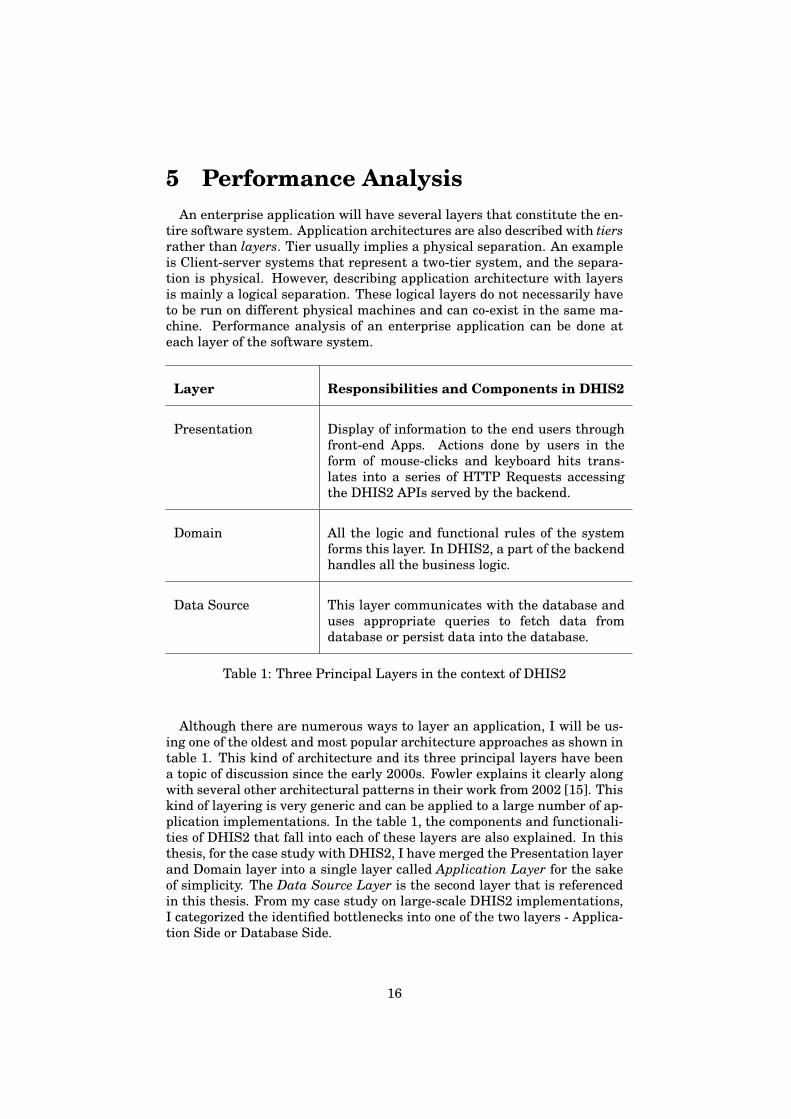
tire software system. Application architectures are also described with tiersrather than layers. Tier usually implies a physical separation. An exampleis Client-server systems that represent a two-tier system, and the separa-tion is physical. However, describing application architecture with layersis mainly a logical separation. These logical layers do not necessarily haveto be run on different physical machines and can co-exist in the same ma-chine. Performance analysis of an enterprise application can be done ateach layer of the software system.
Layer Responsibilities and Components in DHIS2
Presentation Display of information to the end users throughfront-end Apps. Actions done by users in theform of mouse-clicks and keyboard hits trans-lates into a series of HTTP Requests accessingthe DHIS2 APIs served by the backend.
Domain All the logic and functional rules of the systemforms this layer. In DHIS2, a part of the backendhandles all the business logic.
Data Source This layer communicates with the database anduses appropriate queries to fetch data fromdatabase or persist data into the database.
Table 1: Three Principal Layers in the context of DHIS2
Although there are numerous ways to layer an application, I will be us-ing one of the oldest and most popular architecture approaches as shown intable 1. This kind of architecture and its three principal layers have beena topic of discussion since the early 2000s. Fowler explains it clearly alongwith several other architectural patterns in their work from 2002 [15]. Thiskind of layering is very generic and can be applied to a large number of ap-plication implementations. In the table 1, the components and functionali-ties of DHIS2 that fall into each of these layers are also explained. In thisthesis, for the case study with DHIS2, I have merged the Presentation layerand Domain layer into a single layer called Application Layer for the sakeof simplicity. The Data Source Layer is the second layer that is referencedin this thesis. From my case study on large-scale DHIS2 implementations,I categorized the identified bottlenecks into one of the two layers - Applica-tion Side or Database Side.
16
TrackerMetadataConcept
Description and Examples
Tracked EntityType These are the types of entities that you want to track
timeline data for. This can be a ”Person” or ”Vehicle”or ”Student” or any other type that you want to trackbased on the domain and use-case. In the health sec-tor, the tracked entity type is usually a ”Person” or”Patient”. This concept falls under metadata. Defin-ing a tracked entity type is done by the system ad-ministrator as part of the system setup and is a one-time job.
Tracked EntityAttribute These are the attributes that can be configured to
be attached to either tracked entity type or program.Examples of tracked entity attribute that can be at-tached to a ”Person” tracked entity type are ”FirstName”, ”Sex”, ”Date of Birth” and so on. Some at-tributes can be configured to be unique, for example,”National Identification Number”.
Program This is the definition of a program to which aninstance of a tracked entity type can be enrolled.For example, Covid Vaccination Program, Maternity,and Child Health Program, and Tuberculosis Pro-gram. A specific patient, an instance of a tracked en-tity type, can be enrolled into one of these programs,and their treatment or participation in the programcan be tracked from thereon.
Program Stage These are the different stages that can be configuredin a program. Each program can have one or manyprogram stages. For example, in a Covid VaccinationProgram, First Dose can be a program stage, SecondDose can be the second program stage. These stagescan be configured to unlock sequentially as well.
Table 2: DHIS2 Tracker Metadata Concepts
17
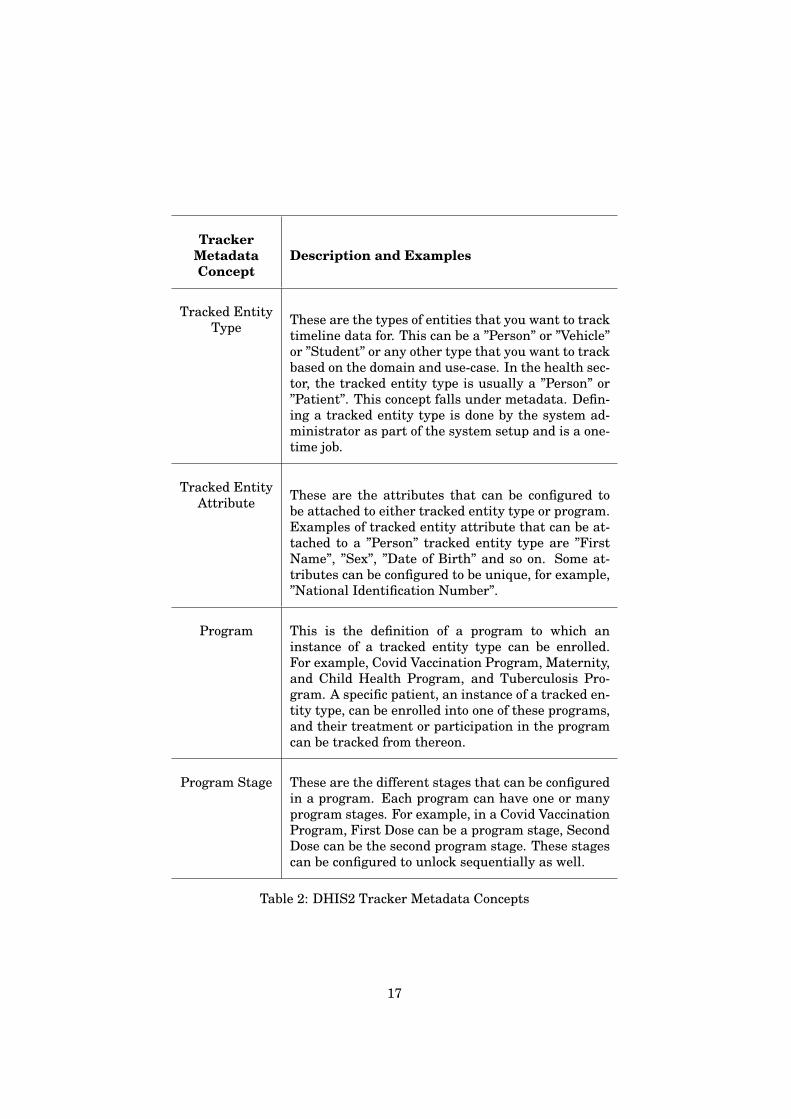
Certain terminologies need to be familiarized to fully understand the per-formance bottlenecks in DHIS2 and their implications. The table 2 givesa brief description of the different metadata concepts in DHIS2 Tracker.Even though the list is not exhaustive, all the essential concepts of DHIS2Tracker Metadata are covered based on the scope of this thesis.
The table 2 focuses on DHIS2 Tracker Metadata concepts. Metadata ispart of the system configuration. Since DHIS2 is a generic application thatcan be tailored for different contexts by configuring the metadata. Thiscustomizability is crucial for enabling DHIS2 to support the concrete im-plementation context at hand. The configuration and metadata setup isdone by the system administrators as a one-time activity as part of the sys-tem setup. Once the metadata setup is complete, there is rarely a need tochange the metadata configuration. The table 2 also has examples for thespecific metadata concepts that can be customized for a health domain use-case, like Covid Vaccination Tracking. Along with the concepts mentionedin the table, an additional concept worth mentioning is Organisation Unit.
In DHIS2 the location of the data, the geographical context, is repre-sented as organisation units. Organisation units can either be a health fa-cility or department/sub-unit providing services or an administrative unitrepresenting a geographical area (e.g. a health district). Organisation unitsare located within a hierarchy, also referred to as a tree. The hierarchy willreflect the health administrative structure and its levels. Typical levels insuch a hierarchy are the national, province, district, and facility levels. InDHIS2 there is a single organisational hierarchy so the way this is definedand mapped to reality needs careful consideration. Which geographical ar-eas and levels are defined in the main organisational hierarchy will have amajor impact on the usability and performance of the application[26].
Metadata is only a mechanism to set up a DHIS2 instance and config-ure it to collect data. The memory footprint for storing metadata is low asit does not include the actual data collected by the users. Data is enteredbased on this metadata, and therefore as long as the data collection con-tinues, the memory footprint for storing this data keeps on increasing. Inthe table 3, some of the DHIS2 Tracker Data concepts are listed. It alsohas examples for the specific data concepts that have been customized for ahealth domain use-case, like Covid Vaccination Tracking.
18
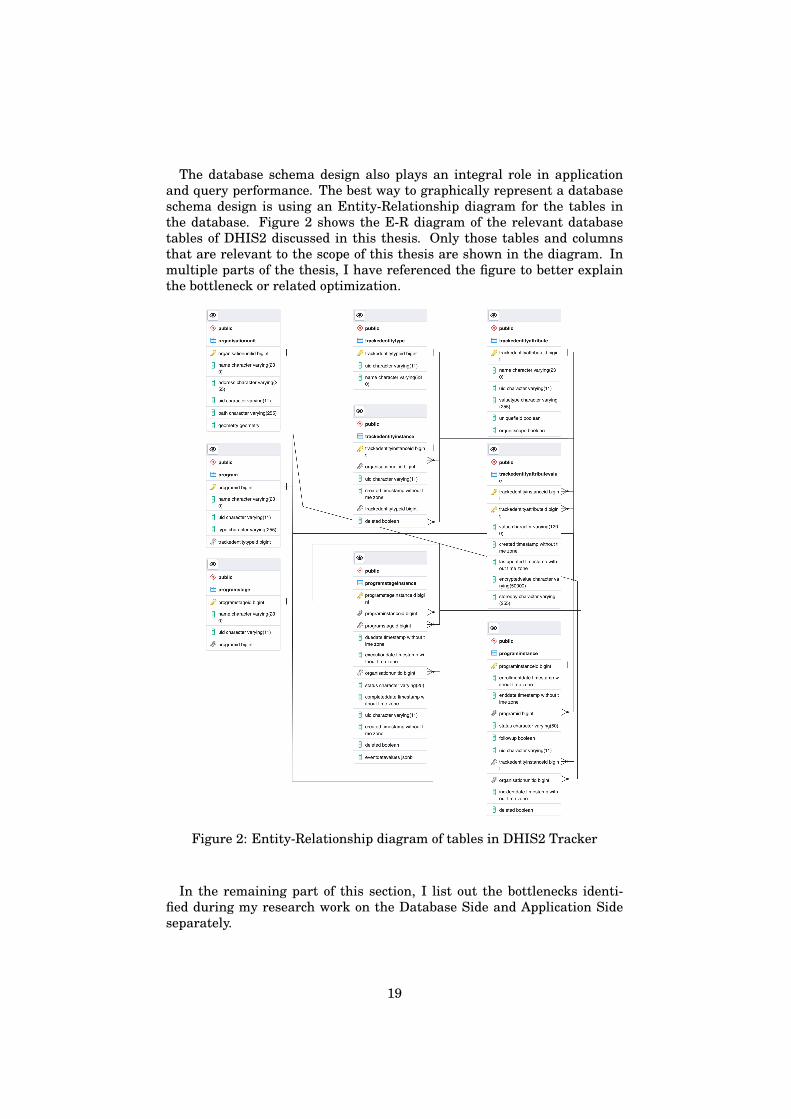
The database schema design also plays an integral role in applicationand query performance. The best way to graphically represent a databaseschema design is using an Entity-Relationship diagram for the tables inthe database. Figure 2 shows the E-R diagram of the relevant databasetables of DHIS2 discussed in this thesis. Only those tables and columnsthat are relevant to the scope of this thesis are shown in the diagram. Inmultiple parts of the thesis, I have referenced the figure to better explainthe bottleneck or related optimization.
Figure 2: Entity-Relationship diagram of tables in DHIS2 Tracker
In the remaining part of this section, I list out the bottlenecks identi-fied during my research work on the Database Side and Application Sideseparately.
19
Tracker DataConcept
Description and Examples
Tracked En-tity Instance
This is an instance of the tracked entity type. If thetype was ”Person”, then examples of tracked entitieswill be specific individual persons. In a national levelimplementation of DHIS2 Tracker, there will be asmany tracked entities as the population of that coun-try. Every citizen is a tracked entity instance. Thisconcept falls under data. In health information in-stances, this is the actual patient data.
Tracked En-tity AttributeValue
These are the values of a tracked entity attributefor a specific tracked entity instance. For example,”David” is the value of tracked entity attribute ”FirstName” for a specific Tracked Entity instance. Thisdata is also crucial for searching and finding specifictracked entity instances.
Program In-stance
A Program instance is an enrollment of a trackedentity instance into a program. Program Instanceand Enrollment can be used interchangeably. For ex-ample, an Enrollment of a patient (a tracked entity)into the Covid Vaccination Program is a Program In-stance.
Program StageInstance
They are also called Events. These are the instancesof program stages. For example, when the patientis enrolled into the Covid Vaccination program andthen visits a clinic to get their first dose, an Event(Program Stage Instance) gets created. The detailsof that stage are populated in the system like thedate of vaccine, type of vaccine, etc. This is also dataand is attached to the enrollment as events.
Table 3: DHIS2 Tracker Data Concepts
20
5.1 Data Source BottlenecksThe Data Source Layer mainly consists of the actual database and the
technologies or tools used to communicate with the database. In the caseof DHIS2, the database is PostgreSQL. Communication with the databasemainly implies querying the database to fetch data and to insert or updatespecific records in the database. In the case of DHIS2, these communica-tions are done using Hibernate ORM tool and Spring JdbcTemplate, all ofwhich internally use the PostgreSQL JDBC driver. The performance bottle-necks in the data source layer are usually in-efficient queries or the absenceof indexes. The bottlenecks explained here are also applicable to most In-formation Systems and not just DHIS2.
5.1.1 In-Efficient QueriesIn-efficient queries are queries structured in such a way that the database
query engine is unable to optimize the data fetch/update and thus leads toa significant response time. In-efficient queries are not declarative enoughwhich does not give the optimizer better execution paths. There have beenincidents in large-scale implementations where the query response timehas been as large as 600000ms, which is 10 minutes. This essentially boilsup to the DHIS2 API response time and the user is left hanging after per-forming a mouse-click and waiting for something to happen. Since Hiber-nate ORM is extensively used in DHIS2, there is a chance that in somecases hibernate constructs in-efficient queries under the hood as well. Inother cases, it may be the application developer that has inadvertently mod-ified an SQL query to add a feature and thereafter make it in-efficient.
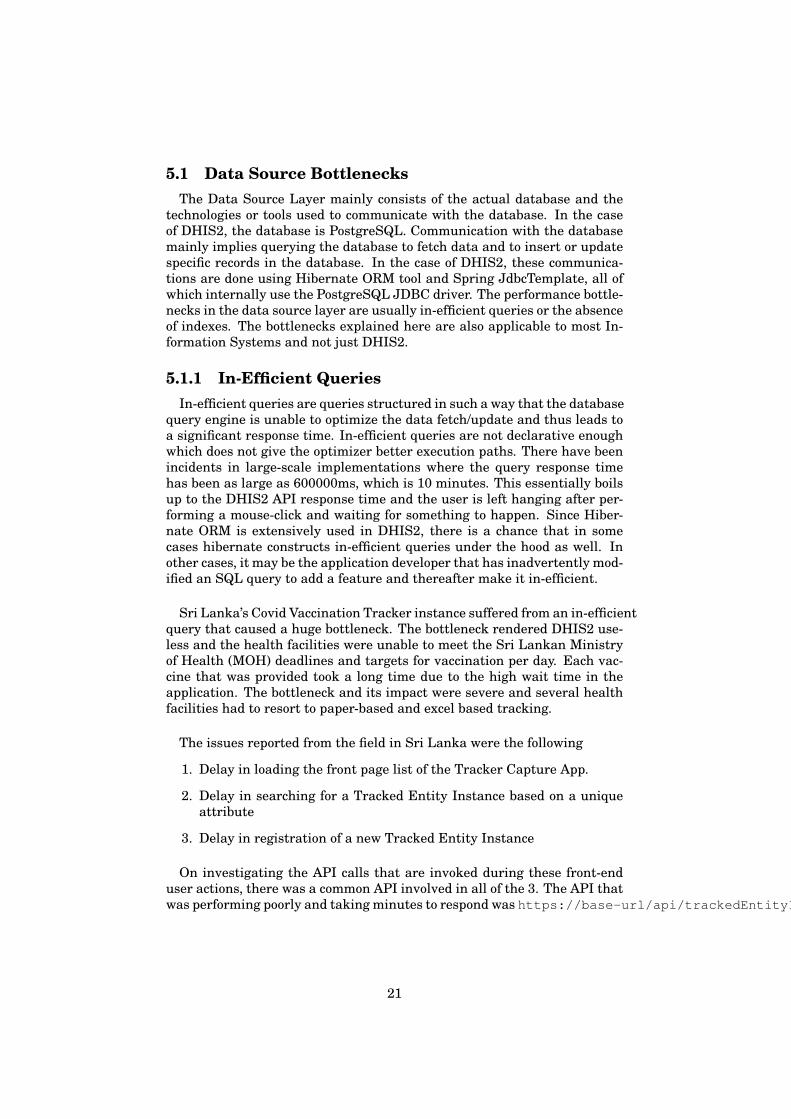
Sri Lanka’s Covid Vaccination Tracker instance suffered from an in-efficientquery that caused a huge bottleneck. The bottleneck rendered DHIS2 use-less and the health facilities were unable to meet the Sri Lankan Ministryof Health (MOH) deadlines and targets for vaccination per day. Each vac-cine that was provided took a long time due to the high wait time in theapplication. The bottleneck and its impact were severe and several healthfacilities had to resort to paper-based and excel based tracking.
The issues reported from the field in Sri Lanka were the following
1. Delay in loading the front page list of the Tracker Capture App.
2. Delay in searching for a Tracked Entity Instance based on a uniqueattribute
3. Delay in registration of a new Tracked Entity Instance
On investigating the API calls that are invoked during these front-enduser actions, there was a common API involved in all of the 3. The API thatwas performing poorly and taking minutes to respond was https://base-url/api/trackedEntityInstances/query.json?
21
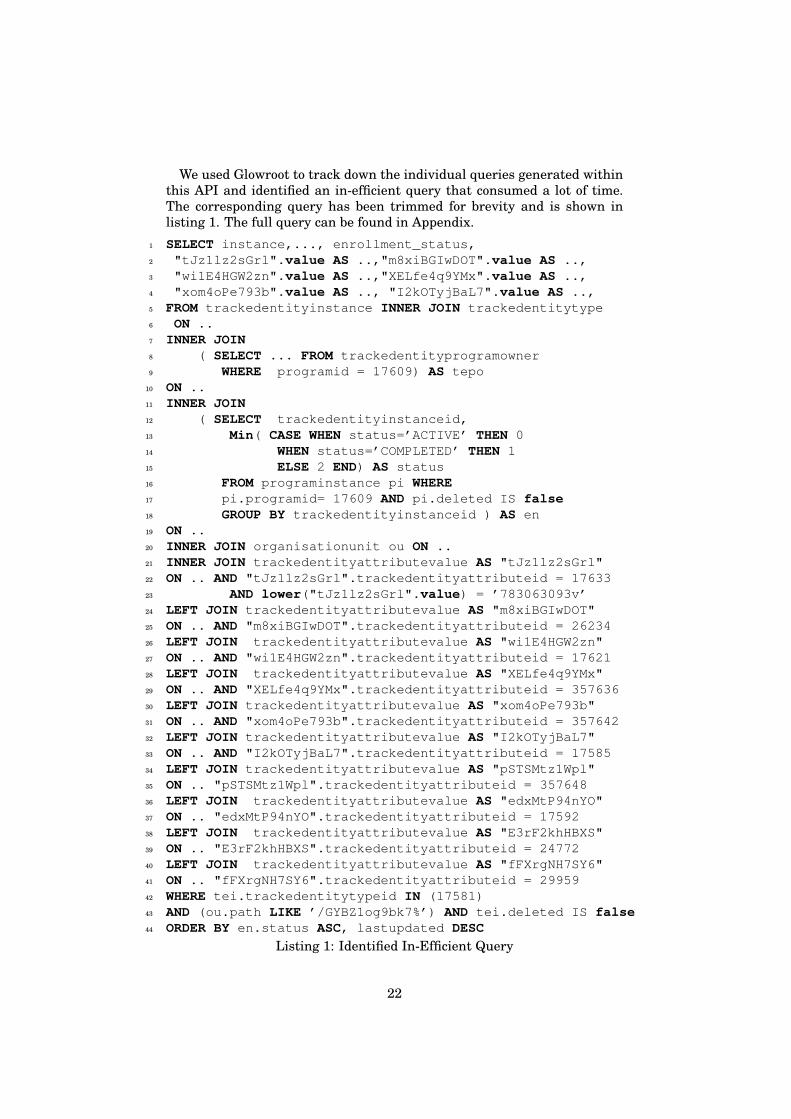
We used Glowroot to track down the individual queries generated withinthis API and identified an in-efficient query that consumed a lot of time.The corresponding query has been trimmed for brevity and is shown inlisting 1. The full query can be found in Appendix.
1 SELECT instance,..., enrollment_status,2 "tJz1lz2sGrl".value AS ..,"m8xiBGIwDOT".value AS ..,3 "wi1E4HGW2zn".value AS ..,"XELfe4q9YMx".value AS ..,4 "xom4oPe793b".value AS .., "I2kOTyjBaL7".value AS ..,5 FROM trackedentityinstance INNER JOIN trackedentitytype6 ON ..7 INNER JOIN8 ( SELECT ... FROM trackedentityprogramowner9 WHERE programid = 17609) AS tepo
10 ON ..11 INNER JOIN12 ( SELECT trackedentityinstanceid,13 Min( CASE WHEN status=’ACTIVE’ THEN 014 WHEN status=’COMPLETED’ THEN 115 ELSE 2 END) AS status16 FROM programinstance pi WHERE17 pi.programid= 17609 AND pi.deleted IS false18 GROUP BY trackedentityinstanceid ) AS en19 ON ..20 INNER JOIN organisationunit ou ON ..21 INNER JOIN trackedentityattributevalue AS "tJz1lz2sGrl"22 ON .. AND "tJz1lz2sGrl".trackedentityattributeid = 1763323 AND lower("tJz1lz2sGrl".value) = ’783063093v’24 LEFT JOIN trackedentityattributevalue AS "m8xiBGIwDOT"25 ON .. AND "m8xiBGIwDOT".trackedentityattributeid = 2623426 LEFT JOIN trackedentityattributevalue AS "wi1E4HGW2zn"27 ON .. AND "wi1E4HGW2zn".trackedentityattributeid = 1762128 LEFT JOIN trackedentityattributevalue AS "XELfe4q9YMx"29 ON .. AND "XELfe4q9YMx".trackedentityattributeid = 35763630 LEFT JOIN trackedentityattributevalue AS "xom4oPe793b"31 ON .. AND "xom4oPe793b".trackedentityattributeid = 35764232 LEFT JOIN trackedentityattributevalue AS "I2kOTyjBaL7"33 ON .. AND "I2kOTyjBaL7".trackedentityattributeid = 1758534 LEFT JOIN trackedentityattributevalue AS "pSTSMtz1Wpl"35 ON .. "pSTSMtz1Wpl".trackedentityattributeid = 35764836 LEFT JOIN trackedentityattributevalue AS "edxMtP94nYO"37 ON .. "edxMtP94nYO".trackedentityattributeid = 1759238 LEFT JOIN trackedentityattributevalue AS "E3rF2khHBXS"39 ON .. "E3rF2khHBXS".trackedentityattributeid = 2477240 LEFT JOIN trackedentityattributevalue AS "fFXrgNH7SY6"41 ON .. "fFXrgNH7SY6".trackedentityattributeid = 2995942 WHERE tei.trackedentitytypeid IN (17581)43 AND (ou.path LIKE ’/GYBZ1og9bk7%’) AND tei.deleted IS false44 ORDER BY en.status ASC, lastupdated DESC
Listing 1: Identified In-Efficient Query
22

The query was sometimes taking several minutes to get a response fromthe database and this was happening on a powerful national DHIS2 trackerinstance. A glimpse at the query made it obvious that this query does notscale well. The more attributes the implementation has configured, themore left joins with the trackedentityattributevalue table occurs. On ana-lyzing the query plan, which is also added in Appendix, the specific areasof bottleneck within the query were identified.
The query plan analysis gave the following observations
• The chaining of joins (line 24 to 40) for every trackedentityattribute-value is not scalable. For the Sri Lanka Covid Vaccination Tracker in-stance, there were more than 10 attributes, and that resulted in morethan 10 chained joins of a table that has over 200 million records. Thedefault value of join collapse limit PostgreSQL configuration param-eter is 8. This parameter caps the number of tables in a join that willstill be processed by the cost-based optimizer. This means that if thenumber of tables in a join is eight or fewer, the optimizer will performa selection of candidate plans, compare plans, and choose the best one[12]. But if the number of tables is nine or more, it will simply exe-cute the joins in the order seen in the SELECT statement. Hence, thiskind of chained left joins block the optimizer from choosing the bestexecution path. An alternative way of fetching the same set of datawithout these many joins had to be investigated.
• The default sorting is based on a computed column of status in the ta-ble programinstance. A decision had to be made whether the defaultsorting has to be such a costly one. Default sorting is used when theAPI client does not explicitly request sorting by any specific param-eter. A non-costly default sorting would have been more optimal toavoid this bottleneck.
By understanding the problematic areas in the query structure, we rewrotethis query as elaborated in section 6.1.1. The rewrite considered the aboveobservations, alleviated the scalability issues while still satisfying the re-quirement of the API. The optimization results are also explained in section6.1.1.
23
5.1.2 Absence of IndexesIn the majority of the cases, the SQL query is already declarative and
optimized structurally. There may not be a way to rewrite it to make it moreefficient. Despite being optimized on paper, there are cases where such aquery is performing poorly on large databases. This is because the queryoptimizer does not have the necessary help to speed up data fetching. Ifthe execution path involves full table scans to fetch data from a large table,then it will certainly be slow. A tool that can help the query optimizer tofurther speed up data lookup is an Index.
What exactly is an index? Indexes are redundant data structures thatare invisible to the application and are designed to speed up data selectionbased on criteria [12]. The redundancy means that an index can be droppedwithout any data loss and can be reconstructed from data stored in thetables. Invisibility means that an application cannot detect if an index ispresent or absent. Any query produces the same results with or without anindex. An index is created to improve the performance of a specific query orseveral queries.
If appropriate indexes are not created, the query engine sequentiallyscans the entire table and that consumes time. To obtain the executionplan for a query, the EXPLAIN command is run. This command takes anygrammatically correct SQL statement as a parameter and returns its exe-cution plan[12]. Analyzing the execution plan gives valuable insights intohow the query optimizer decided to execute the query. It displays the usageof indexes (if any), estimations of costs, the expected number of rows in theoutput for that specific query execution.
In this section, I list two major types of performance bottlenecks thatmultiple large-scale DHIS2 instances faced due to lack of indexing. Both ofthe issues revolve around one of the largest tables in the DHIS2 database,the trackedentityattributevalue table. If an instance has 10 attributes con-figured for a trackedentitytype, then the number of trackedentityattribute-values will be 10 times the number of trackedentityinstances. The relationsbetween these tables can be referred to in figure 2. In the Sri Lankan CovidVaccination tracker instance, there were 17 Million trackedentityinstancesand more than 10 trackedentityattributes configured. This meant the sizeof the trackedentityattributevalue table was well over 200 Million records.
Nigeria DHIS2-Vaccination instance reported the slow query shown inlisting 2. Such queries with cross joins are created internally by HibernateORM used within DHIS2, more of this is covered in the next section 5.2. Inthis section, the slow query is analyzed to identify the bottleneck.
1 SELECT trackedent0_.uid AS col_0_0_2 FROM trackedentityinstance trackedent0_3 WHERE ( EXISTS (4 SELECT trackedent1_.trackedentityinstanceid,
24
5 trackedent1_.trackedentityattributeid6 FROM trackedentityattributevalue trackedent1_7 CROSS JOIN trackedentityattribute trackedent2_8 WHERE trackedent1_.trackedentityattributeid =9 trackedent2_.trackedentityattributeid
10 AND trackedent1_.trackedentityinstanceid =11 trackedent0_.trackedentityinstanceid12 AND trackedent2_.uid = ’izttywqePh2’13 AND Lower(trackedent1_.value) = ’ng-tm10697501lx’14 ) ) AND trackedent0_.deleted = false
Listing 2: Slow Query reported by Nigeria DHIS2 Vaccination Instance
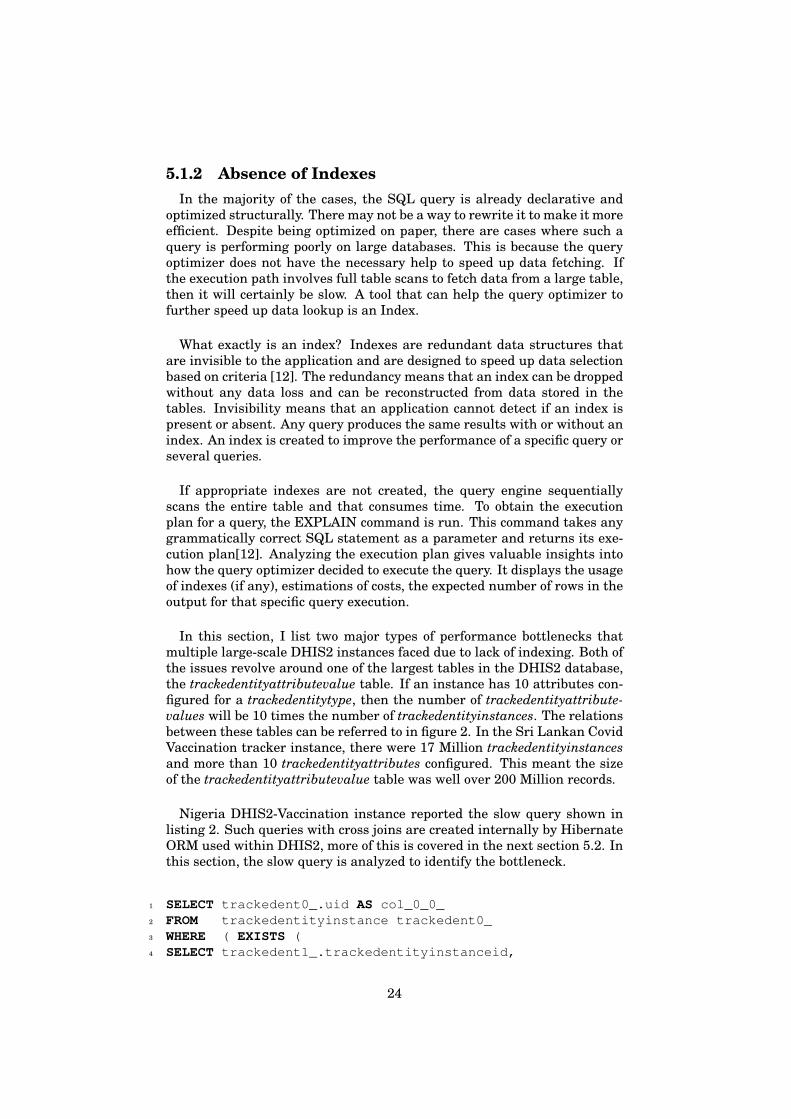
We executed the EXPLAIN command on the query in listing 2 and an-alyzed the query plan. The performance bottleneck was evidently in oneof the filter checks corresponding to Line 13. The figures 3 and 4 shows agraphical representation of the node in the query plan that causes the bot-tleneck. The filtering check on the lower(value) comparison is not part ofan index and therefore is causing the bottleneck.
Figure 3: Query plan node that consumes the most time
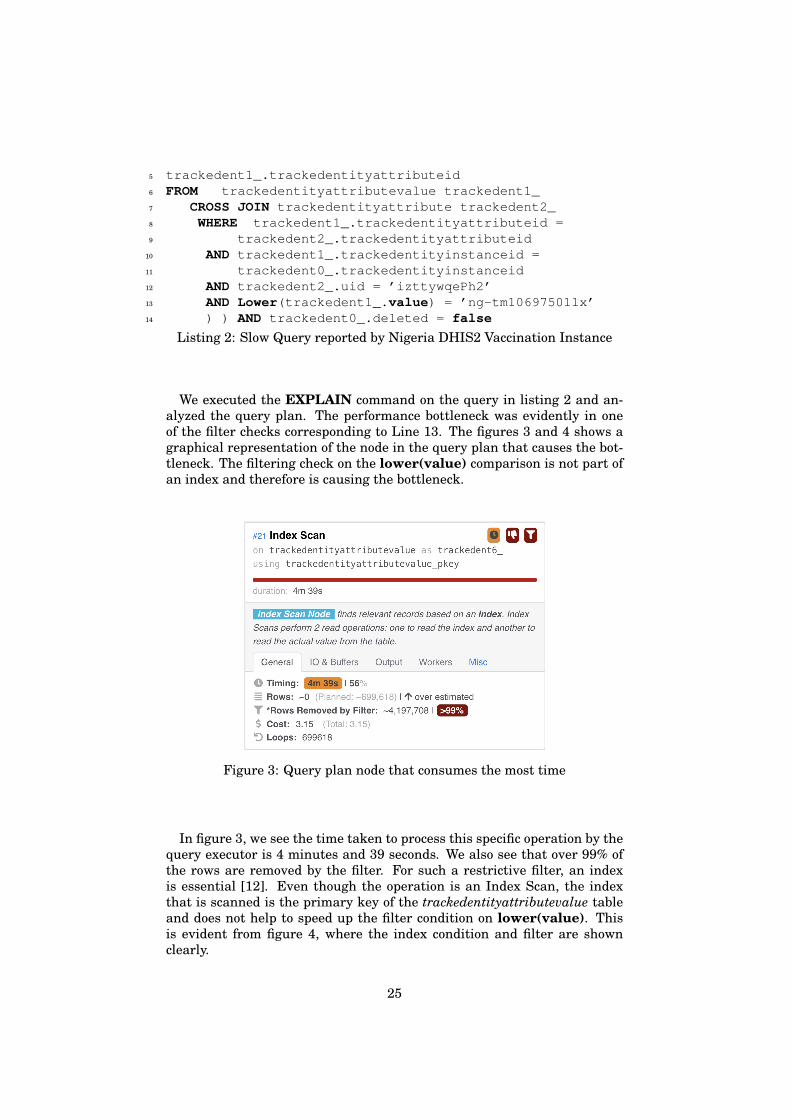
In figure 3, we see the time taken to process this specific operation by thequery executor is 4 minutes and 39 seconds. We also see that over 99% ofthe rows are removed by the filter. For such a restrictive filter, an indexis essential [12]. Even though the operation is an Index Scan, the indexthat is scanned is the primary key of the trackedentityattributevalue tableand does not help to speed up the filter condition on lower(value). Thisis evident from figure 4, where the index condition and filter are shownclearly.
25
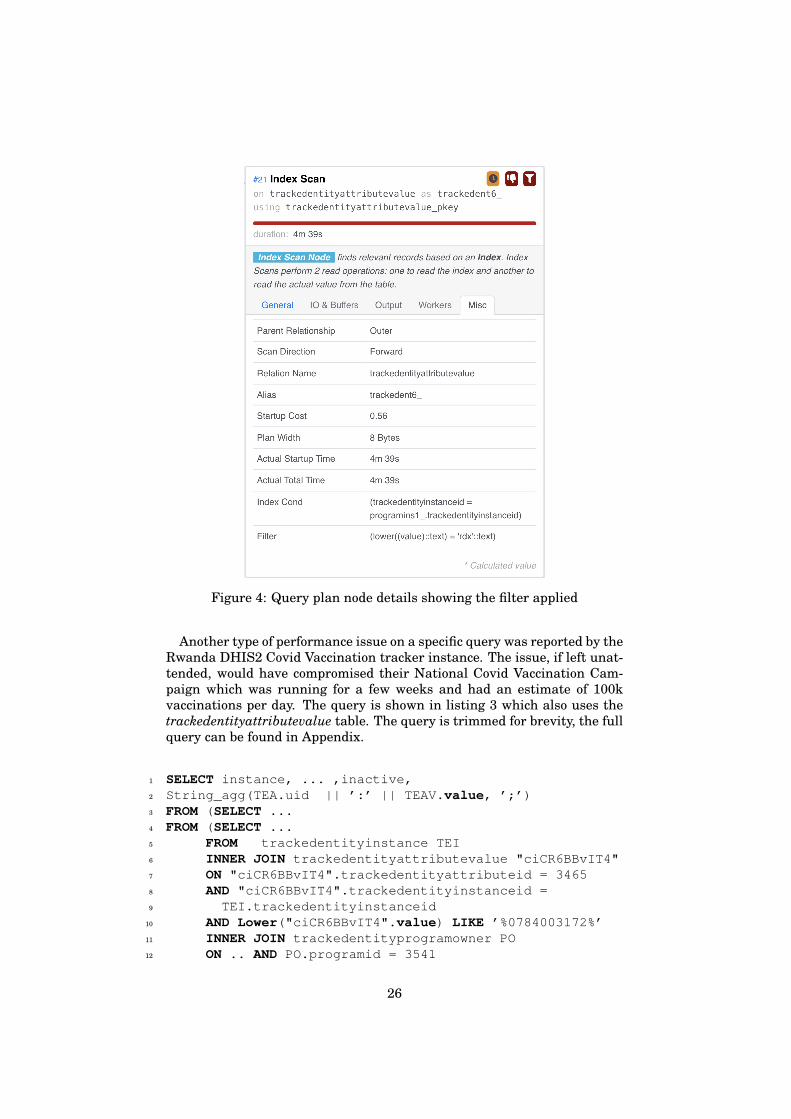
Figure 4: Query plan node details showing the filter applied
Another type of performance issue on a specific query was reported by theRwanda DHIS2 Covid Vaccination tracker instance. The issue, if left unat-tended, would have compromised their National Covid Vaccination Cam-paign which was running for a few weeks and had an estimate of 100kvaccinations per day. The query is shown in listing 3 which also uses thetrackedentityattributevalue table. The query is trimmed for brevity, the fullquery can be found in Appendix.
1 SELECT instance, ... ,inactive,2 String_agg(TEA.uid || ’:’ || TEAV.value, ’;’)3 FROM (SELECT ...4 FROM (SELECT ...5 FROM trackedentityinstance TEI6 INNER JOIN trackedentityattributevalue "ciCR6BBvIT4"7 ON "ciCR6BBvIT4".trackedentityattributeid = 34658 AND "ciCR6BBvIT4".trackedentityinstanceid =9 TEI.trackedentityinstanceid
10 AND Lower("ciCR6BBvIT4".value) LIKE ’%0784003172%’11 INNER JOIN trackedentityprogramowner PO12 ON .. AND PO.programid = 3541
26

13 INNER JOIN organisationunit OU14 ON .. AND ( OU.path LIKE ’/Hjw70Lodtf2%’ )15 WHERE TEI.trackedentitytypeid IN ( 3501 )16 AND TEI.deleted IS FALSE17 AND EXISTS (SELECT PI.trackedentityinstanceid18 FROM programinstance PI19 WHERE PI.trackedentityinstanceid =20 TEI.trackedentityinstanceid21 AND PI.programid = 354122 AND PI.deleted IS FALSE)23 ORDER BY TEI.trackedentityinstanceid ASC24 LIMIT 21 offset 0) TEI25 LEFT JOIN trackedentitytype TET ON ..26 LEFT JOIN trackedentityattributevalue TEAV27 ON .. AND TEAV.trackedentityattributeid IN ( ... )28 LEFT JOIN trackedentityattribute TEA ON ..29 GROUP BY ...30 ORDER BY TEI.trackedentityinstanceid ASC;
Listing 3: Slow attribute search query reported by Rwanda DHIS2 Vacci-nation Instance
On analyzing the query plan for the query in listing 3 the performancebottleneck was once again in one of the filter checks on lower(value) corre-sponding to Line 10. The figures 5 and 6 shows a graphical representationof the node in the query plan that causes this bottleneck. The filteringcheck on the lower(value) comparison is not part of an index and there-fore is causing the bottleneck.
Figure 5: The bottleneck Query plan node in Rwanda
It has to be noted that the query in listing 3 is an optimized version ofthe in-efficient query in listing 1. Even after making the required structural
27
changes for better efficiency, the query still struggled to perform under loadfor certain criteria checks.
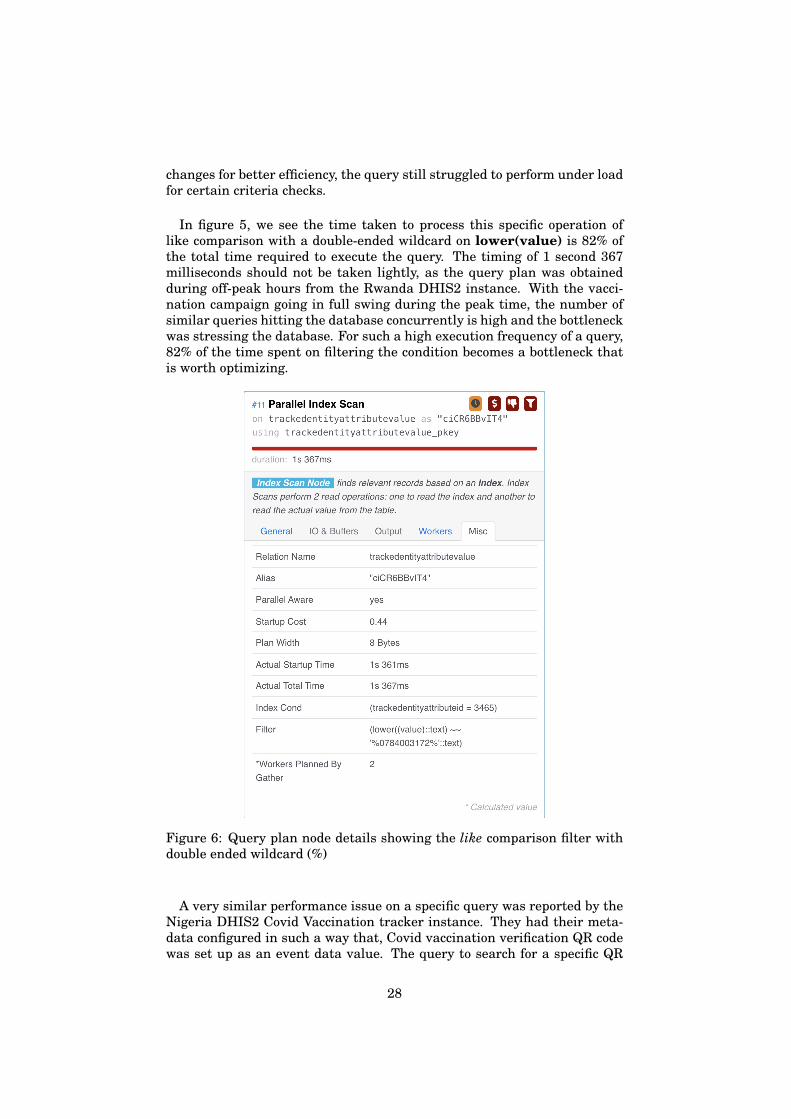
In figure 5, we see the time taken to process this specific operation oflike comparison with a double-ended wildcard on lower(value) is 82% ofthe total time required to execute the query. The timing of 1 second 367milliseconds should not be taken lightly, as the query plan was obtainedduring off-peak hours from the Rwanda DHIS2 instance. With the vacci-nation campaign going in full swing during the peak time, the number ofsimilar queries hitting the database concurrently is high and the bottleneckwas stressing the database. For such a high execution frequency of a query,82% of the time spent on filtering the condition becomes a bottleneck thatis worth optimizing.
Figure 6: Query plan node details showing the like comparison filter withdouble ended wildcard (%)
A very similar performance issue on a specific query was reported by theNigeria DHIS2 Covid Vaccination tracker instance. They had their meta-data configured in such a way that, Covid vaccination verification QR codewas set up as an event data value. The query to search for a specific QR
28

code was very slow. The search functionality was used at airports and otherports of entry to verify if the passengers were vaccinated by searching forthe QR code presented by them. We got reports that passengers were un-able to board their flights on time because of this performance bottleneckand huge response time for searching. The corresponding trimmed query isshown in listing 4. The full query can be found in Appendix.
1 SELECT *2 FROM (SELECT ..3 lower(psi.eventdatavalues #>> ’{LavUrktwH5D, value}’)4 .. FROM programstageinstance psi5 INNER JOIN programinstance pi6 ON ..7 INNER JOIN program p8 ON ..9 INNER JOIN programstage ps
10 ON ..11 INNER JOIN categoryoptioncombo coc12 ON ..13 INNER JOIN categoryoptioncombos_categoryoptions14 ON ..15 INNER JOIN dataelementcategoryoption deco16 ON ..17 LEFT JOIN trackedentityinstance tei18 ON ..19 LEFT JOIN organisationunit ou20 ON ..21 LEFT JOIN organisationunit teiou22 ON ..23 LEFT JOIN users auc24 ON ..25 LEFT JOIN userinfo au26 ON ..27 LEFT JOIN (SELECT categoryoptioncomboid,28 Count(categoryoptioncomboid)29 FROM categoryoptioncombos_categoryoptions30 GROUP BY categoryoptioncomboid) AS cocount31 ON ..32 LEFT JOIN (SELECT ..33 FROM dataelementcategoryoption deco34 LEFT JOIN dataelementcategoryoptionusergroupaccesses35 ON ..36 LEFT JOIN dataelementcategoryoptionuseraccesses37 ON ..38 LEFT JOIN usergroupaccess39 ON ..40 LEFT JOIN useraccess ua41 ON .. WHERE ..) AS decoa42 ON ..
29
43 WHERE Lower(psi.eventdatavalues #>> ’{LavUrktwH5D, value}’)44 LIKE ’%nphcda000005013%’45 AND p.programid = 6451946 AND psi.deleted IS FALSE47 AND ( p.uid IN ( .. ) )48 AND ( ps.uid IN ( .. ) )49 ORDER BY psi_lastupdated DESC50 LIMIT 2 offset 0) AS event51
52 LEFT JOIN (SELECT ..53 FROM programstageinstancecomments psic54 INNER JOIN trackedentitycomment psinote55 ON ..56 LEFT JOIN users usernote57 ON ..58 LEFT JOIN userinfo59 ON ..) AS cm60 ON ..61 ORDER BY psi_lastupdated DESC
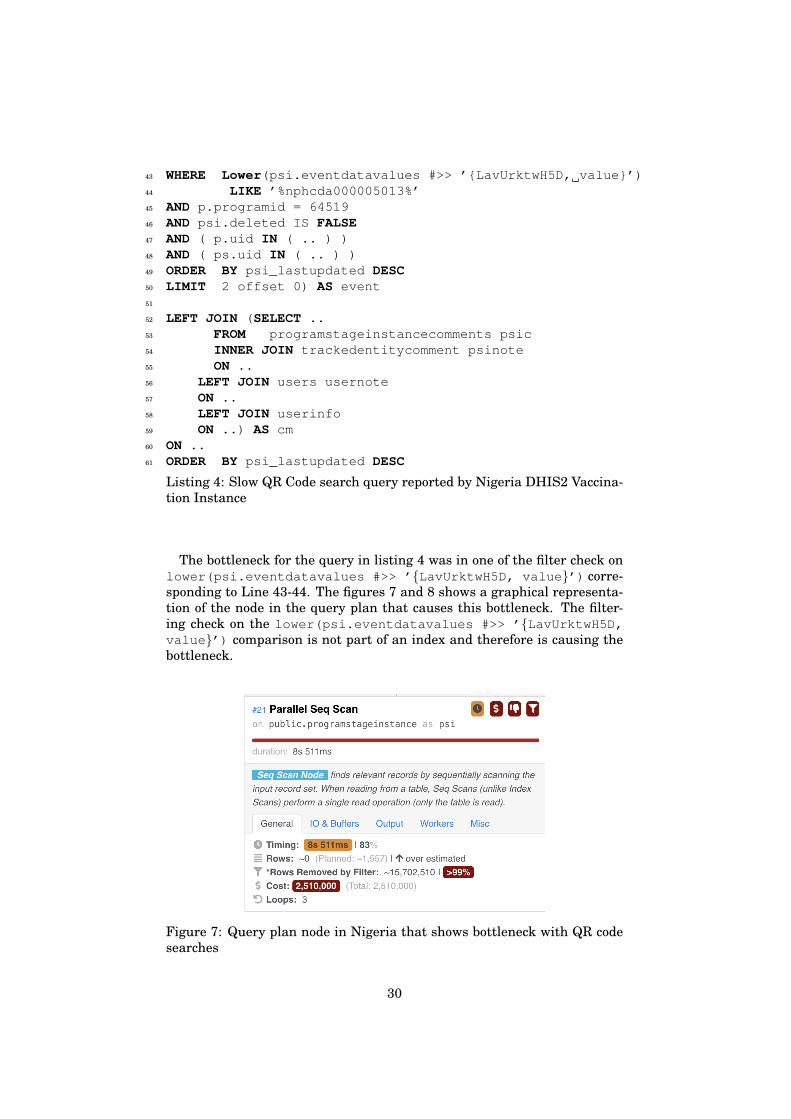
Listing 4: Slow QR Code search query reported by Nigeria DHIS2 Vaccina-tion Instance
The bottleneck for the query in listing 4 was in one of the filter check onlower(psi.eventdatavalues #>> ’{LavUrktwH5D, value}’) corre-sponding to Line 43-44. The figures 7 and 8 shows a graphical representa-tion of the node in the query plan that causes this bottleneck. The filter-ing check on the lower(psi.eventdatavalues #>> ’{LavUrktwH5D,value}’) comparison is not part of an index and therefore is causing thebottleneck.
Figure 7: Query plan node in Nigeria that shows bottleneck with QR codesearches
30
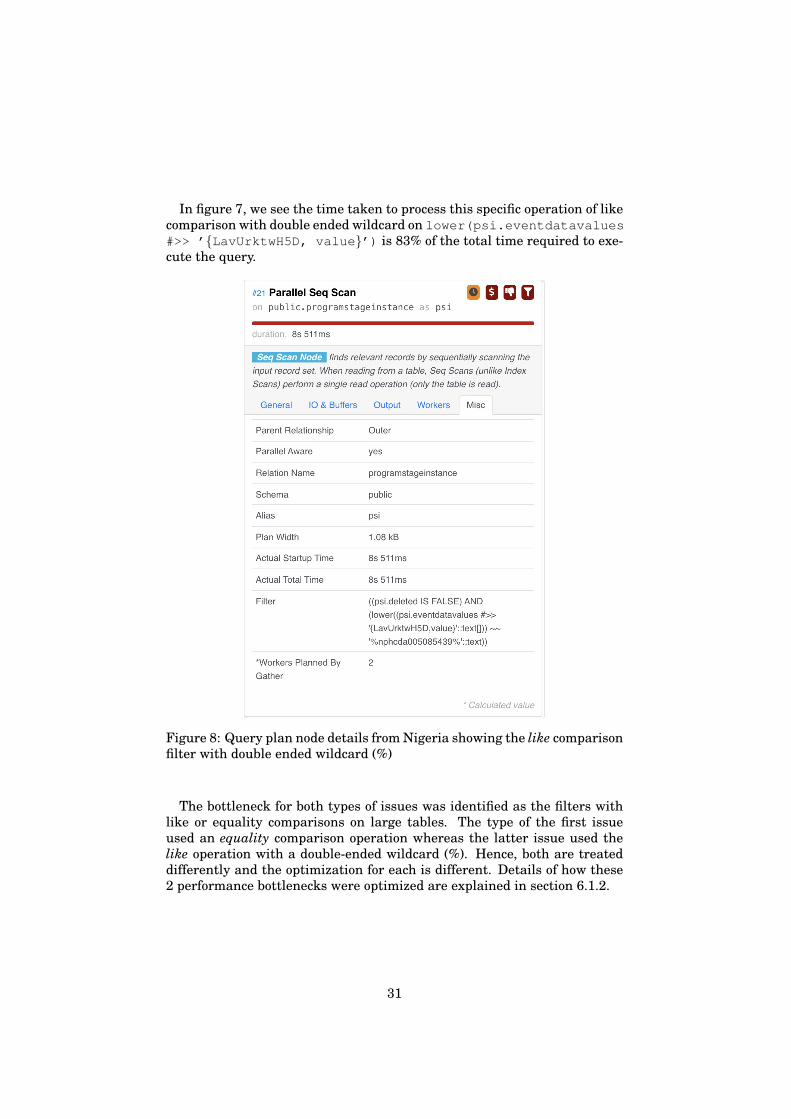
In figure 7, we see the time taken to process this specific operation of likecomparison with double ended wildcard on lower(psi.eventdatavalues#>> ’{LavUrktwH5D, value}’) is 83% of the total time required to exe-cute the query.
Figure 8: Query plan node details from Nigeria showing the like comparisonfilter with double ended wildcard (%)
The bottleneck for both types of issues was identified as the filters withlike or equality comparisons on large tables. The type of the first issueused an equality comparison operation whereas the latter issue used thelike operation with a double-ended wildcard (%). Hence, both are treateddifferently and the optimization for each is different. Details of how these2 performance bottlenecks were optimized are explained in section 6.1.2.
31
5.2 Application BottlenecksIn the previous section 5.1, I focused on Database bottlenecks which weremainly about optimizing database query performance. Database queriesare parts of an application, and this section concerns optimizing processeswithin the application rather than individual queries. If we do not addressprocess deficiencies, it could easily cancel any performance gained from in-dividual queries. In this section, I focus on listing the identified bottleneckson the Application Layer. Out of the layers described in table 1, the Pre-sentation Layer and Domain Layer collectively form the Application layerdiscussed in this section.
A bottleneck in the Application layer means there is an inefficiency in asection of the code. Application bottlenecks can increase the response timesand decrease the throughput of all the RESTful APIs that touch the inef-ficient section of the code. Such application Bottlenecks can either be onthe client-side or server-side. The frontend (client-side) is the presentationlayer that is developed using JavaScript and related technologies. Therecould exist a sub-optimal function or flow in the frontend JavaScript appli-cation which in large-scale systems can even cause the client-side browserto crash or hang. Sub-optimal code execution can also exist in the Java-based backend application running in a JEE compliant container like Tom-cat. This can lead to resource exhaustion and system crashes. Just asdatabase bottlenecks, application bottlenecks also tend to be prominentonly in large-scale Enterprise applications with user access patterns.
Faroult illustrated a great analogy for common performance bottleneckson the application side in their work [13]. The analogy is called the Shop-ping List Problem.
Suppose you have a shopping list for the grocery store. In real life, youwould get into a car, drive to the grocery store, pick up all the items onyour list, get them into the car trunk, drive home, bring them inside, andput them into your fridge. But Imagine that, instead of this, you woulddrive to the store, come in, pick just the first item from your shopping list,drive back home, place this item in the fridge, and head to the store again.Imagine repeating the same sequence of actions for each item on your list.This sounds extremely inefficient for shopping. The fact is that such aninefficient mechanism is seen in many applications when it comes to theirinteraction with databases or APIs.
To put things further into perspective, imagine that to improve the speedof shopping, experts suggest that we should increase the width of the islesin the store or build better highways or equip the car with a more powerfulengine to reach the store faster. Some of these suggestions could, indeed,improve the situation. But no improvement can be compared with the gainsachieved with one simple process improvement - picking up all groceriesduring one single trip.
32

This shopping list problem is often translated into application behavior.Most performance problems are caused by too many queries that are toosmall or too many HTTP requests that are very closely related. The sameanalogy on better highways and powerful car engines can be applied on theapplication side like listed here [13]
1. More powerful computers do not help much, as both the applicationand the database are in a wait state for 99% of time.
2. Higher network bandwidth does not help either. High-bandwidth net-works are efficient for the transfer of bulk amounts of data but can-not significantly improve the time needed for roundtrips. Time de-pends on the number of hops and the number of messages but doesnot depend significantly on message size. Furthermore, the size ofthe packet header does not depend on the message size; hence, thefraction of bandwidth used for payload becomes small for very shortmessages.
3. Distributed servers might improve throughput but not response timeas an application sends data requests sequentially.
Therefore, the best way to optimize the shopping list problem is by re-ducing round trips. The same pattern of the shopping list problem existsin most enterprise applications. In the remaining sections of this chapter, Ifocus on such performance analysis of application bottlenecks in the DHIS2application.
5.2.1 In-efficient API Access PatternSometimes the RESTful API itself be very optimized, but an inefficient
way of accessing the APIs (the process) becomes the bottleneck. For exam-ple, assume there is a customer registration form that is rendered as partof a front-end App. There would naturally be a Customer Registration APIor Customer Details Update API in the backend which the front-end Appwill have to consume. But if the front-end app invokes the API for everyinput field entered by the user, the amount of API invocation will be large.Instead, if the front-end app waits till all the user input fields are popu-lated and then sends all the data using a single API invocation, the num-ber of round-trips to the backend decreases considerably and performanceimproves drastically. Invoking the API for every input field is similar to theShopping List problem described in the previous section 5.2.
A performance issue of a similar nature was reported in Sri Lanka DHIS2Covid Vaccination Tracker Instance. The Tracker Capture App was used totrack the vaccination doses given to each resident in Sri Lanka.
System administrators observed that there existed intermittent databaserow-level locks when updating event data values, table programstagein-stance shown in 2. We investigated a typical end-user flow through theTracker Capture App and observed that for each field input in the Event
33
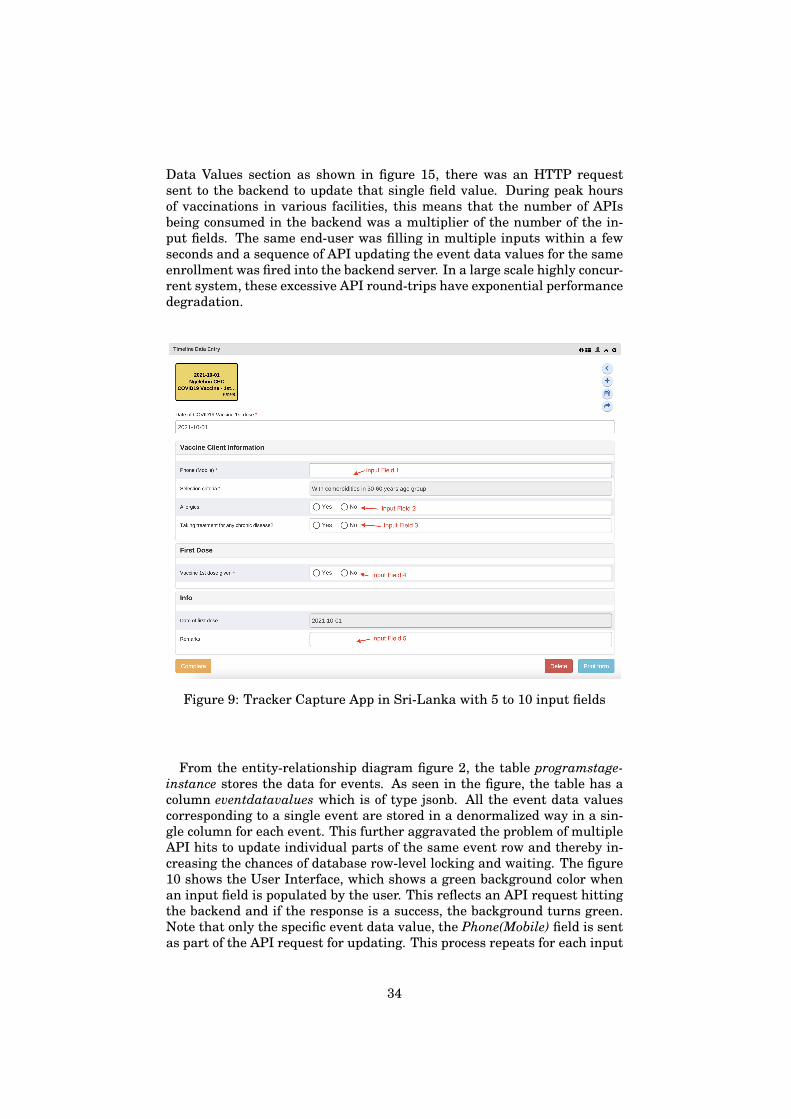
Data Values section as shown in figure 15, there was an HTTP requestsent to the backend to update that single field value. During peak hoursof vaccinations in various facilities, this means that the number of APIsbeing consumed in the backend was a multiplier of the number of the in-put fields. The same end-user was filling in multiple inputs within a fewseconds and a sequence of API updating the event data values for the sameenrollment was fired into the backend server. In a large scale highly concur-rent system, these excessive API round-trips have exponential performancedegradation.
Figure 9: Tracker Capture App in Sri-Lanka with 5 to 10 input fields
From the entity-relationship diagram figure 2, the table programstage-instance stores the data for events. As seen in the figure, the table has acolumn eventdatavalues which is of type jsonb. All the event data valuescorresponding to a single event are stored in a denormalized way in a sin-gle column for each event. This further aggravated the problem of multipleAPI hits to update individual parts of the same event row and thereby in-creasing the chances of database row-level locking and waiting. The figure10 shows the User Interface, which shows a green background color whenan input field is populated by the user. This reflects an API request hittingthe backend and if the response is a success, the background turns green.Note that only the specific event data value, the Phone(Mobile) field is sentas part of the API request for updating. This process repeats for each input
34
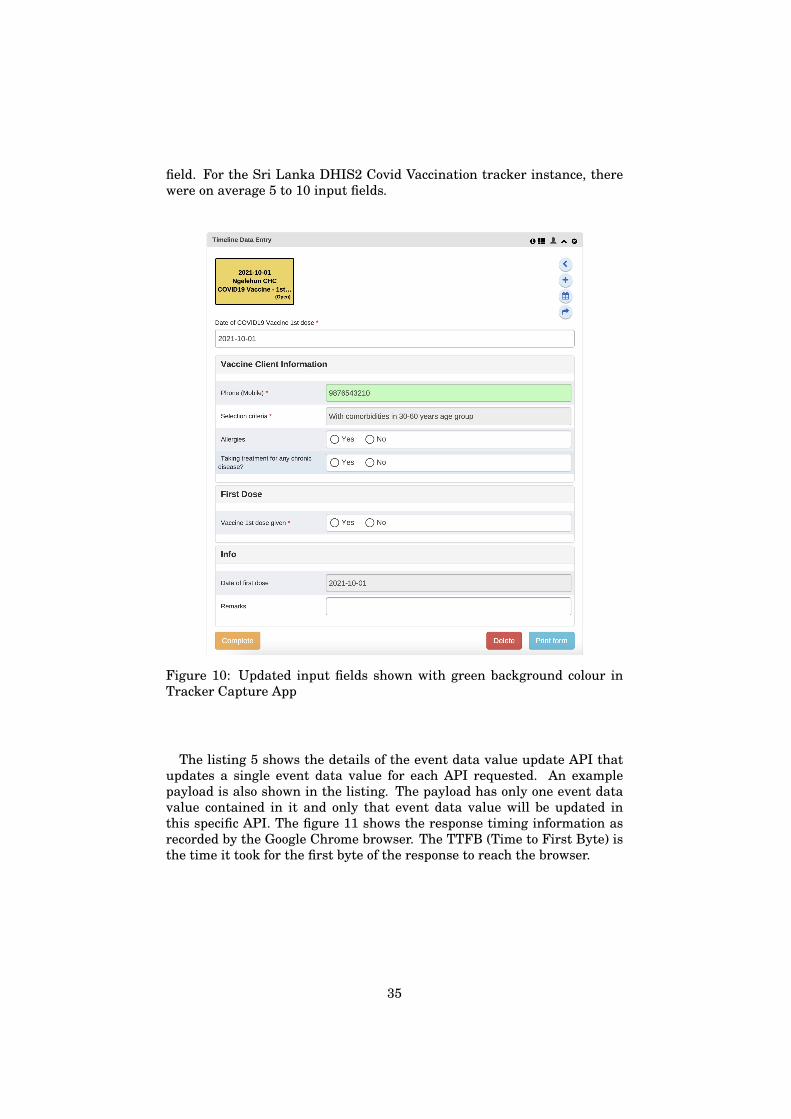
field. For the Sri Lanka DHIS2 Covid Vaccination tracker instance, therewere on average 5 to 10 input fields.
Figure 10: Updated input fields shown with green background colour inTracker Capture App
The listing 5 shows the details of the event data value update API thatupdates a single event data value for each API requested. An examplepayload is also shown in the listing. The payload has only one event datavalue contained in it and only that event data value will be updated inthis specific API. The figure 11 shows the response timing information asrecorded by the Google Chrome browser. The TTFB (Time to First Byte) isthe time it took for the first byte of the response to reach the browser.
35
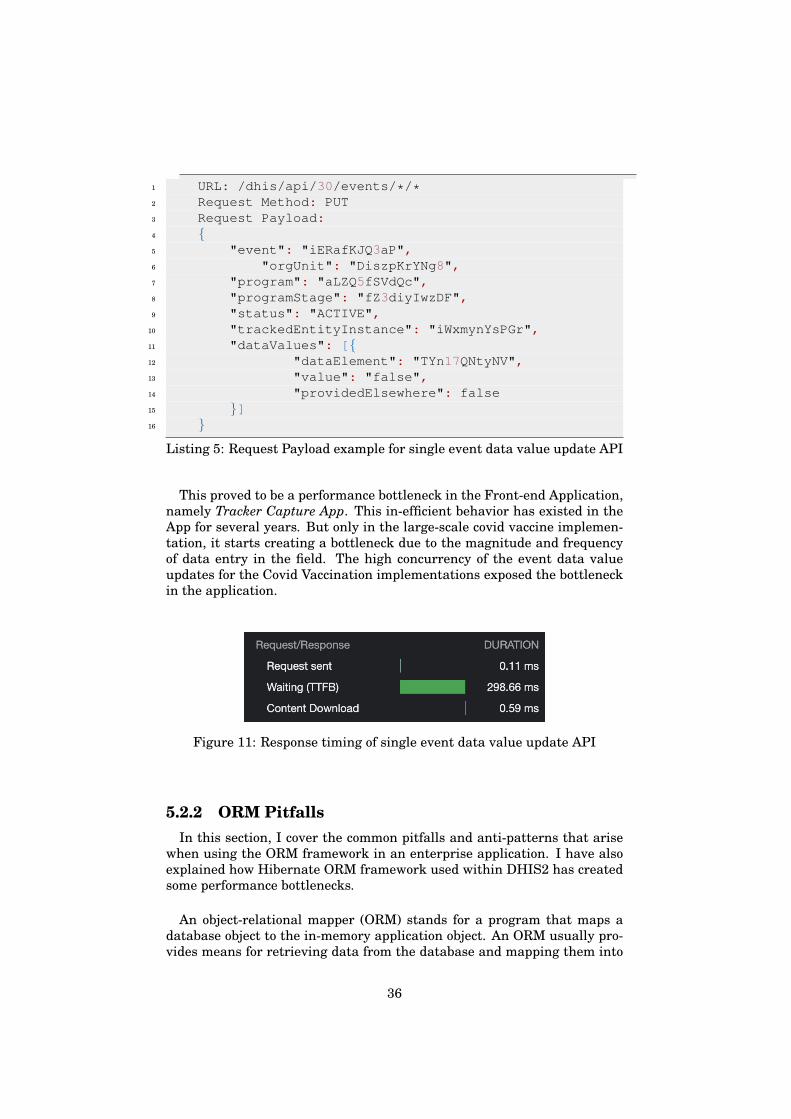
1 URL: /dhis/api/30/events/*/*2 Request Method: PUT3 Request Payload:4 {5 "event": "iERafKJQ3aP",6 "orgUnit": "DiszpKrYNg8",7 "program": "aLZQ5fSVdQc",8 "programStage": "fZ3diyIwzDF",9 "status": "ACTIVE",
10 "trackedEntityInstance": "iWxmynYsPGr",11 "dataValues": [{12 "dataElement": "TYn17QNtyNV",13 "value": "false",14 "providedElsewhere": false15 }]16 }
Listing 5: Request Payload example for single event data value update API
This proved to be a performance bottleneck in the Front-end Application,namely Tracker Capture App. This in-efficient behavior has existed in theApp for several years. But only in the large-scale covid vaccine implemen-tation, it starts creating a bottleneck due to the magnitude and frequencyof data entry in the field. The high concurrency of the event data valueupdates for the Covid Vaccination implementations exposed the bottleneckin the application.
Figure 11: Response timing of single event data value update API
5.2.2 ORM PitfallsIn this section, I cover the common pitfalls and anti-patterns that arise
when using the ORM framework in an enterprise application. I have alsoexplained how Hibernate ORM framework used within DHIS2 has createdsome performance bottlenecks.
An object-relational mapper (ORM) stands for a program that maps adatabase object to the in-memory application object. An ORM usually pro-vides means for retrieving data from the database and mapping them into
36
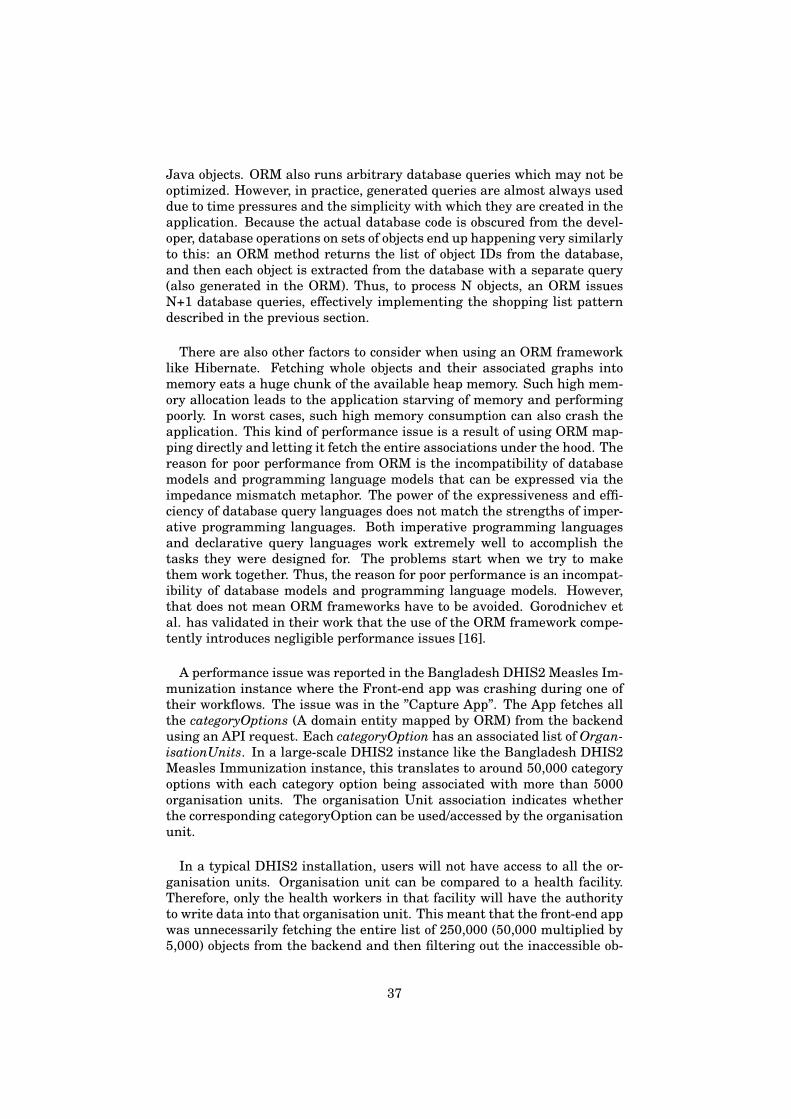
Java objects. ORM also runs arbitrary database queries which may not beoptimized. However, in practice, generated queries are almost always useddue to time pressures and the simplicity with which they are created in theapplication. Because the actual database code is obscured from the devel-oper, database operations on sets of objects end up happening very similarlyto this: an ORM method returns the list of object IDs from the database,and then each object is extracted from the database with a separate query(also generated in the ORM). Thus, to process N objects, an ORM issuesN+1 database queries, effectively implementing the shopping list patterndescribed in the previous section.
There are also other factors to consider when using an ORM frameworklike Hibernate. Fetching whole objects and their associated graphs intomemory eats a huge chunk of the available heap memory. Such high mem-ory allocation leads to the application starving of memory and performingpoorly. In worst cases, such high memory consumption can also crash theapplication. This kind of performance issue is a result of using ORM map-ping directly and letting it fetch the entire associations under the hood. Thereason for poor performance from ORM is the incompatibility of databasemodels and programming language models that can be expressed via theimpedance mismatch metaphor. The power of the expressiveness and effi-ciency of database query languages does not match the strengths of imper-ative programming languages. Both imperative programming languagesand declarative query languages work extremely well to accomplish thetasks they were designed for. The problems start when we try to makethem work together. Thus, the reason for poor performance is an incompat-ibility of database models and programming language models. However,that does not mean ORM frameworks have to be avoided. Gorodnichev etal. has validated in their work that the use of the ORM framework compe-tently introduces negligible performance issues [16].
A performance issue was reported in the Bangladesh DHIS2 Measles Im-munization instance where the Front-end app was crashing during one oftheir workflows. The issue was in the ”Capture App”. The App fetches allthe categoryOptions (A domain entity mapped by ORM) from the backendusing an API request. Each categoryOption has an associated list of Organ-isationUnits. In a large-scale DHIS2 instance like the Bangladesh DHIS2Measles Immunization instance, this translates to around 50,000 categoryoptions with each category option being associated with more than 5000organisation units. The organisation Unit association indicates whetherthe corresponding categoryOption can be used/accessed by the organisationunit.
In a typical DHIS2 installation, users will not have access to all the or-ganisation units. Organisation unit can be compared to a health facility.Therefore, only the health workers in that facility will have the authorityto write data into that organisation unit. This meant that the front-end appwas unnecessarily fetching the entire list of 250,000 (50,000 multiplied by5,000) objects from the backend and then filtering out the inaccessible ob-
37

jects by traversing through them. This traversing caused several browserclients to crash. The fact was that out of these 250,000 objects only a verysmall percentage would be relevant to the logged-in user based on the user’saccess permissions.
An optimization fix was implemented to enable the Bangladesh NationalImmunization campaign to proceed without blockers. The optimization in-volved creating a new parameter restrictToCaptureScope in the same APIrequest, which when set to true, the backend server will perform all thefiltering and traversing logic. The response sent back then will be a smallpayload that contains domain objects relevant to the logged-in user and nofurther traversing or filtering was required from the Front-end App. Thisensured the frontend App never crashed due to the small payload it receivedback from the server, and also the payload contained only the relevant data.
The listing 6 shows the significant code snippet on how the quick fix wasdone for the traversing and filtering logic. Note that, the entities here areall Hibernate ORM mapped entities. The method invocation of getOrgani-sationUnits() on line 7 will internally generate a database query and fetchall the associated organisation unit objects from the database for that spe-cific categoryOption alone. This happens in a for loop as shown in line 5 ofthe listing 6. This is another example of the hibernate n+1 query problemwhich is also illustrated by the Shopping list problem in the previous sec-tion. The fix has eliminated the category options that are not accessible tothe logged-in user but still has to trim the associated organisation unit listby traversing through them.
1 Set<String> orgUnits = organisationUnitService.getOrganisationUnitsByQuery(params).stream().map(orgUnit - >orgUnit.getUid()).collect(
2 Collectors.toSet());3
4 //This for loop does the traversal of ORM entities5 for (T entity: entityList) {6 OrganisationUnitAssignable e = (OrganisationUnitAssignable)
entity;7 if (e.getOrganisationUnits() != null && e.
getOrganisationUnits().size() > 0) {8 //for each entity, the association is fetched and filtered.9 e.setOrganisationUnits(
10 e.getOrganisationUnits().stream().filter(ou - >orgUnits.contains(ou.getUid())).collect(Collectors.toSet()));
11 }12 }
Listing 6: Java code snippet showing a common ORM anti-pattern
In addition to the multiple round trips to the database because of then+1 queries problem, each list of associations is also large. The quick fix
38
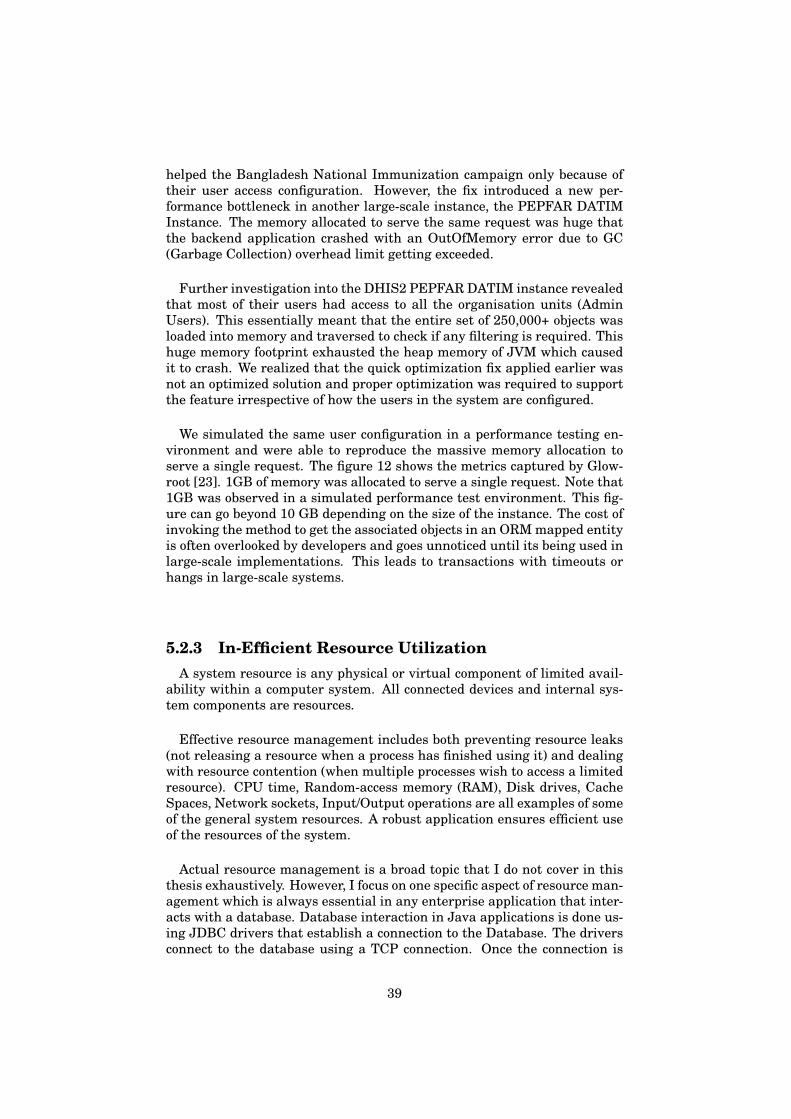
helped the Bangladesh National Immunization campaign only because oftheir user access configuration. However, the fix introduced a new per-formance bottleneck in another large-scale instance, the PEPFAR DATIMInstance. The memory allocated to serve the same request was huge thatthe backend application crashed with an OutOfMemory error due to GC(Garbage Collection) overhead limit getting exceeded.
Further investigation into the DHIS2 PEPFAR DATIM instance revealedthat most of their users had access to all the organisation units (AdminUsers). This essentially meant that the entire set of 250,000+ objects wasloaded into memory and traversed to check if any filtering is required. Thishuge memory footprint exhausted the heap memory of JVM which causedit to crash. We realized that the quick optimization fix applied earlier wasnot an optimized solution and proper optimization was required to supportthe feature irrespective of how the users in the system are configured.
We simulated the same user configuration in a performance testing en-vironment and were able to reproduce the massive memory allocation toserve a single request. The figure 12 shows the metrics captured by Glow-root [23]. 1GB of memory was allocated to serve a single request. Note that1GB was observed in a simulated performance test environment. This fig-ure can go beyond 10 GB depending on the size of the instance. The cost ofinvoking the method to get the associated objects in an ORM mapped entityis often overlooked by developers and goes unnoticed until its being used inlarge-scale implementations. This leads to transactions with timeouts orhangs in large-scale systems.
5.2.3 In-Efficient Resource UtilizationA system resource is any physical or virtual component of limited avail-
ability within a computer system. All connected devices and internal sys-tem components are resources.
Effective resource management includes both preventing resource leaks(not releasing a resource when a process has finished using it) and dealingwith resource contention (when multiple processes wish to access a limitedresource). CPU time, Random-access memory (RAM), Disk drives, CacheSpaces, Network sockets, Input/Output operations are all examples of someof the general system resources. A robust application ensures efficient useof the resources of the system.
Actual resource management is a broad topic that I do not cover in thisthesis exhaustively. However, I focus on one specific aspect of resource man-agement which is always essential in any enterprise application that inter-acts with a database. Database interaction in Java applications is done us-ing JDBC drivers that establish a connection to the Database. The driversconnect to the database using a TCP connection. Once the connection is
39
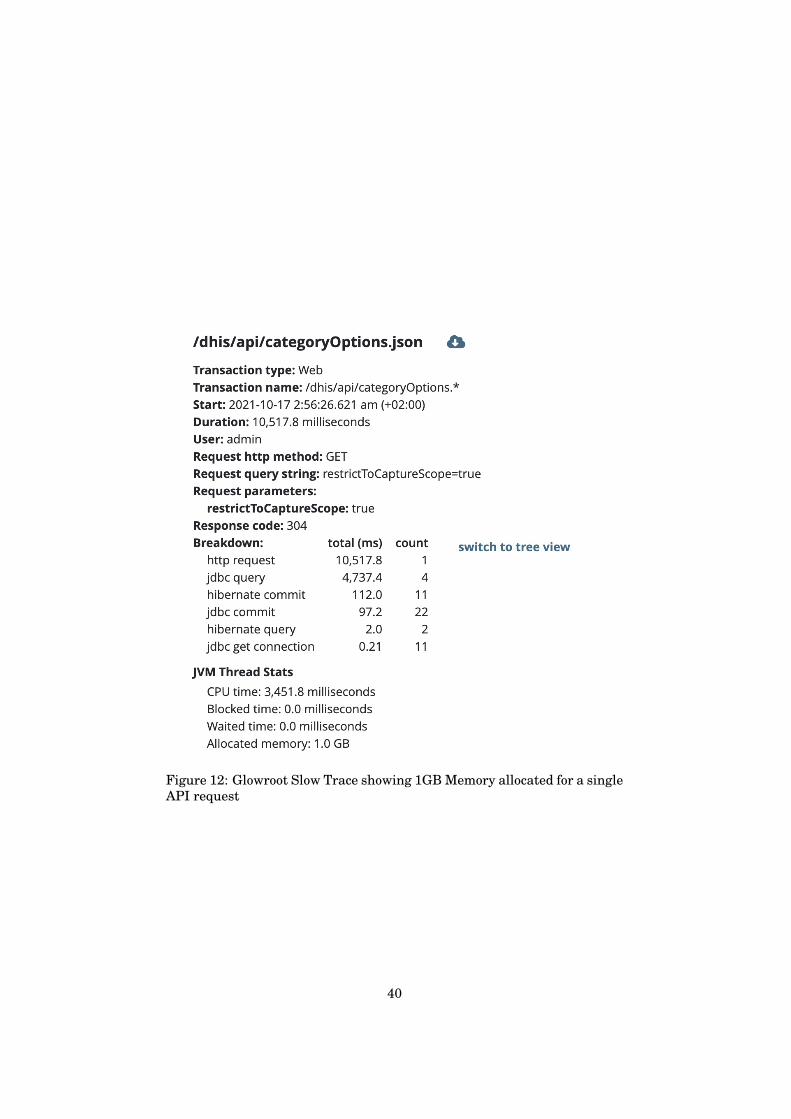
Figure 12: Glowroot Slow Trace showing 1GB Memory allocated for a singleAPI request
40
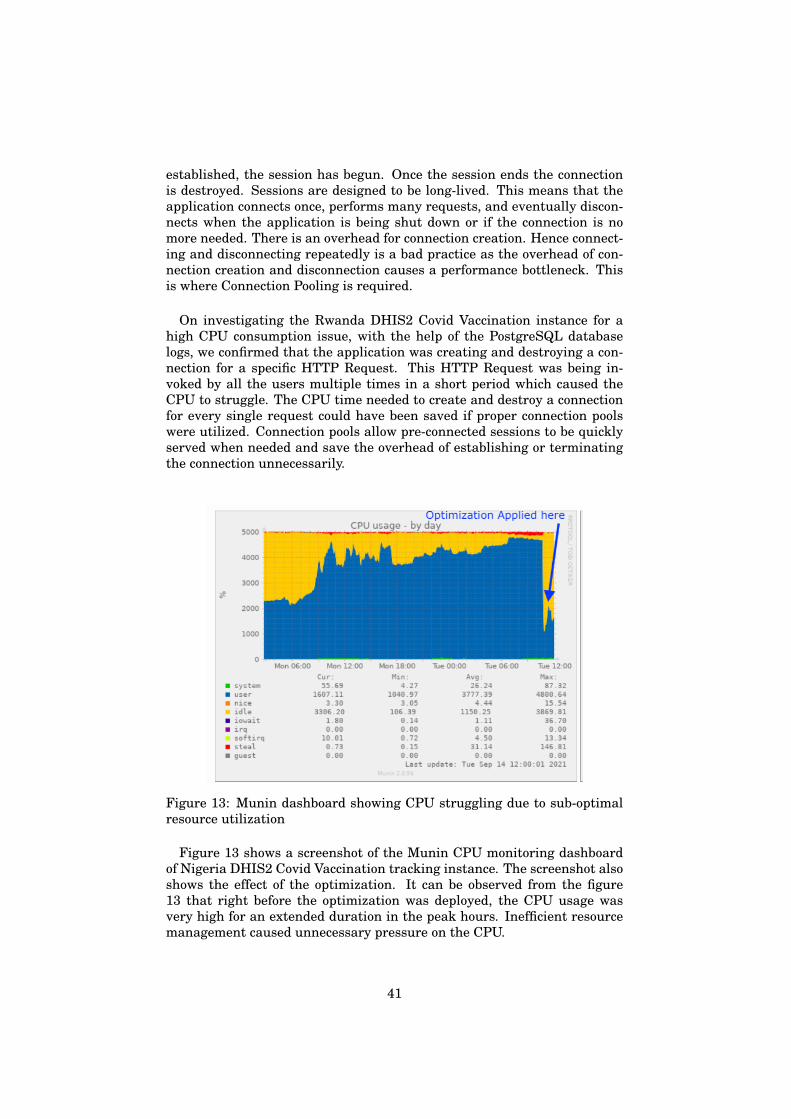
established, the session has begun. Once the session ends the connectionis destroyed. Sessions are designed to be long-lived. This means that theapplication connects once, performs many requests, and eventually discon-nects when the application is being shut down or if the connection is nomore needed. There is an overhead for connection creation. Hence connect-ing and disconnecting repeatedly is a bad practice as the overhead of con-nection creation and disconnection causes a performance bottleneck. Thisis where Connection Pooling is required.
On investigating the Rwanda DHIS2 Covid Vaccination instance for ahigh CPU consumption issue, with the help of the PostgreSQL databaselogs, we confirmed that the application was creating and destroying a con-nection for a specific HTTP Request. This HTTP Request was being in-voked by all the users multiple times in a short period which caused theCPU to struggle. The CPU time needed to create and destroy a connectionfor every single request could have been saved if proper connection poolswere utilized. Connection pools allow pre-connected sessions to be quicklyserved when needed and save the overhead of establishing or terminatingthe connection unnecessarily.
Figure 13: Munin dashboard showing CPU struggling due to sub-optimalresource utilization
Figure 13 shows a screenshot of the Munin CPU monitoring dashboardof Nigeria DHIS2 Covid Vaccination tracking instance. The screenshot alsoshows the effect of the optimization. It can be observed from the figure13 that right before the optimization was deployed, the CPU usage wasvery high for an extended duration in the peak hours. Inefficient resourcemanagement caused unnecessary pressure on the CPU.
41
6 Optimizations and ResultsThe objective of any optimization is to attain a better performance of the
whole system. It might be response time or throughput or a balance ofboth. Optimizations that have no impact on overall performance are notworth the effort. Optimizations have to be SMART (specific, measurable,achievable, results-based, and time-bound)[12]. The table 4 is inspired bySMART goal framework for optimization goals.
Goal DHIS2 Example
Specific Registration of TEI should be completed be-fore the defined threshold time.
Measurable Response time for search tracked entity in-stances by unique attributes query shouldnot exceed 5 seconds.
Achievable When data volume grows, the query responsetime should not grow more than logarithmi-cally
Result-based Event data value updates should not causeany database locking
Time-bound We should release an optimized event datavalue update flow in the patch released nextmonth
Table 4: SMART goals for DHIS2 optimizations
Optimization may involve optimizing the software development processesas well. An example is when developers seek further clarification of thebusiness requirement and question the status quo. Such discussions canlead the way to create more declarative and performant queries and makechanges in the application to better optimize it. On the application side,even if a single query takes less than 0.1 seconds if the API takes 10 secondsto respond, then there may be too many small queries being executed by theapplication on the database to serve that request.
The life of an application does not end after release in production, andoptimization is a continuous process. We should continually keep an eye on
42
the system performance, not only on the execution times but on databasevolume trends and access patterns. A query may be very performant in thebeginning, but query execution time may change because data volume in-creased or the data distribution changed or execution frequency increased.In addition, there will also be new indexes and other improvements in eachnew PostgreSQL release, and some of them may be so significant that theyprompt further optimizations.
In the remaining part of this section, I elaborate on the optimizationsdone for the bottlenecks identified in section 5.2. Both the Application sideoptimizations and Database side optimizations are explained separately inthe corresponding subsections of this chapter.
43

6.1 Database OptimizationsThe best approach when trying to optimize database queries is to Think
like a database! [12]. Observing the query from the point of view of adatabase engine, and imagining what it has to do to execute that query.The aim has to be to avoid imposing suboptimal execution plans.
Since two queries yielding the same result may be executed differently,utilizing different resources and taking a different amount of time, opti-mization and thinking like a database are core parts of SQL developmentand optimization. The database engine interprets SQL queries by parsingthem into a logical plan, transforming the results, choosing algorithms toimplement the logical plan, and finally executing the chosen algorithms.
When queries are not written declaratively, the original purpose of aquery might not be evident. Developers writing the database queries shouldbe well aware of the business requirement. Asking more questions to un-derstand what exactly is needed and what is not is perhaps the first and themost critical optimization step. Some of those answers will help to trans-form a non-performant query into a performant one. An SQL query cannotbe optimized in isolation, outside the context of its purpose and the envi-ronment in which it is executed.
6.1.1 Query RewritingA poorly constructed query, in other words, an in-efficient query, can be
rewritten to satisfy the same requirement but better optimized for perfor-mance. The main points to remember when rewriting an in-efficient queryare the following.
• Avoid fetching whole tables unless it is needed. Pagination should beenabled by default and only a subset of records should be fetched at atime.
• When constructing a complex query, we should make sure the query isdeclarative enough for the optimizer to find the best execution path. Itis beneficial to start with adding all the clauses and conditionals thatare responsible for narrowing or limiting the results. This means allthe filtering predicates are applied early to limit the result size. Thisway, the subsequent left joins will have fewer records to join with.
• Avoid unnecessary usage of computed columns and sorting based oncomputed columns. On large tables, the columns have to be computedfor every row by the database engine. Unless the computed column isindexed, the computation happens every time the query is executed.
In section 5.1.1, we have seen the inefficient query in listing 1 that cre-ated a bottleneck in the Sri Lanka Covid Vaccination Tracker instance.Keeping the above points in mind we rewrote the query. The new queryis as shown in listing 7. The query is trimmed for brevity.
44
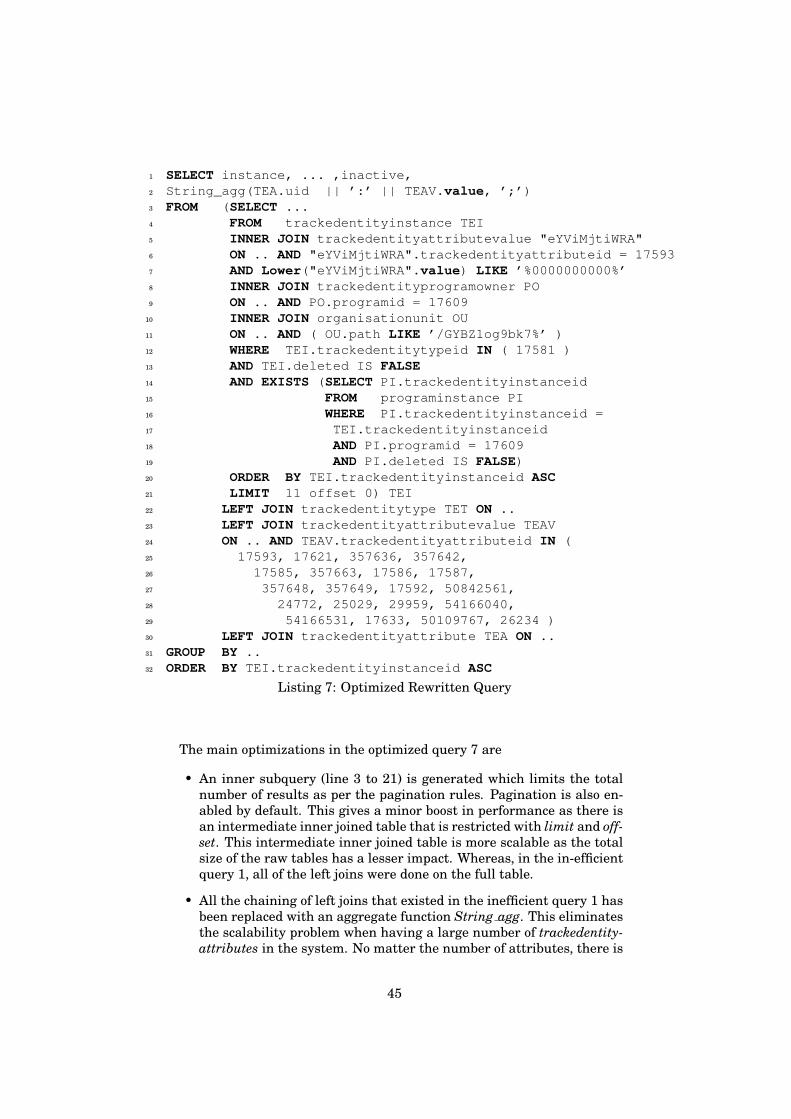
1 SELECT instance, ... ,inactive,2 String_agg(TEA.uid || ’:’ || TEAV.value, ’;’)3 FROM (SELECT ...4 FROM trackedentityinstance TEI5 INNER JOIN trackedentityattributevalue "eYViMjtiWRA"6 ON .. AND "eYViMjtiWRA".trackedentityattributeid = 175937 AND Lower("eYViMjtiWRA".value) LIKE ’%0000000000%’8 INNER JOIN trackedentityprogramowner PO9 ON .. AND PO.programid = 17609
10 INNER JOIN organisationunit OU11 ON .. AND ( OU.path LIKE ’/GYBZ1og9bk7%’ )12 WHERE TEI.trackedentitytypeid IN ( 17581 )13 AND TEI.deleted IS FALSE14 AND EXISTS (SELECT PI.trackedentityinstanceid15 FROM programinstance PI16 WHERE PI.trackedentityinstanceid =17 TEI.trackedentityinstanceid18 AND PI.programid = 1760919 AND PI.deleted IS FALSE)20 ORDER BY TEI.trackedentityinstanceid ASC21 LIMIT 11 offset 0) TEI22 LEFT JOIN trackedentitytype TET ON ..23 LEFT JOIN trackedentityattributevalue TEAV24 ON .. AND TEAV.trackedentityattributeid IN (25 17593, 17621, 357636, 357642,26 17585, 357663, 17586, 17587,27 357648, 357649, 17592, 50842561,28 24772, 25029, 29959, 54166040,29 54166531, 17633, 50109767, 26234 )30 LEFT JOIN trackedentityattribute TEA ON ..31 GROUP BY ..32 ORDER BY TEI.trackedentityinstanceid ASC
Listing 7: Optimized Rewritten Query
The main optimizations in the optimized query 7 are
• An inner subquery (line 3 to 21) is generated which limits the totalnumber of results as per the pagination rules. Pagination is also en-abled by default. This gives a minor boost in performance as there isan intermediate inner joined table that is restricted with limit and off-set. This intermediate inner joined table is more scalable as the totalsize of the raw tables has a lesser impact. Whereas, in the in-efficientquery 1, all of the left joins were done on the full table.
• All the chaining of left joins that existed in the inefficient query 1 hasbeen replaced with an aggregate function String agg. This eliminatesthe scalability problem when having a large number of trackedentity-attributes in the system. No matter the number of attributes, there is
45
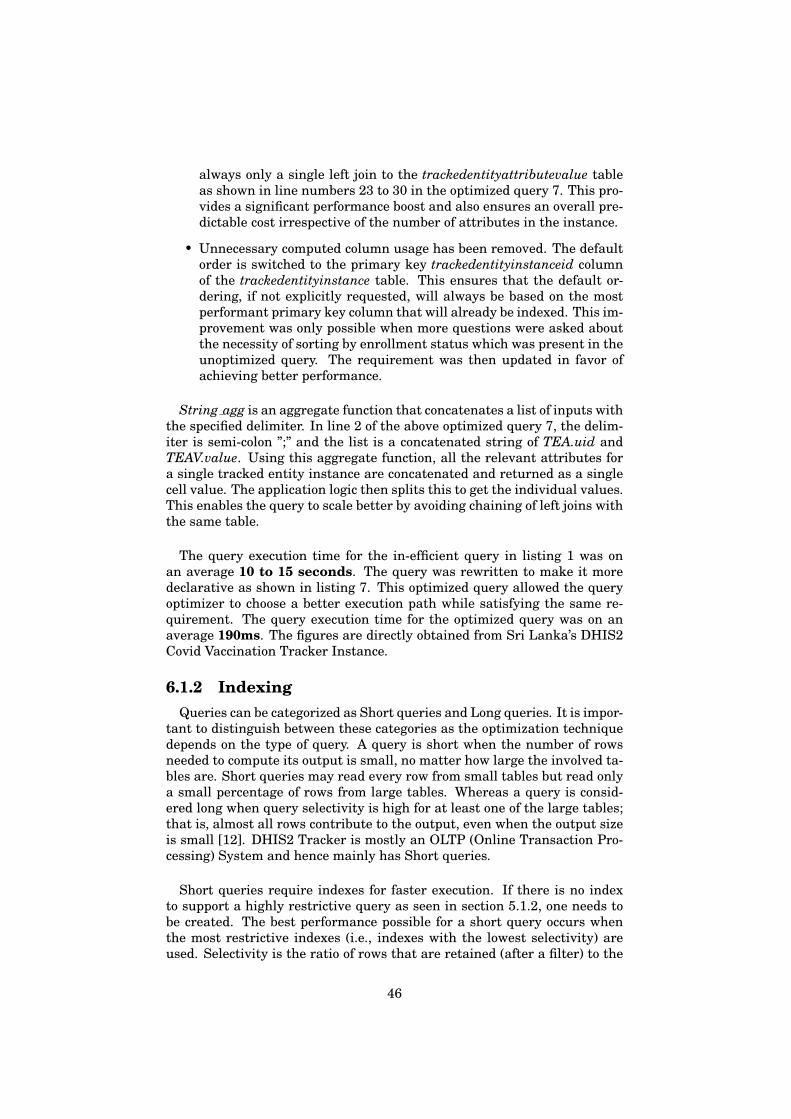
always only a single left join to the trackedentityattributevalue tableas shown in line numbers 23 to 30 in the optimized query 7. This pro-vides a significant performance boost and also ensures an overall pre-dictable cost irrespective of the number of attributes in the instance.
• Unnecessary computed column usage has been removed. The defaultorder is switched to the primary key trackedentityinstanceid columnof the trackedentityinstance table. This ensures that the default or-dering, if not explicitly requested, will always be based on the mostperformant primary key column that will already be indexed. This im-provement was only possible when more questions were asked aboutthe necessity of sorting by enrollment status which was present in theunoptimized query. The requirement was then updated in favor ofachieving better performance.
String agg is an aggregate function that concatenates a list of inputs withthe specified delimiter. In line 2 of the above optimized query 7, the delim-iter is semi-colon ”;” and the list is a concatenated string of TEA.uid andTEAV.value. Using this aggregate function, all the relevant attributes fora single tracked entity instance are concatenated and returned as a singlecell value. The application logic then splits this to get the individual values.This enables the query to scale better by avoiding chaining of left joins withthe same table.
The query execution time for the in-efficient query in listing 1 was onan average 10 to 15 seconds. The query was rewritten to make it moredeclarative as shown in listing 7. This optimized query allowed the queryoptimizer to choose a better execution path while satisfying the same re-quirement. The query execution time for the optimized query was on anaverage 190ms. The figures are directly obtained from Sri Lanka’s DHIS2Covid Vaccination Tracker Instance.
6.1.2 IndexingQueries can be categorized as Short queries and Long queries. It is impor-
tant to distinguish between these categories as the optimization techniquedepends on the type of query. A query is short when the number of rowsneeded to compute its output is small, no matter how large the involved ta-bles are. Short queries may read every row from small tables but read onlya small percentage of rows from large tables. Whereas a query is consid-ered long when query selectivity is high for at least one of the large tables;that is, almost all rows contribute to the output, even when the output sizeis small [12]. DHIS2 Tracker is mostly an OLTP (Online Transaction Pro-cessing) System and hence mainly has Short queries.
Short queries require indexes for faster execution. If there is no indexto support a highly restrictive query as seen in section 5.1.2, one needs tobe created. The best performance possible for a short query occurs whenthe most restrictive indexes (i.e., indexes with the lowest selectivity) areused. Selectivity is the ratio of rows that are retained (after a filter) to the
46
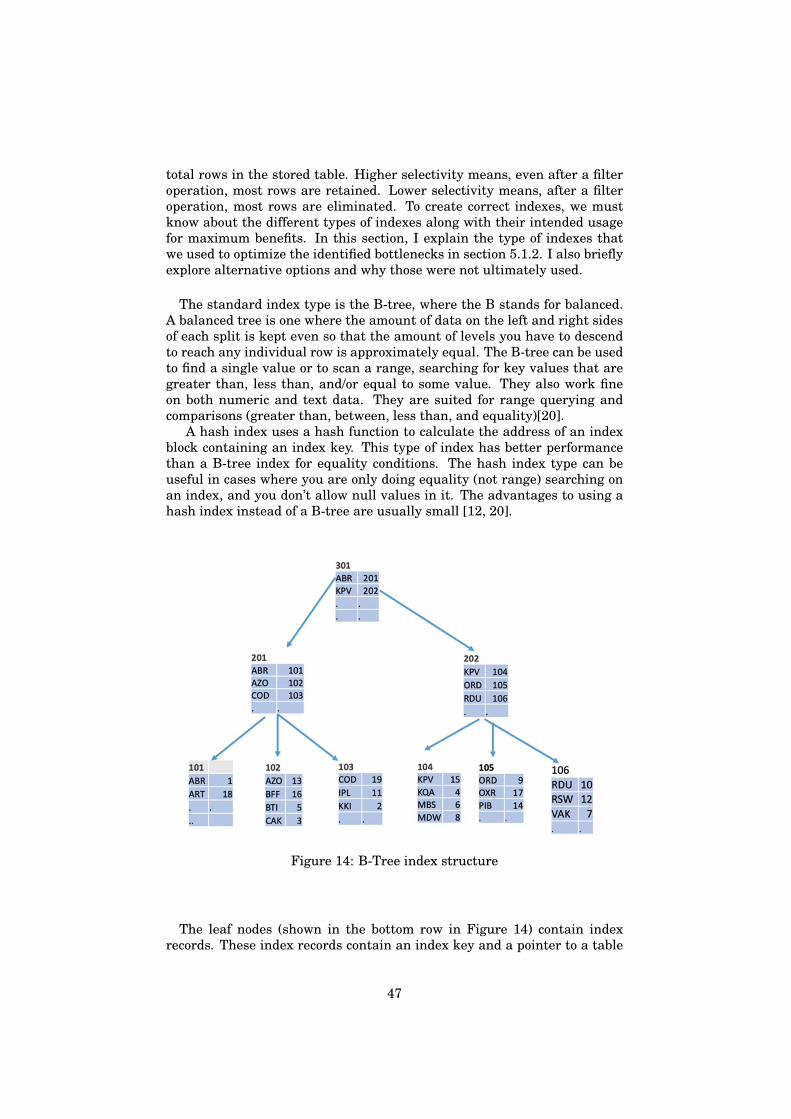
total rows in the stored table. Higher selectivity means, even after a filteroperation, most rows are retained. Lower selectivity means, after a filteroperation, most rows are eliminated. To create correct indexes, we mustknow about the different types of indexes along with their intended usagefor maximum benefits. In this section, I explain the type of indexes thatwe used to optimize the identified bottlenecks in section 5.1.2. I also brieflyexplore alternative options and why those were not ultimately used.
The standard index type is the B-tree, where the B stands for balanced.A balanced tree is one where the amount of data on the left and right sidesof each split is kept even so that the amount of levels you have to descendto reach any individual row is approximately equal. The B-tree can be usedto find a single value or to scan a range, searching for key values that aregreater than, less than, and/or equal to some value. They also work fineon both numeric and text data. They are suited for range querying andcomparisons (greater than, between, less than, and equality)[20].
A hash index uses a hash function to calculate the address of an indexblock containing an index key. This type of index has better performancethan a B-tree index for equality conditions. The hash index type can beuseful in cases where you are only doing equality (not range) searching onan index, and you don’t allow null values in it. The advantages to using ahash index instead of a B-tree are usually small [12, 20].
Figure 14: B-Tree index structure
The leaf nodes (shown in the bottom row in Figure 14) contain indexrecords. These index records contain an index key and a pointer to a table
47

row. Non-leaf nodes (located at all levels except the bottom) contain recordsthat consist of the smallest key in a block located at the next level and apointer to this block. All records in all blocks are ordered, and at least halfof the block capacity is used in every block.
Any search for a key K starts from the root node of the B-tree. Duringthe block lookup, the largest key P not exceeding K is found, and then thesearch continues in the block pointed to by the pointer associated with Puntil the leaf node is reached, where a pointer refers to table rows. Thenumber of accessed nodes is equal to the depth of the tree. The key K isnot necessarily stored in the index, but the search finds either the key orthe position where it could be located. B-trees also support range search(expressed as a between operation in SQL). As soon as the lower end of therange is located, all index keys in the range are obtained with a sequentialscan of leaf nodes until the upper end of the range is reached. A scan of leafnodes is also needed to obtain all pointers if the index is not unique (i.e., anindex value may correspond to more than one row).
B-trees are a sensible default in PostgreSQL. No lookup algorithm canfind an index key among N different keys faster than in log N time (mea-sured in CPU instructions). This performance is achieved with a binarysearch on an ordered list or with binary trees. However, the cost of updates(such as insertions of new keys) can be very high for both ordered lists andbinary trees: insertion of a single record can cause complete restructur-ing. This makes both structures unusable for external storage. In contrast,B-trees can be modified without significant overhead. When a record is in-serted, the restructuring is limited to one block. If the block capacity isexceeded, then the block is split into two blocks, and the update is prop-agated to upper levels. In the worst case, the number of modified blockscannot exceed the depth of the tree. In PostgreSQL, a B-tree index can becreated for any ordinal data type; that is, for any two distinct values of thedata type, one value is less than the other. This includes user-defined types.
It may also be useful to have multiple b-tree indexes in the same tabledepending on querying and filtering patterns. A bitmap is an auxiliarydata structure that is used internally in PostgreSQL for several differentpurposes. Bitmaps can be considered a kind of index: they are built tofacilitate access to other data structures containing several data blocks.Typically, bitmaps are used to compactly represent the properties of tabledata. Usually, a bitmap contains one bit for each block (8192 bytes). Thevalue of the bit is 1 if the block has a property and 0 if it hasn’t. Figure 15shows how bitmaps are used to access data through multiple indexes[12].
The database engine starts by scanning both indexes and building abitmap for each that indicates which data blocks contain table rows withrequested values. These bitmaps are shown in the rows labeled Index 1and Index 2. As soon as these bitmaps are created, the engine performs a
48
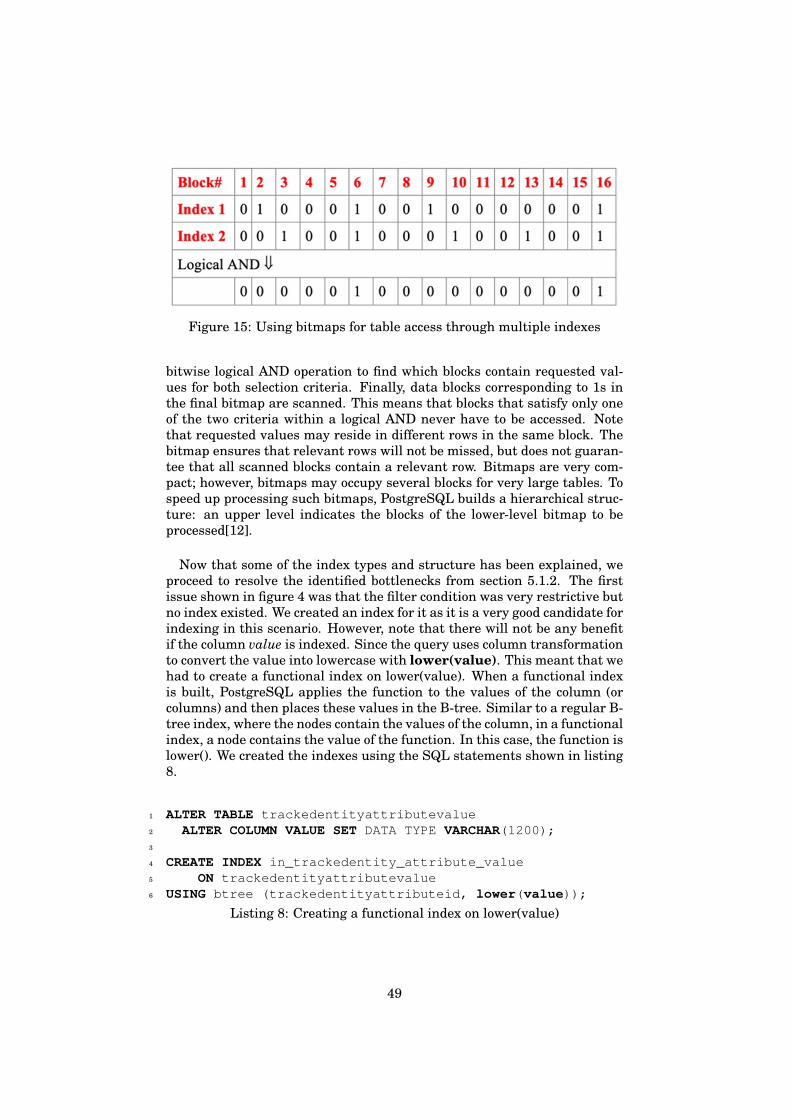
Figure 15: Using bitmaps for table access through multiple indexes
bitwise logical AND operation to find which blocks contain requested val-ues for both selection criteria. Finally, data blocks corresponding to 1s inthe final bitmap are scanned. This means that blocks that satisfy only oneof the two criteria within a logical AND never have to be accessed. Notethat requested values may reside in different rows in the same block. Thebitmap ensures that relevant rows will not be missed, but does not guaran-tee that all scanned blocks contain a relevant row. Bitmaps are very com-pact; however, bitmaps may occupy several blocks for very large tables. Tospeed up processing such bitmaps, PostgreSQL builds a hierarchical struc-ture: an upper level indicates the blocks of the lower-level bitmap to beprocessed[12].
Now that some of the index types and structure has been explained, weproceed to resolve the identified bottlenecks from section 5.1.2. The firstissue shown in figure 4 was that the filter condition was very restrictive butno index existed. We created an index for it as it is a very good candidate forindexing in this scenario. However, note that there will not be any benefitif the column value is indexed. Since the query uses column transformationto convert the value into lowercase with lower(value). This meant that wehad to create a functional index on lower(value). When a functional indexis built, PostgreSQL applies the function to the values of the column (orcolumns) and then places these values in the B-tree. Similar to a regular B-tree index, where the nodes contain the values of the column, in a functionalindex, a node contains the value of the function. In this case, the function islower(). We created the indexes using the SQL statements shown in listing8.
1 ALTER TABLE trackedentityattributevalue2 ALTER COLUMN VALUE SET DATA TYPE VARCHAR(1200);3
4 CREATE INDEX in_trackedentity_attribute_value5 ON trackedentityattributevalue6 USING btree (trackedentityattributeid, lower(value));
Listing 8: Creating a functional index on lower(value)
49
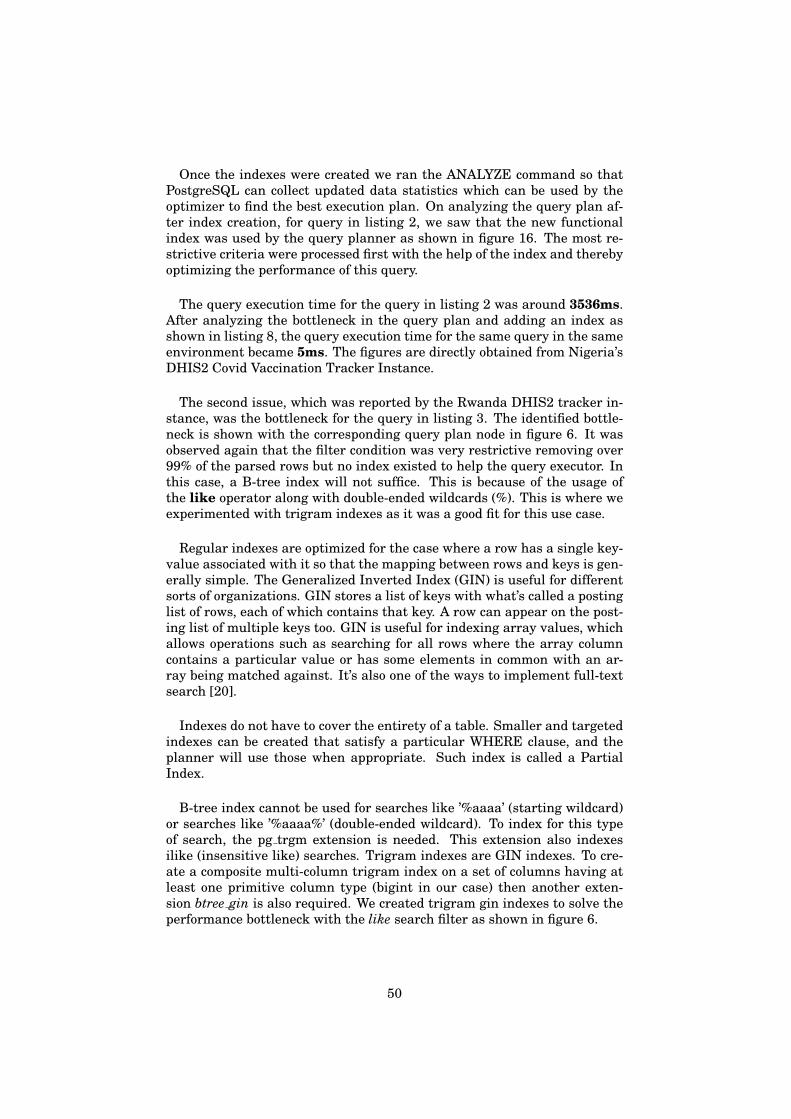
Once the indexes were created we ran the ANALYZE command so thatPostgreSQL can collect updated data statistics which can be used by theoptimizer to find the best execution plan. On analyzing the query plan af-ter index creation, for query in listing 2, we saw that the new functionalindex was used by the query planner as shown in figure 16. The most re-strictive criteria were processed first with the help of the index and therebyoptimizing the performance of this query.
The query execution time for the query in listing 2 was around 3536ms.After analyzing the bottleneck in the query plan and adding an index asshown in listing 8, the query execution time for the same query in the sameenvironment became 5ms. The figures are directly obtained from Nigeria’sDHIS2 Covid Vaccination Tracker Instance.
The second issue, which was reported by the Rwanda DHIS2 tracker in-stance, was the bottleneck for the query in listing 3. The identified bottle-neck is shown with the corresponding query plan node in figure 6. It wasobserved again that the filter condition was very restrictive removing over99% of the parsed rows but no index existed to help the query executor. Inthis case, a B-tree index will not suffice. This is because of the usage ofthe like operator along with double-ended wildcards (%). This is where weexperimented with trigram indexes as it was a good fit for this use case.
Regular indexes are optimized for the case where a row has a single key-value associated with it so that the mapping between rows and keys is gen-erally simple. The Generalized Inverted Index (GIN) is useful for differentsorts of organizations. GIN stores a list of keys with what’s called a postinglist of rows, each of which contains that key. A row can appear on the post-ing list of multiple keys too. GIN is useful for indexing array values, whichallows operations such as searching for all rows where the array columncontains a particular value or has some elements in common with an ar-ray being matched against. It’s also one of the ways to implement full-textsearch [20].
Indexes do not have to cover the entirety of a table. Smaller and targetedindexes can be created that satisfy a particular WHERE clause, and theplanner will use those when appropriate. Such index is called a PartialIndex.
B-tree index cannot be used for searches like ’%aaaa’ (starting wildcard)or searches like ’%aaaa%’ (double-ended wildcard). To index for this typeof search, the pg trgm extension is needed. This extension also indexesilike (insensitive like) searches. Trigram indexes are GIN indexes. To cre-ate a composite multi-column trigram index on a set of columns having atleast one primitive column type (bigint in our case) then another exten-sion btree gin is also required. We created trigram gin indexes to solve theperformance bottleneck with the like search filter as shown in figure 6.
50
1 CREATE EXTENSION pg_trgm;2 CREATE EXTENSION btree_gin;3
4 CREATE INDEX in_gin_teavalue_34615 ON trackedentityattributevalue USING6 gin (trackedentityinstanceid, lower(value) gin_trgm_ops)7 WHERE trackedentityattributeid = 3461;
Listing 9: Creating a partial trigram gin index on lower(value)
Figure 16: Optimized Query plan node in Rwanda showing the new indexbeing used effectively.
Since both of the extensions, pg trgm and btree gin are already part of thePostgreSQL installation bundle, we created the extensions right away in
51
Rwanda DHIS2 Covid Vaccination instance. We then created 3 specific par-tial multi-column trigram indexes on the First Name attribute, Surnameattribute and Phone Number attribute in the table trackedentityattribute-value. Listing 9 shows the sql statements used to create the extensions andone of the 3 partial indexes.
Once the extensions and trigram indexes were created, we analyzed thequery plan node again. The same query in listing 3 was used to obtain theexecution plan and the relevant query plan node is shown in figure 16. Weconfirmed that the new trigram index was used very effectively by the queryplanner. Since the index had low selectivity, the speed of look-up increasedmultiple folds.
The query execution time for the query in listing 3 was around 1281ms.After analyzing the bottleneck in the query plan and adding an index asshown in listing 9, the query execution time for the same query in the sameenvironment decreased to 13ms. The figures are directly obtained fromRwanda’s DHIS2 Covid Vaccination Tracker Instance.
We resolved a very similar bottleneck with trigram indexes in the NigeriaDHIS2 Covid Vaccination instance where their QR code searches were veryslow. We created a specific trigram index on the specific jsonb attributethat was searched in the table programstageinstance. Listing 10 shows theindex creation statements.
1 CREATE INDEX in_gin_psi_edv_64527_2330472 ON programstageinstance USING3 gin(lower(eventdatavalues #>> ’{LavUrktwH5D, value}’)4 gin_trgm_ops);
Listing 10: Creating a trigram gin index on a jsonb column for a specificattribute
52
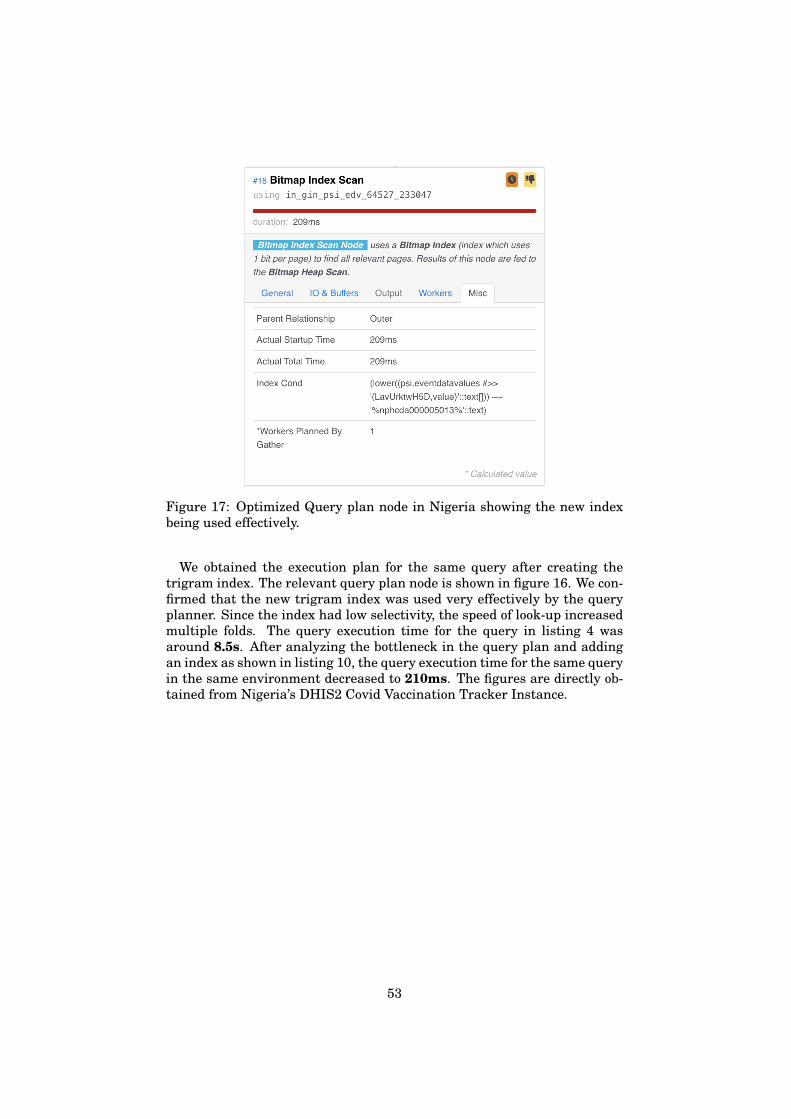
Figure 17: Optimized Query plan node in Nigeria showing the new indexbeing used effectively.
We obtained the execution plan for the same query after creating thetrigram index. The relevant query plan node is shown in figure 16. We con-firmed that the new trigram index was used very effectively by the queryplanner. Since the index had low selectivity, the speed of look-up increasedmultiple folds. The query execution time for the query in listing 4 wasaround 8.5s. After analyzing the bottleneck in the query plan and addingan index as shown in listing 10, the query execution time for the same queryin the same environment decreased to 210ms. The figures are directly ob-tained from Nigeria’s DHIS2 Covid Vaccination Tracker Instance.
53
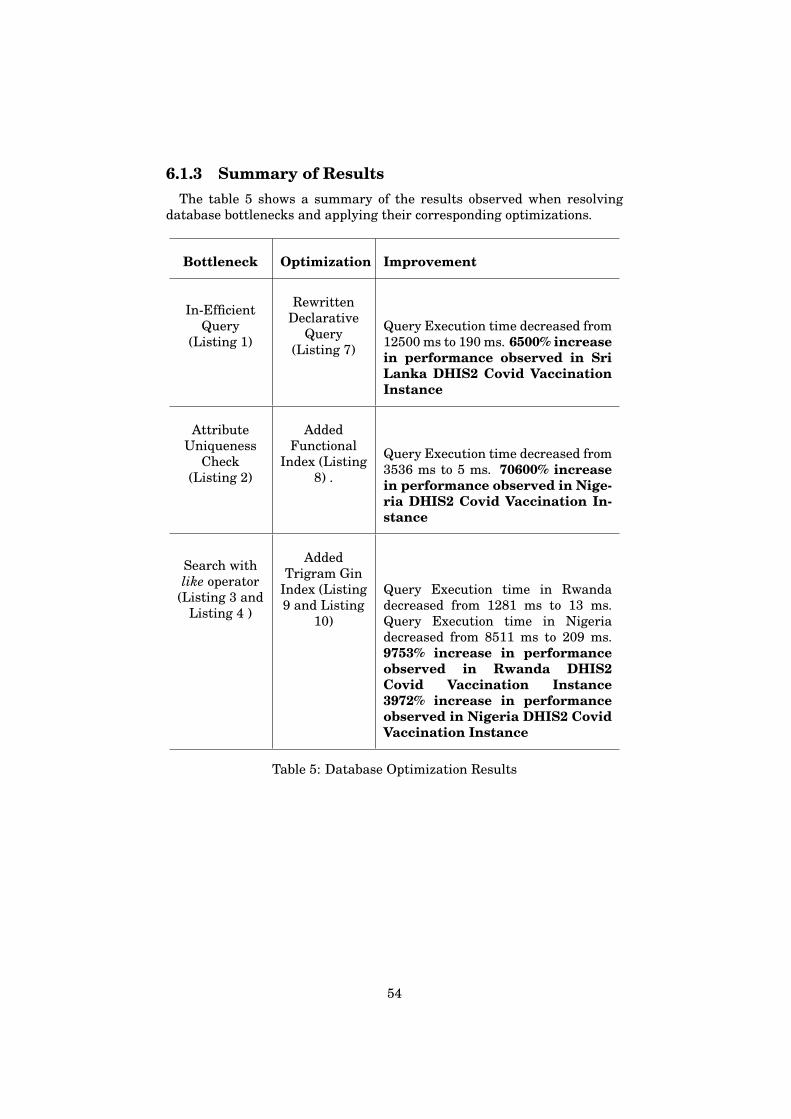
6.1.3 Summary of ResultsThe table 5 shows a summary of the results observed when resolving
database bottlenecks and applying their corresponding optimizations.
Bottleneck Optimization Improvement
In-EfficientQuery
(Listing 1)
RewrittenDeclarative
Query(Listing 7)
Query Execution time decreased from12500 ms to 190 ms. 6500% increasein performance observed in SriLanka DHIS2 Covid VaccinationInstance
AttributeUniqueness
Check(Listing 2)
AddedFunctional
Index (Listing8) .
Query Execution time decreased from3536 ms to 5 ms. 70600% increasein performance observed in Nige-ria DHIS2 Covid Vaccination In-stance
Search withlike operator
(Listing 3 andListing 4 )
AddedTrigram Gin
Index (Listing9 and Listing
10)
Query Execution time in Rwandadecreased from 1281 ms to 13 ms.Query Execution time in Nigeriadecreased from 8511 ms to 209 ms.9753% increase in performanceobserved in Rwanda DHIS2Covid Vaccination Instance3972% increase in performanceobserved in Nigeria DHIS2 CovidVaccination Instance
Table 5: Database Optimization Results
54
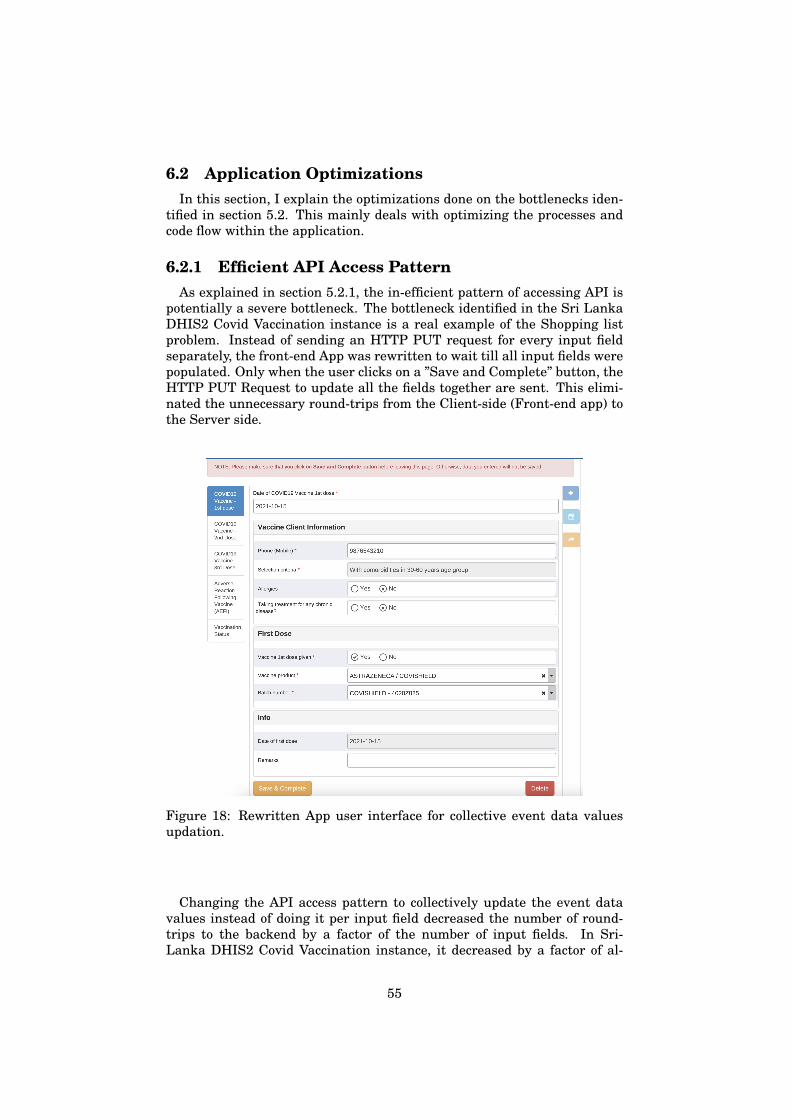
6.2 Application OptimizationsIn this section, I explain the optimizations done on the bottlenecks iden-
tified in section 5.2. This mainly deals with optimizing the processes andcode flow within the application.
6.2.1 Efficient API Access PatternAs explained in section 5.2.1, the in-efficient pattern of accessing API is
potentially a severe bottleneck. The bottleneck identified in the Sri LankaDHIS2 Covid Vaccination instance is a real example of the Shopping listproblem. Instead of sending an HTTP PUT request for every input fieldseparately, the front-end App was rewritten to wait till all input fields werepopulated. Only when the user clicks on a ”Save and Complete” button, theHTTP PUT Request to update all the fields together are sent. This elimi-nated the unnecessary round-trips from the Client-side (Front-end app) tothe Server side.
Figure 18: Rewritten App user interface for collective event data valuesupdation.
Changing the API access pattern to collectively update the event datavalues instead of doing it per input field decreased the number of round-trips to the backend by a factor of the number of input fields. In Sri-Lanka DHIS2 Covid Vaccination instance, it decreased by a factor of al-
55
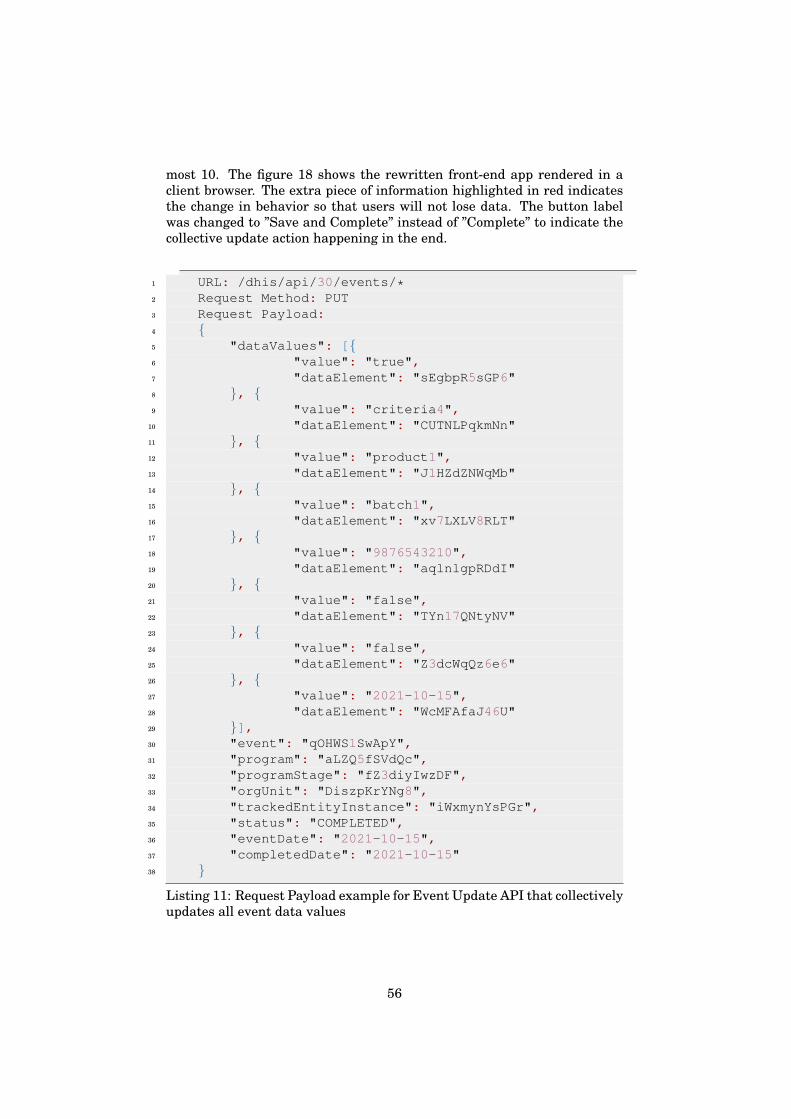
most 10. The figure 18 shows the rewritten front-end app rendered in aclient browser. The extra piece of information highlighted in red indicatesthe change in behavior so that users will not lose data. The button labelwas changed to ”Save and Complete” instead of ”Complete” to indicate thecollective update action happening in the end.
1 URL: /dhis/api/30/events/*2 Request Method: PUT3 Request Payload:4 {5 "dataValues": [{6 "value": "true",7 "dataElement": "sEgbpR5sGP6"8 }, {9 "value": "criteria4",
10 "dataElement": "CUTNLPqkmNn"11 }, {12 "value": "product1",13 "dataElement": "J1HZdZNWqMb"14 }, {15 "value": "batch1",16 "dataElement": "xv7LXLV8RLT"17 }, {18 "value": "9876543210",19 "dataElement": "aqlnlgpRDdI"20 }, {21 "value": "false",22 "dataElement": "TYn17QNtyNV"23 }, {24 "value": "false",25 "dataElement": "Z3dcWqQz6e6"26 }, {27 "value": "2021-10-15",28 "dataElement": "WcMFAfaJ46U"29 }],30 "event": "qOHWS1SwApY",31 "program": "aLZQ5fSVdQc",32 "programStage": "fZ3diyIwzDF",33 "orgUnit": "DiszpKrYNg8",34 "trackedEntityInstance": "iWxmynYsPGr",35 "status": "COMPLETED",36 "eventDate": "2021-10-15",37 "completedDate": "2021-10-15"38 }
Listing 11: Request Payload example for Event Update API that collectivelyupdates all event data values
56
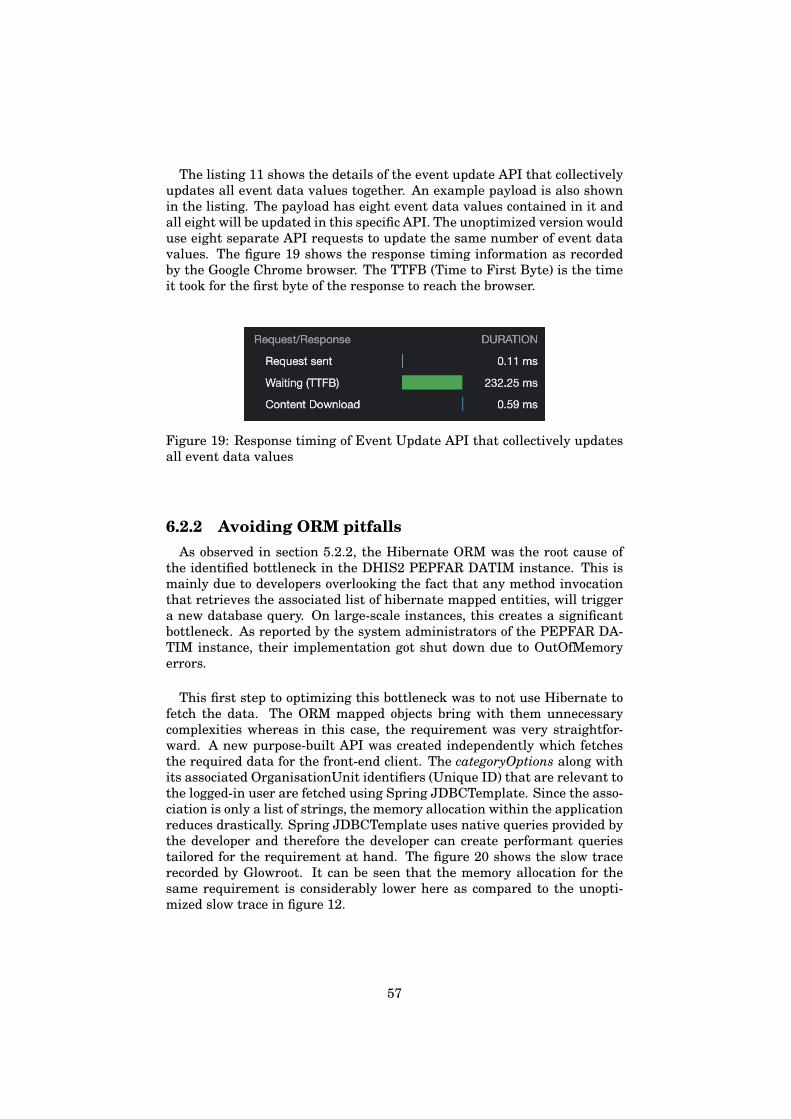
The listing 11 shows the details of the event update API that collectivelyupdates all event data values together. An example payload is also shownin the listing. The payload has eight event data values contained in it andall eight will be updated in this specific API. The unoptimized version woulduse eight separate API requests to update the same number of event datavalues. The figure 19 shows the response timing information as recordedby the Google Chrome browser. The TTFB (Time to First Byte) is the timeit took for the first byte of the response to reach the browser.
Figure 19: Response timing of Event Update API that collectively updatesall event data values
6.2.2 Avoiding ORM pitfallsAs observed in section 5.2.2, the Hibernate ORM was the root cause of
the identified bottleneck in the DHIS2 PEPFAR DATIM instance. This ismainly due to developers overlooking the fact that any method invocationthat retrieves the associated list of hibernate mapped entities, will triggera new database query. On large-scale instances, this creates a significantbottleneck. As reported by the system administrators of the PEPFAR DA-TIM instance, their implementation got shut down due to OutOfMemoryerrors.
This first step to optimizing this bottleneck was to not use Hibernate tofetch the data. The ORM mapped objects bring with them unnecessarycomplexities whereas in this case, the requirement was very straightfor-ward. A new purpose-built API was created independently which fetchesthe required data for the front-end client. The categoryOptions along withits associated OrganisationUnit identifiers (Unique ID) that are relevant tothe logged-in user are fetched using Spring JDBCTemplate. Since the asso-ciation is only a list of strings, the memory allocation within the applicationreduces drastically. Spring JDBCTemplate uses native queries provided bythe developer and therefore the developer can create performant queriestailored for the requirement at hand. The figure 20 shows the slow tracerecorded by Glowroot. It can be seen that the memory allocation for thesame requirement is considerably lower here as compared to the unopti-mized slow trace in figure 12.
57
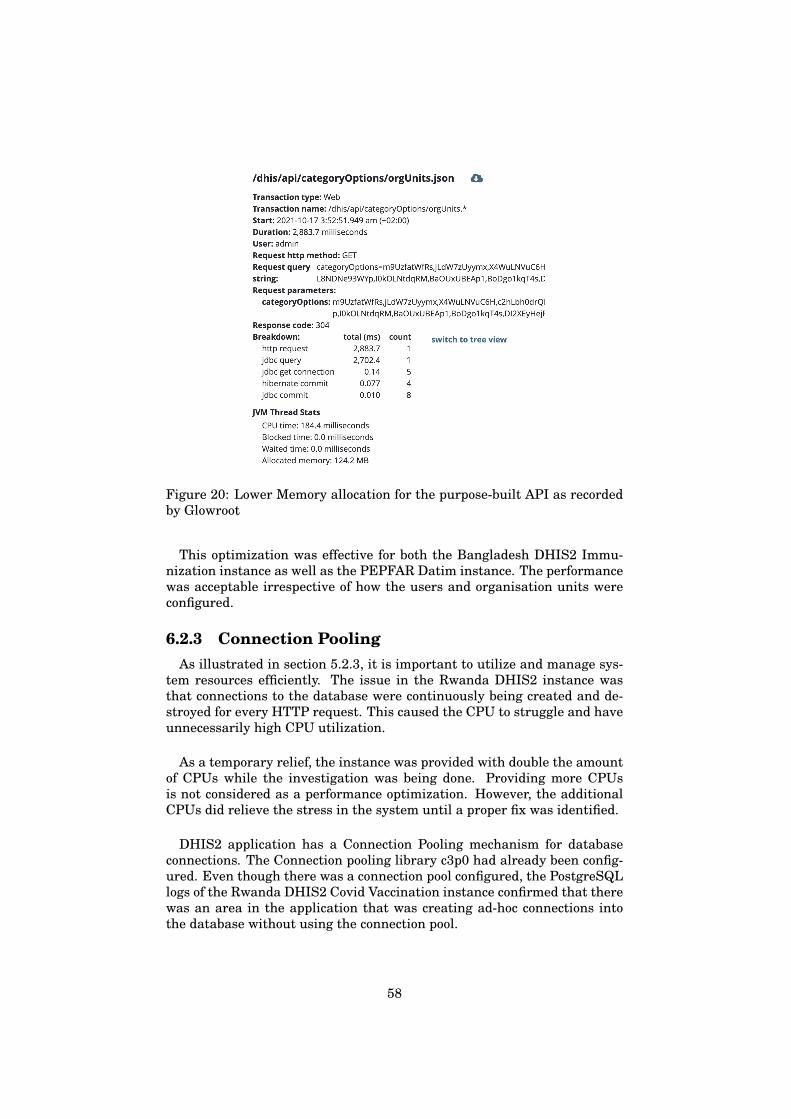
Figure 20: Lower Memory allocation for the purpose-built API as recordedby Glowroot
This optimization was effective for both the Bangladesh DHIS2 Immu-nization instance as well as the PEPFAR Datim instance. The performancewas acceptable irrespective of how the users and organisation units wereconfigured.
6.2.3 Connection PoolingAs illustrated in section 5.2.3, it is important to utilize and manage sys-
tem resources efficiently. The issue in the Rwanda DHIS2 instance wasthat connections to the database were continuously being created and de-stroyed for every HTTP request. This caused the CPU to struggle and haveunnecessarily high CPU utilization.
As a temporary relief, the instance was provided with double the amountof CPUs while the investigation was being done. Providing more CPUsis not considered as a performance optimization. However, the additionalCPUs did relieve the stress in the system until a proper fix was identified.
DHIS2 application has a Connection Pooling mechanism for databaseconnections. The Connection pooling library c3p0 had already been config-ured. Even though there was a connection pool configured, the PostgreSQLlogs of the Rwanda DHIS2 Covid Vaccination instance confirmed that therewas an area in the application that was creating ad-hoc connections intothe database without using the connection pool.
58
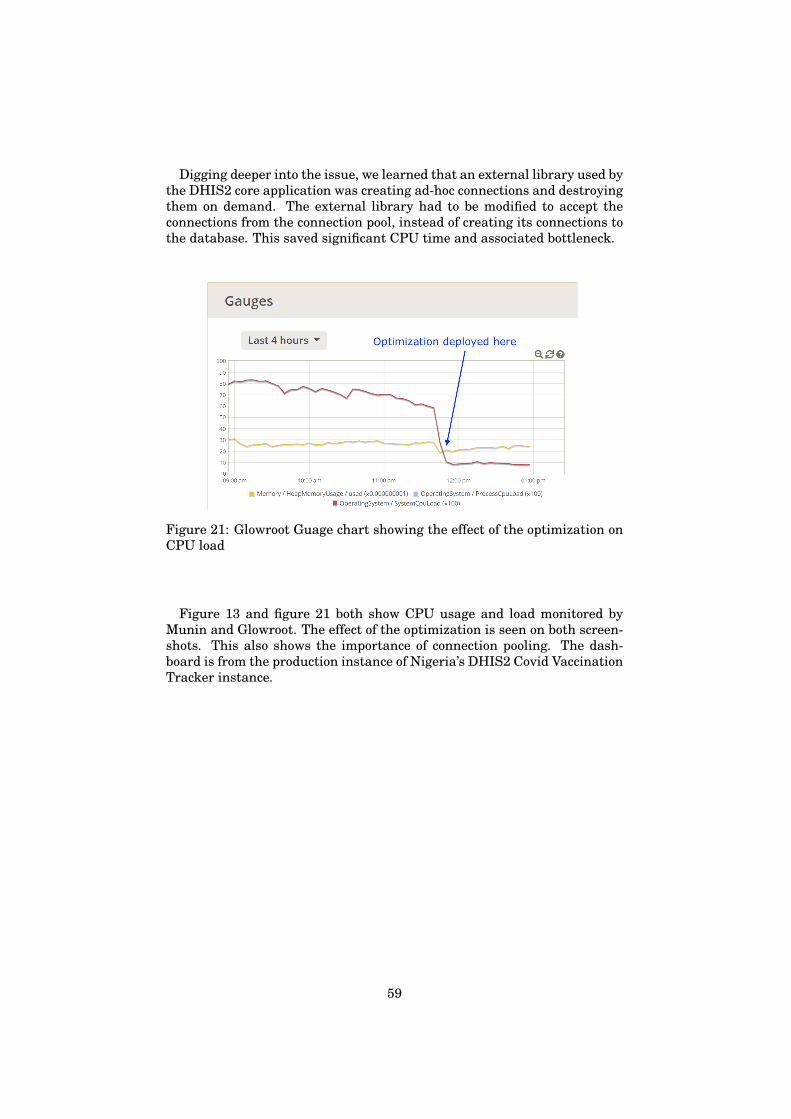
Digging deeper into the issue, we learned that an external library used bythe DHIS2 core application was creating ad-hoc connections and destroyingthem on demand. The external library had to be modified to accept theconnections from the connection pool, instead of creating its connections tothe database. This saved significant CPU time and associated bottleneck.
Figure 21: Glowroot Guage chart showing the effect of the optimization onCPU load
Figure 13 and figure 21 both show CPU usage and load monitored byMunin and Glowroot. The effect of the optimization is seen on both screen-shots. This also shows the importance of connection pooling. The dash-board is from the production instance of Nigeria’s DHIS2 Covid VaccinationTracker instance.
59
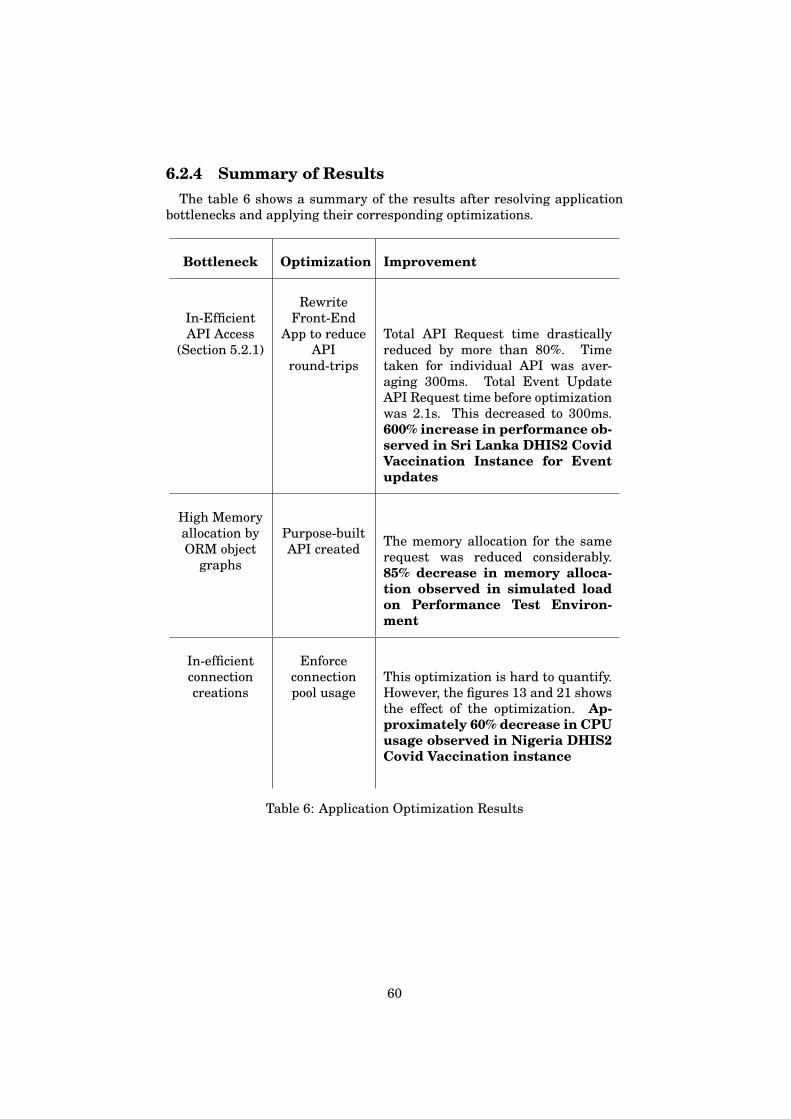
6.2.4 Summary of ResultsThe table 6 shows a summary of the results after resolving application
bottlenecks and applying their corresponding optimizations.
Bottleneck Optimization Improvement
In-EfficientAPI Access
(Section 5.2.1)
RewriteFront-End
App to reduceAPI
round-trips
Total API Request time drasticallyreduced by more than 80%. Timetaken for individual API was aver-aging 300ms. Total Event UpdateAPI Request time before optimizationwas 2.1s. This decreased to 300ms.600% increase in performance ob-served in Sri Lanka DHIS2 CovidVaccination Instance for Eventupdates
High Memoryallocation byORM object
graphs
Purpose-builtAPI created The memory allocation for the same
request was reduced considerably.85% decrease in memory alloca-tion observed in simulated loadon Performance Test Environ-ment
In-efficientconnectioncreations
Enforceconnectionpool usage
This optimization is hard to quantify.However, the figures 13 and 21 showsthe effect of the optimization. Ap-proximately 60% decrease in CPUusage observed in Nigeria DHIS2Covid Vaccination instance
Table 6: Application Optimization Results
60
7 DiscussionThrough this thesis, we understood some of the performance issues faced
by large-scale Information Systems. By studying the performance issueson large-scale DHIS2 implementations across the globe, we understoodhow these bottlenecks affected the day-to-day work of users of the system.Health workers and officials are all affected deeply by performance bottle-necks. We resolved some of the performance bottlenecks using optimiza-tion techniques available in the existing literature. We also empiricallyevaluated how the optimization changes have had an impact on perfor-mance. These optimizations applied to DHIS2 will be generalized in thischapter. Generalized optimizations make them relevant to any large-scaleenterprise application that interacts with a relational database.
The bottlenecks faced by large-scale DHIS2 implementations are cate-gorized into two, Data Source Layer and Application Layer. Existing lit-erature on optimization techniques was extensively studied and carefullyapplied to the real-world problem at hand, the DHIS2 Tracker country im-plementations. The results of the optimizations demonstrate that the bot-tlenecks have been resolved for the identified issues.
Most of the optimization techniques applied were derived from existingliterature. Dombrovskaya et al. in their work [12] covers the most commonperformance issues faced by applications interacting with the PostgreSQLdatabase. The work also covers common pitfalls in ORM frameworks, Ap-plication development, and database interactions. Although the exampleswere generic, this thesis extends their work by identifying the bottlenecksand applying the suggested optimizations on a production-grade large-scaleDHIS2 implementation. The results obtained support the optimizations.There was a need for application downtime to experiment with some ofthe optimizations. But the downtime was always worth the performanceimprovement gained once the optimizations were done. The results con-tribute to a clearer understanding of the impact of these optimizations. Weobserved an increase in throughput, a decrease in response time, and betterresource utilization.
The generalized learnings during the resolution of database bottleneckswere:
1. SQL queries should be as declarative as possible. This allows thequery optimizer to do its job of optimizing the execution path. Bottle-necks will be created if a sub-optimal execution path is enforced.
2. Scalability should be considered when dynamically building SQL queriesbased on data. The chaining of left joins depending on some aspect ofdata is not ideal. The default value of join collapse limit PostgreSQLconfiguration parameter is 8. This parameter caps the number of ta-bles in a join that will be processed by the cost-based optimizer. If thenumber of tables in a join is eight or fewer, the optimizer will perform
61
a selection of candidate plans, compare plans, and choose the best one[12]. But if the number of tables is nine or more, it will simply ex-ecute the joins in the order seen in the SQL and hence enforcing asub-optimal plan.
3. Selectivity should be considered when creating indexes. The most re-strictive filter with a low selectivity is an ideal candidate for an index.
4. Query access pattern should be monitored to find out appropriate in-dex types to create. Appropriate Index types have to be used. Forexample, the Trigram index type should be used for like comparisons,and the B-tree index type should be used for range and equality com-parisons. GIN index type for full-text searches.
The generalized learnings during the resolution of application bottle-necks were
1. Avoid unnecessary round trips from the client-side (Front-end App).Multiple smaller APIs performing related operations for a user flowcould be merged into a single API doing the same tasks.
2. Avoid unnecessary round trips to the database from the application.These are a common performance pitfall in any ORM-based applica-tion. Hibernate n+1 query problem is an example of such a pitfall.
3. Inspect the queries generated by ORM under the hood. ORM cangenerate sub-optimal queries.
4. Keep an eye on memory allocation per request. These give an idea ofpotential resource leakage or even a sub-optimal in-memory compu-tation that will not scale well. Although request processing time maybe low, if it consumes high resources, it will still be a bottleneck.
Different factors expose a bottleneck. It can either be due to a uniquedata access pattern or a unique data configuration or data volume of specificentities. There are cases where a bottleneck in one instance of a system isnot immediately visible in another instance of a similar system. For exam-ple, the application bottleneck in section 5.2.2 was resolved by a quick op-timization fix, and the bottleneck seemed to be resolved in the BangladeshDHIS2 Measles Immunization instance. However, the same optimizationcreated a new application bottleneck in another large-scale DHIS2 imple-mentation, the PEPFAR DATIM instance. This was because of the dif-ference in the implementation context and how the metadata and userswere set up. The PEPFAR DATIM instance had a large number of usershaving access to the Root Organisation Unit along with a very large num-ber of organizational units in the hierarchy. This was different from howBangladesh had configured their system with the majority of the users onlyhaving access to just a handful of organisation units. In any informationsystem, such configurations, data access patterns, data volume, and dataaccess frequency are significant factors that influence performance charac-teristics. Covid Vaccination tracking was the concrete context for three of
62
the five implementations involved in my case study. The optimizations ap-plied were equally relevant to all these 3 Covid related implementationsdue to their similarity in configuration and data access patterns. The CovidVaccination tracking implementation exposed several bottlenecks due to itsmagnitude of data entry and frequency of data access. An optimization doneto resolve a bottleneck should not create an equal or greater bottleneck inanother part of the system. Such changes are not optimizations and lead tofurther degradation of the system.
One of the optimizations to resolve the bottleneck in 6.1.2 was to createpartial trigram indexes (Listing 9). However, a limitation of the trigram in-dex is that it is ineffective for substrings shorter than three. For example,the pattern ’%01%’ requires a sequential search even if the trigram index ispresent. This behavior created an issue in Nigeria, where some end userswere searching with a search text size of less than three. The same bottle-neck resurfaced for which the trigram index was created in the first place.A fix in the Custom Frontend App maintained by HISP Nigeria was doneto enforce a three-character search text rule. The change ensured that theclient does not use the API if the search text is less than three letters.
Sri Lanka had reported a performance issue related to 5.2. On investigat-ing the PostgreSQL logs, we observed database locks held for extended pe-riods(30 seconds). However, on analyzing their infrastructure using MuninMonitoring tool [7], the disk latency was momentarily creeping up as highas 1 second. The snapshot from Munin is added in Appendix 26. An idealdisk latency should have been under 20ms, and even under 1ms for SSDs.Due to this poor disk latency, excessive locking was observed. Even thoughinfrastructural performance issues are outside the scope of this thesis, ithas to be noted that such infrastructural issues magnify the bottleneckspresent in the application. Since these issues are outside the control of de-velopers, it is important to resolve as many potential application/databasebottlenecks as possible.
Some of the performance optimizations were done only on specific produc-tion instances by analyzing their data distribution and query patterns. Thetrigram indexes mentioned in listing 9 is one of them. These optimizationshave not yet been included in the DHIS2 Core release. However, seeing theperformance improvement the optimizations have led to, the DHIS2 coredevelopment team is planning to generalize the optimizations and includethem as part of a future DHIS2 release. The same principle can be appliedto any enterprise application that wants to improve searching based on textcomparisons in PostgreSQL.
There were several challenges faced during the course of my thesis work.Most of the DHIS2 Tracker implementations involved in my case studyare based in developing countries. For a developed country like USA orNorway, it was possible to vertically scale the system by adding more com-puting power on demand in case a performance bottleneck was identified.However, this was not always possible in developing countries where the
63
instance was deployed and maintained in Government or Parastatal datacenters. Resources were often limited and it was not possible to increasethe computing resources on demand. This further signifies the scope of mythesis where we had to resolve the bottlenecks within the confines of theinfrastructural environment it was running in. Another challenge was, thesystem administrators in developing countries were often inexperienced indiagnosing complex performance problems. Fortunately, Glowroot provideda window into several DHIS2 implementations without opening up accessto their sensitive data. The different metrics captured in Glowroot helpedus in the analysis of database queries and API behaviors to resolve bottle-necks. It provided a vital bridge between the DHIS2 Core team and the dif-ferent concrete implementations. Another challenge faced during my thesiswork is the time-critical nature of the Covid Vaccine implementations. Un-like usual long-term HIS implementations where performance issues caneventually get fixed over time, Covid Vaccination implementations are dif-ferent. Besides being large-scale, they are also time-critical. National vac-cination campaigns are launched by country officials to achieve maximumvaccinations. These campaigns typically last a few weeks. When the systemfails to perform, it is not merely an inconvenience. It threatens the viabilityof the whole campaign and needs to get fixed quickly. This determined theurgency of the optimization responses and fixes were required within hoursor days and not weeks or months.
Apart from the challenges faced, there were optimization techniques thatcould not be applied due to various limitations. Covering index is a newfeature that was introduced in PostgreSQL 11. This feature allows thequery executor to use index-only scans instead of index-scans [18]. Thenon-indexed columns required by the select projection can be included in anexisting b-tree index. This is different from multicolumn indexes with thesame columns. Size and maintenance of covering indexes will be lower thanmulti-column indexes. Covering index could not be applied to DHIS2 ver-sion 2.34 or 2.35 as the minimum supported PostgreSQL version of DHIS2version 2.34 and 2.35 is PostgreSQL 9.6. Due to this limitation, optimiza-tions based on Covering indexes were not actively explored. Such Post-greSQL version requirement upgrades can only be made on a later majorrelease version (like 2.38) with an explicit announcement.
Infrastructural and architectural decisions and changes were out of thescope of my thesis work. However, several optimization opportunities canbe explored by modifying the application architecture. For example, a micro-service architecture can be used to modularize and scale parts of the appli-cation based on usage and demand. There are benefits to a micro-servicearchitecture-based application compared to a Monolith application. DHIS2is currently a Monolith but has the potential to be modularized into micro-services. Such micro-services can be deployed and scaled independently.Horizontal scaling is also a possibility for optimizing performance. How-ever, it needs more computing resources to be able to host multiple nodes ofthe system and have a load balancer balancing the requests to the system.PEPFAR DATIM based in the US is one of the few implementations that
64
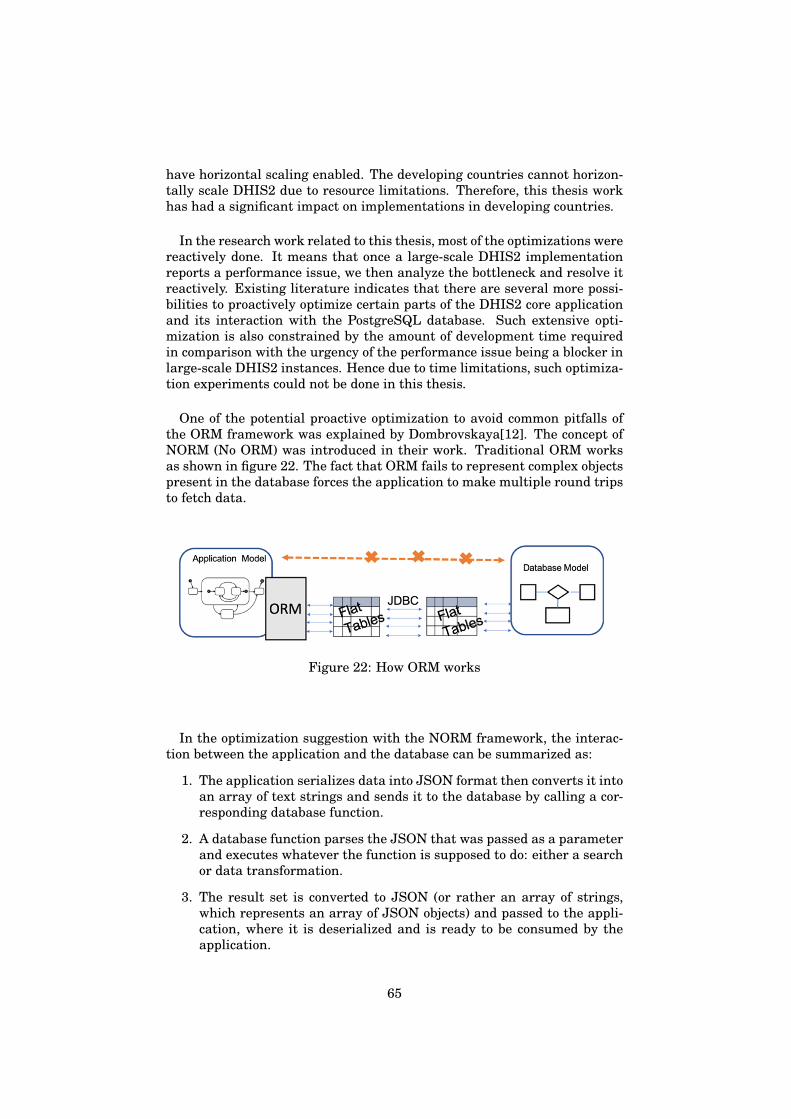
have horizontal scaling enabled. The developing countries cannot horizon-tally scale DHIS2 due to resource limitations. Therefore, this thesis workhas had a significant impact on implementations in developing countries.
In the research work related to this thesis, most of the optimizations werereactively done. It means that once a large-scale DHIS2 implementationreports a performance issue, we then analyze the bottleneck and resolve itreactively. Existing literature indicates that there are several more possi-bilities to proactively optimize certain parts of the DHIS2 core applicationand its interaction with the PostgreSQL database. Such extensive opti-mization is also constrained by the amount of development time requiredin comparison with the urgency of the performance issue being a blocker inlarge-scale DHIS2 instances. Hence due to time limitations, such optimiza-tion experiments could not be done in this thesis.
One of the potential proactive optimization to avoid common pitfalls ofthe ORM framework was explained by Dombrovskaya[12]. The concept ofNORM (No ORM) was introduced in their work. Traditional ORM worksas shown in figure 22. The fact that ORM fails to represent complex objectspresent in the database forces the application to make multiple round tripsto fetch data.
Figure 22: How ORM works
In the optimization suggestion with the NORM framework, the interac-tion between the application and the database can be summarized as:
1. The application serializes data into JSON format then converts it intoan array of text strings and sends it to the database by calling a cor-responding database function.
2. A database function parses the JSON that was passed as a parameterand executes whatever the function is supposed to do: either a searchor data transformation.
3. The result set is converted to JSON (or rather an array of strings,which represents an array of JSON objects) and passed to the appli-cation, where it is deserialized and is ready to be consumed by theapplication.
65
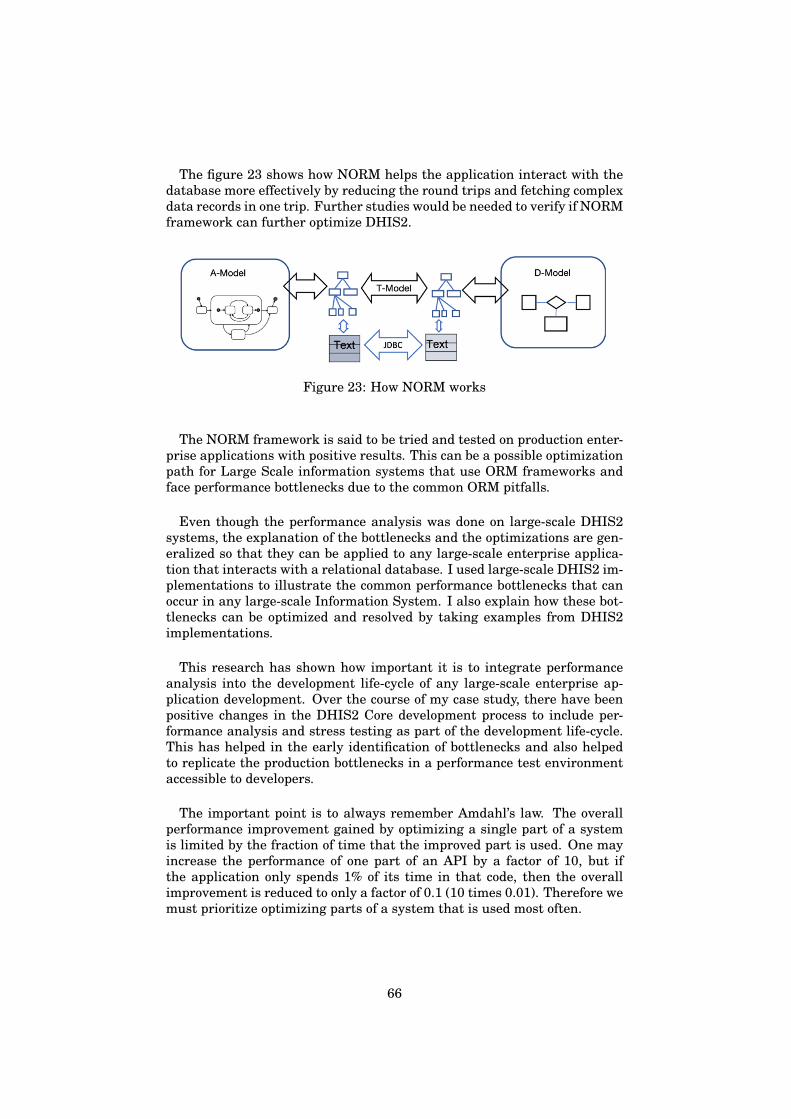
The figure 23 shows how NORM helps the application interact with thedatabase more effectively by reducing the round trips and fetching complexdata records in one trip. Further studies would be needed to verify if NORMframework can further optimize DHIS2.
Figure 23: How NORM works
The NORM framework is said to be tried and tested on production enter-prise applications with positive results. This can be a possible optimizationpath for Large Scale information systems that use ORM frameworks andface performance bottlenecks due to the common ORM pitfalls.
Even though the performance analysis was done on large-scale DHIS2systems, the explanation of the bottlenecks and the optimizations are gen-eralized so that they can be applied to any large-scale enterprise applica-tion that interacts with a relational database. I used large-scale DHIS2 im-plementations to illustrate the common performance bottlenecks that canoccur in any large-scale Information System. I also explain how these bot-tlenecks can be optimized and resolved by taking examples from DHIS2implementations.
This research has shown how important it is to integrate performanceanalysis into the development life-cycle of any large-scale enterprise ap-plication development. Over the course of my case study, there have beenpositive changes in the DHIS2 Core development process to include per-formance analysis and stress testing as part of the development life-cycle.This has helped in the early identification of bottlenecks and also helpedto replicate the production bottlenecks in a performance test environmentaccessible to developers.
The important point is to always remember Amdahl’s law. The overallperformance improvement gained by optimizing a single part of a systemis limited by the fraction of time that the improved part is used. One mayincrease the performance of one part of an API by a factor of 10, but ifthe application only spends 1% of its time in that code, then the overallimprovement is reduced to only a factor of 0.1 (10 times 0.01). Therefore wemust prioritize optimizing parts of a system that is used most often.
66
Performance Analysis is an ongoing process. Query execution time maychange because of data volume increase or data distribution change or ex-ecution frequency increase. In addition, there will be new index types andother improvements in each new PostgreSQL release, and some of themmay be so significant that they prompt rewriting original queries. Require-ments may change forcing new features to be added to the application.These can also have a rippling effect on the overall performance of the sys-tem. No part of any system should be assumed to be optimized forever, andmonitoring the system should happen continuously. This research workonly covers some of the performance bottlenecks and is not an exhaustiveattempt to resolve all bottlenecks.
67
8 ConclusionThis research aimed to identify performance issues in large-scale Infor-
mation systems by performing a case study on multiple large-scale DHIS2Tracker implementations. I illustrated how performance analysis was doneand how bottlenecks were resolved using various optimization techniques.The results of the optimizations indicate that each of the optimizations isincreasing the scalability of DHIS2. However, there are still more optimiza-tion opportunities available to improve scalability even further.
The impacts of these bottlenecks are significant. For DHIS2, users hadto switch to less effective alternative ways to store information like paper-based records. Users were unable to meet their deadlines. Bottlenecksin large-scale systems render the system unusable. Passengers could notboard their flights because the Covid Vaccine QR code searching was a bot-tleneck in the system. It affects the day-to-day lives and work of users.The viability of Covid Vaccination campaigns that last only a few weeks isthreatened due to performance bottlenecks.
Several optimization techniques available from existing literature wereapplied to multiple large-scale production information systems. The impactof the optimizations was analyzed with experiments on simulated environ-ments as well as real-world production environments. The results confirmsignificant performance improvements. System administrators of all theDHIS2 implementations I have worked with during my research have con-firmed that the optimizations applied have saved their day and made theirjobs easier. All the learnings mentioned in section 7 have been generalizedand can be applied to any large-scale enterprise application.
Further research is needed to determine the effects of other optimizationtechniques available in the existing literature which were not explored inthis thesis due to technical or time limitations. Future work is encouragedto investigate bottlenecks and apply optimizations proactively into DHIS2or other large-scale Information Systems. For example, the application ofthe NORM framework in DHIS2 as mentioned in section 7. Similarly, cov-ering indexes and other new features released in later PostgreSQL versionswill warrant more optimization changes within DHIS2. Infrastructural andarchitectural decisions were outside the scope of this thesis. However, fur-ther research can also explore the optimization opportunities possible byenabling efficient horizontal scaling capability or using microservices ar-chitecture in an Information System.
I conclude my thesis with a word of caution that we cannot assume any-thing is optimized forever. Information systems will have to be monitoredcontinuously for changes in queries, data volume, value distributions, dataaccess patterns, and other characteristics that can interfere with perfor-mance. System administrators and developers should be vigilant. There isalways room for more optimizations, both on the application side and thedatabase side.
68
Bibliography[1] Jørn Braa and Calle Hedberg. “The Struggle for District-Based Health
Information Systems in South Africa”. In: The Information Society18.2 (2002), pp. 113–127. DOI: 10.1080/01972240290075048. eprint:https://doi.org/10.1080/01972240290075048. URL: https://doi.org/10.1080/01972240290075048.
[2] Jørn Braa and Sundeep Sahay. “The DHIS2 Open Source SoftwarePlatform: Evolution Over Time and Space”. In: Apr. 2017. ISBN: 9780262338127.
[3] Chitij Chauhan. PostgreSQL high performance cookbook : masteringquery optimization, database monitoring, and performance-tuning forPostgreSQL. eng. Birmingham, England, 2017.
[4] Boyuan Chen et al. “An Industrial Experience Report on Performance-Aware Refactoring on a Database-Centric Web Application”. In: 201934th IEEE/ACM International Conference on Automated SoftwareEngineering (ASE). 2019, pp. 653–664. DOI: 10.1109/ASE.2019.00066.
[5] Tse-Hsun Chen et al. “Detecting Performance Anti-Patterns for Ap-plications Developed Using Object-Relational Mapping”. In: Proceed-ings of the 36th International Conference on Software Engineering.ICSE 2014. Hyderabad, India: Association for Computing Machinery,2014, pp. 1001–1012. ISBN: 9781450327565. DOI: 10.1145/2568225.2568259. URL: https://doi-org.ezproxy.uio.no/10.1145/2568225.2568259.
[6] Vittorioa Cortellessa, Antinisca Di Marco, and Paola Inverardi. “WhatIs Software Performance?” In: Model-Based Software Performance Anal-ysis. Berlin, Heidelberg: Springer Berlin Heidelberg, 2011, pp. 1–7.ISBN: 978-3-642-13621-4. DOI: 10.1007/978-3-642-13621-4_1.URL: https://doi.org/10.1007/978-3-642-13621-4_1.
[7] Munin Dev. An open source networked resource monitoring tool. URL:https://munin-monitoring.org/. (accessed: 07.10.2021).
[8] DHIS2. DHIS2. URL: http://www.dhis2.org. (accessed: 20.05.2021).[9] DHIS2. DHIS2. URL: http://www.dhis2.org/about. (accessed:
25.05.2021).[10] DHIS2. DHIS2 Tracker In Action. URL: https : / / dhis2 . org /
tracker-in-action/. (accessed: 31.10.2021).[11] DHIS2. Technology Platform. URL: http://www.dhis2.org. (ac-
cessed: 17.07.2021).[12] Henrietta Dombrovskaya, Boris Novikov, and Anna Bailliekova. Post-
greSQL Query Optimization: The Ultimate Guide to Building Effi-cient Queries. eng. Berkeley, CA: Apress L. P, 2021. ISBN: 9781484268841.
[13] Stephane Faroult. The art of SQL. eng. Sebastopol, California, 2006.[14] Apache Software Foundation. Apache JMeter. URL: https://jmeter.
apache.org/. (accessed: 25.08.2021).
69
[15] Martin Fowler. Patterns of enterprise application architecture. eng.Boston, Mass, 2003.
[16] Mikhail Gorodnichev et al. “EXPLORING OBJECT-RELATIONALMAPPING (ORM) SYSTEMS AND HOW TO EFFECTIVELY PRO-GRAM A DATA ACCESS MODEL”. In: PalArch’s Journal of Archae-ology of Egypt / Egyptology 17.3 (Nov. 2020), pp. 615–627. DOI: 10.48080/jae.v17i3.141. URL: https://archives.palarch.nl/index.php/jae/article/view/141.
[17] Jonatan Heyman et al. Apache JMeter. URL: https://locust.io/.(accessed: 28.04.2021).
[18] Salahaldin Juba and Andrey Volkov. Learning PostgreSQL 11: A Be-ginner’s Guide to Building High-Performance PostgreSQL DatabaseSolutions, 3rd Edition. eng. Birmingham: Packt Publishing, Limited,2019. ISBN: 9781789535464.
[19] Rediana Koci et al. “A Data-Driven Approach to Measure the Usabil-ity of Web APIs”. In: 2020 46th Euromicro Conference on Software En-gineering and Advanced Applications (SEAA). 2020, pp. 64–71. DOI:10.1109/SEAA51224.2020.00021.
[20] Enrico Pirozzi. PostgreSQL 10 High Performance: Expert Techniquesfor Query Optimization, High Availability, and Efficient Database Main-tenance. eng. Birmingham: Packt Publishing, Limited, 2018. ISBN:9781788474481.
[21] Hans-Jurgen Schonig. Mastering PostgreSQL 9.6 : a comprehensiveguide for PostgreSQL 9.6 developers and administrators. eng. Birm-ingham, 2017.
[22] Mateusz Smolinski. “Impact of Storage Space Configuration on Trans-action Processing Performance for Relational Database in PostgreSQL”.In: Beyond Databases, Architectures and Structures. Facing the Chal-lenges of Data Proliferation and Growing Variety. Ed. by StanisławKozielski et al. Cham: Springer International Publishing, 2018, pp. 157–167. ISBN: 978-3-319-99987-6.
[23] Trask Stalnaker. Glowroot. URL: https://glowroot.org/. (ac-cessed: 15.02.2021).
[24] BAO Systems. Dhis2 Symposium. URL: https://www.dhis2symposium.org/agenda/dhis2-roadmap. (accessed: 06.10.2021).
[25] DHIS2 Core Development Team. DHIS2 Codebase on Github. URL:https://github.com/dhis2/dhis2-core. (accessed: 10.02.2021).
[26] DHIS2 Documentation Team. DHIS2 Implementation Guides. URL:https://docs.dhis2.org/en/implement/database-design/organisation-units.html. (accessed: 30.09.2021).
[27] DHIS2 Documentation Team. DHIS2 User Guides. URL: https://docs.dhis2.org/en/use/use.html. (accessed: 12.08.2021).
[28] DHIS2 Project Support Team and HISP Bangladesh. Bangladesh usesDHIS2 to manage immunization of 35+ million children in their MRmass campaign. URL: https://dhis2.org/bangladesh-immunization-campaign/. (accessed: 07.09.2021).
70
[29] DHIS2 Project Support Team and HISP Sri Lanka. Innovative man-agement of COVID-19 vaccine delivery in Sri Lanka. URL: https://dhis2.org/sri-lanka-covid-vaccine/. (accessed: 07.09.2021).
[30] DHIS2 Project Support Team and HISP Rwanda. Rwanda uses DHIS2as an interactive system for rapid and paperless COVID-19 vaccina-tion. URL: https://dhis2.org/rwanda-covid-vaccination/.(accessed: 07.09.2021).
[31] YourKit. YourKit Java Profiler. URL: https://www.yourkit.com/java/profiler/features/. (accessed: 21.03.2021).
71
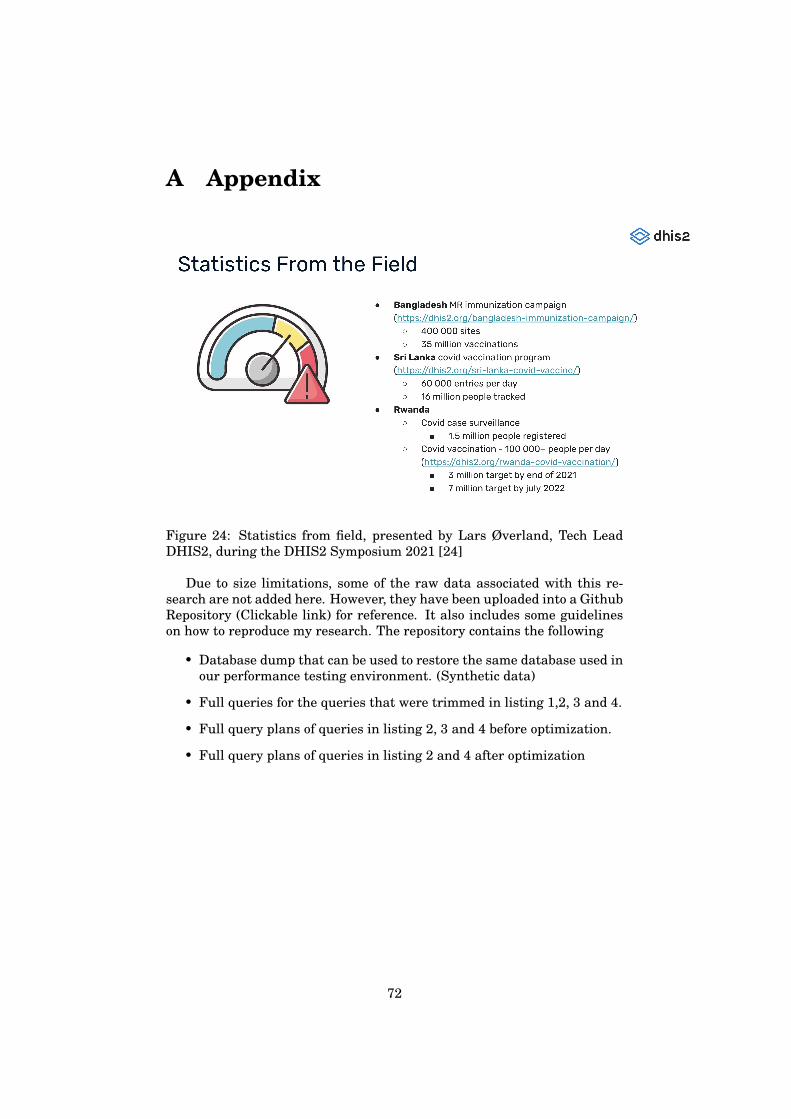
A Appendix
Figure 24: Statistics from field, presented by Lars Øverland, Tech LeadDHIS2, during the DHIS2 Symposium 2021 [24]
Due to size limitations, some of the raw data associated with this re-search are not added here. However, they have been uploaded into a GithubRepository (Clickable link) for reference. It also includes some guidelineson how to reproduce my research. The repository contains the following
• Database dump that can be used to restore the same database used inour performance testing environment. (Synthetic data)
• Full queries for the queries that were trimmed in listing 1,2, 3 and 4.
• Full query plans of queries in listing 2, 3 and 4 before optimization.
• Full query plans of queries in listing 2 and 4 after optimization
72
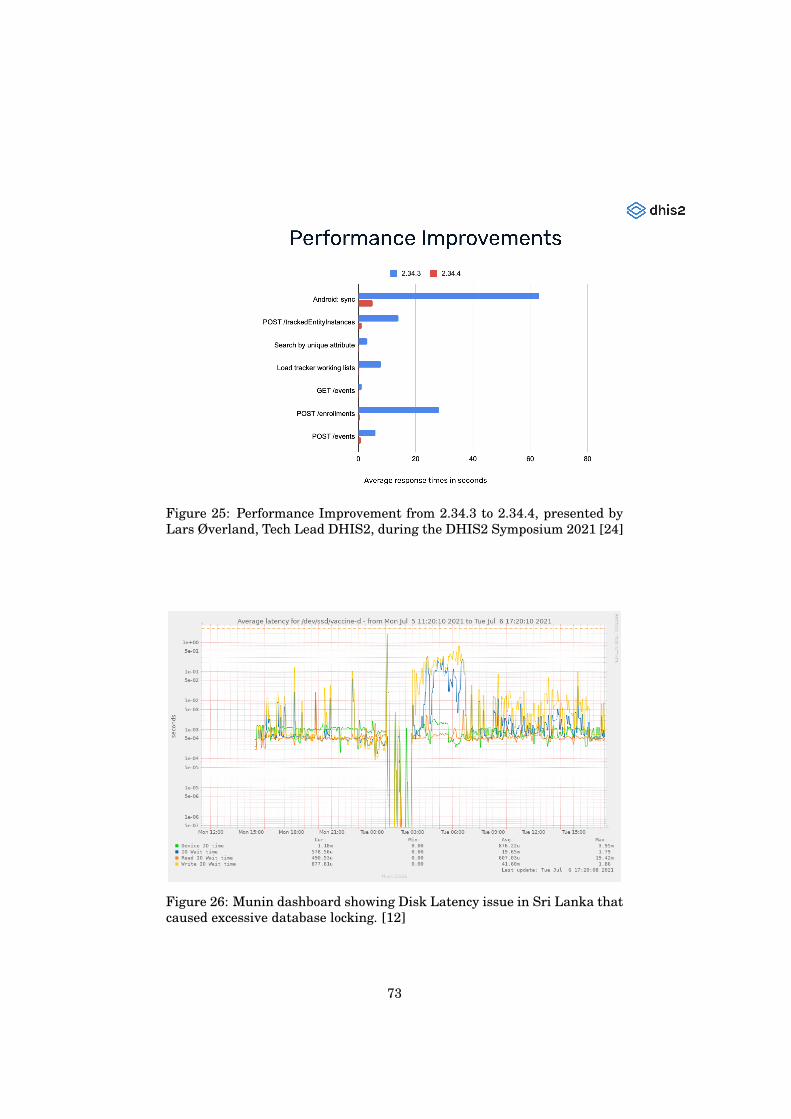
Figure 25: Performance Improvement from 2.34.3 to 2.34.4, presented byLars Øverland, Tech Lead DHIS2, during the DHIS2 Symposium 2021 [24]
Figure 26: Munin dashboard showing Disk Latency issue in Sri Lanka thatcaused excessive database locking. [12]
73