Data mining techniques for improved WSR-88D rainfall estimation
12
Data mining techniques for improved WSR-88D rainfall estimation T.B. Trafalis a, * , M.B. Richman b , A. White a,b , B. Santosa a a School of Industrial Engineering, University of Oklahoma, 202 W.Boyd, Suite 124, Norman, OK 73019-0631, USA b School of Meterology, University of Oklahoma, Norman, OK 73019-0626, USA Abstract The main objective of this paper is to utilize data mining and an intelligent system, Artificial Neural Networks (ANNs), to facilitate rainfall estimation. Ground truth rainfall data are necessary to apply intelligent systems techniques. A unique source of such data is the Oklahoma Mesonet. Recently, with the advent of a national network of advanced radars (i.e. WSR-88D), massive archived data sets have been created generating terabytes of data. Data mining can draw attention to meaningful structures in the archives of such radar data, particularly if guided by knowledge of how the atmosphere operates in rain producing systems. The WSR-88D records digital database contains three native variables: velocity, reflectivity, and spectrum width. However, current rainfall detection algorithms make use of only the reflectivity variable, leaving the other two to be exploited. The primary focus of the research is to capitalize on these additional radar variables at multiple elevation angles and multiple bins in the horizontal for precipitation prediction. Linear regression models and feedforward ANNs are used for precipitation prediction. Rainfall totals from the Oklahoma Mesonet are utilized for the training and verification data. Results for the linear modeling suggest that, taken separately, reflectivity and spectrum width models are highly significant. However, when the two are combined in one linear model, they are not significantly more accurate than reflectivity alone. All linear models are prone to underprediction when heavy rainfall occurred. The ANN results of reflectivity and spectrum width inputs show that a 250-5-1 architecture is least prone to underprediction of heavy rainfall amounts. When a three-part ANN was applied to reflectivity based on light, moderate to heavy rainfall, in addition to spectrum width, it estimated rainfall amounts most accurately of all methods examined. q 2002 Published by Elsevier Science Ltd. Keywords: Backpropagation; Clustering; Data mining applications; Dimensionality reduction; Exploratory data analysis; Feedforward neural networks; Mean-square error; Neural network architectures; Pattern recognition; Principal component analysis; Rainfall estimation 1. Introduction Flash floods kill more people than any other weather phenomenon. Despite this, our ability to estimate 0360-8352/02/$ - see front matter q 2002 Published by Elsevier Science Ltd. PII: S0360-8352(02)00139-0 Computers & Industrial Engineering 43 (2002) 775–786 www.elsevier.com/locate/dsw * Corresponding author. Tel.: þ 1-405-325-3721; fax: þ 1-405-325-7555. E-mail addresses: [email protected] (T.B. Trafalis), [email protected] (M.B. Richman).
-
Upload
independent -
Category
Documents
-
view
4 -
download
0
Transcript of Data mining techniques for improved WSR-88D rainfall estimation
Data mining techniques for improved WSR-88D rainfall estimation
T.B. Trafalisa,*, M.B. Richmanb, A. Whitea,b, B. Santosaa
aSchool of Industrial Engineering, University of Oklahoma, 202 W.Boyd, Suite 124, Norman, OK 73019-0631, USAbSchool of Meterology, University of Oklahoma, Norman, OK 73019-0626, USA
Abstract
The main objective of this paper is to utilize data mining and an intelligent system, Artificial Neural Networks
(ANNs), to facilitate rainfall estimation. Ground truth rainfall data are necessary to apply intelligent systems
techniques. A unique source of such data is the Oklahoma Mesonet. Recently, with the advent of a national
network of advanced radars (i.e. WSR-88D), massive archived data sets have been created generating terabytes of
data. Data mining can draw attention to meaningful structures in the archives of such radar data, particularly if
guided by knowledge of how the atmosphere operates in rain producing systems.
The WSR-88D records digital database contains three native variables: velocity, reflectivity, and spectrum
width. However, current rainfall detection algorithms make use of only the reflectivity variable, leaving the other
two to be exploited. The primary focus of the research is to capitalize on these additional radar variables at multiple
elevation angles and multiple bins in the horizontal for precipitation prediction. Linear regression models and
feedforward ANNs are used for precipitation prediction. Rainfall totals from the Oklahoma Mesonet are utilized
for the training and verification data. Results for the linear modeling suggest that, taken separately, reflectivity and
spectrum width models are highly significant. However, when the two are combined in one linear model, they are
not significantly more accurate than reflectivity alone. All linear models are prone to underprediction when heavy
rainfall occurred. The ANN results of reflectivity and spectrum width inputs show that a 250-5-1 architecture is
least prone to underprediction of heavy rainfall amounts. When a three-part ANN was applied to reflectivity based
on light, moderate to heavy rainfall, in addition to spectrum width, it estimated rainfall amounts most accurately of
all methods examined. q 2002 Published by Elsevier Science Ltd.
Keywords: Backpropagation; Clustering; Data mining applications; Dimensionality reduction; Exploratory data analysis;
Feedforward neural networks; Mean-square error; Neural network architectures; Pattern recognition; Principal component
analysis; Rainfall estimation
1. Introduction
Flash floods kill more people than any other weather phenomenon. Despite this, our ability to estimate
0360-8352/02/$ - see front matter q 2002 Published by Elsevier Science Ltd.
PII: S0360-8352(02)00139-0
Computers & Industrial Engineering 43 (2002) 775–786www.elsevier.com/locate/dsw
* Corresponding author. Tel.: þ1-405-325-3721; fax: þ1-405-325-7555.E-mail addresses: [email protected] (T.B. Trafalis), [email protected] (M.B. Richman).

precipitation and flooding from current state of the technology is frequently inaccurate and can be
improved. Much of this inaccuracy arises from poor estimates from the Weather Surveillance Radar
1988 Doppler (WSR-88D) algorithms, which use only empirical techniques (Fulton, Breidenbach, Seo,
& Miller, 1998; OFCM, 1990, 1991). The emerging technologies of Artificial Neural Networks (ANNs)
provide essential tools for designing intelligent systems. Pattern recognition capability is an essential
component of any intelligent system.
Recently, intelligent systems specifically ANNs, have been applied as a novel approach for modeling
of complex, highly nonlinear dynamic systems. The main advantage of ANNs is in cases where intrinsic
nonlinearities in the dynamics prevent the development of exactly solvable models. Note that, in
meteorology, all of these criteria are present in the sense that the dynamics are inherently nonlinear, and
prediction is one of the main goals. Capturing the radar signature and classifying this signature using
ANNs has been accomplished by Skapura (1996). Jeyabalan, White, and Trafalis (1998), Marzban and
Stumpf (1996), Trafalis, Couellan, Li, Stumpf, and White (1997b) have introduced ANN based models
to diagnose mesocyclones for tornado prediction from radar observations. These investigations have
shown that, ANN based models typically recognize tornados and nearly always outperform the existing
detection algorithms for prediction of tornados. Schizas, Pattichis, and Michaelides (1994), have
developed an ANN model to predict the minimum temperature of the day.
An alternative clutter removal method for weather radar based on polarization diversity
measurements and using ANN methods to discriminate between clutter and precipitation has been
introduced by Silveira and Holt (1997). The monthly and seasonal North American precipitation and
temperature anomalies have been predicted with skill (accuracy exceeding climatology) by Montroy and
Richman (1998) by using ANNs. This has been shown to be more accurate than similar attempts at linear
prediction (Montroy, 1997) of precipitation suggesting the climate system nonlinearities hold additional
information (Montroy, Richman, & Lamb, 1998) if carefully preprocessed to reduce dimensionality
(Gong & Richman, 1995; Richman, 1986; Richman & Gong, 1999).
Of particular interest to the paper is the study of Xiao and Chandrasekar (1997) who have developed
an ANN based algorithm for rainfall estimation from reflectivity of radar observations. A three-layer
perceptron ANN was developed. The ANN is trained using the radar measurements as the input and the
rain gauge measurements as the output. The rainfall estimates obtained from the ANN are shown to be
better than those obtained from empirical based existing techniques despite the fact that only reflectivity
was utilized. The same methodology is extended to snowfall estimation by Liu and Chandrasekar
(1997). All of these studies report an improvement in performance by using ANNs.
The main objective of this paper is developing an intelligent pattern recognizer to improve the WSR-
88D rainfall estimation. This will be accomplished by extending beyond reflectivity and more fully
utilizing the available types of data from the radar.
2. Problem statement
For over forty years, rainfall estimation from radar has been an active area of research. For the most
part, the issue has been addressed through reflectivity-rainfall relations (known as Z–R ). The Z–R
relation was pioneered by Marshall and Palmer (1948). A method based on matching the probabilities of
the two variables of deriving the Z–R relation is presented by Rosenfeld, Wolff, and Atlas (1993).
Currently, radar rainfall estimates were computed from a parametric Z–R relation that can be
T.B. Trafalis et al. / Computers & Industrial Engineering 43 (2002) 775–786776

demonstrated in various ways. The most common form of this relationship can be written as follows:
Z ¼ aRb:
The current WSR-88D default values for a and b are 300 and 1.4, respectively (Fulton et al., 1998).
However, the values of a and b vary from place to place, season-to-season, and time to time (Wilson &
Brandes, 1979). Smith and Joss (1997) suggested that b ¼ 1:5 is comfortably in the middle of any likely
range of variation. They emphasized the importance of the value of a. It is obvious that an estimation
technique based on this relation will not be very successful since no single values for a and b will give a
good estimate of the rainfall over a broad range of conditions. What does occur is a large uncertainty in
estimating rainfall from reflectivity. The bias is not a constant and cannot be corrected with existing
algorithms. Therefore, it is essential to develop a new technique that reduces this variability of the Z–R
relation.
The WSR-88D digital database contains three variables, namely velocity (V ), reflectivity (Z ), and
spectrum width (W ). Current rainfall detection algorithms use only Z data (Fulton et al., 1998). The other
two variables, V and W, are native output of the WSR-88D containing additional information and,
remarkably, have not been explored. The primary focus of this paper is to capitalize on these additional
variables instead of using only Z. Our paper proposes to
† use a multiparametric approach by using Z, V, and W for precipitation prediction from the Norman,
Oklahoma WSR-88D.
† apply data mining techniques to Z, V and W in order to understand the naturally occurring inter-
relationships and signatures of these data when rain is detected.
† use linear models and ANNs for precipitation prediction.
By application of the ANN technology, we hope to improve the precipitation processing subsystem
(PPS) by creating algorithms that use more than one variable. Eventually, such a system can be trained to
ingest some additional meteorological estimates of rainfall types (e.g. squall lines, airmass storms)
derived from the pattern recognition algorithms of the reflectivity, velocity, and spectrum width
signatures. The ability to utilize the additional information, along with the use of newly developed
mathematical–statistical techniques, will allow more precise estimation of the effects of mixed drop size
distributions. By doing so, the precipitation estimation may be improved.
3. Data and analysis
The rainfall data for calendar year 1998 is collected from the Chandler, Oklahoma Mesonet station.
The Oklahoma Mesonet is a statewide network of 115 automated weather observing stations, designed
with dense spatial coverage across the state, while locating at least one observing station in each of
Oklahoma’s 77 counties (Basara, Brotzge, & Crawford, 1999). Nine main parameters are measured at all
stations including rainfall. Rainfall is measured at 5-min intervals. The data are heavily quality
controlled and archived for the period 1994 to present with 99.8% availability.
The WSR-88D radar has an effective range of approximately 230 km. The digital database,
containing the three variables to be used herein, is limited to a range of 180 km. The radar performs
approximately 10 elevation scans that comprise of a single volume scan. Each elevation scan is at a
T.B. Trafalis et al. / Computers & Industrial Engineering 43 (2002) 775–786 777
particular elevation angle between 0.58 and 158 above the horizontal. For each elevation scan, the radar
revolves a full 3608 about the vertical and makes about 366 azimuthal scans in approximately 5 min. For
the azimuthal on the five lowest elevation scans, we will utilize the three variables: V, W, and Z. W and V
are measured once in every 0.25 km or at 920 points and Z is measured once in every kilometer or at 230
points for every azimuthal scan. The radar used in this study (KTLX) is located near Norman, Oklahoma,
which is approximately 54 km WSW of the Chandler raingauge. The data are available on Exabyte
magnetic tapes. The data processing steps are now listed. First, the data on the tapes are extracted using
proprietary programs supplied by the NEXRAD Operational Support Facility. By using another
program, specific elevations are chosen and then the file type is converted into a text file in order to make
the data readable by another software package. Numerous outliers are eliminated and missing data are
interpolated. These data are synchronized in time with the rainfall data for linear analysis and ANNs. All
of these steps are time consuming and are performed separately for Z, V and W.
Given the 5-min time resolution of both observing and measurement platforms, it is clear that there
will be a large amount of data. Therefore, it is necessary to preprocess and do some feature extraction
from the raw data for the following two reasons. First, raw data may suffer from problems such as noise,
missing data points, or probability distribution errors (Rosenfeld et al., 1993). Secondly, using the raw
data may lead our search procedure to suffer from the curse of dimensionality and yield poor results.
Therefore, it is important to transform the raw data into some new representation by using data mining
techniques. For this purpose, a methodology which accomplishes a clustering of the data, similar to one
proposed by Jeyabalan (1998), will be used. In that study, every elevation scan of the radar was
partitioned into smaller areas, which were analyzed for the presence of patterns corresponding to
tornadic circulations by the neural net, which was trained to successfully classify tornadic and
nontornadic circulation differently. The technique used to analyze patterns of inter-related three-
dimensional volume scans in this study revolves around several types of applications of principal
component analysis. The analysis is exploratory with a goal of determining which grids at five elevations
cluster together.
4. Methodology
ANN models are algorithms for intellectual tasks such as learning, classification, recognition,
estimation, and optimization that are based on the concept of how the human brain works. An ANN
model is composed of a large number of processing elements called neurons. Each neuron is connected
to other neurons by links, each with an associated weight. Neurons without links toward them are called
input neurons and those with no link leaving away from them are called output neurons. The neurons are
represented by state variables. State variables are functions of the weighted-sum of input variables (V, W,
Z ) and other state variables. Each neuron performs a simple transformation at the same time in a parallel-
distributed manner. The input–output relation of the transformation in a neuron is characterized by an
activation function. The combination of input neurons, output neurons, and links between neurons with
associated weights constitute the architecture of the ANN.
One of the advantages of using ANNs is that they can extract patterns and detect trends that are often
too complex to be noticed by either humans or other computer techniques. ANNs are appropriate for
capturing existing patterns and trends from noisy data. The procedure involves training an ANN with a
large sample of representative data and testing the ANN by using data not included in the training with
T.B. Trafalis et al. / Computers & Industrial Engineering 43 (2002) 775–786778

the aim of predicting the new outputs of the ANN. The training process involves different numbers of
layers (inputs, output, and hidden) and neurons and links between neurons with associated weights. The
last layer represents the output. The number of hidden layers is user-defined. The user can modify how
many neurons each layer has. The user can also adjust the training and testing tolerances. After the
network has been trained and tested to the user satisfaction, it is ready for use. New sets of input data can
be presented to the network, and they will produce a forecast based on what it has learned. A trained
ANN can be treated as an expert in the category of information it has been given to analyze. This expert
can then be used to provide predictions given new daily situations, and answer what-if questions.
WSR-88D and Oklahoma Mesonet station data are extracted, preprocessed and applied to the
multilayer feedforward ANN model as shown in Fig. 1. A feedforward ANN has some number of input
and output nodes, characterizing, respectively, the independent and dependent variables of an underlying
map that is to be learned by the ANN.
The inputs are categorized in three ways: raw data, principal components of the raw data, and dividing
the raw data into the following precipitation categories: light (0–3.12 mm/h), moderate (3.13–
15.59 mm/h) and heavy (.15.59 mm/h). The rationale for each type of input is that the raw data provide
the native radar output, whereas the principal component analysis achieves data reduction of 250 inputs
to 13 uncorrelated inputs. The third categorization is motivated by the observation that, as precipitation
rate increases the reflectivity (measured in DBZ) increases. By dividing the inputs into three categories
based on rainfall rate, the reflectivity distributions are examined and provide a classification scheme
whereby the ANNs can be divided into three subsets. The first subset is based on any reflectivity less than
27 DBZ to account for the light category. The moderate rainfall is characterized by reflectivity in the
range of 27.5–34 DBZ and the heavy rainfall has reflectivity in excess of 34 DBZ. The accuracy of the
single ANN versus the three subset ANNs combined into a single forecast tool is examined. Multiple
radar inputs are used in all three types of analyses.
Our objective is to find the set of optimal connection weights that achieve the correct mapping
between observed precipitation data RFg(k ) by rain gauges k and calculated rainfall data RFn(k ) by the
Fig. 1. ANN architecture.
T.B. Trafalis et al. / Computers & Industrial Engineering 43 (2002) 775–786 779
ANN for a set of given input data Z and V for kth pattern by WSR-88D. This problem is commonly
known as supervised ANN training. The training phase of ANNs (Haykin, 1999) can be seen as a
nonlinear optimization problem where the training error is to be minimized. This problem can be
formulated as follows:
minimizeXN
i¼1
½RFgðiÞ2 RFnðiÞ�2where N is the number of observations:
The minimization is with respect to the connection weights of the ANN. Several nonlinear optimization
techniques can be used (Bazaraa, Sherali, & Shetty, 1993). In our experiments, the ANN will be trained
to estimate rainfall precipitation at one Mesonet station (Chandler, OK) by using rain gauge data at this
station and WSR-88D data. Note that, for WSR-88D data, only the part whose partitioning coincides
directly with the location of an underlying rainfall station will be used. This problem can be viewed as
time series analysis or nonlinear dynamical system approximation. Preliminary experiments for the
nonlinear dynamical system approximation of Henon Attractor are performed by Trafalis, Couellan, and
Bertrand (1997a), Trafalis and Tutunji (1998).
The application of ANNs to multiple radar variable outputs has never been attempted before this
research. The importance of this is that additional information on the behavior of the winds can provide
inputs that may result in more accurate forecasts of rainfall than analyses based solely on reflectivity.
5. Results of data mining
The reflectivity data are divided approximately into a 5 £ 5 array of 1 km2 horizontally spaced grids
centered on the Mesonet raingauge. There were five elevation angles retained, which yields 25 grid
boxes per level times 5 elevations for a total of 125 boxes serving to describe the atmosphere above the
gauge. The correlation structure of the radar reflectivity is investigated by projecting the structure on an
uncorrelated set of basis vectors in principal component analysis (PCA). A plot of the leading PC loading
vector (Fig. 2) clearly indicates that there is a major locus of points in a large diffuse cluster. This single
PC extracts 88% of the reflectivity variability and its associated eigenvalue is the only one separated by
more than the North, Bell, Cahalan, and Moeng (1982) criterion. However, by scrutinizing Fig. 2, which
plots PC1 (horizontal axis) vs. PC2 (vertical axis) it is apparent that there are five isolated clusters, each
Fig. 2. Unrotated PC1 vs. PC2 reflectivity.
T.B. Trafalis et al. / Computers & Industrial Engineering 43 (2002) 775–786780
of which exhibits low within group variability, residing near PC1. After some experimentation to
achieve the best signal-to-noise separation and decomposition of individual clusters, it was decided that
retention of eight PCs accounting for 96.6% of the variance in reflectivity led to a compact description of
the natural clustering in the dataset. There are 1009 individual 5-min observations in the data set. The
reflectivity pattern for each observation can be reconstructed with 96.6% overall accuracy with a linear
combination of the PCs.
The second native parameter analyzed is velocity in the 5 £ 5 grid and through the 5 elevation angles.
Decomposition of the 125 £ 125 correlation matrix of velocity is accomplished by projecting the data on
5 principal components that extract 94.6% of the total variation of these data. There are five distinct
clusters in these data in a highly collinear arc surrounding the first unrotated PC (Fig. 3). The third radar
parameter analyzed is spectrum width. There are five eigenvalues above the noise spectrum (North et al.,
1982) and the eigenvectors associated with these are retained for analysis and account for 53.8% of the
spectrum width variance. Note that this is much lower than for the analysis of either reflectivity or
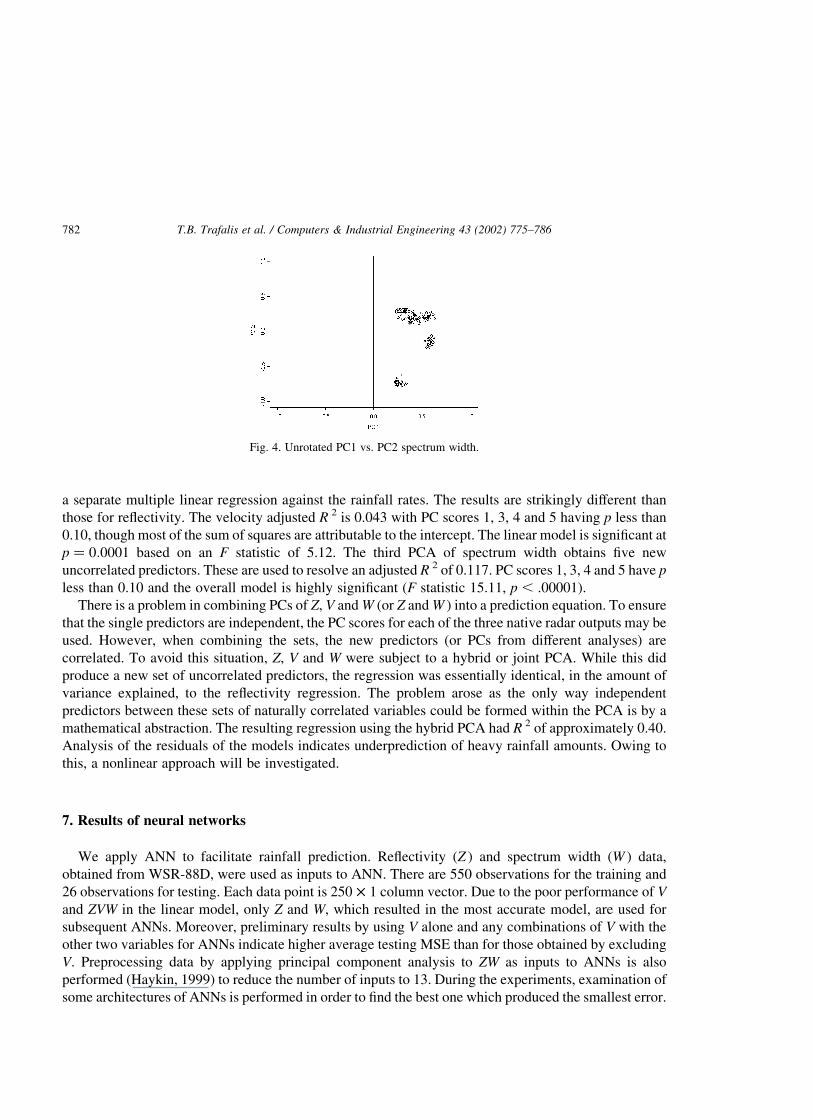
velocity, indicating a more chaotic behavior in the spectrum width data. An investigation of the first pair
of unrotated PCs (Fig. 4) indicates two distinct clusters and one elongated one. However, by
investigating the projections on the remaining four PCs, five clusters emerge.
6. Results of linear modeling of radar inputs
Each of Z, V and W variables are used as a predictor with the rainfall as the response variable. Using
the full set of 576 observations, multiple linear regression of Z on rainfall rate is accomplished by
forming independent predictors from the set of 125 highly correlated Z predictors. The importance of
using this procedure is based on the expectation of independent predictors by the regression. The raw
data are highly correlated and violate that assumption; therefore, PCA is utilized to form new predictors.
The regression of the eight new predictors provides an adjusted R 2 of 0.383. The overall regression is
highly significant with an F-statistic of 44.02 ( p , 0.00001). Physical diagnosis of the predictors which
resolved significant amounts of residual sum of squares indicates that all but PC scores 2 and 8 are
significant at probabilities less than 0.10. Interestingly, PC 2 has loadings with high reflectivity south and
east of the raingauge, which would be consistent with the prior passage of fronts and a cessation of rain
over the Chandler site. A second PCA of velocity yields five new uncorrelated predictors that are used in
Fig. 3. Unrotated PC1 vs. PC2 velocity.
T.B. Trafalis et al. / Computers & Industrial Engineering 43 (2002) 775–786 781
a separate multiple linear regression against the rainfall rates. The results are strikingly different than
those for reflectivity. The velocity adjusted R 2 is 0.043 with PC scores 1, 3, 4 and 5 having p less than
0.10, though most of the sum of squares are attributable to the intercept. The linear model is significant at
p ¼ 0:0001 based on an F statistic of 5.12. The third PCA of spectrum width obtains five new
uncorrelated predictors. These are used to resolve an adjusted R 2 of 0.117. PC scores 1, 3, 4 and 5 have p
less than 0.10 and the overall model is highly significant (F statistic 15.11, p , .00001).
There is a problem in combining PCs of Z, V and W (or Z and W ) into a prediction equation. To ensure
that the single predictors are independent, the PC scores for each of the three native radar outputs may be
used. However, when combining the sets, the new predictors (or PCs from different analyses) are
correlated. To avoid this situation, Z, V and W were subject to a hybrid or joint PCA. While this did
produce a new set of uncorrelated predictors, the regression was essentially identical, in the amount of
variance explained, to the reflectivity regression. The problem arose as the only way independent
predictors between these sets of naturally correlated variables could be formed within the PCA is by a
mathematical abstraction. The resulting regression using the hybrid PCA had R 2 of approximately 0.40.
Analysis of the residuals of the models indicates underprediction of heavy rainfall amounts. Owing to
this, a nonlinear approach will be investigated.
7. Results of neural networks
We apply ANN to facilitate rainfall prediction. Reflectivity (Z ) and spectrum width (W ) data,
obtained from WSR-88D, were used as inputs to ANN. There are 550 observations for the training and
26 observations for testing. Each data point is 250 £ 1 column vector. Due to the poor performance of V
and ZVW in the linear model, only Z and W, which resulted in the most accurate model, are used for
subsequent ANNs. Moreover, preliminary results by using V alone and any combinations of V with the
other two variables for ANNs indicate higher average testing MSE than for those obtained by excluding
V. Preprocessing data by applying principal component analysis to ZW as inputs to ANNs is also
performed (Haykin, 1999) to reduce the number of inputs to 13. During the experiments, examination of
some architectures of ANNs is performed in order to find the best one which produced the smallest error.
Fig. 4. Unrotated PC1 vs. PC2 spectrum width.
T.B. Trafalis et al. / Computers & Industrial Engineering 43 (2002) 775–786782
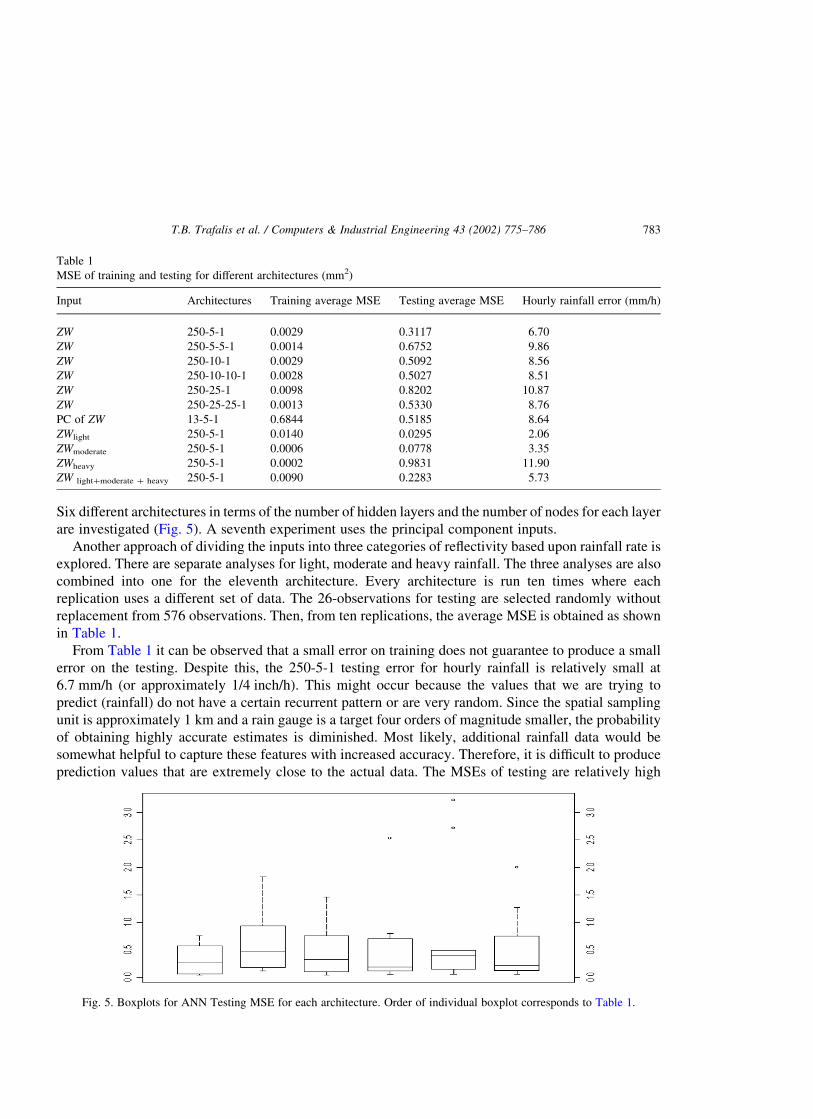
Six different architectures in terms of the number of hidden layers and the number of nodes for each layer
are investigated (Fig. 5). A seventh experiment uses the principal component inputs.
Another approach of dividing the inputs into three categories of reflectivity based upon rainfall rate is
explored. There are separate analyses for light, moderate and heavy rainfall. The three analyses are also
combined into one for the eleventh architecture. Every architecture is run ten times where each
replication uses a different set of data. The 26-observations for testing are selected randomly without
replacement from 576 observations. Then, from ten replications, the average MSE is obtained as shown
in Table 1.
From Table 1 it can be observed that a small error on training does not guarantee to produce a small
error on the testing. Despite this, the 250-5-1 testing error for hourly rainfall is relatively small at
6.7 mm/h (or approximately 1/4 inch/h). This might occur because the values that we are trying to
predict (rainfall) do not have a certain recurrent pattern or are very random. Since the spatial sampling
unit is approximately 1 km and a rain gauge is a target four orders of magnitude smaller, the probability
of obtaining highly accurate estimates is diminished. Most likely, additional rainfall data would be
somewhat helpful to capture these features with increased accuracy. Therefore, it is difficult to produce
prediction values that are extremely close to the actual data. The MSEs of testing are relatively high
Table 1
MSE of training and testing for different architectures (mm2)
Input Architectures Training average MSE Testing average MSE Hourly rainfall error (mm/h)
ZW 250-5-1 0.0029 0.3117 6.70
ZW 250-5-5-1 0.0014 0.6752 9.86
ZW 250-10-1 0.0029 0.5092 8.56
ZW 250-10-10-1 0.0028 0.5027 8.51
ZW 250-25-1 0.0098 0.8202 10.87
ZW 250-25-25-1 0.0013 0.5330 8.76
PC of ZW 13-5-1 0.6844 0.5185 8.64
ZWlight 250-5-1 0.0140 0.0295 2.06
ZWmoderate 250-5-1 0.0006 0.0778 3.35
ZWheavy 250-5-1 0.0002 0.9831 11.90
ZW lightþmoderate þ heavy 250-5-1 0.0090 0.2283 5.73
Fig. 5. Boxplots for ANN Testing MSE for each architecture. Order of individual boxplot corresponds to Table 1.
T.B. Trafalis et al. / Computers & Industrial Engineering 43 (2002) 775–786 783

compared to MSEs of the training. Increasing the complexity of neural network architecture from
1-hidden layer to 2-hidden layers does not have a clear influence on the testing MSE values.
Applying principal components to preprocess the data, as input to ANN, does not improve the
performance. By dividing the reflectivity into three subsets based on light, moderate and heavy
rainfall, an interesting finding emerges. The testing errors for light and moderate rainfall drop
considerably to 2.06 and 3.35 mm/h, respectively. The error for the heavy rainfall increases to
11.90 mm/h. The small sample size (40) in the training data of heavy rainfall is one factor
leading to difficulty in predicting the rainfall rate as accurately as for the light and moderate
categories (with 340 and 160 training observations, respectively). The observed heavy rainfall
rates are as high as 93.48 mm/h; hence, the magnitude of the error can be placed in perspective.
When the three subsets are recombined into one forecast tool, the testing error is 5.73 mm/h,
which is the lowest of the various experiments. Consequently, dividing the analysis into subsets
appears to be a promising approach.
8. Summary and conclusions
Analysis of the three native variables (reflectivity, velocity and spectrum width) from the WSR-88D
radar in Norman, Oklahoma, and experiments for predicting rainfall rates are undertaken with data
mining and ANNs. A 5 £ 5 grid of 1 km boxes for the radar data is constructed, centered on the
Chandler, Oklahoma Mesonet rain gauge. The importance of using these Mesonet data is that they are
recorded in 5 min intervals which nearly match the volume scan time of the radar. Additionally, the
lowest five elevation angles are used to provide a three-dimensional snapshot of the atmosphere above
the raingauge using 125 discrete boxes. The goals of the research are twofold: data mining and
prediction. The former attempts to describe how the 125 grid boxes interrelate for the three native
variables during periods of rainfall. By using principal component analysis, results of the data mining
indicate that, for reflectivity, the data cluster into seven highly correlated groups. A key finding is that the
middle three levels shared many of the same relative variations in wind speed. For spectrum width, there
are five clusters, one for each level, with little correlation between the clusters.
The combination of the features for the three native variables can provide a basis for pattern
recognition and guidance for further investigation using linear and ANN prediction schemes. Linear
modeling of the radar data suggests that reflectivity is the most predictive of the three variables
examined. However, spectrum width is highly significant too. Despite that, when the two were combined
into a single PCA and those PCs are used as predictors, results are only slightly improved over
reflectivity alone. This is likely a consequence of the nonlinearities and feedbacks between the two that
could not be modeled. Therefore, some ANNs architectures are investigated. The results of ANNs using
ZW are relatively accurate with an average hourly error of 6.7 mm for a 250-5-1 model. Other
experiments using PCA to preprocess the data into a lower dimensionality reveal errors of approximately
the same size as the raw inputs. However, partitioning the experiment into various reflectivity bins based
on light, moderate and heavy rainfall is encouraging as the testing error decreases to an overall
5.73 mm/h. Given the large variation in rainfall rates over a small area and the ability of radar to detect
the atmosphere in relatively coarse one km bins, this error is considered reasonable. In the near future,
we plan to extract the 1999 rainfall data to determine if increasing the number of data will provide better
estimation results.
T.B. Trafalis et al. / Computers & Industrial Engineering 43 (2002) 775–786784

Acknowledgements
This research was supported by DOC/NOAA Grant NA67RJ0150. We extend thanks to Tim
O’Bannon for assistance in interpreting the radar tapes and providing the program to interpret Level 2
radar data and to Tim Kwiatkowski for programming assistance. Additional gratitude is extended to Suat
Kasap for data processing assistance and Jean Shingledecker for administrative assistance. This research
was performed on The University of Oklahoma ECAS Cray-J90.
References
Basara, J. B., Brotzge, J. A., & Crawford, K. C. (1999). Investigating land-atmosphere interactions using the Oklahoma
Mesonet. Third Symposium on Integrated Observing Systems, Dallas, TX: American Meteorological Society, January 10–
15.
Bazaraa, M. S., Sherali, H. D., & Shetty, C. M. (1993). Nonlinear programming: Theory and algorithms. New York: Wiley.
Fulton, R. A., Breidenbach, J. P., Seo, D.-J., & Miller, D. A. (1998). The WSR-88D rainfall algorithm. Weather and
Forecasting, 13, 377–395.
Gong, X.-F., & Richman, M. B. (1995). On the application of cluster analysis to growing season precipitation data in North
America east of the Rockies. Journal of Climate, 8, 897–931.
Haykin, S. (1999). Neural networks: A comprehensive foundation. New York: MacMillan.
Jeyabalan, C (1998). Statistical analysis of the base data from the WSR-88D weather radar and description of mesocyclone
features using neural networks. MS Thesis. Norman, OK: The University of Oklahoma.
Jeyabalan, C., White, A., & Trafalis, T. B. (1998). Statistical analysis of base data from the WSR-88D weather radar and
description of mesocyclone features using neural networks. Proceedings of the 14th Conference on Probability and
Statistics in at Atmospheric Science, Phoenix, AZ: American Meteorological Society, January 11–16, pp. J93–J96.
Liu, H., & Chandrasekar, V. (1997). Radar precipitation estimation using neural network. Proceedings of the 28th Conference
on Radar Meteorology, Austin, TX: American Meteorological Society, September 7–12, pp. 202–203.
Marshall, J. S., & Palmer, W. M. (1948). The distribution of raindrops with size. Journal of Meteorology, 5, 165–166.
Marzban, C., & Stumpf, G. J. (1996). A neural network for tornado prediction based on Doppler radar-derived attributes.
Journal of Applied Meteorology, 35, 617–626.
Montroy, D. L. (1997). Linear relation of central and eastern North American precipitation to tropical Pacific sea-surface
temperature anomalies. Journal of Climate, 10, 541–558.
Montroy, D. L., & Richman, M. B. (1998). Prediction of North American precipitation and temperature anomalies using
artificial neural networks. Proceedings of the 14th Conference on Probability and Statistics in at Atmospheric Sciences,
Phoenix, AZ: American Meteorological Society, January 11–16, pp. J81–J86.
Montroy, D. L., Richman, M. B., & Lamb, P. J. (1998). Observed nonlinearities of monthly teleconnections between tropical
Pacific sea-surface temperatures and central eastern North American precipitation. Journal of Climate, 11, 1812–1835.
North, G. R., Bell, T. L., Cahalan, R. F., & Moeng, F. J. (1982). Sampling errors in the estimation of empirical orthogonal
functions. Monthly Weather Review, 110, 699–706.
OFCM (1990). Doppler radar meteorological observations, Part B, Doppler radar theory and methodology. Federal
Meteorological Handbook 11, FCM-H11B-1990, Washington, DC: Office of the Federal Coordinator for Meteorological
Services and Supporting Research.
OFCM (1991). Doppler radar meteorological observations, Part C, WSR-88D products and algorithms. Federal
Meteorological Handbook 11, FCM-H11C-1991, Washington, DC: Office of the Federal Coordinator for Meteorological
Services and Supporting Research.
Richman, M. B. (1986). Review paper: Rotation of principal components. International Journal of Climatology, 6, 293–335.
Richman, M. B., & Gong, X.-F. (1999). Relationships between the definition of hyperplane width to the fidelity of principal
component loading patterns. Journal of Climate, 12, 1557–1576.
Rosenfeld, D., Wolff, D. B., & Atlas, D. (1993). General probability-matched relations between radar reflectivity and rain rate.
Journal of Applied Meteorology, 32, 50–72.
T.B. Trafalis et al. / Computers & Industrial Engineering 43 (2002) 775–786 785

Schizas, C. N., Pattichis, C. S., & Michaelides, S. C. (1994). Forecasting minimum temperature with short time-length data
using artificial neural networks. Neural Network World, 2, 219–230.
Silveira, R. B., & Holt, A. R. (1997). A neural network application to discriminate between clutter and precipitation using
polarization information as feature space. Proceedings of the 28th Conference on Radar Meteorology, Austin, TX:
American Meteorological Society, September 7–12, pp. 57–58.
Skapura, D. M. (1996). Building Neural Networks. New York: ACM Press Books.
Smith, P. L., & Joss, J. (1997). Use of a fixed exponent in adjustable Z–R relationships. Proceedings of the 28th Conference on
Radar Meteorology, Austin, TX: American Meteorological Society, September 7–12, pp. 254–255.
Trafalis, T. B., Couellan, N. P., & Bertrand, S. C. (1997a). Training of supervised neural networks via a nonlinear primal-dual
interior point method. Proceedings of International Conference on Neural Networks (INNC/IEEE), Houston, TX:
International Neural Networks Society, June 9–12, pp. 2017–2021.
Trafalis, T. B., Couellan, N. P., Li, P.-I., Stumpf, G., & White, A. (1997b). An affine scaling neural network training algorithm
for prediction of tornados. In C. H. Dagli, M. Akay, O. Ersay, B. R. Fernandez, & A. Smith (Eds.), (Vol. 7) (pp. 213–218).
Smart Engineering System Design: Neural Networks, Fuzzy Logic, Data Mining, and Evolutionary Programming, New
York: ASME Press.
Trafalis, T. B., & Tutunji, T. A. (1998). Barrier and stochastic barrier Newton-type methods for training feedforward neural
networks with bounded weights. International Journal of Smart Engineering System Design, 1, 241–254.
Wilson, J. W., & Brandes, E. A. (1979). Radar measurement of rainfall—A summary. Bulletin of the American Meteorological
Society, 60, 1048–1058.
Xiao, R., & Chandrasekar, V. (1997). Development of a neural network based algorithm for rainfall estimation from radar
observations. IEEE Transactions on Geoscience and Remote Sensing, 35, 160–171.
T.B. Trafalis et al. / Computers & Industrial Engineering 43 (2002) 775–786786