
Data Mining Application in Analysis of Knowledge Management Gaps
30
Poincare Return Times in the Interaction of Chaotic and Stochastic Systems E. I. Vladimirsky Department of Information-measurement and Computer Engineering Azerbaijan State Oil Academy Baku, AZ1010, Azadlig 20, Azerbaijan Eduard.Vladimirsky@hotmail .com Abstract - In work the new structure of interaction of chaotic and stochastic systems is offered. Defined by recurrence interaction diagram and plotted the distribution of return times Poincare. I. INTRODUCTION The dynamic systems with complex character of trajectories can be described from the point of view of geometry of limiting sets in phase space, and also evolution of phase trajectories in time. One of fundamental features of temporary dynamics of systems is the so-called Poincare return. Poincare return means, that any trajectory, started from some point , in time infinite number of time will pass as much as close from an initial condition [1]. Such movements in dynamic systems Poincare has named steady on Poisson [1]. An example of similar systems is the systems realizing a mode strange attractors. The phase trajectories on strange attractors are always unstable on Lyapunov, but are steady on Poisson. The plenty of works is devoted very much to analysis of a problem of return Poincare. However not all questions, in particular, concerning number of applied problems, are investigated to the full. One of them is the question on influence of interaction of chaotic and stochastic systems on times of return Poincare. 0 x Task of revealing and estimation of parameters of interaction between sources complex (chaotic, stochastic) fluctuations on observable is interdisciplinary approach. It arises in physics, biology, geophysics, medicine, economy etc. Thus the special attention is given to irregular signals, as already comprehension of typical ness of chaotic behavior of nonlinear systems for a long time has come. In connection with deep distinctions between casual and chaotic systems [2], and also taking into account heterogeneity of information flows circulating in these structures, there is a problem of their interaction. That is there is a question « as the stochastic component chaotic process influences. It appears, that resulting chaotic behavior of dynamic system is essentially obliged by the occurrence not only action dynamic (determinist) of the laws, but also presence of the statistical factors [3]. Besides recently in connection with development of sinergetic concept, the interesting property of such systems - was found out has appeared, that the increase of intensity stochastic composed can result not only in growth of the disorder, but also education of the ordered structures, that is self-organizing of system, reduction her entropy [4]. Obviously, last is connected with non-conservative of volume of phase space, as in the complete closed system entropy can not decrease. The interaction of auto oscillatory systems demonstrating chaotic dynamics, results in change of structure of attractors, interaction, existing in absence. In turn, these changes are reflected in structure of characteristic time intervals such, as times of return in Poincare secant. Agrees [5], the distribution of times of return of dynamic system can be characterized multifractals by properties, that is demonstrate local scaling [6, 7]. Depending on a mode of functioning of system the times of return will be or const (if the movement is steady periodic), or quasi-periodic (at movement on n-measure torus), or to represent a casual sequence of times k k k t t − = +1 τ , where - answer times of hit of a phase trajectory in k t ε neighborhood . The casual character of a sequence of times of return characterizes movements on chaotic attractors of dissipative nonlinear systems. 0 x For chaotic attractors times of the first return are limited: Ζ < − = + k k k t t 1 τ for anyone , that is a consequence of presence in system of the minimal set. Movements on attractor, satisfying as the specified property, Poincare has named steady on Poisson. ... 2 , 1 = k II. STATEMENT OF A TASK One of the important practical applications of management of chaos is served by methods of the control of nonlinear systems. These methods are based on extreme sensitivity of chaotic dynamics to small disturbance. The efficiency of the control is appreciably defined (determined) by time of hit in required area. This time refers to as time of an establishment of the control. Let average time > < τ , required that at argotic movement to get in a neighborhood of some point on strange attractor, is expressed as [8]: , (1) F D − > < ε τ ~ where D F - fractal dimension attractor. Let model of interaction of stochastic process with chaotic system Rabinovich - Fabricant of a kind [9, 10]: 1 + Υ i D 547
Transcript of Data Mining Application in Analysis of Knowledge Management Gaps
Poincare Return Times in the Interaction of Chaotic and Stochastic Systems
E. I. Vladimirsky Department of Information-measurement and Computer Engineering
Azerbaijan State Oil Academy Baku, AZ1010, Azadlig 20, Azerbaijan
Eduard.Vladimirsky@hotmail .com Abstract - In work the new structure of interaction of chaotic and stochastic systems is offered. Defined by recurrence interaction diagram and plotted the distribution of return times Poincare.
I. INTRODUCTION
The dynamic systems with complex character of trajectories can be described from the point of view of geometry of limiting sets in phase space, and also evolution of phase trajectories in time. One of fundamental features of temporary dynamics of systems is the so-called Poincare return. Poincare return means, that any trajectory, started from
some point , in time infinite number of time will pass as much as close from an initial condition [1]. Such movements in dynamic systems Poincare has named steady on Poisson [1]. An example of similar systems is the systems realizing a mode strange attractors. The phase trajectories on strange attractors are always unstable on Lyapunov, but are steady on Poisson. The plenty of works is devoted very much to analysis of a problem of return Poincare. However not all questions, in particular, concerning number of applied problems, are investigated to the full. One of them is the question on influence of interaction of chaotic and stochastic systems on times of return Poincare.
0x
Task of revealing and estimation of parameters of interaction between sources complex (chaotic, stochastic) fluctuations on observable is interdisciplinary approach. It arises in physics, biology, geophysics, medicine, economy etc.
Thus the special attention is given to irregular signals, as already comprehension of typical ness of chaotic behavior of nonlinear systems for a long time has come.
In connection with deep distinctions between casual and chaotic systems [2], and also taking into account heterogeneity of information flows circulating in these structures, there is a problem of their interaction. That is there is a question « as the stochastic component chaotic process influences.
It appears, that resulting chaotic behavior of dynamic system is essentially obliged by the occurrence not only action dynamic (determinist) of the laws, but also presence of the statistical factors [3].
Besides recently in connection with development of sinergetic concept, the interesting property of such systems - was found out has appeared, that the increase of intensity
stochastic composed can result not only in growth of the disorder, but also education of the ordered structures, that is self-organizing of system, reduction her entropy [4]. Obviously, last is connected with non-conservative of volume of phase space, as in the complete closed system entropy can not decrease.
The interaction of auto oscillatory systems demonstrating chaotic dynamics, results in change of structure of attractors, interaction, existing in absence. In turn, these changes are reflected in structure of characteristic time intervals such, as times of return in Poincare secant. Agrees [5], the distribution of times of return of dynamic system can be characterized multifractals by properties, that is demonstrate local scaling [6, 7].
Depending on a mode of functioning of system the times of return will be or const (if the movement is steady periodic), or quasi-periodic (at movement on n-measure torus), or to represent a casual sequence of times
kkk tt −= +1τ , where - answer times of hit of a phase trajectory in
ktε neighborhood . The casual character of a
sequence of times of return characterizes movements on chaotic attractors of dissipative nonlinear systems.
0x
For chaotic attractors times of the first return are limited: Ζ<−= + kkk tt 1τ for anyone , that is a consequence of presence in system of the minimal set. Movements on attractor, satisfying as the specified property, Poincare has named steady on Poisson.
...2,1=k
II. STATEMENT OF A TASK
One of the important practical applications of
management of chaos is served by methods of the control of nonlinear systems. These methods are based on extreme sensitivity of chaotic dynamics to small disturbance. The efficiency of the control is appreciably defined (determined) by time of hit in required area. This time refers to as time of an establishment of the control. Let average time ><τ , required that at argotic movement to get in a neighborhood of some point on strange attractor, is expressed as [8]:
, (1) FD−>< ετ ~where DF - fractal dimension attractor. Let model of interaction of stochastic process with
chaotic system Rabinovich - Fabricant of a kind [9, 10]: 1+Υi
D
547
132211 ++++−=
iYDxxbxaxx ,
21122 xxhxbxx −+−= , (2)
2133 xxdxx +−= Where , , - variable; - positive constants; 1x 2x 3x hdba ,,,
1+iϕ - discrete stochastic equations of a kind [11]:
[ ]iiii rr ϕξγτζϕ ))1(1 +−+=+ , (3)
where τiti = - the time, is fixed by a set of numbers and minimal interval Ni ,...,1,0= τ ; iζ and iξ - adaptive
and multiplicative stochastic sources normalized by conditions of white noise ijjiji δξξζζ == ; factor of friction γ sets
parameter )1( γγ +=V , values which define a regime of diffusion; - intensity stochastic composed. D
It is required: · to determine cooperating observable, made by
systems (2), (3); · to determine recurrence diagram in a context
cooperating observable; · to determine fractal dimension DF recurrence
diagram; · to determine the time of Poincare return to function
(1); · to give topological and texture analysis of recurrence
diagrams, as a result of which is made a decision on an accessory to a class of processes.
III. REALIZATION OF ALGORITM
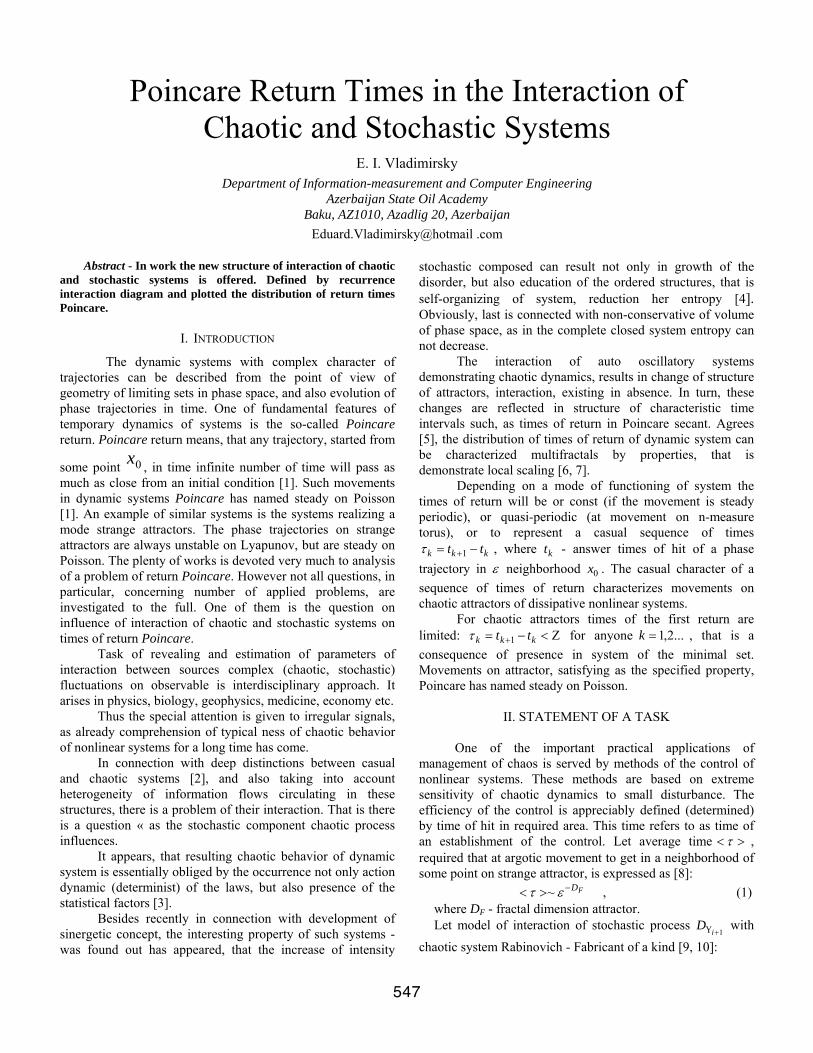
Step 1. Modeling chaotic system such as Rabinovich -
Fabricant in program environment of MATLAB/SIMULINK is regime, of points (is real - ), submitted circuit (Fig. 1, a) with attractor in a plane - (Fig. 1, b), at , , .
4105,2 ⋅=N 3102 ⋅
32 xx −4=a 1== db 75.6=hStep 2. The iterative algorithm of procedure (3) on set
consisting from Of points (real - ), leading to a time series characterizing the anomalous diffusion.
3108 ⋅=N 3102 ⋅
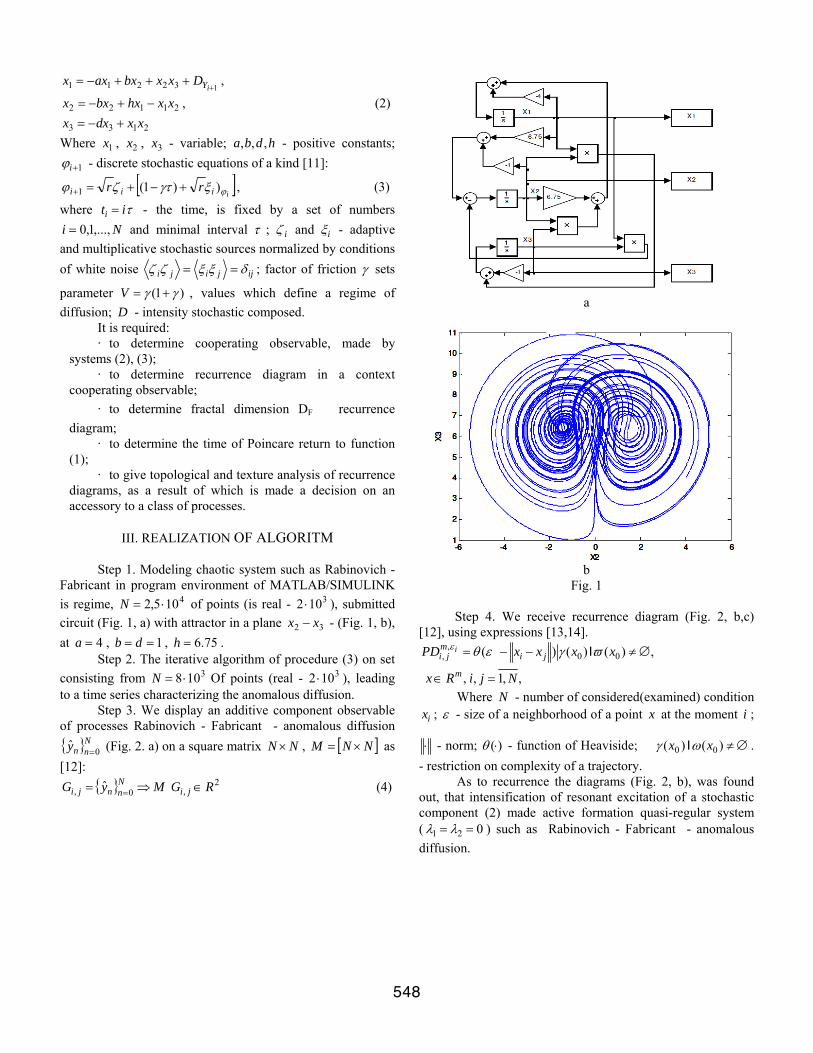
Step 3. We display an additive component observable of processes Rabinovich - Fabricant - anomalous diffusion
(Fig. 2. a) on a square matrix , Nnny 0ˆ = NN × [ ]NNM ×= as
[12]: MyG N
nnji ⇒= =0, ˆ 2, RG ji ∈ (4)
a
b
Fig. 1
Step 4. We receive recurrence diagram (Fig. 2, b,c) [12], using expressions [13,14].
,,1,,
,)()()( 00,
,
NjiRx
xxxxPDm
jim
jii
=∈
∅≠−−= ϖγεθε I
Where - number of considered(examined) condition ;
Nix ε - size of a neighborhood of a point x at the moment i ;
⋅ - norm; )(⋅θ - function of Heaviside; ∅≠)()( 00 xx ωγ I . - restriction on complexity of a trajectory.
As to recurrence the diagrams (Fig. 2, b), was found out, that intensification of resonant excitation of a stochastic component (2) made active formation quasi-regular system ( 021 == λλ ) such as Rabinovich - Fabricant - anomalous diffusion.
548
log τ
0 200 400 600 800 1000 1200 1400 1600 1800 2000-10
-5
0
5
10
a
0 500 1000 1500 2000
0
200
400
600
800
1000
1200
1400
1600
1800
2000
b
Time
Tim
e
0 500 1000 1500 2000
0
200
400
600
800
1000
1200
1400
1600
1800
2000
c
Fig. 2
Step 5. We determine fractal dimension of recurrence diagram [15].
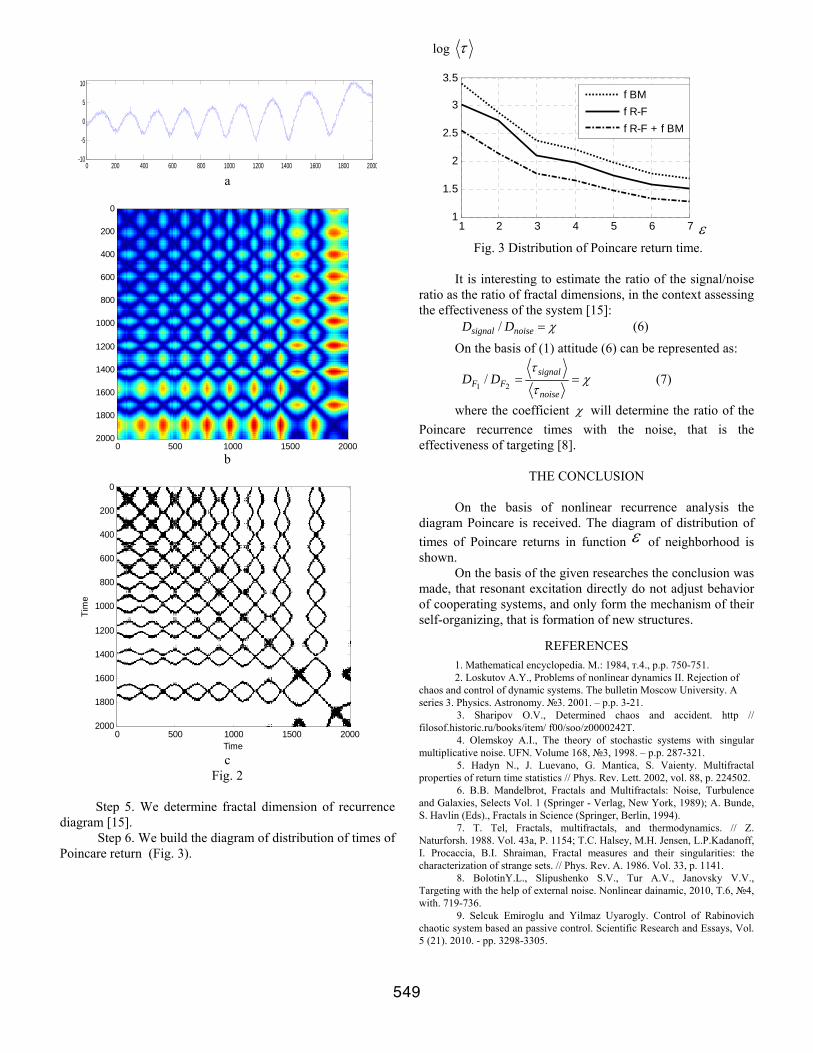
Step 6. We build the diagram of distribution of times of Poincare return (Fig. 3).
1 2 3 4 5 6 7
1
1.5
2
2.5
3
3.5f BMf R-Ff R-F + f BM
Fig. 3 Distribution of Poincare return time.
It is interesting to estimate the ratio of the signal/noise
ratio as the ratio of fractal dimensions, in the context assessing the effectiveness of the system [15]: (6) χ=noisesignal DD /
On the basis of (1) attitude (6) can be represented as:
χτ
τ==
noise
signalFF DD
21/ (7)
where the coefficient χ will determine the ratio of the Poincare recurrence times with the noise, that is the effectiveness of targeting [8].
THE CONCLUSION
On the basis of nonlinear recurrence analysis the
diagram Poincare is received. The diagram of distribution of times of Poincare returns in function ε of neighborhood is shown.
On the basis of the given researches the conclusion was made, that resonant excitation directly do not adjust behavior of cooperating systems, and only form the mechanism of their self-organizing, that is formation of new structures.
REFERENCES 1. Mathematical encyclopedia. M.: 1984, т.4., p.p. 750-751. 2. Loskutov A.Y., Problems of nonlinear dynamics II. Rejection of
chaos and control of dynamic systems. The bulletin Moscow University. A series 3. Physics. Astronomy. 3. 2001. – p.p. 3-21.
3. Sharipov O.V., Determined chaos and accident. http // filosof.historic.ru/books/item/ f00/soo/z0000242T.
4. Olemskoy Amultiplicative noise. UF
.I., The theory of stochastic systems with singular N. Volume 168, 3, 1998. – p.p. 287-321.
5. Hadyn N., J. Luevano, G. Mantica, S. Vaienty. Multifractal properties of return time statistics // Phys. Rev. Lett. 2002, vol. 88, p. 224502.
6. B.B. Mandelbrot, Fractals and Multifractals: Noise, Turbulence and Galaxies, Selects Vol. 1 (Springer - Verlag, New York, 1989); A. Bunde, S. Havlin (Eds)., Fractals in Science (Springer, Berlin, 1994).
7. T. Tel, Fractals, multifractals, and thermodynamics. // Z. Naturforsh. 1988. Vol. 43a, P. 1154; T.C. Halsey, M.H. Jensen, L.P.Kadanoff, I. Procaccia, B.I. Shraiman, Fractal measures and their singularities: the characterization of strange sets. // Phys. Rev. A. 1986. Vol. 33, p. 1141.
8. BolotinY.L., Slipushenko S.V., Tur A.V., Janovsky V.V., Targeting with the help of external noise. Nonlinear dainamic, 2010, Т.6, 4, with. 719-736.
9. Selcuk Emiroglu and Yilmaz Uyarogly. Control of Rabinovich chaotic system based an passive control. Scientific Research and Essays, Vol. 5 (21). 2010. - pp. 3298-3305.
ε
549

10. Dyakonov V., Kruglov In. Mathematical expansions MATLAB. The special directory. – Sankt-Peterburg: Piter, 2001. – p.480.
11. Olemskoy A.I., Borisyuk B.N., Shudo I.A., Multifractal analysis of temporary numbers. // Vistnik SumDU. Ser. «Fhisics, mathematics, mechanics ». 2, 2008. –p.p.70-81.
12. Vladimirsky E.I., Ismailov B.I., Synchronization in control of chaotic systems. // Information technologies, 1 (185), 2012. – p.p.16-19.
13. Vladimirsky E.I., Ismailov B.I., Nonlinear recurrence analysis as mathematical model of control of chaotic processes. Information technologies, 2011, 5, (177). p.p. 42-45.
14. Kolesov A.Y., Rozov N.T., Turbulence chaos. Modern mathematics and its appendices. Т. 64. 2009. – p.p.39-53.
15. Vladimirsky E.I., Tagiev F.K., Sinergetic approach to formation of integrated dimensions in intellectual information-measuring systems. Information technologies. 2010, 6 (166). – p.p. 62-67.
550
Data Mining Application in Analysis of Knowledge Management Gaps
Jalal Rezaienour *Maryam Nazaridoust Department Of Industrial Engineering, University of
Qom, Qom, Iran Department Of Computer Engineering and Information
Technology, University of Qom, Qom, Iran [email protected]
Abstract- Nowadays, lots of researchers believe that studying current status of organizations is one of the most basic stages to implement knowledge management (KM). Gap analysis is one of the techniques used to study current status of organizations and its distance with desired status. In present research, following to consider effective factors on KM, we attempt to present a new and comprehensive approach to improve gap analysis. Hence, we initially represent role of such factors in gap analysis. In addition, we propose using Data Mining (DM) techniques on results from gap analysis to reach more precise results. Then, we study status of each gap in an automobile manufacturing company using combination of statistical methods and DM techniques; and we propose a framework for KM planning and programming by considering the last researches conducted in this field and yielded results from studying gaps status in underlying company. Keywords- Knowledge management, Gap Analysis, Data mining, IT, Mechanism, Organizational Culture
I. Introduction
Knowledge is the most valuable property of any big/small, private or public organization so that knowledge can be taken into account as an important factor which causes to develop or distinct a company against it competitors. Knowledge makes an organization able to compete effectively and efficiently with its competitors in competitive environments. On the other hand, although knowledge exists in different fields of an organization, identification, collection and management of knowledge are often difficult and challenging. Hence, KM concepts and systems have found particular importance for researchers and managers. In present research, we believe that only using Information Technology (IT) tools is not sufficient to move towards knowledge-orientating and implementing an efficient and successful Knowledge Management System (KMS) because such tools cannot perform KM processes particularly on tacit knowledge of individuals. Furthermore, since most of big/small companies are informed of importance of using such systems as ERP1, CRM2, and so on and utilize them thereby such systems cannot be solely sufficient to provide competitive advantage. Hence, a special look to Organizational Culture (OC) as well as using KM mechanisms3 in line with IT is necessary to implement
1Enterprise Resource Planning 2 Customer Relationship Management3 Knowledge management mechanisms are human-centered strategies such as brainstorming, job rotation, on the job training, exit interviews,
and accelerate KM processes so that such mechanisms can help to increase competitive advantage in addition to accelerate KM processes. [1] Therefore, in present paper, we track gap analysis with three approaches including OC, Technology and KM mechanisms based on which a framework is proposed which is more Recall than earlier models. The important note is that results from gap analysis in practice and particularly in big/moderate companies are somewhat general that such problem can cause a challenge. For this purpose, DM techniques are proposed to overcome this challenge since DM is able to look for in huge and complex data and is used to discover patterns and identify hidden dependencies among data.[2,3,4,5] In addition, using DM techniques on data yielded from gap analysis can provide more precision as well as existing universality. Therefore, a suitable solution can be addressed to eliminate existing gaps with more precision and also this will cause to reduce costs of KM in an organization. In this study, we will have a short review on KM and gap analysis in first section. In second section, we study six gaps pattern which has been presented to implement KMS by Lin and TSeng, identify such gaps and address the causes. Then by relying on the last researches conducted in this field, we represent a new model which studies role and impact of OC, Technology and KM mechanisms on gap analysis. In the following, two techniques including clustering and Association Rule are proposed and a new framework is presented for gap analysis. Ultimately, presented framework is analyzed in marketing and sale deputy of Iran Khodro Company.
II. KM and gap analysis
KMS is designed to manage organizational knowledge. Such systems use KM mechanisms and IT tools to support knowledge creating, storage, retrieval, transfer and utilizing processes. Nowadays, there exists an increasing attempt to implement KMSs in order to more utilizing from such a competitive resource, while lots of system items are installed and yielded outputs are very different from what expected initially, and sometimes they are very far from defined objective at KM strategy. [6] Therefore, determining current status of organization and identifying possible gaps are necessary before implementing such systems, and some solutions should be considered to meet each of them during implementation stages through which KMS can be implemented with the least distance from
etc which are considered as main bases next to the technology to implement knowledge management in an organization. [2]
551
desired status and specified perspectives and objective can be obtained.
III. Gap analysis
Gap means the difference between the knowledge required by an organization to reach its goals and the knowledge existing in the organization. [7] On the other hand, gap analysis addresses analyzing the distance between current status4 and desired status in the future5. Real position of the organization knowledge can be specified using analysis and evaluation on existing gaps in the organization's knowledge level and comparing it with presented standards in this area [8].
IV. Gap analysis history
In most of conducted researches, knowledge gap is referred as the difference between current status and desired status of an organization to implement KM. It may be said that the first knowledge gap was represented by Laurich and Pires (1984) which addressed two kinds of knowledge gap to specify social classes' gap. Then, Zack (2002) addressed the gap between what should be performed in an organization for competitiveness and what is flown actually in real world and named it strategic gap. Zack identifies strengths, weaknesses, opportunities, and threats by relying on strategic management traditional approach. Strengths and weaknesses specify current capabilities or status of the organization while opportunities and threats indicate the objectives which an organization is confronted with and should reach them. Strategy also shows how an organization should create a balance between those two mentioned cases. Furthermore, in line with strategic gap, another potential gap is generated which is called knowledge gap which addresses the distance between what an organization should know to conduct its strategies and what it actually knows. And, strategy role in such a knowledge gap is to assist the organization to eliminate this gap by using innovations and solutions of KM. What clear is the coordination between knowledge gap and strategic gap so that knowledge gap is directly originated from strategic gap. Also in the same era, Hall and Andriani studied knowledge gap in innovative companies. Since then, knowledge gap has been interested more seriously by researches so that Tseng and Lin (2005) presented a pattern called KM gap by relying on PZB concepts which initially included 5 gaps and are caused by management gaps generated within KMS implementation. These gaps were generated due to existing management activities and employees’ inabilities in planning, implementation and supporting KMS activities. In the following, Tseng studied important indicators in performance evaluation of organization and KM activities relation on them. Also, he studied that what impact will have presence and absence of KM gaps on KM activities and finally productivity of organization [9]. In the same year, Tseng studied his framework from another angle according to Holzapple’s conceptual model of knowledge value chain and Nonaka cycle, and added another gap to the framework [10]. As 4AS-IS5TO-BE
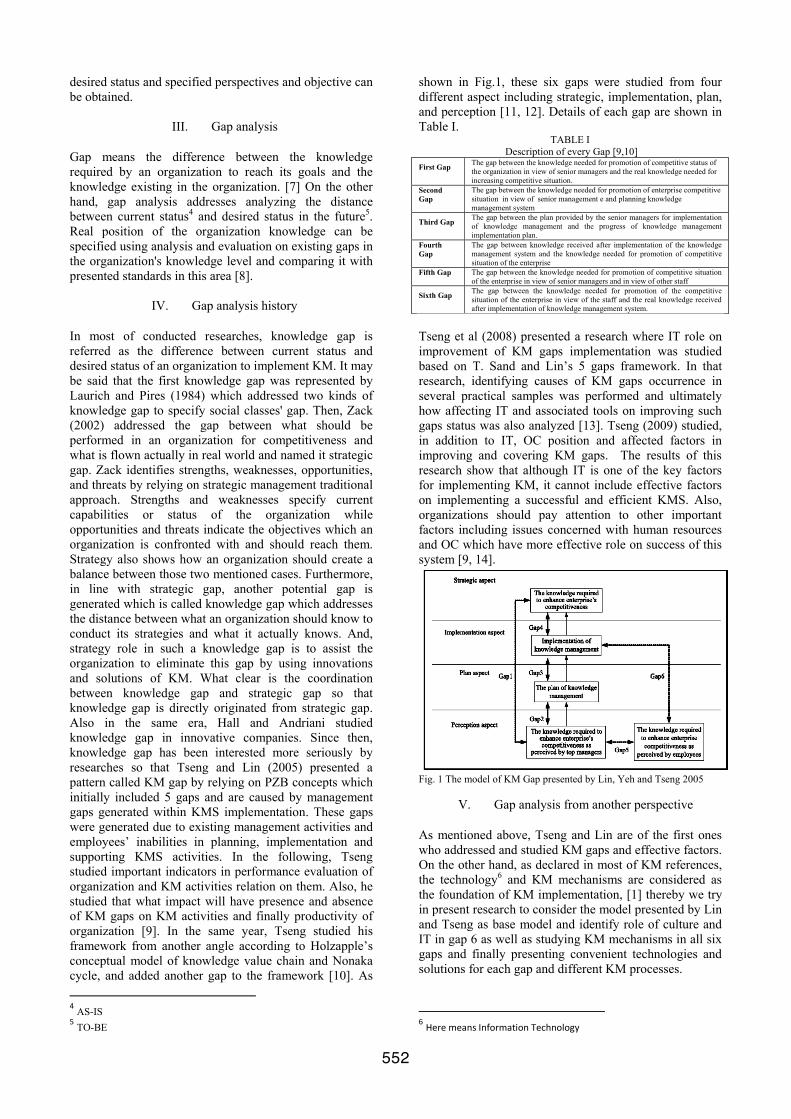
shown in Fig.1, these six gaps were studied from four different aspect including strategic, implementation, plan, and perception [11, 12]. Details of each gap are shown in Table I.
TABLE I Description of every Gap [9,10]
First Gap
The gap between the knowledge needed for promotion of competitive status of the organization in view of senior managers and the real knowledge needed for increasing competitive situation.
Second Gap
The gap between the knowledge needed for promotion of enterprise competitive situation in view of senior management e and planning knowledge management system
Third Gap
The gap between the plan provided by the senior managers for implementation of knowledge management and the progress of knowledge management implementation plan.
Fourth Gap
The gap between knowledge received after implementation of the knowledge management system and the knowledge needed for promotion of competitive situation of the enterprise
Fifth Gap
The gap between the knowledge needed for promotion of competitive situation of the enterprise in view of senior managers and in view of other staff
Sixth Gap
The gap between the knowledge needed for promotion of the competitive situation of the enterprise in view of the staff and the real knowledge received after implementation of knowledge management system.
Tseng et al (2008) presented a research where IT role on improvement of KM gaps implementation was studied based on T. Sand and Lin’s 5 gaps framework. In that research, identifying causes of KM gaps occurrence in several practical samples was performed and ultimately how affecting IT and associated tools on improving such gaps status was also analyzed [13]. Tseng (2009) studied, in addition to IT, OC position and affected factors in improving and covering KM gaps. The results of this research show that although IT is one of the key factors for implementing KM, it cannot include effective factors on implementing a successful and efficient KMS. Also, organizations should pay attention to other important factors including issues concerned with human resources and OC which have more effective role on success of this system [9, 14].
Fig. 1 The model of KM Gap presented by Lin, Yeh and Tseng 2005
V. Gap analysis from another perspective
As mentioned above, Tseng and Lin are of the first ones who addressed and studied KM gaps and effective factors. On the other hand, as declared in most of KM references, the technology6 and KM mechanisms are considered as the foundation of KM implementation, [1] thereby we try in present research to consider the model presented by Lin and Tseng as base model and identify role of culture and IT in gap 6 as well as studying KM mechanisms in all six gaps and finally presenting convenient technologies and solutions for each gap and different KM processes.
6HeremeansInformationTechnology
552
VI. Causes of each gap generating
Gap 1 which is the distance between required knowledge to upgrade competitive position of organization from senior managers’ perspective and actual required knowledge to increase competitive position and is generated due to following reasons: Senior managers are in charge of an important role to implement KM, reviewing internal and external environments in order to understand the strengths, weaknesses, opportunities and threats in the execution of KM activities. These operations include identifying strengths and weaknesses and overcoming competitors’ strengths. Also, based on results from analyzing current status and features of an organization from KM view, the organization will be able to identify its strengths and weaknesses and adopt a suitable strategy based on them [15]. In addition, each organization has its unique knowledge field based on which it is confronted with the problems solvable through its specific solutions. Here key role of senior managers is to identify key knowledge in order to obtain competitive advantage and remaining in competitive market [16]. Since competitive market is not stable and is permanently varying, only knowledge generation and storage can assist the organization to track such changes and having suitable reaction against them. Since environment and features of KM are so variable, senior managers’ expectations from competitive advantage may be so optimistic or pessimistic given the KM in order to adopt suitable objectives for KMS [14]. Gap 2 which is the distance between required knowledge to upgrade competitive position of an organization from perspective of senior management and management system design and is generated due to following reasons: When senior managers understand organization's position in internal and external environment, they will be able to adopt more suitable planning in order to implement KM. Although senior managers have realized necessity of knowledge acquisition operations, they cannot acquire their required knowledge due to inability to explain their needs correctly and efficiently [15]. That is, managers are not able to specify required knowledge of the organization for continues execution of KM implementation plan. This causes to make gap 2 whose main reason is inconsistency between senior managers' perception and approved plans for executing KMS [14]. Gap 3 which is the distance between the programs offered by senior managers to implement KM and KMS implementation plan progress which is generated due to following reasons: Since there are different definitions for main knowledge, knowledge value and defining procedures of KMSs will be confronted with lots of barriers. Therefore, before representing KMS, the organization should present a comprehensive and rational plan for entire the organization. However, due to lack of full perception of KM and its nature by employees and the induced perspective that negative impacts may be appeared on personal value and position of the employees by using the system and sharing their knowledge, there may be some disagreements. Unwillingness of employees to share knowledge or their inability to understand KMSs correctly
result in a gap between internalization and externalization processes during implementation [14].
Gap 4 which is the distance between received knowledge after KMS implementation and required information to upgrade competitive position of the organization and is generated due to following reasons: Effective implementation of KM strategies includes defining and specifying the knowledge which should be acquired. For this purpose, motivating method should be employed. Furthermore, in order to specify if the organization can develop competitive advantage after KM implementation processes, a comprehensive system should be developed for evaluation. Knowledge evaluation includes evaluation of resources and knowledge processors. This process includes indentifying and understanding resources and processors which generate value-added, evaluating and comparing procedure of KM activities execution, and evaluating its execution impact on organization performance through which current status of organization can be understood correctly. Most of organizations fail to evaluate results from KM in order to specify if expectations have been met or not. Therefore, the way of knowledge evaluation is permanently a controversial issue for organizations. Despite the different methods of measurement, properties measurement through existing financial systems is not still possible easily due to the dynamic and tacit nature of knowledge [10]. Gap 5 which is the distance between required information to upgrade competitive position of the organization and employees’ perspective and is generated due to following reasons: Generating new knowledge is one the common responsibilities for each part or expert group in knowledge-based on companies. Managers and executives should participate in this process. However, a gap may be generated inside the organization between perception of senior managers and employees due to difference in their position, role and specialized knowledge. Therefore, employees’ understanding of required knowledge is different and is dependent upon their position and role. So, coordination between all employees’ perception in different positions and approved objectives and plan by all of them for KMS can be one of the key issues in KM implementation [13]. Gap 6 which is the distance between required information to upgrade competitive position of the organization from employees’ perspective and actual knowledge received after KMS implementation and is generated due to following reasons: Employees spend a long time to upgrade their knowledge level in order to improve their own performance in an organization, so the organization should provide an environment through which employees are encouraged to share knowledge and creativity. Otherwise, they will not participate in KMS implementation. As a result, required knowledge acquisition process will be failed in the organization. Executives are aware of activities’ daily details and are confronted with high volume of information, so they confront with problem of converting information to useful knowledge. Therefore, a major part
553
of concepts will be missed. Of course, even if we assume that meaningful concepts are generated, sharing the concepts with other colleagues will not be possible easily. Employees commonly define knowledge based on their position and perception thereby knowledge concepts are being varied permanently during the process. In addition, knowledge employees do not have the willingness to share their intellectual Assets with other colleagues due to competitive among knowledge employees. Since knowledge power is caused by information of knowledge information, we need strong motivating systems to encourage them sharing knowledge. Otherwise, only competition is remained between them and knowledge sharing in order to achieve the organization's competitive advantage will be ignored. Therefore, gap 6 is appeared in the organization [13].
VII. Data mining role in gap analysis improvement
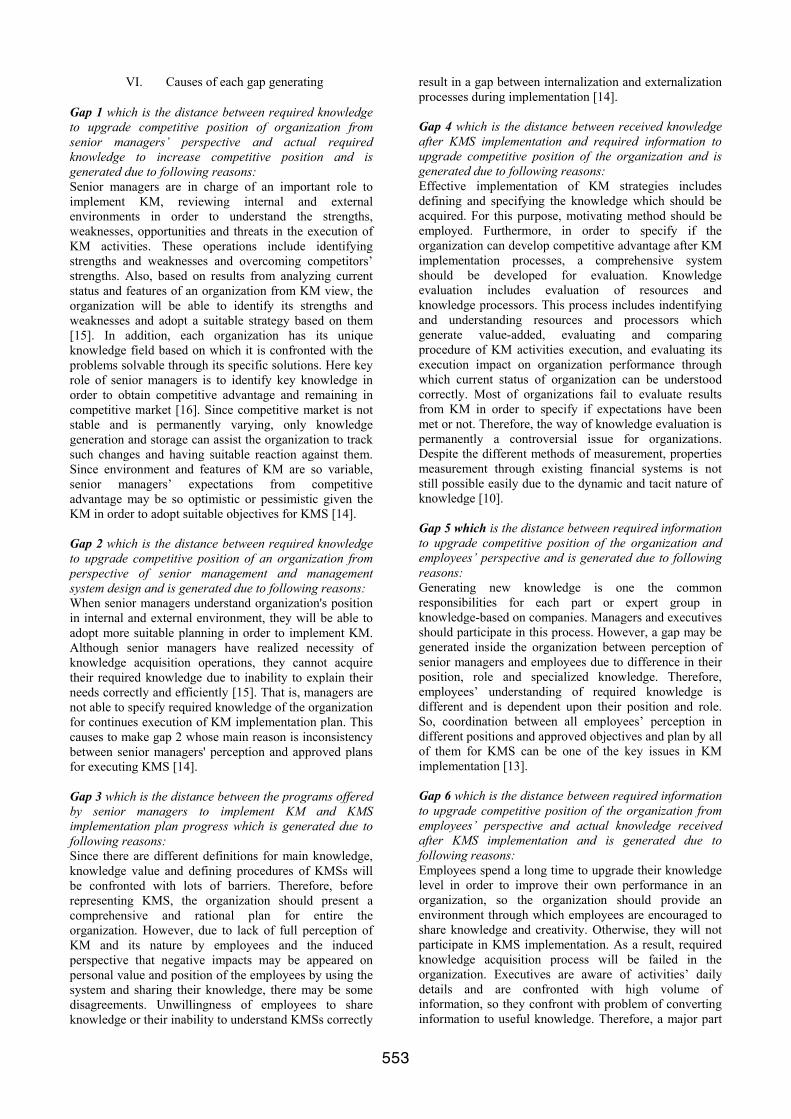
DM and KM have interactive relation with each other. While Data Mining technology is a path and tools to simplify and develop KM and knowledge-driven development approach in the organization. KM can affect on nature and way of DM by various tools and mechanisms. Also, DM can discover useful information as well as providing knowledge production through data processing and based on data bases which are identified through pattern discovery, hidden structure and dependencies among data within an organization. In this way, the organization can utilize knowledge acquired in its subsystems and different business fields. As mentioned, current status of organization necessarily should be studied to implement KM in an organization. For this purpose, we used gap analysis theoretical framework shown in Fig. 2 On the other hand, after offered model analysis, we observed that results from gap analysis are greatly general particularly in large and medium organizations and companies.
Fig.2 theoretical framework of this paper for Gap Analysis
Hence, as shown in Fig. 3, we presented a framework for two algorithms of unsupervised paradigm of DM (i.e. clustering and Association Rule analysis) on results from gap analysis to appear hidden existing structure and dependencies.
Fig. 3 Conceptual model of this paper Based on triangular Gap analysis
and Data Mining
A. Clustering
Clustering has been addressed as a wealthy conceptual and algorithmic format to analyze and interpret data. In clustering, we are about organizing and discover structure in collected data set. Clustering is a task in which data is inserted into separate groups, so that each element is assigned to a cluster and cluster members should have the highest natural similarity with each other. Also, distance measurement metric should be quite clear and be computable for both samples. Therefore, each cluster member has similarity with each other and is distinct relative to other clusters. In clustering, there is no batch in advance and actually we are looking for groups similar and by discovering such similarities, behaviors can be evaluated better and based on which better results can be yielded. [4, 5, 17, 18]
B. Association Rule analysis
Extracting Association Rule is one the important ways in DM which looks for a relation in dataset. By using such a technique, we can find interesting relations and dependencies. Discovering interesting and useful rules often provides an information resource through which better performance can be obtained and more suitable decisions can be made. [17, 18]
VIII. Case study, Iran Khodro Company
Presented theoretical framework in present paper has two parts: first is triangular model of the gap analysis which addresses KM gaps in the company from three angles including OC, IT and KM mechanisms. Second framework focuses on two DM techniques (i.e. clustering and Association Rule analysis). Therefore, given the above mentioned comments, status of each gap should be studied to improve KM implementation. Thereupon, it clears that the company is confronted with which gaps and which gaps have higher priority to be eliminated. So, some questionnaires were distributed for 450 employees of the company in three separate stages to analyze OC, IT and KM mechanisms among which about 250 questionnaires were answered.
554
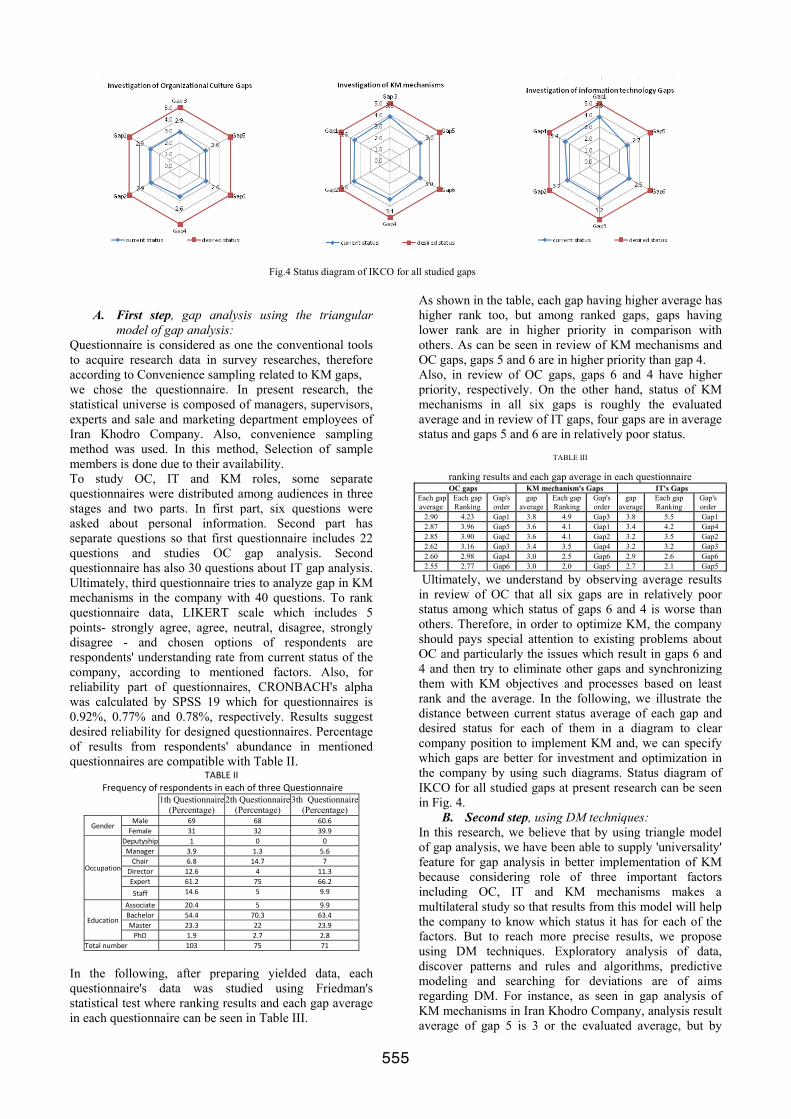
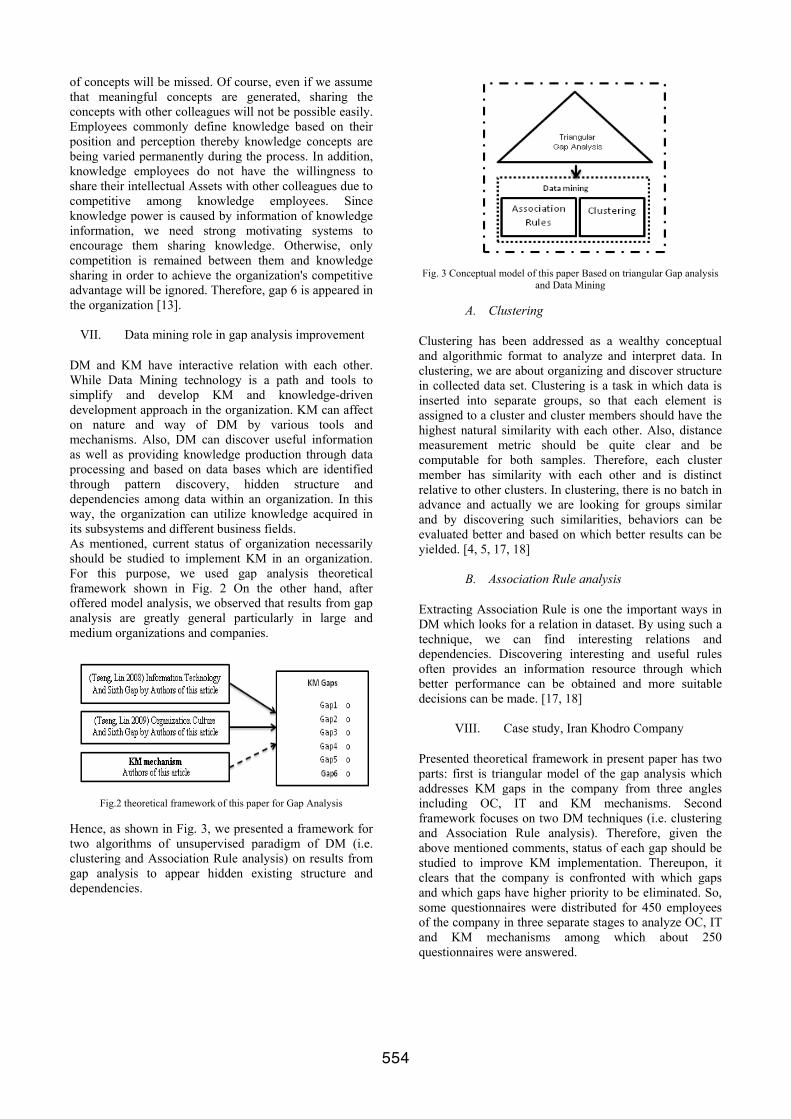
Fig.4 Status diagram of IKCO for all studied gaps
A. First step, gap analysis using the triangular model of gap analysis:
Questionnaire is considered as one the conventional tools to acquire research data in survey researches, therefore according to Convenience sampling related to KM gaps, we chose the questionnaire. In present research, the statistical universe is composed of managers, supervisors, experts and sale and marketing department employees of Iran Khodro Company. Also, convenience sampling method was used. In this method, Selection of sample members is done due to their availability. To study OC, IT and KM roles, some separate questionnaires were distributed among audiences in three stages and two parts. In first part, six questions were asked about personal information. Second part has separate questions so that first questionnaire includes 22 questions and studies OC gap analysis. Second questionnaire has also 30 questions about IT gap analysis. Ultimately, third questionnaire tries to analyze gap in KM mechanisms in the company with 40 questions. To rank questionnaire data, LIKERT scale which includes 5 points- strongly agree, agree, neutral, disagree, strongly disagree - and chosen options of respondents are respondents' understanding rate from current status of the company, according to mentioned factors. Also, for reliability part of questionnaires, CRONBACH's alpha was calculated by SPSS 19 which for questionnaires is 0.92%, 0.77% and 0.78%, respectively. Results suggest desired reliability for designed questionnaires. Percentage of results from respondents' abundance in mentioned questionnaires are compatible with Table II.
In the following, after preparing yielded data, each questionnaire's data was studied using Friedman's statistical test where ranking results and each gap average in each questionnaire can be seen in Table III.
As shown in the table, each gap having higher average has higher rank too, but among ranked gaps, gaps having lower rank are in higher priority in comparison with others. As can be seen in review of KM mechanisms and OC gaps, gaps 5 and 6 are in higher priority than gap 4. Also, in review of OC gaps, gaps 6 and 4 have higher priority, respectively. On the other hand, status of KM mechanisms in all six gaps is roughly the evaluated average and in review of IT gaps, four gaps are in average status and gaps 5 and 6 are in relatively poor status.
TABLE III
ranking results and each gap average in each questionnaire OC gaps KM mechanism's Gaps IT's Gaps
Each gap average
Each gap Ranking
Gap's order
gap average
Each gap Ranking
Gap's order
gap average
Each gap Ranking
Gap's order
2.90 4.23 Gap1 3.8 4.9 Gap3 3.8 5.5 Gap1 2.87 3.96 Gap5 3.6 4.1 Gap1 3.4 4.2 Gap4 2.85 3.90 Gap2 3.6 4.1 Gap2 3.2 3.5 Gap2 2.62 3.16 Gap3 3.4 3.5 Gap4 3.2 3.2 Gap3 2.60 2.98 Gap4 3.0 2.5 Gap6 2.9 2.6 Gap6 2.55 2.77 Gap6 3.0 2.0 Gap5 2.7 2.1 Gap5
Ultimately, we understand by observing average results in review of OC that all six gaps are in relatively poor status among which status of gaps 6 and 4 is worse than others. Therefore, in order to optimize KM, the company should pays special attention to existing problems about OC and particularly the issues which result in gaps 6 and 4 and then try to eliminate other gaps and synchronizing them with KM objectives and processes based on least rank and the average. In the following, we illustrate the distance between current status average of each gap and desired status for each of them in a diagram to clear company position to implement KM and, we can specify which gaps are better for investment and optimization in the company by using such diagrams. Status diagram of IKCO for all studied gaps at present research can be seen in Fig. 4.
B. Second step, using DM techniques: In this research, we believe that by using triangle model of gap analysis, we have been able to supply 'universality' feature for gap analysis in better implementation of KM because considering role of three important factors including OC, IT and KM mechanisms makes a multilateral study so that results from this model will help the company to know which status it has for each of the factors. But to reach more precise results, we propose using DM techniques. Exploratory analysis of data, discover patterns and rules and algorithms, predictive modeling and searching for deviations are of aims regarding DM. For instance, as seen in gap analysis of KM mechanisms in Iran Khodro Company, analysis result average of gap 5 is 3 or the evaluated average, but by
TABLEIIFrequencyofrespondentsineachofthreeQuestionnaire
3th Questionnaire(Percentage)
2th Questionnaire (Percentage)
1th Questionnaire (Percentage)
60.668 69 Male Gender
39.932 31 Female 0 0 1 Deputyship
Occupation
5.61.3 3.9 Manager 7 14.7 6.8 Chair
11.34 12.6 Director 66.275 61.2 Expert 9.9 5 14.6 Staff 9.95 20.4 Associate
Education 63.470.3 54.4 Bachelor 23.922 23.3 Master 2.82.7 1.9 PhD 7175 103 Totalnumber
555
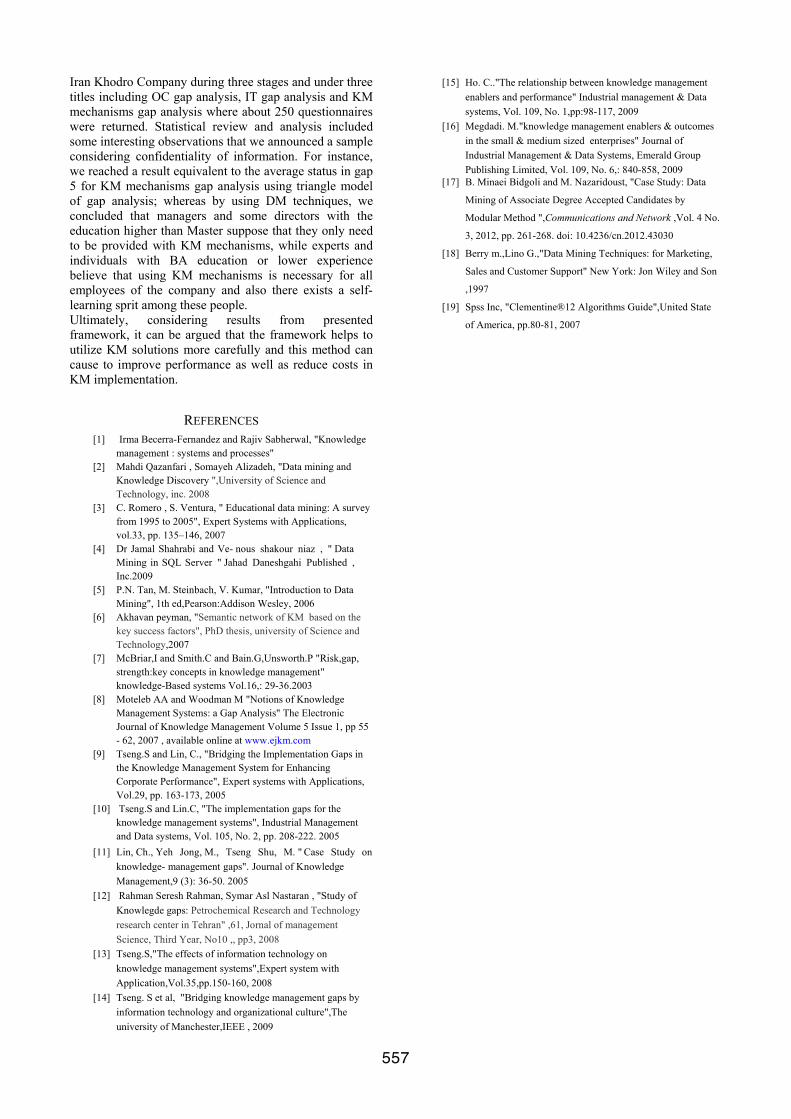
more precise study and using DM techniques, we concluded that generally using mechanisms in managers and directors level is higher in comparison with employees and experts. In the following, how to use DM techniques in studying results from gap analysis is presented and due to high volume of contents, we will proceed to study gap 5 in gap analysis of KM mechanisms as a practical sample. 1) Clustering on results: So far, diverse clustering algorithms have been represented so that often they show different results. K-means is of the methods based on segmentation which uses minimum variance criterion to organize data. This algorithm is one the simplest unsupervised learning algorithms which needs predetermined quantity of k to group data. Therefore, defining center k for each cluster is the main idea of this algorithm. [4, 5, 17, 19] In present research, we considered K of 2 (according to the agreement or disagreement rate) and concluded – by studying answer sheet data regarding gap 5 questions- that most of the respondents have somewhat consensus about questions 1 to 4 but the results were different about questions 5, 6 and 7. The result of k-means execution is shown in Fig. 5.
Features of clusters which are considered as class: Class 1 includes 44 persons where: x More than 63 percent of this cluster believe that
group activities are somewhat supported by the company and about 77 percent suppose KM processes necessary only for managers and about 72 percent believe that the company does not allow collective and spontaneous learning.
Class 2 has a population of 72 persons where: x All the members collective activities are supported
relatively well by the company and about 77 percent suppose KM processes necessary for all (not only managers) and about 92 percent believe that the company allows collective and spontaneous learning.
According to above classes where k-means execution results on gap 5 answers are yielded, the difference between members of two groups is significant and relatively noteworthy.
Fig. 5 The result of k-means execution
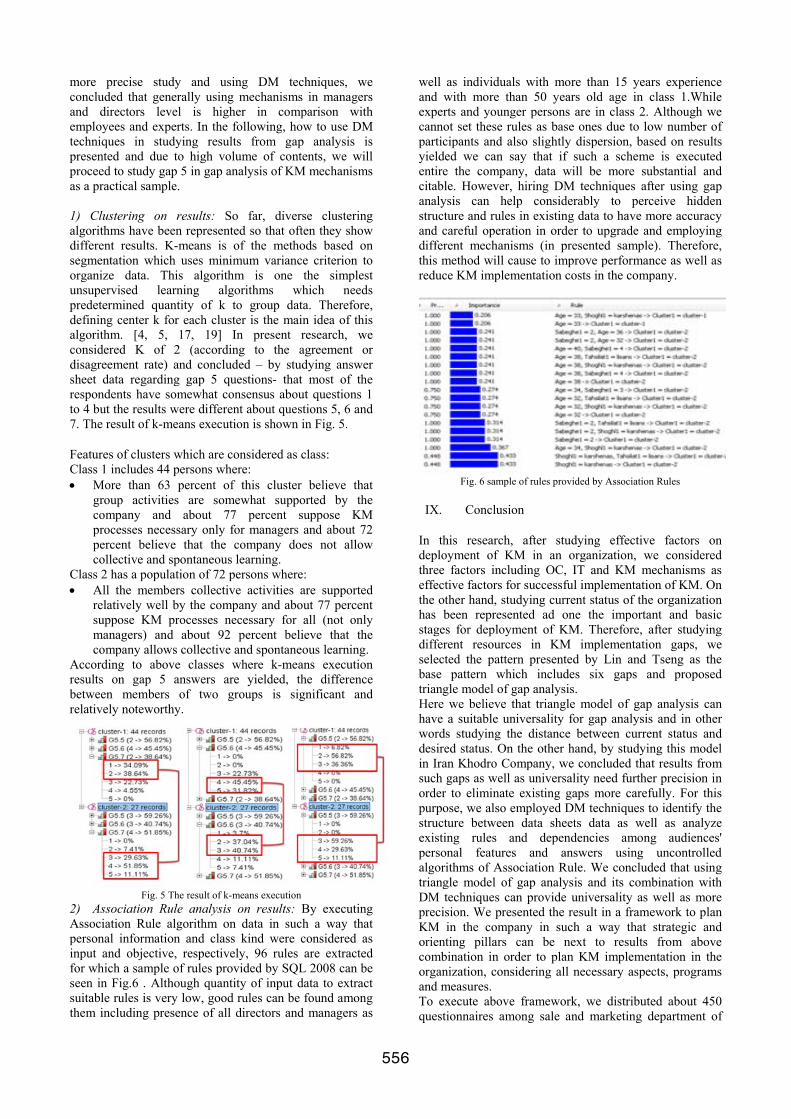
2) Association Rule analysis on results: By executing Association Rule algorithm on data in such a way that personal information and class kind were considered as input and objective, respectively, 96 rules are extracted for which a sample of rules provided by SQL 2008 can be seen in Fig.6 . Although quantity of input data to extract suitable rules is very low, good rules can be found among them including presence of all directors and managers as
well as individuals with more than 15 years experience and with more than 50 years old age in class 1.While experts and younger persons are in class 2. Although we cannot set these rules as base ones due to low number of participants and also slightly dispersion, based on results yielded we can say that if such a scheme is executed entire the company, data will be more substantial and citable. However, hiring DM techniques after using gap analysis can help considerably to perceive hidden structure and rules in existing data to have more accuracy and careful operation in order to upgrade and employing different mechanisms (in presented sample). Therefore, this method will cause to improve performance as well as reduce KM implementation costs in the company.
Fig. 6 sample of rules provided by Association Rules
IX. Conclusion
In this research, after studying effective factors on deployment of KM in an organization, we considered three factors including OC, IT and KM mechanisms as effective factors for successful implementation of KM. On the other hand, studying current status of the organization has been represented ad one the important and basic stages for deployment of KM. Therefore, after studying different resources in KM implementation gaps, we selected the pattern presented by Lin and Tseng as the base pattern which includes six gaps and proposed triangle model of gap analysis. Here we believe that triangle model of gap analysis can have a suitable universality for gap analysis and in other words studying the distance between current status and desired status. On the other hand, by studying this model in Iran Khodro Company, we concluded that results from such gaps as well as universality need further precision in order to eliminate existing gaps more carefully. For this purpose, we also employed DM techniques to identify the structure between data sheets data as well as analyze existing rules and dependencies among audiences' personal features and answers using uncontrolled algorithms of Association Rule. We concluded that using triangle model of gap analysis and its combination with DM techniques can provide universality as well as more precision. We presented the result in a framework to plan KM in the company in such a way that strategic and orienting pillars can be next to results from above combination in order to plan KM implementation in the organization, considering all necessary aspects, programs and measures. To execute above framework, we distributed about 450 questionnaires among sale and marketing department of
556
Iran Khodro Company during three stages and under three titles including OC gap analysis, IT gap analysis and KM mechanisms gap analysis where about 250 questionnaires were returned. Statistical review and analysis included some interesting observations that we announced a sample considering confidentiality of information. For instance, we reached a result equivalent to the average status in gap 5 for KM mechanisms gap analysis using triangle model of gap analysis; whereas by using DM techniques, we concluded that managers and some directors with the education higher than Master suppose that they only need to be provided with KM mechanisms, while experts and individuals with BA education or lower experience believe that using KM mechanisms is necessary for all employees of the company and also there exists a self-learning sprit among these people. Ultimately, considering results from presented framework, it can be argued that the framework helps to utilize KM solutions more carefully and this method can cause to improve performance as well as reduce costs in KM implementation.
REFERENCES [1] Irma Becerra-Fernandez and Rajiv Sabherwal, "Knowledge
management : systems and processes" [2] Mahdi Qazanfari , Somayeh Alizadeh, "Data mining and
Knowledge Discovery ",University of Science and Technology, inc. 2008
[3] C. Romero , S. Ventura, " Educational data mining: A survey from 1995 to 2005", Expert Systems with Applications, vol.33, pp. 135–146, 2007
[4] Dr Jamal Shahrabi and Ve- nous shakour niaz , " Data Mining in SQL Server " Jahad Daneshgahi Published , Inc.2009
[5] P.N. Tan, M. Steinbach, V. Kumar, "Introduction to Data Mining", 1th ed,Pearson:Addison Wesley, 2006
[6] Akhavan peyman, "Semantic network of KM based on the key success factors", PhD thesis, university of Science and Technology,2007
[7] McBriar,I and Smith.C and Bain.G,Unsworth.P "Risk,gap, strength:key concepts in knowledge management" knowledge-Based systems Vol.16,: 29-36.2003
[8] Moteleb AA and Woodman M "Notions of Knowledge Management Systems: a Gap Analysis" The Electronic Journal of Knowledge Management Volume 5 Issue 1, pp 55 - 62, 2007 , available online at www.ejkm.com
[9] Tseng.S and Lin, C., "Bridging the Implementation Gaps in the Knowledge Management System for Enhancing Corporate Performance", Expert systems with Applications, Vol.29, pp. 163-173, 2005
[10] Tseng.S and Lin.C, "The implementation gaps for the knowledge management systems", Industrial Management and Data systems, Vol. 105, No. 2, pp. 208-222. 2005
[11] Lin, Ch., Yeh Jong, M., Tseng Shu, M. " Case Study on knowledge- management gaps". Journal of Knowledge Management,9 (3): 36-50. 2005
[12] Rahman Seresh Rahman, Symar Asl Nastaran , "Study of Knowlegde gaps: Petrochemical Research and Technology research center in Tehran" ,61, Jornal of management Science, Third Year, No10 ,, pp3, 2008
[13] Tseng.S,"The effects of information technology on knowledge management systems",Expert system with Application,Vol.35,pp.150-160, 2008
[14] Tseng. S et al, "Bridging knowledge management gaps by information technology and organizational culture",The university of Manchester,IEEE , 2009
[15] Ho. C.."The relationship between knowledge management enablers and performance" Industrial management & Data systems, Vol. 109, No. 1,pp:98-117, 2009
[16] Megdadi. M."knowledge management enablers & outcomes in the small & medium sized enterprises" Journal of Industrial Management & Data Systems, Emerald Group Publishing Limited, Vol. 109, No. 6,: 840-858, 2009
[17] B. Minaei Bidgoli and M. Nazaridoust, "Case Study: Data
Mining of Associate Degree Accepted Candidates by
Modular Method ",Communications and Network ,Vol. 4 No.
3, 2012, pp. 261-268. doi: 10.4236/cn.2012.43030
[18] Berry m.,Lino G.,"Data Mining Techniques: for Marketing,
Sales and Customer Support" New York: Jon Wiley and Son
,1997
[19] Spss Inc, "Clementine®12 Algorithms Guide",United State
of America, pp.80-81, 2007
557
Data Mining of Associate Degree Accepted Candidates by Using Unsupervised Paradigm
Maryam Nazaridoust Behrouz Minaei Bidgoli Department of Computer Engineering
and Information Technology, University of Qom, Qom, Iran
Department Of Computer Engineering University of Science and Technology
Tehran, Iran [email protected]
Abstract - Since about 10 years ago, University of Applied Science and Technology (UAST) in Iran has admitted students in discontinuous associate degree by modular method, in this way, almost 100,000 students are accepted every year. Although the first purpose of holding such courses was to improve scientific and ability level of employees, over time a considerable group of unemployed people have been interested to participate in these courses. Thus, in this paper, we mine and analyze a sample dataset of accepted candidates in two consecutive years (2008 and 2009) by using unsupervised learning paradigms.
Unsupervised learning finds hidden structure in unlabeled data, by using automatic and control less process. So in the first step, we grouped set of modular accepted candidates based on their student status by using clustering algorithms. Each cluster somehow shows educational and student status of modular accepted candidates. In the next step, by using Association Rules, we generated two predicting models in 2008 data sets, then, by making a comparison between performances of generated models, we selected second predicting model. Finally, this model is executed for Test set which includes accepted candidates of next course then by evaluation of results, the percentage of correctness and confidentiality of obtained results can be viewed.
Keywords
Supervised Learning, Unsupervised Learning, Clustering, Clustering Similarity, Association Rule, Predict model
I. Introduction Higher education is always faced with huge data and information about universities, students, scholars, professors, and other resources; so that in most of cases, this data can include valuable information and patterns. Using modern techniques of data mining such as predicting, clustering, classification, etc. can be useful in ranking of universities, finding specific and valuable patterns about successful students, finding a successful teaching programs or method, finding critical points in financial management of university, and so on. Also, discoverable knowledge through data mining in accepted candidates can be
used and we can offer advices to participants to have better performance and make better decisions.
Almost a decade has been passed from holding modular courses of UAST University and has yielded plenty of graduates so far and although the first aim of holding such courses was to improve scientific and skill level of employees, over time a considerable group of unemployed people have been interested to participate in these courses. So that up to now, more than 100,000 people are admitted in modular associate degree courses and even because of high interest of applicants, modular undergraduate (bachelor) courses have been hold recently. In this admission system, The National Education Assessment admits students generally based on their average, employment history, the relevancy of their job with requested Major, Gender, and kind of diploma (high school degree), and accepted students should pass comprehensive exam to get related degree documents.[1]
In the first section of paper, data sets and data initialization method will be introduced briefly. In the second section, we will have a glance on model generating by using unsupervised learning. In the third section, by a representation on clustering and its kinds, two suitable clustering techniques will be selected and then executed on data sets through which data can be labeled based on generated clusters. In the fourth section, two predicting algorithms are considered for data sets, and then performances of the algorithms will be compared. In the fifth section, by using selected predicting algorithm, two separate models will be introduced for data sets. First model presents some rules in order to predict associate degree Majors for new candidates. Second model, by another perspective, according to student conditions of candidate, extracts the rules which predict only the Major's Categories for new candidate. Ultimately, in the last section, conclusions of performed analysis will be presented.
558
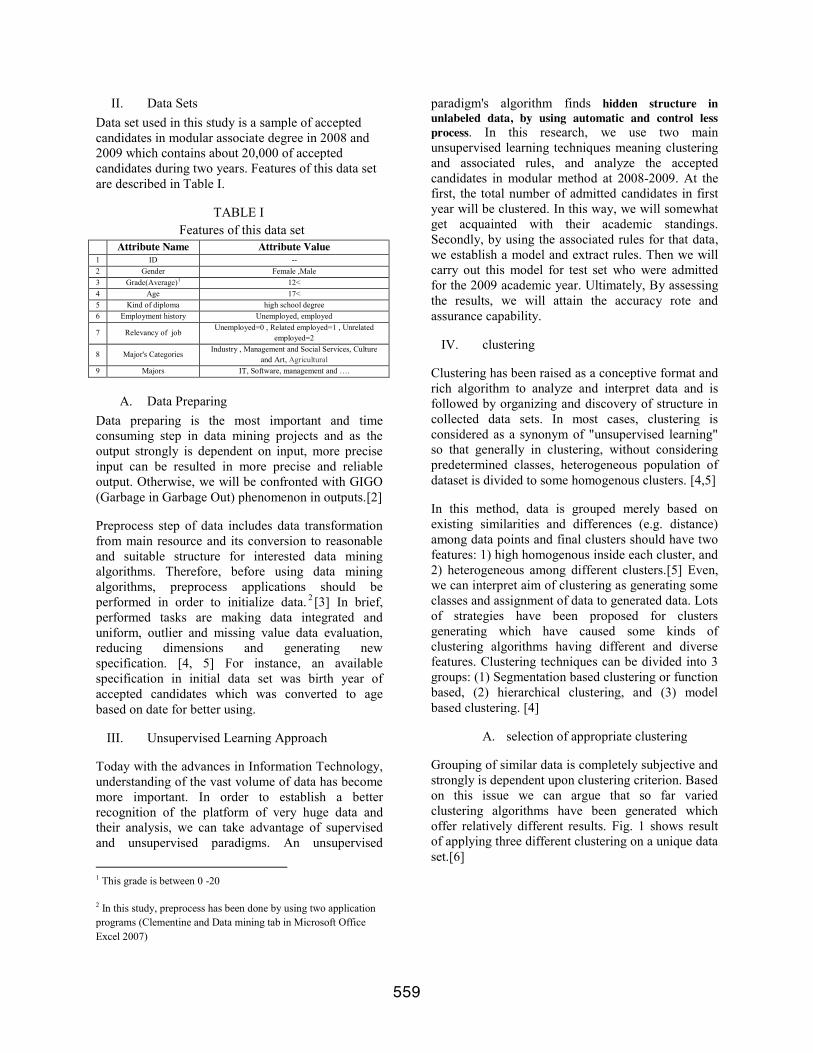
II. Data Sets Data set used in this study is a sample of accepted candidates in modular associate degree in 2008 and 2009 which contains about 20,000 of accepted candidates during two years. Features of this data set are described in Table I.
TABLE I Features of this data set
Attribute Name Attribute Value 1 ID -- 2 Gender Female ,Male 3 Grade(Average)1 12< 4 Age 17< 5 Kind of diploma high school degree 6 Employment history Unemployed, employed
7 Relevancy of job Unemployed=0 , Related employed=1 , Unrelated
employed=2
8 Major's Categories Industry , Management and Social Services, Culture
and Art, Agricultural 9 Majors IT, Software, management and ….
A. Data Preparing Data preparing is the most important and time consuming step in data mining projects and as the output strongly is dependent on input, more precise input can be resulted in more precise and reliable output. Otherwise, we will be confronted with GIGO (Garbage in Garbage Out) phenomenon in outputs.[2]
Preprocess step of data includes data transformation from main resource and its conversion to reasonable and suitable structure for interested data mining algorithms. Therefore, before using data mining algorithms, preprocess applications should be performed in order to initialize data. 2 [3] In brief, performed tasks are making data integrated and uniform, outlier and missing value data evaluation, reducing dimensions and generating new specification. [4, 5] For instance, an available specification in initial data set was birth year of accepted candidates which was converted to age based on date for better using.
III. Unsupervised Learning Approach
Today with the advances in Information Technology, understanding of the vast volume of data has become more important. In order to establish a better recognition of the platform of very huge data and their analysis, we can take advantage of supervised and unsupervised paradigms. An unsupervised
1 This grade is between 0 -20
2 In this study, preprocess has been done by using two application programs (Clementine and Data mining tab in Microsoft Office Excel 2007)
paradigm's algorithm finds hidden structure in unlabeled data, by using automatic and control less process. In this research, we use two main unsupervised learning techniques meaning clustering and associated rules, and analyze the accepted candidates in modular method at 2008-2009. At the first, the total number of admitted candidates in first year will be clustered. In this way, we will somewhat get acquainted with their academic standings. Secondly, by using the associated rules for that data, we establish a model and extract rules. Then we will carry out this model for test set who were admitted for the 2009 academic year. Ultimately, By assessing the results, we will attain the accuracy rote and assurance capability.
IV. clustering
Clustering has been raised as a conceptive format and rich algorithm to analyze and interpret data and is followed by organizing and discovery of structure in collected data sets. In most cases, clustering is considered as a synonym of "unsupervised learning" so that generally in clustering, without considering predetermined classes, heterogeneous population of dataset is divided to some homogenous clusters. [4,5]
In this method, data is grouped merely based on existing similarities and differences (e.g. distance) among data points and final clusters should have two features: 1) high homogenous inside each cluster, and 2) heterogeneous among different clusters.[5] Even, we can interpret aim of clustering as generating some classes and assignment of data to generated data. Lots of strategies have been proposed for clusters generating which have caused some kinds of clustering algorithms having different and diverse features. Clustering techniques can be divided into 3 groups: (1) Segmentation based clustering or function based, (2) hierarchical clustering, and (3) model based clustering. [4]
A. selection of appropriate clustering
Grouping of similar data is completely subjective and strongly is dependent upon clustering criterion. Based on this issue we can argue that so far varied clustering algorithms have been generated which offer relatively different results. Fig. 1 shows result of applying three different clustering on a unique data set.[6]
559
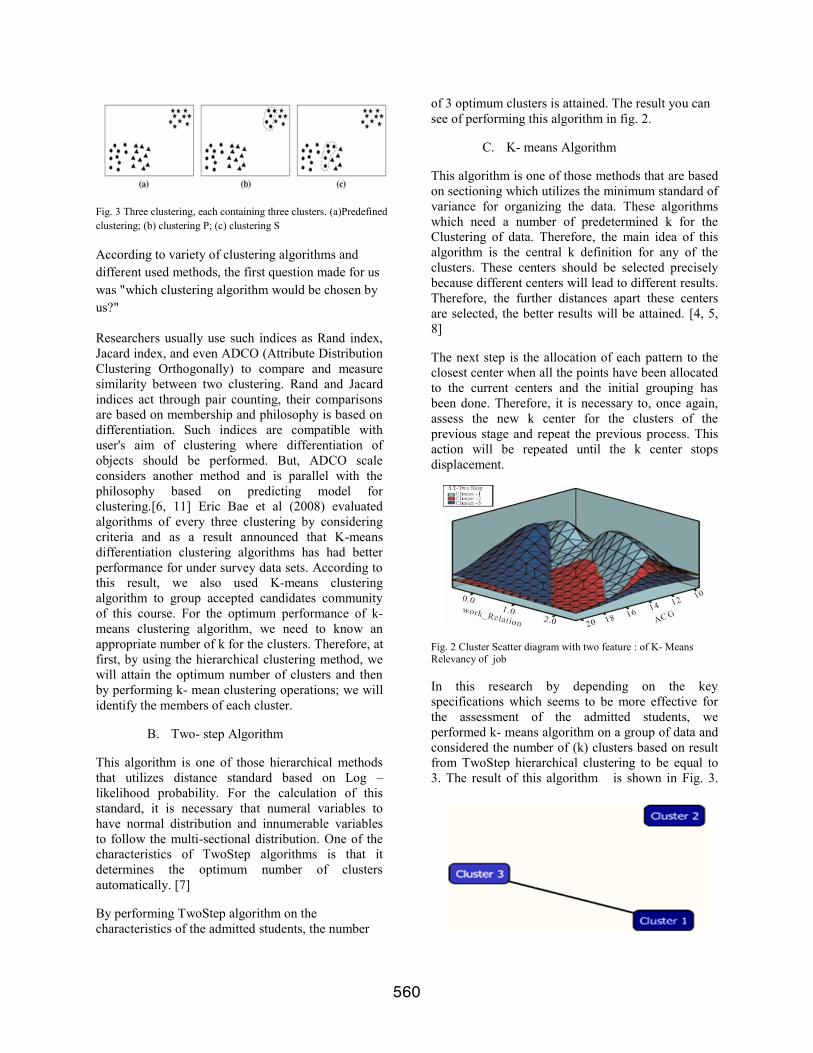
Fig. 3 Three clustering, each containing three clusters. (a)Predefined clustering; (b) clustering P; (c) clustering S
According to variety of clustering algorithms and different used methods, the first question made for us was "which clustering algorithm would be chosen by us?"
Researchers usually use such indices as Rand index, Jacard index, and even ADCO (Attribute Distribution Clustering Orthogonally) to compare and measure similarity between two clustering. Rand and Jacard indices act through pair counting, their comparisons are based on membership and philosophy is based on differentiation. Such indices are compatible with user's aim of clustering where differentiation of objects should be performed. But, ADCO scale considers another method and is parallel with the philosophy based on predicting model for clustering.[6, 11] Eric Bae et al (2008) evaluated algorithms of every three clustering by considering criteria and as a result announced that K-means differentiation clustering algorithms has had better performance for under survey data sets. According to this result, we also used K-means clustering algorithm to group accepted candidates community of this course. For the optimum performance of k-means clustering algorithm, we need to know an appropriate number of k for the clusters. Therefore, at first, by using the hierarchical clustering method, we will attain the optimum number of clusters and then by performing k- mean clustering operations; we will identify the members of each cluster.
B. Two- step Algorithm
This algorithm is one of those hierarchical methods that utilizes distance standard based on Log – likelihood probability. For the calculation of this standard, it is necessary that numeral variables to have normal distribution and innumerable variables to follow the multi-sectional distribution. One of the characteristics of TwoStep algorithms is that it determines the optimum number of clusters automatically. [7]
By performing TwoStep algorithm on the characteristics of the admitted students, the number
of 3 optimum clusters is attained. The result you can see of performing this algorithm in fig. 2.
C. K- means Algorithm
This algorithm is one of those methods that are based on sectioning which utilizes the minimum standard of variance for organizing the data. These algorithms which need a number of predetermined k for the Clustering of data. Therefore, the main idea of this algorithm is the central k definition for any of the clusters. These centers should be selected precisely because different centers will lead to different results. Therefore, the further distances apart these centers are selected, the better results will be attained. [4, 5, 8]
The next step is the allocation of each pattern to the closest center when all the points have been allocated to the current centers and the initial grouping has been done. Therefore, it is necessary to, once again, assess the new k center for the clusters of the previous stage and repeat the previous process. This action will be repeated until the k center stops displacement.
Fig. 2 Cluster Scatter diagram with two feature : of K- Means Relevancy of job
In this research by depending on the key specifications which seems to be more effective for the assessment of the admitted students, we performed k- means algorithm on a group of data and considered the number of (k) clusters based on result from TwoStep hierarchical clustering to be equal to 3. The result of this algorithm is shown in Fig. 3.
560
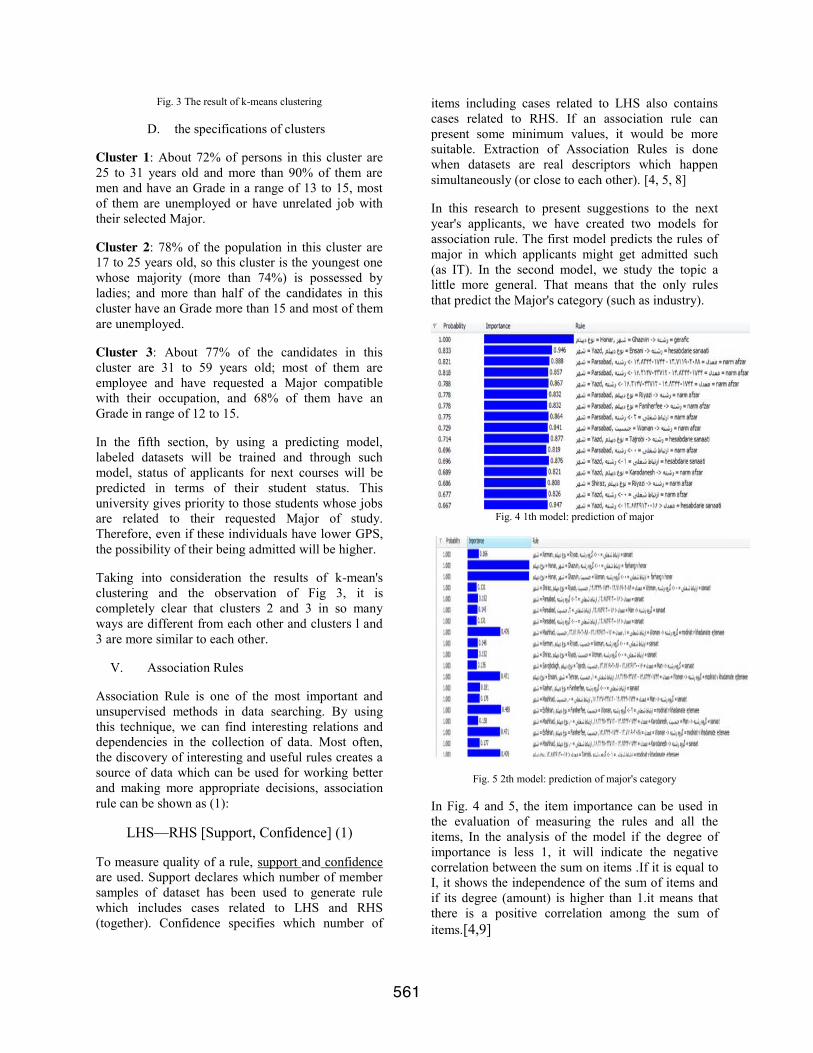
Fig. 3 The result of k-means clustering
D. the specifications of clusters
Cluster 1: About 72% of persons in this cluster are 25 to 31 years old and more than 90% of them are men and have an Grade in a range of 13 to 15, most of them are unemployed or have unrelated job with their selected Major.
Cluster 2: 78% of the population in this cluster are 17 to 25 years old, so this cluster is the youngest one whose majority (more than 74%) is possessed by ladies; and more than half of the candidates in this cluster have an Grade more than 15 and most of them are unemployed.
Cluster 3: About 77% of the candidates in this cluster are 31 to 59 years old; most of them are employee and have requested a Major compatible with their occupation, and 68% of them have an Grade in range of 12 to 15.
In the fifth section, by using a predicting model, labeled datasets will be trained and through such model, status of applicants for next courses will be predicted in terms of their student status. This university gives priority to those students whose jobs are related to their requested Major of study. Therefore, even if these individuals have lower GPS, the possibility of their being admitted will be higher.
Taking into consideration the results of k-mean's clustering and the observation of Fig 3, it is completely clear that clusters 2 and 3 in so many ways are different from each other and clusters l and 3 are more similar to each other.
V. Association Rules
Association Rule is one of the most important and unsupervised methods in data searching. By using this technique, we can find interesting relations and dependencies in the collection of data. Most often, the discovery of interesting and useful rules creates a source of data which can be used for working better and making more appropriate decisions, association rule can be shown as (1):
LHS—RHS [Support, Confidence] (1)
To measure quality of a rule, support and confidence are used. Support declares which number of member samples of dataset has been used to generate rule which includes cases related to LHS and RHS (together). Confidence specifies which number of
items including cases related to LHS also contains cases related to RHS. If an association rule can present some minimum values, it would be more suitable. Extraction of Association Rules is done when datasets are real descriptors which happen simultaneously (or close to each other). [4, 5, 8]
In this research to present suggestions to the next year's applicants, we have created two models for association rule. The first model predicts the rules of major in which applicants might get admitted such (as IT). In the second model, we study the topic a little more general. That means that the only rules that predict the Major's category (such as industry).
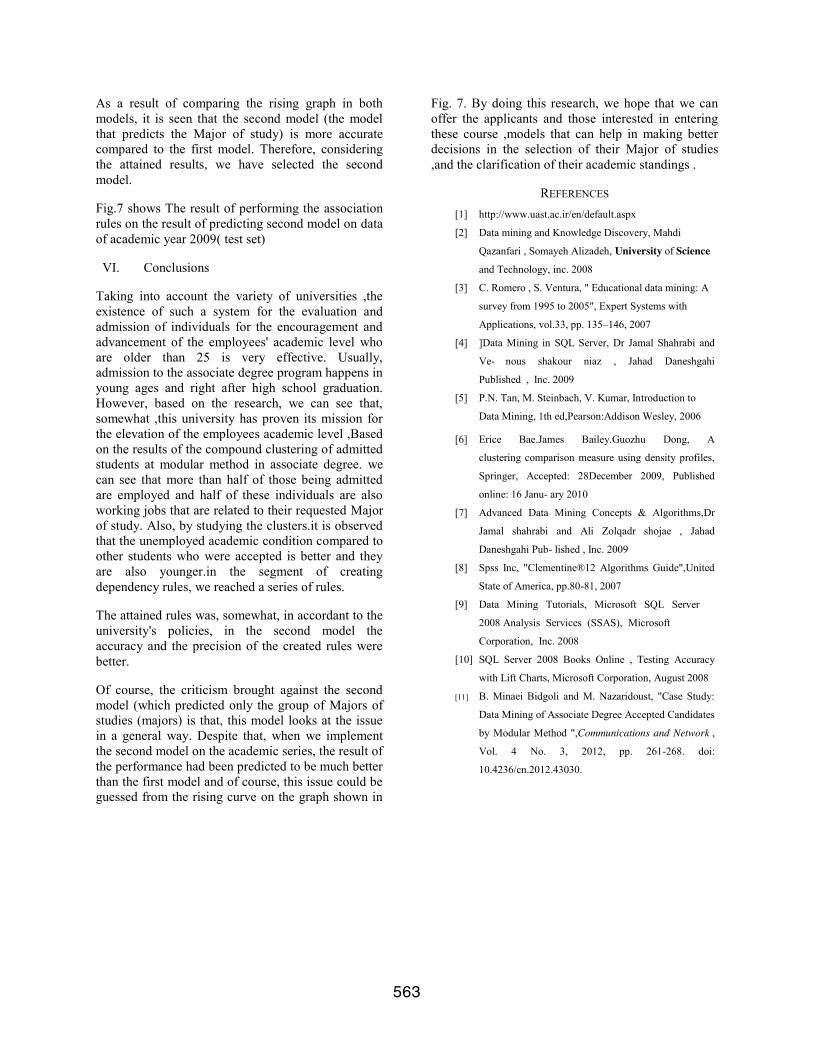
Fig. 4 1th model: prediction of major
Fig. 5 2th model: prediction of major's category
In Fig. 4 and 5, the item importance can be used in the evaluation of measuring the rules and all the items, In the analysis of the model if the degree of importance is less 1, it will indicate the negative correlation between the sum on items .If it is equal to I, it shows the independence of the sum of items and if its degree (amount) is higher than 1.it means that there is a positive correlation among the sum of items.[4,9]
561
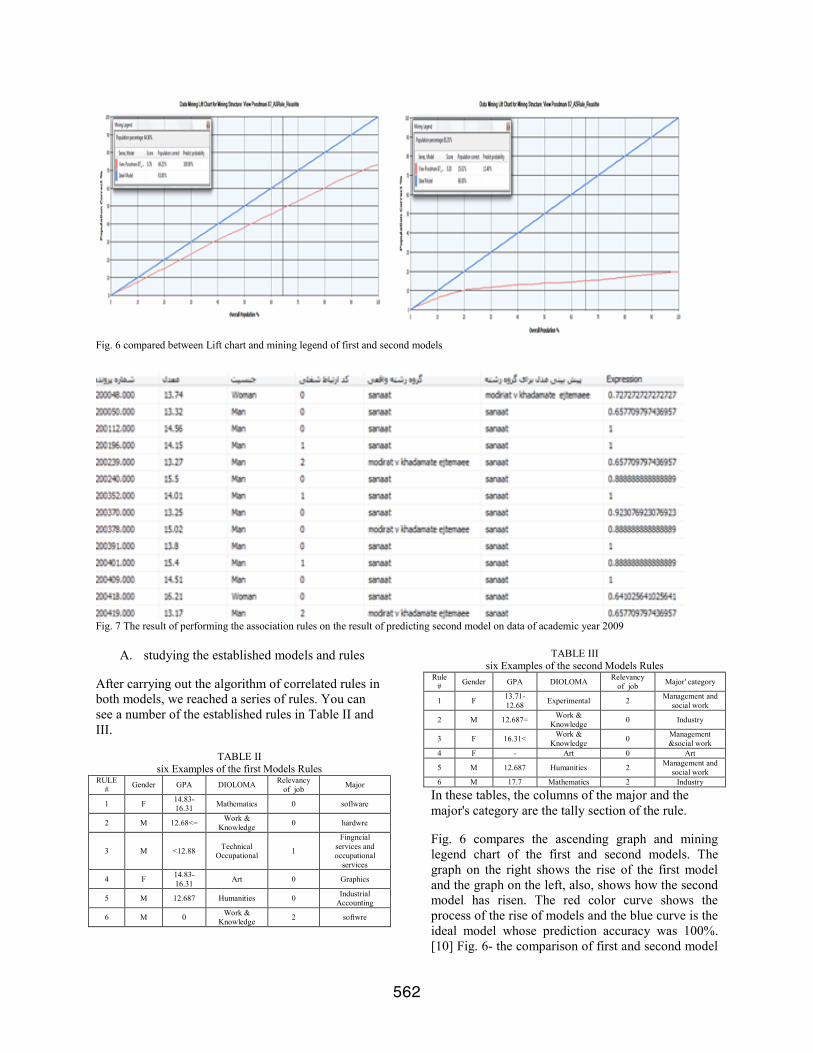
Fig. 6 compared between Lift chart and mining legend of first and second models
Fig. 7 The result of performing the association rules on the result of predicting second model on data of academic year 2009
A. studying the established models and rules
After carrying out the algorithm of correlated rules in both models, we reached a series of rules. You can see a number of the established rules in Table II and III.
TABLE II six Examples of the first Models Rules
Major Relevancy of job DIOLOMA GPA Gender RULE
#
soflware 0 Mathematics 14.83-16.31 F 1
hardwre 0 Work & Knowledge 12.68<= M 2
Fingncial services and occupational
services
1 Technical Occupational <12.88 M 3
Graphics 0 Art 14.83-16.31 F 4
Industrial Accounting 0 Humanities 12.687 M 5
softwre 2 Work & Knowledge 0 M 6
TABLE III six Examples of the second Models Rules
Major' category Relevancy of job DIOLOMA GPA Gender Rule
# Management and
social work 2 Experimental 13.71-12.68 F 1
Industry 0 Work & Knowledge 12.687= M 2
Management &social work 0 Work &
Knowledge 16.31< F 3
Art 0 Art - F 4 Management and
social work 2 Humanities 12.687 M 5
Industry 2 Mathematics 17.7 M 6
In these tables, the columns of the major and the major's category are the tally section of the rule.
Fig. 6 compares the ascending graph and mining legend chart of the first and second models. The graph on the right shows the rise of the first model and the graph on the left, also, shows how the second model has risen. The red color curve shows the process of the rise of models and the blue curve is the ideal model whose prediction accuracy was 100%. [10] Fig. 6- the comparison of first and second model
562
As a result of comparing the rising graph in both models, it is seen that the second model (the model that predicts the Major of study) is more accurate compared to the first model. Therefore, considering the attained results, we have selected the second model.
Fig.7 shows The result of performing the association rules on the result of predicting second model on data of academic year 2009( test set)
VI. Conclusions
Taking into account the variety of universities ,the existence of such a system for the evaluation and admission of individuals for the encouragement and advancement of the employees' academic level who are older than 25 is very effective. Usually, admission to the associate degree program happens in young ages and right after high school graduation. However, based on the research, we can see that, somewhat ,this university has proven its mission for the elevation of the employees academic level ,Based on the results of the compound clustering of admitted students at modular method in associate degree. we can see that more than half of those being admitted are employed and half of these individuals are also working jobs that are related to their requested Major of study. Also, by studying the clusters.it is observed that the unemployed academic condition compared to other students who were accepted is better and they are also younger.in the segment of creating dependency rules, we reached a series of rules.
The attained rules was, somewhat, in accordant to the university's policies, in the second model the accuracy and the precision of the created rules were better.
Of course, the criticism brought against the second model (which predicted only the group of Majors of studies (majors) is that, this model looks at the issue in a general way. Despite that, when we implement the second model on the academic series, the result of the performance had been predicted to be much better than the first model and of course, this issue could be guessed from the rising curve on the graph shown in
Fig. 7. By doing this research, we hope that we can offer the applicants and those interested in entering these course ,models that can help in making better decisions in the selection of their Major of studies ,and the clarification of their academic standings .
REFERENCES [1] http://www.uast.ac.ir/en/default.aspx
[2] Data mining and Knowledge Discovery, Mahdi
Qazanfari , Somayeh Alizadeh, University of Science
and Technology, inc. 2008
[3] C. Romero , S. Ventura, " Educational data mining: A
survey from 1995 to 2005", Expert Systems with
Applications, vol.33, pp. 135–146, 2007
[4] ]Data Mining in SQL Server, Dr Jamal Shahrabi and
Ve- nous shakour niaz , Jahad Daneshgahi
Published , Inc. 2009
[5] P.N. Tan, M. Steinbach, V. Kumar, Introduction to
Data Mining, 1th ed,Pearson:Addison Wesley, 2006
[6] Erice Bae.James Bailey.Guozhu Dong, A
clustering comparison measure using density profiles,
Springer, Accepted: 28December 2009, Published
online: 16 Janu- ary 2010
[7] Advanced Data Mining Concepts & Algorithms,Dr
Jamal shahrabi and Ali Zolqadr shojae , Jahad
Daneshgahi Pub- lished , Inc. 2009
[8] Spss Inc, "Clementine®12 Algorithms Guide",United
State of America, pp.80-81, 2007
[9] Data Mining Tutorials, Microsoft SQL Server
2008 Analysis Services (SSAS), Microsoft
Corporation, Inc. 2008
[10] SQL Server 2008 Books Online , Testing Accuracy
with Lift Charts, Microsoft Corporation, August 2008
[11] B. Minaei Bidgoli and M. Nazaridoust, "Case Study:
Data Mining of Associate Degree Accepted Candidates
by Modular Method ",Communications and Network ,
Vol. 4 No. 3, 2012, pp. 261-268. doi:
10.4236/cn.2012.43030.
563
Context-Dependent Interpretation of Medical Data
M. Kwiatkowska N. T. Ayas, MD Department of Computing Science Department of Medicine
Thompson Rivers University University of British Columbia Kamloops, BC, Canada Vancouver, BC, Canada [email protected] [email protected]
Abstract – Medical data are intrinsically context-dependent, and cannot be properly interpreted outside of their specific con-texts. Therefore, data analysis, especially, secondary data analy-sis, such as data mining, must incorporate contextual information. This paper discusses the need for an explicit context representa-tion in medical data mining. It focuses on five contextual dimen-sions: goal orientation, interdependency of data, time sensitivity, source validity, and absent value semantics. It demonstrates con-text-dependent modeling based on examples of clinical data used for screening, diagnosis, and research of a serious respiratory disorder, obstructive sleep apnea (OSA). In particular, the paper describes context-dependent interpretation for three OSA risk factors: large neck circumference, snoring, and smoking. Fur-thermore, it presents a conceptual framework for representation of the contextual information. This framework is based on a se-miotic approach to represent multiple interpretations of data and a fuzzy-logic approach to represent vagueness of data.
I. INTRODUCTION
The notion of context and its significance in human com-munication have been studied by various fields, such as lin-guistics, artificial intelligence, cognitive science, mobile com-puting, software engineering, and information retrieval [1-3]. In medicine, context is central for correct diagnosis, accurate prognosis, and appropriate treatment. Medical data are con-text-bound, and cannot be properly interpreted outside of their context. Therefore, data analysis, especially secondary analysis such as data mining of electronic patient records (EPRs), must recognize the highly contextual nature of medical information [4]. Patients' data collected for screening, diagnosis, and eval-uation of treatment are viewed as valuable resource, and they could and should be reused in data mining; however, this sec-ondary utilization of data must incorporate an explicit repre-sentation and analysis of their contextual information.
Context is not a single and uniform notion; in fact, medi-cal data are collected and interpreted in several contextual dimensions. This paper focuses on five main aspects of contex-tual information: 1) Goal Orientation: As stated in Ref. [4], “data are al-ways produced with a given purpose and their hardness and specificity is directly tailored to that purpose.” All medical data are collected in a specific clinical context for a specific purpose (e.g., screening, diagnosis, medical research). For example, data regarding habitual snoring are collected differ-ently for screening, diagnosis, and research of obstructive sleep apnea. Screening data include a yes/no answer to a sim-ple question: “Do you snore?” The data collected for diagnos-tic purposes comprise two values: frequency and intensity. The
questionnaire has two specific questions: “How often do you snore?” and “How loud do you snore?” Data collected for re-search include the actual sound recording from overnight study. Thus, in these three contexts data have different preci-sion and different source.
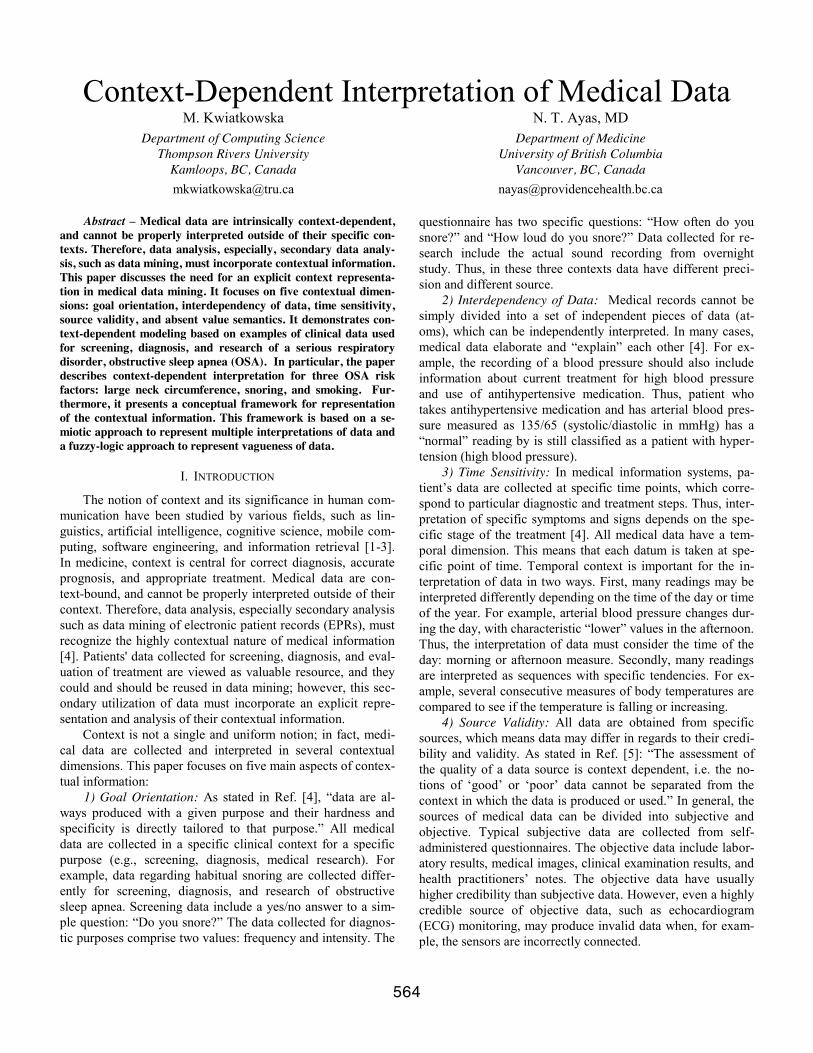
2) Interdependency of Data: Medical records cannot be simply divided into a set of independent pieces of data (at-oms), which can be independently interpreted. In many cases, medical data elaborate and “explain” each other [4]. For ex-ample, the recording of a blood pressure should also include information about current treatment for high blood pressure and use of antihypertensive medication. Thus, patient who takes antihypertensive medication and has arterial blood pres-sure measured as 135/65 (systolic/diastolic in mmHg) has a “normal” reading by is still classified as a patient with hyper-tension (high blood pressure).
3) Time Sensitivity: In medical information systems, pa-tient’s data are collected at specific time points, which corre-spond to particular diagnostic and treatment steps. Thus, inter-pretation of specific symptoms and signs depends on the spe-cific stage of the treatment [4]. All medical data have a tem-poral dimension. This means that each datum is taken at spe-cific point of time. Temporal context is important for the in-terpretation of data in two ways. First, many readings may be interpreted differently depending on the time of the day or time of the year. For example, arterial blood pressure changes dur-ing the day, with characteristic “lower” values in the afternoon. Thus, the interpretation of data must consider the time of the day: morning or afternoon measure. Secondly, many readings are interpreted as sequences with specific tendencies. For ex-ample, several consecutive measures of body temperatures are compared to see if the temperature is falling or increasing.
4) Source Validity: All data are obtained from specific sources, which means data may differ in regards to their credi-bility and validity. As stated in Ref. [5]: “The assessment of the quality of a data source is context dependent, i.e. the no-tions of ‘good’ or ‘poor’ data cannot be separated from the context in which the data is produced or used.” In general, the sources of medical data can be divided into subjective and objective. Typical subjective data are collected from self-administered questionnaires. The objective data include labor-atory results, medical images, clinical examination results, and health practitioners’ notes. The objective data have usually higher credibility than subjective data. However, even a highly credible source of objective data, such as echocardiogram (ECG) monitoring, may produce invalid data when, for exam-ple, the sensors are incorrectly connected.
564
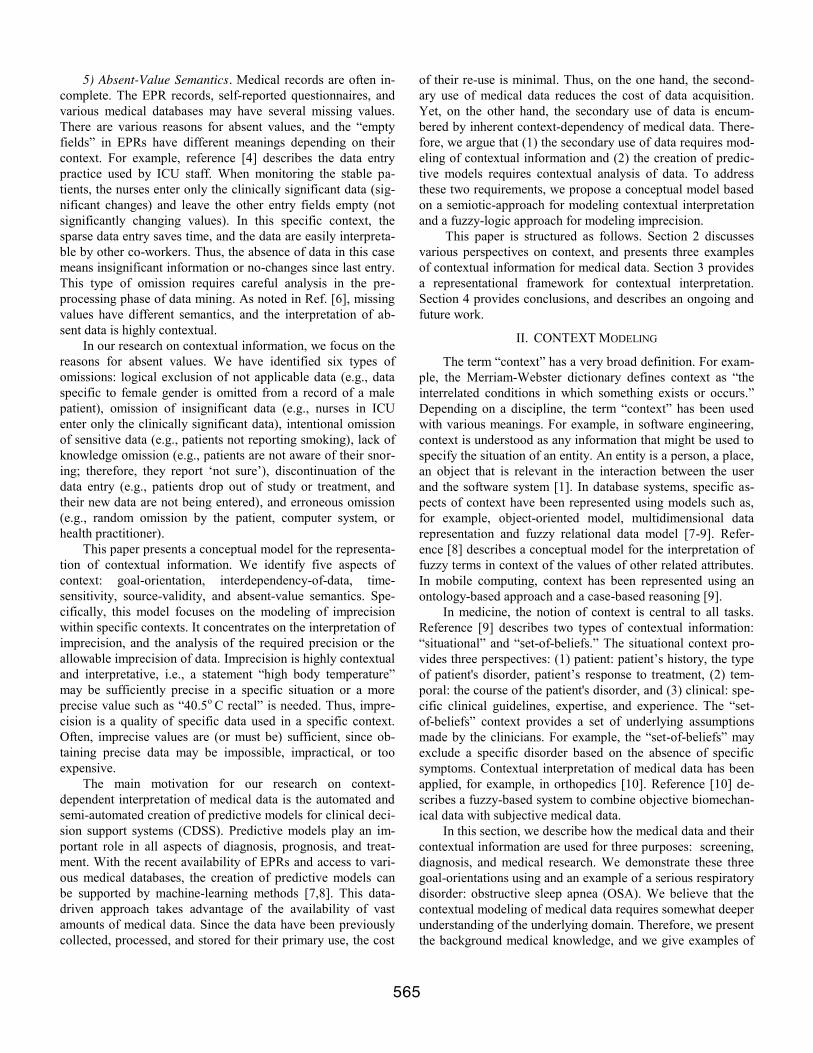
5) Absent-Value Semantics. Medical records are often in-complete. The EPR records, self-reported questionnaires, and various medical databases may have several missing values. There are various reasons for absent values, and the “empty fields” in EPRs have different meanings depending on their context. For example, reference [4] describes the data entry practice used by ICU staff. When monitoring the stable pa-tients, the nurses enter only the clinically significant data (sig-nificant changes) and leave the other entry fields empty (not significantly changing values). In this specific context, the sparse data entry saves time, and the data are easily interpreta-ble by other co-workers. Thus, the absence of data in this case means insignificant information or no-changes since last entry. This type of omission requires careful analysis in the pre-processing phase of data mining. As noted in Ref. [6], missing values have different semantics, and the interpretation of ab-sent data is highly contextual.
In our research on contextual information, we focus on the reasons for absent values. We have identified six types of omissions: logical exclusion of not applicable data (e.g., data specific to female gender is omitted from a record of a male patient), omission of insignificant data (e.g., nurses in ICU enter only the clinically significant data), intentional omission of sensitive data (e.g., patients not reporting smoking), lack of knowledge omission (e.g., patients are not aware of their snor-ing;; therefore, they report ‘not sure’), discontinuation of the data entry (e.g., patients drop out of study or treatment, and their new data are not being entered), and erroneous omission (e.g., random omission by the patient, computer system, or health practitioner).
This paper presents a conceptual model for the representa-tion of contextual information. We identify five aspects of context: goal-orientation, interdependency-of-data, time-sensitivity, source-validity, and absent-value semantics. Spe-cifically, this model focuses on the modeling of imprecision within specific contexts. It concentrates on the interpretation of imprecision, and the analysis of the required precision or the allowable imprecision of data. Imprecision is highly contextual and interpretative, i.e., a statement “high body temperature” may be sufficiently precise in a specific situation or a more precise value such as “40.5o C rectal” is needed. Thus, impre-cision is a quality of specific data used in a specific context. Often, imprecise values are (or must be) sufficient, since ob-taining precise data may be impossible, impractical, or too expensive.
The main motivation for our research on context-dependent interpretation of medical data is the automated and semi-automated creation of predictive models for clinical deci-sion support systems (CDSS). Predictive models play an im-portant role in all aspects of diagnosis, prognosis, and treat-ment. With the recent availability of EPRs and access to vari-ous medical databases, the creation of predictive models can be supported by machine-learning methods [7,8]. This data-driven approach takes advantage of the availability of vast amounts of medical data. Since the data have been previously collected, processed, and stored for their primary use, the cost
of their re-use is minimal. Thus, on the one hand, the second-ary use of medical data reduces the cost of data acquisition. Yet, on the other hand, the secondary use of data is encum-bered by inherent context-dependency of medical data. There-fore, we argue that (1) the secondary use of data requires mod-eling of contextual information and (2) the creation of predic-tive models requires contextual analysis of data. To address these two requirements, we propose a conceptual model based on a semiotic-approach for modeling contextual interpretation and a fuzzy-logic approach for modeling imprecision. This paper is structured as follows. Section 2 discusses various perspectives on context, and presents three examples of contextual information for medical data. Section 3 provides a representational framework for contextual interpretation. Section 4 provides conclusions, and describes an ongoing and future work.
II. CONTEXT MODELING
The term “context” has a very broad definition. For exam-ple, the Merriam-Webster dictionary defines context as “the interrelated conditions in which something exists or occurs.” Depending on a discipline, the term “context” has been used with various meanings. For example, in software engineering, context is understood as any information that might be used to specify the situation of an entity. An entity is a person, a place, an object that is relevant in the interaction between the user and the software system [1]. In database systems, specific as-pects of context have been represented using models such as, for example, object-oriented model, multidimensional data representation and fuzzy relational data model [7-9]. Refer-ence [8] describes a conceptual model for the interpretation of fuzzy terms in context of the values of other related attributes. In mobile computing, context has been represented using an ontology-based approach and a case-based reasoning [9]. In medicine, the notion of context is central to all tasks. Reference [9] describes two types of contextual information: “situational” and “set-of-beliefs.” The situational context pro-vides three perspectives: (1) patient: patient’s history, the type of patient's disorder, patient’s response to treatment, (2) tem-poral: the course of the patient's disorder, and (3) clinical: spe-cific clinical guidelines, expertise, and experience. The “set-of-beliefs” context provides a set of underlying assumptions made by the clinicians. For example, the “set-of-beliefs” may exclude a specific disorder based on the absence of specific symptoms. Contextual interpretation of medical data has been applied, for example, in orthopedics [10]. Reference [10] de-scribes a fuzzy-based system to combine objective biomechan-ical data with subjective medical data. In this section, we describe how the medical data and their contextual information are used for three purposes: screening, diagnosis, and medical research. We demonstrate these three goal-orientations using and an example of a serious respiratory disorder: obstructive sleep apnea (OSA). We believe that the contextual modeling of medical data requires somewhat deeper understanding of the underlying domain. Therefore, we present the background medical knowledge, and we give examples of
565
specific medical predictors. Furthermore, we exemplify our discussion using various clinical data. A. OSA and its Predictors OSA is a common, serious respiratory disorder afflicting, according to conservative studies, 2-4% of the adult popula-tion. "Apnea" means "without breath," and occurs only during sleep, and is, therefore, a condition that might go unnoticed for years. OSA is caused by collapse of the soft tissues in the throat as the result of the natural relaxation of muscles during sleep. The soft tissue blocks the air passage and the sleeping person literally stops breathing (apnea event) or experiences a partial obstruction (hypopnea event). OSA is associated with significant risk for hypertension, congestive heart failure, cor-onary artery disease, myocardial infarction, stroke and ar-rhythmia. Furthermore, patients with OSA have higher risk during and after anesthesia, since their upper airway may be obstructed as a consequence of sedation. Since a typical symp-tom of OSA is daytime sleepiness, the untreated OSA patients have higher rates of vehicle accidents. In summary, OSA has multiple consequences not only for the patients, but also for their families and co-workers. Although an early diagnosis of OSA is critical, it is estimated that 82% of men and 92% of women with moderate-to-severe OSA have not been diag-nosed. The gold standard for the diagnosis of OSA is an over-night in-laboratory polysomnography (PSG). The most im-portant score for OSA diagnosis is the apnea-hypopnea index (AHI), which is calculated as a number of apnea and hypopnea events per hour of sleep [11]. In the diagnosis based solely on the AHI index, apnea is classified as mild for AHI between 5 and 14.9, moderate for AHI between 15 and 29.9, and severe for AHI ≥ 30. Medical literature describes several risk factors (predic-tors) for OSA. For example, Ref. [12] lists seven groups of risks: daytime symptoms (e.g., excessive daytime sleepiness, morning fatigue), nocturnal symptoms (e.g., habitual snoring, witnessed apneas), anatomical signs (e.g.,. obesity, large neck circumference), life style factors (e.g., sleep deprivation, smoking), demographic factors (e.g., age, gender, and ethnici-ty), coexisting medical conditions (e.g., hypertension, diabe-tes), and physiological factors (e.g., blood oxygen saturation). These various predictors are used in screening for OSA, diag-nosis of OSA, and in medical research of OSA. 1) OSA Screening: The screening process often utilizes short self-reporting questionnaires, for example, STOP-bang questionnaire [13]. This self-reporting questionnaire is used to stratify patients for unrecognized OSA before surgeries and to triage patients for diagnosis and treatment. The STOP-bang consists of eight questions considering eight risk factors: snor-ing, tiredness (excessive day-time sleepiness), observed apnea, blood pressure (hypertension), BMI (obesity), age (older age), neck circumference (thick neck), and gender (male). Each pos-itive answer is counted as 1, and a score ≥ 3 indicates a higher risk of OSA. The scores are evaluated, and the patients at risk obtain special perioperative care, and later the patients are
referred for further evaluation by family doctors or respiratory specialists. 2) OSA Diagnosis: The OSA diagnostic process typically includes initial assessment by a family doctor, referral to sleep disorder clinic, overnight in-clinic study, and diagnosis by a respiratory specialist. The initial assessment process involves analysis of the risk factors. The final diagnosis of OSA is based on the results from overnight PSG combined with the results of a sleep questionnaire, physical examination, and the patient’s medical history. The OSA diagnostic process uses data of diverse credibility and validity. The subjective data are based on self- and other-reporting using instruments such as sleep questionnaires, standardized scales, a sleep diary, and bed-partner reporting. The objective data are based on medical examinations, overnight PSGs, and home sleep studies (e.g., oximetry, actigraphy). 3) OSA Research: OSA was discovered and described in 1965. Since then numerous OSA risk factors, predictors, and predictive rules have been studied by many research groups. We limit our discussion to three predictors, and describe the most relevant methods of data definition and acquisition. We exemplify our discussion using the clinical data. For the con-textual analysis of neck circumference data, we use the data set from Ref. [14]. For the contextual analysis of snoring data, we use the data obtained from patients’ records, and base our dis-cussion on Ref. [12, 15-17]. For the contextual analysis of smoking data, we use the data obtained from patients’ records, and base our discussion on Ref. [11-12]. B. Example 1: Neck Circumference Several studies indicate a short and fat neck as a charac-teristic sign of obstructive sleep apnea [14]. Large neck cir-cumference is related to an upper-body fat distribution; there-fore, men have larger necks than women for the same BMI values. Moreover, taller people have usually larger necks. Some studies define specific values for neck circumference indicating risk for OSA, for example, a neck circumference above 43.2 cm for men and greater than 40.6 cm for women are often used as OSA predictors in screening [18]. We describe the following five aspects of contextual in-formation for the concept of “thick neck:” 1) Goal Orientation: The concept of thick neck is opera-tionalized differently for the three different tasks: screening, diagnosis, and research. For the screening purposes, data is obtained from self-reported questionnaires, and the values are binary (yes/no). For example, the STOP-Bang questionnaire has a question: “Neck circumference > 40 cm?” (yes/no). In the diagnostic process, there are two approaches: (1) neck cir-cumference (collar size) is reported by the patient and (2) neck circumference is measured by a health practitioner during physical examination. In both approaches, the values are nu-meric. In research, the measurements are taken by the special-ists conducting the studies, and the measuring process follows a well-defined procedure. For example, the study described in [14] uses a tape measure and measures the neck circumference “at the level of the cricothyroid membrane.”
566
2) Interdependency of Data: We show the interdependen-cy between NC, gender and ethnicity based on a data set col-lected for clinical research [14]. This set has 239 records of adult patients: 199 males (83%) and 40 females (17%), 164 Asian patients (69%), and 75 white patients (31%). The mean NC for all patient is 39.9 cm, a mean NC for women is 36.3 (N = 40), and mean NC for men 40.7 cm (N = 199). Fig. 1 uses modified boxplots to show the difference between the distribu-tion of NC values for females and males. The modified box-plot shows in the central box the first quartile, the median, and the third quartile. The lines extend from the box to the smallest and largest observations that are not suspected outliers. The suspected outliers are plotted as individual data points, which are more than 1.5 × IQR outside of the box (IQR is measured as a distance between the first and the third quartiles).
Male FemaleGender
30.00
35.00
40.00
45.00
50.00
Nec
k C
ircum
fere
nce
(cm
)
7073
16
239
75
Fig. 1 Boxplots for Neck Circumference (NC) by gender and ethnicity.
. The difference in the distribution of values is even more prominent when the data are divided by gender and ethnicity, as shown in Fig. 2. The mean value for the White males is 41.5 cm, and the mean value for the Asian females is 35.3 cm.
Male FemaleGender
30.00
35.00
40.00
45.00
50.00
Nec
k C
ircum
fere
nce
(cm
)
16
217
239 EthnicityWhiteAsian
Fig. 2 Boxplots for Neck Circumference (NC) by gender and ethnicity. .
Thus, we conclude that values representing anatomical measures such as neck circumference should be analyzed sepa-rately for different subgroups. 3) Time Sensitivity: Since the patients are adults, the pos-sible changes in NC are related to gain or loss of weight, but are relatively slow and not significant. 4) Source Validity: Data for NC are obtained in two ways: self-reported (subjective) and clinically measured (objective). Thus, the validity of the data significantly varies, and, as a result the secondary analysis should not combine the subjec-tive data with the objective data. 5) Absent-Value Semantics: We show the problems with missing data using 644 patients’ records obtained from a res-piratory clinic. The neck circumference is self-reported by the patients. However, many patients do not know their NC. In the analyzed data set, 37% of the records (240/644) have the an-swer “not sure” and 4% of the records (25/644) have missing values. Thus, in total, 41% (265/644) patients did not provide the NC data. A question about neck circumference was even more difficult for women: 75% (141/188) female patients an-swered “not sure,” 7% (13/188) answers were missing. Thus, in total, 82% (154/188) female patients did not provide the NC data. Therefore, considering that almost 50% data are missing, the self-reported NC data should be excluded from secondary analysis. C. Example 2: Snoring Snoring is a noise produced by a sleeping individual in which the soft palate and the uvula vibrate during breathing. Loud snoring is a sign that the breathing is strained and that the air-way is not completely open. The narrower the throat becomes during the inhalation, the more effort is needed to draw in air, leading to more vibration. Snoring may have several aspects, and the two most often studied are frequency and intensity. Although there are cases of OSA without snoring and many snorers do not have OSA, loud and habitual snoring is recog-nized as one of the most important predictors of OSA [12]. 1) Goal Orientation: The concept of “snoring” is opera-tionalized differently for the three different tasks: screening, diagnosis, and research. For the purpose of screening, data are obtained from self-reported questionnaires, and the values are binary (yes/no). For example, the STOP-Bang questionnaire has a question: “Do you snore loudly (loud enough to be heard through closed door)?” (yes/no). For the purpose of diagnosis, data are obtained from self-reported questionnaires and, if available, from an overnight PSG recording. The question-naires ask for the frequency and intensity of snoring, and use rating scales (e.g., scale from 1 to 5) for the answers. For the purpose of research, data are obtained using an overnight sound recording. 2) Interdependency of Data: Patients who are undergoing treatment for OSA should not snore. Thus, in research, the patients undergoing treatment must be evaluated separately. 3) Time Sensitivity: Snoring may be habitual or sporadic. Thus, the data must be clearly time-stamped. 4) Source Validity: Data for snoring are obtained in two ways: self-reported (subjective) and clinically recorded (ob-
567
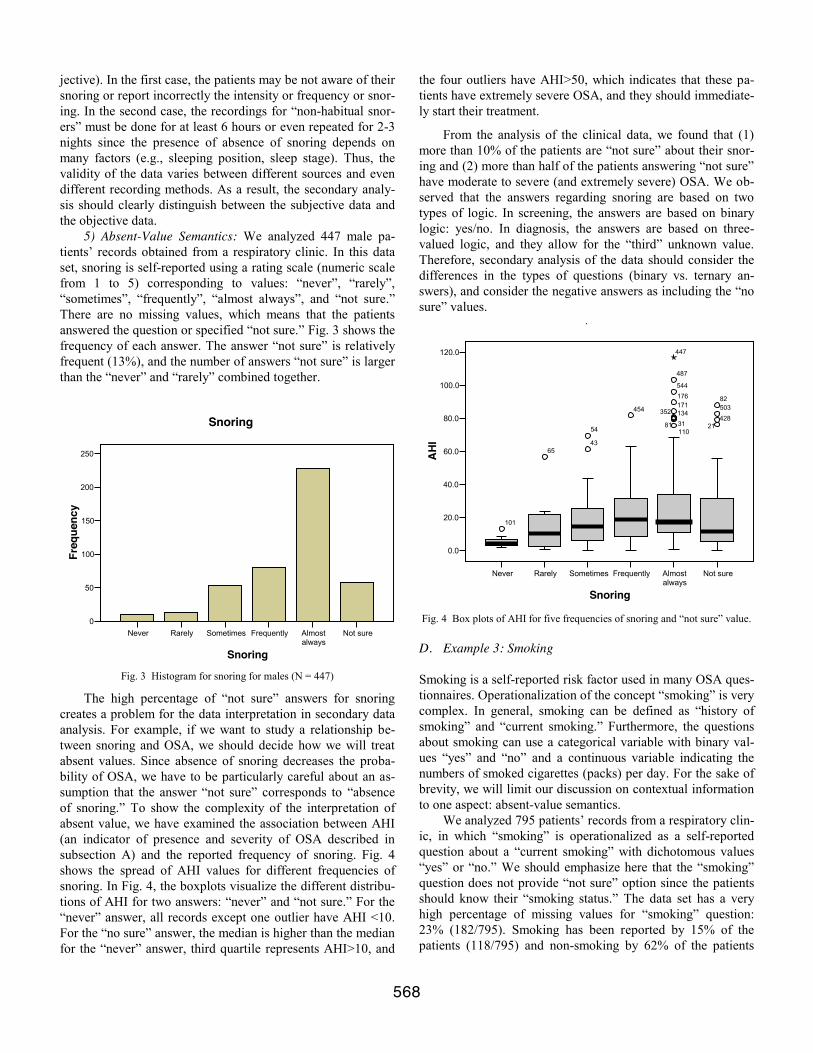
jective). In the first case, the patients may be not aware of their snoring or report incorrectly the intensity or frequency or snor-ing. In the second case, the recordings for “non-habitual snor-ers” must be done for at least 6 hours or even repeated for 2-3 nights since the presence of absence of snoring depends on many factors (e.g., sleeping position, sleep stage). Thus, the validity of the data varies between different sources and even different recording methods. As a result, the secondary analy-sis should clearly distinguish between the subjective data and the objective data. 5) Absent-Value Semantics: We analyzed 447 male pa-tients’ records obtained from a respiratory clinic. In this data set, snoring is self-reported using a rating scale (numeric scale from 1 to 5) corresponding to values: “never”, “rarely”, “sometimes”, “frequently”, “almost always”, and “not sure.” There are no missing values, which means that the patients answered the question or specified “not sure.” Fig. 3 shows the frequency of each answer. The answer “not sure” is relatively frequent (13%), and the number of answers “not sure” is larger than the “never” and “rarely” combined together.
Never Rarely Sometimes Frequently Almost always
Not sure
Snoring
0
50
100
150
200
250
Frequency
Snoring
Fig. 3 Histogram for snoring for males (N = 447)
The high percentage of “not sure” answers for snoring creates a problem for the data interpretation in secondary data analysis. For example, if we want to study a relationship be-tween snoring and OSA, we should decide how we will treat absent values. Since absence of snoring decreases the proba-bility of OSA, we have to be particularly careful about an as-sumption that the answer “not sure” corresponds to “absence of snoring.” To show the complexity of the interpretation of absent value, we have examined the association between AHI (an indicator of presence and severity of OSA described in subsection A) and the reported frequency of snoring. Fig. 4 shows the spread of AHI values for different frequencies of snoring. In Fig. 4, the boxplots visualize the different distribu-tions of AHI for two answers: “never” and “not sure.” For the “never” answer, all records except one outlier have AHI <10. For the “no sure” answer, the median is higher than the median for the “never” answer, third quartile represents AHI>10, and
the four outliers have AHI>50, which indicates that these pa-tients have extremely severe OSA, and they should immediate-ly start their treatment.
From the analysis of the clinical data, we found that (1) more than 10% of the patients are “not sure” about their snor-ing and (2) more than half of the patients answering “not sure” have moderate to severe (and extremely severe) OSA. We ob-served that the answers regarding snoring are based on two types of logic. In screening, the answers are based on binary logic: yes/no. In diagnosis, the answers are based on three-valued logic, and they allow for the “third” unknown value. Therefore, secondary analysis of the data should consider the differences in the types of questions (binary vs. ternary an-swers), and consider the negative answers as including the “no sure” values.
.
Never Rarely Sometimes Frequently Almost always
Not sure
Snoring
0.0
20.0
40.0
60.0
80.0
100.0
120.0
AHI
110
134
81
352
31
171176
544
487
65
454
101
43
54
42821
50382
447
Fig. 4 Box plots of AHI for five frequencies of snoring and “not sure” value.
D. Example 3: Smoking Smoking is a self-reported risk factor used in many OSA ques-tionnaires. Operationalization of the concept “smoking” is very complex. In general, smoking can be defined as “history of smoking” and “current smoking.” Furthermore, the questions about smoking can use a categorical variable with binary val-ues “yes” and “no” and a continuous variable indicating the numbers of smoked cigarettes (packs) per day. For the sake of brevity, we will limit our discussion on contextual information to one aspect: absent-value semantics. We analyzed 795 patients’ records from a respiratory clin-ic, in which “smoking” is operationalized as a self-reported question about a “current smoking” with dichotomous values “yes” or “no.” We should emphasize here that the “smoking” question does not provide “not sure” option since the patients should know their “smoking status.” The data set has a very high percentage of missing values for “smoking” question: 23% (182/795). Smoking has been reported by 15% of the patients (118/795) and non-smoking by 62% of the patients
568
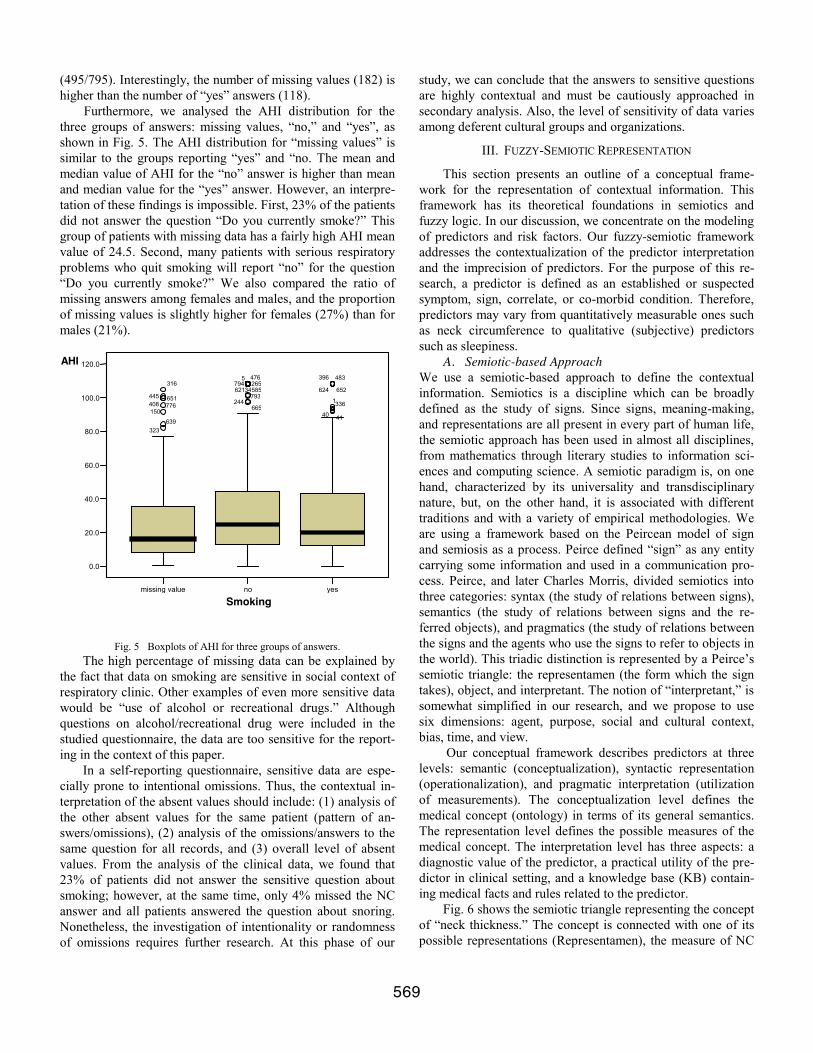
(495/795). Interestingly, the number of missing values (182) is higher than the number of “yes” answers (118). Furthermore, we analysed the AHI distribution for the three groups of answers: missing values, “no,” and “yes”, as shown in Fig. 5. The AHI distribution for “missing values” is similar to the groups reporting “yes” and “no. The mean and median value of AHI for the “no” answer is higher than mean and median value for the “yes” answer. However, an interpre-tation of these findings is impossible. First, 23% of the patients did not answer the question “Do you currently smoke?” This group of patients with missing data has a fairly high AHI mean value of 24.5. Second, many patients with serious respiratory problems who quit smoking will report “no” for the question “Do you currently smoke?” We also compared the ratio of missing answers among females and males, and the proportion of missing values is slightly higher for females (27%) than for males (21%).
Fig. 5 Boxplots of AHI for three groups of answers. The high percentage of missing data can be explained by
the fact that data on smoking are sensitive in social context of respiratory clinic. Other examples of even more sensitive data would be “use of alcohol or recreational drugs.” Although questions on alcohol/recreational drug were included in the studied questionnaire, the data are too sensitive for the report-ing in the context of this paper.
In a self-reporting questionnaire, sensitive data are espe-cially prone to intentional omissions. Thus, the contextual in-terpretation of the absent values should include: (1) analysis of the other absent values for the same patient (pattern of an-swers/omissions), (2) analysis of the omissions/answers to the same question for all records, and (3) overall level of absent values. From the analysis of the clinical data, we found that 23% of patients did not answer the sensitive question about smoking; however, at the same time, only 4% missed the NC answer and all patients answered the question about snoring. Nonetheless, the investigation of intentionality or randomness of omissions requires further research. At this phase of our
study, we can conclude that the answers to sensitive questions are highly contextual and must be cautiously approached in secondary analysis. Also, the level of sensitivity of data varies among deferent cultural groups and organizations.
III. FUZZY-SEMIOTIC REPRESENTATION
This section presents an outline of a conceptual frame-work for the representation of contextual information. This framework has its theoretical foundations in semiotics and fuzzy logic. In our discussion, we concentrate on the modeling of predictors and risk factors. Our fuzzy-semiotic framework addresses the contextualization of the predictor interpretation and the imprecision of predictors. For the purpose of this re-search, a predictor is defined as an established or suspected symptom, sign, correlate, or co-morbid condition. Therefore, predictors may vary from quantitatively measurable ones such as neck circumference to qualitative (subjective) predictors such as sleepiness. A. Semiotic-based Approach We use a semiotic-based approach to define the contextual information. Semiotics is a discipline which can be broadly defined as the study of signs. Since signs, meaning-making, and representations are all present in every part of human life, the semiotic approach has been used in almost all disciplines, from mathematics through literary studies to information sci-ences and computing science. A semiotic paradigm is, on one hand, characterized by its universality and transdisciplinary nature, but, on the other hand, it is associated with different traditions and with a variety of empirical methodologies. We are using a framework based on the Peircean model of sign and semiosis as a process. Peirce defined “sign” as any entity carrying some information and used in a communication pro-cess. Peirce, and later Charles Morris, divided semiotics into three categories: syntax (the study of relations between signs), semantics (the study of relations between signs and the re-ferred objects), and pragmatics (the study of relations between the signs and the agents who use the signs to refer to objects in the world). This triadic distinction is represented by a Peirce’s semiotic triangle: the representamen (the form which the sign takes), object, and interpretant. The notion of “interpretant,” is somewhat simplified in our research, and we propose to use six dimensions: agent, purpose, social and cultural context, bias, time, and view. Our conceptual framework describes predictors at three levels: semantic (conceptualization), syntactic representation (operationalization), and pragmatic interpretation (utilization of measurements). The conceptualization level defines the medical concept (ontology) in terms of its general semantics. The representation level defines the possible measures of the medical concept. The interpretation level has three aspects: a diagnostic value of the predictor, a practical utility of the pre-dictor in clinical setting, and a knowledge base (KB) contain-ing medical facts and rules related to the predictor. Fig. 6 shows the semiotic triangle representing the concept of “neck thickness.” The concept is connected with one of its possible representations (Representamen), the measure of NC
missing value no yes Smoking
0.0
20.0
40.0
60.0
80.0
100.0
120.0
793 665 244
5 794 621 585
476 265
34
639 323
776 150
651 408 445
316
41 336
40 1
483 652 624
396 AHI
569
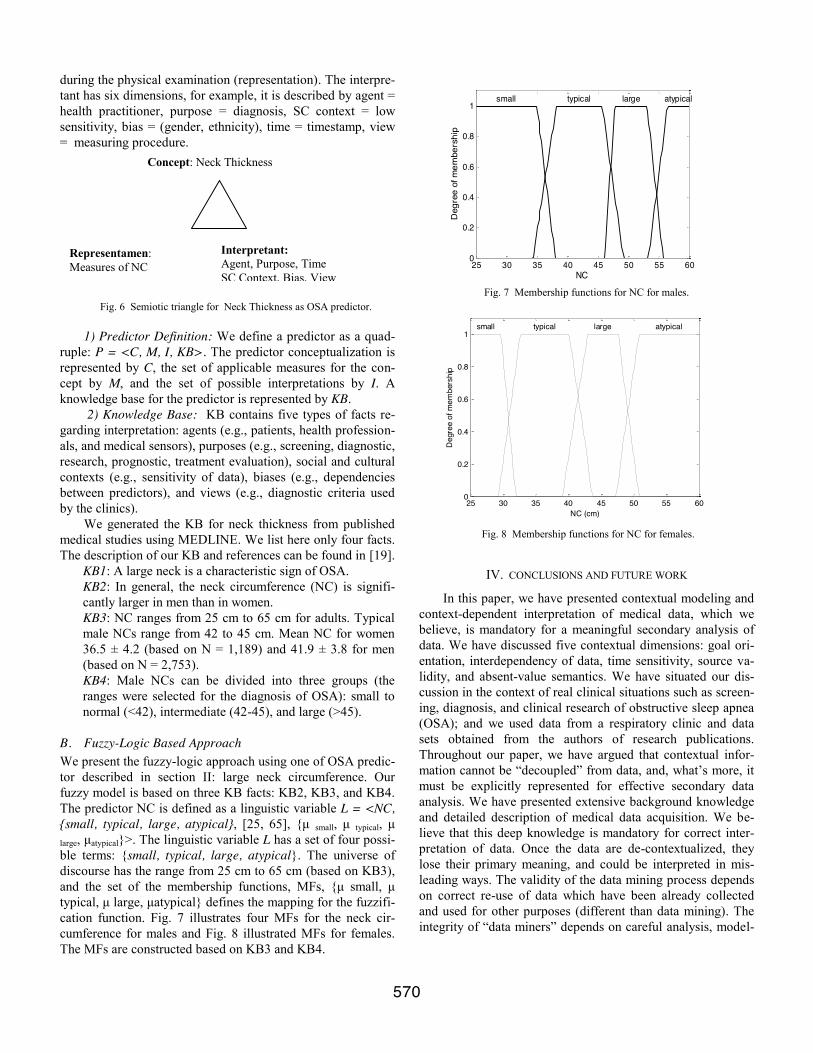
25 30 35 40 45 50 55 600
0.2
0.4
0.6
0.8
1
NC
Deg
ree
of m
embe
rshi
p
small typical large atypical
during the physical examination (representation). The interpre-tant has six dimensions, for example, it is described by agent = health practitioner, purpose = diagnosis, SC context = low sensitivity, bias = (gender, ethnicity), time = timestamp, view = measuring procedure.
Fig. 6 Semiotic triangle for Neck Thickness as OSA predictor.
1) Predictor Definition: We define a predictor as a quad-ruple: P = <C, M, I, KB>. The predictor conceptualization is represented by C, the set of applicable measures for the con-cept by M, and the set of possible interpretations by I. A knowledge base for the predictor is represented by KB. 2) Knowledge Base: KB contains five types of facts re-garding interpretation: agents (e.g., patients, health profession-als, and medical sensors), purposes (e.g., screening, diagnostic, research, prognostic, treatment evaluation), social and cultural contexts (e.g., sensitivity of data), biases (e.g., dependencies between predictors), and views (e.g., diagnostic criteria used by the clinics). We generated the KB for neck thickness from published medical studies using MEDLINE. We list here only four facts. The description of our KB and references can be found in [19].
KB1: A large neck is a characteristic sign of OSA. KB2: In general, the neck circumference (NC) is signifi-cantly larger in men than in women. KB3: NC ranges from 25 cm to 65 cm for adults. Typical male NCs range from 42 to 45 cm. Mean NC for women 36.5 ± 4.2 (based on N = 1,189) and 41.9 ± 3.8 for men (based on N = 2,753). KB4: Male NCs can be divided into three groups (the ranges were selected for the diagnosis of OSA): small to normal (<42), intermediate (42-45), and large (>45).
B. Fuzzy-Logic Based Approach We present the fuzzy-logic approach using one of OSA predic-tor described in section II: large neck circumference. Our fuzzy model is based on three KB facts: KB2, KB3, and KB4. The predictor NC is defined as a linguistic variable L = <NC, small, typical, large, atypical, [25, 65], μ small, μ typical, μ large, μatypical>. The linguistic variable L has a set of four possi-ble terms: small, typical, large, atypical. The universe of discourse has the range from 25 cm to 65 cm (based on KB3), and the set of the membership functions, MFs, μ small, μ typical, μ large, μatypical defines the mapping for the fuzzifi-cation function. Fig. 7 illustrates four MFs for the neck cir-cumference for males and Fig. 8 illustrated MFs for females. The MFs are constructed based on KB3 and KB4.
Fig. 7 Membership functions for NC for males.
Fig. 8 Membership functions for NC for females.
IV. CONCLUSIONS AND FUTURE WORK
In this paper, we have presented contextual modeling and context-dependent interpretation of medical data, which we believe, is mandatory for a meaningful secondary analysis of data. We have discussed five contextual dimensions: goal ori-entation, interdependency of data, time sensitivity, source va-lidity, and absent-value semantics. We have situated our dis-cussion in the context of real clinical situations such as screen-ing, diagnosis, and clinical research of obstructive sleep apnea (OSA); and we used data from a respiratory clinic and data sets obtained from the authors of research publications. Throughout our paper, we have argued that contextual infor-mation cannot be “decoupled” from data, and, what’s more, it must be explicitly represented for effective secondary data analysis. We have presented extensive background knowledge and detailed description of medical data acquisition. We be-lieve that this deep knowledge is mandatory for correct inter-pretation of data. Once the data are de-contextualized, they lose their primary meaning, and could be interpreted in mis-leading ways. The validity of the data mining process depends on correct re-use of data which have been already collected and used for other purposes (different than data mining). The integrity of “data miners” depends on careful analysis, model-
Concept: Neck Thickness
Representamen: Measures of NC
Interpretant: Agent, Purpose, Time SC Context, Bias, View
25 30 35 40 45 50 55 600
0.2
0.4
0.6
0.8
1
NC (cm)
Deg
ree
of m
embe
rshi
p
small typical large atypical
570
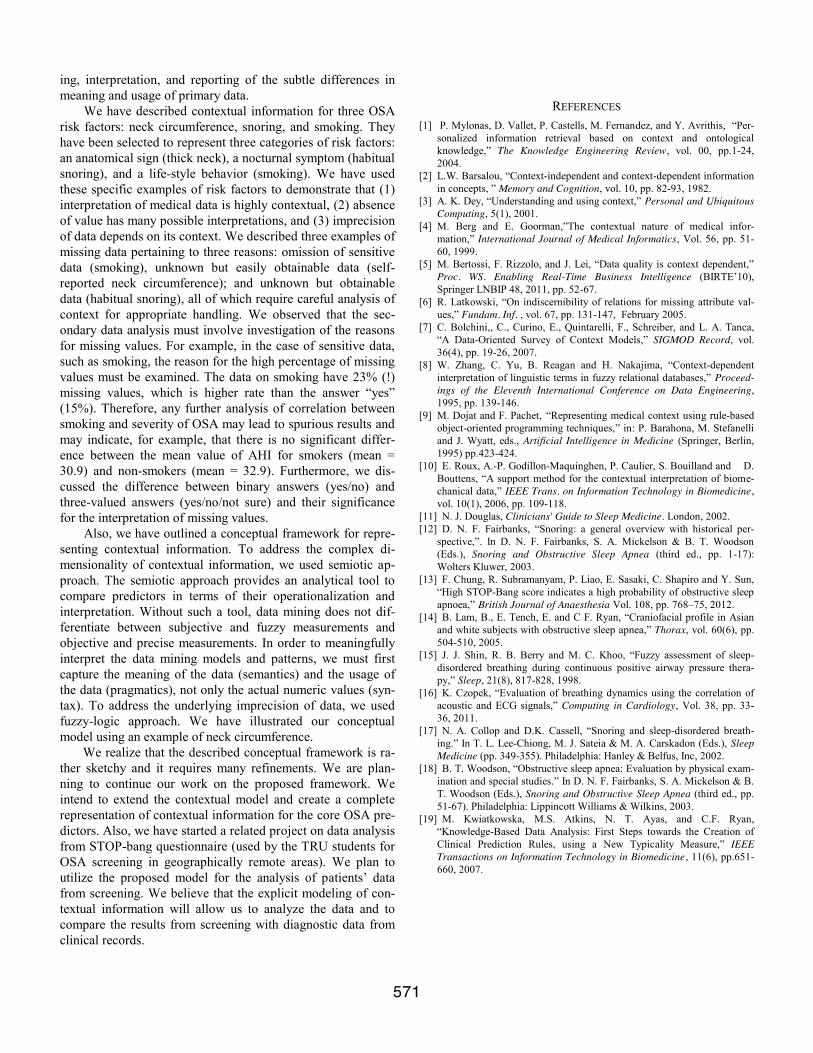
ing, interpretation, and reporting of the subtle differences in meaning and usage of primary data. We have described contextual information for three OSA risk factors: neck circumference, snoring, and smoking. They have been selected to represent three categories of risk factors: an anatomical sign (thick neck), a nocturnal symptom (habitual snoring), and a life-style behavior (smoking). We have used these specific examples of risk factors to demonstrate that (1) interpretation of medical data is highly contextual, (2) absence of value has many possible interpretations, and (3) imprecision of data depends on its context. We described three examples of missing data pertaining to three reasons: omission of sensitive data (smoking), unknown but easily obtainable data (self-reported neck circumference); and unknown but obtainable data (habitual snoring), all of which require careful analysis of context for appropriate handling. We observed that the sec-ondary data analysis must involve investigation of the reasons for missing values. For example, in the case of sensitive data, such as smoking, the reason for the high percentage of missing values must be examined. The data on smoking have 23% (!) missing values, which is higher rate than the answer “yes” (15%). Therefore, any further analysis of correlation between smoking and severity of OSA may lead to spurious results and may indicate, for example, that there is no significant differ-ence between the mean value of AHI for smokers (mean = 30.9) and non-smokers (mean = 32.9). Furthermore, we dis-cussed the difference between binary answers (yes/no) and three-valued answers (yes/no/not sure) and their significance for the interpretation of missing values. Also, we have outlined a conceptual framework for repre-senting contextual information. To address the complex di-mensionality of contextual information, we used semiotic ap-proach. The semiotic approach provides an analytical tool to compare predictors in terms of their operationalization and interpretation. Without such a tool, data mining does not dif-ferentiate between subjective and fuzzy measurements and objective and precise measurements. In order to meaningfully interpret the data mining models and patterns, we must first capture the meaning of the data (semantics) and the usage of the data (pragmatics), not only the actual numeric values (syn-tax). To address the underlying imprecision of data, we used fuzzy-logic approach. We have illustrated our conceptual model using an example of neck circumference.
We realize that the described conceptual framework is ra-ther sketchy and it requires many refinements. We are plan-ning to continue our work on the proposed framework. We intend to extend the contextual model and create a complete representation of contextual information for the core OSA pre-dictors. Also, we have started a related project on data analysis from STOP-bang questionnaire (used by the TRU students for OSA screening in geographically remote areas). We plan to utilize the proposed model for the analysis of patients’ data from screening. We believe that the explicit modeling of con-textual information will allow us to analyze the data and to compare the results from screening with diagnostic data from clinical records.
REFERENCES [1] P. Mylonas, D. Vallet, P. Castells, M. Fernandez, and Y. Avrithis, “Per-
sonalized information retrieval based on context and ontological knowledge,” The Knowledge Engineering Review, vol. 00, pp.1-24, 2004.
[2] L.W. Barsalou, “Context-independent and context-dependent information in concepts, ” Memory and Cognition, vol. 10, pp. 82-93, 1982.
[3] A. K. Dey, “Understanding and using context,” Personal and Ubiquitous Computing, 5(1), 2001.
[4] M. Berg and E. Goorman,”The contextual nature of medical infor-mation,” International Journal of Medical Informatics, Vol. 56, pp. 51-60, 1999.
[5] M. Bertossi, F. Rizzolo, and J. Lei, “Data quality is context dependent,” Proc. WS. Enabling Real-Time Business Intelligence (BIRTE’10), Springer LNBIP 48, 2011, pp. 52-67.
[6] R. Latkowski, “On indiscernibility of relations for missing attribute val-ues,” Fundam. Inf. , vol. 67, pp. 131-147, February 2005.
[7] C. Bolchini,, C., Curino, E., Quintarelli, F., Schreiber, and L. A. Tanca, “A Data-Oriented Survey of Context Models,” SIGMOD Record, vol. 36(4), pp. 19-26, 2007.
[8] W. Zhang, C. Yu, B. Reagan and H. Nakajima, “Context-dependent interpretation of linguistic terms in fuzzy relational databases,” Proceed-ings of the Eleventh International Conference on Data Engineering, 1995, pp. 139-146.
[9] M. Dojat and F. Pachet, “Representing medical context using rule-based object-oriented programming techniques,” in: P. Barahona, M. Stefanelli and J. Wyatt, eds., Artificial Intelligence in Medicine (Springer, Berlin, 1995) pp.423-424.
[10] E. Roux, A.-P. Godillon-Maquinghen, P. Caulier, S. Bouilland and D. Bouttens, “A support method for the contextual interpretation of biome-chanical data,” IEEE Trans. on Information Technology in Biomedicine, vol. 10(1), 2006, pp. 109-118.
[11] N. J. Douglas, Clinicians' Guide to Sleep Medicine. London, 2002. [12] D. N. F. Fairbanks, “Snoring: a general overview with historical per-
spective,”. In D. N. F. Fairbanks, S. A. Mickelson & B. T. Woodson (Eds.), Snoring and Obstructive Sleep Apnea (third ed., pp. 1-17): Wolters Kluwer, 2003.
[13] F. Chung, R. Subramanyam, P. Liao, E. Sasaki, C. Shapiro and Y. Sun, “High STOP-Bang score indicates a high probability of obstructive sleep apnoea,” British Journal of Anaesthesia Vol. 108, pp. 768–75, 2012.
[14] B. Lam, B., E. Tench, E. and C F. Ryan, “Craniofacial profile in Asian and white subjects with obstructive sleep apnea,” Thorax, vol. 60(6), pp. 504-510, 2005.
[15] J. J. Shin, R. B. Berry and M. C. Khoo, “Fuzzy assessment of sleep-disordered breathing during continuous positive airway pressure thera-py,” Sleep, 21(8), 817-828, 1998.
[16] K. Czopek, “Evaluation of breathing dynamics using the correlation of acoustic and ECG signals,” Computing in Cardiology, Vol. 38, pp. 33-36, 2011.
[17] N. A. Collop and D.K. Cassell, “Snoring and sleep-disordered breath-ing.” In T. L. Lee-Chiong, M. J. Sateia & M. A. Carskadon (Eds.), Sleep Medicine (pp. 349-355). Philadelphia: Hanley & Belfus, Inc, 2002.
[18] B. T. Woodson, “Obstructive sleep apnea: Evaluation by physical exam-ination and special studies.” In D. N. F. Fairbanks, S. A. Mickelson & B. T. Woodson (Eds.), Snoring and Obstructive Sleep Apnea (third ed., pp. 51-67). Philadelphia: Lippincott Williams & Wilkins, 2003.
[19] M. Kwiatkowska, M.S. Atkins, N. T. Ayas, and C.F. Ryan, “Knowledge-Based Data Analysis: First Steps towards the Creation of Clinical Prediction Rules, using a New Typicality Measure,” IEEE Transactions on Information Technology in Biomedicine, 11(6), pp.651-660, 2007.
571
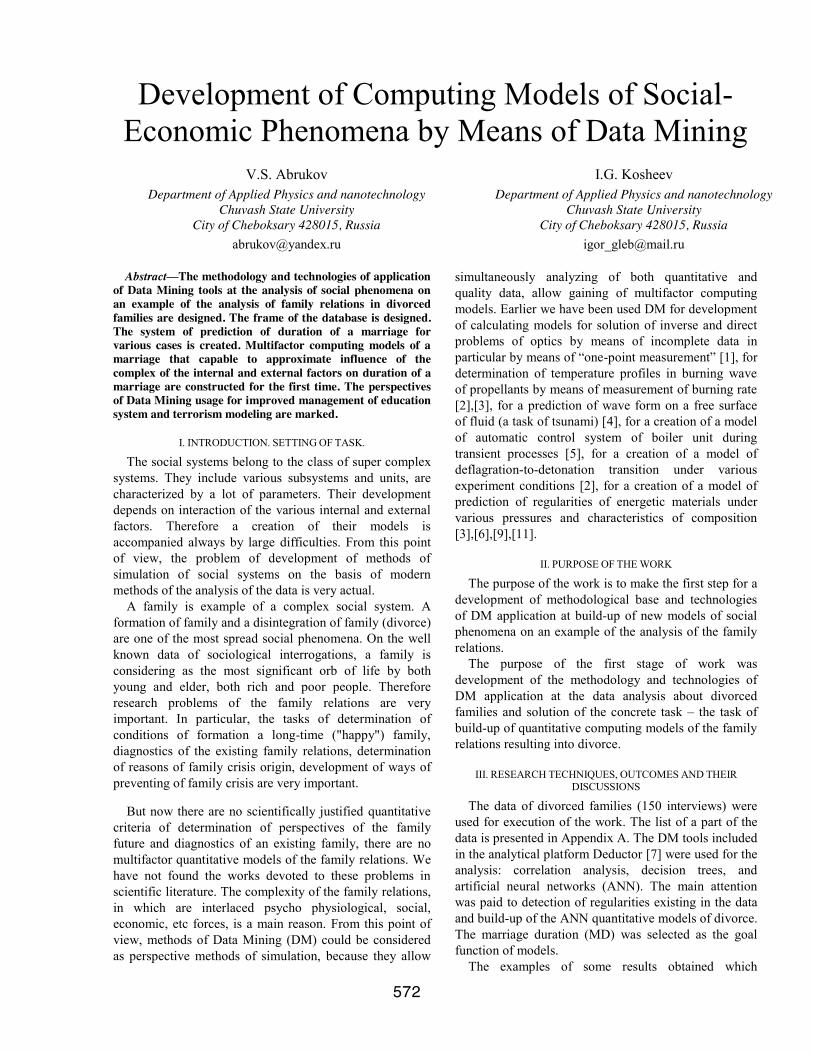
Development of Computing Models of Social-Economic Phenomena by Means of Data Mining
V.S. Abrukov I.G. Kosheev
Department of Applied Physics and nanotechnology Department of Applied Physics and nanotechnology Chuvash State University Chuvash State University
City of Cheboksary 428015, Russia City of Cheboksary 428015, Russia [email protected] [email protected]
Abstract—The methodology and technologies of application
of Data Mining tools at the analysis of social phenomena on an example of the analysis of family relations in divorced families are designed. The frame of the database is designed. The system of prediction of duration of a marriage for various cases is created. Multifactor computing models of a marriage that capable to approximate influence of the complex of the internal and external factors on duration of a marriage are constructed for the first time. The perspectives of Data Mining usage for improved management of education system and terrorism modeling are marked.
I. INTRODUCTION. SETTING OF TASK.
The social systems belong to the class of super complex systems. They include various subsystems and units, are characterized by a lot of parameters. Their development depends on interaction of the various internal and external factors. Therefore a creation of their models is accompanied always by large difficulties. From this point of view, the problem of development of methods of simulation of social systems on the basis of modern methods of the analysis of the data is very actual.
A family is example of a complex social system. A formation of family and a disintegration of family (divorce) are one of the most spread social phenomena. On the well known data of sociological interrogations, a family is considering as the most significant orb of life by both young and elder, both rich and poor people. Therefore research problems of the family relations are very important. In particular, the tasks of determination of conditions of formation a long-time ("happy") family, diagnostics of the existing family relations, determination of reasons of family crisis origin, development of ways of preventing of family crisis are very important.
But now there are no scientifically justified quantitative
criteria of determination of perspectives of the family future and diagnostics of an existing family, there are no multifactor quantitative models of the family relations. We have not found the works devoted to these problems in scientific literature. The complexity of the family relations, in which are interlaced psycho physiological, social, economic, etc forces, is a main reason. From this point of view, methods of Data Mining (DM) could be considered as perspective methods of simulation, because they allow
simultaneously analyzing of both quantitative and quality data, allow gaining of multifactor computing models. Earlier we have been used DM for development of calculating models for solution of inverse and direct problems of optics by means of incomplete data in particular by means of “one-point measurement” [1], for determination of temperature profiles in burning wave of propellants by means of measurement of burning rate [2],[3], for a prediction of wave form on a free surface of fluid (a task of tsunami) [4], for a creation of a model of automatic control system of boiler unit during transient processes [5], for a creation of a model of deflagration-to-detonation transition under various experiment conditions [2], for a creation of a model of prediction of regularities of energetic materials under various pressures and characteristics of composition [3],[6],[9],[11].
II. PURPOSE OF THE WORK
The purpose of the work is to make the first step for a development of methodological base and technologies of DM application at build-up of new models of social phenomena on an example of the analysis of the family relations.
The purpose of the first stage of work was development of the methodology and technologies of DM application at the data analysis about divorced families and solution of the concrete task – the task of build-up of quantitative computing models of the family relations resulting into divorce.
III. RESEARCH TECHNIQUES, OUTCOMES AND THEIR DISCUSSIONS
The data of divorced families (150 interviews) were used for execution of the work. The list of a part of the data is presented in Appendix A. The DM tools included in the analytical platform Deductor [7] were used for the analysis: correlation analysis, decision trees, and artificial neural networks (ANN). The main attention was paid to detection of regularities existing in the data and build-up of the ANN quantitative models of divorce. The marriage duration (MD) was selected as the goal function of models.
The examples of some results obtained which
572
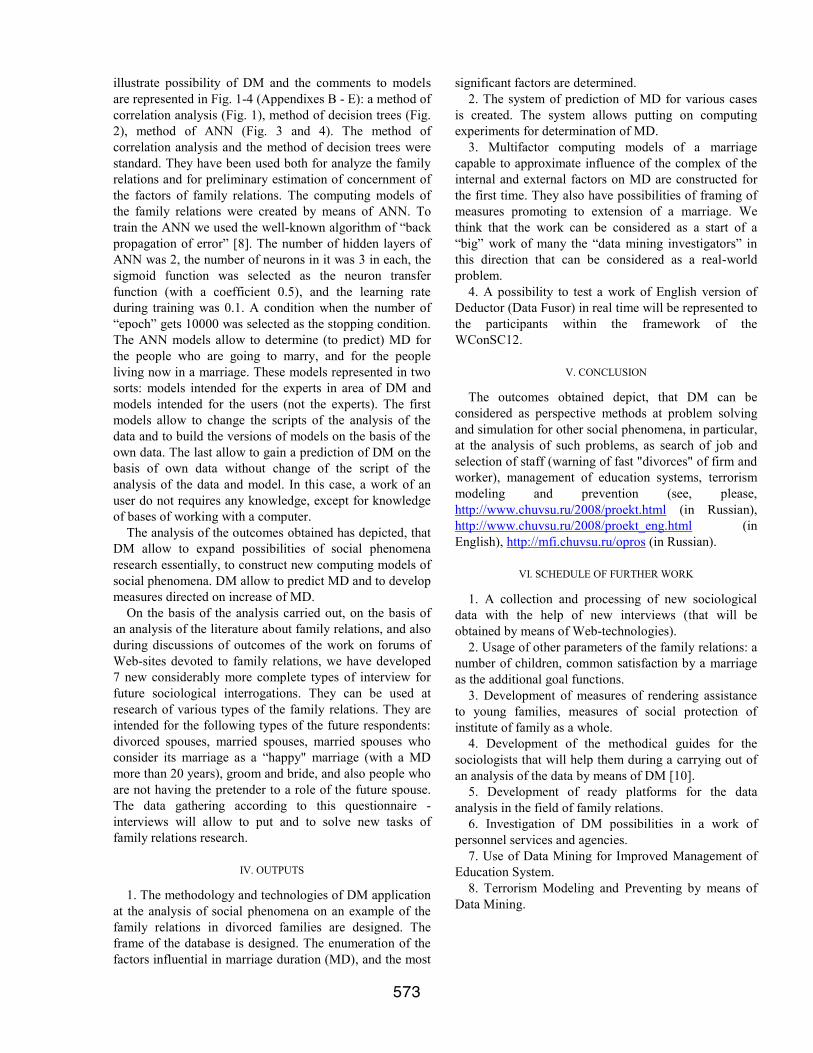
illustrate possibility of DM and the comments to models are represented in Fig. 1-4 (Appendixes B - E): a method of correlation analysis (Fig. 1), method of decision trees (Fig. 2), method of ANN (Fig. 3 and 4). The method of correlation analysis and the method of decision trees were standard. They have been used both for analyze the family relations and for preliminary estimation of concernment of the factors of family relations. The computing models of the family relations were created by means of ANN. To train the ANN we used the well-known algorithm of “back propagation of error” [8]. The number of hidden layers of ANN was 2, the number of neurons in it was 3 in each, the sigmoid function was selected as the neuron transfer function (with a coefficient 0.5), and the learning rate during training was 0.1. A condition when the number of “epoch” gets 10000 was selected as the stopping condition. The ANN models allow to determine (to predict) MD for the people who are going to marry, and for the people living now in a marriage. These models represented in two sorts: models intended for the experts in area of DM and models intended for the users (not the experts). The first models allow to change the scripts of the analysis of the data and to build the versions of models on the basis of the own data. The last allow to gain a prediction of DM on the basis of own data without change of the script of the analysis of the data and model. In this case, a work of an user do not requires any knowledge, except for knowledge of bases of working with a computer.
The analysis of the outcomes obtained has depicted, that DM allow to expand possibilities of social phenomena research essentially, to construct new computing models of social phenomena. DM allow to predict MD and to develop measures directed on increase of MD.
On the basis of the analysis carried out, on the basis of an analysis of the literature about family relations, and also during discussions of outcomes of the work on forums of Web-sites devoted to family relations, we have developed 7 new considerably more complete types of interview for future sociological interrogations. They can be used at research of various types of the family relations. They are intended for the following types of the future respondents: divorced spouses, married spouses, married spouses who consider its marriage as a “happy" marriage (with a MD more than 20 years), groom and bride, and also people who are not having the pretender to a role of the future spouse. The data gathering according to this questionnaire - interviews will allow to put and to solve new tasks of family relations research.
IV. OUTPUTS
1. The methodology and technologies of DM application at the analysis of social phenomena on an example of the family relations in divorced families are designed. The frame of the database is designed. The enumeration of the factors influential in marriage duration (MD), and the most
significant factors are determined. 2. The system of prediction of MD for various cases
is created. The system allows putting on computing experiments for determination of MD.
3. Multifactor computing models of a marriage capable to approximate influence of the complex of the internal and external factors on MD are constructed for the first time. They also have possibilities of framing of measures promoting to extension of a marriage. We think that the work can be considered as a start of a “big” work of many the “data mining investigators” in this direction that can be considered as a real-world problem.
4. A possibility to test a work of English version of Deductor (Data Fusor) in real time will be represented to the participants within the framework of the WConSC12.
V. CONCLUSION
The outcomes obtained depict, that DM can be considered as perspective methods at problem solving and simulation for other social phenomena, in particular, at the analysis of such problems, as search of job and selection of staff (warning of fast "divorces" of firm and worker), management of education systems, terrorism modeling and prevention (see, please, http://www.chuvsu.ru/2008/proekt.html (in Russian), http://www.chuvsu.ru/2008/proekt_eng.html (in English), http://mfi.chuvsu.ru/opros (in Russian).
VI. SCHEDULE OF FURTHER WORK
1. A collection and processing of new sociological data with the help of new interviews (that will be obtained by means of Web-technologies).
2. Usage of other parameters of the family relations: a number of children, common satisfaction by a marriage as the additional goal functions.
3. Development of measures of rendering assistance to young families, measures of social protection of institute of family as a whole.
4. Development of the methodical guides for the sociologists that will help them during a carrying out of an analysis of the data by means of DM [10].
5. Development of ready platforms for the data analysis in the field of family relations.
6. Investigation of DM possibilities in a work of personnel services and agencies.
7. Use of Data Mining for Improved Management of Education System.
8. Terrorism Modeling and Preventing by means of Data Mining.
573
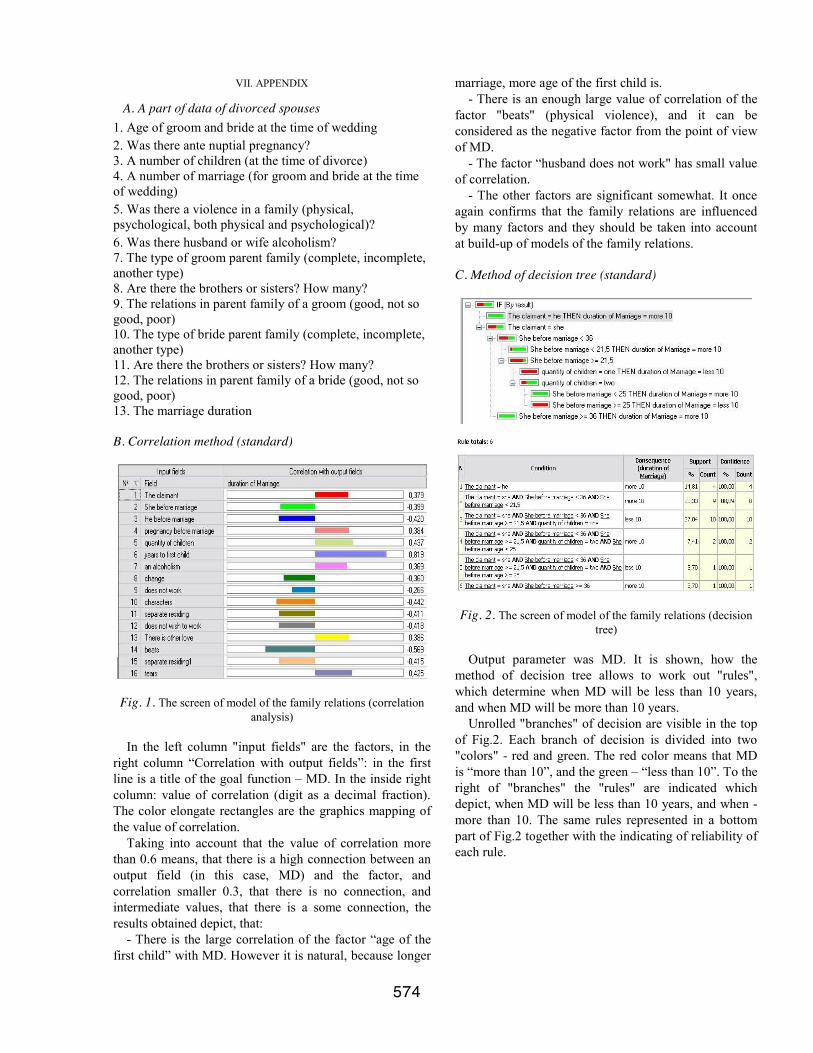
VII. APPENDIX
A. A part of data of divorced spouses 1. Age of groom and bride at the time of wedding 2. Was there ante nuptial pregnancy? 3. A number of children (at the time of divorce) 4. A number of marriage (for groom and bride at the time of wedding) 5. Was there a violence in a family (physical, psychological, both physical and psychological)? 6. Was there husband or wife alcoholism? 7. The type of groom parent family (complete, incomplete, another type) 8. Are there the brothers or sisters? How many? 9. The relations in parent family of a groom (good, not so good, poor) 10. The type of bride parent family (complete, incomplete, another type) 11. Are there the brothers or sisters? How many? 12. The relations in parent family of a bride (good, not so good, poor) 13. The marriage duration B. Correlation method (standard)
Fig. 1. The screen of model of the family relations (correlation analysis)
In the left column "input fields" are the factors, in the
right column “Correlation with output fields”: in the first line is a title of the goal function – MD. In the inside right column: value of correlation (digit as a decimal fraction). The color elongate rectangles are the graphics mapping of the value of correlation.
Taking into account that the value of correlation more than 0.6 means, that there is a high connection between an output field (in this case, MD) and the factor, and correlation smaller 0.3, that there is no connection, and intermediate values, that there is a some connection, the results obtained depict, that:
- There is the large correlation of the factor “age of the first child” with MD. However it is natural, because longer
marriage, more age of the first child is. - There is an enough large value of correlation of the
factor "beats" (physical violence), and it can be considered as the negative factor from the point of view of MD.
- The factor “husband does not work" has small value of correlation.
- The other factors are significant somewhat. It once again confirms that the family relations are influenced by many factors and they should be taken into account at build-up of models of the family relations. C. Method of decision tree (standard)
Fig. 2. The screen of model of the family relations (decision tree)
Output parameter was MD. It is shown, how the
method of decision tree allows to work out "rules", which determine when MD will be less than 10 years, and when MD will be more than 10 years.
Unrolled "branches" of decision are visible in the top of Fig.2. Each branch of decision is divided into two "colors" - red and green. The red color means that MD is “more than 10”, and the green – “less than 10”. To the right of "branches" the "rules" are indicated which depict, when MD will be less than 10 years, and when - more than 10. The same rules represented in a bottom part of Fig.2 together with the indicating of reliability of each rule.
574
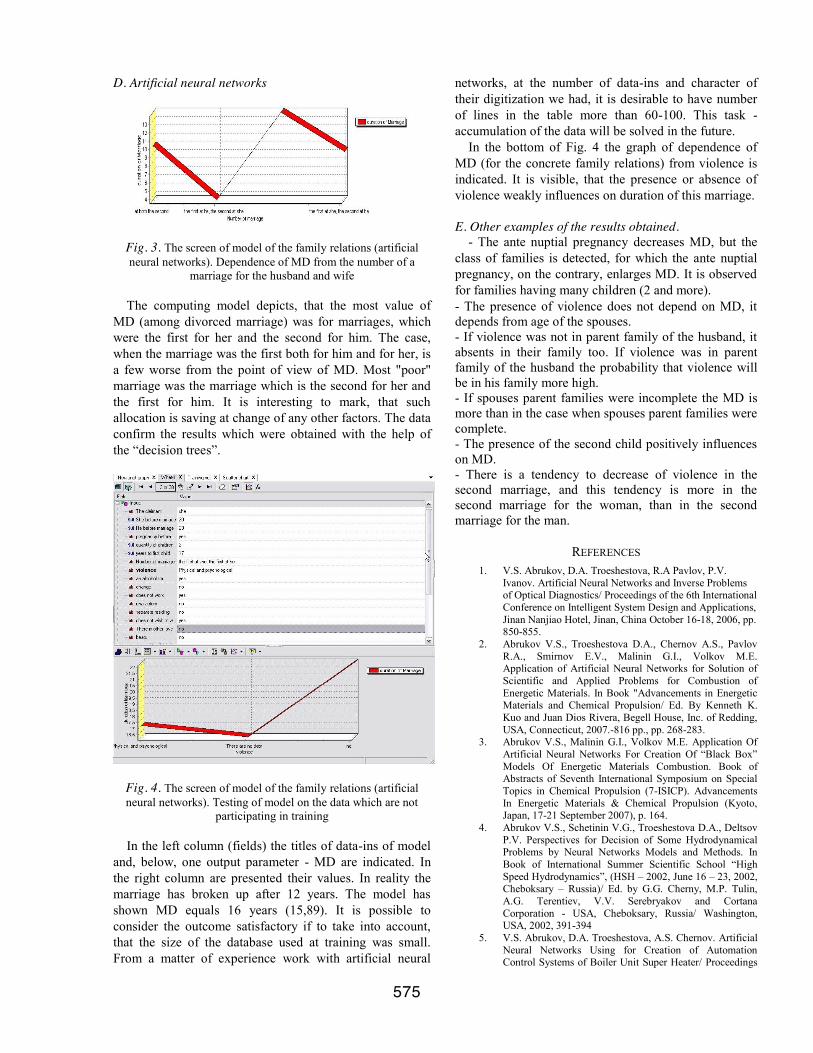
D. Artificial neural networks
Fig. 3. The screen of model of the family relations (artificial neural networks). Dependence of MD from the number of a
marriage for the husband and wife
The computing model depicts, that the most value of MD (among divorced marriage) was for marriages, which were the first for her and the second for him. The case, when the marriage was the first both for him and for her, is a few worse from the point of view of MD. Most "poor" marriage was the marriage which is the second for her and the first for him. It is interesting to mark, that such allocation is saving at change of any other factors. The data confirm the results which were obtained with the help of the “decision trees”.
Fig. 4. The screen of model of the family relations (artificial neural networks). Testing of model on the data which are not
participating in training
In the left column (fields) the titles of data-ins of model and, below, one output parameter - MD are indicated. In the right column are presented their values. In reality the marriage has broken up after 12 years. The model has shown MD equals 16 years (15,89). It is possible to consider the outcome satisfactory if to take into account, that the size of the database used at training was small. From a matter of experience work with artificial neural
networks, at the number of data-ins and character of their digitization we had, it is desirable to have number of lines in the table more than 60-100. This task - accumulation of the data will be solved in the future.
In the bottom of Fig. 4 the graph of dependence of MD (for the concrete family relations) from violence is indicated. It is visible, that the presence or absence of violence weakly influences on duration of this marriage. E. Other examples of the results obtained.
- The ante nuptial pregnancy decreases MD, but the class of families is detected, for which the ante nuptial pregnancy, on the contrary, enlarges MD. It is observed for families having many children (2 and more). - The presence of violence does not depend on MD, it depends from age of the spouses. - If violence was not in parent family of the husband, it absents in their family too. If violence was in parent family of the husband the probability that violence will be in his family more high. - If spouses parent families were incomplete the MD is more than in the case when spouses parent families were complete. - The presence of the second child positively influences on MD. - There is a tendency to decrease of violence in the second marriage, and this tendency is more in the second marriage for the woman, than in the second marriage for the man.
REFERENCES 1. V.S. Abrukov, D.A. Troeshestova, R.A Pavlov, P.V.
Ivanov. Artificial Neural Networks and Inverse Problems of Optical Diagnostics/ Proceedings of the 6th International Conference on Intelligent System Design and Applications, Jinan Nanjiao Hotel, Jinan, China October 16-18, 2006, pp. 850-855.
2. Abrukov V.S., Troeshestova D.A., Chernov A.S., Pavlov R.A., Smirnov E.V., Malinin G.I., Volkov M.E. Application of Artificial Neural Networks for Solution of Scientific and Applied Problems for Combustion of Energetic Materials. In Book "Advancements in Energetic Materials and Chemical Propulsion/ Ed. By Kenneth K. Kuo and Juan Dios Rivera, Begell House, Inc. of Redding, USA, Connecticut, 2007.-816 pp., pp. 268-283.
3. Abrukov V.S., Malinin G.I., Volkov M.E. Application Of Artificial Neural Networks For Creation Of “Black Box” Models Of Energetic Materials Combustion. Book of Abstracts of Seventh International Symposium on Special Topics in Chemical Propulsion (7-ISICP). Advancements In Energetic Materials & Chemical Propulsion (Kyoto, Japan, 17-21 September 2007), p. 164.
4. Abrukov V.S., Schetinin V.G., Troeshestova D.A., Deltsov P.V. Perspectives for Decision of Some Hydrodynamical Problems by Neural Networks Models and Methods. In Book of International Summer Scientific School “High Speed Hydrodynamics”, (HSH – 2002, June 16 – 23, 2002, Cheboksary – Russia)/ Ed. by G.G. Cherny, M.P. Tulin, A.G. Terentiev, V.V. Serebryakov and Cortana Corporation - USA, Cheboksary, Russia/ Washington, USA, 2002, 391-394
5. V.S. Abrukov, D.A. Troeshestova, A.S. Chernov. Artificial Neural Networks Using for Creation of Automation Control Systems of Boiler Unit Super Heater/ Proceedings
575
of the International Conference on Computational and Mathematical Methods in Science and Engineering, CMMSE2006 Madrid, 21-25 September 2006, pp.5-5.
6. Makota Kohga, Victor Abrukov, Dmitry Makarov.. Artificial neural networks models of energetic materials burning. Book of Abstracts of The 3rd International Symposium on Energetic Materials and their Applications (24-25 April, 2008, Tokyo, Japan)
7. BaseGroup Lab. Available: www.basegroup.ru 8. Neural Networks for Instrumentation, Measurement and
Related Industrial Applications. Proceedings of the NATO Advanced Study Institute on Neural Networks for Instrumentation, Measurement, and Related Industrial Applications (9-20 October 2001, Crema, Italy)/ Ed. by Sergey Ablameyko, Liviu Goras, Marco Gori and Vincenzo Piuri, IOS Press, Series 3: Computer and Systems Sciences – Vol. 185, 2003. – 329 pp.
9. Abrukov V.S., Malinin G.I., Volkov M.E. Makarov D.N., Ivanov P.V. Application of artificial neural networks for creation of “black box” models of energetic materials combustion. In Book "Advancements in Energetic Materials and Chemical Propulsion/ Ed. By Kenneth K. Kuo and Keiichi Hori, Begell House, Inc. of Redding, USA, Connecticut, 2009.-1136 pp., pp. 377-386.
10. Abrukov V.S., Ya.G. Nikolaeva. Quantitative and qualitative methods: combine and run! SOTZIS (Social Research), Moscow, 2010, N1, p. 142-145.)
11. Victor S. Abrukov, E. V. Karlovich, V. N. Afanasyev, Yu. V. Semenov, & S. V. Abrukov. Сreation of propellant combustion models by means of data mining tools // International Journal of Energetic Materials and Chemical Propulsion. – 2010, 9(5). – pp. 385-396.
576