Data Logger Meteo-40 Plus User's Manual
266
Ammo ni Data Logger Meteo-40 Plus User’s Manual www.ammonit.com measuring wind and solar power
-
Upload
khangminh22 -
Category
Documents
-
view
0 -
download
0
Transcript of Data Logger Meteo-40 Plus User's Manual

AmmoniData Logger Meteo-40 Plus User’s Manual
www.ammonit.com
measuring wind and solar power

Warranty and License Information
All rights reserved.
All our products are carefully examined before delivery. If any problems should occur we will do our bestto ensure that measurements can be resumed in the shortest possible time. In the event of inappropriateuse, mechanical or electrical overloading we provide no warranty. We accept no liability for any form ofconsequential damage.
The right to make alterations is reserved.
Ammonit Measurement GmbHWrangelstraße 10010997BerlinGermany
Linux is a registered trademark of Linus Torvalds. Mozilla Firefox is a registered trademark of the MozillaFoundation. Windows and Internet Explorer are registered trademarks of Microsoft Corp.
Meteo-40 plus includes free software developed by third parties, including software code subject to theGNU General Public License ( GPL). See Chapter 16.7 to view the terms of this license.
To access the source code distributed under the terms of the GPL or the LGPL used in Meteo-40 plus,contact Ammonit.
CautionIn order to ensure that Meteo-40 plus data loggers work properly, some requirements shouldbe met.The data logger can be affected by extreme temperature and humidity conditions. Meteo-40 plus is designed to operate properly at temperatures between -40 °C and +65 °C in non-condensing environments. The display is readable between -20 °C and +70 °C.On site the data logger has to be installed in a robust and weatherproof cabinet (see alsoat www.ammonit.com (http://www.ammonit.com/)). The cabinet protects Meteo-40plus against weather and condensation damage, theft and vandalism. If humidity tolerance isexceeded and moisture penetrates, the electronics of Meteo-40 plus can be damaged. Usersare responsible for effective humidity control.Handle Meteo-40 plus with care, do not drop the device, and avoid mechanical shocks andvibrations to prevent the electronics from being damaged. Do not try to open or break theMeteo-40 plus housing or any of the slots. Avoid permanent pressure on the data logger.To ensure that Meteo-40 plus operates properly, install only equipment, e.g., sensors, adaptersand cables, which is undamaged and approved by Ammonit. Contact Ammonit, if any ques-tions occur.
Date: 2022-07-22Revision: 279© 2011 — 2021 Ammonit Measurement GmbH
ii © 2011 — 2021 Ammonit Measurement GmbH

Data Logger Meteo-40 Plus User’s Manual iii
Contents
1 Introduction 1
1.1 Opening Remarks . . . . . . . . . . . . . . . . . . . . . . . . . . . . . . . . . . . . . . . . . . . . . 1
1.2 Overview of Meteo-40 plus . . . . . . . . . . . . . . . . . . . . . . . . . . . . . . . . . . . . . . . . 1
1.3 Meteo-40 Series . . . . . . . . . . . . . . . . . . . . . . . . . . . . . . . . . . . . . . . . . . . . . . 2
1.4 The Two Systems of Meteo-40 . . . . . . . . . . . . . . . . . . . . . . . . . . . . . . . . . . . . . . 4
1.4.1 CECS: Switch on / off behavior . . . . . . . . . . . . . . . . . . . . . . . . . . . . . . . . . . . 6
1.5 Data Storage . . . . . . . . . . . . . . . . . . . . . . . . . . . . . . . . . . . . . . . . . . . . . . . . 6
1.6 User Interfaces . . . . . . . . . . . . . . . . . . . . . . . . . . . . . . . . . . . . . . . . . . . . . . . 6
1.7 Communication Methods and Required Devices . . . . . . . . . . . . . . . . . . . . . . . . . . . . . 7
2 Getting Started with Meteo-40 plus 9
2.1 Introduction . . . . . . . . . . . . . . . . . . . . . . . . . . . . . . . . . . . . . . . . . . . . . . . . . 9
2.2 Using Bonjour™ on Windows™ . . . . . . . . . . . . . . . . . . . . . . . . . . . . . . . . . . . . . . 12
2.3 Connecting Meteo-40 plus via Ethernet to your LAN . . . . . . . . . . . . . . . . . . . . . . . . . . . 13
2.4 Connecting Meteo-40 plus to your Windows 10™ PC via point-to-point Ethernet connection . . . . . 15
2.4.1 Using link-local connection . . . . . . . . . . . . . . . . . . . . . . . . . . . . . . . . . . . . . . 15
2.4.2 Using static IP address . . . . . . . . . . . . . . . . . . . . . . . . . . . . . . . . . . . . . . . . 16
2.5 Connecting Meteo-40 plus with your Windows 10™ PC via USB . . . . . . . . . . . . . . . . . . . . 20
2.5.1 Standard RNDIS USB Driver . . . . . . . . . . . . . . . . . . . . . . . . . . . . . . . . . . . . 20
2.6 Using Meteo-40 plus with Linux . . . . . . . . . . . . . . . . . . . . . . . . . . . . . . . . . . . . . . 24
3 Login at Meteo-40 25
3.1 Login Options . . . . . . . . . . . . . . . . . . . . . . . . . . . . . . . . . . . . . . . . . . . . . . . . 25
3.2 Global Control Elements . . . . . . . . . . . . . . . . . . . . . . . . . . . . . . . . . . . . . . . . . . 26
3.3 Menu of the Web Interface . . . . . . . . . . . . . . . . . . . . . . . . . . . . . . . . . . . . . . . . . 28
4 System Configuration 29
4.1 System Information . . . . . . . . . . . . . . . . . . . . . . . . . . . . . . . . . . . . . . . . . . . . . 29
4.2 System Administration . . . . . . . . . . . . . . . . . . . . . . . . . . . . . . . . . . . . . . . . . . . 31
4.3 Upgrade Data Logger Software . . . . . . . . . . . . . . . . . . . . . . . . . . . . . . . . . . . . . . 38
4.3.1 Upgrade using a Smartphone . . . . . . . . . . . . . . . . . . . . . . . . . . . . . . . . . . . . 40
4.3.2 Software Upgrade Behind a Firewall . . . . . . . . . . . . . . . . . . . . . . . . . . . . . . . . 41
4.3.3 Offline Upgrade using USB Flash Drive . . . . . . . . . . . . . . . . . . . . . . . . . . . . . . . 41
© 2011 — 2021 Ammonit Measurement GmbH iii

4.3.3.1 Prepare the Offline Upgrade . . . . . . . . . . . . . . . . . . . . . . . . . . . . . . . . . 41
4.3.3.2 Performing the Offline Upgrade . . . . . . . . . . . . . . . . . . . . . . . . . . . . . . . 42
4.4 The Device Page . . . . . . . . . . . . . . . . . . . . . . . . . . . . . . . . . . . . . . . . . . . . . . 42
4.4.1 Display Access . . . . . . . . . . . . . . . . . . . . . . . . . . . . . . . . . . . . . . . . . . . . 42
4.4.2 Connected USB Devices . . . . . . . . . . . . . . . . . . . . . . . . . . . . . . . . . . . . . . . 43
4.4.3 USB Flash Drive Copy . . . . . . . . . . . . . . . . . . . . . . . . . . . . . . . . . . . . . . . . 44
4.4.4 Access to USB Drive Files . . . . . . . . . . . . . . . . . . . . . . . . . . . . . . . . . . . . . . 46
4.5 Using a Camera . . . . . . . . . . . . . . . . . . . . . . . . . . . . . . . . . . . . . . . . . . . . . . 46
4.5.1 Camera Configuration . . . . . . . . . . . . . . . . . . . . . . . . . . . . . . . . . . . . . . . . 47
4.6 Configuring Switches . . . . . . . . . . . . . . . . . . . . . . . . . . . . . . . . . . . . . . . . . . . . 48
4.6.1 Switch manager . . . . . . . . . . . . . . . . . . . . . . . . . . . . . . . . . . . . . . . . . . . 49
4.7 Using the Logbook . . . . . . . . . . . . . . . . . . . . . . . . . . . . . . . . . . . . . . . . . . . . . 51
4.7.1 Logbook Events . . . . . . . . . . . . . . . . . . . . . . . . . . . . . . . . . . . . . . . . . . . 51
5 Measurement 53
5.1 Sensor Configuration . . . . . . . . . . . . . . . . . . . . . . . . . . . . . . . . . . . . . . . . . . . . 53
5.1.1 Difference between Sensors, Channels, and Evaluations . . . . . . . . . . . . . . . . . . . . . 54
5.1.2 Sensor Helper . . . . . . . . . . . . . . . . . . . . . . . . . . . . . . . . . . . . . . . . . . . . 55
5.1.3 Order of Sensors and Evaluations . . . . . . . . . . . . . . . . . . . . . . . . . . . . . . . . . . 57
5.1.4 RS485 Master Serial Console . . . . . . . . . . . . . . . . . . . . . . . . . . . . . . . . . . . . 57
5.2 Measurement Channels . . . . . . . . . . . . . . . . . . . . . . . . . . . . . . . . . . . . . . . . . . 59
5.3 Configuring the Evaluation . . . . . . . . . . . . . . . . . . . . . . . . . . . . . . . . . . . . . . . . . 60
5.3.1 Evaluation Helper . . . . . . . . . . . . . . . . . . . . . . . . . . . . . . . . . . . . . . . . . . . 60
5.3.1.1 Addition . . . . . . . . . . . . . . . . . . . . . . . . . . . . . . . . . . . . . . . . . . . . 61
5.3.1.2 Density of moist air . . . . . . . . . . . . . . . . . . . . . . . . . . . . . . . . . . . . . . 61
5.3.1.3 Albedo . . . . . . . . . . . . . . . . . . . . . . . . . . . . . . . . . . . . . . . . . . . . . 62
5.3.1.4 Ampere meter . . . . . . . . . . . . . . . . . . . . . . . . . . . . . . . . . . . . . . . . 62
5.3.1.5 Differential temperature . . . . . . . . . . . . . . . . . . . . . . . . . . . . . . . . . . . 62
5.3.1.6 Division . . . . . . . . . . . . . . . . . . . . . . . . . . . . . . . . . . . . . . . . . . . . 63
5.3.1.7 Inflow angle . . . . . . . . . . . . . . . . . . . . . . . . . . . . . . . . . . . . . . . . . . 63
5.3.1.8 Linear equation . . . . . . . . . . . . . . . . . . . . . . . . . . . . . . . . . . . . . . . . 63
5.3.1.9 Multiplication . . . . . . . . . . . . . . . . . . . . . . . . . . . . . . . . . . . . . . . . . 63
5.3.1.10Turbulence intensity . . . . . . . . . . . . . . . . . . . . . . . . . . . . . . . . . . . . . 64
5.3.1.11Obukhov length . . . . . . . . . . . . . . . . . . . . . . . . . . . . . . . . . . . . . . . . 64
5.3.1.12Obukhov stability parameter . . . . . . . . . . . . . . . . . . . . . . . . . . . . . . . . . 64
5.3.1.13Sensible heat flux . . . . . . . . . . . . . . . . . . . . . . . . . . . . . . . . . . . . . . . 64
5.3.1.14Solar zenith angle . . . . . . . . . . . . . . . . . . . . . . . . . . . . . . . . . . . . . . 65
5.3.1.15Diffuse solar irradiance (DHI) . . . . . . . . . . . . . . . . . . . . . . . . . . . . . . . . 65
5.3.1.16Total apparent power . . . . . . . . . . . . . . . . . . . . . . . . . . . . . . . . . . . . . 65
iv © 2011 — 2021 Ammonit Measurement GmbH

Data Logger Meteo-40 Plus User’s Manual v
6 Data Evaluation 67
6.1 Introduction . . . . . . . . . . . . . . . . . . . . . . . . . . . . . . . . . . . . . . . . . . . . . . . . . 67
6.2 Live Data Page . . . . . . . . . . . . . . . . . . . . . . . . . . . . . . . . . . . . . . . . . . . . . . . 67
6.2.1 Publishing live data . . . . . . . . . . . . . . . . . . . . . . . . . . . . . . . . . . . . . . . . . . 67
6.3 Statistic Data Files . . . . . . . . . . . . . . . . . . . . . . . . . . . . . . . . . . . . . . . . . . . . . 68
6.3.1 Configuring Statistics and CSV files . . . . . . . . . . . . . . . . . . . . . . . . . . . . . . . . . 69
6.4 Secondary and Tertiary Statistics Files . . . . . . . . . . . . . . . . . . . . . . . . . . . . . . . . . . 72
6.4.1 Secondary Statistics Files . . . . . . . . . . . . . . . . . . . . . . . . . . . . . . . . . . . . . . 73
6.4.2 Tertiary Statistics Files . . . . . . . . . . . . . . . . . . . . . . . . . . . . . . . . . . . . . . . . 73
6.5 Gust Data Files . . . . . . . . . . . . . . . . . . . . . . . . . . . . . . . . . . . . . . . . . . . . . . . 74
6.6 The CSV File Format . . . . . . . . . . . . . . . . . . . . . . . . . . . . . . . . . . . . . . . . . . . . 75
6.6.1 Ammonit Meteo-40 specific details . . . . . . . . . . . . . . . . . . . . . . . . . . . . . . . . . 76
6.6.1.1 Data part (CSV format) . . . . . . . . . . . . . . . . . . . . . . . . . . . . . . . . . . . . 76
6.6.1.2 Information part (Ini file format) . . . . . . . . . . . . . . . . . . . . . . . . . . . . . . . 77
6.6.2 CSV import in LibreOffice or OpenOffice . . . . . . . . . . . . . . . . . . . . . . . . . . . . . . 79
6.6.3 CSV Import in Microsoft Excel 2010™ . . . . . . . . . . . . . . . . . . . . . . . . . . . . . . . 80
6.7 Access to Source Data . . . . . . . . . . . . . . . . . . . . . . . . . . . . . . . . . . . . . . . . . . . 85
7 Communication 87
7.1 Introduction . . . . . . . . . . . . . . . . . . . . . . . . . . . . . . . . . . . . . . . . . . . . . . . . . 87
7.2 Configuring the Communication Schedule . . . . . . . . . . . . . . . . . . . . . . . . . . . . . . . . 89
7.3 Configuring Online Access . . . . . . . . . . . . . . . . . . . . . . . . . . . . . . . . . . . . . . . . . 91
7.4 Configuration for using AmmonitOR . . . . . . . . . . . . . . . . . . . . . . . . . . . . . . . . . . . . 95
7.4.1 Authenticating Meteo-40 at your local AmmonitOR installation . . . . . . . . . . . . . . . . . . 98
7.5 Configuring Email Parameters . . . . . . . . . . . . . . . . . . . . . . . . . . . . . . . . . . . . . . . 98
7.5.1 Signing and Encrypting Emails and Attachments . . . . . . . . . . . . . . . . . . . . . . . . . . 101
7.5.1.1 Working with Gpg4win to Decrypt and Verify Files on Windows™ PCs . . . . . . . . . . 101
7.5.1.2 Verifying digital signatures in the Windows Explorer™ . . . . . . . . . . . . . . . . . . . 104
7.5.1.3 Verifying digital signatures in Microsoft Outlook™ . . . . . . . . . . . . . . . . . . . . . 105
7.5.1.4 Decrypting files in the Windows Explorer™ . . . . . . . . . . . . . . . . . . . . . . . . . 107
7.5.1.5 Decrypting files in Microsoft Outlook™ . . . . . . . . . . . . . . . . . . . . . . . . . . . 109
7.6 Configuring SCP, FTP and SFTP Parameters . . . . . . . . . . . . . . . . . . . . . . . . . . . . . . 110
7.7 Configuring LAN Parameters . . . . . . . . . . . . . . . . . . . . . . . . . . . . . . . . . . . . . . . 113
7.7.1 Configuring a Static IP address in a LAN . . . . . . . . . . . . . . . . . . . . . . . . . . . . . . 114
7.8 Configuring W-LAN . . . . . . . . . . . . . . . . . . . . . . . . . . . . . . . . . . . . . . . . . . . . . 114
7.9 Configuring the Modem . . . . . . . . . . . . . . . . . . . . . . . . . . . . . . . . . . . . . . . . . . 115
7.9.1 Using the Provider Helper . . . . . . . . . . . . . . . . . . . . . . . . . . . . . . . . . . . . . . 118
7.9.2 Short Message Service . . . . . . . . . . . . . . . . . . . . . . . . . . . . . . . . . . . . . . . 119
7.9.2.1 Sending a Short Message . . . . . . . . . . . . . . . . . . . . . . . . . . . . . . . . . . 120
7.9.3 Working with Static IP SIM cards . . . . . . . . . . . . . . . . . . . . . . . . . . . . . . . . . . 120
7.9.4 Two Ways to Establish an Online Connection via Modem . . . . . . . . . . . . . . . . . . . . . 120
© 2011 — 2021 Ammonit Measurement GmbH v

7.9.5 Reset PIN Code of Locked SIM Card . . . . . . . . . . . . . . . . . . . . . . . . . . . . . . . . 121
7.9.6 Connecting a GSM/GPRS Modem to Meteo-40 . . . . . . . . . . . . . . . . . . . . . . . . . . 121
7.9.6.1 Information on Modem Sierra Wireless Airline Fastback Extend EDGE FXT009 . . . . . 121
7.9.7 Connecting a BGAN Satellite Modem to Meteo-40 . . . . . . . . . . . . . . . . . . . . . . . . . 124
7.9.7.1 Pointing the terminal to the satelite . . . . . . . . . . . . . . . . . . . . . . . . . . . . . 124
7.9.7.2 Configuring Meteo-40 with BGAN Satellite Modem . . . . . . . . . . . . . . . . . . . . . 124
7.9.7.3 Recommended Settings for Satellite Connections . . . . . . . . . . . . . . . . . . . . . 125
7.10 Troubleshooting . . . . . . . . . . . . . . . . . . . . . . . . . . . . . . . . . . . . . . . . . . . . . . 126
7.10.1 How to perform the test for tunnel and AmmonitOR . . . . . . . . . . . . . . . . . . . . . . . . 126
8 SCADA 127
8.1 Configuring Meteo-40 for SCADA . . . . . . . . . . . . . . . . . . . . . . . . . . . . . . . . . . . . . 127
8.1.1 CECS power mode . . . . . . . . . . . . . . . . . . . . . . . . . . . . . . . . . . . . . . . . . . 128
8.1.2 Statistics selection . . . . . . . . . . . . . . . . . . . . . . . . . . . . . . . . . . . . . . . . . . 129
8.2 Meteo-40 and Modbus . . . . . . . . . . . . . . . . . . . . . . . . . . . . . . . . . . . . . . . . . . . 130
8.2.1 Input Registers . . . . . . . . . . . . . . . . . . . . . . . . . . . . . . . . . . . . . . . . . . . . 133
8.2.2 Holding Registers . . . . . . . . . . . . . . . . . . . . . . . . . . . . . . . . . . . . . . . . . . . 133
8.3 Cascading two Meteo-40 Data Loggers using RS485 . . . . . . . . . . . . . . . . . . . . . . . . . . 134
8.3.1 Configuration of the slave or slaves . . . . . . . . . . . . . . . . . . . . . . . . . . . . . . . . . 134
8.3.2 Configuration of the master . . . . . . . . . . . . . . . . . . . . . . . . . . . . . . . . . . . . . 135
9 Using the Display 137
9.1 Assigning Permissions to Display Users . . . . . . . . . . . . . . . . . . . . . . . . . . . . . . . . . 137
9.2 LED Lights . . . . . . . . . . . . . . . . . . . . . . . . . . . . . . . . . . . . . . . . . . . . . . . . . 138
9.3 Navigating through the Display Menu . . . . . . . . . . . . . . . . . . . . . . . . . . . . . . . . . . . 138
9.4 Menu: System . . . . . . . . . . . . . . . . . . . . . . . . . . . . . . . . . . . . . . . . . . . . . . . 138
9.5 Menu: Status . . . . . . . . . . . . . . . . . . . . . . . . . . . . . . . . . . . . . . . . . . . . . . . . 139
9.6 Menu: Channels . . . . . . . . . . . . . . . . . . . . . . . . . . . . . . . . . . . . . . . . . . . . . . 139
9.7 Menu: Communication . . . . . . . . . . . . . . . . . . . . . . . . . . . . . . . . . . . . . . . . . . . 142
10 Sensors 145
10.1 Sensors for Wind Resource Assessment and Wind Farm Monitoring . . . . . . . . . . . . . . . . . . 145
10.2 Sensors for Solar Resource Assessment . . . . . . . . . . . . . . . . . . . . . . . . . . . . . . . . . 146
10.3 Other Sensors for Meteorological Purposes . . . . . . . . . . . . . . . . . . . . . . . . . . . . . . . 147
10.4 Devices for Electrical Measurements . . . . . . . . . . . . . . . . . . . . . . . . . . . . . . . . . . . 148
10.5 Research Applications . . . . . . . . . . . . . . . . . . . . . . . . . . . . . . . . . . . . . . . . . . . 148
10.6 Anemometers . . . . . . . . . . . . . . . . . . . . . . . . . . . . . . . . . . . . . . . . . . . . . . . 148
10.6.1 Thies First Class Advanced X . . . . . . . . . . . . . . . . . . . . . . . . . . . . . . . . . . . . 150
10.6.2 Propeller Anemometer Young . . . . . . . . . . . . . . . . . . . . . . . . . . . . . . . . . . . . 152
10.7 Wind Vanes . . . . . . . . . . . . . . . . . . . . . . . . . . . . . . . . . . . . . . . . . . . . . . . . . 152
10.7.1 Digital Wind Vanes TMR . . . . . . . . . . . . . . . . . . . . . . . . . . . . . . . . . . . . . . . 152
10.7.2 Wind Vanes with Potentiometer . . . . . . . . . . . . . . . . . . . . . . . . . . . . . . . . . . . 153
vi © 2011 — 2021 Ammonit Measurement GmbH

Data Logger Meteo-40 Plus User’s Manual vii
10.7.3 Wind Vanes connected to RS485-M . . . . . . . . . . . . . . . . . . . . . . . . . . . . . . . . . 154
10.7.4 Kintech Geovane™ . . . . . . . . . . . . . . . . . . . . . . . . . . . . . . . . . . . . . . . . . . 155
10.8 Ultrasonic Anemometers . . . . . . . . . . . . . . . . . . . . . . . . . . . . . . . . . . . . . . . . . . 155
10.8.1 NMEA MWV V 2.0 . . . . . . . . . . . . . . . . . . . . . . . . . . . . . . . . . . . . . . . . . . 156
10.8.2 Thies Ultrasonic Configuration Options . . . . . . . . . . . . . . . . . . . . . . . . . . . . . . . 156
10.8.3 Lufft UMB Configuration Tool . . . . . . . . . . . . . . . . . . . . . . . . . . . . . . . . . . . . 157
10.8.4 Gill Wind Configuration Tool . . . . . . . . . . . . . . . . . . . . . . . . . . . . . . . . . . . . . 157
10.9 Weather and Environmental Integrated Monitoring Stations . . . . . . . . . . . . . . . . . . . . . . . 158
10.10 Temperature Humidity Sensors . . . . . . . . . . . . . . . . . . . . . . . . . . . . . . . . . . . . . . 160
10.10.1 Resistance Temperature Detectors (RTD) / Pt100 / Pt1000 . . . . . . . . . . . . . . . . . . . . 161
10.10.2 Temperature Humidity Sensors connected to RS485-M . . . . . . . . . . . . . . . . . . . . . . 161
10.11 Barometric Pressure Sensors . . . . . . . . . . . . . . . . . . . . . . . . . . . . . . . . . . . . . . . 162
10.11.1 Barometric Pressure Sensors connected to RS485-M . . . . . . . . . . . . . . . . . . . . . . . 163
10.12 Solar Sensors . . . . . . . . . . . . . . . . . . . . . . . . . . . . . . . . . . . . . . . . . . . . . . . 163
10.12.1 Pyranometers . . . . . . . . . . . . . . . . . . . . . . . . . . . . . . . . . . . . . . . . . . . . . 163
10.12.2 Delta-T Sunshine SPN 1 . . . . . . . . . . . . . . . . . . . . . . . . . . . . . . . . . . . . . . . 165
10.12.3 Pyrheliometers . . . . . . . . . . . . . . . . . . . . . . . . . . . . . . . . . . . . . . . . . . . . 166
10.12.4 Sunshine Duration Sensors . . . . . . . . . . . . . . . . . . . . . . . . . . . . . . . . . . . . . 167
10.12.5 Solar Trackers . . . . . . . . . . . . . . . . . . . . . . . . . . . . . . . . . . . . . . . . . . . . 168
10.12.6 Rotating Shadowband Irradiometer . . . . . . . . . . . . . . . . . . . . . . . . . . . . . . . . . 168
10.12.7 Reference Cell . . . . . . . . . . . . . . . . . . . . . . . . . . . . . . . . . . . . . . . . . . . . 169
10.13 Precipitation Sensors . . . . . . . . . . . . . . . . . . . . . . . . . . . . . . . . . . . . . . . . . . . 169
10.13.1 Rain Gauge . . . . . . . . . . . . . . . . . . . . . . . . . . . . . . . . . . . . . . . . . . . . . . 169
10.13.2 Laser Precipitation Monitors . . . . . . . . . . . . . . . . . . . . . . . . . . . . . . . . . . . . . 170
10.14 Multifunction Transducer, Power Meters and other Electrical Measurement Devices . . . . . . . . . . 171
10.14.1 Sineax CAM Measuring Unit . . . . . . . . . . . . . . . . . . . . . . . . . . . . . . . . . . . . . 171
10.15 Remote Sensing . . . . . . . . . . . . . . . . . . . . . . . . . . . . . . . . . . . . . . . . . . . . . . 171
10.15.1 ZephIR 300 Lidar . . . . . . . . . . . . . . . . . . . . . . . . . . . . . . . . . . . . . . . . . . . 171
10.16 Bats Detection . . . . . . . . . . . . . . . . . . . . . . . . . . . . . . . . . . . . . . . . . . . . . . . 172
10.16.1 Song Meter SM3BAT/SM4BAT . . . . . . . . . . . . . . . . . . . . . . . . . . . . . . . . . . . 172
10.17 Lightning Detector . . . . . . . . . . . . . . . . . . . . . . . . . . . . . . . . . . . . . . . . . . . . . 173
10.17.1 SG1000 Lightning Detector . . . . . . . . . . . . . . . . . . . . . . . . . . . . . . . . . . . . . 173
10.18 Soil Water Content . . . . . . . . . . . . . . . . . . . . . . . . . . . . . . . . . . . . . . . . . . . . . 174
10.19 Soiling Measurement . . . . . . . . . . . . . . . . . . . . . . . . . . . . . . . . . . . . . . . . . . . . 175
10.19.1 Atonometrics RDE300 . . . . . . . . . . . . . . . . . . . . . . . . . . . . . . . . . . . . . . . . 175
10.19.2 Ammonit Soiling Measurement Kit SD2100 . . . . . . . . . . . . . . . . . . . . . . . . . . . . . 175
10.19.3 Kipp & Zonen DustIQ . . . . . . . . . . . . . . . . . . . . . . . . . . . . . . . . . . . . . . . . . 176
10.20 Other RS485 Sensors . . . . . . . . . . . . . . . . . . . . . . . . . . . . . . . . . . . . . . . . . . . 177
10.20.1 RS485 Multiplexer . . . . . . . . . . . . . . . . . . . . . . . . . . . . . . . . . . . . . . . . . . 178
10.20.2 Configuring generic Modbus RTU sensors . . . . . . . . . . . . . . . . . . . . . . . . . . . . . 179
© 2011 — 2021 Ammonit Measurement GmbH vii

11 Channels 183
11.1 Connecting Sensors to Analog Voltage Channels . . . . . . . . . . . . . . . . . . . . . . . . . . . . 183
11.2 Connecting Sensors to Counter / Period Channels . . . . . . . . . . . . . . . . . . . . . . . . . . . . 184
11.2.1 Period measurement . . . . . . . . . . . . . . . . . . . . . . . . . . . . . . . . . . . . . . . . . 184
11.3 Connecting Sensors to Digital Channels . . . . . . . . . . . . . . . . . . . . . . . . . . . . . . . . . 185
11.3.1 Functionality Check of Clock Output . . . . . . . . . . . . . . . . . . . . . . . . . . . . . . . . . 185
11.4 Connecting Sensors to Analog Current Channels . . . . . . . . . . . . . . . . . . . . . . . . . . . . 187
11.5 Connecting Sensors to Current Source . . . . . . . . . . . . . . . . . . . . . . . . . . . . . . . . . . 188
11.6 Connecting Sensors to RS485-M . . . . . . . . . . . . . . . . . . . . . . . . . . . . . . . . . . . . . 188
11.6.1 SDI-12 sensors . . . . . . . . . . . . . . . . . . . . . . . . . . . . . . . . . . . . . . . . . . . . 189
11.7 Using the Switches . . . . . . . . . . . . . . . . . . . . . . . . . . . . . . . . . . . . . . . . . . . . . 189
12 Technical Data 191
12.1 Specification . . . . . . . . . . . . . . . . . . . . . . . . . . . . . . . . . . . . . . . . . . . . . . . . 191
12.2 Electrical Characteristics . . . . . . . . . . . . . . . . . . . . . . . . . . . . . . . . . . . . . . . . . . 192
12.2.1 Electrical Specifications of Analog Voltage Channels / Differential Inputs . . . . . . . . . . . . . 193
12.2.2 Electrical Specifications of Analog Current Channels / Differential Inputs . . . . . . . . . . . . . 193
12.2.3 Electrical Specifications of Internal Measurements . . . . . . . . . . . . . . . . . . . . . . . . . 194
12.2.4 Electrical Specifications of Counter Channels / Non-Differential Inputs . . . . . . . . . . . . . . 194
12.2.5 Electrical Specifications of Digital Channels (Serial Input / Output) . . . . . . . . . . . . . . . . 194
12.2.6 Electrical Specifications for Digital Clock Output . . . . . . . . . . . . . . . . . . . . . . . . . . 195
12.2.7 Electrical Specifications for Analog Current Source . . . . . . . . . . . . . . . . . . . . . . . . 195
12.2.8 Electrical Specifications for Switches . . . . . . . . . . . . . . . . . . . . . . . . . . . . . . . . 195
12.2.9 Electrical Specifications of the 5 V Output . . . . . . . . . . . . . . . . . . . . . . . . . . . . . 196
12.2.10 Electrical Specifications of the RS485 Interface . . . . . . . . . . . . . . . . . . . . . . . . . . 196
12.2.11 Electrical Specification of the Ethernet Interface . . . . . . . . . . . . . . . . . . . . . . . . . . 196
12.2.12 Electrical Specification of the RS232 Interface . . . . . . . . . . . . . . . . . . . . . . . . . . . 196
12.2.13 Electrical Specification of the Power Supply . . . . . . . . . . . . . . . . . . . . . . . . . . . . 197
13 Electrical Connection Plans 199
14 Cryptographic Software 217
15 Maintenance and Care 219
15.1 Operation and Storage . . . . . . . . . . . . . . . . . . . . . . . . . . . . . . . . . . . . . . . . . . . 219
15.2 Overvoltage / Lightning Protection . . . . . . . . . . . . . . . . . . . . . . . . . . . . . . . . . . . . 219
16 Frequently Asked Questions 221
16.1 Local Communication . . . . . . . . . . . . . . . . . . . . . . . . . . . . . . . . . . . . . . . . . . . 221
16.2 Remote Communication . . . . . . . . . . . . . . . . . . . . . . . . . . . . . . . . . . . . . . . . . . 222
16.2.1 Modem . . . . . . . . . . . . . . . . . . . . . . . . . . . . . . . . . . . . . . . . . . . . . . . . 222
16.2.2 Ammonit Tunnel . . . . . . . . . . . . . . . . . . . . . . . . . . . . . . . . . . . . . . . . . . . 223
16.3 Firmware Upgrade . . . . . . . . . . . . . . . . . . . . . . . . . . . . . . . . . . . . . . . . . . . . . 224
viii © 2011 — 2021 Ammonit Measurement GmbH

Data Logger Meteo-40 Plus User’s Manual ix
16.4 Data: Format, Transfer and Download . . . . . . . . . . . . . . . . . . . . . . . . . . . . . . . . . . 225
16.5 Sensor: Configuration and Connection . . . . . . . . . . . . . . . . . . . . . . . . . . . . . . . . . . 225
16.5.1 Sensor Configuration . . . . . . . . . . . . . . . . . . . . . . . . . . . . . . . . . . . . . . . . . 225
16.5.2 Sensor Connection . . . . . . . . . . . . . . . . . . . . . . . . . . . . . . . . . . . . . . . . . . 226
16.6 Measurement . . . . . . . . . . . . . . . . . . . . . . . . . . . . . . . . . . . . . . . . . . . . . . . . 226
16.7 Errors and Messages . . . . . . . . . . . . . . . . . . . . . . . . . . . . . . . . . . . . . . . . . . . 227
Release Notes 229
Version 2.1.4 (2022-07-22) . . . . . . . . . . . . . . . . . . . . . . . . . . . . . . . . . . . . . . . . . . . . . 229
Version 2.1.3 (2022-07-07) . . . . . . . . . . . . . . . . . . . . . . . . . . . . . . . . . . . . . . . . . . . . . 229
Version 2.1.1 (2022-04-08) . . . . . . . . . . . . . . . . . . . . . . . . . . . . . . . . . . . . . . . . . . . . . 229
Version 2.1.0 (2022-02-02) . . . . . . . . . . . . . . . . . . . . . . . . . . . . . . . . . . . . . . . . . . . . . 230
Version 2.0.14 (2021-10-28) . . . . . . . . . . . . . . . . . . . . . . . . . . . . . . . . . . . . . . . . . . . . 230
Version 2.0.13 (2021-10-20) . . . . . . . . . . . . . . . . . . . . . . . . . . . . . . . . . . . . . . . . . . . . 230
Version 2.0.12 (2021-08-23) . . . . . . . . . . . . . . . . . . . . . . . . . . . . . . . . . . . . . . . . . . . . 230
Version 2.0.11 (2021-08-17) . . . . . . . . . . . . . . . . . . . . . . . . . . . . . . . . . . . . . . . . . . . . 230
Version 2.0.10 (2021-07-12) . . . . . . . . . . . . . . . . . . . . . . . . . . . . . . . . . . . . . . . . . . . . 231
Version 2.0.9 (2021-07-08) . . . . . . . . . . . . . . . . . . . . . . . . . . . . . . . . . . . . . . . . . . . . . 231
Version 2.0.8 (2021-06-14) . . . . . . . . . . . . . . . . . . . . . . . . . . . . . . . . . . . . . . . . . . . . . 231
Version 2.0.7 (2021-05-20) . . . . . . . . . . . . . . . . . . . . . . . . . . . . . . . . . . . . . . . . . . . . . 231
Version 2.0.6 (2021-05-20) . . . . . . . . . . . . . . . . . . . . . . . . . . . . . . . . . . . . . . . . . . . . . 232
Version 2.0.5 (2021-03-24) . . . . . . . . . . . . . . . . . . . . . . . . . . . . . . . . . . . . . . . . . . . . . 232
Version 2.0.4 (2021-02-16) . . . . . . . . . . . . . . . . . . . . . . . . . . . . . . . . . . . . . . . . . . . . . 232
Version 2.0.3 (2021-02-01) . . . . . . . . . . . . . . . . . . . . . . . . . . . . . . . . . . . . . . . . . . . . . 232
Version 2.0.2 (2020-12-15) . . . . . . . . . . . . . . . . . . . . . . . . . . . . . . . . . . . . . . . . . . . . . 233
Version 2.0.1 (2020-11-26) . . . . . . . . . . . . . . . . . . . . . . . . . . . . . . . . . . . . . . . . . . . . . 233
Version 2.0.0 (2020-10-30) . . . . . . . . . . . . . . . . . . . . . . . . . . . . . . . . . . . . . . . . . . . . . 233
Known Problems . . . . . . . . . . . . . . . . . . . . . . . . . . . . . . . . . . . . . . . . . . . . . . . . . . 233
Older releases . . . . . . . . . . . . . . . . . . . . . . . . . . . . . . . . . . . . . . . . . . . . . . . . . . . . 233
GNU General Public License 235
Preamble . . . . . . . . . . . . . . . . . . . . . . . . . . . . . . . . . . . . . . . . . . . . . . . . . . . . . . 235
TERMS AND CONDITIONS FOR COPYING, DISTRIBUTION AND MODIFICATION . . . . . . . . . . . . . 235
Section 0 . . . . . . . . . . . . . . . . . . . . . . . . . . . . . . . . . . . . . . . . . . . . . . . . . . . . 235
Section 1 . . . . . . . . . . . . . . . . . . . . . . . . . . . . . . . . . . . . . . . . . . . . . . . . . . . . 236
Section 2 . . . . . . . . . . . . . . . . . . . . . . . . . . . . . . . . . . . . . . . . . . . . . . . . . . . . 236
Section 3 . . . . . . . . . . . . . . . . . . . . . . . . . . . . . . . . . . . . . . . . . . . . . . . . . . . . 236
Section 4 . . . . . . . . . . . . . . . . . . . . . . . . . . . . . . . . . . . . . . . . . . . . . . . . . . . . 237
Section 5 . . . . . . . . . . . . . . . . . . . . . . . . . . . . . . . . . . . . . . . . . . . . . . . . . . . . 237
Section 6 . . . . . . . . . . . . . . . . . . . . . . . . . . . . . . . . . . . . . . . . . . . . . . . . . . . . 237
Section 7 . . . . . . . . . . . . . . . . . . . . . . . . . . . . . . . . . . . . . . . . . . . . . . . . . . . . 237
Section 8 . . . . . . . . . . . . . . . . . . . . . . . . . . . . . . . . . . . . . . . . . . . . . . . . . . . . 238
© 2011 — 2021 Ammonit Measurement GmbH ix

Section 9 . . . . . . . . . . . . . . . . . . . . . . . . . . . . . . . . . . . . . . . . . . . . . . . . . . . . 238
Section 10 . . . . . . . . . . . . . . . . . . . . . . . . . . . . . . . . . . . . . . . . . . . . . . . . . . . 238
NO WARRANTY Section 11 . . . . . . . . . . . . . . . . . . . . . . . . . . . . . . . . . . . . . . . . . 238
Section 12 . . . . . . . . . . . . . . . . . . . . . . . . . . . . . . . . . . . . . . . . . . . . . . . . . . . 238
How to Apply These Terms to Your New Programs . . . . . . . . . . . . . . . . . . . . . . . . . . . . . . . . 239
17 Glossary 241
18 Index 244
x © 2011 — 2021 Ammonit Measurement GmbH

Data Logger Meteo-40 Plus User’s Manual xi
List of Figures
1.1 Overview of Meteo-40L . . . . . . . . . . . . . . . . . . . . . . . . . . . . . . . . . . . . . . . . . . 2
1.2 Meteo-40L Terminal . . . . . . . . . . . . . . . . . . . . . . . . . . . . . . . . . . . . . . . . . . . . 3
1.3 Meteo-40M Terminal . . . . . . . . . . . . . . . . . . . . . . . . . . . . . . . . . . . . . . . . . . . . 4
1.4 Meteo-40S Terminal . . . . . . . . . . . . . . . . . . . . . . . . . . . . . . . . . . . . . . . . . . . . 4
1.5 Block diagram of Meteo-40 . . . . . . . . . . . . . . . . . . . . . . . . . . . . . . . . . . . . . . . . 5
2.1 Accessing Meteo-40 plus via LAN (see Section 2.3) . . . . . . . . . . . . . . . . . . . . . . . . . . . 10
2.2 Accessing Meteo-40 plus via Point-to-Point Ethernet Connection (see Section 2.4) . . . . . . . . . . 10
2.3 Accessing Meteo-40 plus via USB-B(see Section 2.5) . . . . . . . . . . . . . . . . . . . . . . . . . . 11
2.4 Ethernet / USB ports of Meteo-40 plusL . . . . . . . . . . . . . . . . . . . . . . . . . . . . . . . . . 12
2.5 Meteo-40 plus web interface initial screen . . . . . . . . . . . . . . . . . . . . . . . . . . . . . . . . 13
2.6 Firefox Connection Untrusted alert page . . . . . . . . . . . . . . . . . . . . . . . . . . . . . . . . . 14
2.7 Add Security Exception . . . . . . . . . . . . . . . . . . . . . . . . . . . . . . . . . . . . . . . . . . 14
2.8 Meteo-40 plus web interface initial screen . . . . . . . . . . . . . . . . . . . . . . . . . . . . . . . . 15
2.9 Meteo-40 plus display with activated link-local connection . . . . . . . . . . . . . . . . . . . . . . . . 16
2.10 Network and Sharing Center of Windows 7™ . . . . . . . . . . . . . . . . . . . . . . . . . . . . . . 16
2.11 LAN Connection Status . . . . . . . . . . . . . . . . . . . . . . . . . . . . . . . . . . . . . . . . . . 17
2.12 Properties of LAN Connection . . . . . . . . . . . . . . . . . . . . . . . . . . . . . . . . . . . . . . . 17
2.13 Properties of Internet Protocol . . . . . . . . . . . . . . . . . . . . . . . . . . . . . . . . . . . . . . . 18
2.14 Meteo-40 plus display with activated link-local connection . . . . . . . . . . . . . . . . . . . . . . . . 18
2.15 Mozilla Firefox Connection Untrusted Alert Page . . . . . . . . . . . . . . . . . . . . . . . . . . . . . 19
2.16 Add Security Exception . . . . . . . . . . . . . . . . . . . . . . . . . . . . . . . . . . . . . . . . . . 19
2.17 Meteo-40 plus web interface initial screen . . . . . . . . . . . . . . . . . . . . . . . . . . . . . . . . 20
2.18 Unpack Windows Driver Software . . . . . . . . . . . . . . . . . . . . . . . . . . . . . . . . . . . . . 21
2.19 Select Installation of RNDIS Driver . . . . . . . . . . . . . . . . . . . . . . . . . . . . . . . . . . . . 21
2.20 Confirm Security Warning . . . . . . . . . . . . . . . . . . . . . . . . . . . . . . . . . . . . . . . . . 22
2.21 Confirm Operation Successful . . . . . . . . . . . . . . . . . . . . . . . . . . . . . . . . . . . . . . . 22
2.22 Firefox Connection Untrusted alert page . . . . . . . . . . . . . . . . . . . . . . . . . . . . . . . . . 23
2.23 Add Security Exception . . . . . . . . . . . . . . . . . . . . . . . . . . . . . . . . . . . . . . . . . . 24
2.24 Meteo-40 plus web interface initial screen . . . . . . . . . . . . . . . . . . . . . . . . . . . . . . . . 24
3.1 Login Screen . . . . . . . . . . . . . . . . . . . . . . . . . . . . . . . . . . . . . . . . . . . . . . . . 25
© 2011 — 2021 Ammonit Measurement GmbH xi

3.2 Meteo-40 Status Box displaying Status of Recording . . . . . . . . . . . . . . . . . . . . . . . . . . 27
3.3 Meteo-40 Status Box displaying Connection and Power Mode . . . . . . . . . . . . . . . . . . . . . 27
4.1 System Information Page . . . . . . . . . . . . . . . . . . . . . . . . . . . . . . . . . . . . . . . . . 30
4.2 Assigning a Data Logger Name . . . . . . . . . . . . . . . . . . . . . . . . . . . . . . . . . . . . . . 31
4.3 Configuring the CECS always active Power Mode . . . . . . . . . . . . . . . . . . . . . . . . . . . . 32
4.4 Configuring Date, Time and Location of the Data Logger . . . . . . . . . . . . . . . . . . . . . . . . 33
4.5 Data Logger Location displayed in Google Earth™ . . . . . . . . . . . . . . . . . . . . . . . . . . . 34
4.6 User List . . . . . . . . . . . . . . . . . . . . . . . . . . . . . . . . . . . . . . . . . . . . . . . . . . 34
4.7 Add a New User . . . . . . . . . . . . . . . . . . . . . . . . . . . . . . . . . . . . . . . . . . . . . . 35
4.8 User List with Custom User . . . . . . . . . . . . . . . . . . . . . . . . . . . . . . . . . . . . . . . . 35
4.9 Signing and Encryption . . . . . . . . . . . . . . . . . . . . . . . . . . . . . . . . . . . . . . . . . . 36
4.10 Allow Manufacturer Administration . . . . . . . . . . . . . . . . . . . . . . . . . . . . . . . . . . . . 37
4.11 Deleting All Measurement Data . . . . . . . . . . . . . . . . . . . . . . . . . . . . . . . . . . . . . . 37
4.12 Factory Reset . . . . . . . . . . . . . . . . . . . . . . . . . . . . . . . . . . . . . . . . . . . . . . . 38
4.13 System Upgrade . . . . . . . . . . . . . . . . . . . . . . . . . . . . . . . . . . . . . . . . . . . . . . 39
4.14 System Upgrade . . . . . . . . . . . . . . . . . . . . . . . . . . . . . . . . . . . . . . . . . . . . . . 40
4.15 Settings for Firmware Upgrade via Tethering . . . . . . . . . . . . . . . . . . . . . . . . . . . . . . . 40
4.16 Tethering Settings of an Android™ smartphone . . . . . . . . . . . . . . . . . . . . . . . . . . . . . 41
4.17 Press the right arrow button . . . . . . . . . . . . . . . . . . . . . . . . . . . . . . . . . . . . . . . . 42
4.18 Reading the image . . . . . . . . . . . . . . . . . . . . . . . . . . . . . . . . . . . . . . . . . . . . . 42
4.19 Successful upgrade . . . . . . . . . . . . . . . . . . . . . . . . . . . . . . . . . . . . . . . . . . . . 42
4.20 Remote Display . . . . . . . . . . . . . . . . . . . . . . . . . . . . . . . . . . . . . . . . . . . . . . 43
4.21 Display Settings . . . . . . . . . . . . . . . . . . . . . . . . . . . . . . . . . . . . . . . . . . . . . . 43
4.22 Configuring the USB Flash Drive Copy . . . . . . . . . . . . . . . . . . . . . . . . . . . . . . . . . . 44
4.23 Formatting the USB flash drive ( Windows™ PC) . . . . . . . . . . . . . . . . . . . . . . . . . . . . 44
4.24 Camera Image . . . . . . . . . . . . . . . . . . . . . . . . . . . . . . . . . . . . . . . . . . . . . . . 47
4.25 Attaching Camera Images . . . . . . . . . . . . . . . . . . . . . . . . . . . . . . . . . . . . . . . . . 48
4.26 Switch Configuration . . . . . . . . . . . . . . . . . . . . . . . . . . . . . . . . . . . . . . . . . . . . 49
4.27 Switch Manager . . . . . . . . . . . . . . . . . . . . . . . . . . . . . . . . . . . . . . . . . . . . . . 50
4.28 Logbook . . . . . . . . . . . . . . . . . . . . . . . . . . . . . . . . . . . . . . . . . . . . . . . . . . 51
5.1 Sensor Definitions . . . . . . . . . . . . . . . . . . . . . . . . . . . . . . . . . . . . . . . . . . . . . 53
5.2 Sensor Helper with Sensor Settings . . . . . . . . . . . . . . . . . . . . . . . . . . . . . . . . . . . . 56
5.3 RS485-M Serial Console . . . . . . . . . . . . . . . . . . . . . . . . . . . . . . . . . . . . . . . . . . 58
5.4 Measurement Channels Overview . . . . . . . . . . . . . . . . . . . . . . . . . . . . . . . . . . . . 59
5.5 Screenshot of the Configuration for the Evaluation . . . . . . . . . . . . . . . . . . . . . . . . . . . . 60
5.6 Evaluation for Air Density . . . . . . . . . . . . . . . . . . . . . . . . . . . . . . . . . . . . . . . . . 62
5.7 Evaluation for Differential Temperature . . . . . . . . . . . . . . . . . . . . . . . . . . . . . . . . . . 63
6.1 Downloading Statistics . . . . . . . . . . . . . . . . . . . . . . . . . . . . . . . . . . . . . . . . . . . 69
6.2 Configuring the Statistics . . . . . . . . . . . . . . . . . . . . . . . . . . . . . . . . . . . . . . . . . 70
xii © 2011 — 2021 Ammonit Measurement GmbH

Data Logger Meteo-40 Plus User’s Manual xiii
6.3 Vectorial Calculation for the Wind Direction . . . . . . . . . . . . . . . . . . . . . . . . . . . . . . . . 71
6.4 Statistics Configuration Page . . . . . . . . . . . . . . . . . . . . . . . . . . . . . . . . . . . . . . . 72
6.5 Secondary Statistics Page . . . . . . . . . . . . . . . . . . . . . . . . . . . . . . . . . . . . . . . . . 73
6.6 Tertiary Statistics Page . . . . . . . . . . . . . . . . . . . . . . . . . . . . . . . . . . . . . . . . . . . 74
6.7 Gust Data Calendar . . . . . . . . . . . . . . . . . . . . . . . . . . . . . . . . . . . . . . . . . . . . 75
6.8 Gust Evaluations Selection . . . . . . . . . . . . . . . . . . . . . . . . . . . . . . . . . . . . . . . . 75
6.9 LibreOffice CSV-file import settings . . . . . . . . . . . . . . . . . . . . . . . . . . . . . . . . . . . . 80
6.10 Microsoft Excel 2010™ CSV Import (1) . . . . . . . . . . . . . . . . . . . . . . . . . . . . . . . . . . 81
6.11 Microsoft Excel 2010™ CSV Import (2) . . . . . . . . . . . . . . . . . . . . . . . . . . . . . . . . . . 82
6.12 Microsoft Excel 2010™ CSV Import (3) . . . . . . . . . . . . . . . . . . . . . . . . . . . . . . . . . . 82
6.13 Microsoft Excel 2010™ CSV Import (4) . . . . . . . . . . . . . . . . . . . . . . . . . . . . . . . . . . 83
6.14 Microsoft Excel 2010™ CSV Import (5) . . . . . . . . . . . . . . . . . . . . . . . . . . . . . . . . . . 84
6.15 Microsoft Excel 2010™ CSV Import (6) . . . . . . . . . . . . . . . . . . . . . . . . . . . . . . . . . . 84
6.16 Microsoft Excel 2010™ Format Cells . . . . . . . . . . . . . . . . . . . . . . . . . . . . . . . . . . . 85
6.17 Screenshot of the Source Data Page . . . . . . . . . . . . . . . . . . . . . . . . . . . . . . . . . . . 86
7.1 Configuring the Schedule . . . . . . . . . . . . . . . . . . . . . . . . . . . . . . . . . . . . . . . . . 90
7.2 Communication between Meteo-40 and PC via AmmonitConnect . . . . . . . . . . . . . . . . . . . . 92
7.3 Configuring the Online Access . . . . . . . . . . . . . . . . . . . . . . . . . . . . . . . . . . . . . . 92
7.4 Entering the AmmonitConnect Access Code . . . . . . . . . . . . . . . . . . . . . . . . . . . . . . . 94
7.5 Communication via AmmonitConnect (closed tunnel) . . . . . . . . . . . . . . . . . . . . . . . . . . 95
7.6 AmmonitOR Settings . . . . . . . . . . . . . . . . . . . . . . . . . . . . . . . . . . . . . . . . . . . . 96
7.7 Connection Log in AmmonitOR . . . . . . . . . . . . . . . . . . . . . . . . . . . . . . . . . . . . . . 97
7.8 Configuring Email Parameters . . . . . . . . . . . . . . . . . . . . . . . . . . . . . . . . . . . . . . . 100
7.9 Importing the Public key into Gpg4win . . . . . . . . . . . . . . . . . . . . . . . . . . . . . . . . . . 102
7.10 Creating the private key . . . . . . . . . . . . . . . . . . . . . . . . . . . . . . . . . . . . . . . . . . 103
7.11 Certifying the Public key . . . . . . . . . . . . . . . . . . . . . . . . . . . . . . . . . . . . . . . . . . 103
7.12 Verifying the Fingerprint . . . . . . . . . . . . . . . . . . . . . . . . . . . . . . . . . . . . . . . . . . 104
7.13 Trusted Certificates . . . . . . . . . . . . . . . . . . . . . . . . . . . . . . . . . . . . . . . . . . . . 104
7.14 Verifying signed files . . . . . . . . . . . . . . . . . . . . . . . . . . . . . . . . . . . . . . . . . . . . 105
7.15 Successfully verified signature . . . . . . . . . . . . . . . . . . . . . . . . . . . . . . . . . . . . . . 105
7.16 Verifying files in Microsoft Outlook™ . . . . . . . . . . . . . . . . . . . . . . . . . . . . . . . . . . . 106
7.17 Verifying signatures in Microsoft Outlook™ . . . . . . . . . . . . . . . . . . . . . . . . . . . . . . . . 106
7.18 Successful validation of the signature . . . . . . . . . . . . . . . . . . . . . . . . . . . . . . . . . . . 107
7.19 Verifying signed test mails . . . . . . . . . . . . . . . . . . . . . . . . . . . . . . . . . . . . . . . . . 107
7.20 Decrypting files via the GpgEx plug-in for Windows Explorer™ . . . . . . . . . . . . . . . . . . . . . 108
7.21 Decryption via Kleopatra Software . . . . . . . . . . . . . . . . . . . . . . . . . . . . . . . . . . . . 108
7.22 Password Prompt for Decryption . . . . . . . . . . . . . . . . . . . . . . . . . . . . . . . . . . . . . 109
7.23 Successful File Decryption . . . . . . . . . . . . . . . . . . . . . . . . . . . . . . . . . . . . . . . . . 109
7.24 GgpOL add-in in Microsoft Outlook™ . . . . . . . . . . . . . . . . . . . . . . . . . . . . . . . . . . . 110
7.25 Configuring the Remote Copy Parameters . . . . . . . . . . . . . . . . . . . . . . . . . . . . . . . . 112
© 2011 — 2021 Ammonit Measurement GmbH xiii

7.26 Configuring LAN parameters . . . . . . . . . . . . . . . . . . . . . . . . . . . . . . . . . . . . . . . 113
7.27 Configuring a Static IP Address in a LAN . . . . . . . . . . . . . . . . . . . . . . . . . . . . . . . . . 114
7.28 Configuring W-LAN Parameters . . . . . . . . . . . . . . . . . . . . . . . . . . . . . . . . . . . . . . 115
7.29 Modem Configuration . . . . . . . . . . . . . . . . . . . . . . . . . . . . . . . . . . . . . . . . . . . 116
7.30 Meteo-40 Provider Helper . . . . . . . . . . . . . . . . . . . . . . . . . . . . . . . . . . . . . . . . . 119
7.31 Settings for Short Message Service . . . . . . . . . . . . . . . . . . . . . . . . . . . . . . . . . . . . 119
7.32 Inserting SIM Card into modem Fastback Extend EDGE FXT009 . . . . . . . . . . . . . . . . . . . . 122
7.33 Device Manager . . . . . . . . . . . . . . . . . . . . . . . . . . . . . . . . . . . . . . . . . . . . . . 122
7.34 Modem Properties . . . . . . . . . . . . . . . . . . . . . . . . . . . . . . . . . . . . . . . . . . . . . 123
7.35 PuTTY Configuration . . . . . . . . . . . . . . . . . . . . . . . . . . . . . . . . . . . . . . . . . . . . 123
7.36 PuTTY Command Window . . . . . . . . . . . . . . . . . . . . . . . . . . . . . . . . . . . . . . . . 124
7.37 Check BGAN optimal settings . . . . . . . . . . . . . . . . . . . . . . . . . . . . . . . . . . . . . . . 125
7.38 Select ”Communication” . . . . . . . . . . . . . . . . . . . . . . . . . . . . . . . . . . . . . . . . . . 126
7.39 Select ”Check Connection” . . . . . . . . . . . . . . . . . . . . . . . . . . . . . . . . . . . . . . . . 126
7.40 View results of check . . . . . . . . . . . . . . . . . . . . . . . . . . . . . . . . . . . . . . . . . . . . 126
8.1 Configuring SCADA Parameters . . . . . . . . . . . . . . . . . . . . . . . . . . . . . . . . . . . . . 127
8.2 Configuring CECS always active mode for SCADA . . . . . . . . . . . . . . . . . . . . . . . . . . . 129
8.3 SCADA Modbus Register Table . . . . . . . . . . . . . . . . . . . . . . . . . . . . . . . . . . . . . . 131
9.1 Use of the Meteo-40 buttons . . . . . . . . . . . . . . . . . . . . . . . . . . . . . . . . . . . . . . . . 137
10.1 Generic Modbus RTU sensor configuration . . . . . . . . . . . . . . . . . . . . . . . . . . . . . . . . 180
11.1 Illustration of Period, Pulse Width and Duty Cycle. . . . . . . . . . . . . . . . . . . . . . . . . . . . . 185
11.2 Configuration Menu for CLK-Line Test in Meteo-40. . . . . . . . . . . . . . . . . . . . . . . . . . . . 186
11.3 Setup for CLK-Line test of Serial Interface. . . . . . . . . . . . . . . . . . . . . . . . . . . . . . . . . 187
11.4 Use switches to supply sensors. . . . . . . . . . . . . . . . . . . . . . . . . . . . . . . . . . . . . . 189
11.5 Use switches and 5 V for external relays control. . . . . . . . . . . . . . . . . . . . . . . . . . . . . . 190
12.1 Mounting threads dimensions. . . . . . . . . . . . . . . . . . . . . . . . . . . . . . . . . . . . . . . . 192
13.1 Meteo-40 Supply incl. Modem . . . . . . . . . . . . . . . . . . . . . . . . . . . . . . . . . . . . . . . 199
13.2 Electrical Connection Plan: Analog Voltage (Pyranometer) . . . . . . . . . . . . . . . . . . . . . . . 200
13.3 Electrical Connection Plan: Analog Voltage (Temperature / Barometric Pressure Sensor) . . . . . . . 201
13.4 Electrical Connection Plan: Analog Voltage (Temperature + Humidity Sensor) . . . . . . . . . . . . . 202
13.5 Electrical Connection Plan: Analog Voltage / Current Source (4-wire-connection; Pt1000) . . . . . . 203
13.6 Electrical Connection Plan: Analog Voltage / Current Source (4-wire-connection; Pt1000 + Humidity) 204
13.7 Electrical Connection Plan: Analog Voltage (Potentiometric Wind Vane) . . . . . . . . . . . . . . . . 205
13.8 Electrical Connection Plan: Analog Voltage with Voltage Divider (R1, R2) . . . . . . . . . . . . . . . 206
13.9 Electrical Connection Plan: Analog Current (2-wire-connection), active . . . . . . . . . . . . . . . . 207
13.10 Electrical Connection Plan: Analog Voltage with Shunt . . . . . . . . . . . . . . . . . . . . . . . . . 208
13.11 Electrical Connection Plan: Pulse Counter (Anemometer) . . . . . . . . . . . . . . . . . . . . . . . . 209
xiv © 2011 — 2021 Ammonit Measurement GmbH

Data Logger Meteo-40 Plus User’s Manual xv
13.12 Electrical Connection Plan: Pulse Counter with Pull-up Module for Precipitation Measurement . . . . 210
13.13 Electrical Connection Plan: Digital Serial for Serial Wind Vane (Thies TMR) . . . . . . . . . . . . . . 211
13.14 Electrical Connection Plan: Status with Pull-down Module . . . . . . . . . . . . . . . . . . . . . . . 212
13.15 Electrical Connection Plan: Status for Obstacle Light . . . . . . . . . . . . . . . . . . . . . . . . . . 213
13.16 Electrical Connection Plan: RS485 with RS485 Module . . . . . . . . . . . . . . . . . . . . . . . . . 214
13.17 Electrical Connection Plan: Switch external Sensor Heating via Meteo-40 Switch Manager . . . . . . 215
© 2011 — 2021 Ammonit Measurement GmbH xv

xvi © 2011 — 2021 Ammonit Measurement GmbH

Data Logger Meteo-40 Plus User’s Manual xvii
List of Tables
1.1 Meteo-40 feature overview . . . . . . . . . . . . . . . . . . . . . . . . . . . . . . . . . . . . . . . . 3
3.1 Accounts and permissions . . . . . . . . . . . . . . . . . . . . . . . . . . . . . . . . . . . . . . . . . 26
3.2 Menu of the Web Interface . . . . . . . . . . . . . . . . . . . . . . . . . . . . . . . . . . . . . . . . . 28
5.1 ASCII escape sequences for RS485-M serial console . . . . . . . . . . . . . . . . . . . . . . . . . . 59
7.1 Data Transmission with Meteo-40 . . . . . . . . . . . . . . . . . . . . . . . . . . . . . . . . . . . . . 87
7.2 Automatic vs. Interactive Communication with Meteo-40 . . . . . . . . . . . . . . . . . . . . . . . . 88
7.3 Ports used by Meteo-40 . . . . . . . . . . . . . . . . . . . . . . . . . . . . . . . . . . . . . . . . . . 89
7.4 Short Message Commands . . . . . . . . . . . . . . . . . . . . . . . . . . . . . . . . . . . . . . . . 120
8.1 Modbus Invalid values . . . . . . . . . . . . . . . . . . . . . . . . . . . . . . . . . . . . . . . . . . . 130
8.2 Optional Available Information and configuration . . . . . . . . . . . . . . . . . . . . . . . . . . . . . 132
8.3 Modbus Endianness for SCADA Server . . . . . . . . . . . . . . . . . . . . . . . . . . . . . . . . . 133
8.4 Modbus Device Identification . . . . . . . . . . . . . . . . . . . . . . . . . . . . . . . . . . . . . . . 133
8.5 Set switches state . . . . . . . . . . . . . . . . . . . . . . . . . . . . . . . . . . . . . . . . . . . . . 134
9.1 Menu: System . . . . . . . . . . . . . . . . . . . . . . . . . . . . . . . . . . . . . . . . . . . . . . . 138
9.2 Menu: Status . . . . . . . . . . . . . . . . . . . . . . . . . . . . . . . . . . . . . . . . . . . . . . . . 139
9.3 Menu: Channels/Evaluations . . . . . . . . . . . . . . . . . . . . . . . . . . . . . . . . . . . . . . . 139
9.4 Menu: Channels/Analog Voltage . . . . . . . . . . . . . . . . . . . . . . . . . . . . . . . . . . . . . 140
9.5 Menu: Channels/Analog Current . . . . . . . . . . . . . . . . . . . . . . . . . . . . . . . . . . . . . 140
9.6 Menu: Channels/Counter . . . . . . . . . . . . . . . . . . . . . . . . . . . . . . . . . . . . . . . . . 141
9.7 Menu: Channels/Digital Lines . . . . . . . . . . . . . . . . . . . . . . . . . . . . . . . . . . . . . . . 141
9.8 Menu: Channels/Switches . . . . . . . . . . . . . . . . . . . . . . . . . . . . . . . . . . . . . . . . . 142
9.9 Menu: Channels/Internal . . . . . . . . . . . . . . . . . . . . . . . . . . . . . . . . . . . . . . . . . . 142
10.1 Sensors for Wind Measurement . . . . . . . . . . . . . . . . . . . . . . . . . . . . . . . . . . . . . . 146
10.2 Sensors for Solar Measurement . . . . . . . . . . . . . . . . . . . . . . . . . . . . . . . . . . . . . . 147
10.3 Sensors for Meteorological Purposes . . . . . . . . . . . . . . . . . . . . . . . . . . . . . . . . . . . 148
10.4 Electrical Measurement Devices . . . . . . . . . . . . . . . . . . . . . . . . . . . . . . . . . . . . . 148
10.5 Overview Anemometers . . . . . . . . . . . . . . . . . . . . . . . . . . . . . . . . . . . . . . . . . . 149
10.6 Connecting Thies FCA X to Meteo-40 . . . . . . . . . . . . . . . . . . . . . . . . . . . . . . . . . . . 151
© 2011 — 2021 Ammonit Measurement GmbH xvii

10.7 Overview Propeller Anemometer . . . . . . . . . . . . . . . . . . . . . . . . . . . . . . . . . . . . . 152
10.8 Comparison of Wind Vane Accuracy . . . . . . . . . . . . . . . . . . . . . . . . . . . . . . . . . . . 152
10.9 Overview Wind vanes TMR . . . . . . . . . . . . . . . . . . . . . . . . . . . . . . . . . . . . . . . . 153
10.10 Parameters for the configuration of potentiometric wind vanes . . . . . . . . . . . . . . . . . . . . . 153
10.11 Configuration of RS485 Wind Vanes . . . . . . . . . . . . . . . . . . . . . . . . . . . . . . . . . . . 154
10.12 Kintech Geovane™ . . . . . . . . . . . . . . . . . . . . . . . . . . . . . . . . . . . . . . . . . . . . 155
10.13 Parameters for the configuration of temperature humidity sensors . . . . . . . . . . . . . . . . . . . 160
10.14 Tolerance Classes - Platinum Resistance Thermometers (Pt100) . . . . . . . . . . . . . . . . . . . . 161
10.15 Data request for RS485 Temperature Humidity Sensors . . . . . . . . . . . . . . . . . . . . . . . . . 162
10.16 Parameters for the configuration of barometric pressure sensors . . . . . . . . . . . . . . . . . . . . 162
10.17 Data request for RS485 Barometric Pressure Sensors . . . . . . . . . . . . . . . . . . . . . . . . . 163
10.18 Pyranometers . . . . . . . . . . . . . . . . . . . . . . . . . . . . . . . . . . . . . . . . . . . . . . . 164
10.19 Data request for RS485 pyranometer . . . . . . . . . . . . . . . . . . . . . . . . . . . . . . . . . . . 165
10.20 Pyrheliometers . . . . . . . . . . . . . . . . . . . . . . . . . . . . . . . . . . . . . . . . . . . . . . . 166
10.21 Sunshine Duration Sensors . . . . . . . . . . . . . . . . . . . . . . . . . . . . . . . . . . . . . . . . 167
10.22 Data request for RS485 Sun Tracker . . . . . . . . . . . . . . . . . . . . . . . . . . . . . . . . . . . 168
10.23 Configuration of RS485 CSPS RSI . . . . . . . . . . . . . . . . . . . . . . . . . . . . . . . . . . . . 168
10.24 Configuration details for RS485 Reference Cell . . . . . . . . . . . . . . . . . . . . . . . . . . . . . 169
10.25 Parameters for the configuration of precipitation sensors . . . . . . . . . . . . . . . . . . . . . . . . 169
10.26 Configuration of RS485 Laser Precipitation Monitor Sensors . . . . . . . . . . . . . . . . . . . . . . 170
10.27 Requested values . . . . . . . . . . . . . . . . . . . . . . . . . . . . . . . . . . . . . . . . . . . . . 172
10.28 Requested values . . . . . . . . . . . . . . . . . . . . . . . . . . . . . . . . . . . . . . . . . . . . . 173
10.29 SG1000 status signals . . . . . . . . . . . . . . . . . . . . . . . . . . . . . . . . . . . . . . . . . . . 174
10.30 Soil Moisture Sensors . . . . . . . . . . . . . . . . . . . . . . . . . . . . . . . . . . . . . . . . . . . 174
10.31 RS485 Soil Water Content Sensors . . . . . . . . . . . . . . . . . . . . . . . . . . . . . . . . . . . . 175
10.32 Data request for RS485 Soiling Measurement . . . . . . . . . . . . . . . . . . . . . . . . . . . . . . 175
10.33 Data request for DustIQ RS485 Soiling Measurement . . . . . . . . . . . . . . . . . . . . . . . . . . 177
10.34 Configuration details for other RS485 Sensors / Devices . . . . . . . . . . . . . . . . . . . . . . . . 178
10.35 Data types available . . . . . . . . . . . . . . . . . . . . . . . . . . . . . . . . . . . . . . . . . . . . 181
11.1 Analog Channels of Meteo-40 . . . . . . . . . . . . . . . . . . . . . . . . . . . . . . . . . . . . . . . 183
11.2 Counter / Period Channels of Meteo-40 . . . . . . . . . . . . . . . . . . . . . . . . . . . . . . . . . . 184
11.3 Digital Channels of Meteo-40 . . . . . . . . . . . . . . . . . . . . . . . . . . . . . . . . . . . . . . . 185
11.4 Analog Current Channels of Meteo-40 . . . . . . . . . . . . . . . . . . . . . . . . . . . . . . . . . . 188
11.5 Current Source Channels of Meteo-40 . . . . . . . . . . . . . . . . . . . . . . . . . . . . . . . . . . 188
12.1 Electrical Specifications of Analog Voltage Channels / Differential Inputs . . . . . . . . . . . . . . . . 193
12.2 Electrical Specifications of Analog Current Channels / Differential Inputs . . . . . . . . . . . . . . . . 193
12.3 Electrical Specifications of Counter Channels / Non-Differential Inputs . . . . . . . . . . . . . . . . . 194
12.4 Electrical Specifications of Digital Channels (Serial Input / Output) . . . . . . . . . . . . . . . . . . . 194
12.5 Electrical Specifications for Digital Clock Output . . . . . . . . . . . . . . . . . . . . . . . . . . . . . 195
12.6 Electrical Specifications for Anlog Current Source . . . . . . . . . . . . . . . . . . . . . . . . . . . . 195
xviii © 2011 — 2021 Ammonit Measurement GmbH

Data Logger Meteo-40 Plus User’s Manual xix
12.7 Electrical Specifications for Switches . . . . . . . . . . . . . . . . . . . . . . . . . . . . . . . . . . . 195
12.8 Electrical Specification of the 5 V Output . . . . . . . . . . . . . . . . . . . . . . . . . . . . . . . . . 196
12.9 Electrical Specification of the RS485 Interface . . . . . . . . . . . . . . . . . . . . . . . . . . . . . . 196
12.10 Electrical Specification of the Ethernet Interface . . . . . . . . . . . . . . . . . . . . . . . . . . . . . 196
12.11 Electrical Specification of the RS232 Interface . . . . . . . . . . . . . . . . . . . . . . . . . . . . . . 197
12.12 Electrical Specification of the Power Supply . . . . . . . . . . . . . . . . . . . . . . . . . . . . . . . 197
14.1 Cryptographic Software . . . . . . . . . . . . . . . . . . . . . . . . . . . . . . . . . . . . . . . . . . 217
© 2011 — 2021 Ammonit Measurement GmbH xix

xx © 2011 — 2021 Ammonit Measurement GmbH

Data Logger Meteo-40 Plus User’s Manual 1 / 246
Chapter 1
Introduction
1.1 Opening Remarks
Meteo-40 plus data loggers by Ammonit Measurement GmbH are professional measuring devices which record me-teorological details in order to calculate the wind energy potential of a site. The data loggers can be used flexibly andare well-suited for a wide range of applications. The implemented standards of measurement evaluation and datasecurity meet the requirements of professional specialists. However, you conveniently configure sensors, statisticsand the communication via the user-friendly web interface.
Before installation read this manual carefully. Remember that time spent now setting up the data logger properly, mightsave you from losing valuable data!
We recommend to configure and to test sensors and communication before the measuring equipment is installed onthe mast.
We hope you find this manual clear and easy to understand. If you have any comments or suggestions, please let usknow.
1.2 Overview of Meteo-40 plus
Depending on the model, Meteo-40 plus offers up to 34 measurement channels: There are up to 12 analog differentialvoltage inputs, up to 2 analog current inputs. Furthermore, Meteo-40 plus has up to 12 counter inputs and up to 8digital channels.
In addition, Meteo-40 plus is able to support up to 8 smart sensors via the RS485 interface.
In general, Meteo-40 plus is divided into two main units: A communication unit and a measuring unit. The communi-cation unit offers 3 USB slots to connect a PC, modem, web camera, or flash drive, and 1 Ethernet slot to connect acamera or router. Additionally, the Meteo-40 can be connected to the network via Ethernet.
NoteMeteo-40 Revision C offers a standard RS232 slot. Meteo-40 Revision D is equipped with an Ethernet slot.The production of Meteo-40 Revision C stopped in October 2012. Revision C is not supported anymoreand cannot be upgraded to version 2 or higher.
The basic concept is shown in detail in Figure 1.1.
© 2011 — 2021 Ammonit Measurement GmbH 1

LEDs communication unit
current sources measuring unit RS485
power supplybuttonsLC display
Figure 1.1: Overview of Meteo-40L
1.3 Meteo-40 Series
The Meteo-40 series differs mainly in the number of input and output channels and in the measurement data storagecapacity. Some basic information about the different models (Meteo-40S, Meteo-40M and Meteo-40L) are shown inTable 1.1.
2 © 2011 — 2021 Ammonit Measurement GmbH

Data Logger Meteo-40 Plus User’s Manual 3 / 246
Feature Meteo-40S Meteo-40M Meteo-40L Meteo-40A
Inputchannels
Counters 4 8 12 2Periods 0 2 4 0Digital 2 4 8 4Analog ( U) 4 8 12 12Analog ( I) 1 1 2 2RS485 Up to 8 sensors
Outputchannels
Switches 2 4 8 4ConstantCurrent
1 1 2 2
RS485 1 for SCADA
Memory SizeSource Data 1 GByte 2 GByte 2 GByte 1 GByteCSV Data > 50 MByte
ConnectivityUSB 2 USB host, 1 USB deviceEthernet 1 for router, LAN
Display and keysLC display with backlight (4 lines each with 20 characters), five
keysPower supply 9 - 36 V (DC)
Table 1.1: Meteo-40 feature overview
NoteThe predecessor of the current Meteo-40 Revision D, Revision C, is equipped with a standards RS232 slotinstead of the Ethernet slot.
Find below an overview of the terminals. The white areas indicate available connectors.
Figure 1.2: Meteo-40L Terminal
© 2011 — 2021 Ammonit Measurement GmbH 3

Figure 1.3: Meteo-40M Terminal
Figure 1.4: Meteo-40S Terminal
1.4 The Two Systems of Meteo-40
Meteo-40 consists of two basic systems: the Measurement And Recording System (MARS) and the Configuration,Evaluation and Communication System (CECS).
For measuring and recording data, only MARS is needed. MARS is a 8-bit microcontoller designed to work withminimal power consumption. It controls the analog data logger hardware, measurement channels and data storage.It has no access to the display or to the devices that could be connected via USB or Ethernet (RS232 for Meteo-40Revision C).
In order to use connected devices and to operate the display or the web interface, CECS has to be started. CECSis a fully operational embedded Linux™ computer with a 32-bit microcontroller. Starting it, allows using Meteo-40’sfeatures, but increases power consumption.
To save power during a measurement campaign, CECS is usually powered down and only MARS is running. MARSstarts, when the power connector is plugged in.
The booting process of the MARS software is indicated by the illumination of the two lower LEDs (red and yellow).Both LEDs will turn off, when the MARS is started successfully.
4 © 2011 — 2021 Ammonit Measurement GmbH

Data Logger Meteo-40 Plus User’s Manual 5 / 246
CECS can be started either manually or automatically. To manually start CECS, press the middle button of the keyboardand hold it until the display turns on. A manual start of CECS is necessary for the initial configuration of Meteo-40.
Later on, during a measurement campaign, CECS will be started by MARS according to the configured time schedule,e.g., to upload measurement data. After the scheduled actions have been executed, CECS turns off automatically toreduce power consumption.
Meteo-40
Configuration, Evaluation, and Communication System
MARS - Measurement And Recording System
LC Display Keys
System Storagefor software
and statistics(CSV files)
USB-A
Ethernet*
USB-B
RS485 Slave
e.g. USB modem
e.g. PC, LAN, routeSCADA master, or
PC
SCADA master
read data
write data
Source Data StoragePower System Power Supplyconfiguration
Real-Time Clock (RTC),battery buffered
RS485 master RS485 sensors
Switches e.g. Relais
Measurement Inputs Analog and digital
Current Sources e.g. PT1000
*RS232 on older Meteo-40
Figure 1.5: Block diagram of Meteo-40
© 2011 — 2021 Ammonit Measurement GmbH 5

1.4.1 CECS: Switch on / off behavior
CECS is configured to run for 20 minutes, before it automatically turns off. When the time is expired and an action isstill running, e.g., sending an email, the system will wait until the action is finished and will switch off afterwards. Theremaining time is displayed in the status box(see Section 3.2) of the Meteo-40 web interface.
NoteWith every user action, e.g., click in the web interface or pressing a button on the keyboard, the remainingtime will be reset to 20 minutes.
For SCADA operation, CECS has to run permanently. This is possible by means of the CECS always active mode. IfCECS always active mode is selected, it will be displayed in the status box(see Section 3.2) in the web interfacewith the infinity symbol (∞) as well as on the Meteo-40 display with the word Always.
NoteThe CECS always active mode is not selected by default. If the SCADA server is activated, the CECSalways active mode is automatically set.
If power supply is disconnected and the data logger shuts down while CECS was running in the CECS always activemode, it will start automatically as soon as power is available again.
ImportantWhen CECS is configured to be permanently on, you cannot manually shut down the system by pressingthe middle button on the data logger.
1.5 Data Storage
CECS and MARS both have access to the common measurement data storage (shared source data memory). It ispossible to view or download the source data via the web interface, see Section 6.7.
NoteFor optimal data recording, it is recommended to format the data storage before starting a new mea-surement campaign. Formatting is a very fast process, which only takes a few milliseconds and can beperformed via the web interface under the System → Administration menu. For further details see Sec-tion 4.2.
1.6 User Interfaces
There are two ways to control and configure the data logger: via web interface or by using the buttons of Meteo-40. Thesecond method is only intended for checking and testing, since this control menu does not provide as many possibilitiesto configure Meteo-40. However, the web interface offers all available configuration options and is recommended forthe configuration of the device. To use the web interface a TCP/IP or USB connection is required.
Thanks to its web interface, Meteo-40 can also be operated via Internet with mobile devices, i.e., smartphone, tabletPC.
6 © 2011 — 2021 Ammonit Measurement GmbH

Data Logger Meteo-40 Plus User’s Manual 7 / 246
ImportantThe Meteo-40 web interface is accessed via HTTPS connection, which uses high-grade encryption (AES-256, 256 bit). This connection cannot be decrypted using today’s technologies.
1.7 Communication Methods and Required Devices
Depending on the project, Meteo-40 offers various methods for communication and data retrieval. All available meth-ods are commonly used as well as easy to handle and to configure. In order to set up the connection to Meteo-40,devices like Ethernet cable or modem are necessary as shown in the following table.
Method /Action
Configura-tion
SoftwareUpdate
DataDownload
RequiredDevices Comment
Meteo-40(stand-alone)
no (only afew settingscan bechanged)
no no -Using the display (seeSection 4.4.1 andChapter 9).
USB flashdrive(connectedto datalogger)
no no yesUSB flashdrive
Manual data download onpre-configured USB flashdrive (see Section 4.2).
LAN (dataloggerconnected toLAN)
yesyes (Internetaccessrequired)
yes (Datatransfer viaemail,SCP/FTP/S-FTP/FTPS,AmmonitORor manualdatadownload viawebinterface)
Ethernetcable
Recommended for initialconfiguration and softwareupdates (see Section 2.3).
W-LAN (PC,laptop etc.connected todata logger’sW-LAN)
yes no
yes(Downloadvia webinterface)
USB W-LANstick
Recommended on site formaintenance (seeSection 7.8).
Point-to-PointEthernet(data loggerconnected toPC)
yes no
yes(Downloadvia webinterface)
Ethernetcable
PC has to be configured(see Section 2.4).
USB (dataloggerconnected toPC)
yes no
yes(Downloadvia webinterface)
USB (A/B)cable
Backup access. Driver filemight be required (seeSection 2.5).
USB (dataloggerconnected tosmartphone)
yes
yes, tetheringfunction ofthesmartphoneneeds to beactivated
yes(Downloadvia webinterface)
USB cable ofthesmartphone(accessory)
Convenient for remoteservicing or softwareupgrades, when nomodem is installed.
© 2011 — 2021 Ammonit Measurement GmbH 7

Method /Action
Configura-tion
SoftwareUpdate
DataDownload
RequiredDevices Comment
Modemaccess (dataloggerconnected tomodem, e.g.,GPRS/GSM,directionalradio,satellite)
yesyes (Internetaccessrequired)
yes (Datatransfer viaemail,SCP/FTP/S-FTP/FTPS,AmmonitORor manualdatadownload viawebinterface)
Modem andaccessorycable
Thanks to the tunnel serverdesign a standard SIMcard can be used in a GSMmodem. The tunnel servermanages IP addresses.SIM card with static IPaddress is not necessary.(see Section 7.9)
SCADA overRS485(ModbusRTU)
no noyes (Modbusprotocol)
-Modbus register map hasto be configured for dataretrieval (see Section 8.1).
SCADA overEthernet(ModbusTCP/IP)
no noyes (Modbusprotocol)
-Modbus register map hasto be configured for dataretrieval (see Section 8.1).
NoteIf you are working with a Meteo-40 Revision C with RS232 slot, you need an USB Ethernet adapter toconnect the data logger to your LAN. The production of Meteo-40 Revision C stopped in October 2012.
8 © 2011 — 2021 Ammonit Measurement GmbH

Data Logger Meteo-40 Plus User’s Manual 9 / 246
Chapter 2
Getting Started with Meteo-40 plus
2.1 Introduction
Before you start working with Meteo-40 plus, connect the data logger to the power supply. In the moment Meteo-40plus is connected to the power supply, the lower LED lights turn on and indicate that the Measurement And RecordingSystem ( MARS) is booting. Both LEDs turn off, when MARS has successfully started and is running. To access theweb interface, the second system Configuration, Evaluation and Communication System ( CECS) has to be started.Press the middle button of Meteo-40 plus and hold it until the display turns on (see Section 1.4).
In order to access the web interface, it is necessary to establish a TCP/IP connection between Host PC and Meteo-40plus. There are multiple ways to create this connection:
1. If you connect the data logger to your LAN using an Ethernet cable (see Section 2.3) and DHCP method, anyother device in the lan (e.g. your PC) will have access to the web interface of the data logger, as long as theCECS is running.
© 2011 — 2021 Ammonit Measurement GmbH 9

LAN connection between Data Logger and PC
Ethernet cable
Ethernetport
Ethernetport
Local Area Network (LAN)with DHCP Server
Ethernet orWLAN connection
Figure 2.1: Accessing Meteo-40 plus via LAN (see Section 2.3)
2. A direct, point-to-point connection using an Ethernet cable (see Section 2.4), either with the link-localmethod or with static IP addresses. The link-local method is recommended.
to-point Ethernet connection between Data Logger
Ethernet cableEthernet
portEthernet
port
Figure 2.2: Accessing Meteo-40 plus via Point-to-Point Ethernet Connection (see Section 2.4)
3. A direct, point-to-point connection using a standard USB 2.0 A/B cable, (see Section 2.5). The same type ofcable is typically used to connect a USB printer to a PC.
10 © 2011 — 2021 Ammonit Measurement GmbH

Data Logger Meteo-40 Plus User’s Manual 11 / 246
Connection between Data Logger and PC or Mobile P
USB A/B cable
Micro USB cable
USB Bport
USB Aport
USB Aport
MicroUSB Bport
Figure 2.3: Accessing Meteo-40 plus via USB-B(see Section 2.5)
ImportantIf you establish a connection via USB, a driver file might be needed for Windows PCs. The driverfile can be downloaded from download.windowsupdate.com (http://download.windowsupdate.com/msdownload/update/driver/drvs/2012/12/20342322_4b9970e3174b23b5cb2371af0837f939a71271ea.cab). For further details refer to Section 2.5.
NoteIf you are working with Meteo-40 Revision C with RS232 slot, you need an USB Ethernet adapter to connectthe data logger to your LAN or via Ethernet to your PC (Point-to-Point). The production of Meteo-40 RevisionC stopped in October 2012.
NoteAfter having configured Meteo-40 plus for W-LAN, the data logger web interface can be accessed by usinga W-LAN USB device (see Section 7.8).
© 2011 — 2021 Ammonit Measurement GmbH 11

2 USB-A ports 1 Ethernet port 1 USB-B port
Figure 2.4: Ethernet / USB ports of Meteo-40 plusL
TipWe recommend connecting Meteo-40 plus via Ethernet to your LAN. It is the easiest method, no additionaldriver file is needed and updates can be performed immediately.
2.2 Using Bonjour™ on Windows™
For Windows Vista™ and later versions, this procedure can be simplified by installing the software Bonjour PrintServices for Windows from Apple (http://support.apple.com/kb/DL999). It provides automatic resolutionof computer host names and the data logger can be accessed via its serial number. Unfortunately, our tests haverevealed that this software can cause problems when installed on Windows XP.
After the installation of Bonjour Print Services just type the serial number as follows in your web browser https://Dnnnnnn.localwith Dnnnnnn as your data loggers serial number. The untrusted connection alert page will appear and should beaccepted as described in Section 2.5.1.
12 © 2011 — 2021 Ammonit Measurement GmbH

Data Logger Meteo-40 Plus User’s Manual 13 / 246
URL:http://D001234.local/
Meteo-40plusD001234
Username:
Password:
Showpassword
Login
中文(简) English Español Português Français Deutsch Türkçe ©2011-2020AmmonitMeasurementGmbHwww.ammonit.com
Figure 2.5: Meteo-40 plus web interface initial screen
2.3 Connecting Meteo-40 plus via Ethernet to your LAN
In order to connect Meteo-40 plus with your PC via Ethernet, both devices have to be connected to your local network.Your computer should be connected via LAN or W-LAN to your network. To connect Meteo-40 plus to the network, astandard Ethernet cable is needed. If you have only one Ethernet port in your office, use a switch or a hub to multiplythe available Ethernet ports. See Figure 2.1.
NoteIf you are working with Meteo-40 Revision C with RS232 slot, you need an USB Ethernet adapter to connectthe data logger to the LAN. Connect the USB side of the adapter to the data logger and plug in the Ethernetcable on the other side. The production of Meteo-40 Revision C stopped in October 2012.
To see that Meteo-40 plus has been connected successfully, use the buttons on the data logger to navigate through themenu. In the Communication → Devices → LAN menu you can find a list of connections, which displays all availableconnections. If eth Activated is displayed, the connection has been successfully established.
By opening this menu item (click on the right button of the data logger keyboard), you can browse for the connectionproperties such as IP address, which was automatically assigned to the data logger by DHCP server. To access theweb interface, start your web browser. Enter https:// and the IP address shown in the data logger display, e.g.,https://192.168.12.30.
TipWe recommend using Mozilla Firefox (http://www.mozilla.com/) as your web browser to accessMeteo-40 plus. Other modern web browsers, including mobile web browsers, should work as well, but arenot systematically tested by Ammonit.
After entering the address in your web browser, a confirmation prompt may appear. Click I understand the risks andpress Add Exception.
© 2011 — 2021 Ammonit Measurement GmbH 13

Figure 2.6: Firefox Connection Untrusted alert page
In the next step download the certificate by clicking on Get Certificate and Confirm Security Exception to access theMeteo-40 plus web interface. In order to save the exception Permanently store this exception should be checked.
Figure 2.7: Add Security Exception
ImportantIn order to prevent misuse of the certificate, Ammonit deliberately did not store the security certificate oneach data logger. After downloading the certificate, its validity can be verified.
14 © 2011 — 2021 Ammonit Measurement GmbH

Data Logger Meteo-40 Plus User’s Manual 15 / 246
URL:https://192.168.43.21/
Meteo-40plusD001234
Username:
Password:
Showpassword
Login
中文(简) English Español Português Français Deutsch Türkçe ©2011-2020AmmonitMeasurementGmbHwww.ammonit.com
Figure 2.8: Meteo-40 plus web interface initial screen
ImportantIn order to use all functions of the web interface, activate JavaScript and Cookies in your web browser!
Go to Chapter 3 to proceed with the configuration.
2.4 Connecting Meteo-40 plus to your Windows 10™ PC via point-to-point Ethernet connection
In order to connect Meteo-40 plus with your Windows 7™ PC, an Ethernet cable is required. No additional driver fileis needed for a direct point-to-point connection via Ethernet. See Figure 2.2.
NoteIf you are working with Meteo-40 Revision C with RS232 slot, you need an USB Ethernet adapter to connectthe data logger via point-to-point Ethernet connection to your PC. Connect the USB side of the adapter tothe data logger and plug in the Ethernet cable on the other side. The production of Meteo-40 Revision Cstopped in 2012.
Before you connect the devices, Meteo-40 plus has to be configured to use either a link-local connection or a static IPaddress. The former is much easier to use, because it does not involve any manual configuration of the PC, if it hasthe standard configuration of obtaining an IP address automatically.
2.4.1 Using link-local connection
To use a link-local address, you have to make sure your PC is configured to obtain an IP address automatically. Inmost cases, this is already be the case.
In the next step Meteo-40 plus has to be configured for the link-local Ethernet connection. Open the Communication→ Devices → LAN → Ethernet menu and select Ethernet (Offline). Move to Method and press the right button onthe Meteo-40 plus keyboard until Link-local is displayed as shown in Figure 2.9. DHCP is configured by default tosupport the standard LAN (see Section 2.3) connection via Ethernet.
© 2011 — 2021 Ammonit Measurement GmbH 15

IP / NetmaskDNS ServersRoutes
> Method: Link-local
Figure 2.9: Meteo-40 plus display with activated link-local connection
Open your browser, e.g., Mozilla Firefox. When you are using a Mac or a Linux computer, or when you have installedBonjour on a Windows PC, you can just enter https://Dnnnnnn.local in the URL field of your web browser.
Otherwise, look up the IP number in the menu and enter the number as follows https://169.254.nnn.nnn asURL. For link-local connection, IP addresses start always with 169.254., while the remaining numbers are randomand change every time.
2.4.2 Using static IP address
To use a static IP address, you need to configure your PC and Meteo-40 plus. To configure the PC, open the Networkand Sharing Center in the Control Panel of your computer and click on LAN Connection (see Figure 2.10). In mostcases, the link-local connection Section 2.4.1 is preferable.
Figure 2.10: Network and Sharing Center of Windows 7™
To configure the LAN connection, click on Properties ( Figure 2.11) in the LAN Connection Status window.
16 © 2011 — 2021 Ammonit Measurement GmbH

Data Logger Meteo-40 Plus User’s Manual 17 / 246
Figure 2.11: LAN Connection Status
Select Internet Protocol Version 4 (TCP/IPv4) and open the Properties of the Internet protocol as shown in Figure 2.12
Figure 2.12: Properties of LAN Connection
Choose Use the following IP address and enter the following IP address 192.168.40.1 as shown in Figure 2.13. Bypressing the TAB button the Subnet mask will be filled automatically. Save the configuration with OK.
ImportantIf you do not have the rights to configure the settings, contact your system administrator.
© 2011 — 2021 Ammonit Measurement GmbH 17

Figure 2.13: Properties of Internet Protocol
After having configured the LAN connection, connect your PC with Meteo-40 plus using a standard Ethernet cable.Switch on Meteo-40 plus by pressing the middle button of the keyboard.
In the next step Meteo-40 plus has to be configured for the static IP point-to-point Ethernet connection. Open theCommunication → Devices → LAN → Ethernet menu and select Ethernet (Offline). Move to Method and press theright button on the Meteo-40 plus keyboard until Static IP is displayed.
IP / NetmaskDNS ServersRoutes
> Method: Link-local
Figure 2.14: Meteo-40 plus display with activated link-local connection
Open your browser, e.g., Mozilla Firefox. When you are using a Mac or a Linux computer, or when you have installedBonjour on a Windows PC, you can just enter https://Dnnnnnn.local in the URL field of your web browser.
Otherwise, just enter https://192.168.40.40, where 192.168.40.40 is the preconfigured IP address of eachMeteo-40 plus data logger.
Afterwards a confirmation prompt appears. Click I understand the risks and press Add Exception as shown in Fig-ure 2.15.
18 © 2011 — 2021 Ammonit Measurement GmbH

Data Logger Meteo-40 Plus User’s Manual 19 / 246
Figure 2.15: Mozilla Firefox Connection Untrusted Alert Page
In the next step download the certificate by clicking on Get Certificate and Confirm Security Exception to access theMeteo-40 plus web interface. In order to save the exception, Permanently store this exception should be checked.
Figure 2.16: Add Security Exception
After confirming the certificate, the Meteo-40 plus login page is shown. Use your login details (Meteo-40 plus certificate)to enter the web interface. To proceed with the configuration, go to Chapter 3.
© 2011 — 2021 Ammonit Measurement GmbH 19

URL:https://192.168.40.40/
Meteo-40plusD001234
Username:
Password:
Showpassword
Login
中文(简) English Español Português Français Deutsch Türkçe ©2011-2020AmmonitMeasurementGmbHwww.ammonit.com
Figure 2.17: Meteo-40 plus web interface initial screen
TipBy using this point-to-point connection (without Internet access), the modem connection can be tested, e.g.,sending emails via modem.
NoteDo not forget resetting the LAN configuration on your PC (Internet protocol properties) and enabling DHCPon Meteo-40 plus (if needed).
2.5 Connecting Meteo-40 plus with your Windows 10™ PC via USB
Meteo-40 plus requires a standard RNDIS USB driver. You can download it from download.windowsupdate.com(http://download.windowsupdate.com/msdownload/update/driver/drvs/2012/12/20342322_4b9970e3174b23b5cb2371af0837f939a71271ea.cab).
TipYou can also connect Meteo-40 plus to your tablet PC or smartphone by using a micro USB cable as shownin Figure 2.3. In doing so, you can easily connect to the data logger for maintenance reasons in the field orfor performing updates using the tethering function of your mobile device (see also Section 4.3.1).
2.5.1 Standard RNDIS USB Driver
Unpack the file 20342322_4b9970e3174b23b5cb2371af0837f939a71271ea.cab, downloaded from down-load.windowsupdate.com (http://download.windowsupdate.com/msdownload/update/driver/drvs/2012/12/20342322_4b9970e3174b23b5cb2371af0837f939a71271ea.cab) by double-clicking on the file icon,then marking both contents, right-clicking and then selecting Extract....
20 © 2011 — 2021 Ammonit Measurement GmbH

Data Logger Meteo-40 Plus User’s Manual 21 / 246
Figure 2.18: Unpack Windows Driver Software
Now you have two files, rndis.cat (Security Catalogue) and RNDIS.inf (Setup Information). The former is thedigital signature by Microsoft, the latter is the actual device driver file.
Figure 2.19: Select Installation of RNDIS Driver
You probably get the following security warning, which you need to confirm by clicking on Open:
© 2011 — 2021 Ammonit Measurement GmbH 21

Figure 2.20: Confirm Security Warning
Finally, confirm the success dialog, by clicking on OK:
Figure 2.21: Confirm Operation Successful
The local connection can be established now by pluging in the USB cable. An IP address is automatically assignedto the data logger, which can be found on its display in the menu Communication → Devices → LAN → USB underIP/Netmask. To start using Meteo-40 plus, type the address in your web browser, e.g., https://169.254.12.25/.The address always starts with 169.254, the remaining part is random.
22 © 2011 — 2021 Ammonit Measurement GmbH

Data Logger Meteo-40 Plus User’s Manual 23 / 246
TipWe recommend using Mozilla Firefox (http://www.mozilla.com/) as your web browser to accessMeteo-40 plus. Other modern web browsers, including mobile web browsers, should work as well, but arenot systematically tested by Ammonit.
ImportantIn order to use all functions of the web interface, activate JavaScript and Cookies in your web browser!
After entering the address in your web browser, a confirmation prompt may appear. Click I understand the risks andpress Add Exception.
Figure 2.22: Firefox Connection Untrusted alert page
In the next step download the certificate by clicking on Get Certificate and Confirm Security Exception to access theMeteo-40 plus web interface. In order to save the exception, Permanently store this exception should be checked.
© 2011 — 2021 Ammonit Measurement GmbH 23

Figure 2.23: Add Security Exception
ImportantIn order to prevent misuse of the certificate, Ammonit deliberately did not store the security certificate oneach data logger. After downloading the certificate, its validity can be verified.
URL:https://169.254.43.21/
Meteo-40plusD001234
Username:
Password:
Showpassword
Login
中文(简) English Español Português Français Deutsch Türkçe ©2011-2020AmmonitMeasurementGmbHwww.ammonit.com
Figure 2.24: Meteo-40 plus web interface initial screen
2.6 Using Meteo-40 plus with Linux
Recommended is any up-to-date Linux distribution with installed Network Manager (http://projects.gnome.org/NetworkManager/)(at least version 0.8), such as Debian 6.0, Ubuntu 10.04 or later. Configure the RNDIS/EthernetGadget to use link-local and connect the Meteo-40 plus with the PC. You should be able to access the Meteo-40 pluswith your web browser now.
24 © 2011 — 2021 Ammonit Measurement GmbH

Data Logger Meteo-40 Plus User’s Manual 25 / 246
Chapter 3
Login at Meteo-40
3.1 Login Options
Once you access the login page of the data logger over the web interface, you may log into one of four accounts,which have different access rights: Guest, Viewer, User or Admin.
URL:http://D001234.local/
Meteo-40plusD001234
Username:
Password:
Showpassword
Login
中文(简) English Español Português Français Deutsch Türkçe ©2011-2020AmmonitMeasurementGmbHwww.ammonit.com
Figure 3.1: Login Screen
The original access password for each account is enclosed in the data logger’s delivery. The passwords are unique foreach Meteo-40. All passwords can be changed by the Admin user. The Admin user can also create, edit and deleteother accounts. (see User Management: in Section 4.2).
WarningBe careful if you change the password for the Admin account. A forgotten Admin password cannot berecovered. The data logger must be returned to Ammonit to restore the original password.
© 2011 — 2021 Ammonit Measurement GmbH 25

Account Permissions
Guest• Look at all configuration pages• Look at live data
Viewer• All of the above• Download measurement data
User
• All of the above• Configure the data logger• See and change communication and
encryption passwords
Admin
• All of the above• Change the name of the data logger• Upgrade the data logger software• Change all users access passwords
Table 3.1: Accounts and permissions
The Meteo-40 web interface is available in seven languages: Chinese, English, French, German, Portuguese, Span-ish, and Turkish.
ImportantIn order to use all functions of the web interface, activate JavaScript and Cookies in our web browser!
After login, two links are shown in the upper right corner:
Help Access online help.
Logout Close the session, when access to the data logger is no longer needed.
Under these links the account you are logged into ( Guest, Viewer, User or Admin) is shown, followed by the serialnumber of the data logger.
WarningBe aware that due to security reasons it is not possible to reset the access passwords. Furthermore, if youchange the Admin password and forget it, there is no way to recover it, not even for Ammonit. In this case,you have to send the data logger to Ammonit, so that we can restore the original passwords.
3.2 Global Control Elements
A Status Box is shown in the upper left corner of the Meteo-40 web interface. It always shows the most importantinformation and control options.
26 © 2011 — 2021 Ammonit Measurement GmbH

Data Logger Meteo-40 Plus User’s Manual 27 / 246File Edit View Go Bookmarks Tabs Help
Back https://d130080.local/system/information/
Help Logout(Admin on D130080)
Recording: On Switch off
Configuration: Saved Save
Connection: USB, Ethernet, Tunnel
Remaining: ∞ ( 1 )
Date/time: 2013-11-29 11:43:25 UTC
System Information
File Edit View Go Bookmarks Tabs Help
Back https://d130080.local/measurement/sensors/?saved=true
Help Logout(Admin on D130080)
Top Anemometer Anemometer GenericAnemometer
100.0 1 s C1 Change Delete
BackupAnemometer
Anemometer GenericAnemometer
99.0 1 s C2 Change Delete
MiddleAnemometer
Anemometer GenericAnemometer
50.0 1 s C3 Change Delete
Low Anemometer Anemometer GenericAnemometer
10.0 1 s C4 Change Delete
Top Wind Vane Wind Vane Thies Wind Vane10 Bits SerialSynchron
100.0 1 s D1 Change Delete
Backup Wind Vane Wind Vane Thies Wind Vane10 Bits SerialSynchron
99.0 1 s D2 Change Delete
Low Wind Vane Wind Vane Thies Wind Vane10 Bits SerialSynchron
50.0 1 s D3 Change Delete
Hygro/Thermo Hygro/Thermo Galltec Hygro-Thermo Active KP
10.0 1 s A5, A6 Change Delete
Barometer Barometer BarometricPressure SensorAB60
0.0 1 s A1 Change Delete
Add sensor
Undo
Delete all sensors
Typical cabinet sets
Recording: Off Switch on
Configuration: Unsaved Save
Connection: Ethernet,Tunnel
Remaining: ∞ ( 1 )
Date/time: 2013-07-17 11:48:09 UTC+01:00
Sensor Definitions
SystemInformationAdministrationUpgradeDisplayWeb CameraSwitchesSystem Log
MeasurementSensorsChannelsEvaluation
DataLiveStatisticsSource
CommunicationScheduleE-MailOnlineFTP/SCPSCADALANWLANModem
https://d130080.local/data/statistics/
measurement data is recorded confi guration is saved
measurement data is not saved to memory
confi guration has been changed
Figure 3.2: Meteo-40 Status Box displaying Status of Recording
The Status Box displays whether Meteo-40 is recording data and whether the current configuration is saved. You canswitch on or off recording here and save the configuration after having made any changes.
NoteIf you switch Recording on, the Configuration will be saved automatically, because recording cannotwork without a saved configuration.
ImportantIf you switch Recording off, no measurement data will be saved to memory. The measurement is stillgoing on and you will be able to see live data, but you cannot generate CSV files and you will not be ableto access measured data afterwards!If Configuration is not saved, you have changed the configuration and the changed configuration isactive. You must save the configuration to use the new configuration permanently. If you do not save theconfiguration, your settings will be lost after disconnecting the power supply!
File Edit View Go Bookmarks Tabs Help
Back https://d110017.local/system/information/
Help Logout(Admin on D110017)
Logger type Meteo-40LSerial number D110017Number of channels 12 analog voltage, 12 counters, 2 analog current, 2 current sources, 8 digital, 8 switches, 8 RS-485Active input channels 3 analog voltage, 4 counters, 3 digitalInstalled sensors 4 anemometer, 3 wind vane, 1 hygro/thermo, 1 barometerLogger time 2011-11-18 12:28:14 UTC+01:00RAM Total: 123MB, Used: 61MB Free: 62MBSource data memory 1957.12MB (0.41% used)System memory Total: 464MB, Used: 214MB Free: 245MBSoftware version 1.0 Rev.7728Bootloader version 5641Current connections Admin (169.254.11.169)
(None)Choose File
Upload configuration file
Recording: On Switch off
Configuration: Saved Save
Connection: Modem,Tunnel
Remaining: 09:50 ( 1 )
System Information
SystemInformationAdministrationUpgradeDisplayWeb CameraSwitchesSystem Log
MeasurementSensorsChannelsEvaluation
DataLiveStatisticsSource
CommunicationScheduleE-MailOnlineFTP/SCPSCADALANWLANModem
Download current configuration
中文(简) English Español Português Deutsch © 2011 Ammonit Measurement GmbHwww.ammonit.com
tunnel connection via modem09:50 min until CECS shuts down
one active action
connection via EthernetCECS permanently switched on
two active actions
File Edit View Go Bookmarks Tabs Help
Back https://d130080.local/system/administration/
Help Logout(Admin on D130080)
Logger Name
Logger nameDocu Test Logger
Save name
CECS power mode
CECS is always active (only recommended for SCADA and laboratory use)
Save CECS power mode
Restart CECS
Shutdown CECS
Date and Time, Position
Time zoneUTC+01:00
Set time and position using GPS
Set date and time using NTP (Internet)
NTP servers:0.pool.ntp.org 1.pool.ntp.org 2.pool.ntp.org 3.poo
Recording: On Switch off
Configuration: Saved Save
Connection: Ethernet,Tunnel
Remaining: 19:37 ( 1 )
Date/time: 2013-07-17 11:48:53 UTC+01:00
Administration
SystemInformationAdministrationUpgradeDisplayWeb CameraSwitchesSystem Log
MeasurementSensorsChannelsEvaluation
DataLiveStatisticsSource
CommunicationScheduleE-MailOnlineFTP/SCPSCADALANWLANModem
File Edit View Go Bookmarks Tabs Help
Back https://d130080.local/communication/schedule/
Help Logout(Admin on D130080)
ActionEMail 12:00 1 0:00 2013-07-1712:00
0%
ActionCopy 12:00 1 0:00 2013-07-1712:00
Run now
ActionOnline 12:00 00:40 1 0:00 2013-07-1712:00
60%
CSVFilesGenerate 12:00 1 06:00 — Run now
Save
Recording: On Switch off
Configuration: Saved Save
Connection: Ethernet,Tunnel
Remaining: ∞ ( 2 )
Date/time: 2013-07-17 11:49:26 UTC+01:00
Schedule
SystemInformationAdministrationUpgradeDisplayWeb CameraSwitchesSystem Log
MeasurementSensorsChannelsEvaluation
DataLiveStatisticsSource
CommunicationScheduleE-MailOnlineFTP/SCPSCADALANWLANModem
中文(简) English Español Português Français Deutsch Türkçe © 2011-2013 Ammonit Measurement GmbHwww.ammonit.com
Figure 3.3: Meteo-40 Status Box displaying Connection and Power Mode
The Meteo-40 Status Box displays the current established connections ( Connection), e.g., tunnel connection viamodem or using Ethernet without tunnel in the office. The available connection modes are USB, Ethernet and Modem.If the data logger is available through the tunnel, it will be shown as AmmonitConnect in the connections list. Thecurrent preferred connection for the Internet access is written in capital letters.
Additionally, the web interface informs about the remaining time until shut down or whether CECS is configured to runpermanently ( Remaining). In brackets the number of running actions are displayed, e.g., online access or upload ofCSV file.
© 2011 — 2021 Ammonit Measurement GmbH 27

3.3 Menu of the Web Interface
The menu of the Meteo-40 web interface consists of four main menu items: System, Measurement, Evaluation andCommunication. Each menu item is explained in the following chapters (See Chapter 4 to Chapter 7).
Menu Submenu Item
System
InformationAdministrationUpgradeDeviceCameraSwitchesLogbook
MeasurementSensorsChannelsEvaluation
DataLiveStatisticsGusts
Source
Communication
ScheduleOnlineAmmonitOREmailRemote CopySCADALANWLANModem
Table 3.2: Menu of the Web Interface
28 © 2011 — 2021 Ammonit Measurement GmbH

Data Logger Meteo-40 Plus User’s Manual 29 / 246
Chapter 4
System Configuration
4.1 System Information
This page gives an overview of important system properties, such as data logger type, serial number, available memory,software versions and number of channels.
© 2011 — 2021 Ammonit Measurement GmbH 29

Help LogoutAdminonD001234
URL:http://D001234.local/system/information/
Recording: Off Switchon
Configuration: Saved Save
Connection: Ethernet
Remaining: ∞
Date/time: 2020-10-0615:43:03UTC
SystemInformation
Dataloggertype Meteo-40Lplus
Serialnumber D001234
Numberofchannels
12analogvoltage,12counters,2analogcurrent,2currentsources,
8digital,8switches,8RS-485,4periodmeasurement
Activeinputchannels
None
Installedsensors None
Dataloggerlocation
13.43479,[email protected]
RAM Total:7696MiB,Used:3550MiBAvailable:3100MiB
Sourcedatastorage
31.51MiB(0.00%used,currentpage-id:0)---
Systemstorage Total:230805.86MiB,Used:91707.10MiBFree:139098.76MiB,Type:
[64,0]
Uptime CECS:7:11:36;MARS:0:00:11
Softwareversion 2.0~beta17(2020-10-01)
Bootloaderversion
DEMO
Productiondate <=2013
AmmonitOR ABCD
Signing/encryption signing
SCADA ModbusTCP
Currentconnections
NofileselectedChooseFile
Uploadconfigurationfile
中文(简) English Español Português Français Deutsch Türkçe ©2011-2020AmmonitMeasurementGmbHwww.ammonit.com
Meteo-40
System
Information
Administration
Upgrade
Device
Camera
Switches
Logbook
Measurement
Sensors
Channels
Evaluation
Data
Live
Statistics
Gusts
Source
Communication
Schedule
Online
AmmonitOR
RemoteCopy
SCADA
LAN
WLAN
Modem
Downloadcurrentconfiguration
Figure 4.1: System Information Page
Under Current connections all current logins are displayed with IP address, e.g., via LAN, W-LAN (WiFi), USB or tunnel.If a connection has been established via tunnel (see also Section 7.3), the letter T after the IP address indicates thetunnel.
Source data storage shows the amount of memory which is already in use for storing source data. Please note, thatmore than 100 % are possible. A value beyond 100 % means that the data logger is overwriting the oldest sourcedata by storing new data.
Use Download Current Configuration to download the configuration file. The configuration file is an INI file (http://en.wikipedia.org/wiki/INI_file), which is a widely-used file format. This file contains configurationsettings related to modem, Ethernet, server upload, email, data evaluation, SCADA as well as activated channels andsensors. By saving a configuration file, the configuration can quickly be uploaded and effectively applied to other dataloggers. The file name is config-Dnnnnnn.txt with Dnnnnnn as the serial number of the data logger.
30 © 2011 — 2021 Ammonit Measurement GmbH

Data Logger Meteo-40 Plus User’s Manual 31 / 246
WarningBe careful with uploading a changed INI file to the data logger. Inconsistencies can lead to malfunctions ofthe data logger.We strongly advice not to change manually any entry in the configuration file.
4.2 System Administration
This page contains different administration aspects of the data logger. Only users logged in as Admin can accessthe complete functionality of this section. If you are logged in as User, Viewer or Guest, changes in the System→ Administration menu are not possible.
Data Logger Name: By giving each Meteo-40 a name, the data loggers can be identified easier. The name appearsin the source data files header, on AmmonitOR (http://or.ammonit.com/) and in the config.txt file.
DataLoggerName
Dataloggername
Savename
Figure 4.2: Assigning a Data Logger Name
NoteThe data logger serial number is the most important ID to identify the data logger. Use the DataLogger Name to give the data logger a custom name, e.g. Meteo-40 Site 1.
CECS Power Mode The standard operation mode keeps CECS running for 20 minutes. Each user interaction resetsthe remaining time before automatic shutdown to 20 min. The CECS always active mode is not selected bydefault.
In order to keep CECS permanently running, e.g., for SCADA wind farm monitoring, Meteo-40 offers the CECSalways active mode. This mode prevents the automatic shutdown of CECS. It can be configured via web inter-face ( System → Administration) or by using the display( Status → CECS) of the data logger. To do any changesof the CECS mode via display, permissions have to be defined in the web interface ( System → Display(seeSection 4.4.1). If the CECS always active mode is selected, it will be displayed in the status box of the webinterface with the infinity symbol (∞) as well as on Meteo-40 display with the word Always.
© 2011 — 2021 Ammonit Measurement GmbH 31

CECSPowerMode
RestartCECS
ShutdownCECS
CECSisalwaysactive(onlyrecommendedforSCADAandSwitchManager)
AutomaticCECSreboot('Never'onlyrecommendedforSCADA)
Weekly
PowerCECSondigitalstatussignal
None
SaveCECSPowerMode
Figure 4.3: Configuring the CECS always active Power Mode
NoteIf the power supply for Meteo-40 is disconnected while CECS is running in the CECS always activemode, CECS will restart automatically as soon as Meteo-40 is powered again.
To ensure reliability of Meteo-40 function, it is highly recommended, that the CECS is rebootet regularly. Incases, where CECS is always on, e, e.g. for SCADA, Meteo-40 has an automatic reboot function. The defaultbehavior of Meteo-40 is to reboot just before the start of the week, i.e. every Sunday five minutes beforemidnight. Alternatively, you can choose to reboot every day five minutes before midnight, or never.To restart the CECS, click on Restart CECS.To shutdown the CECS, e.g., during remote access, click on Shutdown CECS.
ImportantWhen CECS is configured to be permanently active, you cannot shut down the system, neither bypressing the middle button on the data logger nor using the Shutdown CECS button at the webinterface. You can still restart the CECS with the Restart CECS button.
ImportantMARS(for measuring and recording) continues without stopping during the restart. You will not looseany measurement data unless the recording is explicitly switched off or the power supply has beendisconnected. For further details about the systems refer to Section 1.4.
You can start the CECS by applying a voltage peak to the selected digital channel. The voltage peak can betriggered over a cable / switch close to the ground. If this is prepared during the first installation, you mightprevent further climbing up the met mast during maintenance work.Once the CECS is on, the communication can be established remotely by any of the previously installed andforeseen methods (Modem, a previously connected Ethernet cable or WLAN). The CECS will automatically turnoff after 20 min, if no action on the data logger is performed.The voltage peak must last at least one second (see also Section 12.2.5). The digital channel has to be selectedfrom the list of available digital channels in the Power CECS on digital status signal dropdown list. This changeon data logger’s configuration will stop the measurement for some seconds, until it is automatically or manuallyrestarted (see Section 3.2).
Date and Time, Location: Time synchronization of the data logger is a primary concern. Four synchronisation meth-ods are available: GPS, NTP, SCADA and Manually.In order to synchronize date and time automatically to NTP servers, select Set date and time automatically.Additionally the time zone has to be set.
32 © 2011 — 2021 Ammonit Measurement GmbH

Data Logger Meteo-40 Plus User’s Manual 33 / 246
NTP is a networking protocol that allows clock synchronization between the computer systems. The NTP serversneed to be trusted, as they will impose the time on your data logger.
We provide a default set of the NTP servers from the NTP Pool. The NTP Pool is generally very high quality,but it is a service run by volunteers in their spare time. If you wish to change an NTP serever, feel free to do so.
We recommend putting at least three trusted NTP servers on the NTP server list. Having less than three canpotentially bring problems. If they start to show different times, which one is to be trusted? With at least threeservers, it is easy for the device to decide which one shows the current time incorrectly.
The first NTP synchronisation happens two minutes after every logger reboot. After that, it is repeated every 6hours, just to make sure that the clock is always showing the correct time.
Optionally, you can also choose to Set date, time and location using GPS. The GPS device must provide asentence following the GPRMC NMEA standard (e.g. PHS8-P modem).
The CECS will attempt to get the date, time and location when it turns on, whenever this form is saved, andevery six hours.
The Minimal offset for automatic time adjustments (seconds) field can be used to only adjust the time when thedifference is sufficiently large, so that there are less discontinuities in the measurement data.
If date and time should be set manually, enter date (date format YYYY-MM-DD) and time (time format hh:mm:ss)in the appropriate fields. Date and time format are validated while typing the values.
Every date, time and/or location adjustment is logged in the Logbook. Moreover, the current latitude and longi-tude as well as the time of the GPS adjustment are included in each CSV file’s footer.
DateandTime,Location
Timezone
UTC(UnitedKingdom,Morocco)
MethodtosetDate,TimeandLocation
Manually,setdate,timeandlocation
NTPservers
0.pool.ntp.org1.pool.ntp.org2.pool.ntp.org3.pool.ntp.org
Date(YYYY-MM-DD)
Time(hh:mm:ss)
Latitude(decimal)
13.43479
Longitude(decimal)
52.50176
Altitude(meters)
36.5
Save
DownloadKMLfile
Figure 4.4: Configuring Date, Time and Location of the Data Logger
In order to view the data logger location in GIS programs or Google Earth™, you can set the data logger location(not altitude) either automatically via a GPS device, or manually by entering latitude, longitude, and altitude inthe appropriate fields. Enter latitude and longitude in the decimal format ( dd.dddddd°), not in degrees andminutes ( dd°mm.mmmm′, like GPS) nor in degrees, minutes, and seconds ( dd°mm′ss.ss″).
After downloading the KML file, you can open the file in Google Earth™.
© 2011 — 2021 Ammonit Measurement GmbH 33

Figure 4.5: Data Logger Location displayed in Google Earth™
User Management: By default there are four user accounts: Admin, User, Viewer and Guest. Each account hasits own level of permissions and access rights, described in Table 3.1. Here you can change their passwords,delete any that you do not need, and create new ones.
Name Permissions
Admin Admin
User User
Viewer Viewer
Guest Guest
Edit Delete
Edit Delete
Edit Delete
Edit Delete
AddaNewUser
Figure 4.6: User List
To change a password, click ”Edit”. To remove an account, click ”Delete”.
To create new accounts click ”Add a New User”. You need to set the Username and Password that they willuse to log in, and what level of permissions they will have when they do. The rights offered by each level ofpermissions are described in Table 3.1.
34 © 2011 — 2021 Ammonit Measurement GmbH

Data Logger Meteo-40 Plus User’s Manual 35 / 246
Name
joebloggs
Permissions
Admin
Password
•••••••• Showpassword
Save
Figure 4.7: Add a New User
Users created this way will be visible in the list alongside the default users. They can also be changed just likethe built-in ones.
Name Permissions
Admin Admin
User User
Viewer Viewer
Guest Guest
joebloggs Admin
Edit Delete
Edit Delete
Edit Delete
Edit Delete
Edit Delete
AddaNewUser
Figure 4.8: User List with Custom User
Once created, a user’s name cannot be changed. You can achieve the same thing by deleting the user whosename you’d like to change and re-creating it with the correct name.
An Admin can’t delete their own account. To remove the built-in Admin account, you must first create anotheraccount with Admin permissions. You can then use that account to remove the built-in Admin.
A deleted account is not logged out immediately. However, all accounts (including deleted ones) are logged outwhen CECS restarts.
WarningBe aware that due to security reasons it is not possible to reset passwords. If you lose a modifiedAdmin password, there is no way to recover it, not even for Ammonit. In this case, return the datalogger to Ammonit. Only Ammonit is able to restore the original passwords.
Signing and Encryption Files sent by Meteo-40, such as CSV data or logbook files, can optionally be digitally signedor encrypted using the OpenPGP standard. The signature guarantees, that the files have been really producedby a specific data logger and have not been altered. The encryption ensures, that nobody can see the contentsof the files without the right password.
© 2011 — 2021 Ammonit Measurement GmbH 35

SigningandEncryption
Unsignedandunencrypted
Signdata(GnuPG)
Signandencryptdata(GnuPG)
Encryptionpassword:
Showpassword
Fingerprint
596F1223EBAD2FE56B5C947EF0554D0862153BE7
Forceencryption
Save
Downloadpublickey(GnuPG)
Figure 4.9: Signing and Encryption
For additional security, the user Admin can set the option Force Encryption. If this option is set, users otherthan Admin have only restricted access to measurement data:
• CSV files can only be downloaded in encrypted form.• CSV files can only be copied to USB flash drive in encrypted form.• Live data can be seen only for 2 minutes on the web interface, but still unlimited on the LC display.• Source data cannot be downloaded nor copied to USB flash drive.• Data transfer settings (AmmonitOR, Email, Remote Copy, SCADA) cannot be changed.
NoteThe signature for a CSV file refers to the canonical, uncompressed CSV file. Before version 1.4.2,the signature referred to the compressed CSV file as sent by the data logger, however.
NoteIf the Meteo-40 data logger has been produced before 2014-08, the digital signature is not available,only encryption (since firmware version 1.0.1). Please contact Ammonit, if digital signature is requiredon a previously purchased data logger.
Allow Manufacturer Administration In some cases it is necessary that Ammonit developers have access to yourdata logger to check configurations or to modify any settings. The mode is only used for maintenance purposes.Activate the manufacturer administration mode to allow Ammonit developers accessing your data logger.
By default the manufacturer administration mode is inactive.
If the manufacturer administration mode is activated, you can start the manufacturer tunnel communication withthe ’Start’ button.
36 © 2011 — 2021 Ammonit Measurement GmbH

Data Logger Meteo-40 Plus User’s Manual 37 / 246
AllowManufacturerAdministration
Allowmanufactureradministration
Save
Start
Stop
Figure 4.10: Allow Manufacturer Administration
ImportantWithout your permission, Ammonit will never access any of your data loggers!
Reset Data: In order to delete all measurement data in one step, click on Delete all measurement data. The user willbe asked to approve a confirmation prompt.
Help Logout
AdminonD001234
URL:http://D001234.local/confirm/format
Recording: Off Switchon
Configuration: Saved Save
Connection: Ethernet
Remaining: ∞
Date/time: 2020-10-0615:43:24UTC
ConfirmMemoryFormat
Ifyouclick"Yes",allsourcedatawillbedeleted!
Areyousure,youwanttodeleteallmeasurementdata?
No,cancel
Yes,delete
Figure 4.11: Deleting All Measurement Data
ImportantRecording stops after deleting measurement data. Start recording by clicking Switch on in the statusbox of the web interface.
In order to delete all configurations, passwords and measurement data, click on Factory reset, delete all data.The data logger will be set back to the condition at delivery. The user will be asked to approve a confirmationprompt before the reset is performed.
© 2011 — 2021 Ammonit Measurement GmbH 37

Help LogoutAdminonD001234
URL:http://D001234.local/confirm/factory_reset
Recording: Off Switchon
Configuration: Saved Save
Connection: Ethernet
Remaining: ∞
Date/time: 2020-10-0615:43:25UTC
ConfirmFactoryReset
Ifyouclick"Yes",allsettingsanddatawillbedeleted!
Areyousure,youwanttodeleteallsettingsandmeasurementdata?
No,cancel
Yes,delete
Figure 4.12: Factory Reset
NoteAfter performing a factory reset, recording stops. Recording can be started after at least one sensorhas been configured.The data reset is logged in the Meteo-40 logbook.
Scanning disk for errors Used to scan the file systems of the data logger. Perform the scan only on demand ofAmmonit. For further details, ask the Ammonit developers.
4.3 Upgrade Data Logger Software
The development of Meteo-40 is in constant process. Ammonit is continually adding new features to the data loggeraccording to user needs.
ImportantIn order to perform a software upgrade, the data logger has to be connected to the Internet, e.g., viamodem or LAN or using the tethering function of a mobile phone ( Section 4.3.1). It is not sufficient toconnect Meteo-40 to a PC over USB, because a PC is not necessarily configured to work as a router.You have to be logged in as Admin to perform an upgrade.If you do not have an Internet connection, you may upgrade the data logger offline, using a USB flash drive.See Section 4.3.3 for details.
Update software list: In this step the data logger browses for updates and displays the number of available softwarepackages. Below the progress bar the currently installed version is displayed; the latest version describes theavailable upgrade.
NoteThe new software itself will not be downloaded and installed after clicking on Update software list.The software version is not changed in this step!
38 © 2011 — 2021 Ammonit Measurement GmbH

Data Logger Meteo-40 Plus User’s Manual 39 / 246
Updatesoftwarelist
Updatesoftwarelist
Installed:2.0.0.Latest:2.0.1.
Requireddownload
5Packages,1.060MiB
Upgradedataloggersoftware
Downloadsoftware
Installsoftware
100%
0%
0%
Figure 4.13: System Upgrade
Upgrade data logger software: The software upgrade can easily be performed by pressing the Upgrade data loggersoftware button. The software packages will be downloaded and installed.
After the installation is completed, CECS is restarted.
NoteIn older firmware versions the data logger has to be restarted after the upgrade. Press the Restartdata logger button.
ImportantBefore upgrading the data logger via modem, make sure that the corresponding switch is configuredcorrectly in the Communication → Modem menu of the data logger web interface.Depending on the installed firmware version, the software packages needed for the upgrade can belarge. So the download and installation process can take some time depending on the speed of yourInternet connection.In rare cases the progress bar in the Meteo-40 web interface may seem to have stopped. Wait! Ifthe progress bar does not move for a certain time, we recommend restarting the upgrade process.Do not disconnect the power supply or reboot the system during the whole upgrade process.
© 2011 — 2021 Ammonit Measurement GmbH 39

Updatesoftwarelist
Updatesoftwarelist
Installed:2.0.0.Latest:2.0.1.
Requireddownload
5Packages,1.060MiB
Upgradedataloggersoftware
Downloadsoftware
Installsoftware
100%
100%
50%
Figure 4.14: System Upgrade
4.3.1 Upgrade using a Smartphone
The Meteo-40 data logger can only be upgraded when it is connected to the Internet.
By connecting your smartphone to the data logger, you can set up an Internet connection via the tethering function ofthe smartphone.
Connect your smartphone to your Meteo-40 data logger via USB (USB-A slot of the data logger and micro USB slotof the smartphone). Make sure, that the data logger has no Ethernet LAN connection during the procedure, i.e. indoubt just unplug the Ethernet cable from the data logger. Open the settings for Tethering and portable hotspot of thesmartphone operating system (see Figure 4.16) and activate USB tethering.
ImportantBefore starting the upgrade via tethering, make sure that Use DHCP for wired network is selected in theCommunication → LAN menu of the Meteo-40 web interface. Additionally, make sure Connect to Internetvia modem only is not selected in the Communication → LAN menu of the Meteo-40 web interface.
File Edit View Go Bookmarks Tabs Help
Back https://d130080.local/communication/lan/
usb0 Unavailable Unknowneth0 Activated 192.168.12.61
LAN online, whenever CECS is on
Use DHCP for wired network
Connect to internet via modem only (recommended e.g. for SCADA)
LAN switch (typically S1):S3
IP address192.168.40.40
DNS server192.168.40.1
Gateway192.168.40.1
Subnet mask255.255.255.0
Additional subnets
Save
SystemInformationAdministrationUpgradeDisplayWeb CameraSwitchesLogbook
MeasurementSensorsChannelsEvaluation
DataLiveStatisticsSource
CommunicationScheduleOnlineAmmonitOREmailFTP/SCPSCADALANWLANModem
important settings for upgrade via tethering
Figure 4.15: Settings for Firmware Upgrade via Tethering
Browse at Meteo-40 display for the IP address using the keys ( Communication → Devices → LAN → USB (Activated)→ IP settings). Enter the data logger’s IP address in your smartphone browser, login and perform the upgrade.
40 © 2011 — 2021 Ammonit Measurement GmbH

Data Logger Meteo-40 Plus User’s Manual 41 / 246
Figure 4.16: Tethering Settings of an Android™ smartphone
TipThe tethering function can also be very useful for remote servicing.
4.3.2 Software Upgrade Behind a Firewall
For most firewalls, that allow outgoing HTTPS and HTTP traffic, no special configuration is needed. Only in somevery restrictive environments, you may need to configure your firewall for the Meteo-40 software upgrade or ask yournetwork administrator to do so. If Meteo-40 is in a separated subnet, you may also need to specify a Gateway in theLAN settings of the data logger.
Meteo-40 needs to connect the server archive.ammonit.com via HTTPS(port 443, since version 1.5) or HTTP(port80, before version 1.5) as outbound connection to perform a software upgrade. Make sure, that these connectionsare allowed. There is no need for Meteo-40 to connect any other servers, use any other protocols or use any kind ofinbound connections.
4.3.3 Offline Upgrade using USB Flash Drive
WarningNote, that this method is not the preferred software upgrade method. If possible, please use the onlineupgrade method.Make sure, you have saved all your data and your configuration before performing an offline upgrade.
4.3.3.1 Prepare the Offline Upgrade
1. Make sure, that all relevant data from data logger is saved: Configuration file, CSV files, and, if necessary,source data.
2. Make sure, the software version you like to upgrade to is actually newer than the software version alreadyinstalled on the data logger. Downgrades are not supported. Always use the latest offline update image fromAmmonit, because errors of older versions might be fixed!
3. You need to get a download link from Ammonit, which leads you to a zip archive, Meteo-40_ version.zip. Download and unpack this zip archive on your PC. You will need the meteo-40.bin.
4. You need a prepared USB flash drive of at least 1 GiB capacity. The flash drive must formatted as FAT32. Thefile meteo-40.bin must be placed in the top-level of the flash drive, not in a directory. You will get the file onrequest from Ammonit.
© 2011 — 2021 Ammonit Measurement GmbH 41

4.3.3.2 Performing the Offline Upgrade
1. Switch off the CECS of the data logger. In doubt, remove the power supply.
2. Plug the prepared USB flash drive into one of the two USB-A slots of the Meteo-40.
3. If necessary, reconnect the power supply of the data logger. Switch on the CECS.
4. You will see the following text on the LC display:
Found imagefor USB upgrade.
Press the > buttonto proceed.
Figure 4.17: Press the right arrow button
You have to press the right arrow button within ten seconds, otherwise the boot process continues normally andno upgrade will be performed.
5. For around half a minute, the following message appears:
Readingimage for
USB upgrade.Please wait...
Figure 4.18: Reading the image
WarningAfter that step interrupting the process, unplugging the USB flash drive, or a power failure can leadto an non-functional data logger!
6. The complete process takes around eight minutes, until the following message appears:
SUCCESS:Remove power plug,
wait 3s, andremove USB drive.
Figure 4.19: Successful upgrade
which should be performed accordingly: Remove the power supply of the data logger, wait at least three sec-onds, remove the USB flash drive, and re-enable the power supply of the data logger.
4.4 The Device Page
4.4.1 Display Access
The display page shows, what can be seen on the LCD.
42 © 2011 — 2021 Ammonit Measurement GmbH

Data Logger Meteo-40 Plus User’s Manual 43 / 246
>System
Status
Channels
Communication
RemoteDisplay
Figure 4.20: Remote Display
In order to give users without access to the web interface the chance of configuring the data logger, some permissionsfor display users can be selected, e.g., switch on recording or (de-)activate W-LAN.
If the corresponding permission Run an action is set, you can also start the execution of an action over the displaymenu Communication → Schedule. Select one of the actions and press the right button to start it.
DisplaySettings
PermissionsofDisplayUser
ChangeCECSmode
SwitchbetweenDHCP,staticIP,andlink-local
Switchoffrecording
Switchonrecording
Changethestateofswitches
(De-)ActivateWLAN
Runanaction,e.g.goonline
OtherSettings
Activatedisplaybacklight
Save
Figure 4.21: Display Settings
NoteTo view the display in the web interface, it is advised to enable JavaScript in your web browser.
4.4.2 Connected USB Devices
Also on the device page, you can find a list of the USB devices, that are currently connected to the data logger andrecognized by it, e.g. a modem, a flash drive, or a camera.
© 2011 — 2021 Ammonit Measurement GmbH 43

NoteThe list of devices is not updated automatically. You have to reload the page to see any changes.
4.4.3 USB Flash Drive Copy
Meteo-40 offers the possibility to download created CSV statistics files with measurement data (statistics see Sec-tion 6.3), the source data in CSV format, and/or the logbook in CSV format on an USB flash drive, which is connectedto the data logger. Before you use this function, data logger and USB flash drive have to be configured.
USBFlashDriveCopy
USBpassphrase(atleasteightcharacters)
••••••••••••••••• Showpassword
SaveUSBpassphrase
ShowUSBfiles
Figure 4.22: Configuring the USB Flash Drive Copy
ImportantA file system like FAT32, NTFS, ext4, ext3, or ext2 is required on USB flash drive.
In order to format the USB flash drive with FAT32 on your Windows™ PC, connect the USB stick to the PC. Open theWindows™ Explorer. Right-click on the USB flash drive shown under Computer. Click on Format... and select FAT32as File system. Start the formating process.
Figure 4.23: Formatting the USB flash drive ( Windows™ PC)
Create a INI file named keyfile.txt, which has to be saved on the USB flash drive used to download CSV files(statistics and/or source data). This INI file must include the data logger serial number and a password in a the INI fileformat. The INI file is necessary to prevent unauthorized access to data. Example:
44 © 2011 — 2021 Ammonit Measurement GmbH

Data Logger Meteo-40 Plus User’s Manual 45 / 246
[D123456]password = yoursecretpasswordstatistics = all
NoteThe passphrase for the USB stick must have at least 8 characters!
The passphrase has to be entered in the field shown in Figure 4.22.
It is possible to use one USB flash drive for several data loggers. To do so, in the keyfile.txt the details of thedata loggers have to be entered section by section, e.g.,
[D123456]password = passwordonestatistics = since 2016-01-01gustdata = since 2016-01-01config = savelogbook = all
[D234567]password = passwordtwostatistics = newest 10config = savesourcedata = all
[D345678]password = passwordthreestatistics = month 2016-01config = savesourcedata = day 2016-01-07
The following entries are possible:
password Mandatory, must have at least eight characters
statistics One of the time period values, see below. Copies the primary statistics files.
secondary One of the time period values, see below. Copies the secondary statistics files.
tertiary One of the time period values, see below. Copies the tertiary statistics files.
config Value save to copy the configuration file. Other values are not yet implemented.
logbook One of the time period values, see below.
gustdata One of the time period values, see below.
sourcedata One of the time period values, see below.
WarningCopying source data may take a very long time, even some hours.
The time period values are:
all Copy all files of this type.
since DATE Copy files of this type since and including DATE in format YYYY-MM-DD.
until DATE Copy files of this type until and including DATE in format YYYY-MM-DD.
© 2011 — 2021 Ammonit Measurement GmbH 45

month DATE Copy files of this type in the month of DATE in format YYYY-MM.
day DATE Copy files of this type at the day of DATE in format YYYY-MM-DD.
newest NUMBER Copy newest files of this type, max. NUMBER.
oldest NUMBER Copy oldest files of this type, max. NUMBER.
Meteo-40 has to be switched on for download. If the USB flash drive is configured correctly, it will be recognized by thedata logger. If the passphrase, entered in the web interface and in the keyfile.txt does not match, data downloadis not possible.
Meteo-40 shows in its display the number of downloaded files. When the download is finished, the data logger menuis shown and the USB flash drive can be disconnected.
By using this function, always all available files are copied to the USB flash drive. All data files are compressed tokeep them as small as possible.
NoteIf encryption and/or digital signature is switched on for the data logger, copying to the USB flash drivebehaves accordingly, i.e. data will be encrypted and/or signed.If the Force Encryption option is enabled, copying source data to USB flash drive is prohibited.
4.4.4 Access to USB Drive Files
4.5 Using a Camera
You can take pictures with Meteo-40 and send the image to AmmonitOR, as an email attachment, copy it to anSCP/FTP/SFTP file server or copy it to a permanently connected USB flash drive. Each of these options must beindividually configured. See the respective checkboxes in the Communication → AmmonitOR, Communication →Email, and Communication → Remote Copy submenus.
You can either use a USB webcam plugged into one of the two USB-A slots or an Ethernet connected camera byHTTP/HTTPS.
46 © 2011 — 2021 Ammonit Measurement GmbH

Data Logger Meteo-40 Plus User’s Manual 47 / 246
Help LogoutAdminonD001234
URL:http://D001234.local/system/camera/
Recording: Off Switchon
Configuration: Saved Save
Connection: Ethernet
Remaining: ∞
Date/time: 2020-10-0615:43:47UTC
Camera
CurrentCameraImage
Refreshimage
CameraImageSettings
CameraImageURL:
CopyCameraImagetoUSBDrive
Savecamerasettings
中文(简) English Español Português Français Deutsch Türkçe ©2011-2020AmmonitMeasurementGmbHwww.ammonit.com
Meteo-40
System
Information
Administration
Upgrade
Device
Camera
Switches
Logbook
Measurement
Sensors
Channels
Evaluation
Data
Live
Statistics
Gusts
Source
Communication
Schedule
Online
AmmonitOR
RemoteCopy
SCADA
LAN
WLAN
Modem
Figure 4.24: Camera Image
NoteIf the camera should be used for monitoring purposes, a steady power supply has to be connected.
4.5.1 Camera Configuration
To take one or more photos with an outdoor camera, just enter the URL of the photo in the web interface. The URLdepends on the installed camera, e.g., http:// nn.nn.nn.nn/ or https:// nn.nn.nn.nn/. Mobotix M25M
© 2011 — 2021 Ammonit Measurement GmbH 47

camera image URL typically is http://10.13.0.197/record/current.jpg.
CameraImageSettings
CameraImageURL:
CopyCameraImagetoUSBDrive
Savecamerasettings
Figure 4.25: Attaching Camera Images
If you connect the cammera via Ethernet, it is recommended to use static IP addresses. You must configure both thecamera and Meteo-40, each with a different address in the same network. E.g. 10.13.0.197 for the camera and10.13.0.200 for the data logger. In this case, the netmask would be 255.0.0.0. DNS server and gateway are notrelevant here.
The static IP address of Meteo-40 can be configured in the Communication → LAN menu (see Section 7.7). In orderto configure the IP address of the camera use the software delivered with it.
To minimize the energy consumption, the Ethernet port is not always active but is automatically activated only whenneeded, i.e. when the image has to be acquired and shared by means of one of the methods (AmmonitOR, email orRemote Copy). This means, you might not see an image on accessing the System → Camera menu (see Section 4.5)menu. You will know if the Ethernet interface is active because it will appear at the connections list in the status boxof the web interface.
If you want the Ethernet port to be always active despite the higher power consumption, you can configure it in Com-munication → LAN menu (see Section 7.7).
In order to reduce the data traffic when a camera is sending pictures frequently, we can restringe the modem tunnelcommunication to the scheduled online times. The option Prevent implicit AmmonitConnect activation inmenu Communication → Online must be active. The option Modem online whenever CECS is on (recommended)must not be active.
ImportantIf a USB modem is connected to Meteo-40 and Ethernet is used for the camera, it is necessary to selectConnect to Internet via modem only in the Communication → LAN menu.
4.6 Configuring Switches
Switches can be used to control and optimize the power consumption of the measurement system. External devicesconnected to Meteo-40, such as modem, camera or heating can be controlled via the data logger. Meteo-40 will close(turn on) the configured switch when the correspondig device is needed, e.g., to send data via the modem connection,and open it again (turn off) when not needed.
In a solar power plant, a switch can be used to orient the solar trackers for protection of the payloads in case of highwind.
Meteo-40L data logger provides eight switches intended for the following tasks:
• Control the modem power supply (recommended). See Section 7.9 for GSM and Section 7.7 for satelite.• Control camera power supply. See Section 7.7.• Control of the selected switch according to the configured measurements and thresholds Section 4.6.1.
A switch can only fulfill one of the duties. It can either be used to control the modem’s power supply or at the SwitchManager.
48 © 2011 — 2021 Ammonit Measurement GmbH

Data Logger Meteo-40 Plus User’s Manual 49 / 246
To manually toggle one or more of the switches individually, go to the System → Switches menu.
Switches
Id Label State Action
S1 Modem On Turnoff
S2 Heating Off Turnon
S3 Off Turnon
S4 Off Turnon
S5 Off Turnon
S6 Off Turnon
S7 Off Turnon
S8 Off Turnon
Figure 4.26: Switch Configuration
WarningWe highly recommend configuring a switch for the modem in the Communication → Modem menu. If themodem is switched manually via the System → Switches menu, you risk the shutdown of the modem afterrebooting the data logger or after problems with the power supply.In Meteo-40 firmware version higher than 1.0 Rev.13915 switch S1 is set by default for the modem. In casethe switch is not used for the modem, it can be deselected.
NoteRefer to Chapter 13 for more information about physically connecting the supply using a switch.
4.6.1 Switch manager
The Switch manager is designed to autimatically toggle one of the switches deppending on the configured condi-tions. It is commonly used for sensor’s heating control. Only one switch can be selected.
In order to use this function, select a switch as well as one or more switching conditions. The available switchingconditions are temperature range, minimum humidity, minimum voltage, minimum windspeed and two time frames. Ifmore than one condition is configured, the switch will only be closed (i.e. On) when all conditions are fulfilled. If onlyone time frame is needed, the duration of the second time frame duration must be set to 00:00. If the inverted logicis selected, the switch will remain closed as long as the conditions are not fulfilled. Only configured sensors and freeswitches are listed.
The state of the selected switch is reviewed according to the values calculated at the end of the configured statisticsinterval for SCADA, Switch manager and snapshots in the Data → Statistics menu. The default statistics interval is10 min. The average value is used for temperature, humidity and voltage whereas the maximum is used for windspeed.
ImportantIt is necessary to keep the CECS always on if the switch manager is deployed. The state of the switchcan only be closed (i.e. On) when CECS is running, i.e., to perform an action (see Section 7.2) or if CECSis configured to be Always on(see Section 4.2). On CECS shut down, the selected switch is is opened(turned Off).
© 2011 — 2021 Ammonit Measurement GmbH 49
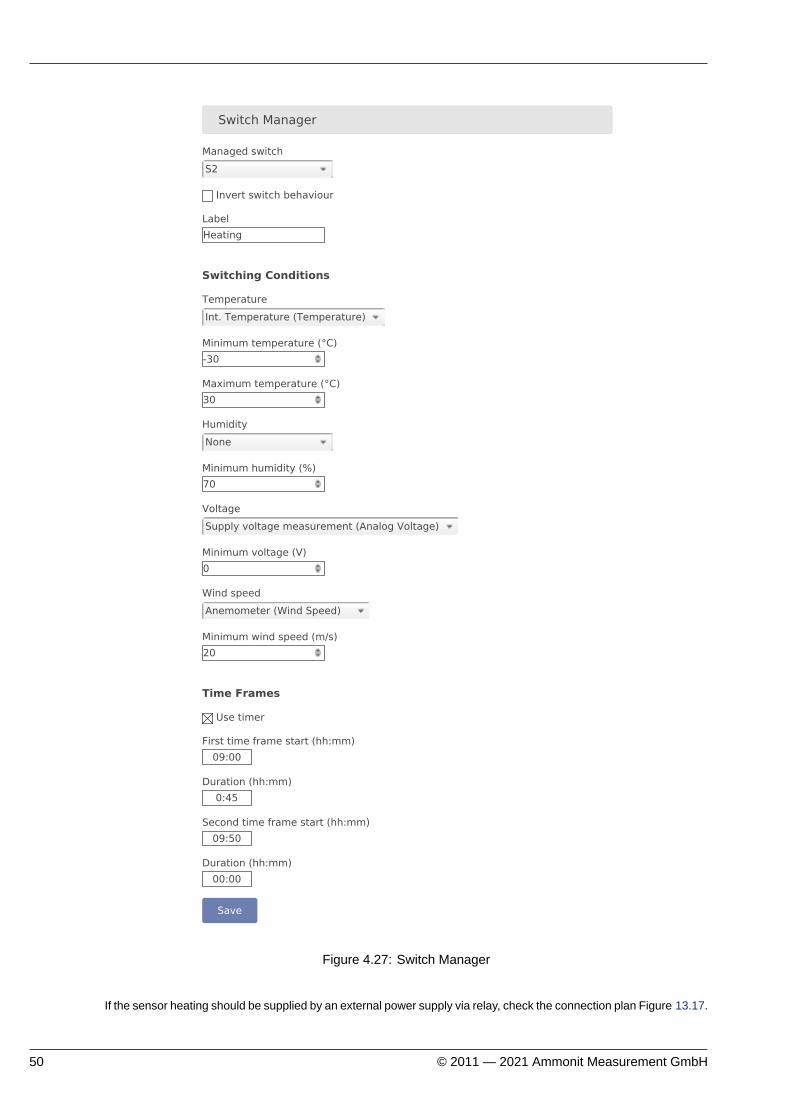
SwitchManager
Managedswitch
S2
Invertswitchbehaviour
Label
Heating
SwitchingConditions
Temperature
Int.Temperature(Temperature)
Minimumtemperature(°C)
-30
Maximumtemperature(°C)
30
Humidity
None
Minimumhumidity(%)
70
Voltage
Supplyvoltagemeasurement(AnalogVoltage)
Minimumvoltage(V)
0
Windspeed
Anemometer(WindSpeed)
Minimumwindspeed(m/s)
20
TimeFrames
Usetimer
Firsttimeframestart(hh:mm)
09:00
Duration(hh:mm)
0:45
Secondtimeframestart(hh:mm)
09:50
Duration(hh:mm)
00:00
Save
Figure 4.27: Switch Manager
If the sensor heating should be supplied by an external power supply via relay, check the connection plan Figure 13.17.
50 © 2011 — 2021 Ammonit Measurement GmbH

Data Logger Meteo-40 Plus User’s Manual 51 / 246
4.7 Using the Logbook
Events, which are not related to measurement data, are listed in the logbook. The logbook displays for example alluser logins and the user’s IP address. A calendar is shown with a monthly overview. Green highlighted boxes indicatedays with logbook entries. By clicking on the day, the entries are displayed. Click on the arrows shown above thecalender to go to the previous or next month.
It is also possible to add entries to the logbook, e.g., to record replacements of sensors or any maintenance work thatis important for data interpretation. Record messages by clicking on Log a message. A short text message can beedit.
Logbook entries of a day can be downloaded by clicking on the Download button.
2016 05 06 07 08 09 10 11 122017 01 02 03 04 05
◁ 2015-06Mon Tue Wed Thu Fri Sat Sun
1 2 3 4 5 6 78 9 10 11 12 13 1415 16 17 18 19 20 2122 23 24 25 26 27 2829 30
Date/TimeDate/Time
MessageMessage
MeasurementandRecordingErrors
RS485_TIMEOUT
Resetmeasurementerrors
▶
Logamessage Download Downloadmonth Downloadyear Downloadall
Figure 4.28: Logbook
MARS errors are indicated by the red LED (second from bottom). A detailed list containing error codes is reportedbelow Measurement and Recording Errors. By clicking on Reset Measurement Errors the list of errors can be deleted.
NoteThe MARS error codes can be important for Ammonit engineers to locate errors in the data logger.
4.7.1 Logbook Events
The following actions or events are logged to the logbook:
• User note to logbook• Log in of a user and failed login attempt• Factory reset• Memory format• Configuration file upload• Setting date and time via GPS, NTP, EKO sun tracker, SCADA or Admin (manually)• Setting location via GPS or EKO sun tracker• Copying data to USB flash drive• Software upgrade• Password reset by manufacturer
© 2011 — 2021 Ammonit Measurement GmbH 51

• CECS start/stop• Actions execution• Actions initiated by a short message ( SMS)• RS485-M Serial Console
52 © 2011 — 2021 Ammonit Measurement GmbH

Data Logger Meteo-40 Plus User’s Manual 53 / 246
Chapter 5
Measurement
5.1 Sensor Configuration
In the Measurement → Sensors menu, sensors can be added and basic parameters can be configured by using theSensor Helper (see Section 5.1.2). After having configured the sensors, two buttons are available for each sensor:Delete and Change. These allow a user to delete or change an existing sensor with help of the Sensor Helper.
Label Type Model Height SerialNo. Rate Channels Change Delete
Top
AnemometerAnemometer
Thies
Anemometer
FirstClass
Advanced
120 1s C1 Change Delete
Backup
AnemometerAnemometer
Thies
Anemometer
FirstClass
Advanced
118 1s C2 Change Delete
Middle
AnemometerAnemometer
Thies
Anemometer
FirstClass
Advanced
60 1s C3 Change Delete
Low
AnemometerAnemometer
Thies
Anemometer
FirstClass
Advanced
10 1s C4 Change Delete
TopWindVane WindVane
ThiesWind
Vane10Bits
SerialSynchron
120 1s D1 Change Delete
BackupWind
VaneWindVane
ThiesWind
Vane10Bits
SerialSynchron
118 1s D2 Change Delete
LowWindVane WindVane
ThiesWind
Vane10Bits
SerialSynchron
60 1s D3 Change Delete
Hygro/Thermo
@10.0mHygro/Thermo
GalltecHygro-
ThermoActive
KP
10 1s A1,A2 Change Delete
Barometer
@10.0mBarometer
Barometric
Pressure
SensorAB60
10 1s A3 Change Delete
Addsensor
Deleteallsensors
RS485-Mserialconsole
Figure 5.1: Sensor Definitions
© 2011 — 2021 Ammonit Measurement GmbH 53

Below the sensor definitions overview you can find four buttons: Add sensor, Undo, Delete all sensors and RS485-Mserial console.
Add sensor: Opens the Sensor Helper to configure a new sensor.
Undo: Click on this button to undo your last action.
Delete all sensors If all sensors should be deleted, e.g., after a completed measurement campaign, you can click onDelete all sensors to remove all sensors from the configuration in one step.
RS485-M serial console Occasionally send a command to a sensor connected to the RS485 Master port. This canbe useful for debugging communication problems or to change sensor’s configuration (see Section 5.1.4).
NoteBy clicking on a column headline in the sensor definitions overview, you can sort the selected column inascending or descending order.
NoteWhen configuring sensors, recording can be switched off, because during the time of configuration, thevalues are typically useless. When adding a new sensor or changing the electrical channel of a sensor,recording is stopped automatically. Also, if no sensors at all are configured, recording is switched off.Afterwards, one can switch on recording. Also, recording will be switched on automatically after 20 minutesof no further configuration changes.
ImportantFor some estimations related to solar sensors, the GPS location of the measurement station has to beadded in the System → Administration menu (see also Section 4.2).
WarningAdding or deleting a sensor, switches off recording. The new configuration is unsaved! By clicking onSwitch on, recording will be activated and the configuration will be saved automatically in one step.
5.1.1 Difference between Sensors, Channels, and Evaluations
To have a better understanding of the sensor management, it is important to know the difference between sensors,channels, and evaluations.
In general, a sensor is an electro-mechanical device, which records physical values. The physical values are trans-formed into an electrical value by the sensor. For example, wind speed can be transformed into a frequency. To mapthese electrical values on the corresponding physical values, an evaluation process has to be performed.
A sensor may be connected to more than one electrical channel of Meteo-40. The number of used electrical channelsdepends on the kind of sensor and also on the kind of electrical wiring of the sensor. For example, wind vane POT(potentiometer) may use the two analog channels A1 and A2. Another example is the pyranometer Delta-T SN1 thatemits two analog voltage signals and one digital status signal. The two analog output signals have to be connected totwo analog voltage channels and the digital status signal has to be connected to one digital input.
The evaluation process of the measured values is done by the software of the Meteo-40 data logger. Both pieces ofdata are saved: the measured physical value at every channel and the evaluated value. Some typical formulas aredisplayed below.
Most anemometers deliver a rectangle pulse output signal with a frequency proportional to the instant speed. Con-necting it to a counter input (i.e., C1 to C12), its frequency will be measured. For the evaluation of wind speed a linearformula will be applied using slope and offset values given in the configuration of the Measurement → Sensors menu.
54 © 2011 — 2021 Ammonit Measurement GmbH

Data Logger Meteo-40 Plus User’s Manual 55 / 246
vwind =
{slope · Cx+ offset : Cx > 0minimalvalue : Cx = 0
Equation 5.1: Linear Equation for Wind Speed
A counter value of 0 results in an output equal to the minimal_value instead of the offset. The offset is ignoredin that case. Leaving the minimal_value field blank is equivalent to setting it equal to the offset.
WarningIn Meteo-40 version 2.1.0 and below, the minimal_value was always 0.
The output signal of many pyranometers is an analog voltage. To measure and record this signal, the output of thepyranometer should be connected to an analog voltage input (i.e., A1 to A12). To interpret the value of the apparentsolar radiation, the measured value is internally divided by the specific sensitivity of this sensor. In this case sensitivityhas to be configured.
5.1.2 Sensor Helper
In order to simplify the configuration of sensors, Meteo-40 provides a Sensor Helper in the Measurement → Sensorsmenu. The Sensor Helper is a wizard, which guides you through the sensor configuration. It will appear when youattempt to Add sensor or Change a sensor, a channel or an evaluation.
You must select of the available sensor types (e.g., anemometer, wind vane, barometric pressure sensor, solar sensor,etc.) and the supported models. If the sensor appears in the list, the appropriate channel settings will be automaticallyselected as shown in Figure 5.2. Depending on the sensor, further settings can be configured by the user, e.g., Slope,Offset, Sensitivity, measurement rate, channel, etc.
ImportantIf the sensor doesn’t appear in the list of preconfigured sensor, you can always use a generic sensor fromthe Other Sensor list.
NoteOnly channels and switches which are not already used by other sensors are available.
© 2011 — 2021 Ammonit Measurement GmbH 55

Sensortype
Anemometer
Sensor
ThiesAnemometerFirstClassAdvanced
Installationheight(m)
120
Label
TopAnemometer
Serialnumber
WindSpeedSlope(m/s/I)
0.0462
WindSpeedOffset(m/s)
0.21
Measurementrate
1s
CounterChannel
C1
Addmore
Finish
Figure 5.2: Sensor Helper with Sensor Settings
56 © 2011 — 2021 Ammonit Measurement GmbH

Data Logger Meteo-40 Plus User’s Manual 57 / 246
ImportantFor many sensors, slope and offset values are pre-configured according to the manufacturer’s information.Carefully check the values. If calibrated sensors are installed, use the slope and offset resp. sensitivityvalues indicated in the calibration protocol of the sensor.
5.1.3 Order of Sensors and Evaluations
The order of sensors and evaluations in the web interface and the LC display is always consistent.
Sensors are ordered by
1. sensor type (anemometers, wind vanes, thermo/hygro sensors, barometers, precipitation sensors, solar sen-sors, ultrasonics, power meters, other sensors),
2. height (from highest to lowest),
3. and finally the textual label (alphabetically).
Evaluations are ordered by
1. evaluation type (wind speed, wind direction, humidity, temperature, differential temperature, air pressure, airdensity, etc.)
2. height of the corresponding sensor (from highest to lowest),
3. and finally the textual label (alphabetically).
5.1.4 RS485 Master Serial Console
During the installation process or to change any sensor settings during deployment, it can be useful to send a specialcommand to a connected RS485 sensor.
© 2011 — 2021 Ammonit Measurement GmbH 57

SendRequestoverRS485-M
Protocol:
ASCII
Modbusaddress
1
Modbusstartregister(0..65535)
0
Modbusregisterquantity(1..20)
1
Modbusfunctioncode
3
Command:
LatestResponse:
Notavailable
Sendrequest
Serialsettings
RS-485port
R1
RS-485speed
38400
RS-485dataformat
8N1
Saveserialsetting
Figure 5.3: RS485-M Serial Console
First of all, the RS485 Master general serial settings must be set matching sensor’s configuration. All sensors in theRS485-M bus will share the configured settings.
If Modbus protocol is selected, the telegram will be internally composed, according to the selected parameters, andshown in the command box. The available parameters for the request are: Sensor ID for the unique sensor identi-ficator in the bus (0..247), Modbus Function code (01 to 06 supported), Start address (PDU addressing, firstreerence is 0) and Quantity or value (quantity of registers/inputs for read only function codes (01 to 04) and valuefor writing function codes (05 and 06).
If ASCII protocol is selected, the custom command must be typed by the user in the command box. The followingescape sequences representations are recognized for the ASCII commands:
58 © 2011 — 2021 Ammonit Measurement GmbH

Data Logger Meteo-40 Plus User’s Manual 59 / 246
Escape Sequence Symbol<CR> \x0d<LF> \x0a<STX> \x02<ETX> \x03
Table 5.1: ASCII escape sequences for RS485-M serial console
The communication will be reflected in the logbook including a timestamp. Example of ASCII communication: ”RS485-M Request: ’01TR00003<CR>’, Response: ’<STX>000.1 096 +24.6 M 0E*1D<CR><ETX>’”. Example of Modbuscommunication: ”RS485-M Request: ’0104277400063aa6’, Response: ’01040c41375c2942c0000041e800006d3d’”.
NoteThe RS485-M serial console is only available for Admin.
5.2 Measurement Channels
In the Measurement → Channels menu a table is shown, which displays all connected channels with details such aslabel, value, rate, range, protocol and selected switch. To modify sensor settings, click on Change to start the SensorHelper (see also Section 5.1.2).
Id Label Value Unit Rate Range Protocol Addr. Switch Sw.Pretime Change
C1Top
AnemometerI 1s S1 1min Change
D1 TopWindVane 1sThies10-
BitS1 1min Change
C2Backup
AnemometerI 1s S1 1min Change
C3Middle
AnemometerI 1s S1 1min Change
A1Hygro/Thermo
@10.0mV 1s -10V..+10V S1 1min Change
C4Low
AnemometerI 1s S1 1min Change
A3Barometer
@10.0mV 1s -10V..+10V S1 1min Change
A2Hygro/Thermo
@10.0mV 1s -1V..+1V S1 1min Change
D3 LowWindVane 1sThies10-
BitS1 1min Change
D2BackupWind
Vane1s
Thies10-
BitS1 1min Change
Digitaltest
Figure 5.4: Measurement Channels Overview
NoteClick on a column headline in the measurement channels overview to sort the selected column in ascendingor descending order.
© 2011 — 2021 Ammonit Measurement GmbH 59

5.3 Configuring the Evaluation
In the Measurement → Evaluation menu the settings for data evaluation are shown. A table displays the configuredsensors with their measured and estimated values. The order of evaluations is explained in Section 5.1.3. If thesettings should be modified, click on Change to start the Sensor Helper (see also Section 5.1.2).
Label Evaluation Origin Value Unit Slope Offset Clip Change
Top
AnemometerWindSpeed C1 --- m/s 0.0462 0.21 Change
Backup
AnemometerWindSpeed C2 --- m/s 0.0462 0.21 Change
Middle
AnemometerWindSpeed C3 --- m/s 0.0462 0.21 Change
Low
AnemometerWindSpeed C4 --- m/s 0.0462 0.21 Change
TopWind
VaneWindDirection D1 --- ° 0.3515625 0 Change
BackupWind
VaneWindDirection D2 --- ° 0.3515625 0 Change
LowWind
VaneWindDirection D3 --- ° 0.3515625 0 Change
Hygro/Thermo
@10.0mHumidity A1 --- % 100 0 100 Change
Hygro/Thermo
@10.0mTemperature A2 --- °C 100 -30 Change
Barometer
@10.0mAirPressure A3 --- hPa 60 800 Change
Addevaluation
Figure 5.5: Screenshot of the Configuration for the Evaluation
In addition to the automatically generated evaluations, it is possible to apply formulas to the measured values or evencombine evaluations. The new evaluations can be added in the Evaluation Helper by clicking on Add evaluation. SeeSection 5.3.1.
NoteClick on a column headline in the evaluation configuration overview to sort the selected column in ascendingor descending order.
5.3.1 Evaluation Helper
The Evaluation Helper introduces a higher flexibility to Meteo-40 sensors configuration. A part from the automati-cally configured evaluations which appear when you add a sensor, this tool allows you to generate new evaluations,combining the existing by means of a formula. The standard statistics will be available for this new evaluation andwill be included in the CSV statistics file. The Evaluation Helper also provides some special statistics like the covari-ance, kurtosis, turbulence intensity or Obukhov length. To use this feature, click Add evaluation in the Measurement→ Evaluation menu. The Evaluation Helper will guide you through the configuration process. After choosing a formulafrom the list, the corresponding parameters will be shown for selection.
ImportantOnly the measured values are saved by default to the CSV statistics file. Estimated values are for infor-mation purposes. In order to include estimated values in the CSV statistics file, select the values over thestatistics selection interface in the Data → Statistics menu under Select statistics (see also Section 6.3.1).
60 © 2011 — 2021 Ammonit Measurement GmbH

Data Logger Meteo-40 Plus User’s Manual 61 / 246
5.3.1.1 Addition
Addition of two or three previously configured evaluations.
A = B + C
Equation 5.2: Addition of two elements
A = B + C + D
Equation 5.3: Addition of three elements
5.3.1.2 Density of moist air
According to IEC 61400-12-1 it is required to measure air density, which is calculated from air temperature and airpressure. Air density has a significant influence on the wind energy calculation. See calculation of wind energy inSection 10.1.
At high temperatures measuring relative air humidity is recommended according to IEC 61400-12-1. In order to cal-culated density of moist air, Meteo-40 offers two options: with or without relative humidity.
If air density should be calculated without humidity, choose only a temperature and a barometric pressure sensor fromthe list in the Evaluation Helper (see Section 5.3.1). Meteo-40 calculates air density for evaluation with original 1-secmeasurement data according to the following formula:
ρ =p
R0 · T
Equation 5.4: Calculation of Density [ρ] of Dry Air
(where p is the air pressure, T the air temperature and RO the gas constant of dry air 287,05[J/kgK])
If relative humidity should be considered for air density calculation, choose also a humidity sensor from the list in theEvaluation Helper (see Section 5.3.1). With selected humidity sensor, Meteo-40 calculates density of moist air forevaluation with original 1-sec measurement data according to the following formula:
ρ =1T
(p
R0− RH · pH2O
(1
R0− 1
RH20
))
Equation 5.5: Calculation of Density [ρ] of Moist Air
(where T is the air temperature, p the air pressure, R0 the gas constant of dry air 287,05[J/kgK], RH2O the gas constantof water vapour 461,5[J/kgK], pH2O the vapor pressure, RH the relative humidity)
© 2011 — 2021 Ammonit Measurement GmbH 61

File Edit View Go Bookmarks Tabs Help
Back https://d120001.local/helper/evaluation?formula=air_density¶m_1=Eval_3¶m_2=Eval_4¶m_3=Eval_2&label=
Formula:Density of moist air
kg/m^3
TemperatureHygro/Thermo @20.0m
Air PressureBarometer
HumidityHygro/Thermo @20.0m
Label:Density of Moist Air
Save
Delete
SystemInformationAdministrationUpgradeDisplayWeb CameraSwitchesLogbook
MeasurementSensorsChannelsEvaluation
DataLiveStatisticsSource
CommunicationScheduleOnlineAmmonitOR
select formula
select humidity sensor (for complex calculation)
select barometric pressure sensor
select temperature sensor
Figure 5.6: Evaluation for Air Density
5.3.1.3 Albedo
Surface albedo is defined as the ratio of irradiance reflected to the irradiance received by a surface. It is dimensionlessand measured on a scale from 0 (corresponding to a black body that absorbs all incident radiation) to 1 (correspondingto a body that reflects all incident radiation).
Albedo =ReflectedIrradiance
GlobalIrradiance
Equation 5.6: Albedo
5.3.1.4 Ampere meter
Based on the Ohm’s law, you can use the Ampere meter formula to transform the measured voltage to the correspond-ing current, after introducing the value of the shunt resistor used. This formula can be used with any existing voltageevaluation (e.g. if you previously configured a Gantner A3.1 module).
I =VR
Equation 5.7: Ohm’s law
(where I is the current through the conductor in units of amperes, V is the voltage measured across the conductor inunits of volts, and R is the resistance of the conductor in units of ohms)
5.3.1.5 Differential temperature
By selecting Differential temperature in the Evaluation Helper, the difference between two temperature measurementscan be recorded every second. Choose two temperature sensors from the list for theta 1 and theta 2. According tothe following equation the difference is calculated.
Δϑ[K] = ϑ1[°C] − ϑ2[°C]
Equation 5.8: Calculation of the Temperature Difference [Δtheta]
62 © 2011 — 2021 Ammonit Measurement GmbH

Data Logger Meteo-40 Plus User’s Manual 63 / 246File Edit View Go Bookmarks Tabs Help
Back https://d130080.local/helper/evaluation?formula=temperature_differential¶m_1=Eval_9¶m_2=Eval_15&label=
Formula:Differential temperature
ϑ1 - ϑ2
Temperature ϑ1Hygro/Thermo 1
Temperature ϑ2Hygro/Thermo 2
Label:Differential Temperature
Save
Delete
SystemInformationAdministrationUpgradeDisplayWeb CameraSwitchesLogbook
MeasurementSensorsChannelsEvaluation
DataLiveStatisticsSource
select formula
choose temperature sensor as subtrahend
choose temperature sensor as minuend
Figure 5.7: Evaluation for Differential Temperature
5.3.1.6 Division
Division of two previously configured evaluations.
A =BC
Equation 5.9: Division
5.3.1.7 Inflow angle
Angle off the horizontal plane at which the wind flow comes into the sensor.
φ = arctan(Vz / Vh)
Equation 5.10: Calculation of the inflow angle
(where Vz is the vertical wind speed and Vh is the horizontal wind speed)
5.3.1.8 Linear equation
The linear equation can be used with any existing evaluation in order to apply an slope and offset. It can also beused to provide a dimensionless measurement (e.g. from a previously configured Other sensor) with a unit and anevaluation type for better interpretation.
A = Slope · B + Offset
Equation 5.11: Linear equation
5.3.1.9 Multiplication
Multiplication of two previously configured evaluations.
A = B · C
Equation 5.12: Multiplication
© 2011 — 2021 Ammonit Measurement GmbH 63

5.3.1.10 Turbulence intensity
Turbulence intensity (TI) is defined as the ratio of standard deviation of fluctuating wind velocity to the mean windspeed, and it represents the intensity of wind velocity fluctuation. It is calculated at the end of the averaging period(normally 10 minutes) and included in the measurement data CSV files.
TI = σ(U) / avg(U)
Equation 5.13: Turbulence intensity
(where σ(U) is the standard deviation of the wind speed and avg(U) is the mean wind speed)
A commonly used procedure when analyzing turbulence data is to transform the horizontal wind vector in the geo-graphical coordinate system into a rotated coordinate system that aligns with the mean wind direction during everyaveraging period. The longitudinal TI is defined as the standard deviation of longitudinal wind speed, normalized withthe mean wind speed.
TI Long = σ(U) / avg(U)
Equation 5.14: Longitudinal turbulence intensity
(where σ(U) is the standard deviation of the longitudinal wind speed and avg(U) is the mean wind speed)
5.3.1.11 Obukhov length
The Obukhov Length can be useful for turbulences analysis and is typically associated with a 3D ultrasonic sensor.To add this evaluation, the measurement of wind speed, wind direction, vertical wind speed and virtual temperature atone height are needed.
L = u*3 / ( K × g / avg(T) × σ(VZ, T))
Equation 5.15: Calculation of the Obukhov Length
(where u* is the friction velocity [m/s], g the graviatitonal acceleration 9.81[m/s²], σ(VZ, T) the covariance of verticalwind speed and virtual temperature and K the von Kármán constant 0,41)
5.3.1.12 Obukhov stability parameter
Dimensionless stability parameter given by the normalized measuring height above ground z with the Obukhov lengthL. Can be useful for turbulences analysis and is typically associated with a 3D ultrasonic sensor. To add this evaluation,the measurement of wind speed, wind direction, vertical wind speed and virtual temperature at one height are needed.
ζ = z / L
Equation 5.16: Calculation of the Obukhov stability parameter
(where z is the height above ground and L is te Obukhov length as in Section 5.3.1.11)
5.3.1.13 Sensible heat flux
Sensible heat flux measured with the eddy covariance method. In meteorology, the conductive heat flux from theEarth’s surface to the atmosphere.
QH = ρ × Cp × σ(VZ, T)
Equation 5.17: Calculation of the sensible heat flux
(where ρ is the air density 1.2[kg/m 3], C p the specific heat with constant pressure 1004.67[J/K/kg] and σ(V Z, T) thecovariance between the vertical wind speed and the temperature)
64 © 2011 — 2021 Ammonit Measurement GmbH

Data Logger Meteo-40 Plus User’s Manual 65 / 246
5.3.1.14 Solar zenith angle
The solar zenith angle is the angle between the zenith and the centre of the Sun’s disc. It is calculated from theconfigured latitude and longitude and the time in the moment of the calculation.
ImportantIn order to use any formula based on the zolar zenith angle, latitude and longitude of the measurementstation have to be entered or acquired with a GPS device in the System → Administration menu (see alsoSection 4.2).
5.3.1.15 Diffuse solar irradiance (DHI)
DHI[W/m²] = GHI[W/m²] − DNI[W/m²] · cos(θ)
Equation 5.18: Calculation of Diffuse Solar Irradiance
(where θ is the solar zenith angle)
NoteIf the DNI pyranometer was tilted or not alligned to north, tilt angle and cardinal direction must be introduced.
Tilt angle (°): (X axis) inclination angle with the Y axis aligned to north [-90°, 90°]
Cardinal direction (°): Clockwise rotation from north around the Z axis [0°, 360°]
5.3.1.16 Total apparent power
Apparent power is the product of the rms (root mean square) values of voltage and current. It is taken into accountwhen designing and operating power systems.
S[VA] = U1[V] · I1[A] + U2[V] · I2[A] + U3[V] · I3[K]
Equation 5.19: Calculation of total apparent power [S].
© 2011 — 2021 Ammonit Measurement GmbH 65

66 © 2011 — 2021 Ammonit Measurement GmbH

Data Logger Meteo-40 Plus User’s Manual 67 / 246
Chapter 6
Data Evaluation
6.1 Introduction
As soon as Recording in the status box (see Section 3.2) is switched on, Meteo-40 records and stores measurementdata. In order to check current data, the web interface offers the possibility to have a closed look at live data (seeSection 6.2). In the Data menu, measurement data can be downloaded (see Section 6.7 and Section 4.2) and statisticscan be configured, which will be saved as CSV file.
6.2 Live Data Page
This page displays the currently measured data. The data is presented in a table and in a line chart.
Click on Start to display currently measured values. Stop ends displaying data. The table shows the total amount ofavailable data. In comparison, the line chart can be customized by choosing sensors and connected channels.
NoteEnable JavaScript in your web browser to display live data in a chart.
6.2.1 Publishing live data
The Meteo-40 can be configured to publish live data every second to an XMPP server using the publish-subscribeextension.
The Meteo-40 authenticates itself with the server using the serial number as the local part of the JID, e.g. ”[email protected]”.
The published data has the access model ”whitelist”, meaning that subscription is not allowed unless configured onthe Meteo-40.
Data is always published using SSL/TLS encryption.
Publish live data to server Enable this checkbox to start publishing.
Server name The name of the XMPP server to which the data should be published, e.g. ”xmpp.test”.
Server port The TCP port for incoming XMPP connections, e.g. 443 or 5223.
Allowed subscribers The Ammonit Live Data Aggregator can be enabled using the checkbox. It is a tool to generateand send CSV files using the published data which is configured on AmmonitOR (https://or.ammonit.com/). Allow more JIDs by entering them into the text box. Use a semicolon (;) between each JID. This allowsthe live data to be used with more tools, such as Ammonit Live Dashboard (https://live.ammonit.com/).
© 2011 — 2021 Ammonit Measurement GmbH 67

6.3 Statistic Data Files
In the Data → Statistics menu CSV files with statistics are listed and can be downloaded. Meteo-40 shows a calendarwith available statistics. Click on a month to highlight days with available CSV files. To navigate through the calendar,click on a month or use the arrows to move one month ahead or back. Click on a highlighted day to list all CSV files,which have been generated for this day.
To view the available CSV files for a whole month, click on Show month; for a complete year, click on Show year. Youcan jump between the years and months by clicking on a month resp. year in the calendar.
All CSV files for the selected period are listed in a table, the file name refers to the time interval covered. For each file,a link to download the corresponding signature, its size in bytes, the methods through which the file has been sharedand a link to visualize the matching source data are available. To display the source data corresponding to a file, clickon the arrow in the Source column.
Below the list of CSV files it is indicated how many statistics CSV files are currently visible, from the available files inthe data logger, e.g., 1 of 53 files.
If CSV files have been uploaded to an AmmonitOR project, sent per Email or copied to a configured SCP/FTP/SFT-P/FTPS server, they will be tagged by a checkmark in the corresponding box.
To manually download or delete one or more files, select them and Click Download selected or Delete selected re-spectively. For the download, the CSV files will be compressed in one ZIP file. If you want a certain file to be sent orcopied again, you can also mark the selected files as not sent with the option Mark as not sent
ImportantDeleting CSV statistic files does not delete the corresponding source data, statistic files can be generatedagain as long as the matching source data are still in the Source data storage.
If some files have been marked as possibly inconsistent, and the issue cannot be fixed, you can manually mark themas ok with the Ignore errors button.
To immediately generate statistic files form the available source data, click on Generate now. Meteo-40 will generatenew files for the configured file interval, containing a line with the calculated statistics for each statistics interval. Forthe standard configuration of daily file interval and ten minutes statistics interval, there will be 144 lines.
If Generate partial files is selected, not only the files for a complete file interval will be generated but also a file withthe residuary data until the moment of the generation. This setting is only recommended for testing porpouses.
Under Maintenance we provide some options for trouble-shooting in case of CSV files generation problems. Clear allsent files will replace all existing CSV files which have already been shared in any of the ways (AmmonitOR, Email orRemote Copy) with an empty file, in order to create more space in the system storage. Fix checked files will inspect allexisting files, search for known incidences and regenerate the files if needed. This option is only available if the datalogger detects any suspicious files. Files which have been replaced with an empty file as described in Clear all sentfiles will be marked as suspicious. The Behaviour if file limit is reached option controls what happens when the systemis low on storage. When there are more than 10,000 statistics files or less than 30MiB free storage remaining, thedata logger stops creating new files. Changing the behaviour to automatically delete the oldest sent files will ensurethat these limits are not exceeded, and files continue to be generated.
68 © 2011 — 2021 Ammonit Measurement GmbH

Data Logger Meteo-40 Plus User’s Manual 69 / 246
Generatenow Downloadselected Deleteselected Markasnotsent
Deletesentstatistics Fixcheckedfiles
Statisticscalendar
2020 10
2020-10
Mon Tue Wed Thu Fri Sat Sun
1 2 3 4
5 6 7 8 9 10 11
12 13 14 15 16 17 18
19 20 21 22 23 24 25
26 27 28 29 30 31
Select
File Sig Size AmmonitOR Email Copy USB Check Source
2020-10-0500:00:00
—
2020-10-0523:55:00
↴ 2258 ✓ ↴
1of3files
Maintenance
Behaviouriffilelimitisreached
Stopcreatingnewfiles
Save
Showmonth Showyear
◀ ▶
Figure 6.1: Downloading Statistics
6.3.1 Configuring Statistics and CSV files
In order to configure statistics and CSV files, go to the Data → Statistics menu. You can define content and intervalof the statistics.
Meteo-40 automatically suggests the standard statistics for each evaluation and channel. Additional statistics can beselected manually.
Click on Select statistics in the Configure statistics section to create the statistics, e.g., average, maximum, minimum,standard deviation, count, sum and median. Tick checkboxes to include evaluators / channels in the statistics. Removecheckboxes to exclude evaluators / channels. Additionally, Meteo-40 displays internal current and internal voltage inthe CSV files.
© 2011 — 2021 Ammonit Measurement GmbH 69

Configurestatistics
Statisticsintervalforfiles
10min
Fileinterval
Daily
Generatepartialfiles(notrecommended)
StatisticsintervalforSCADA,Switchmanagerandsnapshots
10min
SCADASummaryinterval
Daily
Save
AdditionalStatisticsFiles
Selectstatistics
Secondaryfiles
Tertiaryfiles
Figure 6.2: Configuring the Statistics
The options are:
Select statistics Select individual statistics for every evaluator and channel. See Figure 6.4.
Statistics interval for files Defines over which time interval statistics are calculated, generating a new line in theCSV file. All current data that has been collected since the last generated file is considered to generate newaggregate data. Several intervals are available from 1/4 s to 1 h.
File interval Determines, how often a new aggregate data file in CSV format has to be created. Selecting Hourly,produces one file per hour that includes data from the last hour. Daily generates only one file per day, etc.Several intervals are available from every 5 minutes to weekly. The file interval is also applied to Gust data files.
Generate partial files Generate CSV files up to the current moment, even if the file interval has not yet finished.
Statistics interval for SCADA, Switch manager and snapshots Defines over which time interval statistics are cal-culated. The calculation occurs at the end of the interval and the data are available over SCADA, applied toSwitch manager or sent/copied as a snapshot. All current data from that period is considered to generate newaggregate data. Several intervals are available from 1/4 s to 1 h.
SCADA Summary interval Applied only to the Summary statistic of the SCADA Modbus server. Typically used toobtain a daily summary of sun status or precipitation measurements.
Secondary Files Suplementary statistics files can be generated with a different interval for the statistics calculation.Secondary statistics can be configured here. See Section 6.4.
Tertiary Files A further suplementary statistics interval can be configured here. See Section 6.4.
WarningBe careful with setting the statistics interval and the file interval! Low values for the statistics interval leadto huge statistics files, which you might need to remove manually once in a while. Low values for the fileinterval lead to many small CSV files, which might be hard to handle.
70 © 2011 — 2021 Ammonit Measurement GmbH

Data Logger Meteo-40 Plus User’s Manual 71 / 246
NoteLow data file time intervals like 1, 2, 5 and 10 minutes are always delayed in generation by one or twointervals. It means that 5 minute file will always be generated with the delay of 5 or 10 minutes. I.e. 5minute interval file that should be generated at 12:00 (containing data from 11:55 to 12:00) will be firstgenerated at 12:05 or 12:10.
For solar-related evaluations Meteo-40 estimates certain values in addition to the measured values, i.e., estimatedsun status, estimated direct normal irradiation. In order to create the estimated values, the GPS location of the mea-surement station has to be entered in the System → Administration menu. By default the estimated values are notincluded in the CSV file. If required, select the values for the statistics.
Meteo-40 uses vectorial calculations for wind direction, i.e., vectorial average, direction maximum, direction minimum,and vectorial standard deviation (Yamartino method). Hence, the calculated minimum value for the wind direction canbe higher than the maximum in case of wind from northern directions.
d = atan2
(n∑
i=1
sin(ϑi),
n∑i=1
cos(ϑi)
)
Equation 6.1: Calculation of wind direction average
The equation for the average wind direction d is given by Equation 6.1. If d is less than zero, 2π is added.
max. value 5°
90°
min. value 345°
180°
270°
Figure 6.3: Vectorial Calculation for the Wind Direction
© 2011 — 2021 Ammonit Measurement GmbH 71

Evaluator/Channel Avg Max Min SDv Cnt Sum Med Val
WindSpeed(TopAnemometer)
WindSpeed(BackupAnemometer)
WindSpeed(MiddleAnemometer)
WindSpeed(LowAnemometer)
WindDirection(TopWindVane)
WindDirection(BackupWindVane)
WindDirection(LowWindVane)
Humidity(Hygro/[email protected])
Temperature(Hygro/[email protected])
AirPressure([email protected])
A1(Hygro/[email protected])
A2(Hygro/[email protected])
C1(TopAnemometer)
C2(BackupAnemometer)
C3(MiddleAnemometer)
C4(LowAnemometer)
D1(TopWindVane)
D2(BackupWindVane)
D3(LowWindVane)
AnalogVoltage(Int.Voltage)
AnalogCurrent(Int.Current)
Temperature(Int.Temperature)
Save
Back
Figure 6.4: Statistics Configuration Page
Press Save to finish the configuration of statistical values.
6.4 Secondary and Tertiary Statistics Files
Sometimes it is necessary, to have additional statistics on top of the standard. E.g. with a different statistics intervalor a different selection of values. You can activate the supplementary generation of statistics files with two differentconfigurations. The files will be listed in a similar table as the main statistic files (see Figure 6.5 and Figure 6.6). If thefiles are generated, they will be automatically sent per Email or AmmonitOR additionally to the main statistic files.
WarningBeware, that having more CSV files
1. is more work for the data logger, more time and energy is consumed
2. fills the memory of the data logger faster
3. more bandwidth for sending is used
72 © 2011 — 2021 Ammonit Measurement GmbH

Data Logger Meteo-40 Plus User’s Manual 73 / 246
6.4.1 Secondary Statistics Files
Select Generate additional files with secondary interval to activate the generation of the secondary files. You canconfigure a statistics interval different from the main statistics interval. To select the statistics which will be calculatedand included in the secondary files, clik on Select statistics.
Generatenow Downloadselected Deleteselected
Secondarystatisticsfilescalendar
2020-10
Mon Tue Wed Thu Fri Sat Sun
1 2 3 4
5 6 7 8 9 10 11
12 13 14 15 16 17 18
19 20 21 22 23 24 25
26 27 28 29 30 31
Select File Sig Size AmmonitOR Email Copy USB Source
0of0files
Generateadditionalfileswithsecondaryinterval
Secondarystatisticsinterval
10min
Save
Showmonth Showyear
◀ ▶
Selectstatistics
Back
Figure 6.5: Secondary Statistics Page
6.4.2 Tertiary Statistics Files
Select Generate additional files with tertiary interval to activate the generation of the tertiary files. You can configurean statistics interval different from the main and the secondary statistics interval. To select the statistics which will becalculated and included in the secondary files, click on Select statistics.
© 2011 — 2021 Ammonit Measurement GmbH 73

Generatenow Downloadselected Deleteselected
Tertiarystatisticsfilescalendar
2020-10
Mon Tue Wed Thu Fri Sat Sun
1 2 3 4
5 6 7 8 9 10 11
12 13 14 15 16 17 18
19 20 21 22 23 24 25
26 27 28 29 30 31
Select File Sig Size AmmonitOR Email Copy USB Source
0of0files
Generateadditionalfileswithtertiaryinterval
Tertiarystatisticsinterval
10min
Save
Showmonth Showyear
◀ ▶
Selectstatistics
Back
Figure 6.6: Tertiary Statistics Page
6.5 Gust Data Files
Detecting extreme wind events or gusts can be interesting to compare different geographical terrains or to estimatewind turbines load. Meteo-40 offers the possiblity to genere extra CSV files including the sensible measurement valueswith the highest available measurement rate. To generate gusts data files you must activate this option in menu Data→ Gusts.
One gusts CSV file will be generated per day (or the configured file interval in Data → Statistics menu) including allwind gusts of that period. If no gust was registered during the period, an empty file is generated. Empty files will notbe visible in the Gust data files calendar but will be listed beneath.
To be considered a gust, the selected trigger evaluation must exceed the configured threshold value a minimum numberof consecutive repetitons ( minimum repetitions parameter) and not more than the selected maximum repetitions. Thegust as well as the previous and posterior number of seconds specified by time overhang parameter are included inthe gusts CSV file (see .
74 © 2011 — 2021 Ammonit Measurement GmbH

Data Logger Meteo-40 Plus User’s Manual 75 / 246
Generatenow Downloadselected Deleteselected
Gustdatafilescalendar
2020-10
Mon Tue Wed Thu Fri Sat Sun
1 2 3 4
5 6 7 8 9 10 11
12 13 14 15 16 17 18
19 20 21 22 23 24 25
26 27 28 29 30 31
Select File Sig Size AmmonitOR Email Copy USB Source
0of0files
Showmonth Showyear
◀ ▶
Figure 6.7: Gust Data Calendar
Not every existing measurement is related to gusts analysis. The relevant evaluations must be selected. Press theSelect evaluations button to access the evaluations selection site and select which evaluations must be included ingusts CSV files.
Evaluator Include
Anemometer(WindSpeed)
WindVane(WindDirection)
Hygro/Thermo(Humidity)
Hygro/Thermo(Temperature)
Save
Backtogustdata
Figure 6.8: Gust Evaluations Selection
ImportantIf the gusts data generation is activated in a running project, all existing source data will be analyzed andgusts CSV files will be generated. This process could take several hours.
6.6 The CSV File Format
Meteo-40 stores measurement data in standard Comma-Separated Value (CSV) format with appended information inini file format. The CSV file is documented in RFC 4180 (http://tools.ietf.org/html/rfc4180) and wellexplained, e.g., in Wikipedia (http://en.wikipedia.org/wiki/Comma-separated_values). Ini files aredescribed, e.g., in Wikipedia (http://en.wikipedia.org/wiki/INI_file) as well. CSV files can easily beread by many programs and software tools, as is the ini file format.
© 2011 — 2021 Ammonit Measurement GmbH 75

NoteIn almost all cases, the CSV files created by Meteo-40 are compressed using GNU gzip (http://www.gzip.org/) with the typical file extension .gz. gzip compressed files can be decompressed on all operatingsystems, see, e.g., Wikipedia (http://en.wikipedia.org/wiki/Gzip) for further details.
6.6.1 Ammonit Meteo-40 specific details
The measurement data files of the Meteo-40 use the ,(comma) as field separator, "(double quote) for embeddingcommas in textual strings and UTF-8 as character set.
The statistics files generated by Meteo-40 data loggers are structured in two parts, the data in standard CSV formatand additional information in so-called ini file format. Both parts are separated by one empty line.
6.6.1.1 Data part (CSV format)
The CSV part starts with a header line. This line is a comma-separated list of the statistics for each active channeland evaluator. The first item of the list is the date/time entry.
ImportantThe date and time value shows the start time of the statistics interval.
Date and time format are similar to ISO-8601, e.g., 2014-07-17 15:50:00. The date and time values are alwaysthe local time of the data logger. The timezone is stated in the second part of the file.
The evaluator statistics have the form Sensor;Evaluation;Statistic(e.g., Anemometer;wind_speed;Avg orWindVane10bit;wind_direction;Count). Thereafter, the channel statistics are displayed in the form Channel;Statistic(e.g.,A2;Avg or C1;StdDev).
The statistics can individually be selected per sensor in the Data → Statistics menu (see Figure 6.4).
According to the configured statistics interval, Meteo-40 calculates the statistics. Each time period is represented in aline of the CSV file. The values are generally decimal numbers, using a point ( .) as decimal mark.
Language settings of the data logger do not have an influence on the CSV file.
The following evaluation types are available:
76 © 2011 — 2021 Ammonit Measurement GmbH

Data Logger Meteo-40 Plus User’s Manual 77 / 246
wind_speed: Wind Speed,wind_direction: Wind Direction,humidity: Humidity,temperature: Temperature,temperature_differential: Differential Temperature,air_pressure: Air Pressure,air_density: Air Density,solar_irradiance: Global Horizontal Irradiance,solar_irradiance_diffuse: Diffuse Horizontal Irradiance,solar_irradiance_direct: DNI·cosθ,solar_DNI: Direct Normal Irradiance (DNI),solar_irradiance_direct_sw: Estimated DNI,solar_DNIcos_sw: Estimated DNI·cosθ,sun_status: Sun Status,sun_status_sw: Estimated Sun Status,precipitation: Precipitation,precipitation_intensity: Precipitation Intensity,precipitation_status: Precipitation Status,precipitation_sum: Precipitation Sum,wind_speed_vert: Vertical Wind Speed,counter: Counter,voltage: Analog Voltage,current: Analog Current,status: Status,active_power: Active Power,power_factor: Power Factor,reactive_power: Reactive Power,apparent_power: Apparent Power,obukhov_length: Obukhov Length,dir_max_speed: Direction at max. Speed,brightness_max: Brightness max. Value,brightness_direction: Direction of Brightness,frequency: Frequency,inclination_angle: Angle of Inclination,vibration_frequency: Vibration Frequency,vibration_amplitude: Vibration Amplitude,other: Other Evaluation,any: Any Evaluation
The following statistics are available:
Avg: Average,Max: Maximum,Min: Minimum,StdDev: Standard deviation,Count: Count of valid values,Sum: Summary,Med: Median,Val: First valid value
6.6.1.2 Information part (Ini file format)
The information part contains data logger information as well as sensor details like installation height, slope and offsetvalues, as well as unit and sensor name.
The information part is included in every file. It can be found below the statistical data. The overall format of theconfiguration is the following:
[Section 1]key1=valuekey2=value
© 2011 — 2021 Ammonit Measurement GmbH 77

[Section 2]key1=value
All section names, keys and values are case-sensitive and may contain unicode characters in UTF-8 encoding. Whilesections and values may contain spaces; keys will not. Each section is unique; each key is unique within its section.Neither the order of sections nor the order of entries within the sections are significant or guaranteed.
• [System]: Serial number in the format serial=D123456 and type of the data logger in the format type=Meteo-40Lthe assigned name; timezone in the format timezone=UTC+01:00 (the offset can be positive or negative or bemissing, which indicates UTC); the location in decimal degrees and altitude in meters: latitude=0.0 longitude=0.0altitude=0.0 as well as the software version and important system settings, e.g., cecs_power_permanent=true.
• [Summary] comprises the date and time when the CSV file has been created, the used source data storage andthe summary over the file time interval for configured precipitation, precipitation intensity, status and sun statusevaluations.
• [Evaluation] indicates file_interval and stat_interval(see also Section 6.3).The file_interval, usually daily, can have the following values:fiveminutestenminutesfifteenminutestwentyminutesthirtyminuteshourlytwohoursthreehoursfourhourssixhourstwelvehoursdailyweekly
The stat_interval, usually 10 min, can have the following values:1 s2 s3 s5 s10 s20 s30 s1 min2 min5 min10 min15 min20 min30 min1 h
• [Adjustment]: CS1 and CS2 are the calibration values for the current source of Meteo-40. The values are forinformational purpose only.
• [Master]: The rate of RS485 is given in s, min or h; serial_setting for RS485 includes speed without unit,as well as data format in conventional notation (e.g., 9600 8N1).
• [Sensor;Evaluator]
– statistic: List of statistics, which are calculated for the sensor, e.g., average, min, max.– unit: Unit for the data, e.g., m/s.– sensor_label: Name, which has been entered by the user in the sensor configuration.– sensor_height: Installation height in meters, which has been entered by the user in the sensor configuration.– sensor_type: Indicates the type of the sensor, e.g., anemometer. The following values are possible:
78 © 2011 — 2021 Ammonit Measurement GmbH

Data Logger Meteo-40 Plus User’s Manual 79 / 246
anemometer: Anemometer,wind_vane: Wind Vane,hygro_thermo: Humidity / Temperature Sensor,barometer: Barometric Pressure Sensor,precipitation: Precipitation Sensor,pyranometer: Solar Sensor,ultrasonic: Ultrasonic Anemometer,power_meter: Power Meter,other: Other Sensor
– sensor_model: The model of the sensor, e.g., Thies First Class Advanced.– formula: The type of formula used to convert the electrical values, e.g., linear.– formula_params: Parameters, which are referenced to in the formula, including related channels and evaluator
parameters, e.g., A5 A6 var_offset var_slope. Values of the parameters are displayed in the lines belowthe formula parameters, e.g., var_offset, var_slope, var_period, var_sensitivity.
• [Channel]
– statistic: List of statistics, which are calculated for the channel/sensor. For each statistic a column is displayedin the upper part of the CSV file.
– unit: Unit of the calculated data. This is the SI unit for the type of quantity, however the unit for barometricpressure might be either hPa or mbar, and the temperature unit is °C or K for differential temperature.
– rate: Configured rate for the channel with unit (not applicable for Master channels).– range: Configured range for analog voltage channels (Ax) with unit.– protocol: Protocol, which is used for digital channels (Dx).
6.6.2 CSV import in LibreOffice or OpenOffice
TipUse LibreOffice (http://www.libreoffice.org/) Calc or OpenOffice.org (http://www.openoffice.org) Calc. These are free, professional spreadsheet programs to process your CSV files.
The recommended settings to import the CSV file are shown in Figure 6.9.
© 2011 — 2021 Ammonit Measurement GmbH 79

Figure 6.9: LibreOffice CSV-file import settings
6.6.3 CSV Import in Microsoft Excel 2010™
Depending on the version of Microsoft Excel™ the procedure can be slightly different. In general, we recommendusing the import assistant of Microsoft Excel™.
NoteSave CSV files always in a directory. The described process in Microsoft Excel™ does not work, when filesare opened via your email program.
1. Launch Microsoft Excel™ and open the Options window, which can be found in the File menu. Open theAdvanced menu. In the Editing options section deselect Use system separators and use .(dot) as decimalseparator and ,(comma) as Thousands separator. See figure Figure 6.10.
80 © 2011 — 2021 Ammonit Measurement GmbH

Data Logger Meteo-40 Plus User’s Manual 81 / 246
Figure 6.10: Microsoft Excel 2010™ CSV Import (1)
2. After setting the options, click on the Data tab as shown in Figure 6.11. In order to import the CSV file, clickon From Text in the group Get External Data, locate and double-click the file you want to import. Follow theinstructions in the Text Import Wizard.
© 2011 — 2021 Ammonit Measurement GmbH 81

Figure 6.11: Microsoft Excel 2010™ CSV Import (2)
3. In the first step of the wizard choose Delimited as Original data type and select Unicode (UTF-8) for the fileorigin. See Figure 6.12.
Figure 6.12: Microsoft Excel 2010™ CSV Import (3)
4. In next step define Comma as delimiter and ” as text qualifier as shown in Figure 6.13.
82 © 2011 — 2021 Ammonit Measurement GmbH

Data Logger Meteo-40 Plus User’s Manual 83 / 246
Figure 6.13: Microsoft Excel 2010™ CSV Import (4)
5. In the last step of the wizard, select Text for the data format columns. See Figure 6.14.
© 2011 — 2021 Ammonit Measurement GmbH 83

Figure 6.14: Microsoft Excel 2010™ CSV Import (5)
6. By clicking on Finish the file opens in your selected sheet. See Figure 6.15.
Figure 6.15: Microsoft Excel 2010™ CSV Import (6)
7. In order to change the cell format of the date and time columns from text to date time format, highlight thecolumn(s) and open Format Cells in the Numbers group on the Home tab. Select Custom and enter YYYY-MM-DD hh:mm:ss.000 as shown in Figure 6.16.
84 © 2011 — 2021 Ammonit Measurement GmbH

Data Logger Meteo-40 Plus User’s Manual 85 / 246
Figure 6.16: Microsoft Excel 2010™ Format Cells
6.7 Access to Source Data
Source data contains all electrically measured values neither interpreted nor with any statistical evaluation applied.If source data is available and the used sensors are known, it is possible to re-evaluate a complete measurementcampaign.
ImportantSource data is only recorded, when recording is switched on!See the note about recording in Section 5.1 for details.
The source data storage is organized as a ring buffer, which means that the oldest data will be overwritten, whenthe storage is filled entirely. For compactness reasons data is saved in a binary format and cannot be read directly.However, you can view or download data.
To view or download source data, go to the Data → Source menu. Meteo-40 displays all months and related days, onwhich source data is available. As shown in Figure 6.17, select month, day and time period to display related sourcedata in the table below.
© 2011 — 2021 Ammonit Measurement GmbH 85

2020 10
2020-10
Mon Tue Wed Thu Fri Sat Sun
1 2 3 4
5 6 7 8 9 10 11
12 13 14 15 16 17 18
19 20 21 22 23 24 25
26 27 28 29 30 31
HH:MM HH:MM HH:MM HH:MM HH:MM HH:MM
00:00 00:10 00:20 00:30 00:40 00:50
01:00 01:10 01:20 01:30 01:40 01:50
02:00 02:10 02:20 02:30 02:40 02:50
03:00 03:10 03:20 03:30 03:40 03:50
04:00 04:10 04:20 04:30 04:40 04:50
05:00 05:10 05:20 05:30 05:40 05:50
06:00 06:10 06:20 06:30 06:40 06:50
07:00 07:10 07:20 07:30 07:40 07:50
08:00 08:10 08:20 08:30 08:40 08:50
09:00 09:10 09:20 09:30 09:40 09:50
10:00 10:10 10:20 10:30 10:40 10:50
11:00 11:10 11:20 11:30 11:40 11:50
12:00 12:10 12:20 12:30 12:40 12:50
13:00 13:10 13:20 13:30 13:40 13:50
14:00 14:10 14:20 14:30 14:40 14:50
15:00 15:10 15:20 15:30 15:40 15:50
16:00 16:10 16:20 16:30 16:40 16:50
17:00 17:10 17:20 17:30 17:40 17:50
18:00 18:10 18:20 18:30 18:40 18:50
19:00 19:10 19:20 19:30 19:40 19:50
20:00 20:10 20:20 20:30 20:40 20:50
21:00 21:10 21:20 21:30 21:40 21:50
22:00 22:10 22:20 22:30 22:40 22:50
23:00 23:10 23:20 23:30 23:40 23:50
DateandTime A1 A2 A3 A4 C1 sw V I T addr2020-10-
0300:00:00.000361.0556262801021 362.36121467708807 362.5133299321774 363.73716961647534 432.975649367402 0.7319599161642604 30.70623358091316 18.003761734752757 28.773255110742078 0000000000x0
2020-10-
0300:05:00.0000000000001x0
2020-10-
0300:10:00.000361.01463506506786 362.1797412198865 363.05074947937345 363.60573401681 433.46624929392704 0.7406959626282544 30.95850445317772 17.792306630506467 29.40491319885194 0000000002x0
2020-10-
0300:15:00.0000000000003x0
2020-10-
0300:20:00.000361.0642064369929 361.93771684716796 362.9164064701817 363.7343683054953 433.37473061549156 1.4111329760881985 31.066666527906733 17.95963603736538 29.163058437246267 0000000004x0
2020-10-
0300:25:00.0000000000005x0
2020-10-
0300:30:00.000361.0646104911021 361.89071425971304 363.22589819180956 363.9513150474981 432.5878188869856 0.8099513264301863 30.558374430403187 18.04843848301416 29.34651074996842 0000000006x0
2020-10-
0300:35:00.0000000000007x0
2020-10-
0300:40:00.000360.6188685488898 361.9004238695687 363.42332041960265 363.9796602506595 433.341606013404 1.3491906060287382 30.573189320029748 18.358268883258162 29.222290354504107 0000000008x0
2020-10-
0300:45:00.0000000000009x0
10lines
◀ ▶
SourceDataOnly EvaluatedDataOnly SourceandEvaluatedData Downloadtenminutes Downloadhour Downloadday Downloadweek
Figure 6.17: Screenshot of the Source Data Page
The displayed source data can be downloaded as CSV file by clicking on the buttons below the table.
Download ten minutes Click to download a CSV file with source data of the selected 10min-period.
Download hour Click to download source data of the selected hour, i.e., source data of one table row. The sourcedata in the downloaded CSV file starts with 00:00 min and ends with 59:59 min.
Download day Click to download source data of the selected day, i.e., the source data of the whole day from 00:00:00to 23:59:59. If source data of the current day should be downloaded, the CSV file includes all data up to thedownload moment.
WarningThe volume of downloaded source data can be huge, e.g., a filled 2 GB memory can lead to a 10 GB CSVfile.
86 © 2011 — 2021 Ammonit Measurement GmbH

Data Logger Meteo-40 Plus User’s Manual 87 / 246
Chapter 7
Communication
7.1 Introduction
Depending on the usage of Meteo-40, several communication methods are available:
MeasurementCampaign
Power PlantMonitoring Maintenance (Site) Configuration
(Office)
Mobile Communiction(GPRS, UMTS)
Directional Radio
Satellite
USB Flash Drive
Ethernet
RS485
Ethernet
W-LAN
USB cable
Ethernet
W-LAN
USB cable
Table 7.1: Data Transmission with Meteo-40
The Meteo-40 web interface can be accessed via:
• LAN• W-LAN(WiFi) using a USB WiFi stick• Modem for GSM/ GPRS, directional radio or satellite connection• USB
© 2011 — 2021 Ammonit Measurement GmbH 87

TipTo download measurement data without accessing the Meteo-40 web interface, a pre-configured USB flashdrive can be used (see Section 4.2).
If Meteo-40 has been connected successfully to one of the above mentioned devices or networks, it is shown onthe data logger display under the menu Communication. USB and Ethernet connections are displayed in menuCommunication → Devices → LAN; a connected modem in menu Communication → Devices → Modem. W-LAN(WiFi) parameters are displayed in menu Communication → Devices → WLAN.
NoteAlthough no USB device is connected, Meteo-40 displays one unavailableUSB connection, which refersto the USB-B slot. As soon as you connect Meteo-40 via USB with your computer the displayed connectionwill change to active.
Once the connection has been established, further settings can be configured via the web interface. There are differentways to collect data from Meteo-40:
• Email• Remote Copy• AmmonitOR upload (also AmmonitOR installation on customer’s server)(AmmonitOR account is required)• Direct download via web interface• Direct download from data logger on USB flash drive
Data transmission between Meteo-40 and PC can be automatic (one-way) or interactive (two-way). Automatic commu-nication means that Meteo-40 sends CSV files by email or uploads data via SCP/FTP/SFTP/FTPS. Once the actionshave been configured, no further interaction is needed. Active communication implies an action by the user, e.g.,accessing the web interface while Meteo-40 is online. If a modem is used, you can access Meteo-40 via a tunnelserver.
Automatic Communication Interactive Communication
• Data Upload to AmmonitOR• Email CSV and other files• Data Upload via SCP, FTP, or SFTP
• Online Access via Tunnel Server• Meteo-40 Configuration• Data Download via Web Interface
Table 7.2: Automatic vs. Interactive Communication with Meteo-40
The settings for data transmission or online access can easily be configured via the Meteo-40 web interface in theCommunication → Schedule menu (see also Section 7.2). CSV files, which include measurement data, are stored on
88 © 2011 — 2021 Ammonit Measurement GmbH

Data Logger Meteo-40 Plus User’s Manual 89 / 246
the data logger and can be downloaded directly from the data logger, sent automatically via email to an address ofyour choice or uploaded automatically to an SCP/FTP/SFTP/FTPS server of your choice.
In order to configure the settings for each communication method, use the menu items: Online, AmmonitOR, Email,Remote Copy, LAN, W-LAN and Modem.
TipWe recommend using our online platform AmmonitOR to manage and monitor measurement data. Toregister and start using AmmonitOR, go to the AmmonitOR login page (https://or.ammonit.com/access/login/).
Port Direction Configurable Usage
21/tcp (FTP) outgoing yesfile transfer fromMeteo-40 to file server
4040/tcp outgoing nosecure tunnel forMeteo-40 webinterface
4041/tcp outgoing no
secure file transferfrom Meteo-40 to fileserver, e.g.AmmonitOR
25/tcp (SMTP) outgoing yesemail transfer fromMeteo-40 to mailserver
123/tcp+udp (NTP) outgoing nonetwork time protocolto set time and date
443/tcp (HTTPS) incoming nosecure Meteo-40 webinterface
465/tcp (SSMTP) outgoing yessecure email transferfrom Meteo-40 to mailserver
502/tcp (Modbus) incoming noMeteo-40 SCADAservice
Table 7.3: Ports used by Meteo-40
7.2 Configuring the Communication Schedule
Actions are processes, which the data logger performs according to the settings in the Communication → Schedulemenu. You select which action should be performed at which time and how often or how long during a day.
Meteo-40 turns on one minute before an action takes place and stays switched on as long as the action is running.The status box in the web interface informs about the number of running actions.
NoteIf CECS is always active has been selected in the CECS power mode section of the System →Administration menu, Meteo-40 does not switch off automatically. Refer to Section 1.4.1 for further de-tails.
Configuring the schedule includes defining the communication behavior during a day and selecting on which weekdaysan action should be performed. Each action starts performing at its Start Time and will be repeated according tothe defined Interval until the number of actions ( Quantity) is achieved or a new day begins ( 00:00).
© 2011 — 2021 Ammonit Measurement GmbH 89

Online Indicates the periods, at which the Meteo-40 web interface can be accessed over the Internet. If configured,a tunnel connection is established.
NoteBe carefully selecting the online intervals of the data logger. Connection costs can be very highdepending on the communication method. In most cases up to three online intervals of 20 minutesare sufficient.
AmmonitOR Indicates, when and how often CSV files should be uploaded to an AmmonitOR account.
Email Indicates, when and how often emails with attached CSV file(s) should be sent. If necessary, CSV files aregenerated automatically before emails are sent.
Remote Copy Indicates, when and how often CSV file(s) should be uploaded to a configured server using SCP, FTP,SFTP or FTPS. If necessary, CSV files are generated automatically before upload.
Only generate CSV Indicates, when and how often CSV files should be generated without sending or uploadingthem. Select this option to generate CSV files for the manual download via web interface or on USB flash drive.According to the configured statistics (see Section 6.3), Meteo-40 generates CSV files on the selected days atthe scheduled times.
Action Mon Tue Wed Thu Fri Sat Sun Start
time
Duration Quantity Interval Next
Online 12:00 00:20 1 06:002020‑10‑07
12:00Runnow
AmmonitOR 12:00 1 06:002020‑10‑07
12:00Runnow
Email 12:00 1 06:002020‑10‑07
12:00Runnow
Remote
Copy12:00 1 06:00 — Runnow
Only
generate
CSV12:00 1 06:00 — Runnow
Save
Figure 7.1: Configuring the Schedule
Weekdays Select the weekdays, on which the action should be performed.
Start Time: Determine, when the first action should start. If no Start time is defined, Meteo-40 will schedule the firstaction for 00:00.
Enter the Start Time according to the 24-hour format: hh:mm. Enter 14:00, when the action should start at14:00 hrs.
Duration (Only applies for Online): Enter the length of time (hh:mm), which the data logger should be connected tothe Internet. The duration begins with every start of an action.
Example: Start time 11:00, Duration 00:20, Quantity 2, Interval 03:00 means that the data logger will beonline at 11:00 hrs for 20 minutes. At 14:00 hrs Meteo-40 is online again for 20 min.
Enter the Duration according to the following time format: hh:mm.
Quantity: Enter the number of actions, which should be performed during a day. Once a weekday has been selectedto perform the action, the Quantity is set to 1. After changing the Quantity to a number higher than 1, an Intervalcan be entered. The last action will be performed at the latest at midnight, even if the user’s defined number ofactions has not been achieved.
Enter the Quantity as integer, e.g., 2, 3, 4.
Interval: Determine the time between the starts of two successive actions. The Interval can be entered once theQuantity of an action was set to a higher number than 1. Entering 01:00 means that the action will be performedhourly; entering 24:00 means that there is only one action per day possible.
Enter the Interval according to the following time format: hh:mm.
Next: Displays, when the next action is scheduled indicating date and start time.
90 © 2011 — 2021 Ammonit Measurement GmbH

Data Logger Meteo-40 Plus User’s Manual 91 / 246
NoteActions running just before midnight may be interrupted by the automatic CECS reboot. See Section 4.2for details.
For immediate action, click Run now. You can also start an action over the display menu (see Section 4.4.1).
While Meteo-40 is online, the time elapsed is shown in the last column as percentage value. Otherwise, the Run nowbutton can be clicked to connect Meteo-40 immediately to the Internet.
NoteConsider the time settings for sending emails and uploading CSV files via SCP/FTP/SFTP. During nighthours the battery’s energy might be too low to send or upload large files.
Do not forget saving your modifications. Without saving the previous values will be reset.
TipIn order to save or reduce connection costs, we recommend carefully setting the online periods of the datalogger in the schedule. In most cases it is sufficient to configure not more than three time slots of 20 minutesfor Internet activity.
7.3 Configuring Online Access
The Meteo-40 web interface can only be accessed remotely, when the data logger is powered-on and an Internetconnection has been established. Periods for online access can be configured in the Communication → Schedulemenu.
ImportantMeteo-40 can be connected to a tunnel server (e.g., AmmonitConnect; see Figure 7.2) to obtain a uniquesubdomain. Thus the GSM modem can be equipped with a standard SIM card with dynamic IP address.The tunnel server manages the subdomains. Users access the Meteo-40 web interface (when online)by entering its subdomain, e.g., https:// subdomain .connect.ammonit.com. Additionally, the con-nection between data logger and server is encrypted and therefore cannot be accessed by unauthorizedusers.
AmmonitConnect / a tunnel server can be configured in the Communication → Online menu. You can choose betweenAmmonitConnect, your own AmmonitConnect or no AmmonitConnect, if you use Meteo-40 for testing purposesin your office.
© 2011 — 2021 Ammonit Measurement GmbH 91

Ammonittunnel
Access via direct interface (Ethernet or USB)
Ammonit Tunnel Server(provides public IP address,at which the data logger canbe reached on the Internet)
Access via HTTPSconnection
Figure 7.2: Communication between Meteo-40 and PC via AmmonitConnect
NoteIf you use a SIM card with static IP address, an AmmonitConnect connection is not necessarily needed.The AmmonitConnect connection can be configured additionally, since it is established faster than theconnection via static IP address. AmmonitConnect caches images and history of the last sessions.
AmmonitConnect
AmmonitConnectserver
OfficialAmmonitConnect
AmmonitConnectlogin
AmmonitConnectport
4040
AmmonitConnectaccesscode(highlyrecommended)
PreventimplicitAmmonitConnectactivation(onlyrecommendedforsatellitecommunication)
AmmonitConnectnotifyaddress(optional)
Save
RemoveAmmonitConnectidentification
DownloadSSHkey
LinktoAmmonitConnect
Figure 7.3: Configuring the Online Access
Meteo-40 offers three AmmonitConnect options (see Figure 7.3) in the Communication → Online menu:
92 © 2011 — 2021 Ammonit Measurement GmbH

Data Logger Meteo-40 Plus User’s Manual 93 / 246
No AmmonitConnect: Select this option, when you use a SIM card with static IP address or when you are connecteddirectly to the data logger via LAN (Ethernet) or USB.
AmmonitConnect: Select AmmonitConnect (see Figure 7.2) to access the data logger’s web interface via an Am-monitConnect domain link https://Dnnnnnn.connect.ammonit.com).
Custom AmmonitConnect: Enter AmmonitConnect login and AmmonitConnect port of your own AmmonitConnectserver. Your server has to authenticate the Meteo-40 data logger. Download the SSH key of the data logger forauthentication. Contact your system administrator for further details.
Download SSH Key Download SSH Key is only necessary, if you use your own AmmonitConnect server or anAmmonitOR installation. The SSH public key is used to authenticate the data logger at your server.
Link to AmmonitConnect In order to get the URL to access your Meteo-40 data logger via AmmonitConnect, clickon Link to AmmonitConnect.
AmmonitConnect access code By using a AmmonitConnect access code, you prevent unauthorized Internet trafficfrom reaching the data logger. This traffic might slow down your connection and increase Internet costs. For theAmmonitConnect access code, you can use upper and lower case letters, number, and the underscore. Othersymbols are not allowed.
TipBy entering an AmmonitConnect access code, connection costs can be saved. The login page ofthe data logger is not visible for unauthorized users. Thus the URL of the data logger cannot easilybe spammed or attacked.
Once the AmmonitConnect access code has been entered in your browser, it is saved as cookie on your PC. TheAmmonitConnect access code only needs to be entered again on your PC after the cookie has been deleted.
TipBy using AmmonitConnect with an AmmonitConnect Access Code, you can boost your connection to yourdata logger. The AmmonitConnect server recognizes the IP address of your data logger in the field. In somecases the IP address is accessible from outside (routable IP address of the installed SIM card). However, inthis case you can directly access your data logger via its IP address. There is no need to use the circuit viathe AmmonitConnect server in Germany. AmmonitConnect still manages the connection. Thus you accessthe web interface of the data logger via a simple URL: https://dnnnnnn-direct.connect.ammonit.com.This feature works with all Ammonit Meteo-40 data loggers, no matter which firmware version is installed.
In order to access the data logger via AmmonitConnect, the URL of the data logger has to be entered in your browser,i.e., https://dnnnnnn.connect.ammonit.com/. On your first access via AmmonitConnect you have to enter the Am-monitConnect access code, see Figure 7.4.
© 2011 — 2021 Ammonit Measurement GmbH 93

URL:https://D001234.tunnel.ammonit.com/
AmmonitConnect
PleaseenteryourAmmonitConnectaccesscode.
Send
ThedefaultAmmonitConnectaccesscodeis
Ammonit.
TheAmmonitConnectaccesscodemustbeconfiguredonyourdataloggerunderCommunication/Connect.
Itpreventsunauthorizedaccesstotheloginpageofthedatalogger.
©2011-2020AmmonitMeasurementGmbHwww.ammonit.com
Figure 7.4: Entering the AmmonitConnect Access Code
Prevent implicit AmmonitConnect activation The data traffic can be reduced by selecting this checkbox. The fea-ture is especially designed for satellite communication. By activating the checkbox, the connection is onlyestablished according to the configured schedule (see Section 7.2). Other AmmonitConnect activations areprevented.
AmmonitConnect notify address Any semicolon (;) separated XMPP addresses (JIDs) entered here will be con-tacted when the data logger connects to or disconnects from AmmonitConnect. Those accounts will receive amessage from [email protected] which includes the timestamp of the connection, the installed softwareversion and links to the relevant online services.
ImportantMeteo-40 can only be accessed via AmmonitConnect server, when the data logger is online! The onlineperiods are configured in the Communication → Schedule menu.
If Meteo-40 is configured for AmmonitConnect and your data logger is currently not online, the following page (see figFigure 7.5) will be displayed.
94 © 2011 — 2021 Ammonit Measurement GmbH

Data Logger Meteo-40 Plus User’s Manual 95 / 246
URL:https://D001234.tunnel.ammonit.com/
AmmonitConnect
YourdataloggeriscurrentlynotconnectedtoAmmonitConnect.
Ifyoubelieveitshouldbe,pleasecheckthat:
Yourdataloggerisconfiguredtobeonlineatthistime
YourdataloggerisconfiguredtouseAmmonitConnect
©2011-2020AmmonitMeasurementGmbHwww.ammonit.com
Figure 7.5: Communication via AmmonitConnect (closed tunnel)
Remove AmmonitConnect identification Public key cryptography is used at Meteo-40 to identify the AmmonitCon-nectserver in order to prevent man-in-the-middle attacks. During the installation, Ammonit includes the ssh hostfingerprint of the official AmmonitConnect server in the known hosts list of every data logger, to make it possibleto use the AmmonitConnect service. If you are using a custom AmmonitConnect server, the new fingerprint willbe added to the data logger known hosts list on the first access to your AmmonitConnect server. If the Am-monitConnectserver ssh host key changes due to a server relaunch you must delete the old AmmonitConnecthost identification in order to allow the connection.
7.4 Configuration for using AmmonitOR
In the Communication → AmmonitOR the AmmonitOR server can be selected, and one can configure which kind ofdata is send to AmmonitOR.
If Meteo-40 user Admin set the option Force Encryption, the parameters cannot be changed by user User.
NoteIf you do not have an AmmonitOR account yet, go to the AmmonitOR login page (https://or.ammonit.com/access/login/) or click on Link to AmmonitOR to register. Further details about AmmonitORand a user manual can be found on www.ammonit.com (http://www.ammonit.com).
AmmonitOR server Select your preferred AmmonitOR server: Ammonit-hosted installation or your own AmmonitORserver.If you use the Ammonit-hosted installation, server details are filled automatically. If you use your own installation,enter the necessary server details. Your local AmmonitOR server has to authenticate each data logger. To doso, see Section 7.4.1.
AmmonitOR project key Enter the Project key of your related AmmonitOR project. The Project key is displayed inthe project overview of your AmmonitOR project. It consists of four to six uppercase letters. You can connectmore than one data logger to an AmmonitOR project. To do so, use the Project key for all project-related dataloggers.
© 2011 — 2021 Ammonit Measurement GmbH 95

Server, Port, Username Name or IP address of your AmmonitOR server, TCP port, and username for upload. Thesevalues are automatically set correctly for the Ammonit hosted server.
Start date Files older than this date will not be transmitted to AmmonitOR.
AmmonitORserver
AmmonitAmmonitOR
AmmonitORprojectkey
Server
upload.ammonit.com
Port
4041
Username
upload
Startdate(YYYY-MM-DD)
SendCSVfiles
Sendlogbookdata
Yes
Sendconfigurationfile
Sendcameraimage
Senddatasnapshot
Sendgustdatafiles
SendsecondaryCSVfiles
SendtertiaryCSVfiles
Save
Saveandcopytestdata
Resetsendstatus
DownloadSSHkey
LinktoAmmonitOR
Figure 7.6: AmmonitOR Settings
Decide, which data should be monitored in AmmonitOR:
AmmonitOR send options
CSV files Select this, if you want to send all measurement data to AmmonitOR.
If you do not want your measurement data sent to AmmonitOR, deselect this switch.
Logbook data Whether to send logbook entries. Select No to never send them, Yes to send them always on the nextday, or Immediately to send them with every scheduled email.
96 © 2011 — 2021 Ammonit Measurement GmbH

Data Logger Meteo-40 Plus User’s Manual 97 / 246
Configuration file Select this option, to send the data logger configuration file to AmmonitOR. Passwords and themodem PIN will be stripped of the configuration file for security reasons.
Camera image Select this option, to send camera images to AmmonitOR. The camera image is taken at the momentof the sending to AmmonitOR.
Data snapshot Select this option, to send data snapshots to AmmonitOR. The data snapshot consists of the mea-surements just in the moment of sending to AmmonitOR.
NoteThis feature is still considered experimental and might not always work.
Gust data, secondary, and tertiary CSV files Select this option, to send gust data, secondary, or tertiary CSV filesto AmmonitOR.
NoteThis files are only stored on AmmonitOR, but not yet interpreted in any way.
File Edit View Go Bookmarks Tabs Help
Back https://or.ammonit.com/projects/376/logger/591/connections/
Messages
Data loggerOverviewAll evaluations (7 days)ConnectionsConnection alarmsLogbookConfigurationsPhotos
DataCalendarData tablesTable of averagesRaw data filesExport dataUpload data
PlotsCorrelation plotDaily profileLong term comparison profileMonthly profileOverlay graphShadow zone plotSimple height profileSpeed direction barSpeed direction dotsSunshine hoursTurbulence intensityTurbulence intensity polarWind directionWind speedXY plot
Data logger Roof Mast (D110057)
Earlier connections View text View graphic
Showing connections from 2013-10-31 until 2013-11-30 (30 days)
Time in UTC
Day of monthAccess this data logger via tunnel
00:0001:0002:0003:0004:0005:0006:0007:0008:0009:0010:0011:0012:0013:0014:0015:0016:0017:0018:0019:0020:0021:0022:0023:00
31 1 2 3 4 5 6 7 8 9 10 11 12 13 14 15 16 17 18 19 20 21 22 23 24 25 26 27 28 29
Figure 7.7: Connection Log in AmmonitOR
Reset send status With this function, Meteo-40 forgets about ever sending files to AmmonitOR. Any files will be sentagain.
Save and copy test data This function sends a test file to AmmonitOR. This is useful to check the connection andsettings, such as the project key.
Save Save the current settings.
Link to AmmonitOR Click on Link to AmmonitOR to set up a new AmmonitOR account.
Download SSH Key Applies only, when you use a local AmmonitOR installation (not the Ammonit-hosted installation).Your AmmonitOR server has to authenticate each Meteo-40 data logger. To do so, download the SSH key andsee Section 7.4.1 and AmmonitOR user manual on the Ammonit website (http://www.ammonit.com/en/ammonit-customer-login).
© 2011 — 2021 Ammonit Measurement GmbH 97

7.4.1 Authenticating Meteo-40 at your local AmmonitOR installation
If data files should be uploaded to a local AmmonitOR installation, the local AmmonitOR server has to authenticateeach Meteo-40 data logger. To do so, download the SSH key from each Meteo-40 data logger. The SSH key can bedownloaded in the Communication → AmmonitOR menu. Copy the SSH key on your local AmmonitOR server.
Open the AmmonitOR administration web interface (admin rights are necessary) and enter the SSH key in the Base→ SSH keys menu of AmmonitOR. For further details see AmmonitOR manual, which can be downloaded from theAmmonit website (http://www.ammonit.com/en/ammonit-customer-login). After adding the key, the fileupload can be configured.
7.5 Configuring Email Parameters
In order to receive data via email from the data logger, Meteo-40 has to be connected to the Internet (e.g., via modem)and an email account has to be configured in the Communication → Email menu.
ImportantDo not use your personal email account for data logger emails. We recommend setting up a separate ac-count. Anyone logged in as either Admin or User on the data logger can access username and password,and consequently the related email account.
TipIt is possible to use email addresses from free service providers, e.g., Yahoo, Gmail, to send data files fromMeteo-40.
Enter server and account details:
SMTP method Select the method used to secure outgoing SMTP transfers. SMTP (Simple Mail Transfer Protocol)is a standard protocol used to send emails. Choose either SMTP over SSL/TLS (also known as SMTPS),STARTTLS (establish an initially-insecure connection which is upgraded to a secure one before data transfer)or unencrypted. Check with your email service provider for the supported methods.
SMTP server Enter SMTP server address, e.g., smpt.mail.provider.com. SMTP server details can be obtained fromyour email service provider.
SMTP port Enter the SMTP port, or 0 for the default. The default is 465 for ”SMTP over SSL/TLS”, otherwise 25. Theport number can be found in the SMTP server details or from your email service provider. Some newer serversuse 587 for STARTTLS.
Verify server SSL/TLS certificates When using SMTP over SSL/TLS or STARTTLS, the server identifies itself bysending a certificate. When this option is enabled, the data logger verifies that the configured server was issuedthat certificate by a trusted authority. Disabling this option risks man-in-the-middle attacks.
SMTP username Enter the username, which is used to access your email account. Often the username is the sameas the email address.
SMTP password Enter the password, which is used to access your email account.
From Enter the sender’s email address, which is often also the username of the email account.
To Enter the email address of the recipient. If more than one email address should be entered, use a semicolon (;)to separate the email addresses.
Cc If required, enter the recipient(s), who should receive the email in copy. If more than one email address should beentered, use a semicolon (;) to separate the email addresses.
POP server (for POP-before-SMTP authorization) Only required for SMTP servers using POP-before-SMTP or SMTP-after-POP authentication.
Start date (YYYY-MM-DD) Indicates which data files should be sent via email. No older files than indicated with theStart date will be sent.Enter the start date in ISO-8601 format: YYYY-MM-DD (e.g., 2016-01-31)
98 © 2011 — 2021 Ammonit Measurement GmbH

Data Logger Meteo-40 Plus User’s Manual 99 / 246
Maximal number of attachments Each email will contain at most this many attachments. If there are more than thisamount of attachments to send, then multiple emails will be sent.
All other send options are explained in the AmmonitOR section, AmmonitOR send options.
According to the settings in the Communication → Schedule menu (see Section 7.2), an email is sent to the specifiedaccount including one or more CSV files. An email includes all CSV files, generated since the last email has beensent.
© 2011 — 2021 Ammonit Measurement GmbH 99
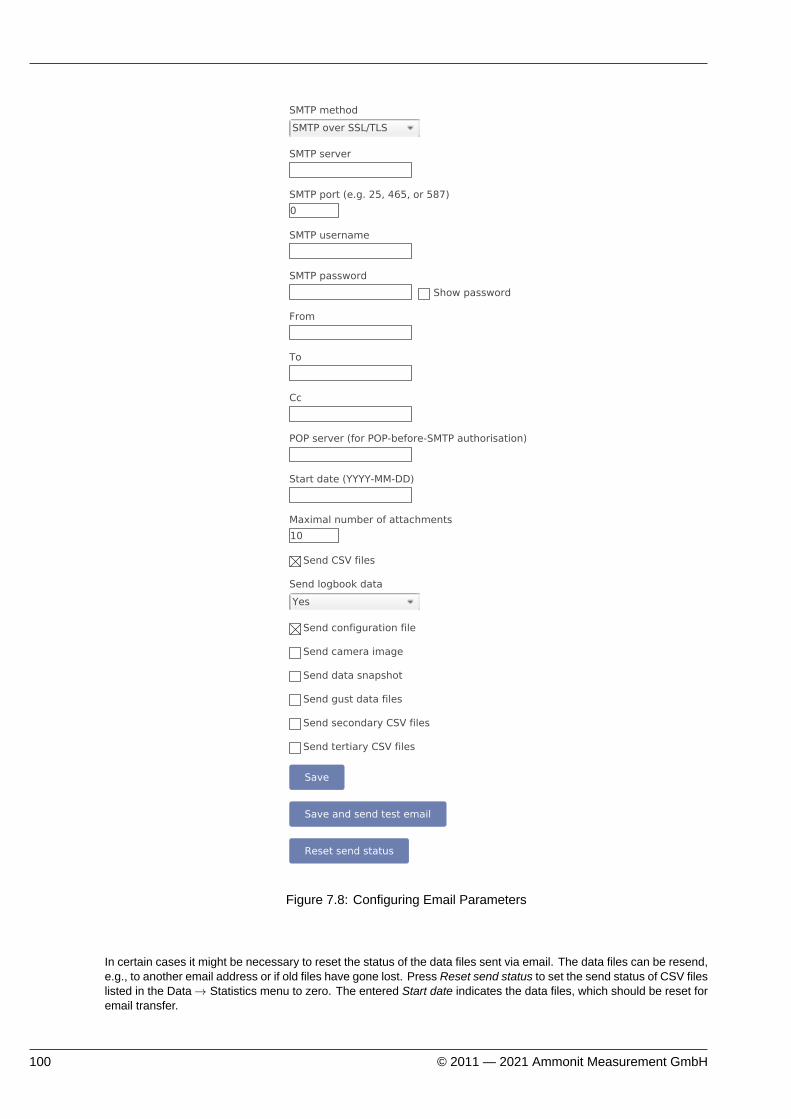
SMTPmethod
SMTPoverSSL/TLS
SMTPserver
SMTPport(e.g.25,465,or587)
0
SMTPusername
SMTPpassword
Showpassword
From
To
Cc
POPserver(forPOP-before-SMTPauthorisation)
Startdate(YYYY-MM-DD)
Maximalnumberofattachments
10
SendCSVfiles
Sendlogbookdata
Yes
Sendconfigurationfile
Sendcameraimage
Senddatasnapshot
Sendgustdatafiles
SendsecondaryCSVfiles
SendtertiaryCSVfiles
Save
Saveandsendtestemail
Resetsendstatus
Figure 7.8: Configuring Email Parameters
In certain cases it might be necessary to reset the status of the data files sent via email. The data files can be resend,e.g., to another email address or if old files have gone lost. Press Reset send status to set the send status of CSV fileslisted in the Data → Statistics menu to zero. The entered Start date indicates the data files, which should be reset foremail transfer.
100 © 2011 — 2021 Ammonit Measurement GmbH

Data Logger Meteo-40 Plus User’s Manual 101 / 246
ImportantDo not forget saving the settings. By clicking the button Save and send test email, the configurationcan be checked.
NoteIn order to test the email function, the data logger has to be connected to the Internet via modem, LAN orW-LAN (WiFi). It is not sufficient to connect Meteo-40 to a PC via USB, because a PC is not necessarilyconfigured as router. If your smartphone is designed for tethering, you can connect your smartphone andconfigure it as router to test the email function of the data logger.
On the Statistics Data Download page in the Data → Statistics menu all CSV files, which have been sent via email,have a checkmark. See also Section 6.3.
7.5.1 Signing and Encrypting Emails and Attachments
Digital signature and encryption are very complex topics. By digitally signing an email or a file, its authenticity can beverified. A valid digital signature indicates that the email / file has been created by a known sender, e.g., your Meteo-40data logger (authentication), and the email has not been manipulated on its way to the receiver (integrity). By usingencryption, you can encode emails and attachments in a way that third parties cannot read the file, only authorizedparties are allowed to open and read the files. A password is required to decrypt emails and files.
Read this section carefully and follow our description step by step to avoid any misunderstandings. For further detailsabout digital signature and encryption, refer to Chapter 14.
Meteo-40 supports the international standard OpenPGP (https://en.wikipedia.org/wiki/Pretty_Good_Privacy#OpenPGP) for signing and encryption. Specifically, the free software GnuPG is used. Refer to the GnuPGwebsite (http://gnupg.org/) for further details.
In the Communication → Email menu emails and attachments can be signed or signed and encrypted using OpenPGP.
Unsigned and unencrypted If emails should be sent neither with digital signature nor password protected, selectthis option.
Sign data (OpenPGP) Select this option to digitally sign CSV and logbook files sent via email. The CSV and logbookfiles sent by Meteo-40 are signed with a unique digital key. A certificate, indicating the digital signature, isattached to the email for each CSV and logbook file. The attachments can, however, be opened and savedwithout restriction.As soon as a signed file is modified, the certificate is invalid.In order to verify the certificate, download the Public key, displayed in the Meteo-40 web interface and importthe key into your local verification software, e.g., Gpg4win (see Section 7.5.1.1).
Sign and encrypt data (OpenPGP) Select this option to sign (as above) and encrypt CSV and logbook files sent viaemail. Enter an Encryption password, which is required to decrypt the file on the recipient’s side.In addition to the digital signature Meteo-40 can encrypt CSV and logbook attachments with a Private key.The encrypted files can only be opened by authorized persons with the Encryption password. To do so, additionalsoftware is required. See e.g. Section 7.5.1.1.To decrypt the data, download the Public key by clicking on the button in the Meteo-40 web interface. Importthe Public key into your encryption software (see below). The displayed Fingerprint is used to authenti-cate the Public key.
7.5.1.1 Working with Gpg4win to Decrypt and Verify Files on Windows™ PCs
In order to open and read files, which have been encrypted by Meteo-40, additional software is necessary. We recom-mend installing GPG4win (GNU Privacy Guard for Windows). Ggp4win enables users to encrypt, decrypt, sign andverify emails and attachments as well as files in a directory. The software includes the following components:
• GnuPG: encryption tool
© 2011 — 2021 Ammonit Measurement GmbH 101

• Kleopatra: certificate manager for OpenPGP• GpgOL: add-in for Microsoft Outlook 2003/2007/2010/2013™ for email encryption• GpgEx: plug-in for Microsoft Explorer™ for file encryption• Gpg4win Compendium: documentation for beginners and advanced users
Go to the GPG4WiN website (http://gpg4win.de/download) and download the current software version. Installthe software with the above mentioned components.
NoteIf you work with Microsoft Outlook™, the program has to be restarted to implement the GpgOL add-in asseparate ribbon. For decryption via the GpgOL add-in, go to Section 7.5.1.5.
Before working with Gpg4win, the software has to be configured. Download the Public key from the Meteo-40 webinterface, as shown in Figure 4.9.
ImportantEach Meteo-40 data logger has its own unique public key. If you work with different Meteo-40 data loggers,you have to import the public key of each Meteo-40. One user’s private key is sufficient to certify the publickeys (as shown in Figure 7.11).
Import the Public key in Gpg4win via right-mouse click in the Windows Explorer™. A message is displayed aftersuccessfully importing the key.
Figure 7.9: Importing the Public key into Gpg4win
Open the Kleopatra software. The Public key is listed under Other Certificates.
The Public key of the Meteo-40 data logger has to be certified by your own key. If a user’s private key has alreadybeen generated, skip the following task and go on with Figure 7.11.
If no user’s private key exists, create a new certificate via the File → New Certificate menu. Select Create a personalOpenPGP key pair and enter the required details. Click Create key and enter a high quality password. Your key shouldhave been successfully created.
102 © 2011 — 2021 Ammonit Measurement GmbH

Data Logger Meteo-40 Plus User’s Manual 103 / 246
Figure 7.10: Creating the private key
The Public key of Meteo-40 has to be certified. Go to Other Certificates and select Meteo-40’s key. Open thecontext menu via right-mouse click and select Certify Certificate.
Figure 7.11: Certifying the Public key
Before trusting the certificate, check the displayed Fingerprint with the Fingerprint shown in the Meteo-40 webinterface (see Figure 4.9).
© 2011 — 2021 Ammonit Measurement GmbH 103

verify finterprint
Figure 7.12: Verifying the Fingerprint
Verify the certificate and enter the password for the Private key. The password is used to unlock the Privatekey for the OpenPGP certificate. Finally both certificates are displayed under Trusted Certificates.
Figure 7.13: Trusted Certificates
7.5.1.2 Verifying digital signatures in the Windows Explorer™
If Sign data (OpenPGP) has been selected, each CSV and logbook file sent by Meteo-40 comes with a detachedsignature file, i.e., a separate signature file (.sig) is attached to the email. The signature file has the same name asthe CSV or logbook file - ending on .sig.
Download and certify the Public key of Meteo-40 as described in Section 7.5.1.1.
Download both related files to your directory. Choose the data or logbook file, which should be verified. Open thecontext menu with a right-mouse click on the .csv.gz, .log or .sig file and select Verify.
104 © 2011 — 2021 Ammonit Measurement GmbH

Data Logger Meteo-40 Plus User’s Manual 105 / 246
Figure 7.14: Verifying signed files
Make sure that Input file is a detached signature is selected. Both related files should be listed, with the signatureending on .sig in the Input file field. Select Decrypt/Verify. After verification the Kleopatra software indicates thevalidity of the signature.
Figure 7.15: Successfully verified signature
7.5.1.3 Verifying digital signatures in Microsoft Outlook™
If Sign data (OpenPGP) has been selected, each CSV and logbook file sent by Meteo-40 comes with a detachedsignature file, i.e., a separate signature file (.sig) is attached to the email. The signature file has the same name asthe CSV or logbook file - ending on .sig.
Download and certify the Public key of Meteo-40 as described in Section 7.5.1.1.
Open the email and select the file, which should be verified (ending on .csv.gz or .log). Click on Save and decryptin the Attachments ribbon of Microsoft Outlook™.
© 2011 — 2021 Ammonit Measurement GmbH 105

Figure 7.16: Verifying files in Microsoft Outlook™
Make sure that Input file is a detached signature is selected. Both related files should be listed, with the signatureending on .sig in the Input file field. Select Decrypt/Verify.
Figure 7.17: Verifying signatures in Microsoft Outlook™
After verification the Kleopatra software indicates the validity of the signature.
106 © 2011 — 2021 Ammonit Measurement GmbH

Data Logger Meteo-40 Plus User’s Manual 107 / 246
Figure 7.18: Successful validation of the signature
NoteIf test emails sent by Meteo-40 have been signed, a separate signature file is attached, e.g., Meteo-40.txt.sig. To verify the signature, open the email and select both related attachments, e.g., Meteo-40.txtand Meteo-40.txt.sig. Choose Save and decrypt in the Attachments ribbon of Microsoft Outlook™.Both files are listed in the Kleopatra software: Input file and Signed data (see Figure 7.19). Select Decryp-t/Verify to validate the signature.
Figure 7.19: Verifying signed test mails
7.5.1.4 Decrypting files in the Windows Explorer™
Download and certify the Public key of Meteo-40 as described in Section 7.5.1.1.
© 2011 — 2021 Ammonit Measurement GmbH 107

Encrypted files can be decrypted in the Windows Explorer™. Right click on the file and select Decrypt and verify.
Figure 7.20: Decrypting files via the GpgEx plug-in for Windows Explorer™
Start the decryption process by clicking Decrypt and verify.
Figure 7.21: Decryption via Kleopatra Software
For decryption enter the password, which you entered for encryption in the Meteo-40 web interface in the System→ Administration menu.
108 © 2011 — 2021 Ammonit Measurement GmbH

Data Logger Meteo-40 Plus User’s Manual 109 / 246
Figure 7.22: Password Prompt for Decryption
After successful decryption the file is displayed in the initial folder or the one selected in the decryption process.
Figure 7.23: Successful File Decryption
7.5.1.5 Decrypting files in Microsoft Outlook™
After installing Gpg4win a new ribbon GpgOL should be shown in your Outlook™ application. Follow our step by stepguide to decrypt encoded data files sent by your Meteo-40 data logger.
Download and certify the Public key of Meteo-40 as described in Section 7.5.1.1.
Open the email item and go to the Attachments ribbon (Click on one of the attached files). Click on Save and decryptin the Attachments ribbon.
© 2011 — 2021 Ammonit Measurement GmbH 109

Figure 7.24: GgpOL add-in in Microsoft Outlook™
Select the folder, in which the files should be saved and start the decryption process by clicking on Decrypt/Verify inthe Kleopatra software. For decryption, enter the passphrase that you configured for encryption in the Communication→ Email menu of the Meteo-40 web interface. See also Section 7.5.1.4.
Both encoded and decrypted data files should be successfully saved in the selected folder.
NoteIn order to verify signed and encrypted test emails sent by Meteo-40, open the email and select Decryptin the GpgOL ribbon of Microsoft Outlook™. Enter the password, which has been set for Encryption in theMeteo-40 web interface at the System → Administration menu.
7.6 Configuring SCP, FTP and SFTP Parameters
By using Remote copy you can upload CSV files to a server of your choice. To do so, Meteo-40 has to be connectedto the Internet, e.g., via modem.
The CSV file upload can be configured in the Communication → Remote copy menu. Meteo-40 offers four methodsto upload data:
If Meteo-40 user Admin set the option Force Encryption, the parameters cannot be changed by user User.
SCP with SSH key Select this option to upload files via SCP to your server. The connection is encrypted with RSA2048 bit. Enter server address, port, username and directory to enable the file upload. Contact your systemadministrator for the server details.To set this up, copy the data logger’s public SSH key to the authorized_keys file on the server. If in doubt,ask your server administrator.
NoteThe Directory can be either absolute, i.e. starting with a forward slash (/), or relative to the remoteusers home directory, i.e. starting with a tilde and a forward slash (~/).
SCP with password This option is the same, but authenticates using the provided password instead of the SSH key.
FTP Select this option to upload files to your FTP server. Enter server address, username, password and directoryto enable the file upload. Contact your system administrator for the server details.
110 © 2011 — 2021 Ammonit Measurement GmbH

Data Logger Meteo-40 Plus User’s Manual 111 / 246
NoteFTP transfer always uses passive mode, not active mode.
WarningThe file upload via FTP is not encrypted.
SFTP SFTP is similar to FTP but encrypted using SSH. In principle, the same facts apply as with SCP.
FTPS FTPS is similar to FTP but encrypted using TLS (also known as SSL).
All files uploaded via Remote Copy have a checkmark in the Copy column in the Data → Statistics menu. See alsoSection 6.3.
© 2011 — 2021 Ammonit Measurement GmbH 111

Method
SCP
Server
Port
0
Username
Password
Showpassword
Directory
Startdate(YYYY-MM-DD)
SendCSVfiles
Sendlogbookdata
Yes
Sendconfigurationfile
Sendcameraimage
Senddatasnapshot
Sendgustdatafiles
SendsecondaryCSVfiles
SendtertiaryCSVfiles
Save
Saveandcopytestdata
Resetsendstatus
DownloadSSHkey
Figure 7.25: Configuring the Remote Copy Parameters
By entering a Start date, you can configure which files should be uploaded. No older files than the indicated Start datewill be uploaded.
All other send options are explained in the AmmonitOR section, AmmonitOR send options.
ImportantSave your configuration. The entered values are reset after moving to another page.
Each upload includes all collected CSV files, which have been generated since the last file upload. If it is the firstupload, Meteo-40 uploads all CSV files - no matter, how many CSV files have been generated. The sequence ofactions can be configured in the Communication → Schedule menu. For further details refer to Section 7.2
112 © 2011 — 2021 Ammonit Measurement GmbH

Data Logger Meteo-40 Plus User’s Manual 113 / 246
TipIf you are using Windows™, you might try the FileZilla (http://filezilla-project.org) FTP server.After downloading and installing the software, you have to add a new user. Enter the appropriate fields andselect the folder, which should be shared. It is also important to configure Windows™ Firewall by addingan exception for the corresponding port (21 for FTP) and the FileZilla server interface.
WarningMake sure to download FileZilla only from its official website or other trusted sources. Malicious versionshave been released, that might copy private information to unauthorized parties.
7.7 Configuring LAN Parameters
ImportantRestart the data logger or disconnect the Ethernet cable for some seconds to apply new network settings.
Meteo-40 data loggers can be connected to your LAN using a standard Ethernet cable. The network connectionwill be automatically recognized. In order to access the Meteo-40 web interface, enter the assigned IP addresshttps://nn.nn.nn.nn/ in your web browser. The IP address can be found on the data logger display by se-lecting the corresponding device at the Communication → Devices → LAN → Ethernet. Refer to Section 2.3 andChapter 3 for more information about the login.
NoteIf you are working with Meteo-40 Revision C with RS232 slot, you need an USB Ethernet adapter to connectthe data logger to your LAN. The production of Meteo-40 Revision C stopped in October 2012.
A table in the Communication → LAN menu displays, which devices are connected, e.g., USB and / or Ethernet withits state, IP address and product (if available).
Screenshot of the Configuration of LAN parameters
Figure 7.26: Configuring LAN parameters
LAN online, whenever CECS is on The checkbox is selected by default. Thus after connecting Meteo-40 to LANvia Ethernet, the data logger goes online as soon as the CECS subsystem is switched on.
Use DHCP, static IP, or link-local By default, Meteo-40 automatically obtains an IP address from a DHCP server.DHCP is available in most networks. If DHCP is selected, the fields below are disabled. DHCP can be used toconnect a Meteo-40 to the internet through a local network without any further configuration.For most SCADA applications, the data logger has to be configured with a fixed IP address. Thus the use ofDHCP server has to be deactivated. See Section 7.7.1 for more information.
NoteFor upgrading the Meteo-40 firmware via the tethering function of your smartphone, the method hasto be set to DHCP. See also Section 4.3.1.
© 2011 — 2021 Ammonit Measurement GmbH 113
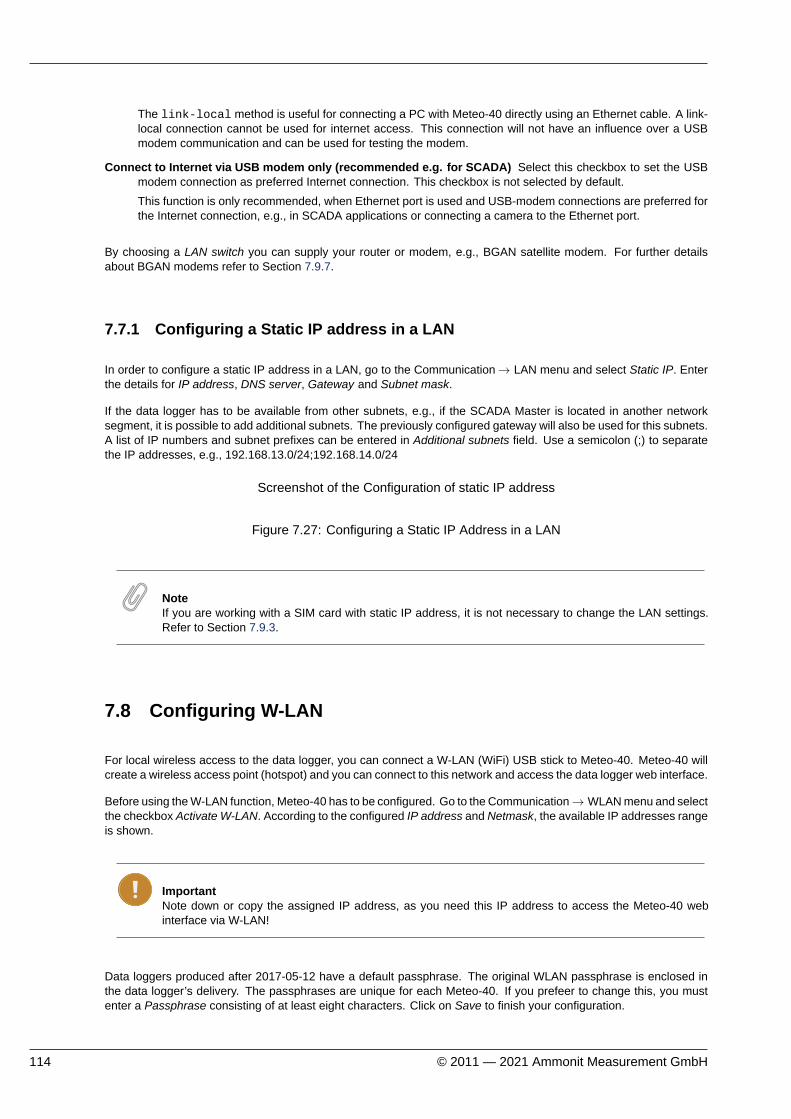
The link-local method is useful for connecting a PC with Meteo-40 directly using an Ethernet cable. A link-local connection cannot be used for internet access. This connection will not have an influence over a USBmodem communication and can be used for testing the modem.
Connect to Internet via USB modem only (recommended e.g. for SCADA) Select this checkbox to set the USBmodem connection as preferred Internet connection. This checkbox is not selected by default.
This function is only recommended, when Ethernet port is used and USB-modem connections are preferred forthe Internet connection, e.g., in SCADA applications or connecting a camera to the Ethernet port.
By choosing a LAN switch you can supply your router or modem, e.g., BGAN satellite modem. For further detailsabout BGAN modems refer to Section 7.9.7.
7.7.1 Configuring a Static IP address in a LAN
In order to configure a static IP address in a LAN, go to the Communication → LAN menu and select Static IP. Enterthe details for IP address, DNS server, Gateway and Subnet mask.
If the data logger has to be available from other subnets, e.g., if the SCADA Master is located in another networksegment, it is possible to add additional subnets. The previously configured gateway will also be used for this subnets.A list of IP numbers and subnet prefixes can be entered in Additional subnets field. Use a semicolon (;) to separatethe IP addresses, e.g., 192.168.13.0/24;192.168.14.0/24
Screenshot of the Configuration of static IP address
Figure 7.27: Configuring a Static IP Address in a LAN
NoteIf you are working with a SIM card with static IP address, it is not necessary to change the LAN settings.Refer to Section 7.9.3.
7.8 Configuring W-LAN
For local wireless access to the data logger, you can connect a W-LAN (WiFi) USB stick to Meteo-40. Meteo-40 willcreate a wireless access point (hotspot) and you can connect to this network and access the data logger web interface.
Before using the W-LAN function, Meteo-40 has to be configured. Go to the Communication → WLAN menu and selectthe checkbox Activate W-LAN. According to the configured IP address and Netmask, the available IP addresses rangeis shown.
ImportantNote down or copy the assigned IP address, as you need this IP address to access the Meteo-40 webinterface via W-LAN!
Data loggers produced after 2017-05-12 have a default passphrase. The original WLAN passphrase is enclosed inthe data logger’s delivery. The passphrases are unique for each Meteo-40. If you prefeer to change this, you mustenter a Passphrase consisting of at least eight characters. Click on Save to finish your configuration.
114 © 2011 — 2021 Ammonit Measurement GmbH

Data Logger Meteo-40 Plus User’s Manual 115 / 246
File Edit View Go Bookmarks Tabs Help
Back https://d110017.local/communication/wlan/
Help Logout(Admin on D110017)
Activate W-LAN
IP address192.168.40.1
Netmask255.255.255.0
Network192.168.40.0
First address192.168.40.2
Last address192.168.40.255
Passphrase (at least eight characters)Show password
Save
Recording: On Switch off
Configuration: Saved Save
Connection: Ethernet,Tunnel
Remaining: ∞
Wireless LAN
SystemInformationAdministrationUpgradeDisplayWeb CameraSwitchesSystem Log
MeasurementSensorsChannelsEvaluation
DataLiveStatisticsSource
CommunicationScheduleE-MailOnlineFTP/SCPSCADALANWLANModem
中文(简) English Español Português Français Deutsch Türkçe © 2011-2012 Ammonit Measurement GmbHwww.ammonit.com
passphrase for Meteo-40 W-LAN
activate W-LAN
IP address for W-LAN access
at least 8 characters
Figure 7.28: Configuring W-LAN Parameters
After successfully configuring the Meteo-40, the new wireless access point must appear among the available wirelessnetworks at your computer. The new W-LAN name is the serial number of the data logger (Dnnnnnn). Select theW-LAN and enter the Passphrase.
Open your browser and enter the configured IP address (see Figure 7.28).
NoteIf you are already connected to a W-LAN, a second W-LAN connection could cause problems.
7.9 Configuring the Modem
Meteo-40 can be connected to the Internet via modem to perform scheduled actions. UMTS/GSM/GPRS modems,or BGAN satellite modems can be configured. UMTS/GSM/GPRS modems are configured via the Meteo-40 webinterface in the Communication → Modem menu.
NoteDepending on the SIM card used in the modem, a different APN (Access Point Name) has to be entered forproper communication. If you use a SIM card with dynamic IP address, you can easily configure the modemvia our provider helper, see Section 7.9.1. If you use a SIM card with static IP address, an individual APNmight be necessary. Ask your provider for the correct APN. See also Section 7.9.3.
In order to configure a BGAN satellite modem, refer to Section 7.9.7.
ImportantWe recommend configuring the modem in the web interface before connecting the modem to the datalogger.
TipIf your SIM card gets lock for some reason, e.g., entering a wrong PIN code, remember the PUK code tocreate a new SIM card PIN code via the Meteo-40 web interface. See also Section 7.9.5.
© 2011 — 2021 Ammonit Measurement GmbH 115

On the upper part of the configuration page, the properties of the connected modem are displayed, e.g., signal strength,operator, IP address and supported bands. If there is no modem connected, the fields are empty.
State Reason Signal Operator IPAddress Product RX/TX Bands
Telephonenumber
*99#
APN
Username
Password
Modemonline,wheneverCECSison(recommended)
Modemswitch(typicallyS1)
S1
PIN
Save
NewPIN
PUK(forchangingthePIN)
SavenewPIN
ShortMessageService
Useproviderhelper
SMSconfiguration
Figure 7.29: Modem Configuration
In the upper part of the screen, the current modem and connection properties are displayed:
State Connection status
Reason Reason of connection failure
Signal Signal strength
Operator Mobile network operator
IP Address IP address of modem
Product Product details
RX/TX Received/transmitted bytes
Bands Radio bands supported by the modem
Use the Provider Helper (see Section 7.9.1) to complete the required information or enter the details manually:
116 © 2011 — 2021 Ammonit Measurement GmbH

Data Logger Meteo-40 Plus User’s Manual 117 / 246
Number: Depending on your provider, the phone number of the GPRS/ UMTS or satellite service has to be entered,e.g., *99#.
If you are using point-to-point protocol ( PPP, TCP/IP connection without GPRS or UMTS), enter the phonenumber in the relevant field. In this case, the APN is not important, but username and password probably are,depending on your provider.
In case of doubt contact your provider.
APN (Access Point Name): Enter the APN of the GPRS/ UMTS network, which can be requested from the provideror can be found in the Internet. CDMA does not require an APN.
Use the Provider helper to set APN and provider details automatically. Check the details with your provider.See Section 7.9.1.
ImportantIf you are using a SIM card with static IP address, the APN is different from the one offered in theProvider helper. Ask your provider for the exact APN. See also Section 7.9.3.
Username: Enter the username for the APN, if applicable.
The username will automatically be set by selecting the APN via the Provider helper.
Password: Enter the password for the chosen APN.
Password is automatically set after selecting the APN via Provider helper.
Modem online, whenever CECS is on The checkbox is selected by default. Thus the modem establishes an onlineconnection as soon as CECS is switched on (automatically or manually). See also Section 7.9.4.
If the checkbox is deselected, the modem only turns on according to the defined actions in the schedule (seeSection 7.2).
NoteThe default setting with activated checkbox Modem online, whenever CECS is on can increase powerconsumption - depending on modem type and location of the next transmitting mast.
TipBy deactivating the checkbox Modem online, whenever CECS is on, connection costs can be saved.The modem will only be switched on according to the scheduled actions. A running CECS systemfor maintenance purposes does not switch the modem.
Modem switch: A switch can be selected for automatic control of modem power supply at the Modem switch combobox (see Section 4.6). An external relai will be controlled by the switch (see also Figure 13.1 for electricalconnection plans). The modem will be power cycled as needed to prevent possible modem hangups.
ImportantIf the modem is connected via relay to the data logger, a switch must be configured. Without selectinga switch for the modem, it will not be power cycled on data logger restart, e.g. after installing anupgrade or at the end of an action requiring communication. The assigned switch has to be savedto the data logger configuration. We highly recommend the usage of a modem switch, the modemmay otherwise misbehave.In Meteo-40 firmware version higher than 1.0 Rev.13915 switch S1 is set by default for the modem.If a different switch is used to control the modem relai, it must be accordingly selected. If the switchis not used for the modem, it can be deselected.
NoteThe switch configured for the modem supply is not available for sensor configuration.
© 2011 — 2021 Ammonit Measurement GmbH 117

ImportantIf you use a BGAN satellite modem, a switch for the LAN connection has to be assigned in theCommunication → LAN menu (see also Section 7.9.7).
PIN: Enter the PIN code of the used SIM card.
New PIN: This field is used, if you like or have to change the PIN. To use it, you need also to enter the PUK below.
PUK The PUK PIN Unlock Key (or Personal Unblocking Code, PUC) is used to activate the new PIN above.
SMS Click here to configure short message functions. See Section 7.9.2.
After connecting a modem, Meteo-40 shows certain modem properties in its display in the Communication → Devices→ Modem menu. Use the right keyboard button to navigate to the modem properties. Additionally, you can see theproperties such as state, signal strength and bands in the table (see Figure 7.29) displayed in the web interface in theCommunication → Modem menu.
Apply the configuration by clicking on Save. We recommend testing the modem connection. Therefore, activate thecheckbox Modem online, whenever CECS is on. The state of the modem should change to Active, when the modemhas been configured successfully.
Close the modem connection by deactivating the Modem online, whenever CECS is on mode. If no action is running,the modem connection is closed after 20 minutes from the last user interaction.
The connection will instantly be closed, when CECS is shut down in the System → Administration menu or when themodem is manually disconnected from Meteo-40.
ImportantIf you close the modem connection while accessing the data logger over the modem, you will instantly losethe communication with the data logger and you will not be able to access it until the next scheduled onlineaction ( Communication → Schedule).
Resetting the SIM PIN over the Meteo-40 web interface is only possible, when the SIM card has been locked afterusing a wrong PIN. SIM PUK and new PIN are required to unlock the SIM card.
7.9.1 Using the Provider Helper
In order to support users configuring modem settings, Meteo-40 offers a provider wizard, which can be started byclicking on Use provider helper. After choosing continent and country, the wizard shows available providers andAPNs. Select the relevant APN and click on Finish to set APN, username and password in the modem configuration.
NoteThe Provider helper is designed for SIM cards with dynamic IP address. For SIM cards with static IPaddress, refer to your provider to get the details for the modem configuration. See also Section 7.9.3.
The Provider helper does not fill in the number field. Enter number and PIN code manually to finish the modemconfiguration.
118 © 2011 — 2021 Ammonit Measurement GmbH

Data Logger Meteo-40 Plus User’s Manual 119 / 246
Continent
Europe
Country
Germany
Provider
O2
Accesspointname/CDMAaccess
internet(o2MMS)
Finish
Figure 7.30: Meteo-40 Provider Helper
7.9.2 Short Message Service
In order to configure the Short Message Service (SMS), go to the Communication → Modem menu and select SMS.
ImportantThe Short Message Service on Meteo-40 data loggers can only be used in connection with a PHS8-Pmodem. Other modems offered by Ammonit do not support this feature.
Enableshortmessageservice
Receivernumber
SMSC
SMSpassword
Showpassword
Saveandsendtestmessage
Save
Figure 7.31: Settings for Short Message Service
The parameters are:
Enable short message service Tick the checkbox to enable the SMS function of Meteo-40.
Receiver number This number is currently only used for sending test messages, i.e. one should enter the telephonenumber of a mobile phone. The number is not used for other SMS functions of Meteo-40.
SMSC The SMSC(Short message service center) has to be configured for some mobile telephony providers andSIMs, for others it is not necessary. In case of doubt, ask your mobile telephony provider.
SMS password Enter a password to use the SMS function. Without password the service is not possible. Use atleast eight characters for the password (numbers and letters are allowed).
© 2011 — 2021 Ammonit Measurement GmbH 119

7.9.2.1 Sending a Short Message
If the SMS feature is activated and a password has been entered, a message can be sent to the telephone numberlinked with the SIM in the modem. The content must be password command where password is the configured SMSpassword and command is an SMS command. Be careful typing the password respecting upper and lower cases.
Command Description
info or just i, like information
Meteo-40 replys to the short message with itsserial number, software version, internal voltage,internal current, and internal temperature in thatmoment, and the current recording pointer, aswell as state of switches, modem, and Ethernet.
online or just o, like online Meteo-40 tries to get online immediately andreplys the same details as information.
s N + or s N -, like switch N on/off ( Ncorresponds to the switch number)
Meteo-40 turns on or off the specified switchand replys the same details as information. E.g.:s1+ to switch on S1s2- to switch off S2.
Table 7.4: Short Message Commands
NoteIf you are unsure about the telephone number of the SIM or whether SMS sending works, try the Save andsend test message function.
7.9.3 Working with Static IP SIM cards
If a SIM card with static IP address is used, refer to the configuration details given by your provider to complete thefields in the Communication → Modem menu. The APN for SIM cards with static IP address is different than for SIMcards with dynamic IP address. The Provider helper is designed for SIM cards with dynamic IP address.
7.9.4 Two Ways to Establish an Online Connection via Modem
NoteFor testing the USB modem communication you can use a link-local connection over USB or LAN simul-taeously. This connection will not have an influence over the usb modem communication.
According to the actions scheduled in the Communication → Schedule menu, Meteo-40 has to establish an onlineconnection. To do so, CECS of Meteo-40 has to be switched on (see also Section 1.4). Meteo-40 offers two possibilitiesto set up or control the online connection via modem using the checkbox Modem online, whenever CECS is on:
Modem is online to perform a scheduled action (checkbox inactive) An online connection is established, whenit is needed for an action, i.e., sending emails, uploading files or remote access according to the schedule (seealso Section 7.2).
Modem is online, when CECS is running - independent of scheduled actions (checkbox is active; default) Anonline connection via modem is established as soon as CECS(see also Section 1.4) of Meteo-40 is activated, ei-ther manually or according to the schedule in the Communication → Schedule menu. The connection is closed,when CECS is switched off.By default the Modem online, whenever CECS is on checkbox is activated and the modem always goes online,when CECS is running.
120 © 2011 — 2021 Ammonit Measurement GmbH

Data Logger Meteo-40 Plus User’s Manual 121 / 246
ImportantThe default setting with activated checkbox can increase power consumption - depending on modemtype and location of next transmitting mast.
We recommended deactivating this option, if the CECS always active mode (see Section 4.2) is selected. Withactivated CECS always active mode, the modem will stay permanently online, despite the scheduled onlineactions.
The mode is independent from the LAN online mode.
7.9.5 Reset PIN Code of Locked SIM Card
If a wrong PIN code has been entered and the SIM card has been locked, use its PUK code to create a new PIN code.On the bottom of the modem configuration page you can find the appropriate fields (see Figure 7.29). Click on Saveto apply the new PIN code, which will automatically be copied in the PIN code field for the modem configuration.
NoteSometimes, the modem will report that the SIM card is locked but the actual issue is connectivity. Whentesting indoors, it can help to attach an antenna and place it outside or near a window.
7.9.6 Connecting a GSM/GPRS Modem to Meteo-40
We recommend testing the modem connection before final installation in the field.
ImportantIn order to avoid PIN conflicts, we recommend configuring the modem before the modem is connected toMeteo-40.
Before connecting the modem to Meteo-40 insert the SIM card into the modem. Afterwards the modem can be providedwith power and connected to the data logger. If the modem has been successfully recognized, Meteo-40 shows theconnection in its display Communication → Devices → Modem.
7.9.6.1 Information on Modem Sierra Wireless Airline Fastback Extend EDGE FXT009
If you are using the modem Sierra Wireless AirLine Fastback Extend EDGE FXT009, slide the SIM card into themodem as shown in Figure 7.32.
ImportantIt is very important to lock the SIM card slot after inserting the SIM card into the modem. If the SIM card isnot properly placed, connection problems may occur.
© 2011 — 2021 Ammonit Measurement GmbH 121

Figure 7.32: Inserting SIM Card into modem Fastback Extend EDGE FXT009
To customize the frequency bands of the modem, connect the modem directly to your computer via USB. If you areusing a Windows™ PC and the modem is not displayed in the Device Manager under Modem, you require a driver file,which can be downloaded from the Sierra Wireless (http://www.sierrawireless.com/) website. On Linux™PCs, in general no driver file needs to be installed.
After connecting the modem to your PC, go to the Device Manager (see Figure 7.33) and open the properties of themodem by double-clicking on the modem.
connected modem
Figure 7.33: Device Manager
Go to the Modem tab (see Figure 7.34) to get the name of the COM Port, to which the modem is connected, e.g.,COM5. Change the Maximum Port Speed to 57600 baud rate. Save the changes.
122 © 2011 — 2021 Ammonit Measurement GmbH

Data Logger Meteo-40 Plus User’s Manual 123 / 246
COM port
change baudrate
Figure 7.34: Modem Properties
To switch from one supported band to another, you can configure your modem with the help of AT commands.
AT+WMBS=5 (to switch to 850/1900 MHz)AT+WMBS=4 (to switch to 900/1800 MHz)AT+WMBS=7 (to switch to 850/900/1800/1900 MHz)
In order to customize the frequency bands, a standard terminal program like PuTTY (http://www.putty.org/)can be used. Open the program and enter the port number as Serial line and 57600 for the Speed as shown inFigure 7.35. Open the command window (see Figure 7.36) of the terminal program. In order to test the connection,enter ” at” and press Enter. If OK is shown, the connection is fine and you can change the frequency bands with theabove mentioned AT commands.
WarningMake sure to download PuTTY only from its official website or other trusted sources. Malicious versionshave been released, that might copy private information to unauthorized parties.
enter COM port and speed
Figure 7.35: PuTTY Configuration
© 2011 — 2021 Ammonit Measurement GmbH 123

Figure 7.36: PuTTY Command Window
ImportantRestart the modem after modification.
7.9.7 Connecting a BGAN Satellite Modem to Meteo-40
7.9.7.1 Pointing the terminal to the satelite
It is recommended to test the conectivity outdoors because pointing through a window introduces a slight drop in signalstrength. Most units have audible and visual pointing indicators. The terminal first needs to acquire GPS, which maytake a long time. Some units will then diplay pointing information to help with the orientation of the antena. Line-of-sightto the satellite is required for connectivity.
7.9.7.2 Configuring Meteo-40 with BGAN Satellite Modem
ImportantBGAN modems are not configured using the modem page, but in the LAN page, as shown in Figure 7.26.
BGAN satellite modems are connected via Ethernet to Meteo-40. If you are working with Meteo-40 Revision C withRS232 slot, you have to use an USB Ethernet adapter to connect the satellite modem to your data logger.
Configure DHCP to automatically assign an IP address to data logger Ethernet port and modem. Both Meteo-40 andmodem must be configured to use DHCP.
Use the software provided by its manufacturer to configure the BGAN satellite modem.
In order to supply the modem, select a LAN switch from the dropdown list in the Communication → LAN menu. Henceprior to the scheduled actions, the modem can be supplied via the Meteo-40 switch (see Section 7.7). For testing, thecheckbox LAN online, whenever CECS is on may be switched on. So the modem goes online as soon as CECS hasbeen switched on. After testing, this setting should be switched off to prevent excessive traffic.
For testing the satellite modem, go to the Communication → Schedule menu and press Run now for the onlineaction. Go to the Communication → Online menu and copy the Ammonit tunnel address of the data logger, e.g.,https://dnnnnnn.connect.ammonit.com. Disconnect the data logger from your PC and / or LAN. After enter-ing the copied address in your browser, you should be able to log into the Meteo-40 web interface.
124 © 2011 — 2021 Ammonit Measurement GmbH

Data Logger Meteo-40 Plus User’s Manual 125 / 246
7.9.7.3 Recommended Settings for Satellite Connections
Help Logout
AdminonD001234
URL:https://D151234.local/communication/lan/
Recording: Off Switchon
Configuration: Saved Save
Connection: Ethernet
Remaining: ∞
Date/time: 2020-10-0615:46:46UTC
LAN
Pleaseturnoff'CECSisalwaysactive'
PleaseactivateAmmonitORwithavalidprojectkey
PleaseuseAmmonitORfordatatransfer
PleaseconfigureaAmmonitConnectaccesscode
PleasepreventimplicitAmmonitConnectactivation
Pleaseconfigurenotmorethanthreeonlinetimesofmax.onehourcombined
PleaseturnoffLANonline,wheneverCECSison
PleasedonotuseEMailfordatatransfer
PleaseusedailyCSVfileswith10minutestatisticsinterval
Interface State IPAddresses
eth0 activated 172.17.0.4
LANonline,wheneverCECSison
IPaddressallocationmethod
DHCP
ConnecttointernetviaUSBmodemonly(recommendede.g.forSCADAandEthernetcamera)
LANswitch(typicallyS1)
None
IPaddress
192.168.40.40
DNSserver
192.168.40.1
Gateway
192.168.40.1
Subnetmask
255.255.255.0
Additionalsubnets
Save
CheckoptimalBGANsettings
Figure 7.37: Check BGAN optimal settings
Use the Check optimal BGAN settings button to verify if all recommended settings are propperly configured.
1. We strongly recommend sending data only to AmmonitOR, but not by email. The data transfer to AmmonitORconsumes less bandwidth than email (see Section 7.2 and Section 7.4).
2. Use only few tunnel connections, e.g. twice or thrice a week for twenty minutes (see Section 7.2).
3. Use a tunnel access code to prevent unauthorized access to the data loggers login page (see Figure 7.3) whichcan generate data traffic.
4. Only for software versions before 1.7.7: To reduce data traffic when using the web user interface, you maywant to reduce user interface interactions (see Figure 7.3).
5. Prevent implicit tunnel activation, only recommended for satellite communication (see Figure 7.3).
6. Do not set the check on LAN online, whenever CECS is on (see Section 7.7).
7. Be sure to generate not too huge or too many CSV files by keeping the default of one file per day with 10 minutesstatistics interval (see Section 6.3). Avoid gust data files, which may get large, depending on configuration andwind conditions.
© 2011 — 2021 Ammonit Measurement GmbH 125

7.10 Troubleshooting
Some mobile service providers and also firewalls in corporate networks restrict the communication of mobile devicesto certain ports. The communication of the Meteo-40 data logger might also be affected. There are different incidents,e.g., the tunnel connection does not work, but Rx/Tx traffic is possible or the tunnel is accessible, but sending emailsdoes not work. Reasons for this are often blocked ports by the communication service provider or the firewall or brokenDNS.
7.10.1 How to perform the test for tunnel and AmmonitOR
In the web user interface, just save the online/tunnel parameters or AmmonitOR settings. In this moment the datalogger checks the connection and presents the result.
Alternatively, you can do the check from the LC display. Go to Communication( Figure 7.38). Then select CommunicationCheck( Figure 7.39). This will take some time. After some seconds, you can see the results ( Figure 7.40).
SystemStatusChannels
> Communication
Figure 7.38: Select ”Communication”
DevicesActivation
> Check ConnectionSchedule
Figure 7.39: Select ”Check Connection”
Tunnel accessiblePort 4040 openAmmonitOR accessiblePort 4041 open
Figure 7.40: View results of check
If one of the servers is not accessible or a port is blocked, please contact your network administrator or mobile serviceprovider.
126 © 2011 — 2021 Ammonit Measurement GmbH

Data Logger Meteo-40 Plus User’s Manual 127 / 246
Chapter 8
SCADA
8.1 Configuring Meteo-40 for SCADA
Meteo-40 SCADA Server can be used to monitor performance and production of wind farms by providing reliablemeteorological data. Meteo-40 data loggers support the standard protocols Modbus TCP/IP over Ethernet as wellas Modbus RTU over RS485 (Slave).
SCADA parameters can be configured in the Communication → SCADA menu. In order to activate SCADA for Meteo-40, select the checkbox Activate SCADA server.
ActivateSCADAserver
SCADAprotocol
ModbusRTU
TCPport
502
Allowglobalaccess
AllowedclientIPaddress
Modbusunitid
3
RS-485slavespeed
38400
RS-485slavedataformat
8N1
Save
EditModbusregistermap
Figure 8.1: Configuring SCADA Parameters
Depending on the SCADA system in which Meteo-40 is integrated, a protocol for data retrieval has to be chosen:
Modbus TCP over Ethernet If you use Modbus TCP, a TCP port has to be entered. The default value is 502. IfAllow global access is selected, the scada server will be accessible over every available TCP connection (e.g.
© 2011 — 2021 Ammonit Measurement GmbH 127

Ethernet, Modem, USB-B), otherwise it will only be available over the Ethernet connection. By entering an IPaddress in field Allowed client IP address, the access to the data can be restricted to a single IP. Only the clientwith the specified IP address can request data from Meteo-40. If the field is left empty or filled with value 0.0.0.0,any client is allowed to access the data. You can also introduce a list of IP addresses separated by a semicolon(;), e.g., 192.168.13.5;192.168.14.6
NoteIn most SCADA systems, the Ethernet interface should be configured properly with a static IP ad-dress. Refer to Section 7.7 for further details.
ImportantIf a USB modem is connected to Meteo-40 and Ethernet is used for SCADA, it is necessary to selectConnect to Internet via USB modem only in the Communication → LAN menu.
In order to connect Meteo-40 to a fiber optic, an industrial media converter 10/100BaseT to 100BaseFX (-40–75 °C) can be used.
Make sure that your Modbus TCP client is addressing the Meteo-40 SCADA server with the proper Modbus unitID configured here. The default value is 1.
Modbus TCP uses the unit identificator for routing purposes in case of addressing a device on a MODBUSor MODBUS+ serial line subnetwork. The Modbus TCP server is still sensitive for this parameter. For furtherdetails see MODBUS Messaging on TCP/IP Implementation Guide V1.0b recommendations at The ModbusOrganization (http://www.modbus.org/).
Modbus RTU over RS485 S (slave) If you are using the Modbus RTU protocol, Modbus Unit ID and RS485 serialsettings (speed and data format) have to be selected.
NoteSome SCADA clients require a half-duplex (2-wire) RS485 interface. In order to convert the 4-wireRS485 signal delivered by Meteo-40 Revision C data loggers into a 2-wire (half duplex) signal, anaccessory module has to be implemented. Refer to the separate data sheet provided by Ammonit.For further details contact Ammonit.The production of Meteo-40 Revision C stopped in October 2012.The accessory module is not necessary for Meteo-40 Revision D data loggers (with Ethernet port).
If you are using more than one Meteo-40 data logger in your SCADA system, each data logger requires a uniqueModbus Unit ID and all data loggers have to use the same RS485 serial settings (speed and data format).
Save your settings. Otherwise, the configuration is reset to the previous values after moving to another page.
8.1.1 CECS power mode
ImportantTo use Meteo-40 SCADA server, the CECS must remain permanently on ( CECS always active mode)Figure 8.2( System → Administration. This mode is automatically set when the SCADA server is activatedin the Communication → SCADA. You can only switch it off again after deactivating the SCADA server.
The CECS always active mode can be configured manually via the web interface (see Section 4.2) or over the display( Status → CECS, see Section 9.5) of the data logger.
If CECS always active mode is selected, it will be displayed in the status box of the web interface with the infinitysymbol (∞) as well as on the Meteo-40 display with the word Always.
128 © 2011 — 2021 Ammonit Measurement GmbH

Data Logger Meteo-40 Plus User’s Manual 129 / 246
CECSPowerMode
RestartCECS
ShutdownCECS
CECSisalwaysactive(onlyrecommendedforSCADAandSwitchManager)
AutomaticCECSreboot('Never'onlyrecommendedforSCADA)
Weekly
PowerCECSondigitalstatussignal
None
SaveCECSPowerMode
Figure 8.2: Configuring CECS always active mode for SCADA
If power supply is disconnected and the data logger shuts down while CECS was running in the CECS always activemode, it will restart automatically as soon as power is available again.
NoteWhen CECS is configured to be permanently active, you cannot manually shut down the system by pressingthe middle button on the data logger.
ImportantCECS is a fully embedded Linux™ computer (see also Section 1.4). Be aware that the power consumptionof Meteo-40 is higher, when CECS is switched on.
8.1.2 Statistics selection
It is possible to request both live data and statistics over SCADA (see available statistics). The time interval over whichthe SCADA statistics are calcuated defaults to 10 minutes and can be modified in menu Data → Statistics menu (seealso Section 6.3.1).
ImportantThe same statistics interval is used for SCADA, the Switch manager and the data snapshots.
Summary statistic is normally used to calculate the summary over a complete day. It is available for precipitation,precipitation intensity, status and sun status evaluations. The SCADA summary interval can also be changed in Data→ Statistics menu.
The Modbus register map in the Meteo-40 web interface only shows the selected statistics from the Data → Statisticsmenu. Go to the Data → Statistics menu and select the required data. See also Section 6.3.1.
© 2011 — 2021 Ammonit Measurement GmbH 129

8.2 Meteo-40 and Modbus
The configurable Modbus Register Map allows Meteo-40 to operate in most existing SCADA systems. The user mustdetermine which measurement values should be available for the SCADA Master and configure a unique registernumber for each measurement (PDU addressing, first reference is 0). For more information about the supportedfunction codes see the public function code definition from the Modbus application protocol specification The ModbusOrganization (http://www.modbus.org/).
All registers in range 0 to 65535 not selected to hold a measurement will contain the hexadecimal value FFFFh. If theregister is selected but no valid measurement is present, the invalid value corresponding to the configured data typeis written (see Table 8.1).
Data Type Invalid Valueshort (16-bit integer) 7FFFhushort (16-bit unsigned integer) FFFFhlong (32-bit integer) 7FFFFFFFhulong (32-bit unsigned integer) FFFFFFFFhIEEE 754 (32-bit single precision binary floatingpoint)
7FC00000h
Unix Time 00000000h
Table 8.1: Modbus Invalid values
130 © 2011 — 2021 Ammonit Measurement GmbH

Data Logger Meteo-40 Plus User’s Manual 131 / 246
InputRegisters
Measurements Live Avg Max Min SDv Sum Med Val Summary Type Factor
Anemometer,
WindSpeed
(m/s)2 102 104 106 108 float(IEEE75432-bit) 1
WindVane,
WindDirection
(°)4 112 118 float(IEEE75432-bit) 1
Hygro/Thermo,
Humidity(%)6 122 124 126 128 float(IEEE75432-bit) 1
Hygro/Thermo,
Temperature
(°C)8 132 134 136 138 float(IEEE75432-bit) 1
A1(V) float(IEEE75432-bit) 1
A2(V) float(IEEE75432-bit) 1
A3(V) float(IEEE75432-bit) 1
A4(V) float(IEEE75432-bit) 1
C1(I) float(IEEE75432-bit) 1
Int.Voltage
(V)float(IEEE75432-bit) 1
Int.Current
(mA)float(IEEE75432-bit) 1
Int.
Temperature
(°C)float(IEEE75432-bit) 1
Switches ushort(16-bit)
Year Month Day Hour Minute Second
Date/TimeLive ushort(16-bit)
Date/Time
Statistics ushort(16-bit)
Date/Time
Summary ushort(16-bit)
Live Start End
UnixTime 0 100 ulong(32-bit)
UnixTime
Summary ulong(32-bit)
ModbusEndianness
Byteendianness
Big(mostsignificantfirst)
Wordendianness
Big(mostsignificantfirst)
Save
ClearTable
DownloadTableasCSV
BacktoSCADA
Figure 8.3: SCADA Modbus Register Table
Column Measurements Name of the evaluation, channel, or measurand. For every measurand either two or fourregisters are used, depending on the data type selected (see Table 8.2).Name of date, time, and switches fields. Every single value needs one register, with the exception of the UNIXtime (seconds since 1970-01-01 00:00:00 GMT), which needs two registers.
Columns statistics ( Live, Avg, ... Med) In these fields, the modbus register number where each measurementvalue will be contained must be introduced.
Type For each evaluation or channel, a data type can be selected, e.g., float, (see Table 8.2).
Factor For each evaluation or channel, a scale factor can be selected, e.g., float, (see Table 8.2).
Live data Describes instantly measured data of the active channels ( A n, AC n, C n, D n, M n, P n) and switches ( S n)as well as instantly evaluated data (Top Anemometer Wind Speed ( m/s), Precipitation ( mm), etc.). All live datavalues, including Live Date/Time and Live Unix Time, are written in the Modbus store with an atomic operation.This guarantees that the time-stamps, in case configured, match the measurement values.
Aggregated / statistical data Statistics can be applied to channels and to evaluated data. All statistics data values,including Statistics Date/Time and Start-End Unix Time, are written in the Modbus store with an atomic operation.This guarantees that the time-stamps, in case configured, match the measurement valuesThe SCADA interval for statistics calculation (’Statistics interval for SCADA, Switch manager and snapshots’)defaults to 10 minutes and can be configured in the Data → Statistics menu. This interval is applied for standard
© 2011 — 2021 Ammonit Measurement GmbH 131

statistics: average (Avg), maximum (Max), minimum (Min), standard deviation (SDv), sum (Sum, only for statussignals), median (Med) and value (Val). For the Summary statistic, ’SCADA summary interval’ is applied, whichdefaults to daily. The summary statistic is calculated as a simple moving statistic at the end of every SCADAinterval for statistics calculation (i.e. 10 minutes with the default configuration).
ImportantOnly measurements selected in menu Data → Statistics(see Figure 6.4) are available here for re-trieval.
In order to configure the Modbus slave address of the data logger for serial subnetworks, go to the Communication→ SCADA menu. For further details about Modbus see: www.modbus.org (http://www.modbus.org).
Option Description
MeasurementsData Type andScale Factor
Date/time values, i.e., year, month, day, hour, minute, and second, as well asstate of the switches are represented as unsigned short values, stored in one16-bit Modbus register each. Data type and scale factor do not apply to thesevalues.For the measurement value representation, data type and scale factor haveto be selected. Data types short, ushort, long and ulong represent ameasurement value as an integer and store it in one or respectively twosubsequent 16-bit registers. To achieve higher resolution on therepresentation or a wider range of values represented with a lower resolution,the original measured value can be divided by a scale factor before storing itinto the registers as an integer. The default data type is IEEE 754 standard inbinary32 format (32-bit single precision binary floating point), being valuesstored in two subsequent 16-bit Modbus registers. In this last case, scalefactor 1 is recommended. See also Equation 8.1.
ModbusEndianness forSCADA Server
According to the Modbus Application Protocol Specification V1.1.b, Modbusis a ’big-Endian’ protocol: ”Modbus uses a ’big-Endian’ representation foraddresses and data items. If a numerical quantity larger than a single byte istransmitted, the most significant byte will be sent first.” Meteo-40 endiannesscan be configured by the user via web interface and is set by default to’big-endian’ byte order and ’big-endian’ registers order representation (highbyte first, high word first). For example for value -4.395978e-11, therepresentation would be: Table 8.3
Modbus registeraddressinterpretation
For historical reasons, some devices use a starting offset to refer to Modbusregister addresses, depending on the function code used to read the data.That means, a Modbus client may represent for example Modbus inputregister 100 with address 30101 and Modbus holding register 100 withaddress 40101.Meteo-40 does not use this representation. Only the register address, uniquefor each measurement that will be retrieved and in range 0 to 65535, must beintroduced at the Modbus register table. For the previous example, only 100should be introduced at the corresponding text box of the register table.
Modbus DeviceIdentification
Some additional information relative to the physical and functional descriptonof the device is available with function code 43 (see Table 8.4).
Table 8.2: Optional Available Information and configuration
ValueSCADA =ValueOriginal
Scalefactor
Equation 8.1: Scale Factor
132 © 2011 — 2021 Ammonit Measurement GmbH

Data Logger Meteo-40 Plus User’s Manual 133 / 246
Representation Byte Endianness Word EndiannessAE41 5650 Big (high byte first) Big (high word first)5650 AE41 Big (high byte first) Little (low word first)41AE 5056 Little (low byte first) Big (high word first)5056 41AE Little (low byte first) Little (low word first)
Table 8.3: Modbus Endianness for SCADA Server
Object Id Description Type
0x00VendorName: ’AmmonitMeasurement GmbH’
ASCII String
0x01ProductCode: Data loggerserial number (e.g. ’D151234’)
ASCII String
0x03VendorURL:’http://ammonit.com/’
ASCII String
0x04ProductName: Data loggername (see Section 4.2)
ASCII String
0x05ModelName: Data logger type(e.g. ’Meteo-40L’)
ASCII String
Table 8.4: Modbus Device Identification
8.2.1 Input Registers
Input registers contain the measurement values configured by the user. Meteo-40 SCADA server instantly writesmeasured values in the Live registers and the calculated statistics after each interval in the aggregated data registers.These data can be read with modbus function code 04. Register addresses must be between 0 and 65535. Thefollowing values can be accessed in modbus registers, if so configured in the table:
Live and statistical data of all active channelsData logger internal values ( Int. Voltage (V), Int. Current (mA) and Int. Temperature (°C))Switches stateUnix Time (for live data and start/end of current statistics interval)Live data time stamp ( Live Date/Time)Last second of the evaluated interval for statistical data ( Statistics Date/Time)
ImportantOnly measurements selected in menu Data → Statistics (see Figure 6.4) are available here for retrieval.
8.2.2 Holding Registers
Holding registers can be both read or written. If Write measurements to holding registers is selected, themeasurement values from the Input registers table will be also written in the same register numbers from the Holdingregisters table. They can be read with function code 03.
NoteTo prevent holding registers from being overwritten by the measurements, the holding and input registersranges cannot overlap if Write measurements to holding registers is selected. This means,you cannot configure a holding register between two input registers. It is recommended to use a completedifferent range e.g. 0 to 999 for the input registers and 1000 to 2000 for the holding registers.
© 2011 — 2021 Ammonit Measurement GmbH 133

Holding registers can be written by the SCADA client in order to achieve any of the following implemented functional-ities.
Date/Time synchronization To synchronise data logger date and time over Modbus, configure the start holding reg-ister number for the date/time value in the Modbus Register Map (Set Date/Time). By means of a single modbusframe and function code 16 (write multiple registers), year, month, day, hour, minute and second must be writtenin six subsequent registers, starting at the previously configured register number (16-bit unsigned short values).
A successful syncronization will be logged in the logbook
ImportantIt is necessary to allow date and time synchronization over SCADA in Section 4.2.
Set switches state If a register number is configured in Set switches state, it is possible to set the current state ofthe switches. You can use modbus function code 6 (write single register) to control the state of all 8 switcheswith one telegram or function code 5 (write single coil) to set the state of only one switch.
In the first case, you must write write into the configured register the integer representing the state of all switches.Each bit determines the state of one switch:”0” for open, ”1” for closed switch.
In the second case the configured register is the first address and corresponds to S1. To change the state ofswitch ’n’ (Sn) you must write the coil address
Switchnumber S8 S7 S6 S5 S4 S3 S2 S1
BitPosition
7 6 5 4 3 2 1 0
Table 8.5: Set switches state
8.3 Cascading two Meteo-40 Data Loggers using RS485
An easy way to cascade two or more Meteo-40 data loggers to get more measurement channels, is to use one Meteo-40 as RS485 SCADA master, and up to four Meteo-40 as RS485 slaves. All data loggers have to be connected as anRS485 bus.
Please be aware of the following characteristics of the RS485 cascading:
• Due to the additional communication involved, there is a delay on the cascaded channels, between 1 and 2 seconds.For most applications, where only 10 minute average data is relevant, this should not be a problem.
• The CECS of the slave or slaves must be always active, leading to a higher energy consumption.• The slave or slaves do not necessarily have a connection to the Internet. If there is no additional modem or a router,
the data loggers cannot be accessed from remote nor can receive software updates easily.• The master can only read up to 20 Modbus registers per slave in one read instruction. Instead of using four Meteo-
40 slaves, one can also configure the same Meteo-40 up to four times to read different register sets. This allowsreading up to 80 Modbus registers from one slave.
• Care has to be taken, that master and slave configuration fit exactly.
8.3.1 Configuration of the slave or slaves
The Meteo-40 slave or slaves need to be configured as a SCADA device with Modbus RTU protocol and a uniqueModbus unit identifier. Note, that if you need to share more than 20 registers with the master, Meteo-40 will need morethan one read requests. Meteo-40 can perform until 8 read requests per second, of 20 registers each. The CECSmust be always active.
134 © 2011 — 2021 Ammonit Measurement GmbH

Data Logger Meteo-40 Plus User’s Manual 135 / 246
8.3.2 Configuration of the master
At the master side, every slave has to be added as a RS485 sensor ( Other Sensor/ Modbus RTU), introducing slave’sunit identifier as RS485 address. If you need to request more than 20 registers from one slave, you must do thisconfiguring two different sensors with the same slave unit identifier. After selecting the corresponding data type, theresulting evaluations must show the same measurement value as at the slave. For each of the measurement valuesyou should configure a custom evaluation using a linear equation in order to confer it the known unit and data type(see Evaluation Helper).
© 2011 — 2021 Ammonit Measurement GmbH 135

136 © 2011 — 2021 Ammonit Measurement GmbH

Data Logger Meteo-40 Plus User’s Manual 137 / 246
Chapter 9
Using the Display
The LC display of Meteo-40 with background light is able to show 4 lines, each with 20 characters. In order to navigatethrough the menu or to perform an action, use the buttons next to the display.
Data Logger Meteo-40
① switchon/off
② submenu/action
③ scrolldown
⑤ scrollup
④ return
Figure 9.1: Use of the Meteo-40 buttons
1. Press this button for a few seconds to switch Meteo-40 ( CECS) on or off.
2. Navigate into a submenu or perform an action.
3. Scroll down in the menu list.
4. Leave the submenu, return to the previous menu.
5. Scroll up in the menu list.
NoteAfter connecting Meteo-40 to the power supply, the two lower LED lights (red and yellow) turn on for a fewseconds. When the LED lights turn off, Meteo-40 is ready and can be switched on.
9.1 Assigning Permissions to Display Users
In order to avoid that settings are accidentally modified by a display user, e.g., when measurement data is downloadedon a USB flash drive, you can assign permissions to display users. The configuration can be changed in the System→ Display menu (see also Section 4.4.1).
© 2011 — 2021 Ammonit Measurement GmbH 137

9.2 LED Lights
Meteo-40 has four LED lights next to its display. The two upper LED lights have not yet been assigned a function. Thetwo lower LED lights (red and yellow) turn on, when Meteo-40 is connected to a power supply and turn off as soon asMeteo-40 is ready to be switched on. However, the lower LED lights show:
Red (third from the top) Indicates errors in measuring operation. For details see the error list in the display System→ Errors → Error List.
Yellow (lower LED light) Indicates that RS485 sensors are connected. According to the Modbus protocol the LEDlight blinks, when a measurement is made.
9.3 Navigating through the Display Menu
The display menu of Meteo-40 includes four main menu items and several submenu items. The main menu items areSystem, Status, Channel and Communication.
In order to jump into a submenu or to perform an action, press the right button. To return to the previous menu, usethe left button. By pressing the upper or the lower button, you can navigate up and down the menu list. For furtherdetails see Figure 9.1.
9.4 Menu: System
Submenu Submenu Item Description
InformationData Logger
• Type• Serial Number (Dnnnnnn)• Channels
Version• Software version• Bootloader version
Memory
• RAM including % of memoryused
• Source Memory including %of memory used. Note, thatthe value can go beyond100%, because the memoryis organized as ring buffer.
Time and DateClock
Displays date and time, incl.time zone
Set Clock
Sets date and time onMeteo-40 according to NTPserver time and Time Zonedefined in the web interface inmenu System→ Administration
ErrorsError List Displays the error listClear List Clears the error list
Table 9.1: Menu: System
138 © 2011 — 2021 Ammonit Measurement GmbH

Data Logger Meteo-40 Plus User’s Manual 139 / 246
9.5 Menu: Status
The Status menu includes the information shown in the status box of the Meteo-40 web interface (see Section 3.2also). In order to switch recording on / off or to save the configuration, press the right navigation button next to thedisplay.
Submenu Item Description
Rem. Time
• Infty = Infinity (if CECS always active isselected)
• Remaining time in mm:ss
Recording
• On• Off (no recording, e.g., after changing the
configuration)
Configuration• Saved• Unsaved (changes have been made)
CECS
• When needed• Always (if CECS always active is
selected)
Ethernet• Online• Offline
Modem• Online• Offline
Tunnel• Active• Inactive
Jobs Number of currently running actions
Table 9.2: Menu: Status
9.6 Menu: Channels
The menu channels contains seven submenus: Evaluations, Analog Voltage, Analog Current, Counter,Digital Lines, Switches and Internal. In order to set or display the values, press the right button until therequired value appears in the display.
Submenu Property
Evaluations
Displays current values of the evaluation, e.g.,wind speed, wind direction, temperature etc.The order of evaluations is explained inSection 5.1.3.
Table 9.3: Menu: Channels/Evaluations
© 2011 — 2021 Ammonit Measurement GmbH 139

Submenu Submenu Item Property Range of Values
Analog A1 (Dependingon the data loggertype, Meteo-40 offers4, 8 or 12 analogvoltage channels)
MeasurementState On or Off
ValueDisplays the currentvalue
SettingsRange
0.1 V, 0.1–0.3 V, 1 V,10 V
Rate
• 1/8 s–30 s• 1 min–30 min• 1 h
SwitchState On or Off
ID
Select the appropriateswitch. Depending onthe data logger type,Meteo-40 offers 2, 4 or8 switches.
Time
• 1/8 s–30 s• 1 min–30 min• 1 h
Table 9.4: Menu: Channels/Analog Voltage
Submenu Submenu Item Property Range of Values
Analog AC1(Depending on thedata logger type,Meteo-40 offers none,1 or 2 analog currentinput channels.)
MeasurementState On or Off
ValueDisplays the currentvalue
SettingsRange 1 mA, 10 mA, 100 mA
Rate
• 1/8 s–30 s• 1 min–30 min• 1 h
SwitchState On or Off
ID
Select the appropriateswitch. Depending onthe data logger type,Meteo-40 offers 2, 4 or8 switches.
Time
• 1/8 s–30 s• 1 min–30 min• 1 h
Table 9.5: Menu: Channels/Analog Current
140 © 2011 — 2021 Ammonit Measurement GmbH

Data Logger Meteo-40 Plus User’s Manual 141 / 246
Submenu Submenu Item Property Range of Values
Counter C1(Depending on thedata logger type,Meteo-40 offers 4,8 or12 counters.)
MeasurementState On or Off
ValueDisplays the currentvalue.
Settings Rate
• 1 s–30 s• 1 min–30 min• 1 h
SwitchState On or Off
ID
Select the appropriateswitch. Depending onthe data logger type,Meteo-40 offers 2, 4 or8 switches.
Time
• 1/8 s–30 s• 1 min–30 min• 1 h
Table 9.6: Menu: Channels/Counter
Submenu Submenu Item Property Range of Values
Digital D1 (Dependingon the data loggertype, Meteo-40 offers2,4 or 8 digitalchannels.)
MeasurementState On or Off
ValueDisplays the currentvalue
SettingsRate
• 1/8 s–30 s• 1 min–30 min• 1 h
Type
• None• Thies10bit• Thies8bit• Status
SwitchState On or Off
ID
Select the appropriateswitch. Depending onthe data logger type,Meteo-40 offers 2, 4 or8 switches.
Time
• 1/8 s–30 s• 1 min–30 min• 1 h
ClockPinCLK 5 V
Press the right buttonto force the clock pinto 5 V for 10 seconds.
CLK 0 VPress the right buttonto force the clock pinto 0 V for 10 seconds.
Table 9.7: Menu: Channels/Digital Lines
© 2011 — 2021 Ammonit Measurement GmbH 141

Submenu Range of ValuesS1 (Displays a list of switches. Depending onthe data logger type, Meteo-40 offers 2, 4 or 8switches.
On or Off
Table 9.8: Menu: Channels/Switches
Submenu PropertyVoltage Displays the current valueCurrent Displays the current valueTemperature Displays the current value
Table 9.9: Menu: Channels/Internal
9.7 Menu: Communication
Submenu Submenu Item Property Description
Devices
ModemProduct Name (onlywhen a modem isconnected)
Quality: displays signalstrengthStatus:
• Offline• Active
Type: indicatesconnection mode, i.e.,GSMRX Bytes: displays sumof bytes receivedTX Bytes: displays sumof bytes transferred
LAN
USB
State / Interface
• State: Active• or Unavailable• Interface: usb
IP / Netmask: displays IPaddress and subnetmaskRoutes: displays routeror gateway addressMAC / Speed: displaysMAC address of the datalogger and thetransmission rate
Ethernet (networkconnection)
State / Interface
• State: Active• Interface: eth
IP / Netmask: displays IPaddress and subnetmaskDNS Servers: displaysDNS server addressesRoutes: displays routeror gateway address
142 © 2011 — 2021 Ammonit Measurement GmbH

Data Logger Meteo-40 Plus User’s Manual 143 / 246
Submenu Submenu Item Property DescriptionMAC / Speed: displaysMAC address of the datalogger and transmissionrateMethod: DHCP/ StaticIP/ Link-local(can beselected using thekeyboard)
WLAN• Restart• Active/ Inactive• IP Address
The WLAN connectioncan be restarted usingthe display.
Activation
Modem: When neededor Permanent(can beselected using thekeyboard)LAN: When needed orPermanent(can beselected using thekeyboard)WLAN: Active or Notactive
Check Connection
Checks the connectionto Tunnel andAmmonitOR servers, seeSection 7.10.1.
Schedule
Online • Online Perform the respectiveactions immediately, bypressing the right button.The configuration for theactions has to be donebeforehand. The dash (-) is visible, if the actionis not active at themoment, otherwise itshow runs or done.
AmmonitOR • AmmonitOR• AmmonitOR Test
Email • Email• Email Test
Copy • Copy• Copy Test
Generate CSV • Gen. CSV
SMS • SMS Test
© 2011 — 2021 Ammonit Measurement GmbH 143

144 © 2011 — 2021 Ammonit Measurement GmbH

Data Logger Meteo-40 Plus User’s Manual 145 / 246
Chapter 10
Sensors
Meteo-40 data loggers are designed for installation in wind and solar measurement campaigns. Thus the data loggeris compatible with all relevant sensor types. Depending on the data logger type a different number of sensors can beconnected to analog voltage, pulse/counter, digital/serial/status as well as analog current, current source and RS485channels. See also Chapter 11 and Section 1.3.
Depending on the measurement campaign different sensors are required. Find below a list of measurement instru-ments for wind measurement and solar measurement purposes as well as a list of other meteorological sensors anddifferent measurement devices.
NoteIf the sensor, you want to connect, is not listed in this manual, refer for technical details and connectionplans to the data sheets on the Ammonit website (http://www.ammonit.com) or contact our sales team(+49-30-6003188-0 or [email protected]).
10.1 Sensors for Wind Resource Assessment and Wind Farm Mon-itoring
In order to evaluate the wind conditions at a specific location, various measurements for wind resource assessmentare required. According to IEC 61400-12-1 horizontal wind speed, wind direction as well as air density have to bemeasured. Wind energy is calculated as follows:
P = 1/2ρ · A · v³
Equation 10.1: Calculation of Wind Energy [P]
(where A is the area; ρ is the air density, ρ = p / (R • T), being p the air pressure, T the air temperature and R the gasconstant; v is the wind speed)
Therefore, wind speed (v) is the most important parameter, as wind energy (P) is proportional to the cube of windspeed. Δ1% wind speed ≈ Δ3% wind energy
The following sensors are crucial for wind site assessment:
© 2011 — 2021 Ammonit Measurement GmbH 145

Sensor Description Link
Anemometer (windspeed)
• Most important parameter for windmeasurement
• Wind energy is proportional to the cube ofwind speed
• Install calibrated cup anemometers orcalibrated ultrasonic anemometers
• Heated sensors are recommended formeasurements in cold climates
NoteVertical wind speed measurementfor turbulence and wind turbine loadanalysis with 3D ultrasonic or pro-peller anemometer.
Section 10.6(Anemometers)Section 10.8(Ultrasonics)Section 10.6.2(PropellerAnemometer)
Wind vane (winddirection)
• Important parameter for wind farmmicrositing
• Ultrasonic anemometers also determine thewind direction
Section 10.7(Windvanes)Section 10.8(Ultrasonics)
Temperature / Humiditysensor
• Important parameters for air densitycalculation
• Wind energy is linear proportional to theinverse of air temperature in K
• Measurement of relative humidityrecommended at high temperatures acc. toIEC
• Combined air temperature and relativehumidity sensors available
Section 10.10
Barometric pressuresensor
• Important parameter for air densitycalculation
• Wind energy is linear proportional to airpressure
Section 10.11
Ultrasonic anemometer
• Evaluate horizontal wind speed anddirection; 3D ultrasonics measure verticalwind speed for turbulence analysis
• Recommended for measurements in coldclimates, as ultrasonic anemometers do nothave moving parts and can be fully heated
Section 10.8
Table 10.1: Sensors for Wind Measurement
10.2 Sensors for Solar Resource Assessment
Certain solar measurements are necessary to design profitable solar power plants. Refer to the Ammonit website(http://www.ammonit.com) to learn more about solar measurement systems. Depending on application (e.g., PV,CSP, CPV) and size of the solar power plant different measurements are crucial.
146 © 2011 — 2021 Ammonit Measurement GmbH

Data Logger Meteo-40 Plus User’s Manual 147 / 246
Insolation combines Direct Normal Irradiation (DNI) and Diffuse Horizontal Irradiance (DHI). Both are linked accordingto the formula for Global Horizontal Irradiation (GHI):
GHI[W/m²] = DHI[W/m²] + DNI[W/m²] · cos(θ)
Equation 10.2: Calculation of Global Horizontal Irradiation
(where θ is the solar zenith angle)
On a sunny day the insolation is 100 % GHI, 20 % DNI and 80 % DNI·cos(θ).
Sensor Description Link
Pyranometer
• Measures GHI (Global HorizontalIrradiation), if installed horizontally
• Measures GTI (Global Tilted Irradiation), ifinstalled tilted as PV panel
• Measures DHI (Diffuse HorizontalIrradiation), if shaded by a shadow ball orshadow ring (installation on sun tracker)
Section 10.12.1
Pyrheliometer
• Measures DNI (Direct Normal Irradiation)and has to be installed on a sun tracker tofollow the position of the sun on the sky
Section 10.12.3
Sunshine Durationsensor
• Indicates the sunshine status as defined byWMO (sunshine = direct irradiation exceedsthe level of 120 W/m²)
Section 10.12.4
Solar Tracker
• Capable to orient a payload towards the sun.Can be combined with different solarsensors to measure solar radiation global,direct and diffuse components.
Section 10.12.5
Soiling Measurement
• Soiling and Irradiance MeasurementSystems collect critical data for evaluatingPV array performance.
Section 10.19
Table 10.2: Sensors for Solar Measurement
Besides measuring the solar conditions at the site of the planned solar power plant, some additional measurementsmight be necessary to design the solar power plant, i.e., wind speed, wind direction, air temperature, relative humidityas well as air pressure (see Table 10.1). In some cases soiling detectors and precipitation sensors are required.
10.3 Other Sensors for Meteorological Purposes
There are several sensors, which are not mandatory for wind and solar resource assessment, but provide importantparameters for ground construction and other influential conditions, e.g., precipitation sensors.
© 2011 — 2021 Ammonit Measurement GmbH 147

Sensor Description Link
Precipitation RainGauge
• Measures the amount of precipitation (raingauge) Section 10.13
Laser PrecipitationMonitor
• Calculates SYNOP code (Surface SynopticObservations)
• Measures intensity of total precipitation• Measures intensity of liquid precipitation• Measures intensity of solid precipitation• Calculates the amount of precipitation
Section 10.13.2
Table 10.3: Sensors for Meteorological Purposes
10.4 Devices for Electrical Measurements
Meteo-40 can be used to connect power meters, multifunction transducers or other electrical measurement devices,e.g., for power curve measurement.
Device Description Link
MultifunctionTransducer
• Also power meters or measuring transducers• Measure average phase voltage, current,
real and reactive powerSection 10.14
Table 10.4: Electrical Measurement Devices
10.5 Research Applications
Meteo-40 is also used for research applications. A large and always growing list of formulas, developed and tested incollaboration with specialists, is included in the Evaluation Helper. For a complete list of the available formulas seeSection 5.3.1. Thanks to the Evaluation Helper, it is possible to apply a linear formula to a live measured data for latercalculation of the standard statistics on this value. Most formulas combine different measurements and constants, likethe air density, the covariance or a plain additon. Some special statistics related to turbulences analysis like Obukhovlenght or turbulence intensity can also be configured. The resulting value will be included in the statistics files.
In some research projects, a higher measurement rate can be needed. Over the RS485 Master ( RS485-M) port,Meteo-40 offers the possibility to record data from one RS485 sensor with a maximum polling rate of 8 Hz. If morethan one RS485 sensor is connected to RS485-M, a maximum polling rate of 1 Hz is available. For the analog voltagechannels Ax, analog current ACx and digital channels Dx, the highest measurement rate is 8 Hz. Whereas for counterchannels Cx and period measurement Px the maximum is 1 Hz.
10.6 Anemometers
Anemometers measure the horizontal wind speed (velocity). This parameter is crucial for any wind site assessment.Cup anemometers are the general standard type of anemometers. They are robust and resistant to turbulence andskew winds caused by masts and traverses. Each anemometer should be individually calibrated and equipped with acertified calibration report according to international standards (e.g., MEASNET). At least two anemometers have tobe installed on a met mast. Most anemometers can be equipped with electronically regulated heating.
148 © 2011 — 2021 Ammonit Measurement GmbH

Data Logger Meteo-40 Plus User’s Manual 149 / 246
Refer to the Ammonit website (http://www.ammonit.com/) to learn more about anemometer behavior andaccuracy.
The wind speed (v) is determined by the linear function of the frequency (impulse) output (I):
v[m/s] =
{slope[m] · I[1/s] + offset[m/s] : I > 0
0 : I = 0
Equation 10.3: Calculation of Wind Speed (v)
A counter value of 0 will always result in 0, i.e., the offset is ignored in this case.
For wind assessment campaigns it is required to perform an individual MEASNET calibration of each anemometerin a wind tunnel to achieve optimal accuracy. After calibration, use the values for slope and offset according to thecalibration protocol.
Anemometers are connected to counter channels (Cx). Refer to Figure 13.11 for the connection diagram. Furtherdetails about counter channels can be found in Section 11.2 and Section 12.2.
Anemometers can easily be configured in the Meteo-40 web interface via the Sensor Helper (see Section 5.1.2).
Sensor Order-No DescriptionThies Anemometer FCA Xvibration extended - Modbus
S11200 / S11200H See Section 10.6.1
Thies Anemometer FCA Xinclination extended - Modbus
S11200 / S11200H See Section 10.6.1
Thies Anemometer FCA X -Modbus
S11200 / S11200H See Section 10.6.1
Thies Anemometer FCA X -ASCII
S11200 / S11200H See Section 10.6.1
Thies Anemometer First ClassAdvanced
S11100/S11100H
Thies Anemometer First Class P6100H/P6100Thies Anemometer Compact S12100HThies Anemometer Classic P6121HAnemometer Vento First ClassVector L100 First Class S14100/S14100HRisø P2546A S16100Vaisala Anemometer WAA 252 S15100HYoung Propeller AnemometerModel 27106T
S17100 See Section 10.6.2
NRG #40 Anemometer S18200CNRG #40 Anemometer linear S18200C Pure linear formulaSecond Wind C3Lambrecht Wind Professional14522Young Wind Monitor S17200Met One 014 miniGeneric Anemometer
Generic Anemometer linearPure linear formula for NRGanemometers
Generic Anemometer PM
Table 10.5: Overview Anemometers
© 2011 — 2021 Ammonit Measurement GmbH 149

ImportantIf you plan to install anemometer NRG #40H (Hall Effect), anemometer Risø P2546A (Reed switch),anemometer Thies (if open drain is used), an external circuitry is needed. This can be solved by an externalresistor or - more elegant - using an external module by Ammonit. The external modules allow adaptionfor many different types of sensors and provide stabilized and ripple-free voltage supply for the sensors.Refer to the data sheet and contact Ammonit for further details.
NoteFor technical details and electrical characteristics of sensors, refer to the data sheets, which can be down-loaded from the Ammonit website (http://www.ammonit.com/).
Meteo-40 saves all electrically measured values to the source data (see Section 6.7). The calculated wind speed inm/s is saved to the CSV file (see Section 6.6.1).
NoteThe CSV file contains for all active channels the electrical values according to the chosen statistical inter-val.
10.6.1 Thies First Class Advanced X
The anemometer Thies First Class Advanced X is a cups anemometer that can be connected to the RS485-M portand offers a list of aggregated informations like vibration frequency, inclination, corrected an uncorrected wind speed.Thanks to the digital communication over the RS485 bus, this suplementary information can synchronously be re-quested by Meteo-40.
The corrected wind speed (EC 61400-12-1 Edition 2.0 compliant) is the result of correcting the influence of the at-mospheric pressure on the measured wind speed. Meteo-40 will acquire the measurement values of the lower tableevery second, including measured frequency, corrected and uncorrected wind speed and 3-axis vibration frequencies.
If a Modbus RTU implementation is used (’Thies FCA X - Modbus’, ’Thies Anemometer FCA X vibration extended -Modbus’ or ’Thies Anemometer FCA X inclination extended - Modbus’) and the option RS485 sensors check is active,the sensor will be uniquely identified on every CECS start by requesting its hardware ID, which will be written in theconfiguration file. The calibration table, applied to the measured frequency resulting on the uncorrected wind speedat the second position of the table, is requested and saved eitherways in the configuration file. If any changes aredetected in either the hardware ID or the calibration table, it is reflected in the logbook, including the time stamp whenthe calibration was performed and the number of the calibration certificate.
ImportantDue to the inherent time required in master/slave protocols like Modbus or Thies ASCII protocol, if you wantto connect more than four RS485 sensors to the RS485-M bus and request the measurement value everysecond, it is not possible to request a long list of measurement data. Modbus protocol is optimizing theamount of data transmitted and you must use the plain version (’Thies FCA X - Modbus’) in this case.
150 © 2011 — 2021 Ammonit Measurement GmbH

Data Logger Meteo-40 Plus User’s Manual 151 / 246
Model Channel(Protocol) Measurement Data Required Configuration
Thies FCA Xvibrationextended -Modbus
RS485-M(Modbus RTU)
Wind speed correcteddepending on the air pressureand calibration table (m/s)Wind speed calculated withcurrent calibration table (m/s)Frequency (Hz)Absolute atmosphericpressure (hPa)Status byteVibration frequency X (Hz)Vibration amplitude X (mg)Vibration frequency Y (Hz)Vibration amplitude Y (mg)Vibration frequency Z (Hz)Vibration amplitude Z (mg)
serial settings, address
Thies FCA Xinclinationextended -Modbus
RS485-M(Modbus RTU)
Wind speed correcteddepending on the air pressureand calibration table (m/s)Wind speed calculated withcurrent calibration table (m/s)Frequency (Hz)Housing interior temperature(°C)Absolute atmosphericpressure (hPa)Status byteInclination angle θ (°)Inclination angle ρ (°)Inclination angle φ (°)
serial settings, address
Thies FCA X -Modbus
RS485-M(Modbus RTU)
Wind speed correcteddepending on the air pressureand calibration table (m/s)Housing interior temperature(°C)Absolute atmosphericpressure (hPa)Status byte
serial settings, address
Thies FCA X -ASCII
RS485-M(Thies)
Wind speed calculated withcurrent calibration table (m/s)Wind speed calculated withstandard curve (m/s)Wind speed correcteddepending on the air pressureand calibration table (m/s)
serial settings, address
Thies FCA X -Counter
CounterWind speedcorrected/calculated (m/s)
Parameter FO=4 (seesensor’s manual)
Table 10.6: Connecting Thies FCA X to Meteo-40
NoteAmplitude vibration unit ist mg, where 1g=9,81m/s².
© 2011 — 2021 Ammonit Measurement GmbH 151

10.6.2 Propeller Anemometer Young
The Propeller Anemometer measures horizontal and vertical wind speed. However, it is not classified according toMEASNET and IEC. The anemometer is widely used to measure vertical wind speed to analyse turbulences and thewind load of a turbine.
The anemometer uses a transducer, which converts linearly the rotational speed into DC voltage levels. Connect thesensor to the analog voltage channels (Ax) of your Meteo-40 data logger.
The anemometer can easily be configured in the Meteo-40 web interface via the Sensor Helper (see Section 5.1.2).
Sensor Order-NoPropeller Anemometer Young 27106T S17100
Table 10.7: Overview Propeller Anemometer
NoteFor technical details and electrical characteristics of sensors, refer to the data sheets, which can be down-loaded from the Ammonit website (http://www.ammonit.com/).
Meteo-40 stores all electrically measured values to the source data (see Section 6.7). The calculated wind speed inm/s is saved to the CSV file (see Section 6.6.1).
NoteThe CSV file contains for all active channels the electrical values according to the chosen statistical inter-val.
10.7 Wind Vanes
Wind vanes indicate the horizontal wind direction. The evaluation of the wind direction enables the best possiblepositioning of wind turbines. It is essential that a wind vane covers an entire 360° degree radius - without north gap.
Meteo-40 data loggers are capable of using different types of wind vanes: Digital Wind Vanes and Analog (potentio-metric) Wind Vanes. The Meteo-40 data logger comprises digital interfaces to connect several Digital Wind Vanes.
In addition to Digital Wind Vanes Meteo-40 data loggers are capable to make use of classical Analog Wind Vanesusing a potentiometer. Ammonit suggests to use a five wire setup with two analog voltage channels to eliminatemeasurement errors caused by cable length and voltage drops in the supply voltage of the wind vane.
Furthermore, wind direction can also be recorded using wind vanes with data transmission via RS485-M bus.
10.7.1 Digital Wind Vanes TMR
Ammonit recommends installing digital wind vanes TMR to determine the wind direction. Wind vanes TMR deliverhigher precision and are less susceptible to mechanical wear because of their solid state design. Ammonit offers windvane Thies First Class TMR 10-bit serial-synchron and wind vane Thies Compact TMR 10-bit serial-synchron.
Wind Vane AccuracyThies Compact TMR ± 1°Thies Compact POT ± 2°Thies First Class TMR ± 0.5°Thies First Class POT ± 1°
Table 10.8: Comparison of Wind Vane Accuracy
152 © 2011 — 2021 Ammonit Measurement GmbH

Data Logger Meteo-40 Plus User’s Manual 153 / 246
Each wind vane TMR requires one digital channel, whereas potentiometer wind vanes require two analog voltagechannels each. By installing wind vanes TMR instead of wind vanes POT, analog voltage channels are available forother analog sensors, e.g., barometric pressure sensor, temperature or humidity sensors.
TipConsidering a measurement system with wind vanes TMR a smaller Meteo-40 model with less channelscan be sufficient - for example Meteo-40S with 10 channels (4 analog voltage, 4 counter and 2 digitalchannels).
Wind vanes TMR are connected to digital channels (Dx). Refer to Figure 13.13 for the connection diagram. Furtherdetails about digital channels can be found in Section 11.3 and Section 12.2.
Wind vanes can easily be configured in the Meteo-40 web interface via the Sensor Helper (see Section 5.1.2).
Sensor Order-NoThies First Class S21100HThies Compact S22100 / S22100H
Table 10.9: Overview Wind vanes TMR
NoteFor technical details and electrical characteristics of sensors, refer to the data sheets, which can be down-loaded from the Ammonit website (http://www.ammonit.com/).
10.7.2 Wind Vanes with Potentiometer
To determine the wind direction with a potentiometer wind vane, e.g., Thies First Class and Thies Compact, Ammonitrecommends to use a five wire connetion between data logger and wind vane. This five wire connection eliminatesvoltage drops accross the connection cables and also eliminates the negative impact of voltage drops in the sensor’ssupply. Select the Generic Analog Wind Vane sensor type to connect any wind vane using this equation with thevoltage range -10 V–+10 V.
The five wire connection method makes use of two consecutive analog voltage channels of the Meteo-40 data logger:An, An+1. An records the total voltage of the potentiometer (voltage between vane supply and Ground), An+1 measuresthe voltage between wiper and Ground. The following equation shows the calculation of the wind direction (D).
D[°] =UAn+1[V]
UAn[V]· 360° + offset[°]
Equation 10.4: Calculation of the Wind Direction (D)
The Offset[°] must be filled when the wind vane has not been precisely aligned to the north, e.g., when the windvane has been aligned to the mast. The offset specifies the angle between the North and the point the wind vane hasbeen aligned to.
The Offset for each wind vane is configured in the Sensor Helper (see Section 5.1.2) of the Meteo-40 web interface.
Refer to Figure 13.7 for the connection diagram. Further details about analog voltage channels can be found inSection 11.1 and Section 12.2
Sensor Order-No OffsetThies First Class S21200H 0° (if aligned to the North)Thies Compact S22200 / S22200H 0° (if aligned to the North)
Table 10.10: Parameters for the configuration of potentiometric wind vanes
© 2011 — 2021 Ammonit Measurement GmbH 153

ImportantIf potentiometric wind vanes, e.g., Thies First Class, Thies Compact, Vector W200P, Vector W200P/L,NRG #200P additional resistors for current limitation have to be used in the wiring setup. Contact Ammonitregarding further details about the accessory module!
NoteFor technical details and electrical characteristics of sensors, refer to the data sheets, which can be down-loaded from the Ammonit website (http://www.ammonit.com/).
Meteo-40 stores all electrically measured values to the source data ( Section 6.7). The calculated wind direction in °(degree) is saved to the CSV file (see Section 6.6.1).
NoteThe CSV file contains the electrical values according to the chosen statistical interval for all active mea-surement channels.
10.7.3 Wind Vanes connected to RS485-M
Certain wind vanes have an RS485 interface. Meteo-40 data loggers are capable to address up to eight smart sensorson the RS485-M bus.
ImportantIf you intend to connect more than one sensor via RS485-M, all connected sensors must use the sameprotocol and serial settings. Additionally, each ultrasonic sensor has to use a unique ID ( RS485 address),which has to be configured for the sensor. The transmission mode for all rs485-connected sensors has tobe configured to half duplex. See Section 11.6.
Wind vanes can easily be configured in the Meteo-40 web interface via the Sensor Helper (see Section 5.1.2). SeeTable 10.11 for the configuration of RS485 wind vanes.
Model Protocol Description Channels / EvaluatedData Required Configuration
Thies WindVane TMRRS485
Thies Telegram 3 R1Cx_1: Wind directionSerial settings, Address,Half duplex mode
Thies WindVane FirstClassRS485
Thies Telegram 3R1Cx_1: Wind speedR1Cx_2: Wind direction
Serial settings, Address,Half duplex mode
Thies WindVane 8-bitparallel viaICP DASI7051
DCON
RS485module toconnect twoThies 8-bitparallel windvanes
R1Cx_1: Wind directionvane DI: 0–7R1Cx_2: Wind directionvane DI: 8–15
Same configuration asfor Meteo-32 (Serialsettings: 38400 8N1,Address: 6, Checksum:disabled)
Table 10.11: Configuration of RS485 Wind Vanes
Meteo-40 stores all measured values to the source data ( Section 6.7). The wind direction in ° (degree) is saved tothe CSV file (see Section 6.6.1).
154 © 2011 — 2021 Ammonit Measurement GmbH

Data Logger Meteo-40 Plus User’s Manual 155 / 246
10.7.4 Kintech Geovane™
Connecting the Kintech Geovane™ to Meteo-40 Plus is possible on two different ways: via RS485-M or three analogchannels (two analog voltage channels A and one counter C).
Model Protocol Description Channels / EvaluatedData Required Configuration
KintechGeovane™Analog
Cx: Direction True-NorthAx: Angle of inclination XAy: Angle of inclination Y
Analog output must beactivated
KintechGeovane™ORN
NMEA(compatiblewith Thies)
ORNmessage
R1Cx_1: DirectionTrue-NorthR1Cx_2: Angle ofinclination XR1Cx_3: Angle ofinclination YR1Cx_4: Status byte
baud rate must be higherthan 9600 bps toconnect more than 4RS485 devices
Table 10.12: Kintech Geovane™
10.8 Ultrasonic Anemometers
Ultrasonic anemometers must be connected to the RS485-M port (see Section 11.6). 2D ultrasonic anemometersmeasure horizontal wind speed, wind direction and acoustic virtual temperature. 3D ultrasonic anemometers alsomeasure the vertical wind velocity, which is important for turbulence and wind load calculations.
ImportantIf you intend to connect more than one sensor via RS485-M, all connected sensors must use the sameprotocol and serial settings. Additionally, each ultrasonic sensor has to use a unique ID ( RS485 address),which has to be configured for the sensor. The transmission mode for all rs485-connected sensors has tobe configured to half duplex. See Section 11.6.
The following ultrasonic anemometers are included in the Meteo-40 sensor helper for easy configuration. More Modbussensors can be configured as Other sensor.
Model Protocol Description Channels / EvaluatedData Required Configuration
Thies 2DAnemometer
Thies Telegram 3
R1Cx_1: Wind speedR1Cx_2: Wind directionR1Cx_3: Acoustic virtualtemperature
serial settings, address, halfduplex mode, scalaraveraging over 1 s
Thies 3DAnemometer
Thies Telegram 3
R1Cx_1: Wind speedazimuthR1Cx_2: Wind directionazimuthR1Cx_3: Wind speedelevationR1Cx_4: Acoustic virtualtemperature
serial settings, address, halfduplex mode, scalaraveraging over 1 s
NMEA - ThiesCompactAnemometer
NMEA Telegram 3R1Cx_1: Wind directionR1Cx_2: Wind speed
serial settings, address,NMEA protocol, half duplexmode, scalar averagingover 1 s
Lufft 2DVENTUS-V200A-UMB
Modbus RTUinputregisters 14and 25
R1Cx_1: Wind directionR1Cx_2: Wind speed
serial settings, address,Modbus RTU protocol,parity none
© 2011 — 2021 Ammonit Measurement GmbH 155

Model Protocol Description Channels / EvaluatedData Required Configuration
Gill WindMaster (Pro)3DAnemometer
Gill Mode 4
R1Cx_1: Wind directionazimuthR1Cx_2: Wind speedazimuthR1Cx_3: Wind speedelevationR1Cx_4: Sonictemperature (if activated)
serial settings (B5: 38400bps, 8N1), address (defaultQ), averaging inactive (G0),sampling rate 20 Hz (P8),polar polled (M4), outputformat CSV (O1), Sonictemperature activated (A3)
Gill WindObserver /WindSonic2DAnemometer
Gill Mode 4
R1Cx_1: Wind directionazimuthR1Cx_2: Wind speedazimuthR1Cx_3: Sonictemperature (if activated)
serial settings (B5: 38400bps, F1: default 8N1),address (default A),averaging inactive (G0),sampling rate 20 Hz (P8),polar polled (M4), outputformat CSV (O1), Sonictemperature optionallyactivated (A2)
VaisalaWMT700NMEA MWV
NMEA
WMT700NMEA MWVDataMessage
R1Cx_1: Wind directionR1Cx_2: Wind speed
autoSend = 0 (automaticmessages disabled),com2_protocol = 11(WMT700 NMEA profile forserial port COM2 MWVprotocol), com2_interf = 0(RS485 interface for serialport COM2), com2_delay =10, wndUnit = 0 (m/s windspeed unit), address = WI(Weather Instruments),device identifier = II
10.8.1 NMEA MWV V 2.0
Supported NMEA telegram: $WIMWV,<dir>,<ref>,<spd>,<uni>,<sta>*<chk><CR> <LF>
• <dir>: Wind direction xxx.x• <ref>: Reference R = relative• <spd>: wind speed xxx.x• <uni>: Wind speed unit M = m/s• <sta>: Status A = valid• <chk>: Checksum (8-bit XOR, excluding $ and *)• <CR>: Carriage return code, ASCII 0DH• <LF>: Line feed code, ASCII 0AH
10.8.2 Thies Ultrasonic Configuration Options
Before connecting any Thies sensor to the RS485-M port, it has to be configured. Three Thies ultrasonic types areavailable: 2D compact, 2D and 3D. You can use the Thies Device Utility software to configure your sensors ( ThiesDevice Utility software (https://www.thiesclima.com/en/Products/Accessories-Software/?art=216)).
Ammonit recommends configuring Thies ultrasonic sensors as follows:
Required settings
• Half duplex for transmission mode• Unique ID for each sensor connected to the bus• Heating ON/OFF
156 © 2011 — 2021 Ammonit Measurement GmbH

Data Logger Meteo-40 Plus User’s Manual 157 / 246
Further Thies-specific settings
• Voltage threshold for heating suppression: 17 V (HC=17)• Serial settings: 38400 bps, 8N1 (data format)• Average mode: scalar-averaged velocity and vectorial-averaged angle (AM=2)
TipFor more information about Thies acoustic virtual temperature, see sensor’s manual.
10.8.3 Lufft UMB Configuration Tool
Before connecting any Lufft sensor to Meteo-40, it has to be configured. Download and install the software UMB-Config-Tool (https://www.lufft.com/de-de/produkte/download-de/software-umb-config-tool)and follow the next steps:
1. Power on the sensor.
2. Connect sensor’s A-, B+ to your computer using RS485 to USB or RS232 adapter.
3. Start Config-Software-UMB and setup the connection in the Edit → Connection settings menu.
4. In order to configure the sensor, switch all sensors temporarily to UMB protocol in the Options menu (followinstructions).
5. Add the new sensor in the Edit → Sensor menu. Select the appropriate type from the list and ID (default 1). Donot exit this menu, press Configure to access the sensor configuration.
6. Load the profile from the sensor (press the button again, if it does not respond). Select the tab with sensor typename and configure as described in the table above (see Section 10.8).
7. Store profile on sensor to apply the configuration changes to the sensor. Save the profile also to your disk tokeep a copy of the sensor configuration.
8. Close the configuration program, disconnect and power off the sensor. Connect the sensor to the data loggerand power on the sensor.
9. Add the sensor to the sensor list of the data logger in the Measurement → Sensors menu, applying the sameconfiguration.
10.8.4 Gill Wind Configuration Tool
Before connecting any Gill sensor to Meteo-40, it must be configured accordingly.
1. Download and install Gill Wind Com (http://www.gill.co.uk/main/software.html).
2. Use the Wizard tool to change from the default configuration all parameters specified in the upper table (seeSection 10.8).
3. Use a different address for each unit connected to the RS485-M. It is recommended that letters A to F, K, M, N,and P are not used since they can appear in a data string and might result in erroneous poll responses.
4. Do not forget to save the configuration report in the Tools menu.
5. Close the configuration program, disconnect and power off the sensor. Connect the sensor to the data loggerand power on the sensor.
6. Add the sensor to Meteo-40 sensors list in the Measurement → Sensors menu, applying the same configuration.
NoteAny wind magnitude lower than defined by sensor’s parameter K (default 0.050 m/s) will omit the winddirection.
© 2011 — 2021 Ammonit Measurement GmbH 157

ImportantGill Wind Master sensors with firmware v7.01 can be networked with other Wind Master units on a 2-wireRS485 bus. Units with older versions cannot be networked.
10.9 Weather and Environmental Integrated Monitoring Stations
Weather and environmental stations are capable of measuring a large amount of athmospheric conditions in only onedevice. To acquire this data the preferred connection ist RS485. These sensors can be connected to the RS485-Mport (see Section 11.6).
ImportantIf you intend to connect more than one sensor via RS485-M, all connected sensors must use the sameprotocol and serial settings. Additionally, each ultrasonic sensor has to use a unique ID ( RS485 address),which has to be configured for the sensor. The transmission mode for all rs485-connected sensors has tobe configured to half duplex. See Section 11.6.
The following weather and environmental stations are included in the Meteo-40 sensor helper for easy configuration.More Modbus sensors can be configured as Other sensor.
Model Protocol Description Channels / EvaluatedData Required Configuration
Thies ClimaSensor US
Thies Telegram 6
R1Cx_1: Wind speedR1Cx_2: Wind directionR1Cx_3: TemperatureR1Cx_4: HumidityR1Cx_5: Air pressureR1Cx_6: Brightness max.valueR1Cx_7: Direction ofbrightnessR1Cx_8: PrecipitationstatusR1Cx_9: PrecipitationintensityR1Cx_10: PrecipitationsumR1Cx_11: SYNOP
BR=384, DM=0, DT=0,TT=0, RD=5
Thies ClimaSensor USVDTHP
Thies Telegram 2
R1Cx_1: Wind speedR1Cx_2: Wind directionR1Cx_3: TemperatureR1Cx_4: HumidityR1Cx_5: Air pressure
BR=384, DM=0, DT=0,TT=0, RD=5
Lufft Weatherstation WS
Modbus RTU
inputregisters 10,14, 22, 31and 47
R1Cx_1: Relative humidity(act.)R1Cx_2: Rel. air pressure(act.)R1Cx_3: Wind directionfastR1Cx_4: Air temperature(act.)R1Cx_5: Wind speed fast
serial settings (38400 bps),address, Modbus RTUprotocol, parity none
Lufft Weatherstation WS300
Modbus RTUinputregisters 10,14 and 31
R1Cx_1: Relative humidity(act.)R1Cx_2: Rel. air pressure(act.)R1Cx_3: Air temperature(act.)
serial settings (38400 bps),address, Modbus RTUprotocol, parity none
158 © 2011 — 2021 Ammonit Measurement GmbH

Data Logger Meteo-40 Plus User’s Manual 159 / 246
Model Protocol Description Channels / EvaluatedData Required Configuration
Lufft Weatherstation WS502
Modbus RTU
inputregisters 10,14, 22, 27, 31and 47
R1Cx_1: Relative humidity(act.)R1Cx_2: Rel. air pressure(act.)R1Cx_3: Wind directionfastR1Cx_4: Global radiation(act.)R1Cx_5: Air temperature(act.)R1Cx_6: Wind speed fast
serial settings (38400 bps),address, Modbus RTUprotocol, parity none
Lufft Weatherstation WS600
Modbus RTU
inputregisters 10,14, 22, 24,25, 31, 47,48, 49 and 50
R1Cx_1: Relative humidity(act.)R1Cx_2: Rel. air pressure(act.)R1Cx_3: Wind directionfastR1Cx_4: CompassdirectionR1Cx_5: Precipitation typeR1Cx_6: Air temperature(act.)R1Cx_7: Wind speed fastR1Cx_8: PrecipitationQuantity AbsoluteR1Cx_9: PrecipitationQuantity DifferenceR1Cx_10: PrecipitationIntensity
serial settings (38400 bps),address, Modbus RTUprotocol, parity none
Gill MaxiMetGMX600
Modbus RTUregisters 2 to20
R1Cx_1: Wind directionR1Cx_2: Wind speedR1Cx_3: Wind directioncorrectedR1Cx_4: Air pressureR1Cx_5: HumidityR1Cx_6: TemperatureR1Cx_7: Dew pointR1Cx_8: Precipitation sumR1Cx_9: Precipitationintensity
serial settings, address
WDS308integrateddustmonitoringsensor
Modbus RTUregisters 1 to14
R1Cx_1: Wind directionR1Cx_2: Wind speedR1Cx_3: TemperatureR1Cx_4: HumidityR1Cx_5: Air pressureR1Cx_6: Precipitation sumR1Cx_7: Global irradianceR1Cx_8: UV IndexR1Cx_9: NoiseR1Cx_10: ParticulateMatter PM�.�R1Cx_11: ParticulateMatter PM��
averaging interval 1s, serialsettings, address
© 2011 — 2021 Ammonit Measurement GmbH 159

10.10 Temperature Humidity Sensors
Temperature sensors measure the air temperature, while humidity sensors measure the air humidity. Both sensorsare often applied in combination to reduce cost.
Temperature humidity sensors, e.g., Galltec Active KP, Galltec Active TP, have to be connected to analog voltagechannels (Ax). Refer to Figure 13.4 for the connection diagram.
The output signal (U) from the temperature sensor is proportional to the temperature (T) in °C.
T[°C] = slope[°C/V] · U[V] + offset[°C]
Equation 10.5: Calculation of Temperature (T)
The output signal (U) from the humidity sensor is proportional to the humidity (RH) in %.
RH[%] = slope[%/V] · U[V]
Equation 10.6: Calculation of Humidity (RH)
Slope and Offset are internal parameters of the sensor, which are important to calculate temperature (T) in °C andhumidity (RH) in %. Both values are pre-configured in the Sensor Helper (see Section 5.1.2).
NoteFor more flexibility, when connecting the combined Galltec temperature and humidity sensor to Meteo-40,two different Galltec Active KP sensors are listed in the Sensor Helper (see Section 5.1.2). Two analogchannels are needed and thus the order of the signals to be connected is selectable. ”Galltec Thermo-Hygro Active KP” assigns the first analog channel to temperature and the second to humidity. As opposite,”Galltec Hygro-Thermo Active KP” assigns the first channel to humidity and the second to temperature.
Sensor Order-No Slope OffsetGalltec Active KP(Temperature + Humidity)
S52100 100 %/V (Humidity)100 °C/V (Temperature)
0 % (Humidity)-30 °C(Temperature)
Galltec Active TP(Temperature)
S42100 100 °C/V -30 °C
Table 10.13: Parameters for the configuration of temperature humidity sensors
ImportantIf you install calibrated sensors, enter the values given in the calibration protocol.
Meteo-40 saves all electrically measured values in V to the source data ( Section 6.7). The calculated values fortemperature (°C) and humidity (%) are saved to the CSV file (see Section 6.6.1).
NoteThe CSV file also contains for all active channels the electrical values according to the chosen statisticalinterval.
160 © 2011 — 2021 Ammonit Measurement GmbH

Data Logger Meteo-40 Plus User’s Manual 161 / 246
NoteFor technical details and electrical characteristics of sensors, refer to the data sheets, which can be down-loaded from the Ammonit website (http://www.ammonit.com/).
10.10.1 Resistance Temperature Detectors (RTD) / Pt100 / Pt1000
RTDs measure the temperature by correlating the resistance of the RTD element with temperature. Those sensorsprovide high accuracy and repeatability; the sensors are suitable for precision applications. RTDs use electrical resis-tance and require a power source to operate.
Platinum Resistance Thermometers (Pt100 / Pt1000) are classified according to DIN EN 60751 - see tolerance classesbelow.
Tolerance Class Tolerance in KClass B1/3 DIN ±(0.10 K + 0.0017 × [t])Class A ±(0.15 K + 0.002 × [t])Class B ±(0.30 K + 0.005 × [t])Class 0.5 ±(0.50 K + 0.006 × [t])
Table 10.14: Tolerance Classes - Platinum Resistance Thermometers (Pt100)
Pt100 / Pt1000 sensors have to be connected to the analog voltage channel and the current source of Meteo-40data loggers. The sensors can easily be configured via the Sensor Helper (see Section 5.1.2) in the Meteo-40 webinterface.
Meteo-40 saves all electrically measured values in V to the source data ( Section 6.7). The calculated value fortemperature ( °C) is saved to the CSV file (see Section 6.6.1).
NoteThe CSV file also contains for all active channels the electrical values according to the chosen statisticalinterval.
10.10.2 Temperature Humidity Sensors connected to RS485-M
Some available temperature humidity sensors have to be connected to the RS485-M bus of the Meteo-40 data logger.The sensors can easily be configured in the Meteo-40 web interface via the Sensor Helper (see Section 5.1.2).
ImportantIf you intend to connect more than one sensor via RS485-M, all connected sensors must use the sameprotocol and serial settings. Additionally, each ultrasonic sensor has to use a unique ID ( RS485 address),which has to be configured for the sensor. The transmission mode for all rs485-connected sensors has tobe configured to half duplex. See Section 11.6.
© 2011 — 2021 Ammonit Measurement GmbH 161

Model Protocol Description Channels / Evaluated DataRequired
Configura-tion
GalltecThermo/HygroKPC.MS
Modbus RTUregisters 0, 1,3, 4
R1Cx_1: TemperatureR1Cx_2: Humidity
Fixed serialsettings(19200 8N1)
CampbellHygro/ThermoCS215
SDI-12 D0R1Cx_1: TemperatureR1Cx_2: Humidity
Externalmoduleneeded(address,19200 8N1,120Ωtermination).See SDI-12.
Table 10.15: Data request for RS485 Temperature Humidity Sensors
Meteo-40 saves all measured values to the source data ( Section 6.7). The values for temperature (°C) and humidity(%) are saved to the CSV file ( see Section 6.6.1).
10.11 Barometric Pressure Sensors
Barometric pressure sensors measure the air pressure. Air pressure and air temperature should be evaluated for anaccurate wind site assessment. It is recommended including an air pressure sensor as part of a measuring system.
Barometric pressure sensors, e.g., AB60, AB100 and Vaisala PTB110, have to be connected to analog voltage chan-nels (Ax). Refer to Figure 13.3 for the connection diagram.
The output signal (U) from the barometric pressure sensor is proportional to the air pressure (P).
P[mbar] = slope[mbar/V] · U[V] + offset[mbar]
Equation 10.7: Calculation of Air Pressure (P)
Slope and Offset are internal parameters of the sensor, which are important to calculate the air pressure in hPa.Both values are pre-configured for sensors listed in the library of the Sensor Helper (see Section 5.1.2).
Sensor Order-No Slope OffsetAmmonit AB60 S31100 60 mbar/V 800 mbarAmmonit AB100 S31200 100 mbar/V 600 mbar
Vaisala PTB110S32100 for PTB 110.3S32200 for PTB 110.2S32300 for PTB 110.1
60 mbar/V 800 mbar
Table 10.16: Parameters for the configuration of barometric pressure sensors
ImportantIf you install calibrated sensors, enter the values given in the calibration protocol.
Meteo-40 saves all electrically measured values in V to the source data ( Section 6.7). The calculated air pressurevalue in mbar is saved to the CSV file (see Section 6.6.1).
162 © 2011 — 2021 Ammonit Measurement GmbH

Data Logger Meteo-40 Plus User’s Manual 163 / 246
NoteThe CSV file contains for all active channels the electrical values according to the chosen statistical inter-val.
NoteFor technical details and electrical characteristics of sensors, refer to the data sheets, which can be down-loaded from the Ammonit website (http://www.ammonit.com/).
10.11.1 Barometric Pressure Sensors connected to RS485-M
Certain barometric pressure sensors have to be connected to the RS485-M bus of the Meteo-40 data logger. Thesensors can easily be configured in the Meteo-40 web interface via the Sensor Helper (see Section 5.1.2).
ImportantIf you intend to connect more than one sensor via RS485-M, all connected sensors must use the sameprotocol and serial settings. Additionally, each ultrasonic sensor has to use a unique ID ( RS485 address),which has to be configured for the sensor. The transmission mode for all rs485-connected sensors has tobe configured to half duplex. See Section 11.6.
Model Protocol Description Channels / Evaluated DataRequired
Configura-tion
Thies BaroTransmitter
Thies Telegramm 1R1Cx_1: Air pressureR1Cx_2: Temperature
serial settings,address
Table 10.17: Data request for RS485 Barometric Pressure Sensors
Meteo-40 saves all measured values to the source data ( Section 6.7). The air pressure value in hPa is saved to theCSV file (see Section 6.6.1).
10.12 Solar Sensors
10.12.1 Pyranometers
Pyranometers measure the global horizontal radiation. They are also used as reference instruments thanks to theirmeasurement precision. The use of this sensor is crucial for measurements with solar-powered applications.
Meteo-40 indicates for pyranometers the global horizontal irradiation (GHI).
Pyranometers, e.g., MS series of EKO Instruments or CMP series of Kipp & Zonen, have to be connected to analogvoltage channels (Ax). Refer to Figure 13.2 for the connection diagram.
The output signal (U) from the pyranometer is proportional to the solar irradiance (E) in W/m².
E[W/m²] =U[μV]
Sensitivity[μV/[W/m²]]
Equation 10.8: Calculation of Solar Irradiance (E)
© 2011 — 2021 Ammonit Measurement GmbH 163

Sensitivity is an internal parameter of the sensor, which is important to calculate the radiation in W/m². The valueis given in the calibration certificate of the sensor.
Sensor Order-NoCMP 3 S61100CMP 6 S61110CMP 10 S61130CMP 11 S61120EKO ML-01 S64350EKO MS-40 S64111EKO MS-410 S64130EKO MS-60 S64131EKO MS-602 S64110EKO MS-60M ( RS485) S64160EKO MS-60S ( RS485) S64137EKO MS-80A S64150EKO MS-80M ( RS485) S64160EKO MS-80S ( RS485) S64185EKO MS-802 S64120EKO MS-90+ ( RS485)Kipp & Zonen CMP11 S61120Kipp & Zonen CMP6 S61110Kipp & Zonen CMP3 S61100Kipp & Zonen SMP10 ( RS485) S61430 / S61420Hukseflux Pyranometer LP 02 S63100Hukseflux Pyranometer SR 11 S63120SP Lite2 S61180Silicon Irradiance Sensor MT 0-1V S68310 / S68320 / S68330Silicon Irradiance Sensor MT 0-10V S68100Silicon Irradiance Sensor MT 4-20mA S68110 / S68210Silicon Irradiance Sensor SiS-13TC-T S68250Li-Cor LI-200SZISET Solar Radiation SensorDatasol MET Reference Cell ( RS485)
Table 10.18: Pyranometers
Meteo-40 saves all electrically measured values in V to the source data ( Section 6.7). The calculated values for solarradiation are saved in W/m² to the CSV file (see Section 6.6.1).
NoteThe CSV file also contains for all active channels the electrical values according to the chosen statisticalinterval.
NoteFor technical details and electrical characteristics of sensors, refer to the data sheets, which can be down-loaded from the Ammonit website (http://www.ammonit.com/).
Some pyranometers can or must be connected to the RS485-M port. For EKO pyranometers, it is also possible touse the M-Box RS485 Modbus RTU adapter and connect analog pyranometers to the RS485-M bus. If more than onesensor is connected to the RS485-M bus, they must be configured with a unique Modbus ID and they must all sharethe same protocol and serial settings (see Section 11.6).
164 © 2011 — 2021 Ammonit Measurement GmbH

Data Logger Meteo-40 Plus User’s Manual 165 / 246
Model Protocol Description Channels / Evaluated DataRequired
Configura-tion
EKO MS-60M Modbus RTUregisters 19 to24
M1_1: Measuring Voltage(mv)M1_2: Global Irradiance(W/m²)M1_3: Internal Temperature(°C)
serial settings(9600, 8N2)
EKO MS-80M Modbus RTUregisters 19 to24
M1_1: Measuring Voltage(mv)M1_2: Global Irradiance(W/m²)M1_3: Internal Temperature(°C)
serial settings(9600, 8N2)
EKO MS-80S Modbus RTUregisters 2, 3,8, 9, 14-17and 20-25
M1_1: GHI (W/m²)M1_2: Temperature Pt100(°C)M1_3: Angle of Inclination XM1_4: Angle of Inclination YM1_5: Analog Voltage (mV)M1_6: Temperature (°C)M1_7: Humidity (%)
serial settings
EKO MS-90+ Modbus RTUregisters 4-7,12-13, 22-23and 28-29
M1_1: GHI MS-80S (W/m²)M1_2: DNI MS-90 (W/m²)M1_3: DHI calculated (W/m²)M1_4: Humidity MS-80S (%)M1_5: Temperature MS-80S(°C)M1_6: Elevation (°)M1_7: Azimuth (°)
serial settings,MS-90sensitivityconfigured inC-Box
EKO M-Box Modbus RTUregisters 19 to24
M1_1: Measuring Voltage(mv)M1_2: Global Irradiance(W/m²)M1_3: Internal Temperature(°C)
serial settings(9600, 8N2)
EKO SMP10 Modbus RTUregisters 5 to10
M1_1: Solar Irradiance(W/m²)M1_2: Solar Irradiance Long(W/m²)M1_3: Temperature (°C)
serial settings(19200, 8E1)
Table 10.19: Data request for RS485 pyranometer
ImportantMS-90+ systems are preconfigured and must be handled as a unit. The sensitivity value of MS-90 and theRS485 address of the MS-80S are already configured in the C-Box. It is very important to keep the systemas a unit and don’t exchange the sensors without adapting the C-Box configuration to prevent comunicationproblems and data loss.
10.12.2 Delta-T Sunshine SPN 1
The pyranometer Delta-T Sunshine SPN 1 measures global horizontal and diffuse irradiation in W/m². It provides 2analog voltage outputs (Ax) for global and diffuse irradiation, and 1 digital output (Dx) for sunshine duration.
© 2011 — 2021 Ammonit Measurement GmbH 165

Additionally, Meteo-40 estimates the direct normal irradiation based on the values of global horizontal and diffuseirradiation according to the general formula: Global Horizontal Irradiation = Diffuse Horizontal Irradiation + DirectNormal Irradiation � cos(θ), where θ is the solar zenith angle
The order number for Delta-T Sunshine SPN 1 is S65100.
ImportantIn order to estimate direct normal irradiation (DNI) and sun status, latitude and longitude of the measurementstation have to be entered in the System → Administration menu (see also Section 4.2).If any estimated values should be included in the CSV statistics file, the values have to be selected in theData → Statistics menu under Select statistics (see also Section 6.3.1).
NoteFor technical details and electrical characteristics of sensors, refer to the data sheets, which can be down-loaded from the Ammonit website (http://www.ammonit.com/).
10.12.3 Pyrheliometers
Pyrheliometers are used to measure the direct irradiance emitted by the sun in a 5 degree angle. The sensors haveto be connected to the analog voltage channels (Ax) of Meteo-40.
The output signal (U) from the pyrheliometer is proportional to the solar irradiance (E) in W/m².
E[W/m²] =U[μV]
Sensitivity[μV/[W/m²]]
Equation 10.9: Calculation of Direct Solar Irradiation (E)
Sensitivity is an internal parameter of the sensor, which is important to calculate the irradiation in W/m². The valueis given in the calibration certificate of the sensor.
Meteo-40 indicates for pyrheliometers direct normal irradiation. Additionally, the data logger estimates DNI � cos(θ)and sun status based on the recorded values for direct normal irradiation. In order to estimate sun status and DNI �cos(θ), latitude and longitude of the measurement station have to be entered in the System → Administration menu(see also Section 4.2)
The sensor often comes with built-in Pt100 sensor and thermistor. The Pt100 sensor can be connected to the currentsource (see Section 11.5) of Meteo-40.
If the built-in Pt100 sensor should be connected to Meteo-40, pyrheliometer and Pt100 sensor have to be config-ured separately in the Sensor Helper: Pyrheliometer via sensor type Solar Sensors and Pt100 via sensor type Hy-gro/Thermo.
ImportantDo not connect the thermistor to Meteo-40!
Sensor Order-NoEKO MS-56 S64210Kipp & Zonen CPH1 S62210
Table 10.20: Pyrheliometers
166 © 2011 — 2021 Ammonit Measurement GmbH

Data Logger Meteo-40 Plus User’s Manual 167 / 246
ImportantIn order to estimate sun status and direct normal irradiation [DNI � cos(θ)], latitude and longitude of themeasurement station have to be entered or acquired with a GPS device in the System → Administrationmenu (see also Section 4.2).If any estimated values should be included in the CSV statistics file, the values have to be selected in theData → Statistics menu under Select statistics (see also Section 6.3.1).
NoteFor technical details and electrical characteristics of sensors, refer to the data sheets, which can be down-loaded from the Ammonit website (http://www.ammonit.com/).
10.12.4 Sunshine Duration Sensors
Sunshine duration sensors indicate the sunshine status as defined by the WMO (sunshine = irradiation exceeds thelevel of 120 W/m²). The sensor measures the irradiation and switches the output voltage high or low to indicate sunnyor not sunny conditions.
Sunshine duration sensors, e.g., Kipp & Zonen CSD 3, have to be connected to analog voltage channels (Ax). If directirradiation should be measured, connect this output also to another analog voltage channel (Ax). Refer to Figure 13.2for the connection diagram.
The output signal (V) indicates sunshine or no sunshine. Additionally, the calculated direct irradiation can be measured.The output signal (mV) for direct irradiation is proportional to the direct irradiation (W/m²).
E[W/m²] =U[μV]
Sensitivity[μV/[W/m²]]
Equation 10.10: Calculation of Solar Irradiation (E)
Sensitivity is an internal parameter of the sensor, which is important to calculate the radiation in W/m². The valueis given in the calibration certificate of the sensor.
Meteo-40 saves all electrically measured values in V to the source data ( Section 6.7). The calculated values for directirradiation are saved in W/m² to the CSV file (see Section 6.6.1).
Sensor Order-NoKipp & Zonen CSD 3 S61910
Table 10.21: Sunshine Duration Sensors
NoteFor technical details and electrical characteristics of sensors, refer to the data sheets, which can be down-loaded from the Ammonit website (http://www.ammonit.com/).
Meteo-40 saves all electrically measured values to the source data ( Section 6.7). The calculated direct irradiation inW/m² and the current sun status are saved to the CSV file (see Section 6.6.1).
NoteThe CSV file contains for all active channels the electrical values according to the chosen statistical inter-val.
© 2011 — 2021 Ammonit Measurement GmbH 167

10.12.5 Solar Trackers
EKO Instruments high precision STR Sun Tracker provide high tracking reliability, enhanced functionality with fullyautomated set up procedure through a built in GPS receiver. The compact sun trackers are suited to support all kindsof measurement sensors to measure Global, Diffuse and Direct Radiation.
EKO Sun Trackers must be connected to RS485-M port by means of an RS232 to RS485 adapter .
Date, time and location are acquired from the sensor by means of commands TM and LO. If the data logger valuesare significantly different, Meteo-40 will get automatically synchronized and the changes will be logged in the logbook.This syncronization happens in two cases: when configuring the sensor and, if RS485 sensors check is active, onevery CECS reboot. If you want to trigger the syncronisation routine, you can access the configured EKO Sun Trackerfor editing and save it again without changing the configuration.
According to the configured polling rate, which is 1 s per default, the calculated angle according to the GPS informationand the current angle are requested and recorded.
ImportantMake sure that no other method to synchronize date and time is active (Section 4.2).
Model Protocol Description Channels / Evaluated DataRequired
Configura-tion
EKO SunTracker
EKOCommandsMR and CR
M1_1: Azimuth calculated(CR)M1_2: Altitude calculated(CR)M2_1: Azimuth (MR)M2_2: Altitude (MR)
serial settings
Table 10.22: Data request for RS485 Sun Tracker
10.12.6 Rotating Shadowband Irradiometer
Measure Global, Diffuse and Direct Radiation from two LiCor sensors as well as the temperature. The average valuesfrom both sensors are also calculated.
Model Protocol Description Channels / Evaluated DataRequired
Configura-tion
CSPS RSI Modbus RTURegisters 0 to20
M1_1: Global HorizontalIrradiance (GHI)M1_2: Difuse HorizontalIrradiance (DHI)M1_3: Direct NormalIrradiance (DNI)M1_4: TemperatureM1_5: GHI LiCor 1M1_6: DHI LiCor 1M1_7: DNI LiCor 1M1_8: GHI LiCor 2M1_9: DHI LiCor 2M1_10: DNI LiCor 2
Serial settings
Table 10.23: Configuration of RS485 CSPS RSI
168 © 2011 — 2021 Ammonit Measurement GmbH
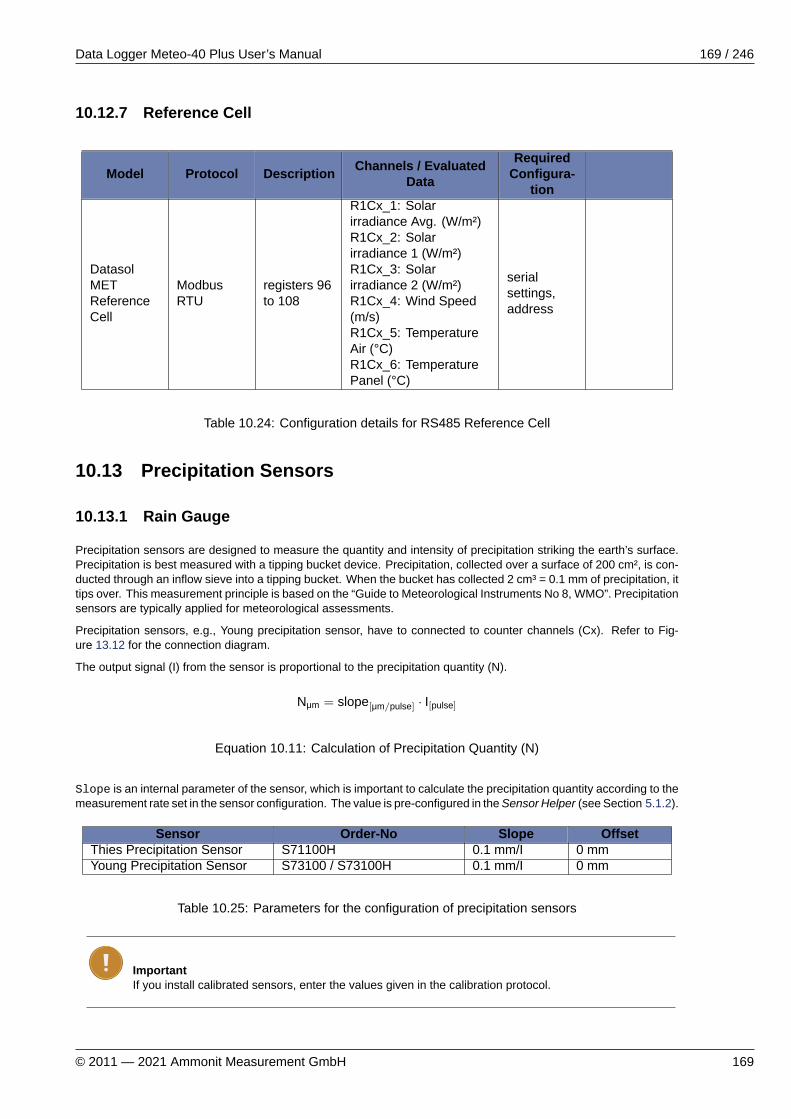
Data Logger Meteo-40 Plus User’s Manual 169 / 246
10.12.7 Reference Cell
Model Protocol Description Channels / EvaluatedData
RequiredConfigura-
tion
DatasolMETReferenceCell
ModbusRTU
registers 96to 108
R1Cx_1: Solarirradiance Avg. (W/m²)R1Cx_2: Solarirradiance 1 (W/m²)R1Cx_3: Solarirradiance 2 (W/m²)R1Cx_4: Wind Speed(m/s)R1Cx_5: TemperatureAir (°C)R1Cx_6: TemperaturePanel (°C)
serialsettings,address
Table 10.24: Configuration details for RS485 Reference Cell
10.13 Precipitation Sensors
10.13.1 Rain Gauge
Precipitation sensors are designed to measure the quantity and intensity of precipitation striking the earth’s surface.Precipitation is best measured with a tipping bucket device. Precipitation, collected over a surface of 200 cm², is con-ducted through an inflow sieve into a tipping bucket. When the bucket has collected 2 cm³ = 0.1 mm of precipitation, ittips over. This measurement principle is based on the “Guide to Meteorological Instruments No 8, WMO”. Precipitationsensors are typically applied for meteorological assessments.
Precipitation sensors, e.g., Young precipitation sensor, have to connected to counter channels (Cx). Refer to Fig-ure 13.12 for the connection diagram.
The output signal (I) from the sensor is proportional to the precipitation quantity (N).
Nμm = slope[μm/pulse] · I[pulse]
Equation 10.11: Calculation of Precipitation Quantity (N)
Slope is an internal parameter of the sensor, which is important to calculate the precipitation quantity according to themeasurement rate set in the sensor configuration. The value is pre-configured in the Sensor Helper (see Section 5.1.2).
Sensor Order-No Slope OffsetThies Precipitation Sensor S71100H 0.1 mm/I 0 mmYoung Precipitation Sensor S73100 / S73100H 0.1 mm/I 0 mm
Table 10.25: Parameters for the configuration of precipitation sensors
ImportantIf you install calibrated sensors, enter the values given in the calibration protocol.
© 2011 — 2021 Ammonit Measurement GmbH 169

Meteo-40 saves all electrically measured values in Pulse [I] to the source data ( Section 6.7). The calculatedvalues are saved to the CSV file (see Section 6.6.1).
NoteThe CSV file also contains for all active channels the electrical values according to the chosen statisticalinterval.
ImportantIf you plan to install precipitation sensor Thies or Young, you have to implement an accessory module!Refer to the data sheet and contact Ammonit for further details.
NoteFor technical details and electrical characteristics of sensors, refer to the data sheets, which can be down-loaded from the Ammonit website (http://www.ammonit.com/).
10.13.2 Laser Precipitation Monitors
Laser precipitation monitors measure various precipitation details, i.e., intensity of total, liquid and solid precipitationas well as the precipitation amount and the SYNOP parameter.
Thies Laser Precipitation Monitor (LPM) sensor performs a new calculation every minute, after the first 5 minutes ofoperation. Meteo-40 requests data with a 1 s rate in order to guarantee a valid measurement per minute with a workingsensor.
Thies LPM has to be connected to RS485-M port.
Model Protocol Description Channels / Evaluated DataRequired
Configura-tion
Thies LaserPrecipitationMonitor
Thies Telegram 8
R1Cx_1: SYNOPR1Cx_2: Intensity totalprecipitationR1Cx_3: Intensity liquidprecipitationR1Cx_4: Intensity solidprecipitationR1Cx_5: Precipitationamount
Serialsettings,address, halfduplex mode,no automatictelegramsending
Table 10.26: Configuration of RS485 Laser Precipitation Monitor Sensors
NoteSYNOP (surface synoptic observations) is a numerical code used for reporting weather observations, alsocalled FM-12 by the World Meteorological Organization. Refer to Thies LPM sensor’s manual for moreinformation.
170 © 2011 — 2021 Ammonit Measurement GmbH

Data Logger Meteo-40 Plus User’s Manual 171 / 246
10.14 Multifunction Transducer, Power Meters and other ElectricalMeasurement Devices
Meteo-40 can be used to connect power meters, multifunction transducers or other electrical measurement devices,e.g., for power curve measurement. The devices are connected to the RS485-M of Meteo-40 (see Section 11.6).
Model Protocol Description Channels and Evaluateddata
Sensor’sprevious
configura-tion
needed
Sineax CAM(see Sec-tion 10.14.1)
Modbus RTU
Actual values(registers40100,40118 to40122,40134 to40142)
R1Cx_1: Average phaseVoltage UR1Cx_2: Current I1R1Cx_3: Current I2R1Cx_4: Current I3R1Cx_5: Real Power P1R1Cx_6: Real Power P2R1Cx_7: Real Power P3R1Cx_8: Total Real PowerPR1Cx_9: Total ReactivePower Q
Serialsettings,address
Iskra MT540(see Iskramanualsdownload(http://www.iskrasistemi.si/download/manuals/))
Modbus RTU
Normalizedactual values(registers804, 809 to811, 816 to819, 823)
R1Cx_1: Average phaseVoltage UR1Cx_2: Current I1R1Cx_3: Current I2R1Cx_4: Current I3R1Cx_5: Real Power P1R1Cx_6: Real Power P2R1Cx_7: Real Power P3R1Cx_8: Total Real PowerPR1Cx_9: Total ReactivePower Q
Serialsettings,address
GD2000Multi-functionPowerAnalyzer
Modbus RTUregisters 56to 63
R1Cx_1: Active powerR1Cx_2: Power factorR1Cx_3: Reactive powerR1Cx_4: Apparent power
Serialsettings(19200 bps),address
10.14.1 Sineax CAM Measuring Unit
Sineax CAM is a universal measuring unit for heavy current variables. Actual measurements for average phase volt-age, current, real and reactive power are requested from this sensor. For more information refer to Gossen MetrawattSineax CAM documentation (http://www.gossenmetrawatt.com/english/produkte/sineaxcam.htm#).
10.15 Remote Sensing
10.15.1 ZephIR 300 Lidar
Meteo-40 can acquire ZephIR 300 live and averaged wind data measurements and include them in the measurementCSV files or share them over SCADA. You can select ’ZephIR 300’ for averaged data or ’ZephIR 300 Live’ for live datafrom the sensors list under ’Other Sensor’.
Before adding a ZephIR 300 to the list, it must be powered and connected to Meteo-40’s RS485-M port. The configuredheights will be automatically requested and for each height, a RS485 channel (M1 to M8) will be configured. If bothlive and averaged data are requested, a maximum of 4 heights can be configured at ZephIR 300.
© 2011 — 2021 Ammonit Measurement GmbH 171

NoteFor more information about how to electrically connect ZephIR 300 and Meteo-40 please contact us.
ImportantMeasurement polling interval for averaged data is 1 minute per default. To ensure a valid measurementper interval it must always be lower than the statistics time interval (see Section 6.3).
Model Protocol Description Channels / Evaluated DataRequired
Configura-tion
ZephIR 300 Modbus RTUAveragedwind data perheight
R1Cx_1: ReferenceR1Cx_2: Wind SpeedR1Cx_3: Vertical WindSpeedR1Cx_4: Wind DirectionR1Cx_5: TemperatureR1Cx_6: Air PressureR1Cx_7: HumidityR1Cx_8: Wind Speed MaxR1Cx_9: TI
Serialsettings,address
ZephIR 300Live
Modbus RTUAveragedwind data perheight
R1Cx_1: ReferenceR1Cx_2: Wind SpeedR1Cx_3: Vertical WindSpeedR1Cx_4: Wind DirectionR1Cx_5: TemperatureR1Cx_6: Air PressureR1Cx_7: Humidity
Serialsettings,address
Table 10.27: Requested values
10.16 Bats Detection
10.16.1 Song Meter SM3BAT/SM4BAT
It is possible to connect the Wildlife Acustics Song Meter SM3BAT or SM4BAT FS to the RS485-M interface. Thisallows a real time monitoring of bat passes and pulses, as well as of the status of the SM3BAT/SM4BAT flash memorycard and power supply.
NoteAn external RS232 to RS485 adapter is required.
172 © 2011 — 2021 Ammonit Measurement GmbH

Data Logger Meteo-40 Plus User’s Manual 173 / 246
Model Protocol Description Channels / Evaluated Data
SM3BAT ASCII(compatible withThies)
R1Cx_1: Internal Voltage (V)R1Cx_2: Internal Temperature (°C)R1Cx_3: Flash memory level (%)R1Cx_4: Bat passes Mic0R1Cx_5: Bat pulses Mic0R1Cx_6: Bat passes Mic1R1Cx_7: Bat pulses Mic1
SM4BAT FS ASCII(compatible withThies)
R1Cx_1: Internal Voltage (V)R1Cx_2: Internal Temperature (°C)R1Cx_3: Flash memory level (%)R1Cx_4: Bat passesR1Cx_5: Bat pulses
Table 10.28: Requested values
Scheduling: The SM3BAT can be programmed to monitor during specific periods of the day, and “sleep” during otherparts of the day to conserve power. When the SM3BAT is sleeping, it will not respond to Meteo-40 messages. Thus,the SM3BAT needs to be programmed when to be monitoring for bats e.g. 24 hours or just at night, etc.
Recording: The SM3BAT normally records the ultrasonic echolocation audio data on up to 4 SDHC or SDXC flashcards. Full spectrum recordings can typically consume 1-2GB of card space per night depending on bat activity. Theflash cards will eventually fill up. Normally, the SM3BAT would shut down if it is no longer able to make recordings.However, for this application, it is desirable to continue monitoring, updating bat counters, and responding to requests.If the interface to Meteo-40 is detected, then the SM3BAT will continue monitoring for bats even if the flash cards arefull, but no new bat activity data will be recorded. This condition is indicated by the flash card 100% full indication inthe response messages.
Bat Activity: Echolocating bats typically produce individual ultrasonic “pulses” continuously while they fly for navigation,avoiding obstacles, and hunting for food. The frequencies, bandwidth and duration of pulses varies from species tospecies and with the functional needs of the bat at the time (e.g. many bats will increase bandwidth and decreaseduration as they close in on prey). The SM3BAT can be configured to recognize pulses that may be tuned to specificbats in a given area. This includes specifying the minimum and maximum frequencies and minimum and maximumdurations of a pulse. These parameters can be tuned to recognize echolocating bats while avoiding false positivesfrom other ultrasonic noise sources such as wind, rain, and insects. The optimum parameters will depend on thespecific bats and insects likely occurring in a given area. A “bat pass” refers to a series of pulses recorded as a batflies by the microphone. Additional parameters in SM3BAT help define what a bat pass is including the maximumtrigger duration and the maximum time between pulses (the trigger window). A bat pass begins with the first detectedpulse, and ends when either no pulses have been detected after the maximum time between pulses has occurred, orwhen the maximum trigger duration has been reached. SM3BAT will not count a bat pass unless it contains at leasttwo pulses. In this way, the SM3BAT can count passes and pulses detected on an ongoing basis and report thesecounts to the customer equipment.
10.17 Lightning Detector
10.17.1 SG1000 Lightning Detector
NoteThis sensor can only be connected to data loggers produced after 2017-06, which can register the digitalsignal period (see Section 11.2).
The SkyScan SG1000 lightning detector can detect the presence of lightning/thunderstorm activity occurring within 64km of your location. It detects the characteristic electromagnetic emissions from individual lightning strokes and usespatented technology to determine the distance to the detected stroke. The distances are indicated in four ranges: 0-5km; 5-13 km; 13-32 km; and 32-64 km. This allows you to track the approach of dangerous storm activity.
© 2011 — 2021 Ammonit Measurement GmbH 173

NoteMore than one range can be detected simultaneously.
SG1000 may also identify certain types of especially strong storms. These storms can produce dangerous winds,heavy rains or tornadoes. When SG1000 detects lightning patterns indicating the presence of these storms, it activatesthe Severe thunderstorm alarm.
Four digital signals with complementary information are supplied by this lightning detector: Alarm, Error, Battery powerand Baseline (see Table 10.29).
Signal Description0-5km Distance range 0-5 km5-13km Distance range 5-13 km13-32km Distance range 13-32 km32-64km Distance range 32-64 kmSevere Severe thunderstrom alarmAlarm Lightning activity has moved within range
ErrorThere is a system error that needs to be addressed (error codeis indicated by the status LED on the unit)
Battery powerMains power has been interrupted and system is operating onbattery backup
BaselineEnsures that there is activity on the digital output (i.e. can beused as a heartbeat to confirm system is up-and-running)
Table 10.29: SG1000 status signals
ImportantIf the period of the digital output signal of the sensor is changed, it is necessary to configure the measure-ment rate at Meteo-40 accordingly. The period of the digital output signal can be set to a value between2.0 and 4.8 seconds, being the default value 2.0. The measurement rate configured at the data logger forthis sensor must be at least twice as long as the period duration of the digital output, in order to guaranteethat a complete period is catched. The default measurement rate is 5 seconds.
10.18 Soil Water Content
Measuring the water content, electrical conductivity (EC), and temperature of soil is a main topic for any agriculturalproject. Meteo-40 supports several volumetric water content (VWC) sensors, connected to an analog channel or tothe RS485-M interface.
SensorDecagon EC-20, EC-10, EC-5 Soil MoistureSensors
Table 10.30: Soil Moisture Sensors
174 © 2011 — 2021 Ammonit Measurement GmbH

Data Logger Meteo-40 Plus User’s Manual 175 / 246
Model Protocol Description Channels / EvaluatedData
RequiredConfigura-
tion
CampbellReflectome-terCS650
SDI-12 D0
R1Cx_1: Volumetricwater contentR1Cx_2: Electricalconductivity
Externalmoduleneeded(address,19200 8N1,120Ω termi-nation).SeeSDI-12.
Table 10.31: RS485 Soil Water Content Sensors
10.19 Soiling Measurement
Soiling is the accumulation of dust, dirt and other contaminants on the surfaces of PV modules. The amount of dustis extremely dependent on the location of the PV power plant, e.g., desert valley with sand storms. In absence of sig-nificant rain events or regular cleaning, production losses due to soiling effects increase. Measuring soiling effectsprovides important details about the PV power plant production, e.g., how much dust can be on the modules beforeany problem occurs and how does the dust affect transparency and efficiency of the modules.
10.19.1 Atonometrics RDE300
Soiling and Irradiance Measurement Systems with the Atonometrics RDE300 Series measurement and control unitcollect critical data for evaluating PV array performance. The systems can be used at operating PV power plants andpre-construction site survey locations.
Model Protocol Description Channels / Evaluated DataRequired
Configura-tion
AtonometricsRDE300
Modbus RTU
M1_1: Global Irradiance PV1M1_2: Analog Current PV1M1_3: Temperature PV1M1_4: Active Power PV1M2_1: Global Irradiance PV2M2_2: Analog Current PV2M2_3: Temperature PV2M2_4: Active Power PV2M2_5: Soiling RatioM2_6: Soiling Ratio IscM2_7: Soiling Ratio PmaxM3_1: Event CodeM4_1: Status FluidM5_1: Status Pump
Serialsettings,address
Table 10.32: Data request for RS485 Soiling Measurement
10.19.2 Ammonit Soiling Measurement Kit SD2100
The Ammonit soiling measurement kit compares the estimated plane-of-array solar (POA) irradiance of a naturally-soiled PV module with a clean reference PV module. The measurement station determines the short-circuit current
© 2011 — 2021 Ammonit Measurement GmbH 175

output as well as the module surface temperature from the backside of each PV module. Based on these measure-ments the POA irradiance can be determined for each module.
G =G0 · ISC · (1 − TKIsc · (T − T0))
ISC0
Equation 10.12: Calculation of POA Irradiation
Where G : POA irradiance reaching the solar cells, G0 : reference condition irradiance, Isc : measured short circuitcurrent, Isc0 : short circuit current at reference condition, T : measured surface temperature, T0 : surface temperatureat reference condition, TK Isc : temperature coefficient of short circuit current.
Two standard metrics for the effects of soiling on energy production are availabe at the Evaluation Helper. The SoilingRatio Isc index (SR Isc), which equals 1 when both modules are clean, and the Soiling Loss Index (SLI), expressedas a percentage.
RSIsc =IscSoiled
ISC0 · (1 + TKIsc · (TSoiled − T0)) · GG0
Equation 10.13: Calculation of SR Isc
Where G is the POA irradiance from the clean module, Isc Soiled is the measured short-circuit current of the soiledmodule and T Soiled is the measured temperature of the soiled module.
SLI = (1 − GClean
GSoiled) · 100
Equation 10.14: Calculation of SLI
Where G Clean : POA irradiance of the clean PV module and G Soiled : POA irradiance of the reference PV module.
The Ammonit soiling measurement kit includes the following components: Ammonit I-U Conversion Box, SurfaceTemperature Sensor and a 30 W Photovoltaic (PV) Module.
Configure an Ampere meter from the sensors list for each of the I-U Conversion Boxes. In order to achieve best matchto the output voltage, the appropriate voltage range must be selected. If you are using CM8281, with a shunt resistorof 50 mΩ, you must select the ±1.0 V range.
10.19.3 Kipp & Zonen DustIQ
The Kipp & Zonen DustIQ is an instrument meant to measure and report the transmission loss (TL) and soiling ratio(SR) caused by light being blocked and reflected and subsequently not getting through the glass of the panel due tosoiling of the panel.
176 © 2011 — 2021 Ammonit Measurement GmbH

Data Logger Meteo-40 Plus User’s Manual 177 / 246
Model Protocol Description Channels / Evaluated DataRequired
Configura-tion
DustIQ Modbus RTUregisters 20,21, 24, 25
M1_1: Soiling Ratio 1 (%)M1_2: Transmission Loss 1(%)M1_3: Soiling Ratio 2 (%)M1_4: Transmission Loss 2(%)
Serialsettings,address
DustIQ &temperature
Modbus RTUregisters 20,21, 24, 25, 31
M1_1: Soiling Ratio 1 (%)M1_2: Transmission Loss 1(%)M1_3: Soiling Ratio 2 (%)M1_4: Transmission Loss 2(%)M1_5: Temperature (°C)
Serialsettings,address
Table 10.33: Data request for DustIQ RS485 Soiling Measurement
10.20 Other RS485 Sensors
In addition to meteorological sensors, further RS485-compatible sensors or devices can be connected to the RS485-Mbus (see Section 11.6). The following list includes some sensors and their configuration.
© 2011 — 2021 Ammonit Measurement GmbH 177

10.20.1 RS485 Multiplexer
Sensortype Model Protocol Description Channels / Evaluated
Data
RequiredConfigura-
tion
MultiChannelVoltageModule
Gantnere.bloxx A1
ModbusRTU
registers 17to 32
R1Cx_1: AnalogVoltage AI1R1Cx_2: AnalogVoltage AI2R1Cx_3: AnalogVoltage AI3R1Cx_4: AnalogVoltage AI4R1Cx_5: AnalogVoltage AI5R1Cx_6: AnalogVoltage AI6R1Cx_7: AnalogVoltage AI7R1Cx_8: AnalogVoltage AI8
Serialsettings,address,protocol,channelsdefinition
MultiChannelVoltageModule
Gantnere.bloxxA3-1
ModbusRTU
registers 17to 26
R1Cx_1: AnalogVoltage 1R1Cx_2: AnalogVoltage 2R1Cx_3: AnalogVoltage 3R1Cx_4: AnalogVoltage 4R1Cx_5: Digital status
Serialsettings,address,protocol,channelsdefinition
MultiChannelDigitalModule
Gantnere.bloxxD1-1
ModbusRTU
registers 0to 7
R1Cx_1: Digital status 1R1Cx_2: Digital status 2R1Cx_3: Digital status 3R1Cx_4: Digital status 4R1Cx_5: Digital status 5R1Cx_6: Digital status 6R1Cx_7: Digital status 7R1Cx_8: Digital status 8
Serialsettings,address,protocol,channelsdefinition
Powersystemmonitor
SYCBAMonitor
ModbusRTU
registers 0to 6
R1Cx_1: AnalogVoltage LoadR1Cx_2: AnalogCurrent Load1R1Cx_3: AnalogCurrent Load2R1Cx_4: AnalogCurrent Load3R1Cx_5: AnalogCurrent Load4R1Cx_6: AnalogVoltage Charge
Serialsettings(default9600 8N1),address(default 1)
Table 10.34: Configuration details for other RS485 Sensors / Devices
178 © 2011 — 2021 Ammonit Measurement GmbH

Data Logger Meteo-40 Plus User’s Manual 179 / 246
10.20.2 Configuring generic Modbus RTU sensors
It is possible to connect up to 8 Modbus RTU sensors to RS485-M port (see Section 11.6). They can be combinedwith other Modbus RTU sensors implemented in Meteo-40 like Lufft sensors, but not with other protocols like Thies orGill.
© 2011 — 2021 Ammonit Measurement GmbH 179

Sensortype
OtherSensor
Sensor
ModbusRTU
Installationheight(m)
0.0
Label
Serialnumber
Evaluationtype
OtherEvaluation
Unit
Serialport
R1
RS-485Channel
R1C1
SensorID(0..247)
1
DataType:
ushort(16-bit)
WordEndianness:
Big(mostsignificantfirst)
Modbusstartregister(0..65535)
0
Modbusregisterquantity(1..20)
1
Modbusfunctioncode(3..4)
4
Serialsettings
RS-485speed
38400
RS-485dataformat
8N1
Measurementrate
1s
ForceRS485sensorscheck
Addmore
Finish
Figure 10.1: Generic Modbus RTU sensor configuration
180 © 2011 — 2021 Ammonit Measurement GmbH

Data Logger Meteo-40 Plus User’s Manual 181 / 246
The maximum quantity of consecutive registers that can be read from each sensor is 20. It is necessary to specifythe first register (PDU addressing, first reference is 0) and the amount of registers. The function code is selectablebetween ’03’ (read holding registers) and ’04’ (read input registers).
Read registers will be evaluated according to the selected data type (see Table 10.35). If a 32-bit data type is selected,each two registers will be merged. For each registers pair (if 32-bit data type selected) or each individual register (if16-bit data type selected), an evaluation is generated. E.g. reading 10 registers on RS485 channel M1 will generate10 evaluations if a 16-bit data type is selected (M1_1 to M1_10) and 5 evaluations if a 32-bit data type is selected(M1_1 to M1_5).
The resulting evaluations have no unit or evaluation type. You can create a new evaluation on top of each originalevaluation by means of the linear equation from the Evaluation Helper (see Section 5.3.1). Finally, it is necessary toproperly select the evaluations to be included in the CSV statistics files in the Data → Statistics(see Figure 6.4).
Data Type Descriptionshort (16-bit) 16-bit integerushort (16-bit) 16-bit unsigned integerlong (32-bit) 32-bit integerulong (32-bit) 32-bit unsigned integerfloat (IEEE754 32-bit) 32-bit single precision binary floating point32-bit unsigned (8-bit exp) 8-bit signed decade exponent, 24-bit uint32-bit signed (8-bit exp) 8-bit signed decade exponent, 24-bit signed int
Table 10.35: Data types available
© 2011 — 2021 Ammonit Measurement GmbH 181

182 © 2011 — 2021 Ammonit Measurement GmbH

Data Logger Meteo-40 Plus User’s Manual 183 / 246
Chapter 11
Channels
In the previous chapter, various sensors have been described, which can be connected to Meteo-40. The sensorshave to be connected to the corresponding channel. Depending on the data logger type, Meteo-40 offers up to 35channels. Meteo-40 provides connectors for the following measurands and signals:
• Analog Voltage (DC)• Analog Current (DC)• Pulse Counter / Period• Digital / Serial / Status• RS485-M (master)
Furthermore, the data logger Meteo-40 provides up to two high precision Current Sources to supply passive sensors.
See also Section 1.3.
11.1 Connecting Sensors to Analog Voltage Channels
Meteo-40 is equipped with up to 12 differential voltage inputs, depending on the logger’s type. Generally, there aretwo benefits from differential inputs:
1. Reduced impact of perturbances and interferences on the signal lines,
2. Helps to avoid ground loops.
You can find the analog voltage channels (Ax, Bx) on the lower left side of the measuring unit (see Section 1.2).For example, analog wind vanes, barometric pressure sensors or pyranometers with analog voltage output can beconnected to analog voltage channels of Meteo-40.
The analog voltage ranges comprise the following voltage ranges:
• ±0.1 V,• ±1 V,• ±10 V,• 0.1 V to 0.3 V.
Note: The voltage range 0.1 V to 0.3 V is a high resolution range, especially designed tor use with passive Pt1000temperature sensors in conjunction with the current sources of Meteo-40.
For further electrical details refer to Section 12.2.
Channel Meteo-40S Meteo-40M Meteo-40L Meteo-40AAnalog Voltage Channels 4 8 12 12
Table 11.1: Analog Channels of Meteo-40
© 2011 — 2021 Ammonit Measurement GmbH 183

11.2 Connecting Sensors to Counter / Period Channels
The counter channels (C) are located next to the analog voltage channels (see Section 1.2). For example, anemome-ters and precipitation sensors can be connected to counter channels. For electrical details refer to Section 12.2.
With data loggers produced since 2017-06, one can use the counter channels C5, C6, C11, and C12 as periodmeasurement channels (P). This is useful for low frequency signals. The channel names are P1 to P4, respectively.
Channel Meteo-40S Meteo-40M Meteo-40L Meteo-40ACounterChannels
4 8 12 2
Periodmeasurements
0 2 4 0
Table 11.2: Counter / Period Channels of Meteo-40
11.2.1 Period measurement
Meteo-40 data loggers produced after 2017-06 can detect rising and falling edges of a signal connected to P channels.Three different measurement options are implemented: period, pulse width and duty cycle. These can be configuredas Other Sensor in the Sensor Helper(see Section 5.1.2). If you want to use the period measurement to connectan anemometer, you must select the Generic Anemometer PM form the list of sensors.
For the period-related measurements, the first two or three edges in the measurement interval are registered. Noaveraging is applied for a measurement interval.
ImportantThe measurement rate must be at least twice as long as the period of the measured signal. If the measure-ment rate is to short, there might not be enough edges per measurement interval.
Period: The Period is the duration of time of one cycle in a repeating event, so the Period is the reciprocal of thefrequency. For the Period measurement, a total of three edges is needed.
Pulse Width: The Pulse Width or pulse duration is the time between a rising and a falling edge. At least one risingand one falling edge are needed for this measurement.
Duty Cycle: The Duty Cycle is the percentage of the ratio of the pulse width to the total period of the waveform. Inthis case, at least three edges are needed for the measurement.
Period, Pulse Width and Duty Cycle are illustraded in Figure Figure 11.1.
184 © 2011 — 2021 Ammonit Measurement GmbH

Data Logger Meteo-40 Plus User’s Manual 185 / 246
T = t + t1 2Period:
t
U(t)
t1
t2
Pulse Width: T = t - t12
t
U(t)
t1
t2
t2t
1
DC = t + t1 2
t 1Duty Cycle:
t
U(t)
Figure 11.1: Illustration of Period, Pulse Width and Duty Cycle.
11.3 Connecting Sensors to Digital Channels
To use digital serial wind vanes Meteo-40 comprises up to eight Digital Channels (D). These Digital Channels arelocated in the middle of the connection panel of the data logger. For further electrical details refer to Section 12.2.
Channel Meteo-40S Meteo-40M Meteo-40L Meteo-40ADigital Channels 2 4 8 4
Table 11.3: Digital Channels of Meteo-40
11.3.1 Functionality Check of Clock Output
To set up a proper digital connection between the sensor and Meteo-40 it is sometimes necessary to verify the func-tionality of the Digital Clock Output. The Digital Clock Output sends a short data sequence to the sensor, the sensorshould respond with a data sequence on the IN line of the serial interface.
To request data from the sensor the Digital Clock Output must provide voltage levels that can be detected (understood)by the sensor. To simply test the functionality of the Digital Clock Output with a Multimeter, Meteo-40 provides asoftware driven test procedure. To perform the CLK-Line Output Test do the following:
• Disconnect the sensor from the data logger.• Connect the data logger to the PC to configure it via web interface.
© 2011 — 2021 Ammonit Measurement GmbH 185

• Login into the data logger and follow the links Measurement→ Channels• Press the ”Digital test” button below the sensor list.• A tabular showing the Digital Channels available on this logger appears. The right columns of the table contain two
buttons: ”5 V” and ”0 V” corresponding to each channel.
Channel CLK5V CLK0V
D1 5V 0V
D2 5V 0V
D3 5V 0V
D4 5V 0V
D5 5V 0V
D6 5V 0V
D7 5V 0V
D8 5V 0V
Figure 11.2: Configuration Menu for CLK-Line Test in Meteo-40.
• Connect the multi meter between CLK output and GND of the Digital Channel you intend to check.• First step: Press the button ”5 V” to switch on the DC voltage of the Clock Output. There must be a voltage between
4 V and 5.6 V present at the Clock Output.• Second Step: Add a resistor of 1 kΩ–1.2 kΩ in parallel to the multi meter (see figure Figure 11.3). Press the button
”5 V” to switch on the DC voltage of the Clock Output. The voltage at the Clock Output must not drop below 3 volts.
Notes:
• The DC voltage output can be toggled between High- and Low-level via the two buttons ”5 V” and ”0 V”• The test has limited timespan: After pressing the ” Digital test” button and choosing the DC voltage level, the
voltage level will remain only 10 seconds. To repeat the test, the button ” 5 V” has to be pressed again.
Test Result: If the voltage level drops below 3 volts, the CLK output of the data logger could be defective.
186 © 2011 — 2021 Ammonit Measurement GmbH

Data Logger Meteo-40 Plus User’s Manual 187 / 246
1kΩ ... 1.2kΩ
CLK
Data-In
GND
PAS / Eart
h
Measure VoltageBetween CLK and GND
to sensor
Figure 11.3: Setup for CLK-Line test of Serial Interface.
11.4 Connecting Sensors to Analog Current Channels
Meteo-40 data loggers offer analog current measurement channels: Meteo-40L and Meteo-40A provide two channels;Meteo-40M and Meteo-40S one each.
Barometric pressure sensors with current output can be connected to these channels. The current measurementchannels offer current ranges of 1 mA, 10 mA and 100 mA which can be configured via web interface.
© 2011 — 2021 Ammonit Measurement GmbH 187

Channel Meteo-40S Meteo-40M Meteo-40L Meteo-40AAnalog Current Channels 1 1 2 2
Table 11.4: Analog Current Channels of Meteo-40
11.5 Connecting Sensors to Current Source
The current source (CS) is located on the left of the communication unit next to the analog current channels (seeSection 1.2). Meteo-40 data loggers are equipped with one or two current sources, depending on the logger’s type.The goal of these current sources is to supply passive temperature sensors (PT100 or PT1000).
Single Pt100 and Pt1000 sensors as well as Pt100 sensors, which are for example implemented inside pyrheliometerscan be connected to the current source of Meteo-40. For electrical details refer to Section 12.2.
Channel Meteo-40S Meteo-40M Meteo-40L Meteo-40ACurrent Source Channels 1 1 2 2
Table 11.5: Current Source Channels of Meteo-40
NoteFor technical details and electrical characteristics of sensors, refer to the data sheets, which can be down-loaded from the Ammonit website (http://www.ammonit.com/).
11.6 Connecting Sensors to RS485-M
All data logger types of Meteo-40 offer an RS485-M (master) slot for bus connection of up to eight sensors with RS485interface. For further electrical details refer to Section 12.2.
When adding an RS485 sensor in the Measurement → Sensors menu, a (selectable) channel name between M1 andM8 is assigned to the sensor. Subindexes, e.g., M1_1, M1_2, are created for measured data and evaluations. Inthe Measurement → Evaluation menu the evaluations are displayed. Both measured values and evaluated data areincluded in the CSV files and can be seen in the Data → Live menu.
Most RS485 sensors have to be configured before use. The same configuration must be applied, when adding thesensors to Meteo-40 in the Measurement → Sensors menu.
ImportantOnly sensors using the same protocol and serial settings can share the RS485 bus. It is necessary toconfigure each sensor with a unique RS485 address in the bus.
ImportantIf 4 or less RS485 sensors are connected, the RS485-M receiver remains enabled for 165 ms. With morethan 4 sensors, the receiver enabled time decreases to 40 ms. The sensor response delay and the re-sponse transmission itself should happen within this period.
188 © 2011 — 2021 Ammonit Measurement GmbH

Data Logger Meteo-40 Plus User’s Manual 189 / 246
11.6.1 SDI-12 sensors
SDI-12 is a standard communications protocol which provides a means to transfer measurements taken by an intelli-gent sensor to a data recorder. A subset of the SDI-12 protocol is implemented on Meteo-40. By means of an externalhardware, the RS485-M interface can be used to connect SDI-12 sensors. If more than one SDI-12 is connected, theexternal adapters must be configured with different RS485 addresses. The supported SDI-12 sensors can be foundin section Sensors.
11.7 Using the Switches
Each Meteo-40 data logger comprises switches to switch different kinds of loads on and off. The number of switchesdepends on the type of the logger (S, M or L). The switch is internally reasized with a P-channel MOSFET. The loadscan be sensors as well as relays (electro-mechanical or solid state). Each switches section consists of three terminals:5 V output, Input (In) and Output (Out).
Input terminal: This is the input of the voltage to be switched. Note: Input voltage must be positive with respect toground (GND).
Output terminal: Output of the switch.
5 V Output terminal: The 5 V output can be used as a control voltage for external devices. Furthermore, it can be usedas input voltage for the switches.
The following two figures show example circiuts to make clear the use of the 5 V and the switches terminals.
5VIn
Out
Sensoror
Load
DCSource(5Vto28V)
Meteo-40:SwitchesTerminal
++
GND GND
Figure 11.4: Use switches to supply sensors.
© 2011 — 2021 Ammonit Measurement GmbH 189

5VIn
Out
5V-Coilor
SSR-Input
Meteo-40:SwitchesTerminal
+
GND
RelaysorSolid-State-Relays(SSR)
Bridgefrom5VOutputtoSwtichInput
Figure 11.5: Use switches and 5 V for external relays control.
190 © 2011 — 2021 Ammonit Measurement GmbH

Data Logger Meteo-40 Plus User’s Manual 191 / 246
Chapter 12
Technical Data
12.1 Specification
Property SpecificationHousing Dimensions 260 × 194 × 50 [mm]Weight 950 gProtection IP65
Temperature -40–+65 °C (operation)-20–+65 °C (display readable)
Memory Meteo-40S: 1 GBMeteo-40M: 2 GBMeteo-40L: 2 GBMeteo-40A: 1 GB
Date Format YYYY-MM-DDTime Format hh:mm:ss
ClockBuffered real time clockAccuracy: -40–+85 °C (±3.5 ppm);0–+40 °C (±2 ppm)3 V Lithium Button Cell CR2032;approx. 180 mAh; operating time >3 years
Power Supply No internal supply! (see Section 12.2.13)
ImportantMeteo-40 has no internal supply battery! External power supply is essential for proper operation. Sec-tion 12.2.13 contains the characteristics of the voltage supply and the current consumption of the datalogger.
© 2011 — 2021 Ammonit Measurement GmbH 191

7151
225±0.4
125±0
.4
4x threaded inserts for mountingmetric screw thread: M5screw-in-depth: 10 mm
Figure 12.1: Mounting threads dimensions.
12.2 Electrical Characteristics
The values given in the following tables Table 12.1 to Table 12.12 contain the specifications of the digital and analoginputs and outputs. The given values are specified for a temperature range of -40– +65 °C.
NoteAll inputs and outputs are protected against overvoltage and electrostatic discharge using suppressordiodes. All voltage outputs of the data logger are fused by an self-resetting electronic fuse. Additionally,the power supply comprises an reverse-polarity protection diode.
192 © 2011 — 2021 Ammonit Measurement GmbH

Data Logger Meteo-40 Plus User’s Manual 193 / 246
12.2.1 Electrical Specifications of Analog Voltage Channels / Differential Inputs
Property Specification
Number of Channels per Data Logger Type4 @ Meteo-40S (A1–A4)8 @ Meteo-40M (A1–A8)12 @ Meteo-40L (A1–A12)12 @ Meteo-40A (A1–A12)
Available Voltage Ranges (DC)±0.1 V±1 V±10 V0.1 V–0.3 V
Internal Resolution (Bit)15 bit (Range: ±0.1 V)16 bit (Range: ±1 V)16 bit (Range: ±10 V)16 bit (Range: 0.1 V–0.3 V)
Internal Resolution (Voltage)6.1 µV (Range: ±0.1 V)30 µV (Range: ±1 V)300 µV (Range: ±10 V)3.1 µV (Range: 0.1 V–0.3 V)
Measurement Accuracy (Voltage)≤ 50 µV (Range: ±0.1 V)≤ 150 µV (Range: ±1 V)≤ 1 mV (Range: ±10 V)≤ 50 µV (Range: 0.1 V–0.3 V)
Input Impedance 1 MΩ
Input Voltage min. -12 Vmax. +12 V
Maximum Measurement Frequency 4 Hz
Table 12.1: Electrical Specifications of Analog Voltage Channels / Differential Inputs
12.2.2 Electrical Specifications of Analog Current Channels / Differential Inputs
Property Specification
Number of Channels per Data Logger Type1 @ Meteo-40S (AC1)1 @ Meteo-40M (AC1)2 @ Meteo-40L (AC1–AC2)2 @ Meteo-40A (AC1–AC2)
Available Current Ranges (DC)±1 mA±10 mA±100 mA
Measurement Accuracy (DC)≤ 5µA (Range: ±1 mA)≤ 30µA (Range: ±10 mA)≤ 300µA (Range: ±100 mA)
Resolution (Bit)13 bit (Range: ±1 mA)15 bit (Range: ±10 mA15 bit (Range: ±10 mA
Input Impedance (Shunt) 4.7 ΩMaximum Input Current 150 mAMaximum Input Voltage 0.75 VMaximum Measurement Frequency 4 Hz
Table 12.2: Electrical Specifications of Analog Current Channels / Differential Inputs
© 2011 — 2021 Ammonit Measurement GmbH 193

12.2.3 Electrical Specifications of Internal Measurements
Meteo-40 comprises measurement of Internal Supply Voltage and Internal Current of the data logger. These mea-surement values can be used for remote verification of the functionality of the data logger and are written to the sourcedata and the CSV data files respectively.
Important Notes:
• Internal Supply Voltage and Internal Current are recorded with 12 bit resolution only,• Internal Supply Voltage is measured directly behind a reverse polarity protection diode. This means: The measured
value is approximately 0.35 volt lower than the supply voltage at the logger’s supply terminals.
12.2.4 Electrical Specifications of Counter Channels / Non-Differential Inputs
The counter counts impulses within a defined measurement timespan. This measurement timespan is derived from aprecise timer signal with a precision of ± 5 ppm in the temperature range -40–+65 °C.
In case of a measurement timespan of one second the count of impulses is equal to frequency (Unit: Hz).
Property Specification
Number of Channels per Data Logger Type4 @ Meteo-40S (C1–C4)8 @ Meteo-40M (C1–C8)12 @ Meteo-40L (C1–C12)2 @ Meteo-40A (C1–C2)
Frequency Range (TTL-Level) 1 Hz–25 kHzFrequency Resolution 1 0.1 HzVoltage Threshold (f > 1 Hz) 0.22 V
Input Voltage min. -12 Vmax. +12 V
Period Measurement (Non-Differential Inputs) Channels P1 (C5), P2 (C6), P3 (C11), P4 (C12)
Table 12.3: Electrical Specifications of Counter Channels / Non-Differential Inputs
12.2.5 Electrical Specifications of Digital Channels (Serial Input / Output)
Property Specification
Number of Channels per Data Logger Type2 @ Meteo-40S (D1–D2)4 @ Meteo-40M (D1–D4)8 @ Meteo-40L (D1–D8)4 @ Meteo-40A (D1–D4)
Input Voltage Range (High State) 2 V–25 VInput Voltage Range (Low State) -0.5 V–0.6 VInput Resistance ≥ 10 kΩ
Table 12.4: Electrical Specifications of Digital Channels (Serial Input / Output)
1The frequency resolution depends on the period time setting. Longer period time setting results in higher resolution.
194 © 2011 — 2021 Ammonit Measurement GmbH

Data Logger Meteo-40 Plus User’s Manual 195 / 246
12.2.6 Electrical Specifications for Digital Clock Output
Property Specification
Number of Channels per Data Logger Type2 @ Meteo-40S (D1–D2)4 @ Meteo-40M (D1–D4)8 @ Meteo-40L (D1–D8)4 @ Meteo-40A (D1–D4)
High State 5 VLow State 0 VOutput Resistance 100 ΩMinimal Load Resistance 500 Ω
Table 12.5: Electrical Specifications for Digital Clock Output
12.2.7 Electrical Specifications for Analog Current Source
Property Specification
Number of Channels per Data Logger Type1 @ Meteo-40S (CS1)1 @ Meteo-40M (CS1)2 @ Meteo-40L (CS1–CS2)2 @ Meteo-40A (CS1–CS2)
Nominal Current 200 µATolerances < 0.5 %
Table 12.6: Electrical Specifications for Anlog Current Source
12.2.8 Electrical Specifications for Switches
Property Specification
Number of Channels per Data Logger Type2 @ Meteo-40S (S1–S2)4 @ Meteo-40M (S1–S4)8 @ Meteo-40L (S1–S8)4 @ Meteo-40A (S1–S4)
Switch Voltage Range 5 V–28 VMax. Current Continuous Switch 120 mAPeak Switch Current (2 s) 400 mASwitch On Resistance < 350 mΩSwitch Off Resistance > 10 MΩ
Table 12.7: Electrical Specifications for Switches
ImportantThe switches section of the Meteo-40 comprises 5 V outputs to supply periferical devices inside the steelcabinet of the measurement setup. The 5 V supply is not intended to supply sensors connected with longcables due to the risk of damage caused by lightning strike.The 5 V outputs provide an electronic current limiter and an overvoltage protection.
© 2011 — 2021 Ammonit Measurement GmbH 195

12.2.9 Electrical Specifications of the 5 V Output
Property SpecificationMax. output voltage 5.5 VMin. output voltage 4.7 VMax. output current per output terminal 15 mA
Table 12.8: Electrical Specification of the 5 V Output
12.2.10 Electrical Specifications of the RS485 Interface
Property SpecificationSupply Voltage RS485 A, B 5 VTermination Resistor (Bus Termination) 120 ΩMaximal Transmission Rate 1 MB/s
Table 12.9: Electrical Specification of the RS485 Interface
NoteBiasing of RS485 interface via external module M83570.
12.2.11 Electrical Specification of the Ethernet Interface
ImportantThe Ethernet interface is only available on Meteo-40 Revision D.
Property SpecificationEthernet port (Meteo-40 Revision D) 100 Mbit/s (100BASE-TX)
Table 12.10: Electrical Specification of the Ethernet Interface
12.2.12 Electrical Specification of the RS232 Interface
ImportantThe RS232 interface is only available on Meteo-40 Revision C. The production of Meteo-40 Revision Cstopped in October 2012.
196 © 2011 — 2021 Ammonit Measurement GmbH

Data Logger Meteo-40 Plus User’s Manual 197 / 246
Property Specification
Serial interface port (Meteo-40 Revision C)Male 9-pin RS232 connector for connection toserial modem
Maximal Baudrate 115200 Baud
Table 12.11: Electrical Specification of the RS232 Interface
12.2.13 Electrical Specification of the Power Supply
ImportantMeteo-40 has no internal supply battery! External power supply is essential for proper operation.
Power Supply Property SpecificationSupply Voltage Input (withReverse Voltage Protection)
Supply Voltage Range 9 V (DC)–36 V (DC)Peak Supply Voltage (10 s) 55 V (DC)
Current Consumption
Average Current Consumption@ 12 V (DC) duringmeasurement
≤ 30 mA (P < 360 mW)
Average Current Consumption@ 12 V (DC) duringcommunication
≤ 70 mA (P ≤ 840 mW)for Meteo-40 Revision D≤ 60 mA (P < 720 mW)for Meteo-40 Revision C
Average Current Consumption@ 12 V (DC) with displayillumination
175 mA (P ≤ 2.1 W)for Meteo-40 Revision D< 500 mA (P < 6 W)for Meteo-40 Revision C
Table 12.12: Electrical Specification of the Power Supply
© 2011 — 2021 Ammonit Measurement GmbH 197

198 © 2011 — 2021 Ammonit Measurement GmbH

Data Logger Meteo-40 Plus User’s Manual 199 / 246
Chapter 13
Electrical Connection Plans
The following connection plans explain how Meteo-40 is connected with power supply, sensors and other periphery.
NoteSince Meteo-40 is designed to be very flexible, various sensors can be connected to the data logger. If thesensor you intend to connect, is not listed in this manual, refer for technical details and connection plansshown on the data sheets on our website ( www.ammonit.com (http://www.ammonit.com)) or contactour sales team (+49-30-6003188-0 or [email protected]).
Figure 13.1: Meteo-40 Supply incl. Modem
© 2011 — 2021 Ammonit Measurement GmbH 199

Figure 13.2: Electrical Connection Plan: Analog Voltage (Pyranometer)
Floating voltage source (pyranometer) is connected via terminal or OVP to the differential analog voltage channels.
200 © 2011 — 2021 Ammonit Measurement GmbH

Data Logger Meteo-40 Plus User’s Manual 201 / 246
Figure 13.3: Electrical Connection Plan: Analog Voltage (Temperature / Barometric Pressure Sensor)
The temperature and/or barometric pressure sensor is connected via terminal or OVP to the differential analog voltagechannels. To avoid ground loops, it is not recommended connecting the B terminal of the analog voltage input directlyto common ground.
© 2011 — 2021 Ammonit Measurement GmbH 201

Figure 13.4: Electrical Connection Plan: Analog Voltage (Temperature + Humidity Sensor)
Voltage sources (temperature and humidity sensor) are connected via terminal or OVP to the differential analog voltagechannels. To avoid ground loops, it is not recommended connecting the B terminal of the analog voltage input directlyto common ground.
202 © 2011 — 2021 Ammonit Measurement GmbH

Data Logger Meteo-40 Plus User’s Manual 203 / 246
Figure 13.5: Electrical Connection Plan: Analog Voltage / Current Source (4-wire-connection; Pt1000)
Analog Current Source (CS) of Meteo-40 is applied to feed a Pt100/Pt1000 temperature sensor. The sensor is con-nected via terminal or OVP to the differential analog voltage channel. 4-wire measurement is recommended to avoidvoltage errors due to the resistance of feed line.
© 2011 — 2021 Ammonit Measurement GmbH 203

Figure 13.6: Electrical Connection Plan: Analog Voltage / Current Source (4-wire-connection; Pt1000 +Humidity)
Analog Current Source (CS) of Meteo-40 supplies the Pt100/Pt1000 temperature sensor. The active humidity sensormay be fed by the same supply as the data logger. Both sensor outputs are connected via terminal or OVP to individualdifferential analog voltage channels.
204 © 2011 — 2021 Ammonit Measurement GmbH

Data Logger Meteo-40 Plus User’s Manual 205 / 246
Figure 13.7: Electrical Connection Plan: Analog Voltage (Potentiometric Wind Vane)
The figure above shows the 5-wire connection of a potentiometric wind vane. The intention of this configuration is toavoid voltage drops on the measurement lines caused by wire resistance. The first analog voltage channel measuresthe voltage across the whole potentiometer while the second channel measures the voltage between wiper and ground.The configuration is supplied via current limiting resistor by a 5 V supply. All lines to the wind vane are connected viaterminal or OVP.
© 2011 — 2021 Ammonit Measurement GmbH 205

Figure 13.8: Electrical Connection Plan: Analog Voltage with Voltage Divider (R1, R2)
The Meteo-40 data logger is designed to measure analog DC voltages from -10 V–10 V. This is sufficient for mostmeteorological sensors. If voltages higher than +10 V occur, the voltage at the analog voltage inputs must be sharedby a voltage divider. Note that R2 is in parallel to the input impedance of the analog voltage channel (1 MΩ).
206 © 2011 — 2021 Ammonit Measurement GmbH

Data Logger Meteo-40 Plus User’s Manual 207 / 246
Figure 13.9: Electrical Connection Plan: Analog Current (2-wire-connection), active
Meteo-40 comprises analog current measurement inputs (AC) to measure DC currents up to 100 mA. Many meteoro-logical sensors provide analog current outputs with 0–20 mA or 4–20 mA. The positive signal line has to be connectedto the A input. The negative line (or signal ground) has to be connected to the B input of the analog current input. Thefigure above depicts the recommended setup using connections via terminal or OVP to the data logger.
© 2011 — 2021 Ammonit Measurement GmbH 207

Figure 13.10: Electrical Connection Plan: Analog Voltage with Shunt
The Meteo-40 data logger can measure DC currents up to 100 mA on its analog current inputs. This is sufficient formost meteorological sensors. If currents higher than 100 mA are to be measured, a shunt can be used in conjunctionwith the analog voltage inputs.
208 © 2011 — 2021 Ammonit Measurement GmbH

Data Logger Meteo-40 Plus User’s Manual 209 / 246
Figure 13.11: Electrical Connection Plan: Pulse Counter (Anemometer)
Meteo-40 comprises several impulse counter inputs (CNT). In most cases they are used for anemometer setup. Thesignal output of the sensor has to be connected to the CNT input of the data logger. To avoid floating signals commonground is used for the negative line of counter connection. The figure above depicts the recommended setup usingconnections via terminal or OVP to the data logger.
© 2011 — 2021 Ammonit Measurement GmbH 209

Figure 13.12: Electrical Connection Plan: Pulse Counter with Pull-up Module for Precipitation Measure-ment
The counter inputs of the Meteo-40 data logger can be used for precipitation sensors. Most precipitation sensorscomprise open collector outputs or use a switching reed contact. In both cases an additional pull-up resistor has tobe applied. This pull-up resistor is tied to a 5 V supply to feed the sensor’s output. The module M83570 by Ammonitcomprises several configurable pull-up resistors and an internal 5 V supply. M83570 can easily be integrated in thesetup of a steel cabinet. The figure above shows the recommended setup using connections via terminal or OVP tothe data logger.
210 © 2011 — 2021 Ammonit Measurement GmbH

Data Logger Meteo-40 Plus User’s Manual 211 / 246
Figure 13.13: Electrical Connection Plan: Digital Serial for Serial Wind Vane (Thies TMR)
The Digital Serial inputs of Meteo-40 data loggers are designed to connect sensors using serial communication. Thedata logger sends a clock burst to the sensor via the CLK line. The response of the sensor is sent back to the datainput line (IN) of the Digital Serial panel. It is essential that sensor and data logger use the same common ground.The figure above shows the recommended setup using connections via terminal or OVP to the data logger.
© 2011 — 2021 Ammonit Measurement GmbH 211

Figure 13.14: Electrical Connection Plan: Status with Pull-down Module
In some cases an additional pull-down resistor may be required to equalise the electrical potential on the status signallines. This may be necessary to reduce perturbance caused by floating lines. The potential equalization can berealized by an external resistor to GND or an external module M83570 provided by Ammonit. This external modulecomprises pull down resistors for several signal lines.
212 © 2011 — 2021 Ammonit Measurement GmbH

Data Logger Meteo-40 Plus User’s Manual 213 / 246
Figure 13.15: Electrical Connection Plan: Status for Obstacle Light
Many obstacle lights provide a diagnosis port to indicate malfunction. This diagnosis port can be connected to the INport of the Serial Digital panel. For a detailed description of the electrical characteristics of the interfaces see table inSection 12.2.5. The figure above shows the recommended setup using connections via terminal or OVP to the datalogger.
© 2011 — 2021 Ammonit Measurement GmbH 213

Figure 13.16: Electrical Connection Plan: RS485 with RS485 Module
In case of RS485 bus communication nn additional biasing may be required. This can be done with the configurationshown above. Ammonit provides the external Module M83570 which comprises a configurable circuit for biasingpurposes. The M83570 module contains an internal voltage supply providing 5 V for biasing the RS485 bus lines.
214 © 2011 — 2021 Ammonit Measurement GmbH

Data Logger Meteo-40 Plus User’s Manual 215 / 246
Figure 13.17: Electrical Connection Plan: Switch external Sensor Heating via Meteo-40 Switch Manager
The configuration above displays the connection of an external sensor heating switched by the Meteo-40 heatingcontrol.
© 2011 — 2021 Ammonit Measurement GmbH 215

216 © 2011 — 2021 Ammonit Measurement GmbH

Data Logger Meteo-40 Plus User’s Manual 217 / 246
Chapter 14
Cryptographic Software
Ammonit implemented certain standard cryptographic software to protect sensitive measurement data. None of thealgorithms are developed by Ammonit. All cryptographic software used on Meteo-40 is free software. Its source codeis available for everybody to study and check for security problems.
Currently the following is encrypted:
• Access to Meteo-40 via web interface over HTTPS with high-grade encryption (AES-256, 256 bit keys)• All data sent and received via the Meteo-40 web interface, e.g., data download• Data upload via SCP (RSA 2048 bit) to AmmonitOR or your own server• Emails and attached CSV files sent by Meteo-40 (optional)
NoteThere is no encryption, when data is uploaded via FTP to a server. Moreover, the data stored on Meteo-40is not encrypted. But only computer specialists with inside knowledge could be able to access the data.
Software or Protocol Description Supported Algorithms
HTTPS
All access to the user interfaceof the data logger is done viaHTTPS, a combination ofHTTP with SSL/ TLS, asimplemented in OpenSSL.
AES, Blowfish, Camellia,SEED, CAST-128, DES, IDEA,RC2, RC4, RC5, Triple DES,GOST 28147-89, MD5, MD2,SHA-1, SHA-2, RIPEMD-160,MDC-2, GOST R 34.11-94,RSA, DSA, Diffie–Hellman keyexchange, Elliptic curve,GOST R 34.10-2001
SSH
The connection to the Ammonittunnel server (or any tunnelserver of your choice) isperformed with an SSHreverse tunnel.
3DES, Blowfish, CAST128,Arcfour, AES, RSA
OpenPGP (GnuPG)
The international standardOpenPGP, specifically theGnuPG implementation, isused to digitally sign andencrypt measurement data.
CAST5, Camellia, Triple DES,AES, Blowfish, Twofish,ElGamal, RSA RIPEMD-160,MD5, SHA-1, SHA-2, Tiger,DSA, RSA
Table 14.1: Cryptographic Software
© 2011 — 2021 Ammonit Measurement GmbH 217

218 © 2011 — 2021 Ammonit Measurement GmbH

Data Logger Meteo-40 Plus User’s Manual 219 / 246
Chapter 15
Maintenance and Care
In order to ensure that Meteo-40 data loggers work properly, it is important that you maintain and handle the devicewith care.
ImportantIf an error occurs and the Ammonit support team needs to be contacted, download the configuration file( config-Dnnnnnn.txt in menu System → Information) and send it with the error description to theAmmonit Support [email protected].
15.1 Operation and Storage
The data logger can be affected by extreme temperature and humidity conditions. Meteo-40 is designed to operateproperly at temperatures between -40–+65 °C in non-condensing environments. The display is readable between-20–+70 °C.
On site the data logger has to be installed in a robust and weatherproof cabinet (see also at www.ammonit.com(http://www.ammonit.com/)). The cabinet protects the data logger against weather and condenzation damage,theft and vandalism. If humidity tolerance is exceeded and moisture penetrates, the electronics of Meteo-40 can bedamaged. Users are responsible for effective humidity control.
Handle Meteo-40 with care, do not drop it, and avoid mechanical shocks and vibrations to prevent the electronics frombeing damaged. Do not open or break the Meteo-40 housing or any of the slots. Avoid permanent pressure on thedata logger.
To ensure that Meteo-40 operates properly, install only equipment, e.g., sensors, adapters and cables, which is un-damaged and approved by Ammonit. Contact Ammonit, if any questions occur.
15.2 Overvoltage / Lightning Protection
Ammonit offers lightning and overvoltage protection devices for DC and AC low-voltage supplies of components andmeasuring systems, ensuring protection of data and signal lines and power cables. The surge protection cable clampis installed in the steel cabinet instead of a regular unprotected cable clamp. We offer several types of surge protectiondevices, differing in number of pins and voltage levels. Although the installation of overvoltage protection devices is notmandatory, we highly recommend installing them, as unprotected lightning can lead to a total breakdown of the entiremeasuring system. Overvoltage protection is strongly advised at freestanding measuring stations or when aircraftobstacle lights are applied.
© 2011 — 2021 Ammonit Measurement GmbH 219

220 © 2011 — 2021 Ammonit Measurement GmbH

Data Logger Meteo-40 Plus User’s Manual 221 / 246
Chapter 16
Frequently Asked Questions
Find in this chapter a summary of frequently asked questions.
If you do not find the answer to your specific question in this chapter, contact the Ammonit support team.
16.1 Local Communication
Question Answer
The Meteo-40 display does notshow anything.
The display is switched off. Press the middle button of your data loggerand hold it until the display turns on. The display of Meteo-40 is onlyilluminated, when CECS is running. During MARS operation, thedisplay is switched of. Refer to Chapter 9.The ambient temperature is below -20 °C. The crystals of the LCD gotstuck.
I cannot configure Meteo-40 usingthe buttons.
You do not have permission to configure the data logger with thebuttons on the Meteo-40 housing. See Section 9.1.
The red LED light is turned on.What does it indicate?
It indicates that an error in the measuring operation occured. Fordetails see System → Logbook in the web interface or System→ Errors → Error List in the display menu.
The yellow LED light blinks. Whatdoes it indicate?
It indicates that at least one RS485 sensor is connected. According tothe Modbus protocol, the yellow LED light blinks, when a measurementis taken.
I do not have an USB Ethernetadapter available. How can Iconnect Meteo-40 Revision C tothe LAN?
As Meteo-40 Revision C has no Ethernet port, an USB Ethernet adapteris required. Use the USB Ethernet adapter included in the delivery.Meteo-40 Revision D data loggers are equipped with Ethernet port andcan be connected directly to the LAN - without any accessories.
Meteo-40 is connected to the LAN.After entering the IP address ofMeteo-40 in my browser, I receivean error message.
Check the three following possibilities:
• Meteo-40 is switched off. The web interface can only be accessed,when Meteo-40 is switched on, rep. the CECS has to be on. SeeSection 1.4.
• Make sure, Meteo-40 and your PC are within the same LAN.• A static IP address is configured, which does not exist in your current
LAN. If you have the permission, you can activate DHCP in thedisplay of Meteo-40. Go to the Communication → Devices → LAN→ eth menu and set Use DHCP to Yes(see Section 9.1. Or connectthe data logger via USB and change the LAN settings. SeeSection 7.7.
Meteo-40 is connected via USB to aWindows PC and is not recognized.
Download and install the required driver file. See Section 2.5.
Which cable I have to use toconnect Meteo-40 to my PC?
Use a standards USB-A+B cable, the same cable used to connectprinters or other devices.Note that you might require a driver file for Meteo-40 (see above).
© 2011 — 2021 Ammonit Measurement GmbH 221

16.2 Remote Communication
16.2.1 Modem
Question Answer
Modem USB connected but remoteAmmonitConnect access notavailable.
It is a common mistake to try to test the modem communication whileaccessing the user interface localy via ethernet. With the defaultconfiguration, the preferred connection in this case is the ethernet and,if there is no internet access via ethernet, the data logger will not haveinternet access. You can see in the status box: Connection:ETHERNET, Modem (See Figure 3.3).The recommended way to test the USB GSM modem is to disconnectthe ethernet cable and check the connection at the display menuCommunication (see Section 7.10).You can always access the data logger user interface using the USB-Bcable, which doesn’t interfere with the modem communication.If both the ethernet communication (for local access) and the modemcommunication (for remote access) are needed, you must activate theoption Connect to Internet via modem only in Communication → LANmenu (see Section 7.7.
After configuring and connectingthe Sierra Wireless FXT009modem, the connection cannot beestablished.
• Make sure the SIM card is not broken. The SIM card should beinserted properly and the SIM card slot of the modem has to belocked (see Section 7.9.6.1).
• Check the power supply of the modem. A small red light indicatesthat the modem is running.
• Make sure that you configured the SIM card’s provider details in theprovider settings. Use the Provider helper (see Section 7.9.1), if youare unsure. If your provider is not given in the list, ask your providerfor the details, i.e., APN, username and password.We recommend doublechecking the provider details.
• Make sure that the used SIM card has not been locked by entering awrong PIN code. You can create a new PIN code via the Meteo-40web interface; the PUK code is required.
• Make sure that you use a SIM card / rate, which supports mobileInternet.
An Internet connection is alwaysestablished, when I switch on theCECS of Meteo-40. The modemshould only be online, when datahas to be sent.
Deselect the checkbox Modem online, when CECS is on in theCommunication → Modem menu. Thus the modem only establishes anonline connection, when an action (e.g., upload data, email data oronline availability) is scheduled.
222 © 2011 — 2021 Ammonit Measurement GmbH

Data Logger Meteo-40 Plus User’s Manual 223 / 246
Question Answer
I cannot connect to the data loggervia modem?
• Make sure the modem is switched on and running to perform thescheduled actions. Did you configure a switch to toggle the modem?If the modem is connected via relay to the data logger, a switch hasto be configured in the Communication → Modem menu of the datalogger. In Meteo-40 firmware version 1.0 Rev. 13915 and higher S1is set by default in the modem configuration.It is not sufficient to toggle the switch manually, as it is not saved tothe data logger configuration. After rebooting the data logger or afterpower supply interruptions, the modem will not start again. It remainsswitched off. See also Section 7.9.
• If the modem is configured properly and you do not receive anymeasurement data, it could be a problem with the modem. Are thefrequency bands configured correctly? Refer to Section 7.9.6.1.We also recommend upgrading the data logger firmware regularly aswe contineously improve the software.
• If you receive measurement data, the signal might be too weak to setup the Internet connection to access the data logger. In this caserefer to Section 16.2.2.
TipWe recommend testing the modem functions before installa-tion in the field, i.e., sending emails, uploading files and ac-cessing the web interface via modem connection.
How do I connect a BGAN satellitemodem?
BGAN satellite modems are connected via Ethernet cable to Meteo-40.If you are working with Meteo-40 Revision C with RS232 slot, you needan USB Ethernet adapter to connect the modem.In order to supply the satellite modem, a LAN switch has to be assignedin the Communication → LAN menu. Make sure that the checkbox LANonline, whenever CECS is on is not selected. Hence, the modem goesonline only when needed. The modem itself has to be configured usingthe software provided by its manufacturer. For further details refer toSection 7.9.7 and especially to Section 7.9.7.3.
16.2.2 Ammonit Tunnel
Question Answer
After entering the URL of the tunnelconnection, a message is displayedwhich indicates that the tunnel isnot responding.
• Your data logger is (currently) not connected to the Internet. The datalogger has not been configured to be online for this time. Meteo-40establishes an Internet connection for the periods configured in theschedule (see Section 7.2).
TipIf you use AmmonitOR to monitor your data logger, you cancheck, when the data logger is scheduled to be online.
• The data logger is busy, e.g., performing an upgrade, uploading files.Try to access the tunnel connection a few minutes later.
• Another user is logged in and is downloading data files. Try to accessthe tunnel connection a few minutes later.
© 2011 — 2021 Ammonit Measurement GmbH 223

Question Answer
The entered URL seems to bewrong.
Make sure that the URL has the formhttps://Dnnnnnn.connect.ammonit.com/, where Dnnnnnnmust be replaced with the serial number of the data logger withoutspaces or hyphens.If you lost tunnel access code, call the Ammonit support team.
The data logger is sending /uploading data, but I cannotconnect to the data logger viatunnel.
The tunnel connection seems to be not stable enough. The issue canbe solved as follows:
• The GPRS connection might be very weak. Switch to GSM. Ask yourprovider for the dial-in number (P-to-P). The dial-in Number has to beconfigured in the Meteo-40 web interface in the Communication→ Modem menu. An APN does not have to be entered. See alsoSection 7.9.
• The signal might be very weak. Replace the installed antenna with aYagi directional antenna. The Yagi antenna can be aligned to a neartransmitting station to receive a better signal. For further details seeWikipedia(http://en.wikipedia.org/wiki/Yagi-Uda_antenna).
• Instead of using a standard SIM card with dynamic IP address, inserta SIM card with public IP address into the modem. The data loggercan be accessed via its public IP address and/or via the domainprovided by the tunnel server, if configured. See also Section 7.3.If your data logger is registered in AmmonitOR, you can find its publicIP address in the Data Loggers → Connections menu. Go with themouse pointer on a displayed connection in the graphic view or lookup the IP address in the text view.
16.3 Firmware Upgrade
Question Answer
Do I have to be on site to performan upgrade?
No, you can start the upgrade via remote access (tunnel connection),e.g., when the data logger is scheduled to be online.Nevertheless we recommend upgrading the data logger in the office toavoid any unexpected difficulties.
My data logger is not connected tothe Internet; how can I perform anupgrade?
In order to perform an upgrade, the data logger has to be connected tothe Internet.By connecting your smartphone to the data logger, you can set up anInternet connection via the tethering function of the smartphone.Connect your smartphone to your Meteo-40 data logger via USB(USB-A slot of the data logger and micro USB slot of the smartphone).Open the settings for Tethering and portable hotspot of the smartphoneoperating system (see Figure 4.16). Activate USB tethering.Browse for the IP address of your Meteo-40 data logger using the keys( Communication → Devices → LAN → USB (Activated) → IPsettings). Enter the data logger’s IP address in your smartphonebrowser, login and perform the upgrade.
Do I have to install all upgrades?
We recommend installing all available upgrades to benefit from newfeatures and to fix recent problems.Ammonit regularly informs Meteo-40 users about available upgrades byemail.
During the download process theconnection was interrupted? Do Ihave to restart the downloadprocess?
The downloaded software packages are stored on the data logger.Start the upgrade process again to continue the download andinstallation process. Once downloaded packages do not have to bedownloaded again.
How does the installation processaffect the recording of the MARS?
If the MARS is not affected by the upgrade, the recording continueswithout any interruption.If the MARS will be upgraded, the recording stops for approx. 30s andcontinues afterwards.
224 © 2011 — 2021 Ammonit Measurement GmbH

Data Logger Meteo-40 Plus User’s Manual 225 / 246
16.4 Data: Format, Transfer and Download
Question Answer
Which methods are available totransfer data files?
• Upload data files via SCP/FTP/SFTP/FTPS connection to a server ofyour choice or the AmmonitOR installation on your server (seeSection 7.6).
• Upload data files to your AmmonitOR account on the Ammonit server(AmmonitOR project key is required, see Section 7.6).
• Sent data files to an email account (see Section 7.5).• Manual download of CSV files via the Meteo-40 web interface.• Manual download of CSV files on pre-configured USB flash drive on
site (see Section 4.4.3).
If no Internet connection is availableon site, can I download data files?
Yes, you can download the statistics and/or the source data using apre-configured USB flash drive. Switch on the data logger (CECS) andplug in the prepared USB flash drive. All generated CSV files willautomatically be saved on the USB flash drive. See also Section 4.2.You can also connect to the data logger via USB or W-LAN on site anddownload the CSV files on your PC.
What happens to data files, whichcould not be sent / uploadedaccording to the schedule time,e.g., because of connectionproblems?
Files, which have not been sent according to the scheduled time, will besent or uploaded at the next scheduled action.
I receive data files with the file typecsv.gz? How do I handle thesefiles?
The file is compressed using GNU gzip (See Section 6.6) and has to bedecompressed before you can use it. If you work with MicrosoftExcel™, open the file as decribed in Section 6.6.3. If you work withLibreOffice or OpenOffice, use the settings decribed in Section 6.6.2.
How can I open CSV filesgenerated by Meteo-40 withMicrosoft Excel?
In order to open CSV files with Microsoft Excel, the settings have to beadapted. Launch Microsoft Excel and open the Options in menu File.Under Advanced the decimal and thousands separators are defined.Adapt the settings for Meteo-40 CSV files as follows, if necessary.Decimal separator has to be a dot (.); thousands separator has to be acomma (,). If necessary, deselect the function Use system separators.CSV files generated by Meteo-40 data loggers use the comma (,) asfield separator, double quote (”) for embedding commas in textualstrings and UTF-8 as character set. These details have to beconsidered, when data files are imported. In order to import CSV files,click on From Text on the Data tab and browse for the CSV file. Followthe instructions of the import wizard.For further details refer to Section 6.6.3.
I have an AmmonitOR installationon my own server. How can Iupload the data files to it?
Select in the Communication → AmmonitOR menu of your Meteo-40data logger for AmmonitOR server the value Custom AmmonitOR andbelow under server the name or IP address of your server.
What shows the date/time at thebeginning of each row of the CSVfile?
The date and time value shows the start time of the statistics interval ofthis row. Date and time format are similar to ISO-8601, e.g.,2014-07-17 15:50:00. The date and time values are always the localtime of the data logger. See also Section 6.6.
16.5 Sensor: Configuration and Connection
16.5.1 Sensor Configuration
© 2011 — 2021 Ammonit Measurement GmbH 225

Question Answer
The sensor, which I have to install,is not given in the sensor list. Howdo I configure the sensor?
If the sensor is not given in the list, you can select Other Sensor in theSensor Helper and configure channels, slope and offset values,measurement rate etc. manually.If the anemometer you want to install is not listed in the Sensor Helper,select Anemometer for the sensor type and Generic Anemometer forthe sensor. The other values have to be configured manually.If the analog wind vane you want to install is not listed in the SensorHelper, select Wind Vane for the sensor type and Generic Analog WindVane for the sensor. The other values have to be configured manually.
ImportantOnly for the sensors listed in the Sensor Helper, Ammonit as-sures the correct calculation of the statistics!
If you are unsure how to configure an unlisted sensor, contact theAmmonit support team.
I have a calibrated sensor. Wheredo I enter the calibration values?
For each configured sensor you can modify the slope and offset valuesin the Sensor Helper.
My configured pyranometer SPN1does not display any estimatedvalue?
In order to estimate DNI and sun status, you have to enter thegeographic coordinates of the measurement station, i.e., latitude andlongitude. Both coordinates are important to get the zenith angle of thesun at the site. Enter latitude and longitude in the System→ Administration menu of your Meteo-40 data logger.
16.5.2 Sensor Connection
Question Answer
Where can I find a plan to connecta sensor?
• If you ordered the measurement system including steel cabinet andcables from Ammonit, connection plans can be found in the steelcabinet. Additionally, the sensor connection with Ammonit cables isdescribed in the data sheet, which you received for each sensorbought from Ammonit.
• If you ordered only the sensors without cables from Ammonit, refer tothe data sheet by the sensor’s manufacturer. In Chapter 13 you canfind the electrical connection plans for Meteo-40.
I have to install two potentiometricwind vanes, a barometric pressuresensor and a temperature humiditysensor - all connected to analogvoltage channels. Which datalogger model is suitable?
The Meteo-40M model offers 8 analog voltage channels to connect twopotentiometric wind vanes, a barometric pressure sensor and atemperature humidity sensor.If digital wind vanes TMR would be installed, which require only onedigital channel each, the Meteo-40S model would be suitable, as well.
NoteDigital wind vanes TMR are more precise than potentiometricwind vanes. Additionally, digital wind vanes TMR are sub-ject to less mechanical wear than potentiometer wind vanesthanks to their solid state design. Wind vanes TMR do nothave moving parts, except the bearings. Thus digital windvanes TMR are more reliable and less susceptible to failure.
16.6 Measurement
226 © 2011 — 2021 Ammonit Measurement GmbH

Data Logger Meteo-40 Plus User’s Manual 227 / 246
Question Answer
Sensors are configured andconnected, but the measurement isnot recorded?
Check the following options:
• It seems that the power supply during measurement was notsufficient or has stopped. Thus MARS is turned off. ConnectMeteo-40 to a reliable power supply to operate MARS on.
• In the status box Recording is swiched off. Click Switch on in theMeteo-40 web interface.
• The configuration has not been saved after the last modification.Save the configuration and click Switch on for recording.
Where can I find the meteorologicaldata in m/s or °C?
The current value of each evaluation is displayed in the Measurement→ Evaluation menu in the Meteo-40 web interface. Additionally, youcan display live data in the Data → Live menu of the data logger.In the CSV files you can find the evaluated meteorological dataaccording the the settings you made in the Data → Statistics menu.Furthermore, if you work with AmmonitOR, you can monitor themeteorological data in your AmmonitOR project, e.g., in various plotsfor selectable periods.
Where can I find the originalelectrical measurement data?
The current electrical value of each channel is displayed in theMeasurement → Channels menu of the Meteo-40 web interface.Additionally, you can see the electrical values of all channels in theData → Source menu.In the source file, which can be downloaded in the Data → Statisticsmenu of the data logger, you can see all electrical values of all channelsfor a selected period.
16.7 Errors and Messages
Question Answer
After saving a configuration orstarting an action, an Internal erroroccured and is displayed in the webinterface?
Internal errors could have various reasons. Not always a serious erroroccured, e.g., due to a short connection time out, an operation couldhave been interrupted. Try the following actions to solve the problem:
• Go to another page and perform the action again.• Restart the data logger and perform the action again.
The red LED light is turned on.What does it indicate?
It indicates that an error in the measuring operation occured. Fordetails see System → Logbook in the web interface or System→ Errors → Error List in the display menu.
ImportantIf you should notice any error on your data logger or in the web interface, we kindly ask you to inform us assoon as possible. The Meteo-40 data logger is a very complex system, so unfortunately it can happen thaterrors occur. In order to avoid any disruption of the data logger operation, we need on your assistance.In case of an error, please note down what have been done on the data logger before the error occured,which system components are used, e.g., GSM modem or satellite modem, and which system configurationis active.
© 2011 — 2021 Ammonit Measurement GmbH 227

228 © 2011 — 2021 Ammonit Measurement GmbH

Data Logger Meteo-40 Plus User’s Manual 229 / 246
Release Notes
Version 2.1.4 (2022-07-22)
• Fix display of longitude on the ”System > Information” page.• Show more information about running actions in the web interface.• Add weekly overview of source data to the web interface.• Remove switch (pretime) settings from Sensor Helper which were not working correctly.• Allow a longer time for the modem to connect before abandoning file transfers.• Show more information about the modem in the web interface and remove incorrect warnings.• Add a button to manually ignore warnings about possibly inconsistent CSVs.• Add ”Remote Copy” methods for SCP and SFTP with password. The original methods now use the SSH key only.• Add TLS client certificate support to live data publisher.• Add menus to the display to send test files.• Show the origin channel of evaluations on the display.• Add a dropdown to choose between global and diffuse irradiance for pyranometers.• Fix creating CSV files when the clock is set to 1st Jan 2000 or after the year 2050.• Recording can only be started if at least one sensor is configured.• Fix the live data page if the sensor label contains special characters.• Check that user names are unique when uploading config files.• Change separator for fractional seconds from ”:” to ”.” in evaluated source data.• New Thies barometer sensor 0..5V.
Version 2.1.3 (2022-07-07)
• Add support for counter ICs with new specification. There is no need to upgrade existing devices to this release.
Version 2.1.1 (2022-04-08)
• Add a minimal_value variable for linear wind speed calculations, which is used when the counter measurementchannel records zero. This is equal to the offset by default. See Equation 5.1 for more information.
• Fix offline USB-Upgrade ”Error (5) Could not read environment”. This version or later must be installed via theinternet in order to use future USB-Upgrades.
• Fix GPS with certain modems, such as the PLS8. Include GPS response in the KML file.• Fix Switch Manager timer as sufficient condition.• Improve web-UI status box accuracy.• Fix toggling Switch 1 via the display.• Estimated DHI value is 0 instead of NAN between sunset and sunrise.• New SYCBA Monitor over RS485.• Always include data snapshot in EMail body text.• Record a message in the logbook when CSV files could not be generated or are manually deleted.• Show number of statistics files on the ”System > Information” page.• Show the same hints when changing sensors as when adding them.
© 2011 — 2021 Ammonit Measurement GmbH 229

Version 2.1.0 (2022-02-02)
• Live data can now be published via XMPP. See Section 6.2 for more information.• If the ”Delete all measurement data” process is interrupted, it will now be resumed.• Fix uploads to AmmonitOR when ”Sign and encrypt data (OpenPGP)” is selected.• Embed signature in encrypted files so that they are compatible with Ammonit Verify.• Avoid sending incomplete logbook files more reliably when ”Yes” is selected.• Show more information about inconsistent statistics files.• Show progress of statistic file generation.• More feedback when triggering actions on the display.• Warn about invalid directories configured for Remote Copy.• Shrink ”Order No.” column on the sensor list.• Fix non-functional ”Download week” button in Source Data view.• Ensure information displayed in the web UI status box is up-to-date.• New turbulence intensity (TI) formula, rename the existing formula to longitudinal TI.• Request MS-90+ altitude and azimuth every second.
Version 2.0.14 (2021-10-28)
• Fix MS-90+ implementation.• Increased robustness against invalid configuration files upload.• Ensure that cross-signed TLS certificates are accepted when one signature has expired e.g. for SFTP with letsen-
crypt.
Version 2.0.13 (2021-10-20)
• Improve system stability when generating many statistics files with high-frequency RS485 sensors configured.• New pyranometer EKO MS-60 S over RS485.• Request coordinates for EKO MS-90+ on every CECS reboot.• Fix ’Thies FCA X - Counter’ statistics calculation.• Allow switch manager to be disabled by setting the ”Managed switch” to none.• Improve reliability of copying files to USB flash drives and show progress on the LCD.• Fix error page when saving USB passphrase.• Hide prompt to view manual when entering the wrong password.• Add Japanese language support.
Version 2.0.12 (2021-08-23)
• Fix unrelated sensors being removed when a sensor is deleted.
Version 2.0.11 (2021-08-17)
• Improved robustness against RS485 data corruption for ASCII protocols.• Improved memory usage for CSV generation with ’Thies Clima Sensor US’.• New NRG PB60 pressure sensor.• New NRG T60 temperature sensor.• New WDS 100 4..20 mA wind vane.• Fix DHI formula in Evaluation helper.• Fix statistics calculation for ’Thies FCA X - ASCII’ and ’Vaisala WMT700 NMEA’.
230 © 2011 — 2021 Ammonit Measurement GmbH

Data Logger Meteo-40 Plus User’s Manual 231 / 246
WarningYou must delete and regenerate older files to correctly perform the statistics calculation.
• Deleting a sensor no longer deletes other sensors with the same label.• The option ”Behaviour if file limit is reached” now prevents re-creating deleted statistics when there is low storage
space.• Improve handling of non-ASCII characters on the display.• Ensure that only completed logbook files are sent when ”Yes” is selected.• Show beta status of software on update.• Prevent auto shutdown during upgrade more reliably.
Version 2.0.10 (2021-07-12)
• Improve reliability of manufacturer administration procedure.• The option ”Behaviour if file limit is reached” now deletes files when there is low storage space.
Version 2.0.9 (2021-07-08)
• Reconnect to AmmonitConnect more quickly when settings are changed.• Show live data in the configured time zone in the web interface, not in UTC.• Update settings immediately when changed on the display.• Restore ability to set the clock pin for digital channels on the display.• Add modem signal quality graphic to display.• Smoother page transitions on the display.• New EKO MS-80 S over RS485.• New EKO MS-90+ over RS485 (C-Box).• New Kintech Geovane over RS485.• Fix Lufft WS 600 implementation.• Fix DustIQ with temperature implementation.• Fix EKO MS-80 S 4-20 mA.
Version 2.0.8 (2021-06-14)
• New DustIQ with temperature measurement.• New Lufft WS 600.• New EKO MS-80 S analog.• New Generic Voltage Wind Vane with slope and offset input fields.• New Thies FCA X - Counter.• Fix Lufft WS 502 implementation.• Fix generate new CSV file after configuration change.• Show additional sensor details in the web interface.• Record config file uploads in the logbook.• Add connectivity timeout to file sending actions.• Ensure username/ password completion prompts only appear where necessary in the web interface.• Indicate table sorting in the web interface.
Version 2.0.7 (2021-05-20)
• Fix issue where incomplete attachments were sent via EMail. Only attachments from EMails sent directly fromthe data logger are affected. Remote Copy, AmmonitOR upload, EMails from AmmonitOR and USB Copy are notaffected.
© 2011 — 2021 Ammonit Measurement GmbH 231

Version 2.0.6 (2021-05-20)
• Fix secondary CSV files statistics interval.• Fix problem generating CSV files if RS485 sensors configured.• Respect display user permissions.• Data snapshots sent to AmmonitOR now display correctly.• Represent data values on the display and in the UI with the same precision as in the data files.• Add ”Minimal offset for automatic time adjustments” field to System Administration page, so that small time adjust-
ments can be ignored.• New Kintech Geovane analog connection.• Fix visualise Data Live menu if an RS485 sensor is not answering.• Fix endianness for Galltec Thermo-Hygro KPC MS
Version 2.0.5 (2021-03-24)
• GPS dongle is supported again.• Fix Analog Current AC1 channel missing for Meteo-40S Plus statistics files. Please re-generate affected files after
upgrade. Meteo-40M Plus and Meteo-40L Plus are not affected.• Enable changing CECS Power Mode on the display between Always On and When Needed.• Ensure the display stays on when in use.• Use more descriptive modem names on the display.• Show modem signal quality and operator name in the web interface.• Add page to check connection to AmmonitConnect and AmmonitOR on the display.• Speed improvements in the Web Interface.• Fix combination of ”Connect to internet via USB modem only” checkbox and Static IP.• Apply correct netmask with Static IP.• New Wildlife Acoustics SM4BAT FS in Sensor Helper.
Version 2.0.4 (2021-02-16)
• Add option to store live data in SCADA holding registers.• Report current LAN and Modem status more reliably on the display.• Show state more reliably on the Switches page.• Fix rounding error related to negative integers in the web interface and CSV files.
Version 2.0.3 (2021-02-01)
• Add required modbus unit id for SCADA Modbus TCP server.• Add SCADA holding registers to set date/time and switches state.• Fix graphical issue below footer affecting Chrome 87+.• Improve responsiveness of modem, sensor and evaluation configuration pages.• Add option to enable server SSL/TLS certificate verification when sending e-mails.• Send e-mails more reliably with certain configurations.• Sort evaluations correctly and always show their values on the display.• Fix display digital channels.• Improve display modem page stability and show signal quality.• Fix display IP subnet mask representation.• Show more decimal values for measurements on the display.• Fix decimal values being accepted in certain fields (such as ”Installation height”).• Improve responsiveness of the Switches page.
232 © 2011 — 2021 Ammonit Measurement GmbH

Data Logger Meteo-40 Plus User’s Manual 233 / 246
Version 2.0.2 (2020-12-15)
• Fix placeholder notification text and automatic status updates on the Modem configuration page.• Fix missing rows from manual full-day source data downloads.• Fix ordering of messages in the logbook related to CECS start-up.
Version 2.0.1 (2020-11-26)
• Fix RS485 sensors measurement data excluded from CSV files.
NoteIf there exist older CSV files without measurement data for RS485 sensors, they must be removed andregenerated with the new version.
• Fix selected statistics reverting to the default when a sensor is reconfigured in the UI.• Only show five decimal values in the UI.• Fix ”Good-bye” message shown on display while booting.• Fix driver problem with RS485 S/M (SCADA).• Chinese translation completed.• Only send configuration file if the config was changed.• Some missing communication menus added to the display.• Fix tertiary statistics generation.• Fix download statistics CSV files as ZIP.
Version 2.0.0 (2020-10-30)
• More modems are supported, esp. with support for LTE (4G): PLS8-E, MC89LTE, FX30S, and GL7600.• TLS 1.1, 1.2, and 1.3 are supported now, which makes Meteo-40 plus compatible with more web browsers and more
SMTP servers.• User management has been added to the web interface: Admin user can create new users or delete them. Prede-
fined users can be deleted.• The tunnel has been replaced with AmmonitConnect. The new URL is https://<serialnumber>.connect.ammonit.com/.• The SCADA Meteo-32 stream protocol is not supported anymore.• Fetching of historical data over SCADA is not supported anymore.• Holding registers are not yet supported for SCADA.• Modbus RTU and TCP are much faster now.• Remote Copy supports FTPS now.
Known Problems
Although Meteo-40 plus has been released for measurement campaigns, errors can occur. Please find below a list ofknown problems. We will fix the problems as soon as possible.
• Summary values not available for SCADA• Wi-Fi stick TL-WN321G does not work• Chinese translation is still incomplete
Older releases
For older release notes from version 1.0(2011) to 1.7.x(2020), please refer to Data Logger Meteo-40 User’s Manual.
© 2011 — 2021 Ammonit Measurement GmbH 233

234 © 2011 — 2021 Ammonit Measurement GmbH

Data Logger Meteo-40 Plus User’s Manual 235 / 246
GNU General Public License
Preamble
The licenses for most software are designed to take away your freedom to share and change it. By contrast, theGNU General Public License is intended to guarantee your freedom to share and change free software - to make surethe software is free for all its users. This General Public License applies to most of the Free Software Foundation’ssoftware and to any other program whose authors commit to using it. (Some other Free Software Foundation softwareis covered by the GNU Library General Public License instead.) You can apply it to your programs, too.
When we speak of free software, we are referring to freedom, not price. Our General Public Licenses are designedto make sure that you have the freedom to distribute copies of free software (and charge for this service if you wish),that you receive source code or can get it if you want it, that you can change the software or use pieces of it in newfree programs; and that you know you can do these things.
To protect your rights, we need to make restrictions that forbid anyone to deny you these rights or to ask you to surrenderthe rights. These restrictions translate to certain responsibilities for you if you distribute copies of the software, or ifyou modify it.
For example, if you distribute copies of such a program, whether gratis or for a fee, you must give the recipients allthe rights that you have. You must make sure that they, too, receive or can get the source code. And you must showthem these terms so they know their rights.
We protect your rights with two steps:
1. copyright the software, and
2. offer you this license which gives you legal permission to copy, distribute and/or modify the software.
Also, for each author’s protection and ours, we want to make certain that everyone understands that there is nowarranty for this free software. If the software is modified by someone else and passed on, we want its recipients toknow that what they have is not the original, so that any problems introduced by others will not reflect on the originalauthors’ reputations.
Finally, any free program is threatened constantly by software patents. We wish to avoid the danger that redistributorsof a free program will individually obtain patent licenses, in effect making the program proprietary. To prevent this, wehave made it clear that any patent must be licensed for everyone’s free use or not licensed at all.
The precise terms and conditions for copying, distribution and modification follow.
TERMS AND CONDITIONS FOR COPYING, DISTRIBUTION AND MOD-IFICATION
Section 0
This License applies to any program or other work which contains a notice placed by the copyright holder saying itmay be distributed under the terms of this General Public License. The “Program”, below, refers to any such programor work, and a “work based on the Program” means either the Program or any derivative work under copyright law:that is to say, a work containing the Program or a portion of it, either verbatim or with modifications and/or translated
© 2011 — 2021 Ammonit Measurement GmbH 235

into another language. (Hereinafter, translation is included without limitation in the term “modification”.) Each licenseeis addressed as “you”.
Activities other than copying, distribution and modification are not covered by this License; they are outside its scope.The act of running the Program is not restricted, and the output from the Program is covered only if its contentsconstitute a work based on the Program (independent of having been made by running the Program). Whether that istrue depends on what the Program does.
Section 1
You may copy and distribute verbatim copies of the Program’s source code as you receive it, in any medium, providedthat you conspicuously and appropriately publish on each copy an appropriate copyright notice and disclaimer ofwarranty; keep intact all the notices that refer to this License and to the absence of any warranty; and give any otherrecipients of the Program a copy of this License along with the Program.
You may charge a fee for the physical act of transferring a copy, and you may at your option offer warranty protectionin exchange for a fee.
Section 2
You may modify your copy or copies of the Program or any portion of it, thus forming a work based on the Program,and copy and distribute such modifications or work under the terms of Section 1 above, provided that you also meetall of these conditions:
a. You must cause the modified files to carry prominent notices stating that you changed the files and the date ofany change.
b. You must cause any work that you distribute or publish, that in whole or in part contains or is derived from theProgram or any part thereof, to be licensed as a whole at no charge to all third parties under the terms of thisLicense.
c. If the modified program normally reads commands interactively when run, you must cause it, when startedrunning for such interactive use in the most ordinary way, to print or display an announcement including anappropriate copyright notice and a notice that there is no warranty (or else, saying that you provide a warranty)and that users may redistribute the program under these conditions, and telling the user how to view a copy ofthis License. (Exception: If the Program itself is interactive but does not normally print such an announcement,your work based on the Program is not required to print an announcement.)
These requirements apply to the modified work as a whole. If identifiable sections of that work are not derived fromthe Program, and can be reasonably considered independent and separate works in themselves, then this License,and its terms, do not apply to those sections when you distribute them as separate works. But when you distribute thesame sections as part of a whole which is a work based on the Program, the distribution of the whole must be on theterms of this License, whose permissions for other licensees extend to the entire whole, and thus to each and everypart regardless of who wrote it.
Thus, it is not the intent of this section to claim rights or contest your rights to work written entirely by you; rather, theintent is to exercise the right to control the distribution of derivative or collective works based on the Program.
In addition, mere aggregation of another work not based on the Program with the Program (or with a work based onthe Program) on a volume of a storage or distribution medium does not bring the other work under the scope of thisLicense.
Section 3
You may copy and distribute the Program (or a work based on it, under Section 2 in object code or executable formunder the terms of Sections 1 and 2 above provided that you also do one of the following:
a. Accompany it with the complete corresponding machine-readable source code, which must be distributed underthe terms of Sections 1 and 2 above on a medium customarily used for software interchange; or,
236 © 2011 — 2021 Ammonit Measurement GmbH

Data Logger Meteo-40 Plus User’s Manual 237 / 246
b. Accompany it with a written offer, valid for at least three years, to give any third party, for a charge no more thanyour cost of physically performing source distribution, a complete machine-readable copy of the correspondingsource code, to be distributed under the terms of Sections 1 and 2 above on a medium customarily used forsoftware interchange; or,
c. Accompany it with the information you received as to the offer to distribute corresponding source code. (Thisalternative is allowed only for noncommercial distribution and only if you received the program in object code orexecutable form with such an offer, in accord with Subsection b above.)
The source code for a work means the preferred form of the work for making modifications to it. For an executablework, complete source code means all the source code for all modules it contains, plus any associated interfacedefinition files, plus the scripts used to control compilation and installation of the executable. However, as a specialexception, the source code distributed need not include anything that is normally distributed (in either source or binaryform) with the major components (compiler, kernel, and so on) of the operating system on which the executable runs,unless that component itself accompanies the executable.
If distribution of executable or object code is made by offering access to copy from a designated place, then offeringequivalent access to copy the source code from the same place counts as distribution of the source code, even thoughthird parties are not compelled to copy the source along with the object code.
Section 4
You may not copy, modify, sublicense, or distribute the Program except as expressly provided under this License. Anyattempt otherwise to copy, modify, sublicense or distribute the Program is void, and will automatically terminate yourrights under this License. However, parties who have received copies, or rights, from you under this License will nothave their licenses terminated so long as such parties remain in full compliance.
Section 5
You are not required to accept this License, since you have not signed it. However, nothing else grants you permissionto modify or distribute the Program or its derivative works. These actions are prohibited by law if you do not accept thisLicense. Therefore, by modifying or distributing the Program (or any work based on the Program), you indicate youracceptance of this License to do so, and all its terms and conditions for copying, distributing or modifying the Programor works based on it.
Section 6
Each time you redistribute the Program (or any work based on the Program), the recipient automatically receives alicense from the original licensor to copy, distribute or modify the Program subject to these terms and conditions. Youmay not impose any further restrictions on the recipients’ exercise of the rights granted herein. You are not responsiblefor enforcing compliance by third parties to this License.
Section 7
If, as a consequence of a court judgment or allegation of patent infringement or for any other reason (not limited topatent issues), conditions are imposed on you (whether by court order, agreement or otherwise) that contradict theconditions of this License, they do not excuse you from the conditions of this License. If you cannot distribute so as tosatisfy simultaneously your obligations under this License and any other pertinent obligations, then as a consequenceyou may not distribute the Program at all. For example, if a patent license would not permit royalty-free redistributionof the Program by all those who receive copies directly or indirectly through you, then the only way you could satisfyboth it and this License would be to refrain entirely from distribution of the Program.
If any portion of this section is held invalid or unenforceable under any particular circumstance, the balance of thesection is intended to apply and the section as a whole is intended to apply in other circumstances.
It is not the purpose of this section to induce you to infringe any patents or other property right claims or to contestvalidity of any such claims; this section has the sole purpose of protecting the integrity of the free software distributionsystem, which is implemented by public license practices. Many people have made generous contributions to the wide
© 2011 — 2021 Ammonit Measurement GmbH 237

range of software distributed through that system in reliance on consistent application of that system; it is up to theauthor/donor to decide if he or she is willing to distribute software through any other system and a licensee cannotimpose that choice.
This section is intended to make thoroughly clear what is believed to be a consequence of the rest of this License.
Section 8
If the distribution and/or use of the Program is restricted in certain countries either by patents or by copyrighted in-terfaces, the original copyright holder who places the Program under this License may add an explicit geographicaldistribution limitation excluding those countries, so that distribution is permitted only in or among countries not thusexcluded. In such case, this License incorporates the limitation as if written in the body of this License.
Section 9
The Free Software Foundation may publish revised and/or new versions of the General Public License from time totime. Such new versions will be similar in spirit to the present version, but may differ in detail to address new problemsor concerns.
Each version is given a distinguishing version number. If the Program specifies a version number of this License whichapplies to it and “any later version”, you have the option of following the terms and conditions either of that version orof any later version published by the Free Software Foundation. If the Program does not specify a version number ofthis License, you may choose any version ever published by the Free Software Foundation.
Section 10
If you wish to incorporate parts of the Program into other free programs whose distribution conditions are different,write to the author to ask for permission. For software which is copyrighted by the Free Software Foundation, write tothe Free Software Foundation; we sometimes make exceptions for this. Our decision will be guided by the two goalsof preserving the free status of all derivatives of our free software and of promoting the sharing and reuse of softwaregenerally.
NO WARRANTY Section 11
BECAUSE THE PROGRAM IS LICENSED FREE OF CHARGE, THERE IS NO WARRANTY FOR THE PROGRAM,TO THE EXTENT PERMITTED BY APPLICABLE LAW. EXCEPT WHEN OTHERWISE STATED IN WRITING THECOPYRIGHT HOLDERS AND/OR OTHER PARTIES PROVIDE THE PROGRAM “AS IS” WITHOUT WARRANTY OFANY KIND, EITHER EXPRESSED OR IMPLIED, INCLUDING, BUT NOT LIMITED TO, THE IMPLIED WARRANTIESOF MERCHANTABILITY AND FITNESS FOR A PARTICULAR PURPOSE. THE ENTIRE RISK AS TO THE QUALITYAND PERFORMANCE OF THE PROGRAM IS WITH YOU. SHOULD THE PROGRAM PROVE DEFECTIVE, YOUASSUME THE COST OF ALL NECESSARY SERVICING, REPAIR OR CORRECTION.
Section 12
IN NO EVENT UNLESS REQUIRED BY APPLICABLE LAW OR AGREED TO IN WRITING WILL ANY COPYRIGHTHOLDER, OR ANY OTHER PARTY WHO MAY MODIFY AND/OR REDISTRIBUTE THE PROGRAM AS PERMITTEDABOVE, BE LIABLE TO YOU FOR DAMAGES, INCLUDING ANY GENERAL, SPECIAL, INCIDENTAL OR CONSE-QUENTIAL DAMAGES ARISING OUT OF THE USE OR INABILITY TO USE THE PROGRAM (INCLUDING BUTNOT LIMITED TO LOSS OF DATA OR DATA BEING RENDERED INACCURATE OR LOSSES SUSTAINED BY YOUOR THIRD PARTIES OR A FAILURE OF THE PROGRAM TO OPERATE WITH ANY OTHER PROGRAMS), EVENIF SUCH HOLDER OR OTHER PARTY HAS BEEN ADVISED OF THE POSSIBILITY OF SUCH DAMAGES.
END OF TERMS AND CONDITIONS
238 © 2011 — 2021 Ammonit Measurement GmbH

Data Logger Meteo-40 Plus User’s Manual 239 / 246
How to Apply These Terms to Your New Programs
If you develop a new program, and you want it to be of the greatest possible use to the public, the best way to achievethis is to make it free software which everyone can redistribute and change under these terms.
To do so, attach the following notices to the program. It is safest to attach them to the start of each source file to mosteffectively convey the exclusion of warranty; and each file should have at least the “copyright” line and a pointer towhere the full notice is found.
<one line to give the program’s name and a brief idea of what it does.> Copyright (C) <year> <name of author>
This program is free software; you can redistribute it and/or modify it under the terms of the GNU General PublicLicense as published by the Free Software Foundation; either version 2 of the License, or (at your option) any laterversion.
This program is distributed in the hope that it will be useful, but WITHOUT ANY WARRANTY; without even the impliedwarranty of MERCHANTABILITY or FITNESS FOR A PARTICULAR PURPOSE. See the GNU General Public Licensefor more details.
You should have received a copy of the GNU General Public License along with this program; if not, write to the FreeSoftware Foundation, Inc., 51 Franklin Street, Fifth Floor, Boston, MA 02110-1301 USA
Also add information on how to contact you by electronic and paper mail.
If the program is interactive, make it output a short notice like this when it starts in an interactive mode:
Gnomovision version 69, Copyright (C) year name of author Gnomovision comes with ABSOLUTELY NO WARRANTY;for details type “show w”. This is free software, and you are welcome to redistribute it under certain conditions; type“show c” for details.
The hypothetical commands “show w” and “show c” should show the appropriate parts of the General Public License.Of course, the commands you use may be called something other than “show w” and “show c”; they could even bemouse-clicks or menu items--whatever suits your program.
You should also get your employer (if you work as a programmer) or your school, if any, to sign a “copyright disclaimer”for the program, if necessary. Here is a sample; alter the names:
Yoyodyne, Inc., hereby disclaims all copyright interest in the program “Gnomovision”(which makes passes at compil-ers) written by James Hacker.
<signature of Ty Coon>, 1 April 1989 Ty Coon, President of Vice
This General Public License does not permit incorporating your program into proprietary programs. If your program isa subroutine library, you may consider it more useful to permit linking proprietary applications with the library. If this iswhat you want to do, use the GNU Library General Public License instead of this License.
© 2011 — 2021 Ammonit Measurement GmbH 239

240 © 2011 — 2021 Ammonit Measurement GmbH

Data Logger Meteo-40 Plus User’s Manual 241 / 246
Chapter 17
Glossary
APNAccess Point Name
CDMACode Division Multiple Access
CECSConfiguration, Evaluation, and Communication System
CPVConcentrated Photovoltaics
CSPConcentrated Solar Power
CSVComma Separated Values
DHCPDynamic Host Configuration Protocol
DHIDiffuse Horizontal Irradiation
DNIDirect Normal Irradiation
DNSDomain Name System
FTPFile Transfer Protocol
FTPSFTP Secure (using TLS/SSL)
GHIGlobal Horizontal Irradiation
GISGeographic Information System
GNUGNU’s Not Unix
GnuPGGNU Privacy Guard
GPLGeneral Public License
© 2011 — 2021 Ammonit Measurement GmbH 241

GPRSGeneral Packet Radio Service
GPSGlobal Positioning System
GSMGlobal System for Mobile communications
GTIGlobal Tilted Irradiation
HTTPHyperText Transfer Protocol
HTTPSHTTP Secure
IEEEInstitute of Electrical and Electronics Engineers
IPInternet Protocol
JIDJabber Id, an XMPP address
LANLocal Area Network
LCDLiquid Crystal Display
LEDLight-emitting diode
LGPLLesser General Public License
MARSMeasurement And Recording System
NTPNetwork Time Protocol
OVPOvervoltage Protection
PINPersonal Identification Number
POAPlane of Array
POTPotentiometer - Measurement principle, e.g., Wind vane POT
PPPPoint-to-point protocol
PUKPIN Unlock Key (or Personal Unblocking Code, PUC)
PVPhotovoltaic
RNDISRemote Network Driver Interface Specification
SCADASupervisory Control and Data Acquisition
SCPSecure Copy Protocol/Program (using SSH)
242 © 2011 — 2021 Ammonit Measurement GmbH

Data Logger Meteo-40 Plus User’s Manual 243 / 246
SFTP
Secure FTP (using SSH)
SIM
Subscriber Identity Module
SMS
Short Message Service
SMSC
Short Message Service Center
SSH
Secure Shell
SSL
Secure Sockets Layer
TCP/IP
Transmission Control Protocol/Internet Protocol
TLS
Transport Layer Security
TMR
Tunnel Magneto Resistance - Measurement principle, e.g. Wind vane TMR
UMTS
Universal Mobile Telecommunications System
USB
Universal Serial Bus
W-LAN
Wireless Local Area Network
WMO
World Meteorological Organization
XMPP
Extensible Messaging and Presence Protocol (originally named Jabber)
© 2011 — 2021 Ammonit Measurement GmbH 243

Chapter 18
Index
AAccess Point Name, 115Access Rights, 25, 137
Admin, 25Guest, 25User, 25Viewer, 25
Accessing Meteo-40 plusEthernet, 9, 15LAN, 9, 13USB, 9, 20
Addition, 61Admin, 25AES, 217Air density evaluation, 61Albedo, 62AmmonitConnect, 91AmmonitOR, 87, 91, 95Ampere meter, 62Analog Current, 187Analog Voltage, 183Anemometers, 54, 148APN, 115
BBarometric Pressure Sensors, 162BGAN, 124, 125Bonjour Print Services, 12
CCamera, 46Cascading, 134CECS, 4, 6, 31, 127, 139Change Passwords, 31Channels, 59
Analog Current, 139, 187Analog Voltage, 139Counter, 139, 184Digital, 139, 185Period Measurement, 184RS485, 188Status, 139, 185
CommunicationEthernet, 9, 15, 142LAN, 9, 13, 87, 142Modem, 87, 115, 142Satellite Modem, 87, 115, 124
Recommended Settings, 125USB, 9, 20, 87, 142W-LAN, 87, 114, 142
Communication Configuration, 89Communication Methods, 7Communication Schedule, 89Configuration
Access Point Name, 118Email Parameters, 98LAN, 113Modem, 115Online Access, 91W-LAN, 114
Configuration File, 29Download, 29Format, 29Upload, 29
Configuration Status, 26Connection Plans, 199Connection Status, 26Cookie, 15, 23Counter Channels, 184Cryptographic Software, 217CSV File, 68, 75, 79, 80
DData Evaluation, 60, 67Data Logger Name, 31Data Retrieval
LAN, 7Modbus RTU, 7Modbus TCP/IP, 7Modem, 7USB, 7W-LAN, 7
Data Storage, 6Data Transmission, 87Debian, 24Delete Measurement Data, 31, 38DHCP, 9, 13, 15, 113Differential temperature evaluation, 62Diffuse solar irradiance, 65Digital Channels, 185Digital Wind Vanes, 152, 154Display, 42, 137Division, 63Driver, 20
244 © 2011 — 2021 Ammonit Measurement GmbH

Data Logger Meteo-40 Plus User’s Manual 245 / 246
Dynamic IP Address, 91, 113, 115, 118
EElectrical Characteristics, 192Email, 87, 98Email Attachments, 98Encryption, 217
Force Encryption, 36Error List, 138Ethernet, 142Evaluation, 60
FFactory Reset, 31, 38FAQ, 221File Interval, 68, 70File Upload, 87
FTP, 110SCP, 110SFTP, 110
FileZillaFTP server, 113
FTP, 87, 110active mode, 111passive mode, 111
FXT009, 121
GGeneric Modbus RTU sensors, 179Generic Sensors
Modbus RTU, 179Gill Ultrasonic Sensors, 157Global Control Elements, 26GnuPG, 101, 217GPS, 31Guest, 25Gust Data, 74
HHTTPS, 217Humidity Sensors, 160
IIEEE 754, 132Import CSV Files, 79, 80Inflow angle evaluation, 63INI File, 29Ini File, 75Input Channels, 2Internet Explorer, iiIP Address, 113, 142
JJavaScript, 15
LLAN, 7, 13, 87, 113, 142Laser Precipitation Monitors, 170LED Lights, 138LibreOffice Calc, 79Linear equation, 63link-local, 15Linux, ii, 4, 24
Live Data, 67Location, 31Logbook, 51Login, 25Lufft Ultrasonic Sensors, 157
MMaintenance, 219MARS, 4Measurement Values, 59Memory, 2, 138Menu
Display, 138Web Interface, 28
Microsoft Excel 2010, 80, 85Modbus, 130Modbus Register Map, 130Modbus RTU, 7, 127Modbus TCP/IP, 7, 127Modem, 7, 87, 115, 139, 142, 199
FXT009, 121Mozilla Firefox, ii, 13, 23Multiplication, 63
NNTP Server, 31
OObukhov length evaluation, 64Obukhov stability parameter evaluation, 64Online Period, 91OpenOffice Calc, 79OpenPGP, 35, 101, 217OpenSSL, 217Output Channels, 2Overvoltage Protection, 219
PPeriod Measurement, 184Photos, 98Point-to-Point Ethernet Connection, 15POP Server, 98Potentiometric Wind Vanes, 153Power Meters
RS485 Sensors, 171Power Supply, 2Precipitation Sensors, 169, 170Provider Helper, 118Pyranometers, 55, 163
RRain Gauge, 169Recording, 26, 54, 139Register Map, 127Release Notes, 229Research Applications, 148Restart Data Logger, 38RNDIS USB Driver, 20Rotating Shadowband Irradiometer, 168RS485, 188
Wind Vanes, 154, 155RS485 Master Serial Console, 57
© 2011 — 2021 Ammonit Measurement GmbH 245

RS485 S, 127RSA, 217
SSCADA, 6, 7, 127
Configuration, 127SCP, 87, 110, 217Security
Force Encryption, 36Sensible heat flux evaluation, 64Sensitivity, 163Sensor Configuration, 53Sensor Helper, 55Sensor Settings, 55, 57Sensors
Anemometers, 54, 148Barometric Pressure Sensors, 162Humidity Sensors, 160Modbus RTU Sensors, 179Precipitation Sensors, 169, 170Pyranometers, 163, 165Research Applications, 148Rotating Shadowband Irradiometer, 168RS485 Sensors, 171SG1000 Lightning Detector, 173Soil Water Content, EC and Temperatur sensors,
174Soiling Measurement, 175Solar Trackers, 168Song Meter SM3BAT/SM4BAT, 172Temperature Sensors, 160Ultrasonic Sensors, 156, 157Wind Vanes, 54, 152, 153ZephIR 300, 171
SFTP, 87, 110SG1000 Lightning Detector, 173SHA, 217Sierra Wireless, 121SIM Card, 91, 121Sineax CAM Measuring Unit, 171SMTP Server, 98Soil Water Content, EC and Temperature sensors, 174Soiling Measurement, 175Solar Trackers, 168Solar zenith angle, 65Song Meter SM3BAT/SM4BAT, 172Source Data, 85SSH, 217Static IP Address, 91, 113–115, 120Statistics, 68
Configuration, 68Statistics Interval, 68, 70Status (Channel), 185Status Box, 26, 139Storage Size, 2, 138Subdomain, 91Switch, 48
Configuration, 48Switch Manager, 48
Switch Manager, 48Switches, 189System
CECS, 4, 127MARS, 4
System Administration, 31System Information, 29
TTechnical Data, 191Temperature Humidity Sensors, 160Temperature Sensors, 160Tethering, 7Thies Ultrasonic Sensors, 156Total apparent power, 65Tunnel, 87Tunnel Server, 91Turbulence intensity, 64
UUbuntu, 24Ultrasonics, 188
Gill Sensors, 157Lufft Sensors, 157Thies Sensors, 156
Upgrade Data Logger Software, 38USB, 7, 20, 87, 142USB Flash Drive, 43User, 25User Interface, 6
VViewer, 25
WW-LAN, 7, 87, 114, 142Web Interface Menu, 28Webcam, 46WiFi, 114Wind Vanes, 54, 152, 153
Digital, 152, 154Potentiometer, 153RS485, 154, 155TMR, 152
Windows, ii, 12, 15, 20
ZZephIR 300, 171
246 © 2011 — 2021 Ammonit Measurement GmbH