Dark energy and dark matter haloes
16
arXiv:astro-ph/0402210v2 23 Nov 2004 Mon. Not. R. Astron. Soc. 000, 1–16 (2004) Printed 2 February 2008 (MN L A T E X style file v2.2) Dark Energy and Dark Matter Haloes Michael Kuhlen 1 , Louis E. Strigari 2 , Andrew R. Zentner 3,4 , James S. Bullock 5⋆ and Joel R. Primack 6 1 Department of Astronomy and Astrophysics, University of California at Santa Cruz, 1156 High Street, Santa Cruz, CA 95064 2 Department of Physics, The Ohio State University, 174 W. 18th Avenue, Columbus, OH 43210 3 Center for Cosmological Physics, The University of Chicago, 5640 S. Ellis Avenue, Chicago, IL 60637 4 Department of Astronomy and Astrophysics, The University of Chicago, 5640 S. Ellis Avenue, Chicago, IL 60637 5 Harvard-Smithsonian Center for Astrophysics, 60 Garden Street, Cambridge, MA 02138 6 Physics Department, University of California at Santa Cruz, 1156 High Street, CA 95064 Submitted 2004 April 05 ABSTRACT We investigate the effect of dark energy on the density profiles of dark matter haloes with a suite of cosmological N-body simulations and use our results to test analytic models. We consider constant equation of state models, and allow both w ≥−1 and w< −1. Using five simulations with w ranging from −1.5 to −0.5, and with more than ∼ 1600 well-resolved haloes each, we show that the halo concentration model of Bullock et al. (2001) accurately predicts the median concentrations of haloes over the range of w, halo masses, and redshifts that we are capable of probing. We find that the Bullock et al. (2001) model works best when halo masses and concentrations are defined relative to an outer radius set by a cosmology-dependent virial overdensity. For a fixed power spectrum normalization and fixed-mass haloes, larger values of w lead to higher concentrations and higher halo central densities, both because collapse occurs earlier and because haloes have higher virial densities. While precise predictions of halo densities are quite sensitive to various uncertainties, we make broad comparisons to galaxy rotation curve data. At fixed power spectrum normalization (fixed σ 8 ), w> −1 quintessence models seem to exacerbate the central density problem relative to the standard w = −1 model. For example, models with w ≃−0.5 seem disfavored by the data, which can be matched only by allowing extremely low normalizations, σ 8 < ∼ 0.6. Meanwhile w< −1 models help to reduce the apparent discrepancy. We confirm that the Jenkins et al. (2001) halo mass function provides an excellent approximation to the abundance of haloes in our simulations and extend its region of validity to include models with w< −1. Key words: cosmology: theory – dark matter – large-scale structure of universe – methods: N-body simulations 1 INTRODUCTION In the prevailing model of galaxy formation, galaxies assem- ble and evolve in the potential wells established by gravita- tionally bound haloes of cold and collisionless dark matter (CDM). Except for some possible difficulties on small scales, the CDM model is remarkably successful in explaining a large number of observations. However, this success requires an additional “dark energy” component, that drives an ac- celerated cosmic expansion, to be added to the universal energy budget. While the presence of dark energy is firmly established observationally, measuring its equation of state ⋆ Hubble Fellow as well as developing a theoretical understanding of the na- ture of the dark energy are two of the biggest outstanding problems in cosmology today. Dark energy not only affects the large-scale evolution of the Universe, but also the col- lapse histories and density structures of dark matter haloes. Understanding the precise nature of these effects is impor- tant for studies that aim to quantify the nature of dark en- ergy using strong (e.g., Sarbu, Rusin, & Ma 2001; Huterer & Ma 2004; Kuhlen, Keeton, & Madau 2004) and weak (e.g. Hu & Jain 2003; Bartelmann et al. 2002) gravitational lensing. Changing the dark energy model should similarly change expectations for galaxy rotation curves, and could affect one of the main small-scale problems facing CDM – the central density problem (e.g., Zentner & Bullock 2002; McGaugh, Barker, & de Blok 2003, and references therein).
Transcript of Dark energy and dark matter haloes

arX
iv:a
stro
-ph/
0402
210v
2 2
3 N
ov 2
004
Mon. Not. R. Astron. Soc. 000, 1–16 (2004) Printed 2 February 2008 (MN LATEX style file v2.2)
Dark Energy and Dark Matter Haloes
Michael Kuhlen1, Louis E. Strigari2, Andrew R. Zentner3,4, James S. Bullock5⋆
and Joel R. Primack61Department of Astronomy and Astrophysics, University of California at Santa Cruz, 1156 High Street, Santa Cruz, CA 950642Department of Physics, The Ohio State University, 174 W. 18th Avenue, Columbus, OH 432103Center for Cosmological Physics, The University of Chicago, 5640 S. Ellis Avenue, Chicago, IL 606374Department of Astronomy and Astrophysics, The University of Chicago, 5640 S. Ellis Avenue, Chicago, IL 606375Harvard-Smithsonian Center for Astrophysics, 60 Garden Street, Cambridge, MA 021386Physics Department, University of California at Santa Cruz, 1156 High Street, CA 95064
Submitted 2004 April 05
ABSTRACT
We investigate the effect of dark energy on the density profiles of dark matter haloeswith a suite of cosmological N-body simulations and use our results to test analyticmodels. We consider constant equation of state models, and allow both w ≥ −1 andw < −1. Using five simulations with w ranging from −1.5 to −0.5, and with morethan ∼ 1600 well-resolved haloes each, we show that the halo concentration model ofBullock et al. (2001) accurately predicts the median concentrations of haloes over therange of w, halo masses, and redshifts that we are capable of probing. We find thatthe Bullock et al. (2001) model works best when halo masses and concentrations aredefined relative to an outer radius set by a cosmology-dependent virial overdensity. Fora fixed power spectrum normalization and fixed-mass haloes, larger values of w lead tohigher concentrations and higher halo central densities, both because collapse occursearlier and because haloes have higher virial densities. While precise predictions of halodensities are quite sensitive to various uncertainties, we make broad comparisons togalaxy rotation curve data. At fixed power spectrum normalization (fixed σ8), w > −1quintessence models seem to exacerbate the central density problem relative to thestandard w = −1 model. For example, models with w ≃ −0.5 seem disfavored by thedata, which can be matched only by allowing extremely low normalizations, σ8
<∼
0.6.Meanwhile w < −1 models help to reduce the apparent discrepancy. We confirm thatthe Jenkins et al. (2001) halo mass function provides an excellent approximation tothe abundance of haloes in our simulations and extend its region of validity to includemodels with w < −1.
Key words: cosmology: theory – dark matter – large-scale structure of universe –methods: N-body simulations
1 INTRODUCTION
In the prevailing model of galaxy formation, galaxies assem-ble and evolve in the potential wells established by gravita-tionally bound haloes of cold and collisionless dark matter(CDM). Except for some possible difficulties on small scales,the CDM model is remarkably successful in explaining alarge number of observations. However, this success requiresan additional “dark energy” component, that drives an ac-celerated cosmic expansion, to be added to the universalenergy budget. While the presence of dark energy is firmlyestablished observationally, measuring its equation of state
⋆ Hubble Fellow
as well as developing a theoretical understanding of the na-ture of the dark energy are two of the biggest outstandingproblems in cosmology today. Dark energy not only affectsthe large-scale evolution of the Universe, but also the col-lapse histories and density structures of dark matter haloes.Understanding the precise nature of these effects is impor-tant for studies that aim to quantify the nature of dark en-ergy using strong (e.g., Sarbu, Rusin, & Ma 2001; Huterer& Ma 2004; Kuhlen, Keeton, & Madau 2004) and weak(e.g. Hu & Jain 2003; Bartelmann et al. 2002) gravitationallensing. Changing the dark energy model should similarlychange expectations for galaxy rotation curves, and couldaffect one of the main small-scale problems facing CDM –the central density problem (e.g., Zentner & Bullock 2002;McGaugh, Barker, & de Blok 2003, and references therein).

2 Kuhlen et al.
In the present paper, we use a suite of N-body simulations tostudy how halo density profiles change as a function of darkenergy equation of state, discuss our results in the context ofanalytic models, and discuss the observational implicationsof dark energy on galaxy scales.
The existence of some form of dark energy is supportedby a preponderance of data. Taken together, observations ofthe magnitude-redshift relation of type Ia supernovae (SNIa;Perlmutter et al. 1999; Riess et al. 2001; Knop et al. 2003;Barris et al. 2003), the power spectrum of cosmic microwavebackground (CMB) anisotropy (Spergel et al. 2003; Tegmarket al. 2003a), the power spectrum of galaxy clustering (Do-delson et al. 2003; Tegmark et al. 2003b), and the luminosityfunction and baryon fraction of clusters (Allen et al. 2003)provide nearly unimpeachable evidence for the existence ofdark energy. The most common supposition is that the darkenergy takes the form of a cosmological constant or vac-uum energy. In this case, the energy density ρ, and pressurep, are related through p = −ρ. An attractive alternativecandidate for the dark energy is the potential energy of aslowly-varying scalar field φ, or “quintessence” (e.g., Ratra& Peebles 1988; Caldwell, Dave, & Steinhardt 1998).
A convenient parametrization of the dark energy isthrough an equation of state w ≡ pφ/ρφ relating its en-ergy density and pressure. In general, the equation of stateparameter w is time-varying, but it is useful to modelquintessence with a constant equation of state parame-ter because current observational data sets have limitedpower to distinguish between a time-varying and constantequation of state (e.g., Kujat et al. 2002). Useful limitson the equation of state for the dark energy, assumingthat it remains constant in time, come from SNIa studies,−1.67 < w < −0.62 (2σ; Knop et al. 2003), and can berefined by combining SNIa data with CMB anisotropy andgalaxy clustering statistics yielding −1.33 < w < −0.79 at2σ (Tegmark et al. 2003b). For our simulations, we adoptan empirical view and study five models with constant w,that span a comparably large range of parameter space:w = −1.5,−1.25,−1.0,−0.75,−0.5.
Our theoretical understanding of halo profiles has im-proved recently largely through numerical simulations, per-formed in the context of CDM plus cosmological con-stant (ΛCDM) or standard CDM (SCDM, i.e. ΩM = 1,ΩQ = 0) cosmologies (Navarro, Frenk, & White, 1995, 1996,1997, hereafter NFW; Kravtsov, Klypin, & Khokhlov 1997;Ghigna et al. 1998; Jing 2000; Bullock et al. 2001; Eke,Navarro, & Steinmetz 2001; Wechsler et al. 2002, hereafterW02; Zhao et al. 2003; Hayashi et al. 2003; Navarro et al.2003; for a review, see Primack 2003). It is generally un-derstood that the final density profiles of haloes are linkedclosely to their formation histories. Halo central densitiesare set during an early, rapid-accretion phase, and tend tobe proportional to the density of haloes in the Universe atthe time of this rapid collapse (W02; Zhao et al. 2003; Tasit-siomi et al. 2003). Larger values of w lead to earlier collapsetimes and also to more rapid collapse of overdensities, thuswe expect haloes with higher relative central densities andhigher virial densities (see our discussions in § 2 and § 3).In §§ 4-6 we quantify these effects and test the expectedscalings. We verify that the analytic technique of Bullock etal. (2001, B01) for predicting halo concentrations works well
when applied directly to constant w cosmologies, implyingthat it is fairly generally applicable.
A related issue is the effect of dark energy on the halomass function. Although it is not directly observable, the-oretical insight into the expected halo mass function is at-tainable through current N-body simulations. The effectsof dark energy on halo mass functions have been investi-gated by Bartelmann, Perota, & Baccigalupi (2003), Linder& Jenkins (2003), Klypin et al. (2003), Maccio et al. (2003),and Lokas, Bode, & Hoffman (2003) and the accurate pre-diction of halo mass functions as well as accretion historiesand density structures over a large range of redshifts is nec-essary in order to take full advantage of the ability of up-coming cluster surveys, such as the Sunyaev-Zeldovich Array(http://astro.uchicago.edu/sza/), to constrain the dark en-ergy equation of state (see Carlstrom, Holder, & Reese 2001for a review). There appears to be general agreement thathalo mass functions can be approximated accurately by the“universal” mass function of Jenkins et al. (2001, hereafterJ01) even in models with dark energy. In § 5.1, we confirmthe results of previous studies of quintessence cosmologieswith w > −1, and extend this agreement to models withw < −1.
Klypin et al. (2003) and Dolag et al. (2003) haveperformed previous numerical studies of CDM haloes inquintessence cosmologies. Where our study overlaps withthese, our results are generally in agreement. This study ex-tends, complements, and improves upon previous studies inseveral ways. We have investigated the effects of normal-izing the power spectrum using clusters vs. CMB, whichyield quite different results. We have assembled large cata-logues of haloes, with masses and concentrations for morethan 1600 haloes with more than 100 particles each in eachsimulation. With this large number of haloes we are able tomeasure the distribution of concentrations at fixed mass andtest the predictions of the B01 model for both the mean re-lation between concentration and mass and the halo-to-haloscatter. We also extend the range of quintessence parameterspace probed by simulations by exploring two models withw < −1.
The format of this paper is as follows. After a briefreview of the basics of structure formation in models withdark energy in § 2, we go on in § 3 to describe modificationsto the B01 model for halo concentrations in quintessencecosmologies. In § 4, we describe the set of numerical sim-ulations that we performed. In § 5, we present the massfunctions and concentrations of CDM haloes in these simu-lations and compare them to the results of the analytic B01model. In § 6, we briefly discuss the central density prob-lem of CDM in light of our results. In § 7, we present asummary of our findings, highlight improvements and dif-ferences to previous studies, and discuss the implications ofthis work. Throughout this paper, we assume a flat universewith present matter density relative to critical of ΩM = 0.3,and Hubble parameter h = 0.7. The quintessence energydensity is then ΩQ = 1 − ΩM = 0.7. We refer to a modelwith a cosmological constant (w = −1) as ΛCDM. We usethe terms “quintessence” and “QCDM” to refer to all mod-els which have w 6= −1.

Dark Energy and Dark Matter Haloes 3
2 STRUCTURE FORMATION IN
QUINTESSENCE COSMOLOGIES
In this Section, we present a brief overview of the growth ofstructure in quintessence cosmologies. In §2.1, we introducethe basic results of cosmological perturbation theory withquintessence and discuss our computations of the matterpower spectrum. We briefly discuss the normalization of thepower spectrum in §2.2. A convenient way to define the massand radius of a dark matter halo is through a mean over-density ∆vir, relative to the background density (see §3.1).The idea is to choose ∆vir so as to delineate the boundarybetween virialized and in-falling material. The equivalentlinear overdensity at collapse δc, is a quantity that is usedto delineate the mass scale of objects that are forming ata particular redshift. Often, these overdensity criteria arechosen with reference to the evolution of a spherical tophatoverdensity. In §2.3, we discuss the spherical tophat modelin quintessence cosmologies.
We explore both conventional quintessence models withw ≥ −1 and, adopting an empirical approach, we pursuemodels with w < −1. Requiring the kinetic energy of thequintessence to be positive imposes the condition w ≥ −1on the quintessence equation of state. When w ≥ −1 andconstant, all computations can be performed knowing onlythe value of w by assuming that the scalar field Lagrangianhas a canonical kinetic term. To explore the parameter spacew < −1 self-consistently, we must choose a particular modelfor scalar field dynamics and one simple possibility is aLagrangian with a non-canonical kinetic term that differsfrom the canonical case by a negative sign. Explicitly, weadopt the “phantom energy” Lagrangian for the field, φ:L = −∂µφ∂µφ−V(φ) (Caldwell 2002; Carroll, Hoffmann, &Trodden 2003; Cline, Jeon, & Moore 2003). Having madethis choice, we can express the derivatives of the poten-tial completely in terms of w (Dave, Caldwell, & Steinhardt2002).
2.1 Cosmological Perturbations
Here we consider linear perturbations to the CDM densityfield, δ(~x) ≡ δρ(~x)/ρb, with ρb the mean density of darkmatter in the universe. The linear evolution of δ(~x) followsfrom solving the linearized Einstein-Boltzmann equations(e.g., Ma & Bertschinger 1995). We perform our calcula-tions in the synchronous gauge with a modified version ofthe publicly-available Einstein-Boltzmann code CMBfast bySeljak & Zaldarriaga (1996). We assume a scale-invariantspectrum of adiabatic primordial density fluctuations and abaryon density ΩBh2 = 0.02.
The linear equation for fluctuations in the quintessencefield in Fourier space is
δφ + 3H ˙δφ + (k2/a2 ± V,φφ )δφ = δk[(1 + wQ)ρφ]1/2, (1)
where V,φφ ≡ ∂2V/∂φ2, ρφ is the mean energy density in thequintessence field, and the plus (minus) signs correspond tofields with positive (negative) kinetic energy. Here the dotsrepresent derivatives with respect to cosmological propertime t, and δk is the linear CDM fluctuation in Fourier space.The power spectrum of linear density perturbations is de-fined as P (k) ≡ 〈|δk|
2〉. The CDM transfer functions for ourscale-invariant primordial spectrum are defined from
Figure 1. The ratio of z = 0 quintessence transfer functions toΛCDM for different models. The transfer functions are similar forwavenumbers k >
∼ 0.01 h Mpc−1. The different equation of stateparameters are shown in the legend.
P (k, z) = AQkT 2(k, z)D2(z)
D2(0), (2)
where AQ is the normalization and D(z) ≡ δ(z)/δ(0) is thelinear growth factor. On scales larger than the Comptonwavenumber, kQ ∼
√
V,φφ, δφ can grow and source the evo-lution of δk. Contrarily, on small scales k >
∼ kQ, perturba-tions in the quintessence field decay, so the QCDM transferfunctions have the same form as those of standard ΛCDM,while on scales k <
∼ kQ, the transfer functions reflect theclustering of φ (Ma, Caldwell, Bode, & Wang 1999). Fig-ure 1 shows the ratio of the CDM transfer functions withquintessence, TQ, to the transfer function in the correspond-ing ΛCDM model (w = −1), TΛ, at z = 0. For k <
∼ kQ andw ≥ −1, perturbations in the quintessence field, δρφ −3δpφ,source the growth of δk. For w ≤ −1, the source term fromthe quintessence field changes sign, resulting in a relativedecrease in δk.
2.2 Power Spectrum Normalization
One of the most important parameters determining the scaleradii of halo density profiles is the normalization of the mat-ter power spectrum on small scales. In our N-body exper-iments, we choose to normalize each w model with similarvalues of σ8, set by cluster abundance estimates. We do sobecause the abundance of clusters is a more direct probe ofthe amount of power on the scales that are relevant to galaxyformation than the CMB anisotropy measurements and inorder to isolate the differences that arise because of varia-tions in the expansion rate in models with different valuesof w.
We normalize the power spectrum to the abundanceof massive clusters using x-ray flux and temperature mea-surements from the cores of clusters of galaxies, and the

4 Kuhlen et al.
corresponding conversion to cluster mass from the mass-temperature (M -T ) relation. With all other cosmologicalparameters fixed, a comparison of the observed mass func-tion to the predicted mass functions from N-body simula-tions (J01) determines the normalization parameter σ8. Thequintessence field is smooth on scales much smaller than thehorizon size, thus the values of σ8 derived from z = 0 clustermeasurements are rather insensitive to w.
The largest source of error in the determination of σ8
from clusters is the uncertainty in the normalization of theM -T relation. Simulations consistently predict an M -T re-lation that is a factor of ∼ 2 greater than the one observedfrom x-ray temperature data (e.g., Seljak 2002 and refer-ences therein). For ΛCDM and ΩM = 0.3, our current un-derstanding of the M -T relation places σ8 very broadly inthe range 0.65 <
∼ σ8 <∼ 1.1 (Pierpaoli, Scott, & White 2001;
Reiprich & Bohringer 2002; Pierpaoli et al. 2003). Using theHIFLUGCS cluster mass function (Reiprich & Bohringer2002), we find for ΩM = 0.3, σ8 ≃ 0.74, nearly indepen-dently of w (Kuhlen, Keeton, & Madau 2004). We normalizethe power spectra to σ8 = 0.742, 0.740, 0.738, 0.736, 0.734 forw = −1.5,−1.25,−1.0,−0.75,−0.50 respectively. In princi-ple, the value of σ8 as determined from clusters is degeneratewith ΩM (e.g. Schuecker et al. 2003), indeed the global bestfit to the HILFUGUS sample is ΩM ≃ 0.12, σ8 ≃ 0.96 in aΛCDM cosmology; however, we adopt values of σ8 that bestfit the data given our choice of ΩM = 0.3.
While we have chosen to normalize our numerical sim-ulations using the cluster abundance, this normalization isfairly uncertain. In the interest of completeness, we remarkthat not all of these model normalizations are consistentwith n = 1 normalization to CMB anisotropy (even modulouncertainties in the reionization epoch). In the simplest case,with all other cosmological parameters held fixed, the valueof w affects the CMB-derived σ8 normalization primarilythrough the late-time integrated Sachs-Wolfe (ISW) effect(see Hu & Sugyiyama 1995). For universes with w ≥ −1,the quintessence energy density becomes comparable to thatof CDM at earlier epochs relative to ΛCDM, resulting ingreater variation in the gravitational potentials along linesof sight to the surface of last scattering. For lower values ofw, the ISW effect is not as prominent because quintessencebecomes dynamically important only at more and more re-cent epochs. In Figure 2, we show the value of σ8 impliedby the CMB normalization as a function of the equation ofstate parameter w. As we stated above, the decrease in σ8
is due to the increased importance of the ISW effect as wincreases.
Care must be taken when setting the CMB normaliza-tion. First, we note that when we performed our N-bodyexperiments we fixed the parameter ΩM = 0.3 for all modelsrather than allowing ΩM to vary along the ΩM-w degeneracyin the angular diameter distance. Our most extreme modelsare currently disfavored by the present observational data(e.g., Tegmark et al. 2003; Knop et al. 2003), but as our in-tent is to address the effect of quintessence on structure andhalo formation, we do not consider this to be a serious defi-ciency. In principle, the WMAP (Spergel et al. 2003) resultof high optical depth to the last scattering surface τ , hasmade the determination of σ8 from the CMB less robust,as the scattering off of free electrons damps anisotropieson scales that are sub-horizon at the epoch of reionization,
Figure 2. The power spectrum normalization σ8, implied byCMB anisotropy as a function of w. The solid line shows thevalues of σ8 that we obtain by assuming the optical depth to thelast scattering surface τ = 0. The dashed line shows the valuesof σ8 implied by adopting τ = 0.17. The dotted line shows thevalues of σ8 that we infer from the abundance of massive x-rayclusters.
thereby introducing a degeneracy between τ and σ8. Thedashed line in Figure 2 shows the CMB-normalized σ8 as afunction of w implied by adopting an optical depth to thelast scattering surface of τ = 0.17, in line with the WMAPexpectations.1 We return to a discussion of the relative im-portance of σ8 and w in §§ 6-7.
2.3 The Spherical Collapse Approximation
A common convention is to define the virial mass and radiusof a dark matter halo by demanding that the mean densitywithin the virial radius of the halo be a factor ∆vir timeslarger than the background density, ρb. Thus the virial massand radius of a halo are related by
Mvir =4π
3∆virρbR3
vir. (3)
In addition, the equivalent linear overdensity at collapseδc(z) is often used to determine the mass scale that is typ-ically collapsing at a given epoch. Both of these quantitiesare usually estimated using the approximation of sphericaltophat collapse (e.g., Lacey & Cole 1993). In this section,we summarize the previous results for spherical collapse inquintessence cosmologies (Mainini et al. 2003; Mota & van
1 Note that a high optical depth to reionization appears to be dif-ficult to reconcile with low values of σ8 <
∼ 0.75 (e.g., Somerville,Bullock, & Livio 2003), though the CMB-derived τ is very un-certain and is somewhat degenerate with the tilt of the powerspectrum, so tilted models with low σ8 may still be viable. Thisissue will likely be settled with future CMB data and analysis.

Dark Energy and Dark Matter Haloes 5
Figure 3. Ratio of the growth factor to the SCDM growth factor(DSCDM(a) = a) as a function of scalefactor for different valuesof w. The growth factor is normalized to unity today (D(a = 1) =1). Linetypes are shown in the legend.
de Bruck 2004), and discuss the implications for w < −1cosmologies.
The evolution of linear overdensities on scales muchsmaller than those on which the quintessence field spatiallyclusters is
δ + 2H(a)δ ≃3
2H0ΩMa−3. (4)
Solving this equation gives the growth factor for linear per-turbations. Figure 3 shows the linear growth factor in fivedifferent quintessence models, normalized to the growth fac-tor in an ΩM = 1, SCDM cosmology in which D(a) ∝ a.Models with w ≥ −1 have been well-studied, with suchmodels showing more relative growth at higher redshifts.For models with w ≤ −1, figure 3 shows how the trend to-wards more relative growth at lower redshifts continues forw < −1.
To detemine the non-linear growth of an object whichhas decoupled from the expanding universe and virialized,we follow Wang & Steinhardt (1998) and Weinberg &Kamionkowski (2003). We use the spherical collapse ap-proximation to determine the non-linear overdensity of ahalo, ∆vir(z), as a function of w. In this model, an over-density defined by ∆vir(z) collapses at the time tcoll, whenthe radius of the overdense region approaches zero. How-ever, the actual, final radius of the collapsed object is finiteand can be computed using the virial theorem. We computethe equivalent linear overdensity at collapse by evolving thelinearized equation of motion, Eq. (4), until the time tcoll, de-termined from the non-linear evolution of the overdensity. Inthe ΛCDM cosmology, the well-known results for the linearand non-linear overdensities at collapse are δc(z = 0) ≃ 1.67and ∆vir ≃ 337, and vary with redshift.
Figure 4 shows our results for the equivalent linear over-density at collapse δc(z), and the non-linear overdensity at
200
300
400
500
∆ vir
a)
1 101+z
1.66
1.67
1.68
1.69δ c
b)
w=-0.50w=-0.75w=-1.00w=-1.25w=-1.50
Figure 4. The non-linear and linear overdensities at collapse in
quintessence cosmologies. In panel (a), we exhibit the non-linearoverdensity at collapse ∆vir(z) for 5 different quintessence modelsthat we explore in this paper (ΩM = 0.3). The different valuesof the quintessence equation of state parameter w, are shown inthe legend. The increase in ∆vir(z) for larger w results primarilyfrom later collapse redshifts. In panel (b), we show the equivalentlinear overdensity at collapse δc(z), as a function of redshift forthe same quintessence models.
collapse ∆vir(z), as a function of redshift in quintessencecosmologies. The trend in δc(z) reflects the fact that over-densities grow more slowly in higher-w models. We can un-derstand the behavior of ∆vir(w, z) by noting that overden-sities in models with larger w take longer to collapse at latetimes. Consider, for example, two haloes, one in a w = −1cosmology, and another in a w > −1 cosmology, both ofwhich are just virializing at some redshift z. Very roughlyspeaking, the w > −1 halo will have had a turn-around timeat a higher redshift than the w = −1 halo, and its virial den-sity will be higher to reflect this. Conversely w < −1 modelswill have more recent turn-around times and smaller virialoverdensities. We find that an accurate fitting function, in-cluding the regime w < −1, can be obtained from a slight

6 Kuhlen et al.
modification to the formula already proposed by Weinberg& Kamionkowski (2003) for w > −1,
∆vir(z) = 18π2[
1 + aΘb(z)]
, (5)
where Θ(z) ≡ Ω−1M (z) − 1, and with a = 0.432 −
2.001(|w|0.234 − 1) and b = 0.929 − 0.222(|w|0.727 − 1).We find this formula to be accurate to better than 2% for0.1 ≤ ΩM ≤ 1 and −0.5 ≤ w ≤ −1.5.
3 ANALYTIC MODEL FOR HALO
CONCENTRATIONS
3.1 Main Ingredients
It is commonly agreed that the spherically-averaged densityprofiles of dark matter haloes can be described fairly wellby a generalized NFW profile on scales that are resolved instate-of-the-art N-body simulations:
ρhalo(r) =ρs
(r/rs)α(1 − r/rs)3−α, (6)
where α describes the slope of the inner density profile atr < rs. The value of α that most closely represents the re-sults of N-body simulations is still debated, with acceptablevalues between −0.7 and −1.5. An additional complexityis that recent studies indicate that haloes exhibit a rangeof inner slopes (Klypin et al. 2001; Tasitsiomi et al. 2003;Navarro et al. 2003). In the following, we adopt α = −1, cor-responding to the standard NFW profile. In this paper, weare concerned with the concentration parameter cvir, whichis quite insensitive to the exact value of α (see below).
The two parameters of the NFW profile are rs and ρs,with rs the radius at which the logarithmic density slopebecomes equal to −2. The concentration of the halo is de-fined as the ratio of its virial radius to the scale radius ofthe NFW profile,
cvir =Rvir
rs. (7)
With these definitions, the halo virial mass is related to theNFW parameters by
Mvir = 4πρsr3s
[
ln(1 + cvir) −cvir
1 + cvir
]
, (8)
so the halo density profile is completely determined by Mvir
and cvir.Numerical simulations have revealed a correlation be-
tween Mvir and cvir, with halo concentrations log-normallydistributed around the median relation. Several simple mod-els have been developed to explain this correlation (NFW;B01; Eke, Navarro, & Steinmetz 2001). Here we focus on theB01 model and test the accuracy with which it predicts theobserved relation between halo mass and concentration insimulations with w 6= −1.
The B01 model assumes that a halo’s central densityand concentration are set by the density of the universe at acharacteristic formation epoch. This formation epoch quali-tatively tracks the characteristic collapse epoch for the halosubunits. It is defined as the time when the linear rms den-sity fluctuations at a scale corresponding to a fraction F ofMvir is equal to the linear collapse overdensity, δc:
σ(FMvir, ac) = δc(ac). (9)
Given the halo collapse epoch, the halo concentrationis set via
cvir(Mvir, a) = Kvira
ac(Mvir). (10)
A closely related study by Wechsler et al. (2002, here-after W02) showed that the B01 “collapse epoch” seems tocorrespond closely to the epoch when the mass accretion rateof the halo d ln(Mvir)/dt, is large compared to the rate ofcosmic expansion. W02 found that if one defines the end ofthis rapid collapse phase to be when d ln(Mvir)/d ln(a) ≤ 2,it corresponds closely to the “formation epoch” in Eq. (9)above. After this epoch of rapid mass accretion ends, thehalo mass and virial radius continue to grow via compara-bly minor mergers and diffuse mass accretion. These rela-tively minor mergers do not affect the inner regions of thehalo (r < rs) significantly and so Rvir grows, but rs remainsapproximately constant, leading to an increase in concentra-tion as the halo evolves (W02).
The B01 model has two parameters, F and K, that haveto be determined by calibrating them to numerical simula-tions. B01 analysed two ΛCDM simulations with σ8 = 1.0and different resolutions and box sizes. Using a halo finderbased on the Bound Density Maxima (BDM) algorithm(Klypin & Holtzman 1997), they assembled a catalogue ofseveral thousand haloes for each simulation, and fit NFWprofiles to each of them. B01 found that their model wasable to satisfactorily reproduce the mean relation betweenhalo mass and concentration, and the redshift dependenceof the cvir-Mvir relation with F = 0.01 and K = 4.0.B01 and W02 determined that the scatter in concentrationat fixed mass is well-described by a log-normal distribu-tion with σlog c = 0.14 dex. Other numerical studies havefound a somewhat smaller scatter, with Jing (2000) report-ing σlog c = 0.9 − 0.11 dex, and Jing & Suto (2002) findingσlog c = 0.13 dex.
The B01 model with F = 0.01 and K = 4.0 has sinceproven successful in reproducing concentrations of ΛCDMhaloes over more than six orders of magnitude in halo massfrom Mvir ≃ 107 M⊙ to Mvir ≃ 1013 M⊙ (e.g., Colın et al.2003; Hayashi et al. 2003). However, as discussed in B01, themodel ceases to make physical sense for halo masses largeenough that FMvir begins to approach the typical collapsemass at z = 0. This is because linear fluctuations stop grow-ing at late times in ΛCDM, and with the simplified defini-tion of collapse time discussed above, very large haloes nevercollapse. Consequently, the B01 model with F = 0.01 under-predicts halo concentrations for systems more massive thana few ×1014 M⊙ (e.g., Hayashi et al. 2003; Dolag et al. 2003).As a matter of pragmatism, this can be remedied with a sim-ple change of parameters. With F = 0.001 and K = 3.0 themodel works adequately for all masses, though it becomessomewhat less attractive because of the small value of F , forwhich the collapse epoch no longer corresponds directly toac defined by W02.
3.2 The Analytic Model in Quintessence
Cosmologies
As shown in § 2, linear overdensities have greater relativegrowth at higher redshift as w increases. We then expect,given an overdensity on a mass scale Mvir, that this mass

Dark Energy and Dark Matter Haloes 7
scale will collapse at higher redshift as we increase w. Asthe halo concentration reflects the density of the universe atthe time of rapid collapse, we expect this change in averageformation time to translate directly into a change in averageconcentration. The differences in w 6= −1 models should beconfined to changes in the rapid-collapse epoch ac for haloesof a given mass.
From Equation (9), ac for a halo of mass Mvir is de-termined by δc, D(a), and σ8. The changes in δc with w(Figure 4) have a very small effect on ac. More relevant arethe changes in σ(M, a) and the linear growth rate (Fig. 3).For a fixed value of σ8 all the w-dependence of ac(Mvir) willbe captured by D(a), with σ(M,a) reaching the δc collapsethreshold at earlier times as w increases. We therefore expectconcentrations to increase as w increases.
Note that an alternative definition of a halo’s radius,R200, the radius at which the mean halo density is equal to200ρcrit has frequently been used in the past. This resultsin an alternative definition of concentration: c200 = R200/rs
(e.g., NFW96). Of course, given a set of cosmological pa-rameters, the model described above (and similar models)can be used to predict equivalent relations between c200 andM200. For a fixed cosmology, the predicted relation betweenc200 and M200 will look quite similar to the cvir-Mvir relation,with an offset that varies slowly as a function of concentra-tion and accounts for the differences in values of the outerhalo radius.
Because the simulations of B01 focused only on one cos-mology, it was impossible to tell whether agreement with thesimulations and the proposed B01 model was sensitive to thechoice of defining halo concentration relative to Rvir insteadof R200. That is, one could have equally well proposed adifferent model based on c200:
c200(M200, a) = K200a
ac(M200). (11)
The simulation results of B01 could have been reproducedusing this model, simply by setting K200 equal to a slightlysmaller value than the original K = 4.0.
Consider now the current case, where we compare sim-ulation results based on cosmologies with different w’s andhence different ∆vir values. In these simulations, the ratiosof Rvir/R200 (and cvir/c200) for fixed-mass haloes will de-pend on the value ∆vir(w). Therefore, it is impossible for amodel based on c200 with fixed K200 to do equally well asthe original B01 model based on cvir with fixed K for all val-ues of w. More physically, the original B01 model describedabove implicitly assumes that the haloes have virialized atthe appropriate virial density and predicts that, in addi-tion, the halo collapse redshift acts to set the ratio of thevirial density (∝ R−3
vir ) to the central density (∝ r−3s ). A
model based on c200 with fixed K200 would instead assumethat all of the changes in halo density arise solely becauseof changes in ac. As we demonstrate below, the virial as-sumption seems to capture better our simulation results. Itseems therefore, that there are two physical processes thatset halo densities: one process is related to the global pro-cess of halo virialization and the other may be related to anearlier, rapid-collapse epoch.
4 NUMERICAL SIMULATIONS
In this section, we describe our numerical simulations. In§ 4.1, we detail the numerical and cosmological parametersthat were used. In § 4.3, we describe the methods we useto locate haloes and to fit NFW profiles to their densityprofiles.
4.1 Simulations and Parameters
We use GADGET version 1.1, a publicly-available and well-tested N-body code (Springel et al. 2001). Gravity betweenparticles is solved using a hierarchical tree algorithm in co-moving coordinates, and both the force calculations and thetime-stepping are performed in a fully adaptive way. Us-ing the parallel version, we have run the code on either 96375MHz IBM Power3 processors of NERSC’s Seaborg or on64 1.4GHz Athlon processors of UpsAnd, a 264-processor Be-owulf cluster at The University of California at Santa Cruz.We made necessary alterations to the expansion rate of theuniverse for GADGET to account for quintessence cosmolo-gies with w 6= −1.
Power et al. (2003) have performed a detailed conver-gence study of a high resolution cluster simulation usingGADGET, and although we simulate a much larger cos-mological volume we have followed their recommendationsfor a number of GADGET’s parameters. In particular wehave chosen an adaptive timestep equal to ∆ti = ηaǫ
√
ǫi/ai,where ǫi and ai are the gravitational softening and accelera-tion experienced by the ith particle in the simulation, and ηaǫ
is a dimensionless constant. Power et al. (2003) recommendsetting ηaǫ = 0.2; this choice of adaptive timestep minimizesundesirable effects due to particle discreteness and hardscatterings, while at the same time allowing for convergenceat minimal computational expense. In GADGET, gravita-tional softening is performed using a cubic spline (Springelet al. 2001), for which the potential becomes exactly Newto-nian at r = 2.8 ǫ, where ǫ is the softening length. Generallyour simulations were run with a co-moving softening lengthof ǫ = 2.5h−1 kpc, although we have run a few cases with ǫas low as 1h−1 kpc.
Our cosmological background model is fixed by ΩM =0.3, ΩQ = 0.7, h = 0.7, and n = 1.0 for all values of w.In normalizing σ8 on the scale of galaxy clusters, the initialpower spectra are nearly unaffected by quintessence. How-ever, when normalizing to the scales probed by the CMB,the initial power spectra are altered by the inclusion ofquintessence (section 2.2). As discussed below, we normal-ize our simulations such that σ8 ≃ 0.74, thus the effect ofw 6= −1 is due almost exclusively to the expansion rate.
All of our simulations were run with 2563 particles inboxes with sides of length 60h−1Mpc. ΩM = 0.3 implies amass per particle of Mp = 1.1×10⁹h−1 M⊙. For the analysisof halo concentrations we used only haloes with more than100 particles (see §5.2). This corresponds to a minimum halomass of Mmin
vir ≃ 1.1×10¹¹h−1 M⊙, for which the B01 modelpredicts a median concentration of 13.5 (for σ8 = 0.74). Thistranslates into an NFW scale radius of rmin
s ∼ 10h−1 kpc.More massive haloes will have larger scale radii, and becauseeven this minimum scale radius is almost three times largerthan our softening length, we should be able to determineaccurate concentrations from the haloes in our simulations.
8 Kuhlen et al.
Table 1. Simulation Parameters and Power Spectrum Normal-izations.
Model w ǫ/h−1 kpc σ8,noma σ8,eff
a
−0.50 2.5 0.742 0.799−0.75 2.5 0.740 0.775−1.00 2.5 0.738 0.716−1.00 1.0 1.000 0.972−1.25 2.5 0.736 0.716−1.50 2.5 0.734 0.714
All other parameters are fixed at the same value for all simu-lations. The number of particles is Np = 2563, the box size isLbox = 60h−1Mpc, and the initial redshift is zi = 50. For all sim-ulations, the remaining cosmological parameters are ΩM = 0.3,ΩQ = 0.7, h = 0.7, and n = 1.0.a the difference between σ8,nom and σ8,eff is explained in §4.2.
Table 1 summarizes the parameters used in our simula-tions.
4.2 Initial Conditions
Setting initial conditions for our simulations requires fixingthe z = 0 power spectrum normalization, which we param-eterize by σ8. As discussed above (§2.2), our current under-standing of present day clusters of galaxies makes σ8 still un-certain by ∼ 20−30% (σ8 ∼ 0.70−1.10 for ΩM = 0.3). Haloconcentrations in cosmological N-body simulations dependsensitively on σ8, because the amount of small-scale powerdirectly affects typical halo formation times, especially forhigh mass haloes. For example, at Mvir = 1014 h−1 M⊙ theB01 model predicts median concentrations of cvir = 6.8and cvir = 5.3 for σ8 = 0.90 and σ8 = 0.74, respectively.We initialize our simulations with the values of σ8 deter-mined by Kuhlen et al. (2004) from the abundance of clus-ters in the HIFLUGCS sample of local clusters (Reiprich& Bohringer 2002): σ8 = 0.742, 0.740, 0.738, 0.736, 0.734for w = −1.50,−1.25,−1.00,−0.75,−0.50, respectively. Weconstruct initial conditions for each w with the routines ofthe publicly-available PM code (Klypin & Holtzman 1997).
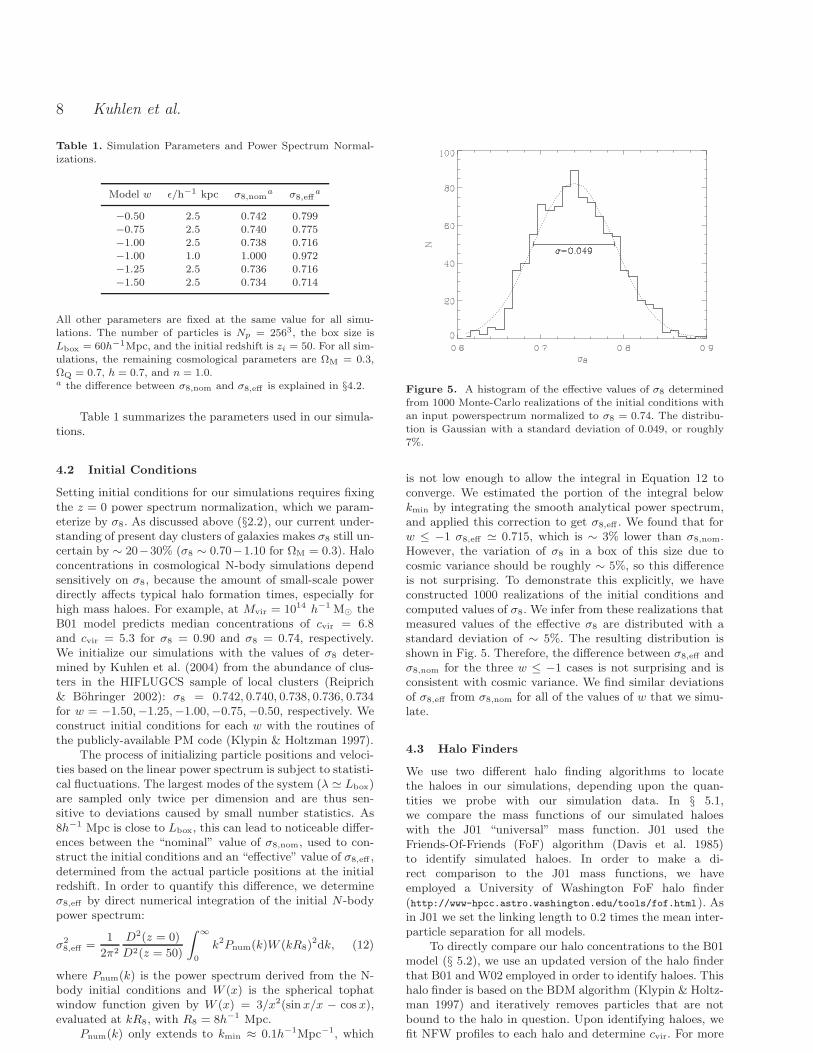
The process of initializing particle positions and veloci-ties based on the linear power spectrum is subject to statisti-cal fluctuations. The largest modes of the system (λ ≃ Lbox)are sampled only twice per dimension and are thus sen-sitive to deviations caused by small number statistics. As8h−1 Mpc is close to Lbox, this can lead to noticeable differ-ences between the “nominal” value of σ8,nom, used to con-struct the initial conditions and an “effective” value of σ8,eff ,determined from the actual particle positions at the initialredshift. In order to quantify this difference, we determineσ8,eff by direct numerical integration of the initial N-bodypower spectrum:
σ28,eff =
1
2π2
D2(z = 0)
D2(z = 50)
∫
∞
0
k2Pnum(k)W (kR8)2dk, (12)
where Pnum(k) is the power spectrum derived from the N-body initial conditions and W (x) is the spherical tophatwindow function given by W (x) = 3/x2(sin x/x − cos x),evaluated at kR8, with R8 = 8h−1 Mpc.
Pnum(k) only extends to kmin ≈ 0.1h−1Mpc−1, which
Figure 5. A histogram of the effective values of σ8 determinedfrom 1000 Monte-Carlo realizations of the initial conditions withan input powerspectrum normalized to σ8 = 0.74. The distribu-tion is Gaussian with a standard deviation of 0.049, or roughly7%.
is not low enough to allow the integral in Equation 12 toconverge. We estimated the portion of the integral belowkmin by integrating the smooth analytical power spectrum,and applied this correction to get σ8,eff . We found that forw ≤ −1 σ8,eff ≃ 0.715, which is ∼ 3% lower than σ8,nom.However, the variation of σ8 in a box of this size due tocosmic variance should be roughly ∼ 5%, so this differenceis not surprising. To demonstrate this explicitly, we haveconstructed 1000 realizations of the initial conditions andcomputed values of σ8. We infer from these realizations thatmeasured values of the effective σ8 are distributed with astandard deviation of ∼ 5%. The resulting distribution isshown in Fig. 5. Therefore, the difference between σ8,eff andσ8,nom for the three w ≤ −1 cases is not surprising and isconsistent with cosmic variance. We find similar deviationsof σ8,eff from σ8,nom for all of the values of w that we simu-late.
4.3 Halo Finders
We use two different halo finding algorithms to locatethe haloes in our simulations, depending upon the quan-tities we probe with our simulation data. In § 5.1,we compare the mass functions of our simulated haloeswith the J01 “universal” mass function. J01 used theFriends-Of-Friends (FoF) algorithm (Davis et al. 1985)to identify simulated haloes. In order to make a di-rect comparison to the J01 mass functions, we haveemployed a University of Washington FoF halo finder(http://www-hpcc.astro.washington.edu/tools/fof.html). Asin J01 we set the linking length to 0.2 times the mean inter-particle separation for all models.
To directly compare our halo concentrations to the B01model (§ 5.2), we use an updated version of the halo finderthat B01 and W02 employed in order to identify haloes. Thishalo finder is based on the BDM algorithm (Klypin & Holtz-man 1997) and iteratively removes particles that are notbound to the halo in question. Upon identifying haloes, wefit NFW profiles to each halo and determine cvir. For more

Dark Energy and Dark Matter Haloes 9
detail, we refer the reader to Appendix B of B01 and Ap-pendix A of W02. We include in our catalogues only haloeswith more than 100 particles, the same cut-off used by W02.
We have checked that both halo finding algorithmsagree with each other, within our expectations, by compar-ing mass functions. The systematic differences in total massbetween haloes defined in terms of the cosmology-dependentvirial overdensity ∆vir(w) (as in the BDM finder) and thosebased on the fixed FoF linking length translate into onlyminor differences in mass functions. At high redshift, thetwo mass functions actually converge because ∆vir(z) ap-proaches 178 and a linking length of 0.2 times the meaninter-particle separation roughly corresponds to a mean halodensity of ∼ 180− 200 times the background density. Belowz ∼ 2 − 2.5, the FoF and BDM mass functions agree well.At higher redshifts the BDM-based finder becomes increas-ingly incomplete. A consequence of the low value of σ8 inour simulations is that halo formation occurs more recently.Frequent merger events during the rapid mass growth phaseof halo formation disrupt any spherical symmetry in the halodensity profile. These haloes will not be well described bythe NFW formula. In our implementation of the BDM halofinder, haloes with very bad fits to the NFW profile are re-jected and not included in the catalogues. This is the majorsource of incompleteness at z >
∼ 2.5. Note that the net effectof this incompleteness is to underestimate the number of lowconcentration haloes at high redshift.
5 RESULTS
5.1 Mass Functions
Several recent numerical studies have demonstrated that theJ01 formula for halo mass functions may be considered “uni-versal” as it accurately describes halo counts as a functionof mass in N-body simulations of various cosmologies, in-cluding models containing dark energy with w 6= −1 and atime-varying w (Linder & Jenkins 2003; Klypin et al. 2003;Maccio et al. 2003; Lokas, Bode, & Hoffman 2003). We con-firm and further extend this conclusion by presenting halomass functions from our simulations at different redshifts.In Figure 6, we show the mass functions of our FoF haloesin each cosmology and at a variety of redshifts from z = 0 toz = 3. It is apparent that, in all panels, the mass functionsand the redshift evolution of the mass functions for eachw model are in excellent agreement with the J01 forumula.Thus we confirm that the J01 formula is a good approxima-tion at all redshifts for w > −1 and we extend the range ofvalidity of the J01 relation to include quintessence modelswith w < −1.
5.2 Concentrations
In §3.2, we described the manner in which quintessence mod-ifies the predictions of the analytic B01 model for halo con-centration as a function of mass. We have assembled cata-logues consisting of more than ∼ 1600 haloes for each of ourquintessence N-body simulations. The density profiles of ev-ery halo have been fit to an NFW profile, yielding a best-fitcvir for each object. Some of these fits produced concentra-
tions smaller than one. We have excluded these haloes fromour subsequent analysis.
The resulting cvir(Mvir) relations are plotted in Fig-ure 7. We find that our simulations produce haloes withslightly lower concentrations than expected from previoussimulation results (e.g., B01, Colın et al. 2003) and the an-alytic model proposed by B01 with F = 0.01 and K = 4.0.However, we find that this difference can be described wellby a constant offset. For example, keeping F = 0.01 andlowering the proportionality constant K to K = 3.5 [seeEq. 10] in the B01 model matches our data quite well forall of the w models we explore. We discuss this overall off-set further in § 5.3. The cvir-Mvir relation flattens out be-low Mvir ≈ 6 × 10¹¹h−1 M⊙. We attribute this to the lowernumber of particles in these haloes, making them more sus-ceptible to relaxation effects which tend to cause the cen-tral regions of haloes to be more diffuse and lead to lowerconcentrations. It is thus unlikely that this flattening rep-resents any physical effect (compare to the results of Colınet al. 2003), and we have neglected the lowest mass bin indetermining the best-fit value of K.
As mentioned above (§3.2), considering several cosmo-logical models with different virial overdensities ∆vir allowsus to distinguish between analytic prescriptions based ondefinitions of halo concentration in terms of R200, in whichthe proportionality constant K200 is independent of cosmol-ogy (Eq. 11), and those based on the virial radius Rvir,in which Kvir is cosmology-independent (Eq. 10). To testthis, we re-analysed the five z = 0 N-body outputs us-ing the BDM halo finder, but setting ∆vir = ρvir/ρb =ρvir/ρcrit Ω−1
M = 200 Ω−1M ≃ 667, effectively yielding a
relation between c200 and M200. Matching these relationsto the model described by Eq. 11 we determined best-fitting values of K200 = (3.76, 3.44, 3.32, 3.16, 3.16) for w =(−0.50,−0.75,−1.00,−1.25,−1.50), respecively. This rangein K200 is not consistent with one cosmology-independentvalue of K200. The results of this analysis suggest that mod-els similar to the B01 model, in which the halo concentrationis defined in terms of Rvir and ∆vir, are more readily general-izable to alternative cosmologies as cvir is related to a/ac viaa cosmology-independent constant of proportionality, Kvir.Put another way, defining the radius of a halo, and thus itsconcentration, using a fixed overdensity criterion necessi-tates using a cosmology-dependent proportionality constantin Eq. (10) while the cosmology-dependent virial overden-sity definition seems to account for these differences, so thatKvir is independent of cosmology.
As in previous studies (B01; Jing 2000; Jing & Suto2002), we also find that haloes of a given mass have a broaddistribution of concentrations. To determine the inherentscatter in the cvir-Mvir relation it is important to accountfor the artificial scatter introduced by uncertainties in thefit to an NFW profile and by the Poisson noise in each bin.Following the B01 analysis, we corrected for the former bydetermining 500 one-sided Gaussian deviates for each halowith a standard deviation equal to the error in the cvir fitreturned by the halo finder. The deviates are positive (nega-tive) if cvir is less (greater) than the median in that bin. Wethen determined the 16th and 84th percentiles in log(cvir)and subtract off the Poisson noise from each in quadrature.The resulting estimates of the intrinsic scatter are shown asthe dashed lines in Figure 7. The scatter is consistent with

10 Kuhlen et al.
Figure 6. A comparison between the J01 analytic mass function (solid lines) and the mass functions derived from our five N-bodysimulations (shapes with error bars, see the legend in the lower right portion of the Figure). The haloes in our simulations were locatedusing a FoF algorithm with a linking length equal to 0.2 times the mean particle separation as in J01. In each panel we plot massfunctions at various redshifts, from top to bottom: z = 0.0, 0.5, 1.0, 2.0, and 3.0. The error bars represent the Poisson noise due to thefinite number of haloes in each mass bin.
being independent of w and Mvir, and we find that tak-ing the B01 proportionality constant to be Klow = 2.28 andKhigh = 4.52 fits the lower and upper lines well. These valuescorrespond to σlog c,low = 0.18 dex and σlog c,high = 0.11 dex.Although these are similar in magnitude to the scatter re-ported in previous studies, our distributions are skewed awayfrom log-normal toward lower concentrations. We note thatthe skewness may likely be caused by the lower resolution ofour simulations, which tends to result in lower concentrationhaloes.
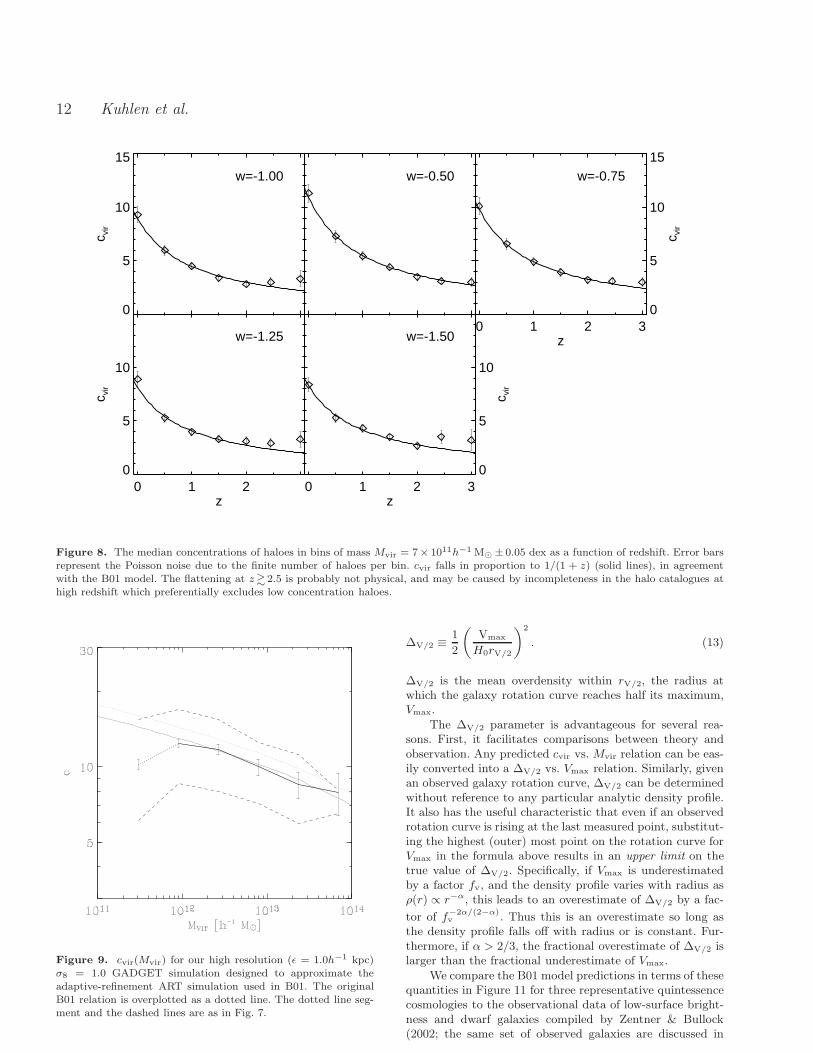
For a fixed mass the B01 model predicts that concentra-tion should decrease with redshift as 1/(1 + z). The haloesin our simulation also satisfy this relation, as shown by Fig-ure 8, in which we plot the redshift dependence of concentra-tion for haloes of mass Mvir = 7 × 10¹¹h−1 M⊙. This figureshows that the concentrations follow the cvir ∝ (1 + z)−1
relation that is embodied in the B01 analytic model. Atredshifts greater than ∼ 2.5, our catalogues of haloes inthis mass bin with fitted NFW profiles become incomplete.This incompleteness preferentially affects low concentrationshaloes, causing the cvir(z) relation to flatten at high redshift.We do not believe this to be a physical effect, and trust ourdata points to z ∼ 2.5.
5.3 The Concentration Discrepancy
We have attempted to understand the origin of the discrep-ancy between cvir(Mvir) derived from our simulations andthose reported by B01 and summarized by the B01 model.We have re-analysed the same z = 0 simulation data thatwas analysed previously by B01, and we were able to repro-duce their cvir-Mvir relation and scatter. We conclude thatthe discrepancy that we observe is not due to any change inanalysis procedures.
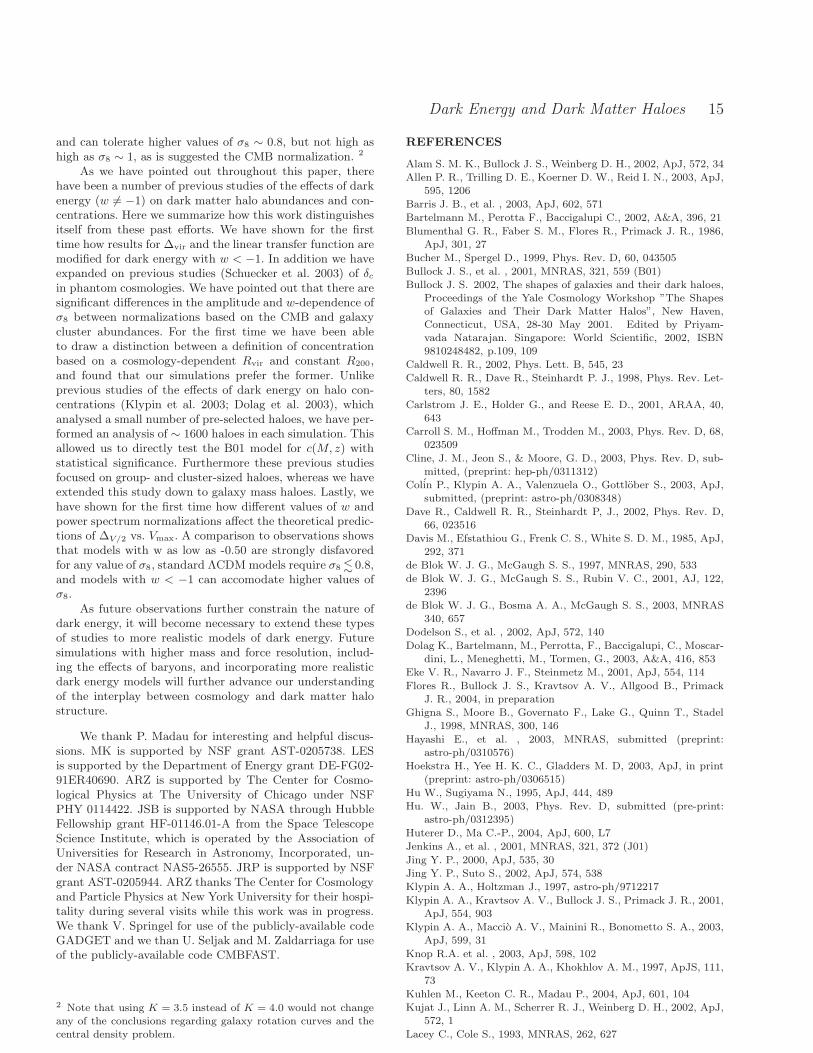
Of course, the main difference between the study of B01and our work is the choice of simulation codes. Whereaswe use the publicly-available, uniform-resolution code GAD-GET, B01 used the adaptive-refinement code ART. Un-doubtedly the effective resolution at the centres of haloeswas higher in the B01 simulation than in ours. In orderto shed further light on this matter, we have run one ad-ditional GADGET simulation designed to test the impor-tance of the effective force resolution. Compared to the fivesimulations discussed previously, this one has higher forceresolution (ǫ = 1.0h−1 kpc) and σ8 = 1.0. The resultingcvir(Mvir) relation is shown in Figure 9.
Here, we again find that the GADGET concentrationsare systematically lower than the ones found by B01 withART by ∼ 14%. Instead of K = 4.0 we find K = 3.44matches the GADGET halo concentrations. This is con-sistent with the value found for the five lower resolution

Dark Energy and Dark Matter Haloes 11
Figure 7. The concentration parameter cvir, as a function of mass Mvir, for the five quintessence N-body simulations. The original(F = 0.01, K = 4.0) and our best-fitting (F = 0.01, K = 3.5) B01 models are over-plotted as thin dotted and solid lines, respectively.Error bars represent the Poisson noise due to the finite number of haloes per bin. The dashed lines are our estimates of the intrinsicscatter in the relation, obtained by removing the scatter due to errors in the fits of the NFW profiles, as well as Poisson noise. The
lowest mass bin was excluded in our analysis and is shown here for completeness only. The total number of haloes in the remaining binsis shown in the upper right corner of each panel. The lower right panel shows the best-fitting B01 model for all five values of w.
quintessence simulations described above. The difference inK between our simulations and the B01 simulation may bedue to an inherent difference between the GADGET andART N-body codes. Whether this is due to the higher max-imum force resolution afforded by the adaptive refinement ofART, or another difference between the two codes remainsunclear.
Several recent analyses based on w = −1 simulationswith higher resolution than our own (Hayashi et al. 2003;Colın et al. 2003; Tasitsiomi et al. 2003) also favor the B01model with K = 4.0. In light of these results we suggest thatour GADGET simulations systematically under-predict haloconcentrations by ∼ 10 − 15%. However, when this offset isnormalized out, the variation of cvir(Mvir) with w scales aspredicted, and we conclude that the B01 model is successfulin this regard. Emboldened by this success, we use the modelto explore the implications of various normalization choicesand to compare expected halo densities with those inferredfrom galaxy rotation curves. In what follows, we assume K =4.0 for the model normalization and we advocate this choicefor the reasons outlined above. (However, setting K = 3.5would not qualitatively change the conclusions that follow.)
6 HALO CONCENTRATIONS AND CENTRAL
DENSITIES WITH w 6= −1
In Figure 10, we illustrate the degeneracy between w andσ8 in setting halo concentrations. Shown are the predictionsof the B01 model (F = 0.01, K = 4.0) for cvir(z = 0) witha fixed normalization σ8 = 0.74 for several values of w. Asdiscussed in § 3.2, for a fixed normalization, concentrationsincrease as w increases because haloes collapse earlier. Theright panel of the figure shows the corresponding predictionsfor cvir with σ8 determined by normalizing to the CMB withτ = 0 (see § 2.3). Note that for the CMB normalization, thetrend with w is in the opposite direction, with increasingw implying lower concentrations. As illustrated in Figure 2,higher w requires a lower normalization: σ8 ≃ 0.6, 0.9, and1.0 for w = −0.5, −1, and −1.5, respectively. The change innormalization based on the CMB dominates changes in thegrowth function that give rise to the behavior of cvir(w) atfixed normalization.
As discussed previously, the cvir parameter is useful, butit is not a direct measure of physical density. We would like,therefore to convert our predicted cvir relations into quan-tities that have a more direct physical interpretation, andare more amenable to comparison with observations. Alam,Bullock, & Weinberg (2002) proposed the central density pa-
rameter as a means to quantify the physical density in thecentral regions of a galaxy:
12 Kuhlen et al.
0
5
10
15
c vir
w=-1.00
w=-0.50
0 1 2 3z
0
5
10
15
c vir
w=-0.75
0 1 2 z
0
5
10
c vir
w=-1.25
0 1 2 3z
0
5
10
c vir
w=-1.50
Figure 8. The median concentrations of haloes in bins of mass Mvir = 7× 10¹¹h−1 M⊙ ± 0.05 dex as a function of redshift. Error barsrepresent the Poisson noise due to the finite number of haloes per bin. cvir falls in proportion to 1/(1 + z) (solid lines), in agreementwith the B01 model. The flattening at z >
∼ 2.5 is probably not physical, and may be caused by incompleteness in the halo catalogues athigh redshift which preferentially excludes low concentration haloes.
Figure 9. cvir(Mvir) for our high resolution (ǫ = 1.0h−1 kpc)σ8 = 1.0 GADGET simulation designed to approximate theadaptive-refinement ART simulation used in B01. The originalB01 relation is overplotted as a dotted line. The dotted line seg-ment and the dashed lines are as in Fig. 7.
∆V/2 ≡1
2
(
Vmax
H0rV/2
)2
. (13)
∆V/2 is the mean overdensity within rV/2, the radius atwhich the galaxy rotation curve reaches half its maximum,Vmax.
The ∆V/2 parameter is advantageous for several rea-sons. First, it facilitates comparisons between theory andobservation. Any predicted cvir vs. Mvir relation can be eas-ily converted into a ∆V/2 vs. Vmax relation. Similarly, givenan observed galaxy rotation curve, ∆V/2 can be determinedwithout reference to any particular analytic density profile.It also has the useful characteristic that even if an observedrotation curve is rising at the last measured point, substitut-ing the highest (outer) most point on the rotation curve forVmax in the formula above results in an upper limit on thetrue value of ∆V/2. Specifically, if Vmax is underestimatedby a factor fv, and the density profile varies with radius asρ(r) ∝ r−α, this leads to an overestimate of ∆V/2 by a fac-
tor of f−2α/(2−α)v . Thus this is an overestimate so long as
the density profile falls off with radius or is constant. Fur-thermore, if α > 2/3, the fractional overestimate of ∆V/2 islarger than the fractional underestimate of Vmax.
We compare the B01 model predictions in terms of thesequantities in Figure 11 for three representative quintessencecosmologies to the observational data of low-surface bright-ness and dwarf galaxies compiled by Zentner & Bullock(2002; the same set of observed galaxies are discussed in

Dark Energy and Dark Matter Haloes 13
Figure 10. Predictions for halo concentration as a function of Mvir. Dotted, solid, and dash-dot lines in each panel refer to w = −0.5,−1,and −1.5, respectively. The left panel is for the fixed σ8 used in the simulations presented in this paper. The right panel shows how thehalo concentration changes when we normalize based on the CMB: σ8 ≃ 0.6 , 0.9, and 1.0 for w = −0.5,−1, and −1.5, respectively.
Hayashi et al. 2003, who reach similar conclusions) from theobservational work of Swaters (1999), de Blok, McGaugh, &Rubin (2001), and de Blok and Bosma (2002). The error barin the right panel shows the theoretical 1σ scatter in ∆V/2
expected at fixed Vmax due to the scatter in cvir.
While it is difficult to quantify the agreement of eachquintessence cosmology with observational data, the cos-mological model that is most commonly referred to as thestandard, concordance cosmological model with w = −1σ8 = 0.9 (solid line, right panel) seems to be in conflict withthe extant observational data. For w = −1, lowering thenormalization of the power spectrum to the value σ8 ≈ 0.74(solid line, left panel) can greatly alleviate this discrepancy(Alam, Bullock, & Weinberg 2002; Zentner & Bullock 2002;McGaugh et al. 2003). However, a w = −0.5 model with thesame σ8 ≈ 0.74 normalization (dotted line, left panel) doesnot do as well because earlier structure formation produceshigher galactic central densities.
Notice that the trends with ∆V/2 for fixed Vmax do notscale as might be expected from the cvir trends at fixed massshown in Figure 10. This is because ∆V/2 is a physical mea-sure of density and it increases not only with cvir but alsowith ∆vir (i.e. haloes are defined with respect to differentoverdensities). This effect is most apparent when comparingthe right panels of Figures 10 and 11. Though the concen-trations of haloes with w = −0.5 and σ8 = 0.6 (dotted-line,right panel, Figure 10) are much lower than those in thestandard w = −1.0, σ8 = 0.9 case (solid line, right panel),the actual densities of those haloes are roughly the same inthe right panel of Figure 11. This is because w = −0.5 mod-els have higher virial densities (see Figure 4). Even thoughhaloes in the low-normalization w = −0.5 model tend tohave the same (rapid-collapse) formation epoch as those inthe higher-normalization w = −1 model, the higher virialdensities in the former model make the haloes denser over-all.
By inspecting Figure 11, we can immediately determinethat models with w < −1 and moderately low σ8 (σ8 ∼ 0.7−
0.8) can bring theoretical predictions to rough agreementwith rotation curve data from low surface brightness anddwarf galaxies. Though it is clear that sufficiently decreasingσ8 can bring any model into accord with the median of thedata, a w = −0.5 model would require σ8 < 0.6. Such a lownormalization would be nearly impossible to reconcile withz = 0 cluster abundance data. Thus from the standpoint ofquintessence, models with w < −1 seem mildly favored bygalaxy density data. Conversely, models with w as high as∼ −0.5 are strongly disfavored by galactic rotation curvescoupled with only a weak prior on the normalization of thepower spectrum.
Note that none of the models can easily account for thevery low data points. Nevertheless, the scatter in the data isnot extremely large compared to the scatter expected fromthe halo-to-halo variations observed in N-body simulations.For example, at Vmax = 80 km/s, the 1σ scatter in N-bodysimulations is σ(log(∆V/2)) ≃ 0.37 while the 1σ scatter inall 67 data points is σ(log(∆V/2)) ≃ 0.41. This suggeststhat lowering the median of the theoretically predicted cen-tral densities, perhaps by a reduction in σ8 or invoking atilted or running power spectrum that reduces power ongalaxy scales, or as we discuss here, by invoking w < −1quintessence, may be sufficient to bring the predictions intogood agreement with the data. Yet, we must bear in mindthat our calculations are approximate. The most obviousomission is that all of our calculations are based on N-bodysimulations that contain no baryons. The effects of baryoniccontraction are likely to be small in LSB galaxies (e.g., deBlok & McGaugh 1997) and would tend to drive rotationcurves to higher values or ∆V/2 and Vmax in the simplestmodels (Blumenthal et al. 1986). This serves only to increasethe apparent discrepancy. Additionally, rotation curve mea-surements may yet be subject to poorly-understood system-atic effects in the reduction of the observational data (Swa-ters et al. 2003). Currently, it is difficult to draw a firmconclusion.

14 Kuhlen et al.
Figure 11. The central density parameter as a function of the maximum halo circular velocity. Dotted, solid, and dash-dot lines in eachpanel refer to w = −0.5,−1, and −1.5, respectively. The left panel is for a fixed σ8 = 0.74 and the right panel is normalize to match theCMB: σ8 ≃ 0.6 , 0.9, and 1.0 for w = −0.5,−1, and −1.5, respectively. The error bar in the right panel shows the expected theoretical1 − σ scatter in ∆V/2 due to the scatter in cvir. The points are for observed LSB and dwarf galaxies (see text for references).
7 SUMMARY AND CONCLUSIONS
Although the nature of dark energy is unknown, its effects onstructure formation can be studied using numerical N-bodysimulations. We have performed a series of these simulationsfor a range of dark energy equation of state parameters.Confirming previous findings by Linder & Jenkins (2003),Klypin et al. (2003), Maccio et al. (2003), and Lokas et al.(2003) we show that the J01 formula provides a good fit tohalo mass functions even in the presence of non-ΛCDM darkenergy. We show that this is true for models with w < −1as well.
The density structure of dark matter haloes is also af-fected by dark energy. We have shown how the predictionsof the B01 model are modified when dark energy with con-stant w is accounted for. As structure tends to form earlierin models with less negative w, halo concentrations tend tobe somewhat higher in these models. These findings are inagreement with the results of Klypin et al. (2003) and qual-itatively agree with Dolag et al. (2003), although we probea different range of masses than the latter. The larger num-ber of haloes with NFW profile fits and concentrations in ourstudy allows us to quantitatively test the B01 model. We findthat the original (F = 0.01, K = 4.0) over-predicts the con-centrations of haloes in our simulations by about ∼ 12−15%.However, the shape of the mass-concentration relation thatwe find is the same as in B01, and we find that a slightlymodified set of the B01 parameters (F = 0.01, K = 3.5)matches our haloes well. This offset may likely be causedby the lower force resolution of our GADGET simulationscompared to the adaptive-refinement code ART used in B01.For the haloes in our simulations the adopted B01 modelaccurately reproduces the median concentration-mass re-lation over a range of masses from Mvir ∼ 6 × 10¹¹ toMvir ∼ 4 × 10¹³h−1 M⊙. We confirm that for a fixed masshalo concentration decrease with redshift as 1/(1 + z), atleast out to z ∼ 2.5.
Interestingly, we find that halo concentrations are more
easily understood when the halo virial radius is defined interms of a cosmology-dependent virial overdensity ratherthan by one that uses a fixed overdensity of ρ/ρcrit = 200.The result supports one of the (previously-untested) as-sumptions of the original B01 model. Specifically, we arguethat halo densities in different cosmological models are in-fluenced both by changes in the overall virialization processof haloes as well as by changes in epoch when the halo corescollapse. As noted in §6, it is important to include bothof these physical processes when comparing predictions forgalaxy densities to real data, as in Figure 11.
Having confirmed that the B01 model correctly de-scribes the scaling of halo concentrations as a function ofmass and redshift even in cosmologies with w 6= −1, wehave investigated the effects of dark energy on a compari-son between model predictions and observations of centralhalo densities. Zentner and Bullock (2002) found that theobserved distribution of ∆V/2 as a function of Vmax is in-consistent with the predictions of the B01 model for ΛCDMand σ8 = 0.9. The model predicts haloes that are simplytoo concentrated (see also Primack 2003). A lower value ofσ8 = 0.75, as used in our simulations, can alleviate this dis-crepancy, but such models may face other difficulties regard-ing early reionization (Somerville, Bullock, & Livio 2003)and possibly with reproducing the properties of halo sub-structure (Zentner & Bullock 2003). Including the effectsof dark energy, we find that for models with w > −1 theproblem is exacerbated because haloes collapse earlier andbecause they have higher virial overdensities. Note that forthe extreme case of w = −0.5, even a normalization aslow as σ8 = 0.6 seems disfavored by the data. Thus oneinteresting conclusion is that the rotation curves of galax-ies coupled only with a weak prior on the normalization ofthe power spectrum of density fluctuations seem to disfa-vor quintessence models with w significantly larger than −1without measuring the expansion history of the Universe, asis done in SNIa analyses. Models with w < −1 do better,
Dark Energy and Dark Matter Haloes 15
and can tolerate higher values of σ8 ∼ 0.8, but not high ashigh as σ8 ∼ 1, as is suggested the CMB normalization. 2
As we have pointed out throughout this paper, therehave been a number of previous studies of the effects of darkenergy (w 6= −1) on dark matter halo abundances and con-centrations. Here we summarize how this work distinguishesitself from these past efforts. We have shown for the firsttime how results for ∆vir and the linear transfer function aremodified for dark energy with w < −1. In addition we haveexpanded on previous studies (Schuecker et al. 2003) of δc
in phantom cosmologies. We have pointed out that there aresignificant differences in the amplitude and w-dependence ofσ8 between normalizations based on the CMB and galaxycluster abundances. For the first time we have been ableto draw a distinction between a definition of concentrationbased on a cosmology-dependent Rvir and constant R200,and found that our simulations prefer the former. Unlikeprevious studies of the effects of dark energy on halo con-centrations (Klypin et al. 2003; Dolag et al. 2003), whichanalysed a small number of pre-selected haloes, we have per-formed an analysis of ∼ 1600 haloes in each simulation. Thisallowed us to directly test the B01 model for c(M, z) withstatistical significance. Furthermore these previous studiesfocused on group- and cluster-sized haloes, whereas we haveextended this study down to galaxy mass haloes. Lastly, wehave shown for the first time how different values of w andpower spectrum normalizations affect the theoretical predic-tions of ∆V/2 vs. Vmax. A comparison to observations showsthat models with w as low as -0.50 are strongly disfavoredfor any value of σ8, standard ΛCDM models require σ8 <
∼ 0.8,and models with w < −1 can accomodate higher values ofσ8.
As future observations further constrain the nature ofdark energy, it will become necessary to extend these typesof studies to more realistic models of dark energy. Futuresimulations with higher mass and force resolution, includ-ing the effects of baryons, and incorporating more realisticdark energy models will further advance our understandingof the interplay between cosmology and dark matter halostructure.
We thank P. Madau for interesting and helpful discus-sions. MK is supported by NSF grant AST-0205738. LESis supported by the Department of Energy grant DE-FG02-91ER40690. ARZ is supported by The Center for Cosmo-logical Physics at The University of Chicago under NSFPHY 0114422. JSB is supported by NASA through HubbleFellowship grant HF-01146.01-A from the Space TelescopeScience Institute, which is operated by the Association ofUniversities for Research in Astronomy, Incorporated, un-der NASA contract NAS5-26555. JRP is supported by NSFgrant AST-0205944. ARZ thanks The Center for Cosmologyand Particle Physics at New York University for their hospi-tality during several visits while this work was in progress.We thank V. Springel for use of the publicly-available codeGADGET and we than U. Seljak and M. Zaldarriaga for useof the publicly-available code CMBFAST.
2 Note that using K = 3.5 instead of K = 4.0 would not changeany of the conclusions regarding galaxy rotation curves and thecentral density problem.
REFERENCES
Alam S. M. K., Bullock J. S., Weinberg D. H., 2002, ApJ, 572, 34
Allen P. R., Trilling D. E., Koerner D. W., Reid I. N., 2003, ApJ,595, 1206
Barris J. B., et al. , 2003, ApJ, 602, 571
Bartelmann M., Perotta F., Baccigalupi C., 2002, A&A, 396, 21
Blumenthal G. R., Faber S. M., Flores R., Primack J. R., 1986,ApJ, 301, 27
Bucher M., Spergel D., 1999, Phys. Rev. D, 60, 043505
Bullock J. S., et al. , 2001, MNRAS, 321, 559 (B01)
Bullock J. S. 2002, The shapes of galaxies and their dark haloes,Proceedings of the Yale Cosmology Workshop ”The Shapesof Galaxies and Their Dark Matter Halos”, New Haven,Connecticut, USA, 28-30 May 2001. Edited by Priyam-vada Natarajan. Singapore: World Scientific, 2002, ISBN9810248482, p.109, 109
Caldwell R. R., 2002, Phys. Lett. B, 545, 23
Caldwell R. R., Dave R., Steinhardt P. J., 1998, Phys. Rev. Let-ters, 80, 1582
Carlstrom J. E., Holder G., and Reese E. D., 2001, ARAA, 40,643
Carroll S. M., Hoffman M., Trodden M., 2003, Phys. Rev. D, 68,023509
Cline, J. M., Jeon S., & Moore, G. D., 2003, Phys. Rev. D, sub-mitted, (preprint: hep-ph/0311312)
Colin P., Klypin A. A., Valenzuela O., Gottlober S., 2003, ApJ,submitted, (preprint: astro-ph/0308348)
Dave R., Caldwell R. R., Steinhardt P, J., 2002, Phys. Rev. D,66, 023516
Davis M., Efstathiou G., Frenk C. S., White S. D. M., 1985, ApJ,292, 371
de Blok W. J. G., McGaugh S. S., 1997, MNRAS, 290, 533
de Blok W. J. G., McGaugh S. S., Rubin V. C., 2001, AJ, 122,2396
de Blok W. J. G., Bosma A. A., McGaugh S. S., 2003, MNRAS340, 657
Dodelson S., et al. , 2002, ApJ, 572, 140
Dolag K., Bartelmann, M., Perrotta, F., Baccigalupi, C., Moscar-dini, L., Meneghetti, M., Tormen, G., 2003, A&A, 416, 853
Eke V. R., Navarro J. F., Steinmetz M., 2001, ApJ, 554, 114
Flores R., Bullock J. S., Kravtsov A. V., Allgood B., PrimackJ. R., 2004, in preparation
Ghigna S., Moore B., Governato F., Lake G., Quinn T., StadelJ., 1998, MNRAS, 300, 146
Hayashi E., et al. , 2003, MNRAS, submitted (preprint:astro-ph/0310576)
Hoekstra H., Yee H. K. C., Gladders M. D, 2003, ApJ, in print(preprint: astro-ph/0306515)
Hu W., Sugiyama N., 1995, ApJ, 444, 489
Hu. W., Jain B., 2003, Phys. Rev. D, submitted (pre-print:astro-ph/0312395)
Huterer D., Ma C.-P., 2004, ApJ, 600, L7
Jenkins A., et al. , 2001, MNRAS, 321, 372 (J01)
Jing Y. P., 2000, ApJ, 535, 30
Jing Y. P., Suto S., 2002, ApJ, 574, 538
Klypin A. A., Holtzman J., 1997, astro-ph/9712217
Klypin A. A., Kravtsov A. V., Bullock J. S., Primack J. R., 2001,ApJ, 554, 903
Klypin A. A., Maccio A. V., Mainini R., Bonometto S. A., 2003,ApJ, 599, 31
Knop R.A. et al. , 2003, ApJ, 598, 102
Kravtsov A. V., Klypin A. A., Khokhlov A. M., 1997, ApJS, 111,73
Kuhlen M., Keeton C. R., Madau P., 2004, ApJ, 601, 104
Kujat J., Linn A. M., Scherrer R. J., Weinberg D. H., 2002, ApJ,572, 1
Lacey C., Cole S., 1993, MNRAS, 262, 627

16 Kuhlen et al.
Lee J., Shandarin S.F., 1999, ApJ, 517, L5
Linder E. V., Jenkins A., 2003, MNRAS, 346, 573 Lokas E. L., Bode P., Hoffman Y., 2004, MNRAS, 349, 595Ma C.-P., Bertschinger E., 1995 ApJ, 455, 7Ma C.-P., Caldwell R. R. Bode, P. Wang L., 1999 ApJ, 521, L1Maccio A. V., Quercellini C., Mainini R., Amendola L.,
Bonometto S. A., 2003, Phys. Rev. D, submitted (preprint:astro-ph/0309671)
Mainini, R., Maccio A. V., & Bonometto, S. A., 2003, New As-tronomy, 8, 173
Molinari E., Zacchei A., 2002, ApJ, 575, 801McGaugh S. S., Barker M., de Blok W. J. G., 2003, ApJ, 584,
566Monaco P., 1995, ApJ, 447, 23Mota, D. F., & van de Bruck, C., 2004, A&A, 421, 71Navarro J. F., Frenk C. S., White S. D. M., 1995, MNRAS, 275,
56Navarro J. F., Frenk C. S., White S. D. M., 1996, ApJ, 462, 563Navarro J. F., Frenk C. S., White S. D. M., 1997, ApJ, 490, 493Navarro J. F., et al. , 2003, MNRAS, in print (preprint:
astro-ph/0311231)Perlmutter S., et al. , 1999, ApJ, 517, 565Pierpaoli E., Scott D., White M., 2001, MNRAS, 325, 77Pierpaoli E., Borgani S., Scott D., White M., 2003, MNRAS, 342,
163Power C., Navarro J. F., Jenkins A., Frenk C. S., White S. D. M.,
Springel V., Stadel J., Quinn T., 2003, MNRAS, 338, 14Press W. H., Schechter P., 1974, ApJ, 187, 425Primack J. R., 2003, IAU 220 Proceedings (pre-print:
astro-ph/0312459)Ratra B., Peebles P. J. E., 1988, Phys. Rev. D, 37, 3406Reiprich T. H., Bohringer H., 2002, ApJ, 567, 716Riess A. G., et al. , 2001, ApJ, 560, 49Sarbu N., Rusin D., Ma C.-P., 2001, ApJ, 561, L147Schuecker P., Caldwell R. R., Bohringer H., Collins C. A., Guzzo
L., Weinberg N. N., 2003, A&A, 402, 53Seljak U., 2002, MNRAS, 337, 769Seljak U., Zaldarriaga M., 1999, ApJ, 469, 437Sheth R. K., Tormen G., 1999, MNRAS, 308, 119Silveira V., Waga I., 1994, Phys. Rev. D, 50, 4890Somerville R. S., Bullock J. S., Livio M., 2003, ApJ, 593, 616Spergel D. N., et al. , 2003, ApJS, 148, 175Springel V., Yoshida N., White S. D. M., 2001, New Astronomy,
6, 51Swaters R. A., 1999, PhD Thesis, University of GroningenSwaters R. A., Madore B. F., van den Bosch F. C., Balcells M.,
2003, ApJ, 583, 732
Tegmark M. et al., 2003a, Phys. Rev. D, in print (pre-print:astro-ph/0310723)
Tegmark M. et al., 2003b, ApJ, submitted(preprint:astro-ph/0310725)
Tasitsiomi A., Kravtsov A. V., Gottloeber S., Klypin A. A., 2003,ApJ, submitted (preprint:astro-ph/0311062)
Wang L., Steinhardt P. J., 1998, ApJ, 508, 483Wechsler R. H., Bullock J. S., Primack J. R., Kravtsov A. V.,
Dekel A., 2002, ApJ, 568, 52 (W02)Weinberg N. N., Kamionkowski M., 2003, MNRAS, 341, 251Zentner A. R., Bullock J. S., 2002, Phys. Rev. D, 66, 043003Zentner A. R., Bullock J. S., 2003, ApJ, 598, 49Zhao D. H., Jing Y. P., Mo H. J., Borner G., 2003, ApJ, 597, L9