Dairying in antiquity. I. Evidence from absorbed lipid residues dating to the British Iron Age
17
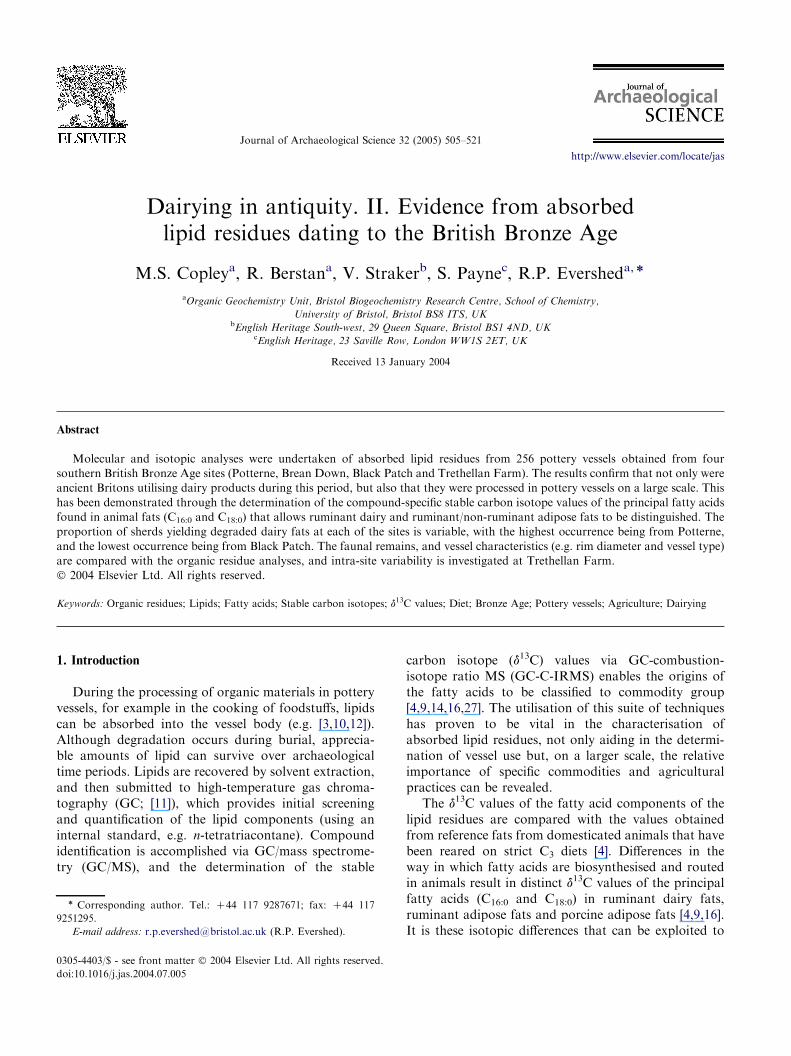
Dairying in antiquity. II. Evidence from absorbed lipid residues dating to the British Bronze Age M.S. Copley a , R. Berstan a , V. Straker b , S. Payne c , R.P. Evershed a, ) a Organic Geochemistry Unit, Bristol Biogeochemistry Research Centre, School of Chemistry, University of Bristol, Bristol BS8 ITS, UK b English Heritage South-west, 29 Queen Square, Bristol BS1 4ND, UK c English Heritage, 23 Saville Row, London WW1S 2ET, UK Received 13 January 2004 Abstract Molecular and isotopic analyses were undertaken of absorbed lipid residues from 256 pottery vessels obtained from four southern British Bronze Age sites (Potterne, Brean Down, Black Patch and Trethellan Farm). The results confirm that not only were ancient Britons utilising dairy products during this period, but also that they were processed in pottery vessels on a large scale. This has been demonstrated through the determination of the compound-specific stable carbon isotope values of the principal fatty acids found in animal fats (C 16:0 and C 18:0 ) that allows ruminant dairy and ruminant/non-ruminant adipose fats to be distinguished. The proportion of sherds yielding degraded dairy fats at each of the sites is variable, with the highest occurrence being from Potterne, and the lowest occurrence being from Black Patch. The faunal remains, and vessel characteristics (e.g. rim diameter and vessel type) are compared with the organic residue analyses, and intra-site variability is investigated at Trethellan Farm. Ó 2004 Elsevier Ltd. All rights reserved. Keywords: Organic residues; Lipids; Fatty acids; Stable carbon isotopes; d 13 C values; Diet; Bronze Age; Pottery vessels; Agriculture; Dairying 1. Introduction During the processing of organic materials in pottery vessels, for example in the cooking of foodstuffs, lipids can be absorbed into the vessel body (e.g. [3,10,12]). Although degradation occurs during burial, apprecia- ble amounts of lipid can survive over archaeological time periods. Lipids are recovered by solvent extraction, and then submitted to high-temperature gas chroma- tography (GC; [11]), which provides initial screening and quantification of the lipid components (using an internal standard, e.g. n-tetratriacontane). Compound identification is accomplished via GC/mass spectrome- try (GC/MS), and the determination of the stable carbon isotope (d 13 C) values via GC-combustion- isotope ratio MS (GC-C-IRMS) enables the origins of the fatty acids to be classified to commodity group [4,9,14,16,27]. The utilisation of this suite of techniques has proven to be vital in the characterisation of absorbed lipid residues, not only aiding in the determi- nation of vessel use but, on a larger scale, the relative importance of specific commodities and agricultural practices can be revealed. The d 13 C values of the fatty acid components of the lipid residues are compared with the values obtained from reference fats from domesticated animals that have been reared on strict C 3 diets [4]. Differences in the way in which fatty acids are biosynthesised and routed in animals result in distinct d 13 C values of the principal fatty acids (C 16:0 and C 18:0 ) in ruminant dairy fats, ruminant adipose fats and porcine adipose fats [4,9,16]. It is these isotopic differences that can be exploited to ) Corresponding author. Tel.: C44 117 9287671; fax: C44 117 9251295. E-mail address: [email protected] (R.P. Evershed). 0305-4403/$ - see front matter Ó 2004 Elsevier Ltd. All rights reserved. doi:10.1016/j.jas.2004.07.005 Journal of Archaeological Science 32 (2005) 505–521 http://www.elsevier.com/locate/jas
Transcript of Dairying in antiquity. I. Evidence from absorbed lipid residues dating to the British Iron Age
Journal of Archaeological Science 32 (2005) 505–521
http://www.elsevier.com/locate/jas
Dairying in antiquity. II. Evidence from absorbedlipid residues dating to the British Bronze Age
M.S. Copleya, R. Berstana, V. Strakerb, S. Paynec, R.P. Eversheda,)
aOrganic Geochemistry Unit, Bristol Biogeochemistry Research Centre, School of Chemistry,
University of Bristol, Bristol BS8 ITS, UKbEnglish Heritage South-west, 29 Queen Square, Bristol BS1 4ND, UK
cEnglish Heritage, 23 Saville Row, London WW1S 2ET, UK
Received 13 January 2004
Abstract
Molecular and isotopic analyses were undertaken of absorbed lipid residues from 256 pottery vessels obtained from foursouthern British Bronze Age sites (Potterne, Brean Down, Black Patch and Trethellan Farm). The results confirm that not only wereancient Britons utilising dairy products during this period, but also that they were processed in pottery vessels on a large scale. This
has been demonstrated through the determination of the compound-specific stable carbon isotope values of the principal fatty acidsfound in animal fats (C16:0 and C18:0) that allows ruminant dairy and ruminant/non-ruminant adipose fats to be distinguished. Theproportion of sherds yielding degraded dairy fats at each of the sites is variable, with the highest occurrence being from Potterne,
and the lowest occurrence being from Black Patch. The faunal remains, and vessel characteristics (e.g. rim diameter and vessel type)are compared with the organic residue analyses, and intra-site variability is investigated at Trethellan Farm.� 2004 Elsevier Ltd. All rights reserved.
Keywords: Organic residues; Lipids; Fatty acids; Stable carbon isotopes; d13C values; Diet; Bronze Age; Pottery vessels; Agriculture; Dairying
1. Introduction
During the processing of organic materials in potteryvessels, for example in the cooking of foodstuffs, lipidscan be absorbed into the vessel body (e.g. [3,10,12]).Although degradation occurs during burial, apprecia-ble amounts of lipid can survive over archaeologicaltime periods. Lipids are recovered by solvent extraction,and then submitted to high-temperature gas chroma-tography (GC; [11]), which provides initial screeningand quantification of the lipid components (using aninternal standard, e.g. n-tetratriacontane). Compoundidentification is accomplished via GC/mass spectrome-try (GC/MS), and the determination of the stable
) Corresponding author. Tel.: C44 117 9287671; fax: C44 117
9251295.
E-mail address: [email protected] (R.P. Evershed).
0305-4403/$ - see front matter � 2004 Elsevier Ltd. All rights reserved.
doi:10.1016/j.jas.2004.07.005
carbon isotope (d13C) values via GC-combustion-isotope ratio MS (GC-C-IRMS) enables the origins ofthe fatty acids to be classified to commodity group[4,9,14,16,27]. The utilisation of this suite of techniqueshas proven to be vital in the characterisation ofabsorbed lipid residues, not only aiding in the determi-nation of vessel use but, on a larger scale, the relativeimportance of specific commodities and agriculturalpractices can be revealed.
The d13C values of the fatty acid components of thelipid residues are compared with the values obtainedfrom reference fats from domesticated animals that havebeen reared on strict C3 diets [4]. Differences in theway in which fatty acids are biosynthesised and routedin animals result in distinct d13C values of the principalfatty acids (C16:0 and C18:0) in ruminant dairy fats,ruminant adipose fats and porcine adipose fats [4,9,16].It is these isotopic differences that can be exploited to
506 M.S. Copley et al. / Journal of Archaeological Science 32 (2005) 505–521
enable the detection of the processing of dairy productsin pottery vessels and hence the importance of dairyingas a component of prehistoric agriculture to be assessed.
In a previous paper [5], organic residue analysis pro-vided direct evidence for widespread dairying in theBritish Iron Age. Furthermore, differences in actual useof the vessels and vessel type and rim diameter weredetected. We now extend these investigations to earlierperiods with pottery vessels from four Bronze Age sitesin Britain, which are discussed in detail herein. The foursites are Potterne, Wiltshire (sherds dated to the lateBronze Age/early Iron Age), Trethellan Farm, Cornwall(sherds dated to the middle Bronze Age), Brean Down,Somerset (sherds dated from the early to late BronzeAge), and Black Patch, Sussex (sherds dated to themiddle Bronze Age). At both Trethellan Farm and BlackPatch, sherds were selected from several of the huts thathave been excavated, thus permitting the possibility ofany intra-site variations in vessel use/deposition to beinvestigated. Furthermore, the relationships betweencommodity group and vessel characteristics, such astype and rim diameter, are also discussed. Althoughprimarily interested in the detection of dairy fats inprehistoric pottery, of course this is not pursued to theexclusion of other types of absorbed lipid residues (e.g.from pigs or plants), which all contribute significantly tothe overall reconstruction of past farming practices.
2. Materials and methods
2.1. The selection of the potsherds
A total of 256 sherds from the four Bronze Age siteswere selected for absorbed organic residue analysis.Where possible, rim or upper body sherds were chosenfrom vessel forms likely to have been used in theprocessing of foodstuffs. The 69 sherds from Potternewere either jars or bowls [19]. A further 69 potsherdsfrom Trethellan Farm were submitted for analysis, all ofwhich were Trevisker Style pottery vessels (primarilyround-bottomed jars) which were found to predominateat the site (Woodward and Ellison in [28]). Threedifferent vessel types were investigated from BreanDown (59 sherds were selected) associated with the threemain periods within the Bronze Age [34]. The earlyBronze Age vessels are dominated by biconical urns,while the middle Bronze Age comprises Trevisker Stylepottery, and the late Bronze Age is dominated by plainwares (jars and bowls). A total of 59 sherds from BlackPatch [8] were also selected. The sherds that comprise theBlack Patch pottery assemblage are small, henceattributing a vessel type and form to the majority of thesherds was not possible, although the predominant vesseltype is the jar (Ellison in [8]). Appendix 1 lists the sherds,their illustrated sherd numbers (where applicable), the
contexts from which they were excavated and their vesselforms.
2.2. The analytical protocol
The protocol followed has been described in detail inearlier papers (e.g. [5,11,16]). Briefly, this procedureinvolves the crushing of the potsherds, extraction of thelipids with solvent, yielding a total lipid extract (TLE). Aproportion of the TLEs were then derivatised for GCanalyses. A further proportion of the TLE was sapon-ified and fatty acid methyl esters (FAMEs) prepared.These FAMEs were then screened by GC and submittedto GC-C-IRMS analyses so that their d13C values couldbe determined. All GC and MS conditions are identicalto those of Copley et al. [5]. Statistical analysis wasperformed using SYSTAT 7.0 (SPSS Inc., Chicago).
3. Results and discussion
3.1. Survival of absorbed lipids
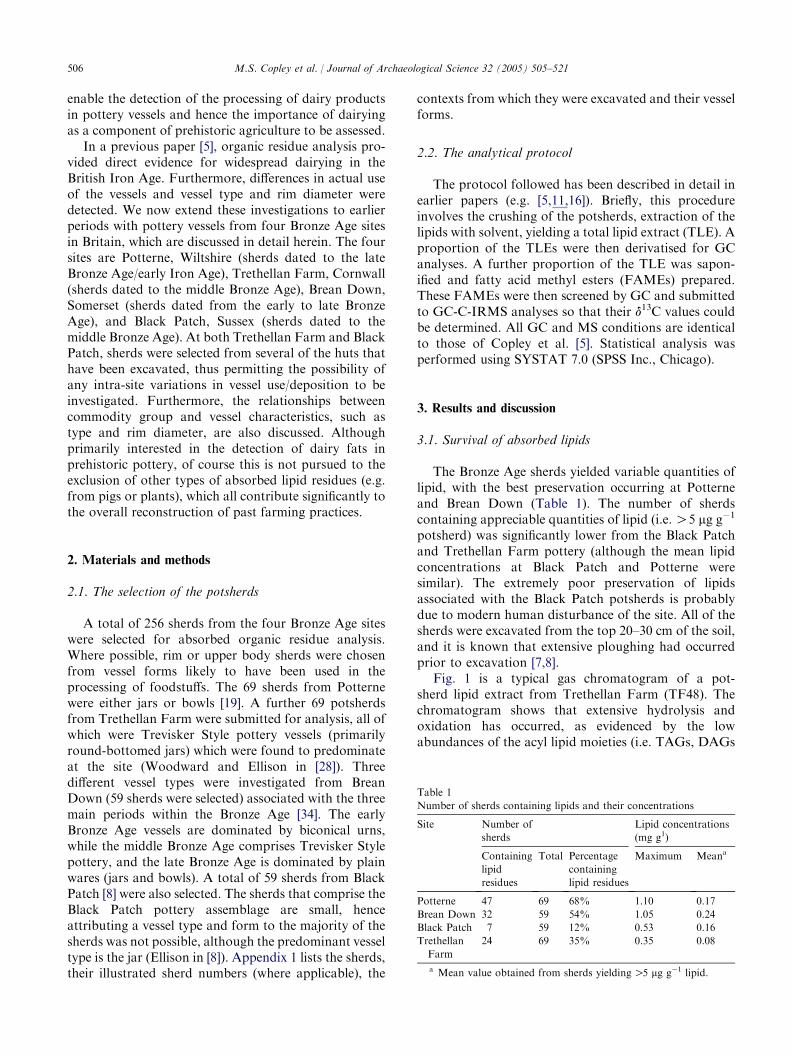
The Bronze Age sherds yielded variable quantities oflipid, with the best preservation occurring at Potterneand Brean Down (Table 1). The number of sherdscontaining appreciable quantities of lipid (i.e.O5 mg g�1
potsherd) was significantly lower from the Black Patchand Trethellan Farm pottery (although the mean lipidconcentrations at Black Patch and Potterne weresimilar). The extremely poor preservation of lipidsassociated with the Black Patch potsherds is probablydue to modern human disturbance of the site. All of thesherds were excavated from the top 20–30 cm of the soil,and it is known that extensive ploughing had occurredprior to excavation [7,8].
Fig. 1 is a typical gas chromatogram of a pot-sherd lipid extract from Trethellan Farm (TF48). Thechromatogram shows that extensive hydrolysis andoxidation has occurred, as evidenced by the lowabundances of the acyl lipid moieties (i.e. TAGs, DAGs
Table 1
Number of sherds containing lipids and their concentrations
Site Number of
sherds
Lipid concentrations
(mg g1)
Containing
lipid
residues
Total Percentage
containing
lipid residues
Maximum Meana
Potterne 47 69 68% 1.10 0.17
Brean Down 32 59 54% 1.05 0.24
Black Patch 7 59 12% 0.53 0.16
Trethellan
Farm
24 69 35% 0.35 0.08
a Mean value obtained from sherds yieldingO5 mg g�1 lipid.
507M.S. Copley et al. / Journal of Archaeological Science 32 (2005) 505–521
10 20
Time (min)
C18
:1
C14
:0
C15
:0br
, C15
:0
C17
:0br
, C17
:0
Rel
ativ
e in
tens
ity
30 40
C16:0
T46
T48
T50
T52
T54
C18:0
IS
DAGsMAGs
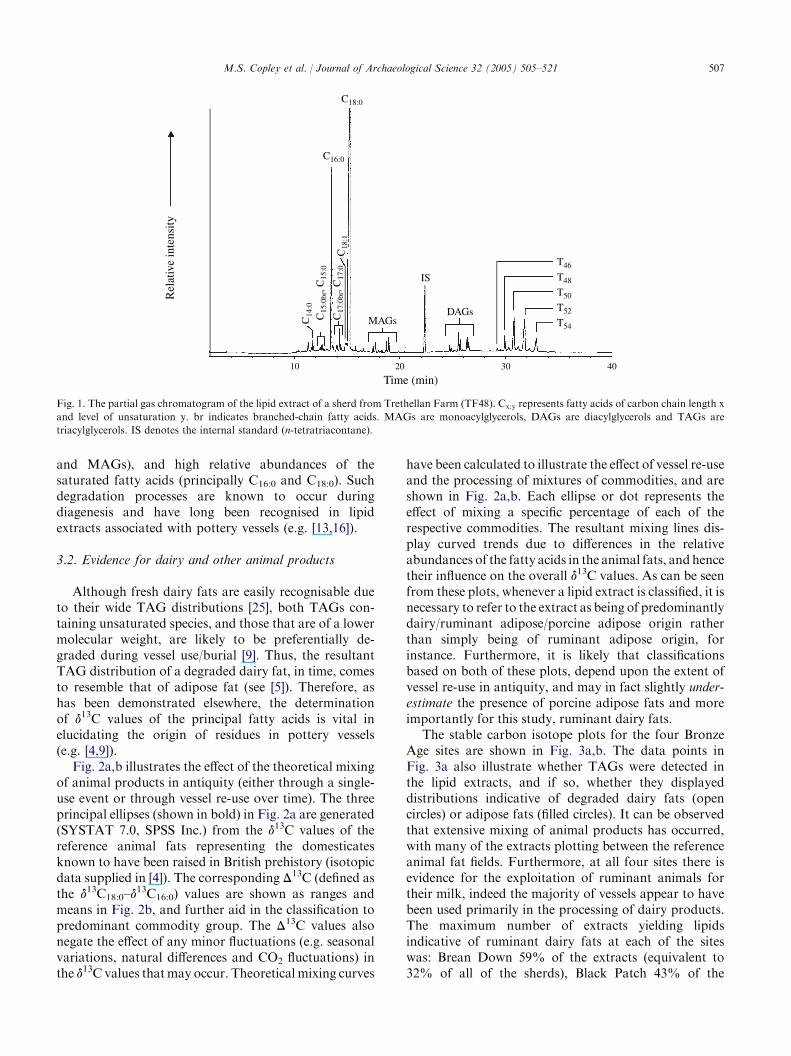
Fig. 1. The partial gas chromatogram of the lipid extract of a sherd from Trethellan Farm (TF48). Cx:y represents fatty acids of carbon chain length x
and level of unsaturation y. br indicates branched-chain fatty acids. MAGs are monoacylglycerols, DAGs are diacylglycerols and TAGs are
triacylglycerols. IS denotes the internal standard (n-tetratriacontane).
and MAGs), and high relative abundances of thesaturated fatty acids (principally C16:0 and C18:0). Suchdegradation processes are known to occur duringdiagenesis and have long been recognised in lipidextracts associated with pottery vessels (e.g. [13,16]).
3.2. Evidence for dairy and other animal products
Although fresh dairy fats are easily recognisable dueto their wide TAG distributions [25], both TAGs con-taining unsaturated species, and those that are of a lowermolecular weight, are likely to be preferentially de-graded during vessel use/burial [9]. Thus, the resultantTAG distribution of a degraded dairy fat, in time, comesto resemble that of adipose fat (see [5]). Therefore, ashas been demonstrated elsewhere, the determinationof d13C values of the principal fatty acids is vital inelucidating the origin of residues in pottery vessels(e.g. [4,9]).
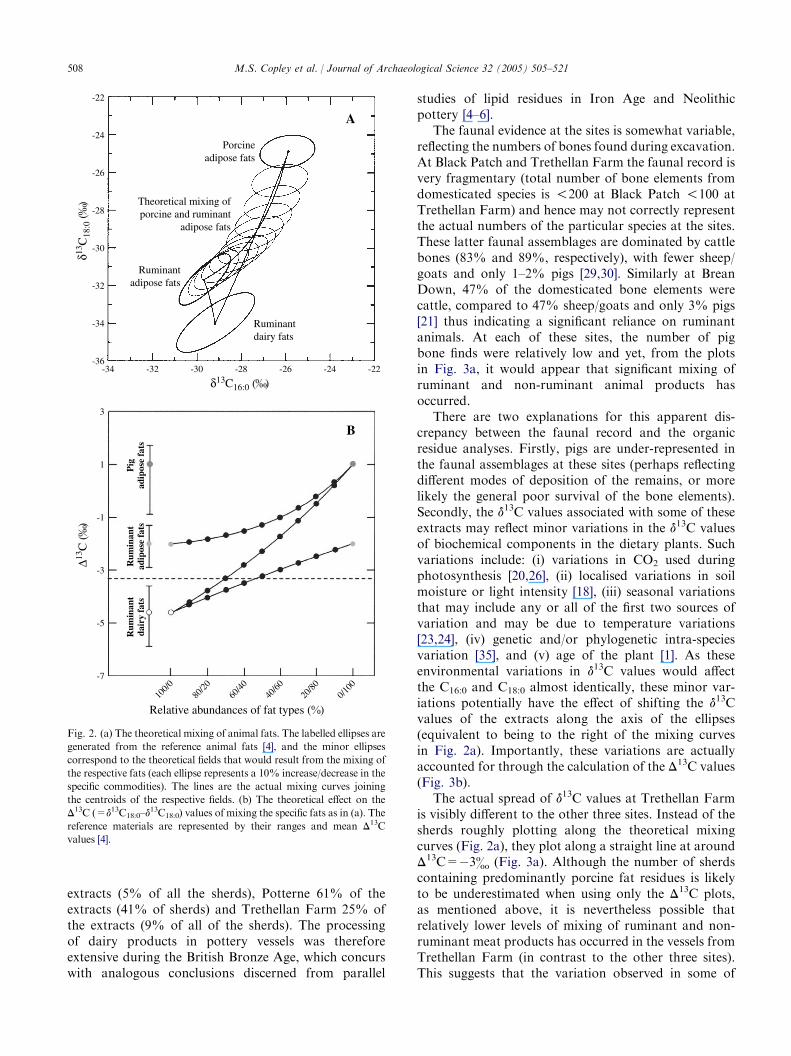
Fig. 2a,b illustrates the effect of the theoretical mixingof animal products in antiquity (either through a single-use event or through vessel re-use over time). The threeprincipal ellipses (shown in bold) in Fig. 2a are generated(SYSTAT 7.0, SPSS Inc.) from the d13C values of thereference animal fats representing the domesticatesknown to have been raised in British prehistory (isotopicdata supplied in [4]). The corresponding D13C (defined asthe d13C18:0–d
13C16:0) values are shown as ranges andmeans in Fig. 2b, and further aid in the classification topredominant commodity group. The D13C values alsonegate the effect of any minor fluctuations (e.g. seasonalvariations, natural differences and CO2 fluctuations) inthe d13C values thatmay occur. Theoretical mixing curves
have been calculated to illustrate the effect of vessel re-useand the processing of mixtures of commodities, and areshown in Fig. 2a,b. Each ellipse or dot represents theeffect of mixing a specific percentage of each of therespective commodities. The resultant mixing lines dis-play curved trends due to differences in the relativeabundances of the fatty acids in the animal fats, and hencetheir influence on the overall d13C values. As can be seenfrom these plots, whenever a lipid extract is classified, it isnecessary to refer to the extract as being of predominantlydairy/ruminant adipose/porcine adipose origin ratherthan simply being of ruminant adipose origin, forinstance. Furthermore, it is likely that classificationsbased on both of these plots, depend upon the extent ofvessel re-use in antiquity, and may in fact slightly under-estimate the presence of porcine adipose fats and moreimportantly for this study, ruminant dairy fats.
The stable carbon isotope plots for the four BronzeAge sites are shown in Fig. 3a,b. The data points inFig. 3a also illustrate whether TAGs were detected inthe lipid extracts, and if so, whether they displayeddistributions indicative of degraded dairy fats (opencircles) or adipose fats (filled circles). It can be observedthat extensive mixing of animal products has occurred,with many of the extracts plotting between the referenceanimal fat fields. Furthermore, at all four sites there isevidence for the exploitation of ruminant animals fortheir milk, indeed the majority of vessels appear to havebeen used primarily in the processing of dairy products.The maximum number of extracts yielding lipidsindicative of ruminant dairy fats at each of the siteswas: Brean Down 59% of the extracts (equivalent to32% of all of the sherds), Black Patch 43% of the
508 M.S. Copley et al. / Journal of Archaeological Science 32 (2005) 505–521
extracts (5% of all the sherds), Potterne 61% of theextracts (41% of sherds) and Trethellan Farm 25% ofthe extracts (9% of all of the sherds). The processingof dairy products in pottery vessels was thereforeextensive during the British Bronze Age, which concurswith analogous conclusions discerned from parallel
-36
-34
-32
-30
-28
-26
-24
-22
A
B
δ13C
18:0
(
)
-34 -32 -30 -28 -26 -24 -22
δ13C16:0 ( )
Porcineadipose fats
Ruminantadipose fats
Theoretical mixing ofporcine and ruminant
adipose fats
Ruminantdairy fats
-7
100/0
80/20
60/40
40/60
20/80
0/100
-5
-3
-1
1
3
∆13C
(
)
Rum
inan
tda
iry
fats
Rum
inan
tad
ipos
e fa
tsP
igad
ipos
e fa
ts
Relative abundances of fat types ( )
Fig. 2. (a) The theoretical mixing of animal fats. The labelled ellipses are
generated from the reference animal fats [4], and the minor ellipses
correspond to the theoretical fields that would result from the mixing of
the respective fats (each ellipse represents a 10% increase/decrease in the
specific commodities). The lines are the actual mixing curves joining
the centroids of the respective fields. (b) The theoretical effect on the
D13C (=d13C18:0–d13C18:0) values of mixing the specific fats as in (a). The
reference materials are represented by their ranges and mean D13C
values [4].
studies of lipid residues in Iron Age and Neolithicpottery [4–6].
The faunal evidence at the sites is somewhat variable,reflecting the numbers of bones found during excavation.At Black Patch and Trethellan Farm the faunal record isvery fragmentary (total number of bone elements fromdomesticated species is !200 at Black Patch !100 atTrethellan Farm) and hence may not correctly representthe actual numbers of the particular species at the sites.These latter faunal assemblages are dominated by cattlebones (83% and 89%, respectively), with fewer sheep/goats and only 1–2% pigs [29,30]. Similarly at BreanDown, 47% of the domesticated bone elements werecattle, compared to 47% sheep/goats and only 3% pigs[21] thus indicating a significant reliance on ruminantanimals. At each of these sites, the number of pigbone finds were relatively low and yet, from the plotsin Fig. 3a, it would appear that significant mixing ofruminant and non-ruminant animal products hasoccurred.
There are two explanations for this apparent dis-crepancy between the faunal record and the organicresidue analyses. Firstly, pigs are under-represented inthe faunal assemblages at these sites (perhaps reflectingdifferent modes of deposition of the remains, or morelikely the general poor survival of the bone elements).Secondly, the d13C values associated with some of theseextracts may reflect minor variations in the d13C valuesof biochemical components in the dietary plants. Suchvariations include: (i) variations in CO2 used duringphotosynthesis [20,26], (ii) localised variations in soilmoisture or light intensity [18], (iii) seasonal variationsthat may include any or all of the first two sources ofvariation and may be due to temperature variations[23,24], (iv) genetic and/or phylogenetic intra-speciesvariation [35], and (v) age of the plant [1]. As theseenvironmental variations in d13C values would affectthe C16:0 and C18:0 almost identically, these minor var-iations potentially have the effect of shifting the d13Cvalues of the extracts along the axis of the ellipses(equivalent to being to the right of the mixing curvesin Fig. 2a). Importantly, these variations are actuallyaccounted for through the calculation of the D13C values(Fig. 3b).
The actual spread of d13C values at Trethellan Farmis visibly different to the other three sites. Instead of thesherds roughly plotting along the theoretical mixingcurves (Fig. 2a), they plot along a straight line at aroundD13C=�3& (Fig. 3a). Although the number of sherdscontaining predominantly porcine fat residues is likelyto be underestimated when using only the D13C plots,as mentioned above, it is nevertheless possible thatrelatively lower levels of mixing of ruminant and non-ruminant meat products has occurred in the vessels fromTrethellan Farm (in contrast to the other three sites).This suggests that the variation observed in some of

-24 -22
-20 -15
easingne diet
PPP
P
P
inanty
∆13 C = -3
.3
Trethellan Farm
-36
-34
-32
-30
-28
-26
-24
-22
-34 -32 -30 -28 -26 -24 -22
δ13C16:0 ( )
Porcineadipose
fats
Ruminantadipose
fatsRuminantdairyfats
∆13 C = -3
.3
-7
-5
-3
-1
1
3
-40 -35 -30 -25 -20 -15
δ13C16:0 ( )
PredominantlyC3 diet
Increasingmarine diet
Rum
inan
tda
iry
fats
Rum
inan
tad
ipos
e fa
tsPi
g fa
ts
F e ellipses indicate the d13C values of the reference animal fats,
b ducts in the vessel. D13C (=d13C18:0–d13C16:0) values of lower
th e fats. The open circles represent those with typical degraded
d circle denotes that plant lipids were also detected, whilst a ‘‘B’’
re e right, then the greater the marine component of the animals’’
d
509
M.S.Copley
etal./JournalofArch
aeologica
lScien
ce32(2005)505–521
-36
-34
-32
-30
-28
-26
-24
-22A
B
Potterne Black Patch Brean Down
-36
-34
-32
-30
-28
-26
-24
-22
-36
-34
-32
-30
-28
-26
-24
-22
δ13C
18:0
(
)
-7
-5
-3
-1
1
3
-7
-5
-3
-1
1
3
-7
-5
-3
-1
1
3
∆13C
(
)
-34 -32 -30 -28 -26 -24 -22
δ13C16:0 ( )-34 -32 -30 -28 -26 -24 -22
δ13C16:0 ( )-34 -32 -30 -28 -26
δ13C16:0 ( )
-40 -35 -30 -25 -20 -15
δ13C16:0 ( )-40 -35 -30 -25 -20 -15
δ13C16:0 ( )-40 -35 -30 -25
δ13C16:0 ( )
Porcineadipose
fats
PredominantlyC3 diet
Increasingmarine diet
Rum
inan
tda
iry
fats
Rum
inan
tad
ipos
e fa
tsPi
g fa
ts
PredominantlyC3 diet
Increasingmarine diet
Rum
inan
tda
iry
fats
Rum
inan
tad
ipos
e fa
tsPi
g fa
ts
PredominantlyC3 diet
Incrmari
Rum
inan
tda
iry
fats
Rum
inan
tad
ipos
e fa
tsPi
g fa
ts
Ruminantadipose
fats
P
P
PP
P
P
PP,B
P,B P
Ruminantdairyfats
∆13 C = -3
.3
Porcineadipose
fats
Ruminantadipose
fatsRuminantdairyfats
∆13 C = -3
.3
Porcineadipose
fats
Ruminantadipose
fatsRumdairfats
ig. 3. (a) Plot of the d13C values of the FAMEs of C16:0 and C18:0, prepared from lipid extracts from the six pottery assemblages. Th
ased on which the archaeological extracts are classified [4]. Sherds plotting in between the ellipses represent the mixing of animal pro
an �3.3& indicate dairy fats. The black filled circles represent extracts containing TAG distributions indicative of degraded adipos
airy fat TAG distributions, whilst the circles with crosses within them represent sherds that yielded no TAGs. A ‘‘P’’ adjacent to the
presents the presence of beeswax. (b) D13C values of the extracts plotted against their d13C16:0 values. The further the sherds plot to th
iet. The reference materials are represented by their ranges and mean D13C values [4].
510 M.S. Copley et al. / Journal of Archaeological Science 32 (2005) 505–521
the Trethellan Farm extracts may be related to envi-ronmental stresses affecting the plants grown in theassociated field systems (which are in close proximity tothe coast), and hence may even be subjected to sea-sprayeffects.
The scatterplot of the D13C and d13C16:0 values ofthe Brean Down extracts, displayed in Fig. 3b, whencompared with the Black Patch and Trethellan Farmextracts, exhibits a slightly wider range of d13C16:0 valuessuggesting that there maybe a minor marine componentin the animals’ diet. Indeed, at Brean Down there isevidence for the presence of salt marsh plants and seaweed [32], and it may be this that is reflected in the d13Cvalues of the fatty acids of the domesticated animals. Theextracts from Black Patch and Trethellan Farm do notdisplay such wide ranges in the d13C16:0 values, indicatingthat the animals were most likely completely fed onterrestrial plants, which is consistent with the evidencefrom the charred plant macrofossils from the sites(Straker in [28]; Hinton in [8]). Given that localisedisotopic variation is likely to account for the majority ofthe Trethellan Farm extracts that plot in between theruminant and porcine reference ellipses in Fig. 3a, this isnot the case at Black Patch or BreanDown, where there isevidence for the ‘cooking’ of porcine meat products insignificantly higher abundances than the faunal remainswould suggest.
At Potterne, the majority of the domesticated animalbones are from ruminants (c. 20–35% cattle and c. 55–75% sheep/goats over the period of occupation), mostof which were under 4 years of age at death, possiblyindicating an emphasis on mixed milk/meat production[22]. There was also slightly higher abundances of pigbones (c. 10%) compared to the other Bronze Age sites,most of which were over 2 years of age. Evidence forthe cooking of porcine products is also observed inthe pottery residues which indicate extensive mixingof ruminant and non-ruminant animal products inantiquity.
3.3. Plant and beeswax products
As well as containing animal fats, a number of sherdsyielded plant-derived lipids (labelled ‘‘P’’ in Fig. 3a),although always in low abundances. The recognition ofplant lipids in pottery vessels relies upon the detectionof compounds such as n-alkanes (principally C27–C33),n-alcohols (principally C24–C34), b-sitosterol and, wherethey survive intact, palmitic and stearic wax esters(C40–C52). Some or all of these compounds weredetected in three of the extracts from Brean Down(two of which were also associated with dairy fats whilstthe third was not associated with any type of animalfat), a further eight of the Trethellan Farm extractsyielded plant-derived lipids (four of which were associ-ated with adipose fats, two with dairy fats and a further
two with no animal fats at all). None of the sherds fromBlack Patch contained plant lipids. Finally, at Potternesix sherds contained plant-derived lipids as well asadipose fats and a further sherd contained both plantcompounds and dairy products. In total, this equatesto only approximately 15% of the all of the BronzeAge extracts exhibiting an epicuticular plant lipidcomponent (or 7% of all of the sherds) actually con-taining detectable concentrations of plant compounds.Although this prevalence is relatively low, it is incon-ceivable that this is a fair reflection of the importance ofplants to the Bronze Age diet. Plants contain signifi-cantly lower abundances of lipid compared to animalfats, and hence during their cooking in pottery vessels,not only will fatty acids of an animal fat originpredominate, but also the minor plant biomolecularcomponents may not be present in detectable quantities.Furthermore, there is a possibility that certain types ofplant were processed by other means than boiling [33].However, it is clear that relatively few of the vesselsfrom the British Bronze Age were used to process onlyplants in, which is in contrast with evidence from otherparts of the world (e.g. Egypt; [2], South Africa;Rothman, Stott, Berstan and Evershed, unpublishedresults).
Beeswax contains lipids that can survive over archae-ological time-spans [14,15,17,31], and its detection islikely to represent the addition of honey to otherfoodstuffs or the application of beeswax to potteryvessels in order to improve impermeability. This com-modity can be detected through a range of palmiticwax esters (C40–C50), hydroxy wax esters C42–C50), aswell as n-alkanes (C25–C31), n-alcohols (C24–C34) and thehydrolysis product 15-hydroxy palmitic acid. Potternewas the only Bronze Age site with sherds containingbeeswax-derived lipids (annotated ‘‘B’’ in Fig. 3a); twoof these also yielded animal fats and plant lipids anda further one sherd was found only to contain beeswax.The lower numbers of sherds containing beeswax lipidsis typical of prehistoric Britain and suggests that thisparticular commodity was not utilised to any greatextent in vessels associated with the cooking/processingof foodstuffs. It may be that other types of potteryvessels are more likely to be associated with the use/application of beeswax (e.g. lamps and combed wares;[14,15,17]).
3.4. Vessel types and rim diameters
A study of the absorbed lipid residues from Iron Agevessels suggested that there were no major differences inthe actual use of specific vessel types, e.g. jars and‘sauce-pan pots’ [5]. It was not possible to accomplisha similar evaluation of the Bronze Age pottery fromall of the sites due to the homogeneity of the potteryassemblages at any given time period; where different
511M.S. Copley et al. / Journal of Archaeological Science 32 (2005) 505–521
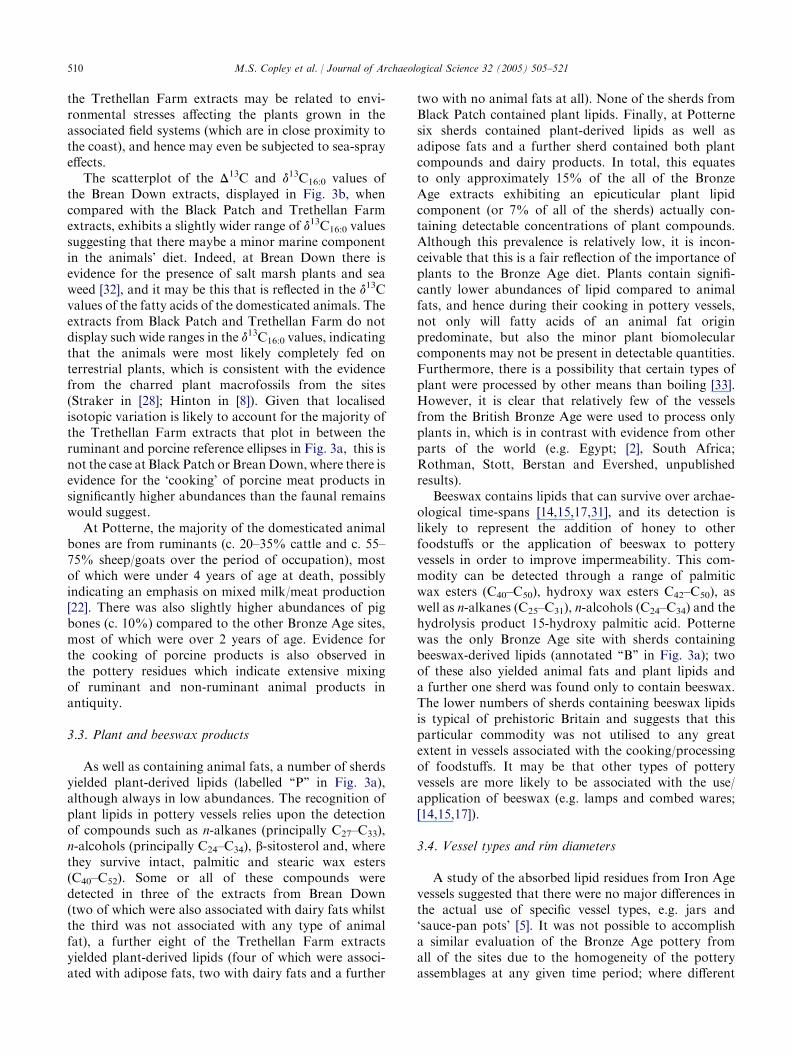
vessel types are recovered during excavation, these areoften associated with the date of the contexts that theycame from (e.g. Brean Down). The one exception wasthe late Bronze Age/early Iron Age site of Potterne,which is primarily a jar and bowl assemblage. Fig. 4is a bar chart of the number of bowls and jars yieldingthe main commodity groups. The jars were almostequally as likely to yield dairy fats or adipose fats asthey were to contain no lipids at all. Furthermore,a significantly larger number of bowls yielded dairy fats,compared to adipose fats or no lipids at all. Thusillustrating that bowls were likely to have beenpreferentially used in the processing of dairy productsat Potterne.
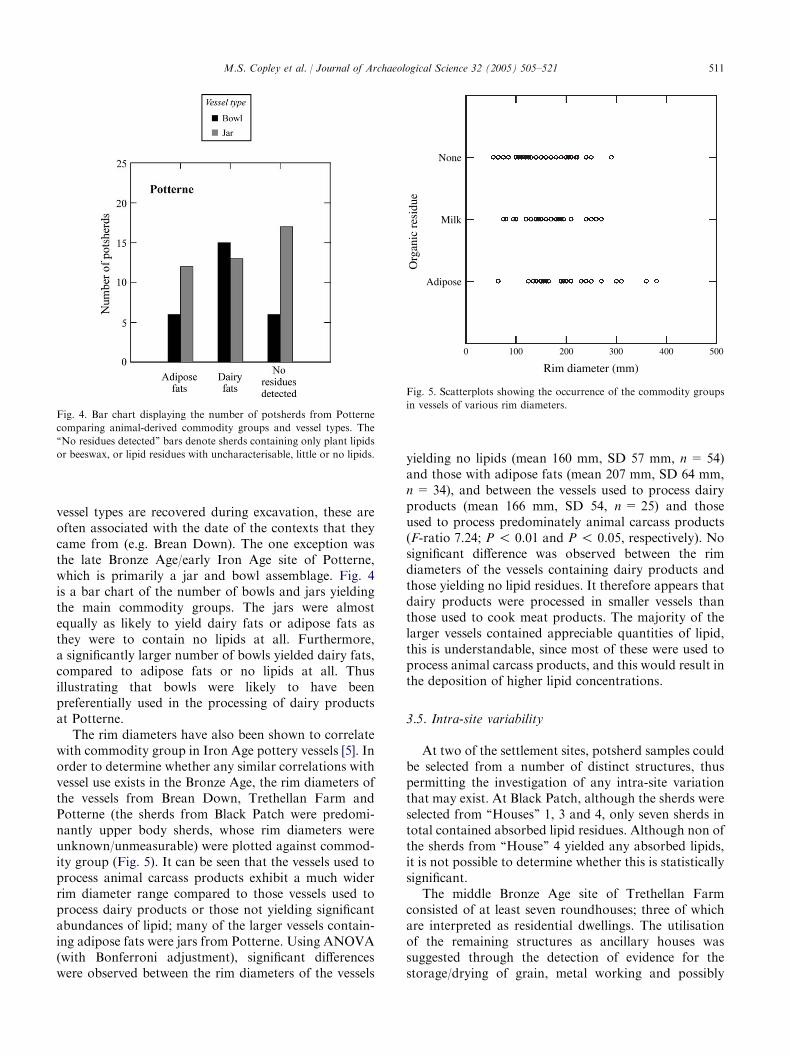
The rim diameters have also been shown to correlatewith commodity group in Iron Age pottery vessels [5]. Inorder to determine whether any similar correlations withvessel use exists in the Bronze Age, the rim diameters ofthe vessels from Brean Down, Trethellan Farm andPotterne (the sherds from Black Patch were predomi-nantly upper body sherds, whose rim diameters wereunknown/unmeasurable) were plotted against commod-ity group (Fig. 5). It can be seen that the vessels used toprocess animal carcass products exhibit a much widerrim diameter range compared to those vessels used toprocess dairy products or those not yielding significantabundances of lipid; many of the larger vessels contain-ing adipose fats were jars from Potterne. Using ANOVA(with Bonferroni adjustment), significant differenceswere observed between the rim diameters of the vessels
Fig. 4. Bar chart displaying the number of potsherds from Potterne
comparing animal-derived commodity groups and vessel types. The
‘‘No residues detected’’ bars denote sherds containing only plant lipids
or beeswax, or lipid residues with uncharacterisable, little or no lipids.
yielding no lipids (mean 160 mm, SD 57 mm, n = 54)and those with adipose fats (mean 207 mm, SD 64 mm,n = 34), and between the vessels used to process dairyproducts (mean 166 mm, SD 54, n = 25) and thoseused to process predominately animal carcass products(F-ratio 7.24; P ! 0.01 and P ! 0.05, respectively). Nosignificant difference was observed between the rimdiameters of the vessels containing dairy products andthose yielding no lipid residues. It therefore appears thatdairy products were processed in smaller vessels thanthose used to cook meat products. The majority of thelarger vessels contained appreciable quantities of lipid,this is understandable, since most of these were used toprocess animal carcass products, and this would result inthe deposition of higher lipid concentrations.3.5. Intra-site variability
At two of the settlement sites, potsherd samples couldbe selected from a number of distinct structures, thuspermitting the investigation of any intra-site variationthat may exist. At Black Patch, although the sherds wereselected from ‘‘Houses’’ 1, 3 and 4, only seven sherds intotal contained absorbed lipid residues. Although non ofthe sherds from ‘‘House’’ 4 yielded any absorbed lipids,it is not possible to determine whether this is statisticallysignificant.
The middle Bronze Age site of Trethellan Farmconsisted of at least seven roundhouses; three of whichare interpreted as residential dwellings. The utilisationof the remaining structures as ancillary houses wassuggested through the detection of evidence for thestorage/drying of grain, metal working and possibly
0
None
Milk
Adipose
100 200
Rim diameter (mm)
Org
anic
res
idue
300 400 500
Fig. 5. Scatterplots showing the occurrence of the commodity groups
in vessels of various rim diameters.
512 M.S. Copley et al. / Journal of Archaeological Science 32 (2005) 505–521
even hide processing [28]. The site was only occupiedfor a relatively short time, and appears to have beenabruptly abandoned. This evidence offers an opportu-nity to determine whether the different functions ofthe structures are reflected in the absorbed lipid residuesobtained from the pottery vessels excavated from thedifferent structure-types.
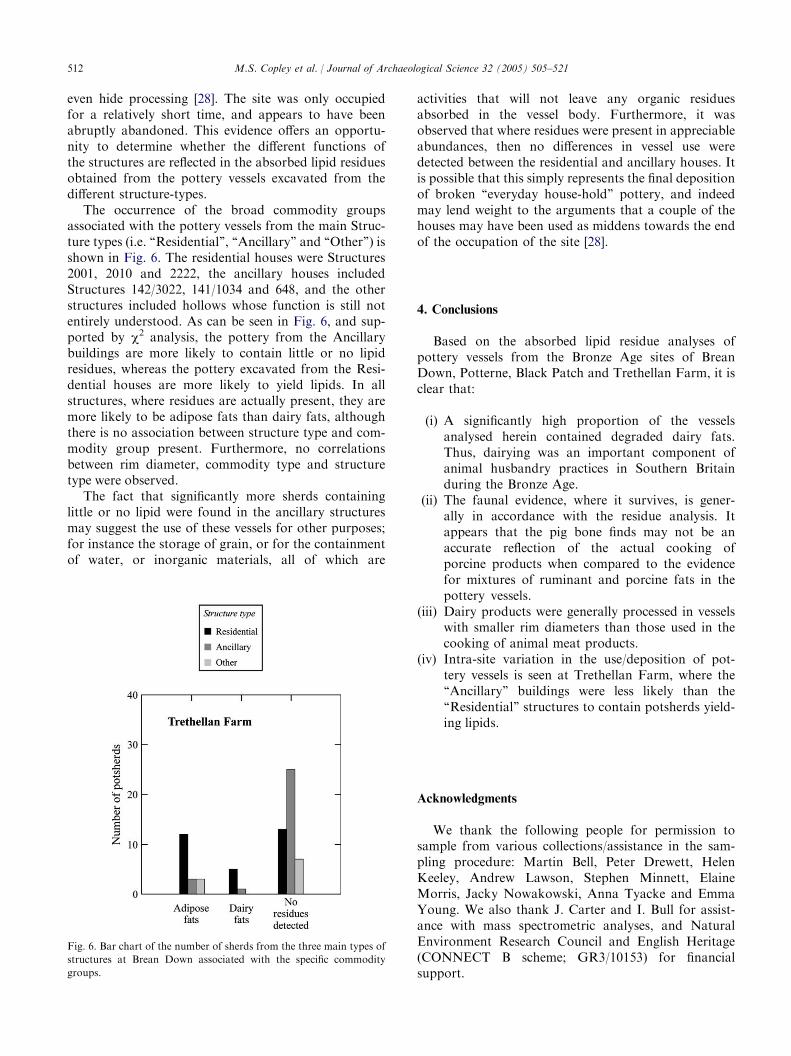
The occurrence of the broad commodity groupsassociated with the pottery vessels from the main Struc-ture types (i.e. ‘‘Residential’’, ‘‘Ancillary’’ and ‘‘Other’’) isshown in Fig. 6. The residential houses were Structures2001, 2010 and 2222, the ancillary houses includedStructures 142/3022, 141/1034 and 648, and the otherstructures included hollows whose function is still notentirely understood. As can be seen in Fig. 6, and sup-ported by c2 analysis, the pottery from the Ancillarybuildings are more likely to contain little or no lipidresidues, whereas the pottery excavated from the Resi-dential houses are more likely to yield lipids. In allstructures, where residues are actually present, they aremore likely to be adipose fats than dairy fats, althoughthere is no association between structure type and com-modity group present. Furthermore, no correlationsbetween rim diameter, commodity type and structuretype were observed.
The fact that significantly more sherds containinglittle or no lipid were found in the ancillary structuresmay suggest the use of these vessels for other purposes;for instance the storage of grain, or for the containmentof water, or inorganic materials, all of which are
Fig. 6. Bar chart of the number of sherds from the three main types of
structures at Brean Down associated with the specific commodity
groups.
activities that will not leave any organic residuesabsorbed in the vessel body. Furthermore, it wasobserved that where residues were present in appreciableabundances, then no differences in vessel use weredetected between the residential and ancillary houses. Itis possible that this simply represents the final depositionof broken ‘‘everyday house-hold’’ pottery, and indeedmay lend weight to the arguments that a couple of thehouses may have been used as middens towards the endof the occupation of the site [28].
4. Conclusions
Based on the absorbed lipid residue analyses ofpottery vessels from the Bronze Age sites of BreanDown, Potterne, Black Patch and Trethellan Farm, it isclear that:
(i) A significantly high proportion of the vesselsanalysed herein contained degraded dairy fats.Thus, dairying was an important component ofanimal husbandry practices in Southern Britainduring the Bronze Age.
(ii) The faunal evidence, where it survives, is gener-ally in accordance with the residue analysis. Itappears that the pig bone finds may not be anaccurate reflection of the actual cooking ofporcine products when compared to the evidencefor mixtures of ruminant and porcine fats in thepottery vessels.
(iii) Dairy products were generally processed in vesselswith smaller rim diameters than those used in thecooking of animal meat products.
(iv) Intra-site variation in the use/deposition of pot-tery vessels is seen at Trethellan Farm, where the‘‘Ancillary’’ buildings were less likely than the‘‘Residential’’ structures to contain potsherds yield-ing lipids.
Acknowledgments
We thank the following people for permission tosample from various collections/assistance in the sam-pling procedure: Martin Bell, Peter Drewett, HelenKeeley, Andrew Lawson, Stephen Minnett, ElaineMorris, Jacky Nowakowski, Anna Tyacke and EmmaYoung. We also thank J. Carter and I. Bull for assist-ance with mass spectrometric analyses, and NaturalEnvironment Research Council and English Heritage(CONNECT B scheme; GR3/10153) for financialsupport.
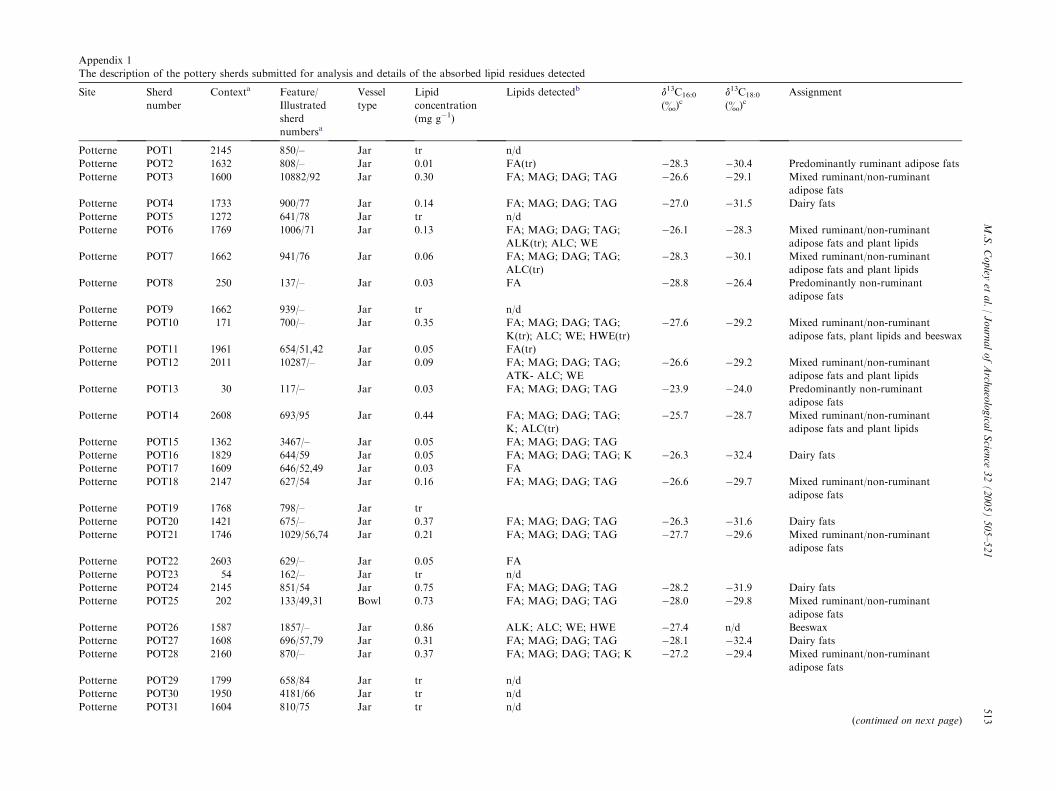
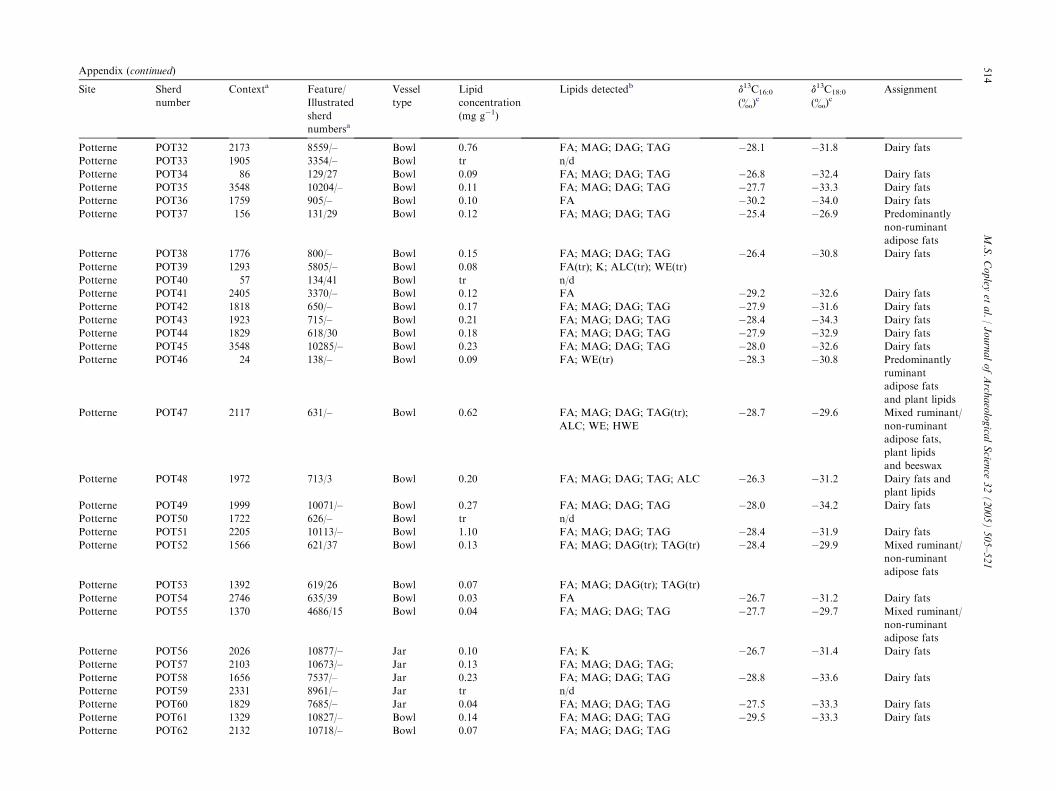
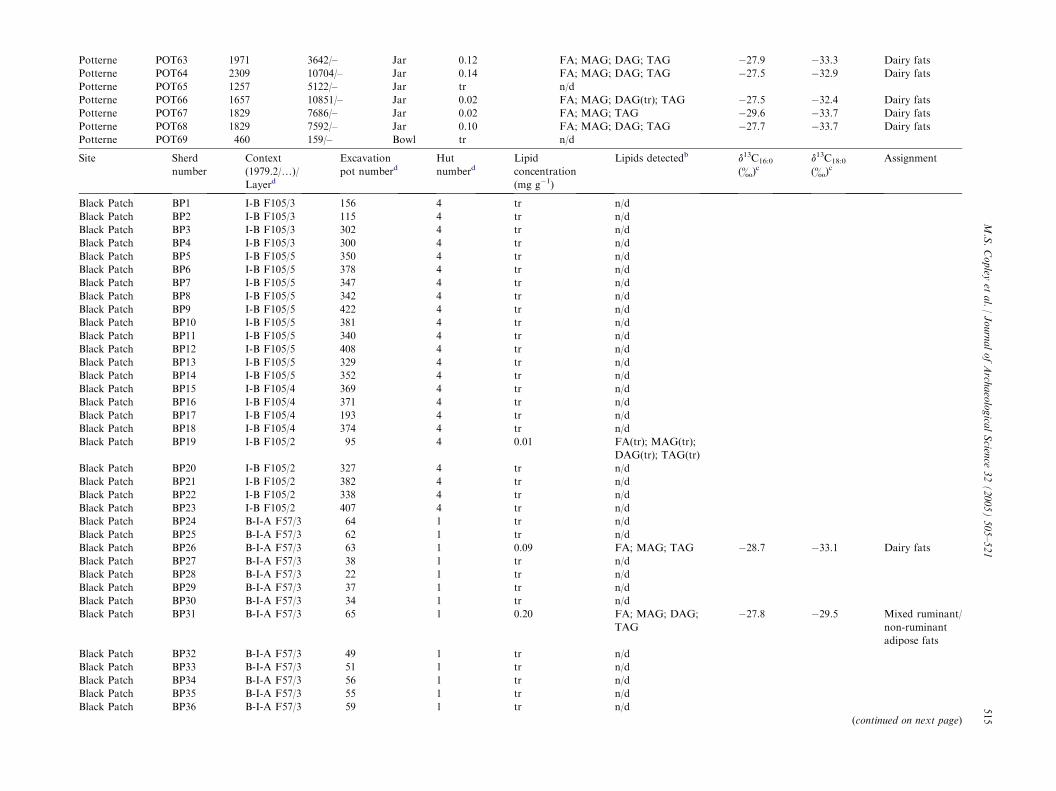
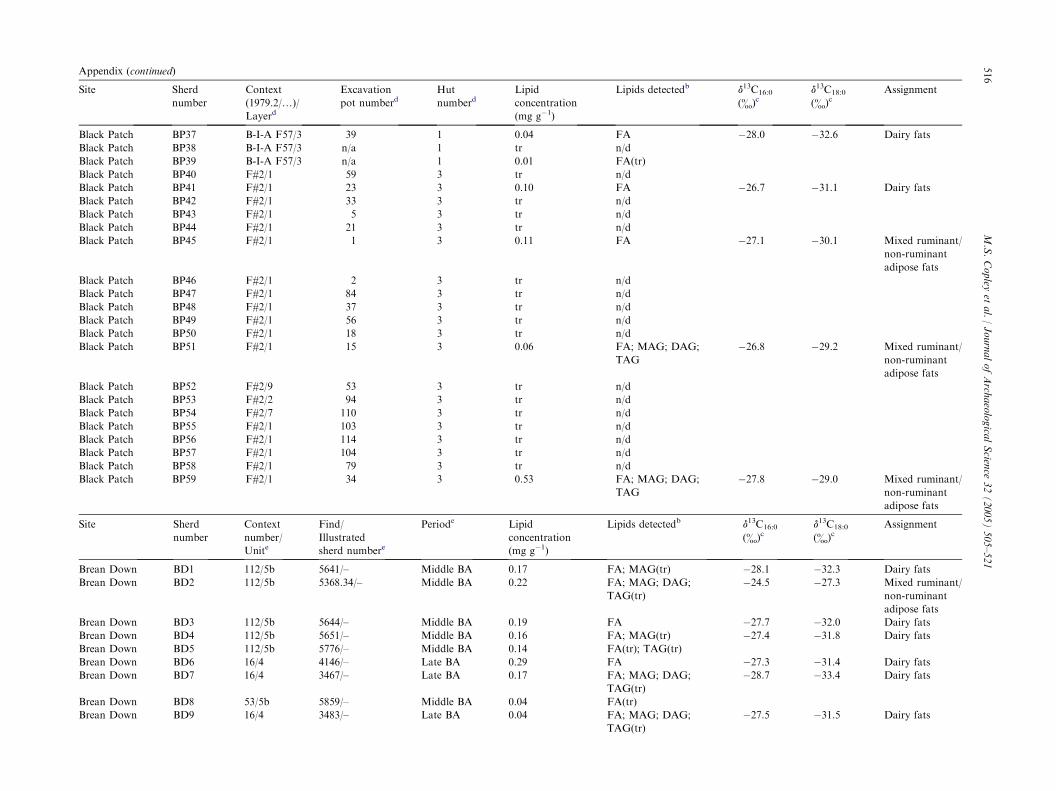
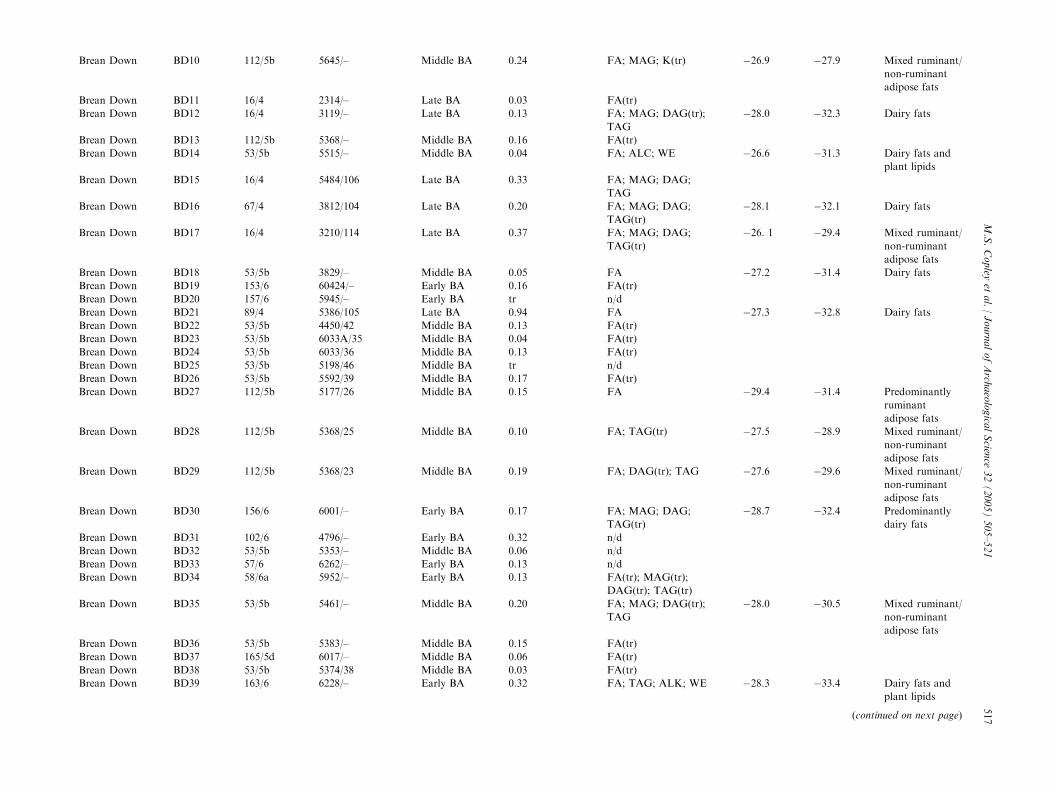
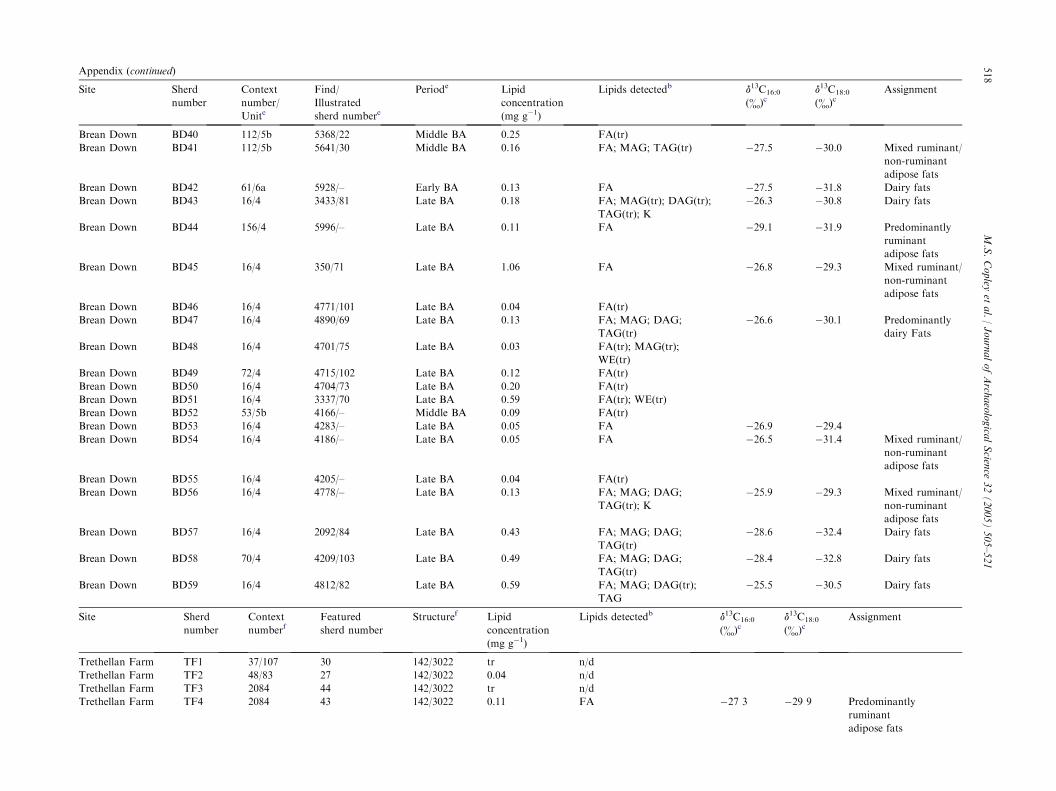
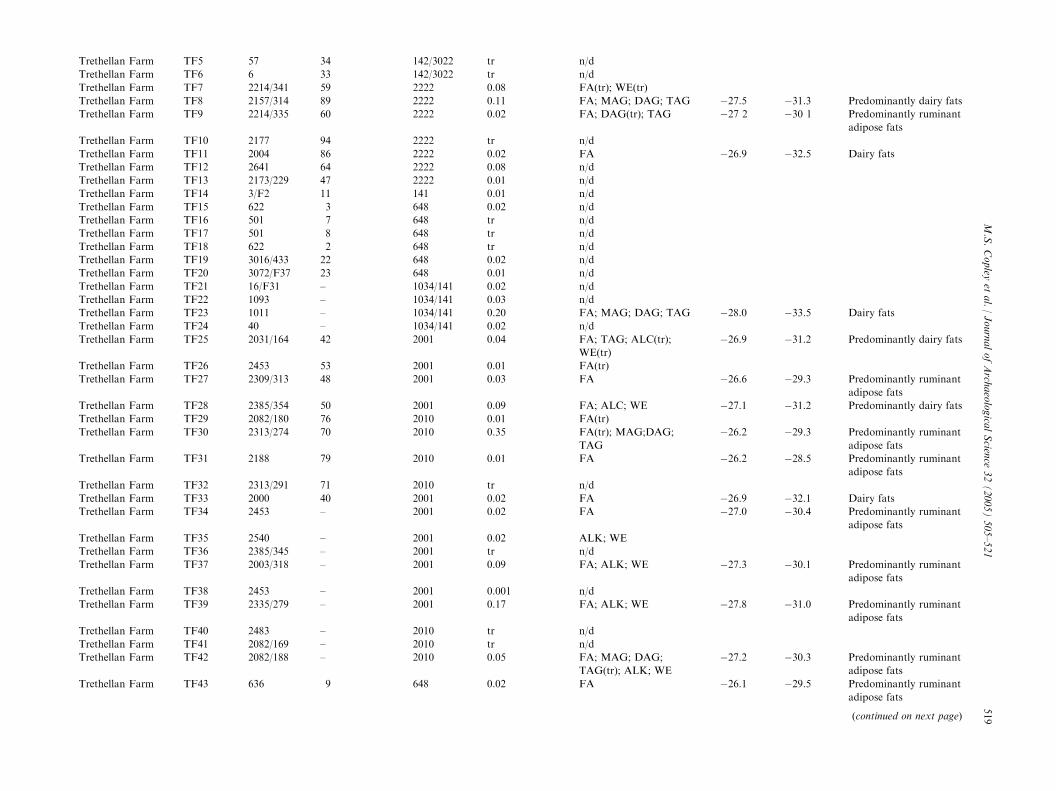
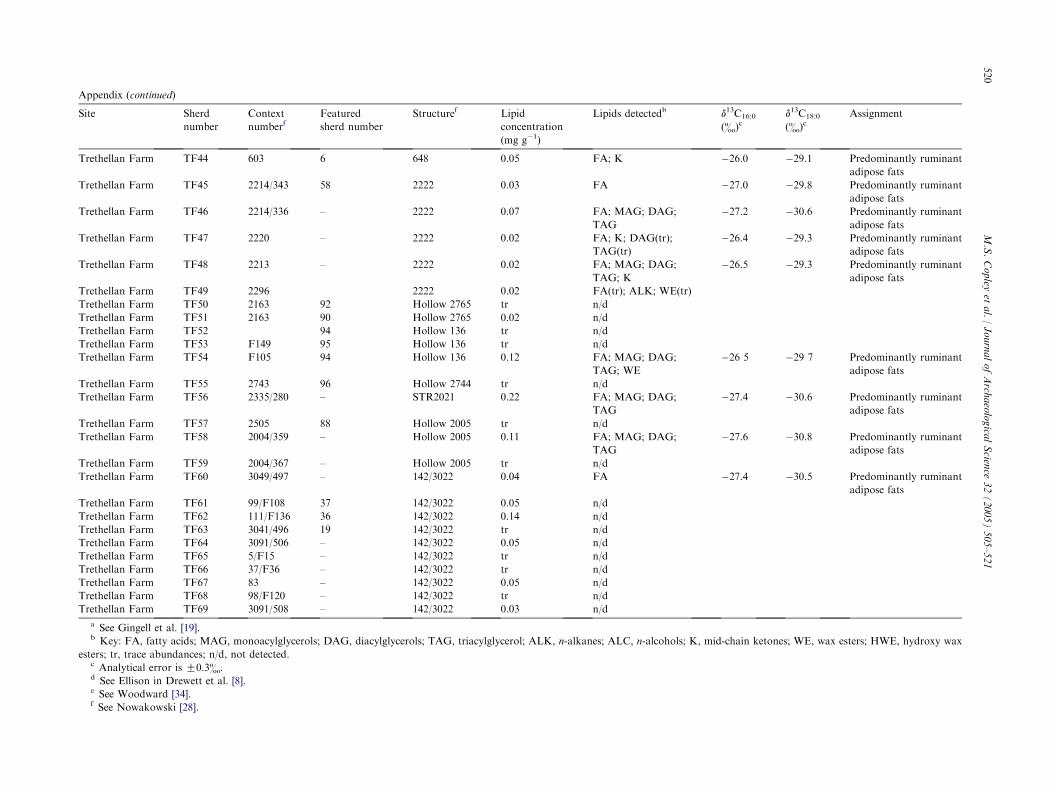
Appendix 1
The description of the pottery sherds submitted for analysis and details of the absorbed lipid residues detected
18:0 Assignment
4 Predominantly ruminant adipose fats
1 Mixed ruminant/non-ruminant
adipose fats
5 Dairy fats
3 Mixed ruminant/non-ruminant
adipose fats and plant lipids
1 Mixed ruminant/non-ruminant
adipose fats and plant lipids
4 Predominantly non-ruminant
adipose fats
2 Mixed ruminant/non-ruminant
adipose fats, plant lipids and beeswax
2 Mixed ruminant/non-ruminant
adipose fats and plant lipids
0 Predominantly non-ruminant
adipose fats
7 Mixed ruminant/non-ruminant
adipose fats and plant lipids
4 Dairy fats
7 Mixed ruminant/non-ruminant
adipose fats
6 Dairy fats
6 Mixed ruminant/non-ruminant
adipose fats
9 Dairy fats
8 Mixed ruminant/non-ruminant
adipose fats
Beeswax
4 Dairy fats
4 Mixed ruminant/non-ruminant
adipose fats
(continued on next page)
513
M.S.Copley
etal./JournalofArch
aeologica
lScien
ce32(2005)505–521
Site Sherd
number
Contexta Feature/
Illustrated
sherd
numbersa
Vessel
type
Lipid
concentration
(mg g�1)
Lipids detectedb d13C16:0
(&)cd13C
(&)c
Potterne POT1 2145 850/– Jar tr n/d
Potterne POT2 1632 808/– Jar 0.01 FA(tr) �28.3 �30.
Potterne POT3 1600 10882/92 Jar 0.30 FA; MAG; DAG; TAG �26.6 �29.
Potterne POT4 1733 900/77 Jar 0.14 FA; MAG; DAG; TAG �27.0 �31.
Potterne POT5 1272 641/78 Jar tr n/d
Potterne POT6 1769 1006/71 Jar 0.13 FA; MAG; DAG; TAG;
ALK(tr); ALC; WE
�26.1 �28.
Potterne POT7 1662 941/76 Jar 0.06 FA; MAG; DAG; TAG;
ALC(tr)
�28.3 �30.
Potterne POT8 250 137/– Jar 0.03 FA �28.8 �26.
Potterne POT9 1662 939/– Jar tr n/d
Potterne POT10 171 700/– Jar 0.35 FA; MAG; DAG; TAG;
K(tr); ALC; WE; HWE(tr)
�27.6 �29.
Potterne POT11 1961 654/51,42 Jar 0.05 FA(tr)
Potterne POT12 2011 10287/– Jar 0.09 FA; MAG; DAG; TAG;
ATK- ALC; WE
�26.6 �29.
Potterne POT13 30 117/– Jar 0.03 FA; MAG; DAG; TAG �23.9 �24.
Potterne POT14 2608 693/95 Jar 0.44 FA; MAG; DAG; TAG;
K; ALC(tr)
�25.7 �28.
Potterne POT15 1362 3467/– Jar 0.05 FA; MAG; DAG; TAG
Potterne POT16 1829 644/59 Jar 0.05 FA; MAG; DAG; TAG; K �26.3 �32.
Potterne POT17 1609 646/52,49 Jar 0.03 FA
Potterne POT18 2147 627/54 Jar 0.16 FA; MAG; DAG; TAG �26.6 �29.
Potterne POT19 1768 798/– Jar tr
Potterne POT20 1421 675/– Jar 0.37 FA; MAG; DAG; TAG �26.3 �31.
Potterne POT21 1746 1029/56,74 Jar 0.21 FA; MAG; DAG; TAG �27.7 �29.
Potterne POT22 2603 629/– Jar 0.05 FA
Potterne POT23 54 162/– Jar tr n/d
Potterne POT24 2145 851/54 Jar 0.75 FA; MAG; DAG; TAG �28.2 �31.
Potterne POT25 202 133/49,31 Bowl 0.73 FA; MAG; DAG; TAG �28.0 �29.
Potterne POT26 1587 1857/– Jar 0.86 ALK; ALC; WE; HWE �27.4 n/d
Potterne POT27 1608 696/57,79 Jar 0.31 FA; MAG; DAG; TAG �28.1 �32.
Potterne POT28 2160 870/– Jar 0.37 FA; MAG; DAG; TAG; K �27.2 �29.
Potterne POT29 1799 658/84 Jar tr n/d
Potterne POT30 1950 4181/66 Jar tr n/d
Potterne POT31 1604 810/75 Jar tr n/d
Appendix (continued)
16:0c
d13C18:0
(&)cAssignment
.1 �31.8 Dairy fats
.8 �32.4 Dairy fats
.7 �33.3 Dairy fats
.2 �34.0 Dairy fats
.4 �26.9 Predominantly
non-ruminant
adipose fats
.4 �30.8 Dairy fats
.2 �32.6 Dairy fats
.9 �31.6 Dairy fats
.4 �34.3 Dairy fats
.9 �32.9 Dairy fats
.0 �32.6 Dairy fats
.3 �30.8 Predominantly
ruminant
adipose fats
and plant lipids
.7 �29.6 Mixed ruminant/
non-ruminant
adipose fats,
plant lipids
and beeswax
.3 �31.2 Dairy fats and
plant lipids
.0 �34.2 Dairy fats
.4 �31.9 Dairy fats
.4 �29.9 Mixed ruminant/
non-ruminant
adipose fats
.7 �31.2 Dairy fats
.7 �29.7 Mixed ruminant/
non-ruminant
adipose fats
.7 �31.4 Dairy fats
.8 �33.6 Dairy fats
.5 �33.3 Dairy fats
.5 �33.3 Dairy fats
514
M.S.Copley
etal./JournalofArch
aeolo
gica
lScien
ce32(2005)505–521
Site Sherd
number
Contexta Feature/
Illustrated
sherd
numbersa
Vessel
type
Lipid
concentration
(mg g�1)
Lipids detectedb d13C
(&)
Potterne POT32 2173 8559/– Bowl 0.76 FA; MAG; DAG; TAG �28
Potterne POT33 1905 3354/– Bowl tr n/d
Potterne POT34 86 129/27 Bowl 0.09 FA; MAG; DAG; TAG �26
Potterne POT35 3548 10204/– Bowl 0.11 FA; MAG; DAG; TAG �27
Potterne POT36 1759 905/– Bowl 0.10 FA �30
Potterne POT37 156 131/29 Bowl 0.12 FA; MAG; DAG; TAG �25
Potterne POT38 1776 800/– Bowl 0.15 FA; MAG; DAG; TAG �26
Potterne POT39 1293 5805/– Bowl 0.08 FA(tr); K; ALC(tr); WE(tr)
Potterne POT40 57 134/41 Bowl tr n/d
Potterne POT41 2405 3370/– Bowl 0.12 FA �29
Potterne POT42 1818 650/– Bowl 0.17 FA; MAG; DAG; TAG �27
Potterne POT43 1923 715/– Bowl 0.21 FA; MAG; DAG; TAG �28
Potterne POT44 1829 618/30 Bowl 0.18 FA; MAG; DAG; TAG �27
Potterne POT45 3548 10285/– Bowl 0.23 FA; MAG; DAG; TAG �28
Potterne POT46 24 138/– Bowl 0.09 FA; WE(tr) �28
Potterne POT47 2117 631/– Bowl 0.62 FA; MAG; DAG; TAG(tr);
ALC; WE; HWE
�28
Potterne POT48 1972 713/3 Bowl 0.20 FA; MAG; DAG; TAG; ALC �26
Potterne POT49 1999 10071/– Bowl 0.27 FA; MAG; DAG; TAG �28
Potterne POT50 1722 626/– Bowl tr n/d
Potterne POT51 2205 10113/– Bowl 1.10 FA; MAG; DAG; TAG �28
Potterne POT52 1566 621/37 Bowl 0.13 FA; MAG; DAG(tr); TAG(tr) �28
Potterne POT53 1392 619/26 Bowl 0.07 FA; MAG; DAG(tr); TAG(tr)
Potterne POT54 2746 635/39 Bowl 0.03 FA �26
Potterne POT55 1370 4686/15 Bowl 0.04 FA; MAG; DAG; TAG �27
Potterne POT56 2026 10877/– Jar 0.10 FA; K �26
Potterne POT57 2103 10673/– Jar 0.13 FA; MAG; DAG; TAG;
Potterne POT58 1656 7537/– Jar 0.23 FA; MAG; DAG; TAG �28
Potterne POT59 2331 8961/– Jar tr n/d
Potterne POT60 1829 7685/– Jar 0.04 FA; MAG; DAG; TAG �27
Potterne POT61 1329 10827/– Bowl 0.14 FA; MAG; DAG; TAG �29
Potterne POT62 2132 10718/– Bowl 0.07 FA; MAG; DAG; TAG
Potterne POT63 1971 3642/– Jar 0.12 FA; MAG; DAG; TAG �27.9 �33.3 Dairy fats
Potterne POT64 2309 10704/– Jar 0.14 FA; MAG; DAG; TAG �27.5 �32.9 Dairy fats
27.5 �32.4 Dairy fats
29.6 �33.7 Dairy fats
27.7 �33.7 Dairy fats
13C16:0
&)cd13C18:0
(&)cAssignment
28.7 �33.1 Dairy fats
27.8 �29.5 Mixed ruminant/
non-ruminant
adipose fats
(continued on next page)
515
M.S.Copley
etal./JournalofArch
aeologica
lScien
ce32(2005)505–521
Potterne POT65 1257 5122/– Jar tr n/d
Potterne POT66 1657 10851/– Jar 0.02 FA; MAG; DAG(tr); TAG �Potterne POT67 1829 7686/– Jar 0.02 FA; MAG; TAG �Potterne POT68 1829 7592/– Jar 0.10 FA; MAG; DAG; TAG �Potterne POT69 460 159/– Bowl tr n/d
Site Sherd
number
Context
(1979.2/.)/
Layerd
Excavation
pot numberdHut
numberdLipid
concentration
(mg g�1)
Lipids detectedb d
(
Black Patch BP1 I-B F105/3 156 4 tr n/d
Black Patch BP2 I-B F105/3 115 4 tr n/d
Black Patch BP3 I-B F105/3 302 4 tr n/d
Black Patch BP4 I-B F105/3 300 4 tr n/d
Black Patch BP5 I-B F105/5 350 4 tr n/d
Black Patch BP6 I-B F105/5 378 4 tr n/d
Black Patch BP7 I-B F105/5 347 4 tr n/d
Black Patch BP8 I-B F105/5 342 4 tr n/d
Black Patch BP9 I-B F105/5 422 4 tr n/d
Black Patch BP10 I-B F105/5 381 4 tr n/d
Black Patch BP11 I-B F105/5 340 4 tr n/d
Black Patch BP12 I-B F105/5 408 4 tr n/d
Black Patch BP13 I-B F105/5 329 4 tr n/d
Black Patch BP14 I-B F105/5 352 4 tr n/d
Black Patch BP15 I-B F105/4 369 4 tr n/d
Black Patch BP16 I-B F105/4 371 4 tr n/d
Black Patch BP17 I-B F105/4 193 4 tr n/d
Black Patch BP18 I-B F105/4 374 4 tr n/d
Black Patch BP19 I-B F105/2 95 4 0.01 FA(tr); MAG(tr);
DAG(tr); TAG(tr)
Black Patch BP20 I-B F105/2 327 4 tr n/d
Black Patch BP21 I-B F105/2 382 4 tr n/d
Black Patch BP22 I-B F105/2 338 4 tr n/d
Black Patch BP23 I-B F105/2 407 4 tr n/d
Black Patch BP24 B-I-A F57/3 64 1 tr n/d
Black Patch BP25 B-I-A F57/3 62 1 tr n/d
Black Patch BP26 B-I-A F57/3 63 1 0.09 FA; MAG; TAG �Black Patch BP27 B-I-A F57/3 38 1 tr n/d
Black Patch BP28 B-I-A F57/3 22 1 tr n/d
Black Patch BP29 B-I-A F57/3 37 1 tr n/d
Black Patch BP30 B-I-A F57/3 34 1 tr n/d
Black Patch BP31 B-I-A F57/3 65 1 0.20 FA; MAG; DAG;
TAG
�
Black Patch BP32 B-I-A F57/3 49 1 tr n/d
Black Patch BP33 B-I-A F57/3 51 1 tr n/d
Black Patch BP34 B-I-A F57/3 56 1 tr n/d
Black Patch BP35 B-I-A F57/3 55 1 tr n/d
Black Patch BP36 B-I-A F57/3 59 1 tr n/d
Appendix (continued)
13C16:0
)cd13C18:0
(&)cAssignment
28.0 �32.6 Dairy fats
26.7 �31.1 Dairy fats
27.1 �30.1 Mixed ruminant/
non-ruminant
adipose fats
26.8 �29.2 Mixed ruminant/
non-ruminant
adipose fats
27.8 �29.0 Mixed ruminant/
non-ruminant
adipose fats
d13C16:0
(&)cd13C18:0
(&)cAssignment
�28.1 �32.3 Dairy fats
�24.5 �27.3 Mixed ruminant/
non-ruminant
adipose fats
�27.7 �32.0 Dairy fats
�27.4 �31.8 Dairy fats
�27.3 �31.4 Dairy fats
�28.7 �33.4 Dairy fats
�27.5 �31.5 Dairy fats
516
M.S.Copley
etal./JournalofArch
aeolo
gica
lScien
ce32(2005)505–521
Site Sherd
number
Context
(1979.2/.)/
Layerd
Excavation
pot numberdHut
numberdLipid
concentration
(mg g�1)
Lipids detectedb d
(&
Black Patch BP37 B-I-A F57/3 39 1 0.04 FA �Black Patch BP38 B-I-A F57/3 n/a 1 tr n/d
Black Patch BP39 B-I-A F57/3 n/a 1 0.01 FA(tr)
Black Patch BP40 F#2/1 59 3 tr n/d
Black Patch BP41 F#2/1 23 3 0.10 FA �Black Patch BP42 F#2/1 33 3 tr n/d
Black Patch BP43 F#2/1 5 3 tr n/d
Black Patch BP44 F#2/1 21 3 tr n/d
Black Patch BP45 F#2/1 1 3 0.11 FA �
Black Patch BP46 F#2/1 2 3 tr n/d
Black Patch BP47 F#2/1 84 3 tr n/d
Black Patch BP48 F#2/1 37 3 tr n/d
Black Patch BP49 F#2/1 56 3 tr n/d
Black Patch BP50 F#2/1 18 3 tr n/d
Black Patch BP51 F#2/1 15 3 0.06 FA; MAG; DAG;
TAG
�
Black Patch BP52 F#2/9 53 3 tr n/d
Black Patch BP53 F#2/2 94 3 tr n/d
Black Patch BP54 F#2/7 110 3 tr n/d
Black Patch BP55 F#2/1 103 3 tr n/d
Black Patch BP56 F#2/1 114 3 tr n/d
Black Patch BP57 F#2/1 104 3 tr n/d
Black Patch BP58 F#2/1 79 3 tr n/d
Black Patch BP59 F#2/1 34 3 0.53 FA; MAG; DAG;
TAG
�
Site Sherd
number
Context
number/
Unite
Find/
Illustrated
sherd numbere
Periode Lipid
concentration
(mg g�1)
Lipids detectedb
Brean Down BD1 112/5b 5641/– Middle BA 0.17 FA; MAG(tr)
Brean Down BD2 112/5b 5368.34/– Middle BA 0.22 FA; MAG; DAG;
TAG(tr)
Brean Down BD3 112/5b 5644/– Middle BA 0.19 FA
Brean Down BD4 112/5b 5651/– Middle BA 0.16 FA; MAG(tr)
Brean Down BD5 112/5b 5776/– Middle BA 0.14 FA(tr); TAG(tr)
Brean Down BD6 16/4 4146/– Late BA 0.29 FA
Brean Down BD7 16/4 3467/– Late BA 0.17 FA; MAG; DAG;
TAG(tr)
Brean Down BD8 53/5b 5859/– Middle BA 0.04 FA(tr)
Brean Down BD9 16/4 3483/– Late BA 0.04 FA; MAG; DAG;
TAG(tr)
Brean Down BD10 112/5b 5645/– Middle BA 0.24 FA; MAG; K(tr) �26.9 �27.9 Mixed ruminant/
non-ruminant
adipose fats
�28.0 �32.3 Dairy fats
�26.6 �31.3 Dairy fats and
plant lipids
�28.1 �32.1 Dairy fats
�26. 1 �29.4 Mixed ruminant/
non-ruminant
adipose fats
�27.2 �31.4 Dairy fats
�27.3 �32.8 Dairy fats
�29.4 �31.4 Predominantly
ruminant
adipose fats
�27.5 �28.9 Mixed ruminant/
non-ruminant
adipose fats
�27.6 �29.6 Mixed ruminant/
non-ruminant
adipose fats
�28.7 �32.4 Predominantly
dairy fats
�28.0 �30.5 Mixed ruminant/
non-ruminant
adipose fats
�28.3 �33.4 Dairy fats and
plant lipids
(continued on next page)
517
M.S.Copley
etal./JournalofArch
aeologica
lScien
ce32(2005)505–521
Brean Down BD11 16/4 2314/– Late BA 0.03 FA(tr)
Brean Down BD12 16/4 3119/– Late BA 0.13 FA; MAG; DAG(tr);
TAG
Brean Down BD13 112/5b 5368/– Middle BA 0.16 FA(tr)
Brean Down BD14 53/5b 5515/– Middle BA 0.04 FA; ALC; WE
Brean Down BD15 16/4 5484/106 Late BA 0.33 FA; MAG; DAG;
TAG
Brean Down BD16 67/4 3812/104 Late BA 0.20 FA; MAG; DAG;
TAG(tr)
Brean Down BD17 16/4 3210/114 Late BA 0.37 FA; MAG; DAG;
TAG(tr)
Brean Down BD18 53/5b 3829/– Middle BA 0.05 FA
Brean Down BD19 153/6 60424/– Early BA 0.16 FA(tr)
Brean Down BD20 157/6 5945/– Early BA tr n/d
Brean Down BD21 89/4 5386/105 Late BA 0.94 FA
Brean Down BD22 53/5b 4450/42 Middle BA 0.13 FA(tr)
Brean Down BD23 53/5b 6033A/35 Middle BA 0.04 FA(tr)
Brean Down BD24 53/5b 6033/36 Middle BA 0.13 FA(tr)
Brean Down BD25 53/5b 5198/46 Middle BA tr n/d
Brean Down BD26 53/5b 5592/39 Middle BA 0.17 FA(tr)
Brean Down BD27 112/5b 5177/26 Middle BA 0.15 FA
Brean Down BD28 112/5b 5368/25 Middle BA 0.10 FA; TAG(tr)
Brean Down BD29 112/5b 5368/23 Middle BA 0.19 FA; DAG(tr); TAG
Brean Down BD30 156/6 6001/– Early BA 0.17 FA; MAG; DAG;
TAG(tr)
Brean Down BD31 102/6 4796/– Early BA 0.32 n/d
Brean Down BD32 53/5b 5353/– Middle BA 0.06 n/d
Brean Down BD33 57/6 6262/– Early BA 0.13 n/d
Brean Down BD34 58/6a 5952/– Early BA 0.13 FA(tr); MAG(tr);
DAG(tr); TAG(tr)
Brean Down BD35 53/5b 5461/– Middle BA 0.20 FA; MAG; DAG(tr);
TAG
Brean Down BD36 53/5b 5383/– Middle BA 0.15 FA(tr)
Brean Down BD37 165/5d 6017/– Middle BA 0.06 FA(tr)
Brean Down BD38 53/5b 5374/38 Middle BA 0.03 FA(tr)
Brean Down BD39 163/6 6228/– Early BA 0.32 FA; TAG; ALK; WE
Appendix (continued)
d13C16:0
(&)cd13C18:0
(&)cAssignment
�27.5 �30.0 Mixed ruminant/
non-ruminant
adipose fats
�27.5 �31.8 Dairy fats
�26.3 �30.8 Dairy fats
�29.1 �31.9 Predominantly
ruminant
adipose fats
�26.8 �29.3 Mixed ruminant/
non-ruminant
adipose fats
�26.6 �30.1 Predominantly
dairy Fats
�26.9 �29.4
�26.5 �31.4 Mixed ruminant/
non-ruminant
adipose fats
�25.9 �29.3 Mixed ruminant/
non-ruminant
adipose fats
�28.6 �32.4 Dairy fats
�28.4 �32.8 Dairy fats
�25.5 �30.5 Dairy fats
6:0 d13C18:0
(&)cAssignment
�29 9 Predominantly
ruminant
adipose fats
518
M.S.Copley
etal./JournalofArch
aeolo
gica
lScien
ce32(2005)505–521
Site Sherd
number
Context
number/
Unite
Find/
Illustrated
sherd numbere
Periode Lipid
concentration
(mg g�1)
Lipids detectedb
Brean Down BD40 112/5b 5368/22 Middle BA 0.25 FA(tr)
Brean Down BD41 112/5b 5641/30 Middle BA 0.16 FA; MAG; TAG(tr)
Brean Down BD42 61/6a 5928/– Early BA 0.13 FA
Brean Down BD43 16/4 3433/81 Late BA 0.18 FA; MAG(tr); DAG(tr);
TAG(tr); K
Brean Down BD44 156/4 5996/– Late BA 0.11 FA
Brean Down BD45 16/4 350/71 Late BA 1.06 FA
Brean Down BD46 16/4 4771/101 Late BA 0.04 FA(tr)
Brean Down BD47 16/4 4890/69 Late BA 0.13 FA; MAG; DAG;
TAG(tr)
Brean Down BD48 16/4 4701/75 Late BA 0.03 FA(tr); MAG(tr);
WE(tr)
Brean Down BD49 72/4 4715/102 Late BA 0.12 FA(tr)
Brean Down BD50 16/4 4704/73 Late BA 0.20 FA(tr)
Brean Down BD51 16/4 3337/70 Late BA 0.59 FA(tr); WE(tr)
Brean Down BD52 53/5b 4166/– Middle BA 0.09 FA(tr)
Brean Down BD53 16/4 4283/– Late BA 0.05 FA
Brean Down BD54 16/4 4186/– Late BA 0.05 FA
Brean Down BD55 16/4 4205/– Late BA 0.04 FA(tr)
Brean Down BD56 16/4 4778/– Late BA 0.13 FA; MAG; DAG;
TAG(tr); K
Brean Down BD57 16/4 2092/84 Late BA 0.43 FA; MAG; DAG;
TAG(tr)
Brean Down BD58 70/4 4209/103 Late BA 0.49 FA; MAG; DAG;
TAG(tr)
Brean Down BD59 16/4 4812/82 Late BA 0.59 FA; MAG; DAG(tr);
TAG
Site Sherd
number
Context
numberfFeatured
sherd number
Structuref Lipid
concentration
(mg g�1)
Lipids detectedb d13C1
(&)c
Trethellan Farm TF1 37/107 30 142/3022 tr n/d
Trethellan Farm TF2 48/83 27 142/3022 0.04 n/d
Trethellan Farm TF3 2084 44 142/3022 tr n/d
Trethellan Farm TF4 2084 43 142/3022 0.11 FA �27 3
Trethellan Farm TF5 57 34 142/3022 tr n/d
Trethellan Farm TF6 6 33 142/3022 tr n/d
5 �31.3 Predominantly dairy fats
2 �30 1 Predominantly ruminant
adipose fats
9 �32.5 Dairy fats
0 �33.5 Dairy fats
9 �31.2 Predominantly dairy fats
6 �29.3 Predominantly ruminant
adipose fats
1 �31.2 Predominantly dairy fats
2 �29.3 Predominantly ruminant
adipose fats
2 �28.5 Predominantly ruminant
adipose fats
9 �32.1 Dairy fats
0 �30.4 Predominantly ruminant
adipose fats
3 �30.1 Predominantly ruminant
adipose fats
8 �31.0 Predominantly ruminant
adipose fats
2 �30.3 Predominantly ruminant
adipose fats
1 �29.5 Predominantly ruminant
adipose fats
(continued on next page)
519
M.S.Copley
etal./JournalofArch
aeologica
lScien
ce32(2005)505–521
Trethellan Farm TF7 2214/341 59 2222 0.08 FA(tr); WE(tr)
Trethellan Farm TF8 2157/314 89 2222 0.11 FA; MAG; DAG; TAG �27.
Trethellan Farm TF9 2214/335 60 2222 0.02 FA; DAG(tr); TAG �27
Trethellan Farm TF10 2177 94 2222 tr n/d
Trethellan Farm TF11 2004 86 2222 0.02 FA �26.
Trethellan Farm TF12 2641 64 2222 0.08 n/d
Trethellan Farm TF13 2173/229 47 2222 0.01 n/d
Trethellan Farm TF14 3/F2 11 141 0.01 n/d
Trethellan Farm TF15 622 3 648 0.02 n/d
Trethellan Farm TF16 501 7 648 tr n/d
Trethellan Farm TF17 501 8 648 tr n/d
Trethellan Farm TF18 622 2 648 tr n/d
Trethellan Farm TF19 3016/433 22 648 0.02 n/d
Trethellan Farm TF20 3072/F37 23 648 0.01 n/d
Trethellan Farm TF21 16/F31 – 1034/141 0.02 n/d
Trethellan Farm TF22 1093 – 1034/141 0.03 n/d
Trethellan Farm TF23 1011 – 1034/141 0.20 FA; MAG; DAG; TAG �28.
Trethellan Farm TF24 40 – 1034/141 0.02 n/d
Trethellan Farm TF25 2031/164 42 2001 0.04 FA; TAG; ALC(tr);
WE(tr)
�26.
Trethellan Farm TF26 2453 53 2001 0.01 FA(tr)
Trethellan Farm TF27 2309/313 48 2001 0.03 FA �26.
Trethellan Farm TF28 2385/354 50 2001 0.09 FA; ALC; WE �27.
Trethellan Farm TF29 2082/180 76 2010 0.01 FA(tr)
Trethellan Farm TF30 2313/274 70 2010 0.35 FA(tr); MAG;DAG;
TAG
�26.
Trethellan Farm TF31 2188 79 2010 0.01 FA �26.
Trethellan Farm TF32 2313/291 71 2010 tr n/d
Trethellan Farm TF33 2000 40 2001 0.02 FA �26.
Trethellan Farm TF34 2453 – 2001 0.02 FA �27.
Trethellan Farm TF35 2540 – 2001 0.02 ALK; WE
Trethellan Farm TF36 2385/345 – 2001 tr n/d
Trethellan Farm TF37 2003/318 – 2001 0.09 FA; ALK; WE �27.
Trethellan Farm TF38 2453 – 2001 0.001 n/d
Trethellan Farm TF39 2335/279 – 2001 0.17 FA; ALK; WE �27.
Trethellan Farm TF40 2483 – 2010 tr n/d
Trethellan Farm TF41 2082/169 – 2010 tr n/d
Trethellan Farm TF42 2082/188 – 2010 0.05 FA; MAG; DAG;
TAG(tr); ALK; WE
�27.
Trethellan Farm TF43 636 9 648 0.02 FA �26.
C16:0
)cd13C18:0
(&)cAssignment
6.0 �29.1 Predominantly ruminant
adipose fats
7.0 �29.8 Predominantly ruminant
adipose fats
7.2 �30.6 Predominantly ruminant
adipose fats
6.4 �29.3 Predominantly ruminant
adipose fats
6.5 �29.3 Predominantly ruminant
adipose fats
6 5 �29 7 Predominantly ruminant
adipose fats
7.4 �30.6 Predominantly ruminant
adipose fats
7.6 �30.8 Predominantly ruminant
adipose fats
7.4 �30.5 Predominantly ruminant
adipose fats
ain ketones; WE, wax esters; HWE, hydroxy wax
520
M.S.Copley
etal./JournalofArch
aeolo
gica
lScien
ce32(2005)505–521
Appendix (continued)
Site Sherd
number
Context
numberfFeatured
sherd number
Structuref Lipid
concentration
(mg g�1)
Lipids detectedb d13
(&
Trethellan Farm TF44 603 6 648 0.05 FA; K �2
Trethellan Farm TF45 2214/343 58 2222 0.03 FA �2
Trethellan Farm TF46 2214/336 – 2222 0.07 FA; MAG; DAG;
TAG
�2
Trethellan Farm TF47 2220 – 2222 0.02 FA; K; DAG(tr);
TAG(tr)
�2
Trethellan Farm TF48 2213 – 2222 0.02 FA; MAG; DAG;
TAG; K
�2
Trethellan Farm TF49 2296 2222 0.02 FA(tr); ALK; WE(tr)
Trethellan Farm TF50 2163 92 Hollow 2765 tr n/d
Trethellan Farm TF51 2163 90 Hollow 2765 0.02 n/d
Trethellan Farm TF52 94 Hollow 136 tr n/d
Trethellan Farm TF53 F149 95 Hollow 136 tr n/d
Trethellan Farm TF54 F105 94 Hollow 136 0.12 FA; MAG; DAG;
TAG; WE
�2
Trethellan Farm TF55 2743 96 Hollow 2744 tr n/d
Trethellan Farm TF56 2335/280 – STR2021 0.22 FA; MAG; DAG;
TAG
�2
Trethellan Farm TF57 2505 88 Hollow 2005 tr n/d
Trethellan Farm TF58 2004/359 – Hollow 2005 0.11 FA; MAG; DAG;
TAG
�2
Trethellan Farm TF59 2004/367 – Hollow 2005 tr n/d
Trethellan Farm TF60 3049/497 – 142/3022 0.04 FA �2
Trethellan Farm TF61 99/F108 37 142/3022 0.05 n/d
Trethellan Farm TF62 111/F136 36 142/3022 0.14 n/d
Trethellan Farm TF63 3041/496 19 142/3022 tr n/d
Trethellan Farm TF64 3091/506 – 142/3022 0.05 n/d
Trethellan Farm TF65 5/F15 – 142/3022 tr n/d
Trethellan Farm TF66 37/F36 – 142/3022 tr n/d
Trethellan Farm TF67 83 – 142/3022 0.05 n/d
Trethellan Farm TF68 98/F120 – 142/3022 tr n/d
Trethellan Farm TF69 3091/508 – 142/3022 0.03 n/d
a See Gingell et al. [19].b Key: FA, fatty acids; MAG, monoacylglycerols; DAG, diacylglycerols; TAG, triacylglycerol; ALK, n-alkanes; ALC, n-alcohols; K, mid-ch
esters; tr, trace abundances; n/d, not detected.c Analytical error is G0.3&.d See Ellison in Drewett et al. [8].e See Woodward [34].f See Nowakowski [28].
521M.S. Copley et al. / Journal of Archaeological Science 32 (2005) 505–521
References
[1] J. Cavender-Bares, F.A. Bazzaz, Changes in drought response
strategies with ontogeny in Quercus rubra: implications for
scaling from seedlings to mature trees, Oecologia 124 (2000)
8–18.
[2] M.S. Copley, Chemical investigations of pottery and palae-
oenvironmental material from Qasr Ibrim, Egypt, Unpublished
PhD thesis. School of Chemistry, University of Bristol, Bristol,
2001.
[3] M.S. Copley, P.J. Rose, A. Clapham, D.N. Edwards,
M.C. Horton, R.P. Evershed, Detection of palm fruit lipids in
archaeological pottery from Qasr Ibrim, Egyptian Nubia,
Proceedings of the Royal Society Biological Section 268 (2001)
593–597.
[4] M.S. Copley, R. Berstan, S.N. Dudd, G. Docherty,
A.J. Mukherjee, V. Straker, S. Payne, R.P. Evershed, Direct
chemical evidence for widespread dairying in prehistoric Britain,
Proceedings of the National Academy of Sciences USA 100
(4) (2003) 1524–1529.
[5] M.S. Copley, R. Berstan, S.N. Dudd, V. Straker, S. Payne, R.P.
Eversherd, Dairying in antiquity: I. Evidence from absorbed lipid
residues dating to the British Iron Age, Journal of Archaeological
Sciences, in press.
[6] M.S. Copley, R. Berstan, S.N. Dudd, V. Straker, S. Payne, R.P.
Eversherd, Dairying in antiquity: III. Evidence from absorbed
lipid residues dating to the British Neolithic, Journal of
Archaeological Sciences, in press.
[7] P. Drewett, Black Patch and the later Bronze Age in Sussex, in:
J.C. Barrett, J. Bradley (Eds.), Settlement and Society in the
British late Bronze Age, BAR 83(i), Oxford, 1980, pp. 377–398.
[8] P. Drewett, A.B. Ellison, C.R. Cartwright, P. Hinton,
T. O’Connor, Excavations at Black Patch, Proceedings of the
Prehistoric Society 48 (1982) 321–400.
[9] S.N. Dudd, R.P. Evershed, Direct demonstration of milk as an
element of archaeological economies, Science 282 (1998) 1478–
1481.
[10] R.P. Evershed, Biomolecular archaeology and lipids, World
Archaeology 25 (1) (1993) 74–93.
[11] R.P. Evershed, C. Heron, L.J. Goad, Analysis of organic residues
of archaeological origin by high-temperature gas-chromatography
and gas-chromatography mass- spectrometry, Analyst 115 (10)
(1990) 1339–1342.
[12] R.P. Evershed, C. Heron, L.J. Goad, Epicuticular wax compo-
nents preserved in potsherds as chemical indicators of leafy
vegetables in ancient diets, Antiquity 65 (1991) 540–544.
[13] R.P. Evershed, C. Heron, S. Charters, L.J. Goad, The survival of
food residues: new methods of analysis, interpretation and
application, in: A.M. Pollard (Ed.), New Developments in
Archaeological Science, Oxford University Press, Oxford, 1992,
pp. 187–208.
[14] R.P. Evershed, H.R. Mottram, S.N. Dudd, S. Charters,
A.W. Stott, G.J. Lawrence, A.M. Gibson, A. Conner,
P.W. Blinkhorn, V. Reeves, New criteria for the identification
of animal fats preserved in archaeological pottery, Naturwissen-
schaften 84 (9) (1997a) 402–406.
[15] R.P. Evershed, S.J. Vaughan, S.N. Dudd, J.S. Soles, Fuel for
thought? Beeswax in lamps and conical cups from the late Minoan
Crete, Antiquity 71 (1997b) 979–985.
[16] R.P. Evershed, S.N. Dudd, M.S. Copley, R. Berstan, A.W. Stott,
S. Mottram, S.A. Buckley, Z. Grossman, Chemistry of archae-
ological animal fats, Accounts of Chemical Research 35 (8)
(2002) 660–668.
[17] R.P. Evershed, S.N. Dudd, V.R. Anderson-Stojanovic,
E.R. Gebhard, New chemical evidence for the use of combed
ware pottery vessels as beehives in Ancient Greece, Journal of
Archaeological Science 30 (2003) 1–12.
[18] G.D. Farquhar, J.R. Ehleringer, K.T. Hubick, Carbon isotope
discrimination and photosynthesis, Annual Review of Plant
Physiology and Plant Molecular Biology 40 (1989) 503–537.
[19] C.J. Gingell, E.L. Morris, R. Seager-Smith, L. Mepham, Pottery,
in: A.J. Lawson (Ed.), Animal Husbandry in Prehistoric
Wiltshire, Wessex Archaeology, No. 17, pp. 136–179.
[20] C.D. Keeling, W.G. Mook, P.P. Tans, Recent trends in the13C/12C ratio of atmospheric carbon dioxide, Nature 277
(1979) 121–123.
[21] B. Levitan, The vertebrae remains, in: M. Bell (Ed.), Brean Down,
Exacavtions 1983–1987, English Heritage, London, 1990,
pp. 220–240.
[22] A. Locker, Animal bone, in: A. Lawson (Ed.), Potterne 1982–5,
Animal Husbandry in Later Prehistoric Wiltshire: Wessex
Archaeology, pp. 101–136.
[23] M.J. Lockheart, P.F. van Bergen, R.P.E. Evershed, Variations in
the stable carbon isotope compositions of individual lipids from
the leaves of modern angiosperms, Implications for the study of
higher plant derived sedimentary organic matter, Organic Geo-
chemistry 26 (1–2) (1997) 137–153.
[24] J.A. Lowdon, W. Dyck, Seasonal variation in the isotope ratios of
carbon in maple leaves and other plants, Canadian Journal of
Earth Sciences 11 (1973) 79–88.
[25] P. McDonald, R.D. Edwards, J.F.D. Greenhalgh, Animal
Nutrition, Pergamon Press, Essex, 1988.
[26] E. Medina, L.D. Steinberg, Vertical stratification of d13C values in
closed natural and plantation forests in the Luquillo mountains,
Puerto Rico, Oecologia 87 (1991) 369–372.
[27] H.R. Mottram, S.N. Dudd, G.J. Lawrence, A.W. Stott,
R.P. Evershed, New chromatographic, mass spectrometric and
stable isotope approaches to the classification of degraded animal
fats preserved in archaeological pottery, Journal of Chromatog-
raphy A 833 (2) (1999) 209–221.
[28] J. Nowakowski, Trethellan Farm, Cornish Archaeology 30
(1991) 1–242.
[29] T. O’Connor, Animal bones, in: P. Drewett (Ed.), Later Bronze
Age Downland Economy and Excavations at Black Patch, East
Sussex, Proceedings of the Prehistoric Society, 48, pp. 378–380.
[30] S. Payne, The animal bones, in: J. Nowakowski (Ed.), Trethellan
Farm, Newquay: Excavation of a Lowland Bronze Age Settle-
ment and Iron Age Cemetary, Cornish Archaeology, No. 30,
pp. 180–182.
[31] M. Regert, S. Colinart, L. Degrand, O. Decavallas, Chemical
alteration and use of beeswax through time: accelerated ageing
tests and analysis of archaeological samples from various
environmental contexts, Archaeometry 43 (4) (2001) 549–569.
[32] V. Straker, Charred plant macrofossils, in: M. Bell (Ed.), Brean
Down. Exacavations 1983–1987, English Heritage, London, 1990,
pp. 211–220.
[33] L. Wandsnider, The roasted and the boiled: Food composition
and heat treatment with special emphasis on pit-hearth cooking,
Journal of Anthropological Archaeology 16 (1) (1997) 1–48.
[34] P. Woodward, The Bronze Age pottery, in: M. Bell (Ed.), Brean
Down Excavations 1983–1987, English Heritage, Report No. 15,
London, 1990, pp. 121–145
[35] J.W. Zhang, J.D. Marshall, Variation in carbon-isotope discrim-
ination and photosynthetic gas-exchange among populations of
pseudotsuga-menziesii and pinus-ponderosa in different environ-
ments, Functional Ecology 9 (3) (1995) 402–412.