DAIRY MARKETS, POLICIES, AND TRADE IN EASTERN EUROPE AND THE FORMER SOVIET UNION
34
Dairy Markets, Policies, and Trade in Eastern Europe and the former Soviet Union Johan F.M. SWINNEN, Liesbeth DRIES and Hamish R. GOW Paper prepared for presentation at the International Agricultural Trade Research Consortium Conference on “Trade in Livestock Products” in Auckland, New Zealand, January 18-19, 2001. Swinnen and Dries are, respectively, associate professor and researcher with the Policy Research Group, Department of Agricultural and Environmental Economics, at the Katholieke Universiteit Leuven (PRG-Leuven) in Belgium. Gow is assistant professor at the University of Illinois, Champaign-Urbana and senior research associate of PRG-Leuven. Correspondence: PRG-Leuven Department of Agricultural and Environmental Economics Katholieke Universiteit Leuven De Croylaan 42, 3001 Leuven, Belgium Tel: 32-16-32.16.15 Fax: 32-16-32.19.96 Email: [email protected]
Transcript of DAIRY MARKETS, POLICIES, AND TRADE IN EASTERN EUROPE AND THE FORMER SOVIET UNION

Dairy Markets, Policies, and Trade
in Eastern Europe and the former Soviet Union
Johan F.M. SWINNEN, Liesbeth DRIES and Hamish R. GOW
Paper prepared for presentation at the International Agricultural Trade Research Consortium Conference on “Trade in Livestock Products” in Auckland, New Zealand, January 18-19, 2001. Swinnen and Dries are, respectively, associate professor and researcher with the Policy Research Group, Department of Agricultural and Environmental Economics, at the Katholieke Universiteit Leuven (PRG-Leuven) in Belgium. Gow is assistant professor at the University of Illinois, Champaign-Urbana and senior research associate of PRG-Leuven. Correspondence: PRG-Leuven Department of Agricultural and Environmental Economics Katholieke Universiteit Leuven De Croylaan 42, 3001 Leuven, Belgium Tel: 32-16-32.16.15 Fax: 32-16-32.19.96 Email: [email protected]

1
Dairy Markets, Policies, and Trade in Transition Economies
Johan F.M. Swinnen, Liesbeth Dries, and Hamish R. Gow
Introduction
In the transition economies of central and eastern Europe and the former Soviet Union,1
economic and institutional reforms had important impacts on dairy production, consumption, prices,
and policies. This paper analyzes the changes in dairy markets, policies, and trade over the past
decade during transition and discusses what can be expected in the next decade. We analyze the
changes in production, consumption, and trade, as well as changes in the policies and the industry
structure, and discuss how various factors have affected the market and trade situation.
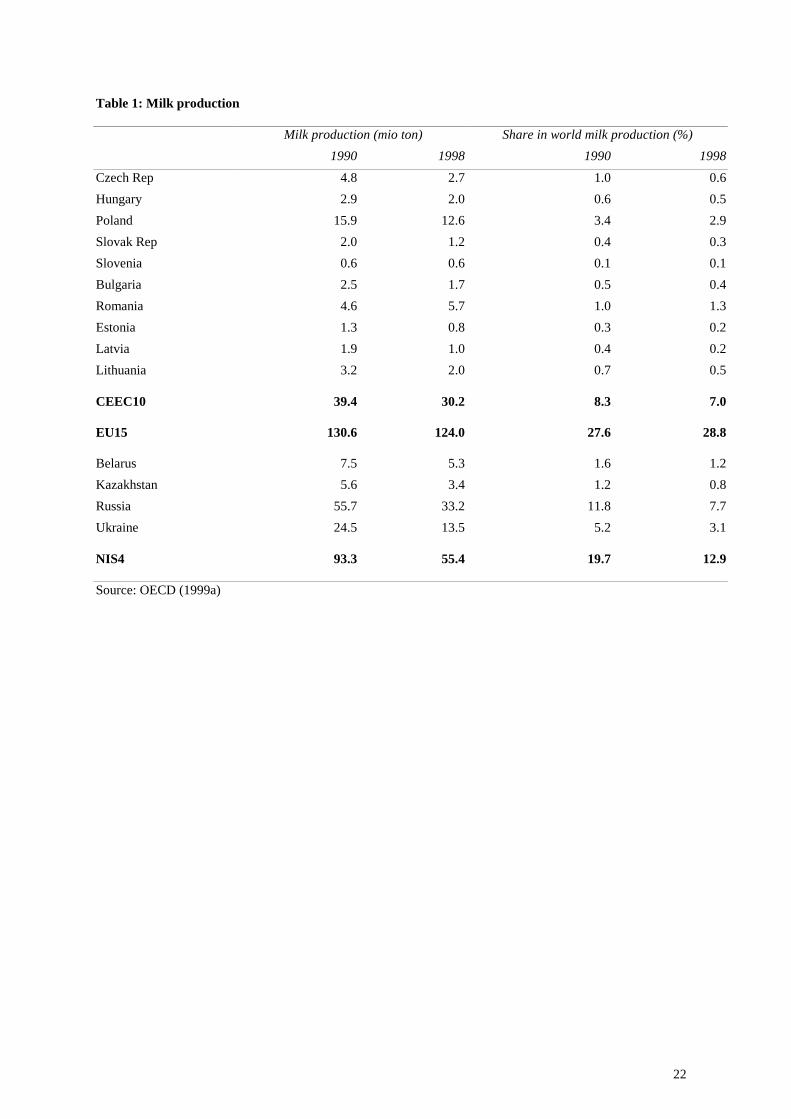
The transition countries account for a very significant share of world dairy markets. The ten
Central and Eastern European Countries (CEEC-10) who have signed association agreements with
the European Union (EU), several of whom are expected to join the EU in the next decade,
currently produce somewhat more than 30 million tons of milk, 7 % of total world milk production
(see table 1). This is almost a quarter less than their output in 1990 (figure 1). Still, combined with
the fifteen current member states of the EU (EU-15) they produce over 150 million tons of milk,
36% of total world milk output.
The former Soviet Union (FSU) countries are an even larger milk producer than the CEEC-
10. Four important so-called Newly Independent States (NIS-4), i.e. Russia, Ukraine, Belarus, and
Kazakhstan produced around 55 million tons of milk in 1998, i.e. 13 % of world milk production.
However, this is much less than their pre-transition levels: in 1990 they still produced, at least
according to official statistics, over 90 million tons of milk, i.e. 20% of the world’s total.
1 This paper does not cover China and other East Asian transition countries. For a general comparison of agrarian transition in China and East Asia with the FSU and Eastern Europe, see Macours and Swinnen (2001).

2
At the country level, the most important milk producers are Poland with 12.6 million tons in
1998, and Russia (33.2 million tons) and Ukraine (13.5 million tons). The output fall in Russia and
Ukraine was particularly dramatic. While Ukraine produced more than 50% more than Poland in
1990, its milk output has since fallen to close to Poland’s. In Poland, as in most CEECs, important
recovery occurred in the second half of the 1990s in productivity and output in the dairy sector. The
latter was positively influenced by foreign investment in dairy processing.
The dairy sector was highly protected under the Communist system. While government
protection fell during liberalization, government interventions increased again in the second half of
the 1990s. By the end of the decade, dairy was one of the highest protected commodities in central
and eastern Europe and Russia.
The paper is organized as follows: we first discuss the transition changes in consumption
and production, and how reforms have affected them. Then we discuss restructuring of the
production system and the dairy chain and the impacts of the changes on dairy trade. In the last
sections we discuss policy changes and the expected effects of integration of the central European
countries into the EU, the so-called “Eastern EU enlargement” and how this relates to EU dairy
policy and the WTO.
Consumption
Important changes in dairy consumption have taken place in transition countries, although
the changes vary among countries. Consumption fell in all countries after the start of the reforms
with declining real incomes (figure 2). However in some CEECs, such as Poland and Czech
Republic, a significant recovery occurred in the second half of the 1990s, while consumption kept
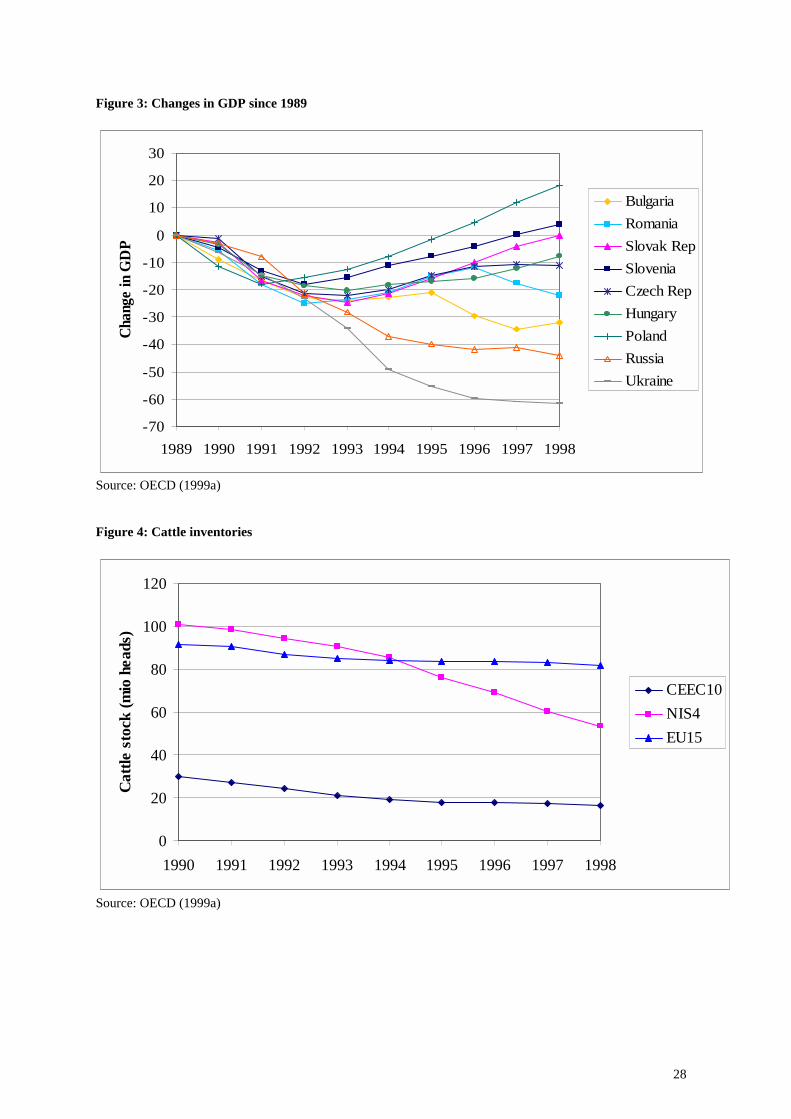
declining in Russia and Ukraine. These consumption patterns reflect developments in GDP, as
income increased rapidly in Poland, and to a lesser extent in the Czech Republic since 1993 (figure

3
3). In fact, GDP grew on average with 6% between 1993 and 1998 in Poland, while it continued to
decline in Russia and Ukraine over this period.
The consumption data should be interpreted with care, especially for international
comparisons, since there are major differences in quality among countries, and consumption data in
Communist countries typically exaggerated actual consumption. Further, with changes during
transition the quality and variety of dairy products has changed, which is not always accurately
reflected in the data (or the presentations). Despite these qualifications, the available data are
consistent with the argument that dairy products were among the most heavily subsidized products
in eastern Europe and the former Soviet Union, and their consumption has therefore suffered
heavily from subsidy cuts and price liberalization.2 This was especially the case in the former
Soviet Union, as consumption per capita fell more than 40% both in the Baltics and in Russia and
Ukraine.
Data from different sources presented in table 2 suggest that pre-reform consumption of
dairy products was high in these countries in comparison with the level of income in these
countries, even allowing for statistical bias. The fact that the level remains high even now in
comparison with the EU countries also reflects the fact that dairy products traditionally make up a
large share of the consumer diet in many former Communist countries, in particular the Northern
and Eastern ones. For example, according to OECD data, dairy consumption levels were highest in
the Baltic countries with per capita consumption levels of close to 500 kg milk and dairy products
in 1990, which have since dropped by half to around 250 kg/capita by 1998.
2 The subsidy system included keeping consumer prices low while simultaneously subsidizing production, often through a combination of various direct and indirect subsidies. Hence producers and consumers of dairy products were both subsidized.

4
Changes in Production and Yields
Milk production, as the production of other commodities, has been severely affected by the
political and economic reforms over the past ten years. However it is clear from figure 1 that the
output pattern has gone different roads in both regions in the second half of the 1990s. While
output fell around 25% in both CEEC-10 and NIS-4 between 1990 and 1994, milk production
stabilized and slightly recovered in the CEEC-10 after 1994, while it continued to fall in Russia and
the other NIS countries to 60% of the pre-reform level by 1998.
Stabilization occurred in most CEECs since the mid 1990s, but at different levels. For
example, while in Poland stabilization and recovery returned production to 80% of pre-reform
output, milk production fell below 60% of pre-reform output in Bulgaria a country where reforms
proceeded much more slowly (and also the Czech Republic, where the 1996 macro-economic crisis
caused a major decline in output at the end of the 1990s.)
Interestingly, recovery did not reach levels equal or above the pre-reform output, as was the
case in crop production (Swinnen, 2000).
Figures 4-7 present data on the evolution of the cattle stock and on milk yields. These data
also reveal the different patterns in CEECs versus Russia and the NIS countries. The output decline
in the early 1990s in CEECs was mostly due to a dramatic decline in cattle stock: the number of
cattle declined by 40% between 1990 and 1995 in the CEEC-10, and declined only slightly
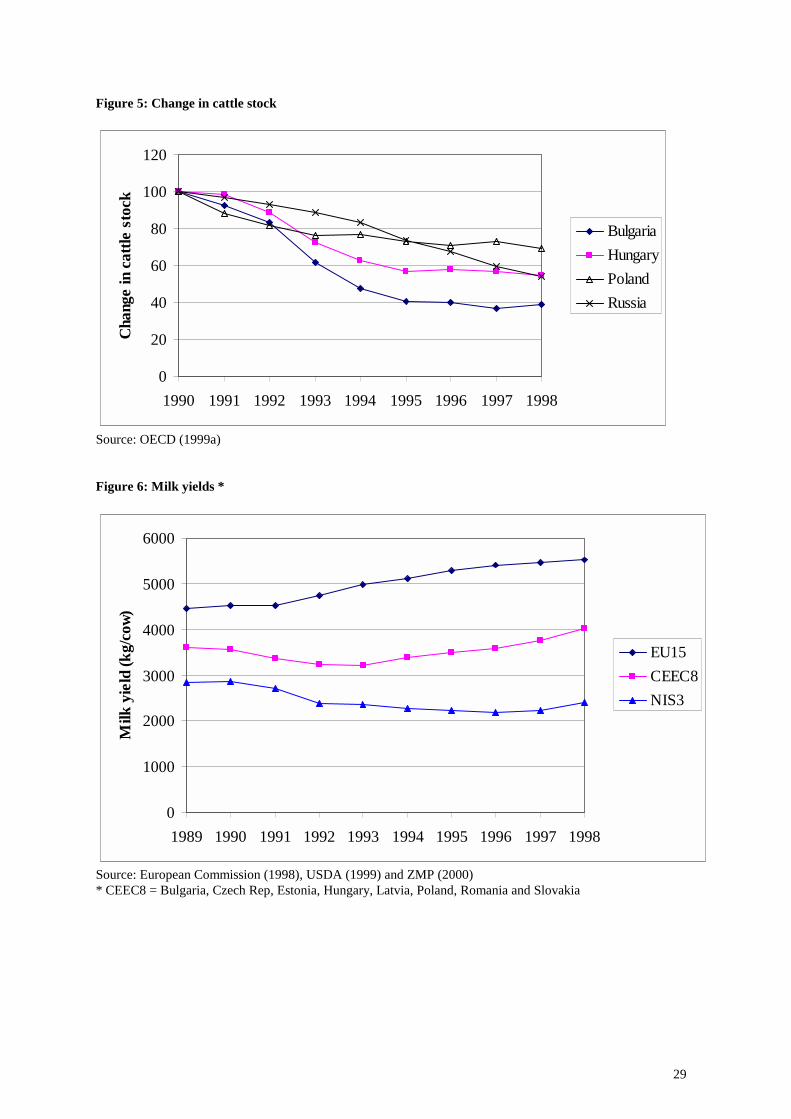
afterwards, while yields fell 10% between 1990 and 1993, but started increasing rapidly after 1993.
In fact, milk yields increased by an average of 4.5 % annually between 1993 and 1998 in CEECs,
compared to the EU-15 annual increase in milk yields of 2.5 % over the same period. Still, despite
the rapid increase in milk yields in CEECs, milk yields in CEECs averaged 4000 kg/cow, which is
still considerably below the EU-15 average of 5500 kg/cow in 1998.
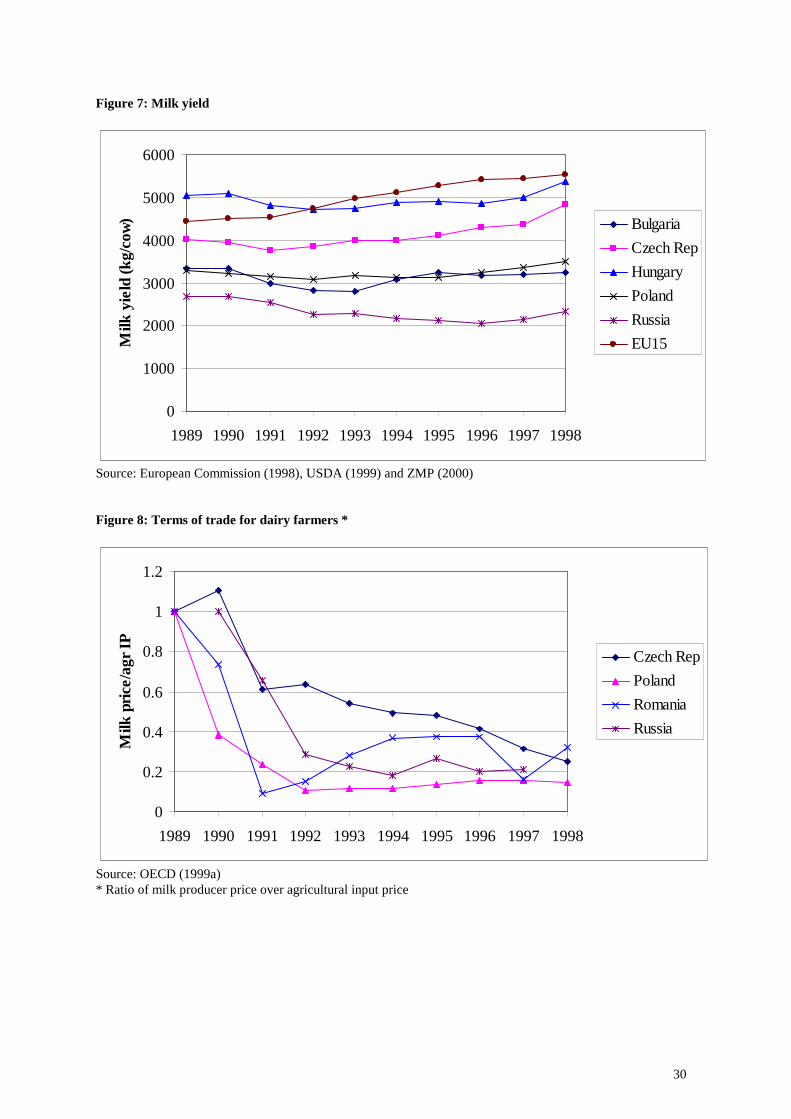
Furthermore, figures 5 and 7 yield some interesting information on the differences within
CEECs. Figure 5 illustrates how the fall in cattle stock was most extreme in Bulgaria where
5
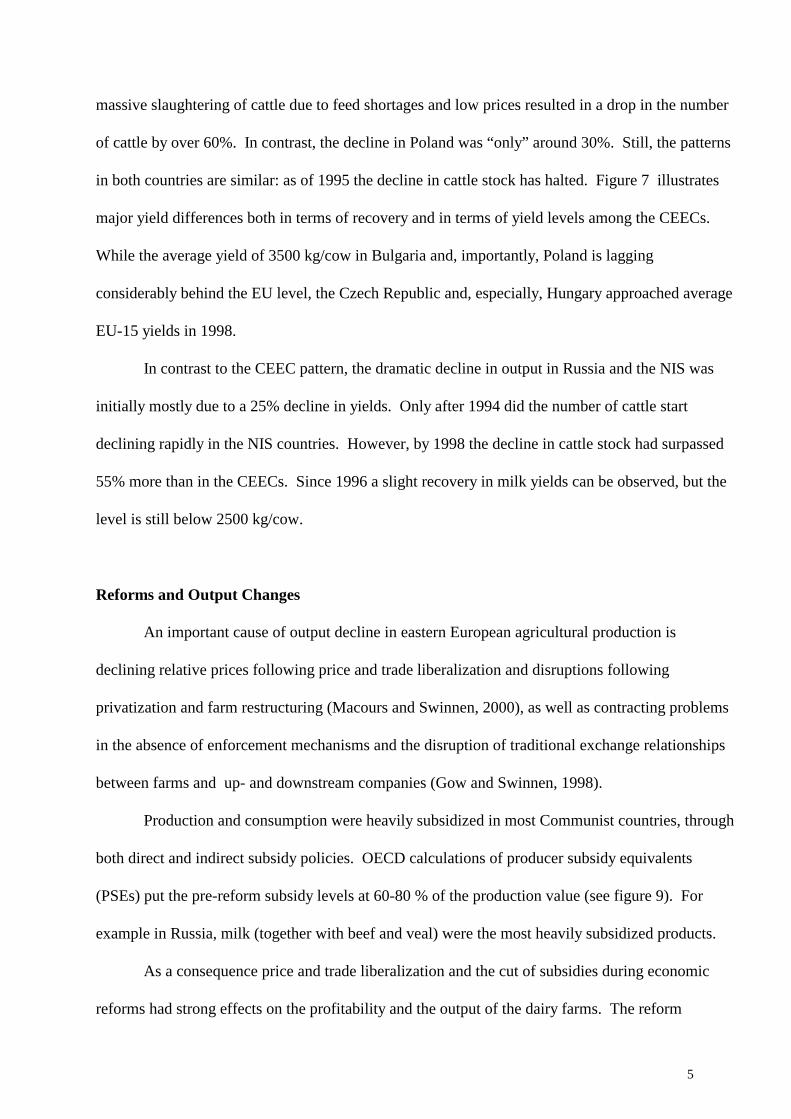
massive slaughtering of cattle due to feed shortages and low prices resulted in a drop in the number
of cattle by over 60%. In contrast, the decline in Poland was “only” around 30%. Still, the patterns
in both countries are similar: as of 1995 the decline in cattle stock has halted. Figure 7 illustrates
major yield differences both in terms of recovery and in terms of yield levels among the CEECs.
While the average yield of 3500 kg/cow in Bulgaria and, importantly, Poland is lagging
considerably behind the EU level, the Czech Republic and, especially, Hungary approached average
EU-15 yields in 1998.
In contrast to the CEEC pattern, the dramatic decline in output in Russia and the NIS was
initially mostly due to a 25% decline in yields. Only after 1994 did the number of cattle start
declining rapidly in the NIS countries. However, by 1998 the decline in cattle stock had surpassed
55% more than in the CEECs. Since 1996 a slight recovery in milk yields can be observed, but the
level is still below 2500 kg/cow.
Reforms and Output Changes
An important cause of output decline in eastern European agricultural production is
declining relative prices following price and trade liberalization and disruptions following
privatization and farm restructuring (Macours and Swinnen, 2000), as well as contracting problems
in the absence of enforcement mechanisms and the disruption of traditional exchange relationships
between farms and up- and downstream companies (Gow and Swinnen, 1998).
Production and consumption were heavily subsidized in most Communist countries, through
both direct and indirect subsidy policies. OECD calculations of producer subsidy equivalents
(PSEs) put the pre-reform subsidy levels at 60-80 % of the production value (see figure 9). For
example in Russia, milk (together with beef and veal) were the most heavily subsidized products.
As a consequence price and trade liberalization and the cut of subsidies during economic
reforms had strong effects on the profitability and the output of the dairy farms. The reform
6
impacts on the prices for milk producers can be seen from figure 8. The terms of trade for milk
producers, measured in figure 8 by the ratio of milk prices over an index of agricultural input prices
declined dramatically in all CEECs with price liberalizations and subsidy cuts, starting first in
Poland in 1988/9 and the next year in the other countries. By 1998 the ratio had declined by 70-
85% in all the countries represented. Importantly, the major price adjustments occurred in the early
years of transition. For example in Poland, Russia, and Romania relative prices had declined to
around their current level within 2 years of reforms. Since 1993 relative prices have been much
more stable.
A comparison with figure 1 shows that the major decline in output, at least in CEECs,
occurred during this initial phase with major price adjustments. Furthermore, comparing figures 1,
7 and 8 suggests that an important factor in milk output growth since 1995 is increases in yields,
rather than an improvement in relative prices.
In conclusion, this analysis suggests that the initial decline in milk output in the early 1990s
is caused primarily by a decline in relative prices, while the recovery in the second half of the 1990s
in Central Europe is due mostly to an improvement in yields and efficiency. This conclusion is
consistent with Macours and Swinnen’s (2000) result based on an econometric study for crops in
eight CEECs.
Yield increases have come from improved access to inputs and correction of contracting
problems, and have been most strongly in those countries where the necessary reforms and
restructuring were implemented rapidly and most thoroughly. Reforms in countries such as Russia,
Ukraine and several other large NIS have been slow, if at all implemented, and restructuring has
lagged behind. As a consequence, improvements in yields and recovery in output have not emerged
or only much later than in several of the CEECs such as Hungary and the Czech Republic.
Key reforms and conditions for such recovery to occur are privatization and effective
restructuring of the farm and the processing companies.

7
Privatization and Restructuring of the Dairy Farms and the Industry
The dairy system was characterized by a wide variety of problems, including
overcapacity, inefficiencies, outdated technology, poor incentives, and poor quality of the
products, both at the farm level and at the processing level. Privatization and enterprise
restructuring was needed to improve the incentive problems. But this was not sufficient.
Improvements in technology and quality enhancements required significant investments.
Dairy companies had low levels of investment capital, or difficult access to capital in general,
following the macro-economic reforms and the general banking restructuring, this left many of the
companies in financial distress. Consequently, dairy processors borrowed capital from farms by
delaying payments to farms for milk deliveries (Gow and Swinnen, 1998). This worsened the
already poor financial situation of the dairy farms, complicating their investments as well.
While privatization induced foreign investment has played an important role in providing
access to much needed foreign capital, know-how, and technology, also domestic financial
resources, both public and private have contributed to improvements in quality and productivity.
Let us summarize some key developments and restructurings.
Farm restructuring
Except in Poland and former Yugoslavia, where small scale family farms dominated, dairy
production took place on large scale cooperative and state farms under the Communist regime.
With privatization and land reform a major restructuring of the dairy production system has
occurred in several transition countries.
In many transition countries the majority of dairy production currently occurs at much
smaller family farms. For example, in Poland, the largest CEEC dairy producer and where family
farms dominated under Communism, most dairy production occurs on (very) small farms. The

8
average dairy herd per farm is 3.5 cows. One estimates that around 1,300,000 farms are involved in
(some) dairy production, but only around 500,000 farms deliver milk to dairy plants. The rest of the
milk is used for self-consumption.
But also in other transition countries where dairy production was located on large state and
collective farms under Communism, such as for example in Latvia and Lithuania where dairy is an
important activity, dairy production has shifted to family farms. The small family farms typically
use very labor intensive production techniques. This creates some specific problems in dairy
production if these farms need to make the necessary investments, both in human capital and in
equipment and technology, to upgrade their production techniques in order to obtain minimum
quality milk. The fragmented farm structure also poses specific problems for investors in dairy
processing, in terms of transaction costs of milk collection and for on-farm investment.
In some other CEECs, such as the Czech Republic, Slovakia, and to some extent Hungary,
large dairy farms have survived to a much larger extent, as they did in Russia, Ukraine, Belarus, and
Kazakhstan (Mathijs and Swinnen, 2000). The average herd in the Czech Republic is 35 cows per
farm. However this number hides an important dualistic structure, with most of the assets used by
large farms, but still a large number of very small farms operating simultaneously.
However, the NIS and CEECs differ strongly in the operation of the large corporate farms.
While most of these farms have undergone serious restructuring in the CEECs where they survived,
typically laying off much surplus labour, this is much less the case in Russia and Ukraine, where
many of the old farm management practices continue (Csaki and Lerman, 2000). As a
consequence, the majority of large Russian dairy farms is facing an insolvency problem. Their bank
accounts are frozen and most of them resort to barter trade arrangements. This makes them less
responsive to market signals while dairy production continues to shift towars small-scale household
production. Much of this is subsistence production with only a small proportion of the produce
destined for the markets. In general in Russia the role of so-called “household producers” has

9
continuously grown over the past decade.3 While these households are only using around 20% of
the land, they produced around 60% of total agricultural output in Russia in 1999 (OECD 2000).
Privatization of dairy processing facilities and investments throughout the chain
Various approaches of privatization of processing facilities have been followed, resulting in
different market and industry dynamics during the transition period (Gow, 2000). For example, the
Hungarian privatization procedure of selling off processing facilities to the highest bidder has
caused a much more efficient restructuring and stronger inflow of foreign capital than other
procedures followed by most CEECs and NIS. By now, around half of the Hungarian dairy industry
is owned by foreign dairy companies.
FDI has been a very important factor in the restructuring process of the entire dairy chain.
While reliable data on FDI and its effects are difficult to obtain, we identify several preliminary
conclusions here:
• Foreign investment in the dairy sector has caused a huge inflow of western technology,
finance, and know how.
• If foreign investment reaches a certain share of the market it induces consolidation in the
local dairy market by forcing sufficient competition on the local companies. This seems to
be happening in Hungary, but much less in Poland where foreign investments are still
relatively marginal. (Also, the competition effect may be limited, as in Russia, because
foreign investment is most important in subsectors (e.g. yogurt) that were relatively
underdeveloped before.)
3 In contrast to most CEECs, there are hardly any 'family farms' in Russia. However, the difference in Russia between household farms and private farms is peculiar, and mostly for taxation reasons household farms have refrained from registering as "family farms" or "private farms".
10
• Importantly, throughout the region we observe dairy companies setting up technology
adoption and credit facilitation programs for their milk supplying farms. For example,
companies provide loans for farms to invest in cooling tanks or milk equipment, and assist
them in getting access to better feed for the cows, and in some cases even support for
livestock investments. Such credit and investment programs are implemented by both
foreign owned and domestic dairy companies, although some spillover effects may have
occurred after foreign investors came in and set up their programs.
• Financing of technology and investments depends strongly on the overall state of the
economy. For example, input suppliers tend to sell only on a cash basis in Russia, while
providing up to 10 year loans for milking equipment in Poland because of the much more
stable macroeconomic and institutional environment.
• Case studies suggest that while the processors prefer larger farms because of lower
transaction costs, smaller farms tend to be more reliable in terms of milk deliveries, and
therefore dairy companies tend to set up support programs for both larger and smaller farms
(e.g. investments in milk collection points for the latter).
• The combination of these programs have major effects on the productivity and the quality of
the milk produced by the farms.
• Foreign investments in higher value dairy products (e.g. yogurt and ice cream) often result
from increased restrictions on imports of these products. In fact, several companies
exporting these products to the countries set up local production facilities, both in
anticipation of trade restrictions and of growing local consumption of these products (e.g. in
Russia the current consumption of higher value production is extremely low by West
European levels.)

11
• Foreign investors rapidly impose high quality standards, before public institutions started
requiring this, and support it by programs in anticipation of EU accession. While the
preparation for EU accession forces the CEEC governments to impose minimum product
quality on the domestic producers, such requirements were imposed much earlier by foreign
investors in dairy processing companies.
How far have the quality improvements progressed ?
One of the preconditions to sell in the EU is the accordance of production standards with the
quality, sanitary and hygiene regulations imposed by the EU regulations. One indicator of this
ability is the number of certified facilities, which are approved by certification agencies for
exporting to the EU. According to European Commission data, the number of dairy processing
plants which already received certifications are only a small share: 27 out of 125 plants (22%) in the
Czech Republic, 4 out of 41 (10%) in Estonia, and only 19 out of 400 (5%) in Poland. However,
one should take into account that, for example in Poland, many of these processing plants are quite
small and that those that received certification are typically the larger ones.
Furthermore, things may change fast once public programs start being implemented
and when sufficient foreign investment has taken place. For example in 1999 only about 25
% of the milk in Poland fulfilled the minimum EU hygiene standards, while in Hungary
around 80%, and even 90% in the Czech Republic, of the milk met the EU standards
(Berkowitz and Münch, 2000). However, due to major investments currently going on, both
supported by private investors in dairy processing, and by public programs (including the
PHARE, and in the future the SAPARD, programs of the European Commission), these
numbers are changing rapidly. For example, according to the latest reports the share of the
highest quality milk in total milk output in Poland increased from 30% in 1999 to 65% in
2000 (Poland Agri Bulletin, Oct/Nov 2000).

12
Reform Impacts on Dairy Trade and World Markets
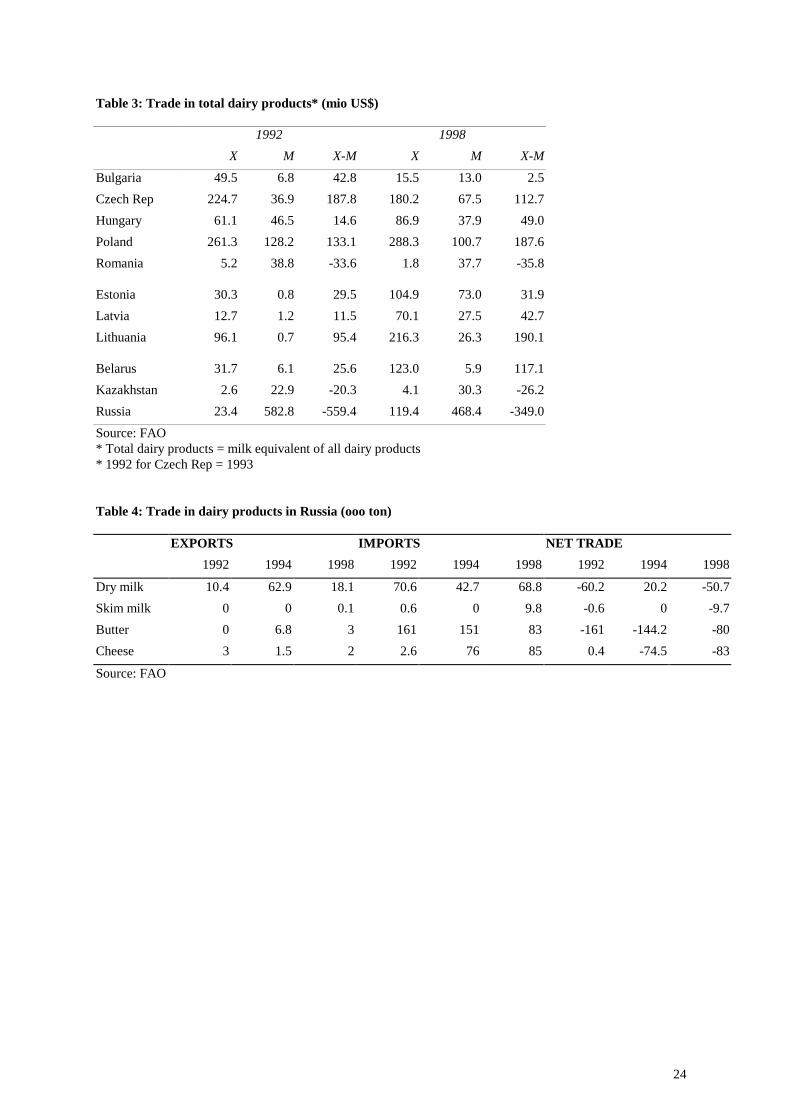
Russia has traditionally been a large importer of dairy products. By 1992, Russia imported
almost 600 million US$ of dairy products (table 3). By 1998 imports were down to 468 million
US$. According to official statistics both dairy consumption and production fell around 40%
between 1990 and 1998. The reduced value of imports appears importantly due to a shift within the
dairy products. For example, table 4 shows how imports of cheese have increased considerably
during transition (from close to zero in 1992 to over 75,000 tons in the second half of the 1990s),
while butter imports have by half fallen during the second half of the 1990s (from over 150,000
tons in 1994 to 83,000 tons by 1998).
Within the Soviet Union framework, the Baltic countries were a large dairy producing
region of which much was transported to Russia. In 1992, i.e. immediately after the separation of
the Baltics from the FSU, they exported around 140 million US$ in dairy products, mostly from
Lithuania. Remarkably, by 1998 Baltic dairy exports had increased to over 400 million US$, but a
significant part of this is probably pass-through produce, as imports have increased strongly as well.
Still, net exports almost doubled between 1992 and 1998to 271 million US$.
Poland and Lithuania are the largest dairy exporters among the CEECs and NIS, with
Poland also, after Russia the largest importer. Table 5 shows that during the 1990s Polish dairy
exports to the EU have fallen by two-thirds. The bilateral trade between the CEECs and the EU has
remained relatively stable since the mid 1990s in terms of composition of trade (van Berkum 2000).
On average, exports to the EU have been lower value added products than imports from the EU. In
general, the EU is importing more raw materials and first stage processed products (around 80% for
agro-food products as a whole) from the CEECs, while it exports more highly processed and higher
13
value commodities (around 55 percent for agro-food products as a whole) to the CEECs (Berkowitz
and Munch, 2000). An important constraint on the EU-CEEC trade developments are the Europe
Agreements which strictly regulate bilateral trade between the EU and the CEECs.
In contrast, to the trade developments with the EU, Polish dairy exports to the FSU have
increased after 1992, at least until 1998 when the Russian financial crisis effectively closed down
the Russian market for Polish exports, causing major problems on the domestic market. It can also
be seen that the growth in exports to Russia mostly was in cheese, while exports to more developed
regions were mostly in the “cream” category. Imports were mostly cheeses and high added value
dairy processed products.
Hence, the increased competitiveness of the Polish dairy sector has resulted mostly in
growing market shares and export outlets in non-EU markets, such as the NIS market.
Improvements in the dairy processing and distribution industry has significantly improved the
quality and international competitiveness of the dairy chains in Poland (as in some other CEECs).
However, while the quality of exported products, and its share in total exports, has improved, most
of them went to the Russian market, and suffered heavily from the recent volatility in this market.
Dairy Policies
Government intervention is widespread in the dairy sector of eastern Europe and the former
Soviet Union. Figure 9 shows that protection of the dairy sector was high under the communist
system: the producer subsidy equivalent (PSE) was above 50% in the five countries listed. The
figure also illustrates that the past years can be separated in three “phases”. First, government
control of production and prices, including subsidies, caused high support under the communist
system. Second, a radical reduction in government support during market liberalization in the first
half of the 1990s caused PSEs to fall dramatically, although one should be careful in interpreting

14
the calculated PSEs during the 1991-1993 period since the calculations are very sensitive to
assumptions on exchange rates. Still, PSEs declined during this period.
However protection increased again during the third transition policy phase due to a
renewed increase in government intervention and support in the second half of the 1990s. As
figure 10 shows, the average PSEs for milk between 1996 and 1998 in most CEECs and in Russia
were between 33% and 46%, which is still below, but close to, the EU and USA levels of 53% and
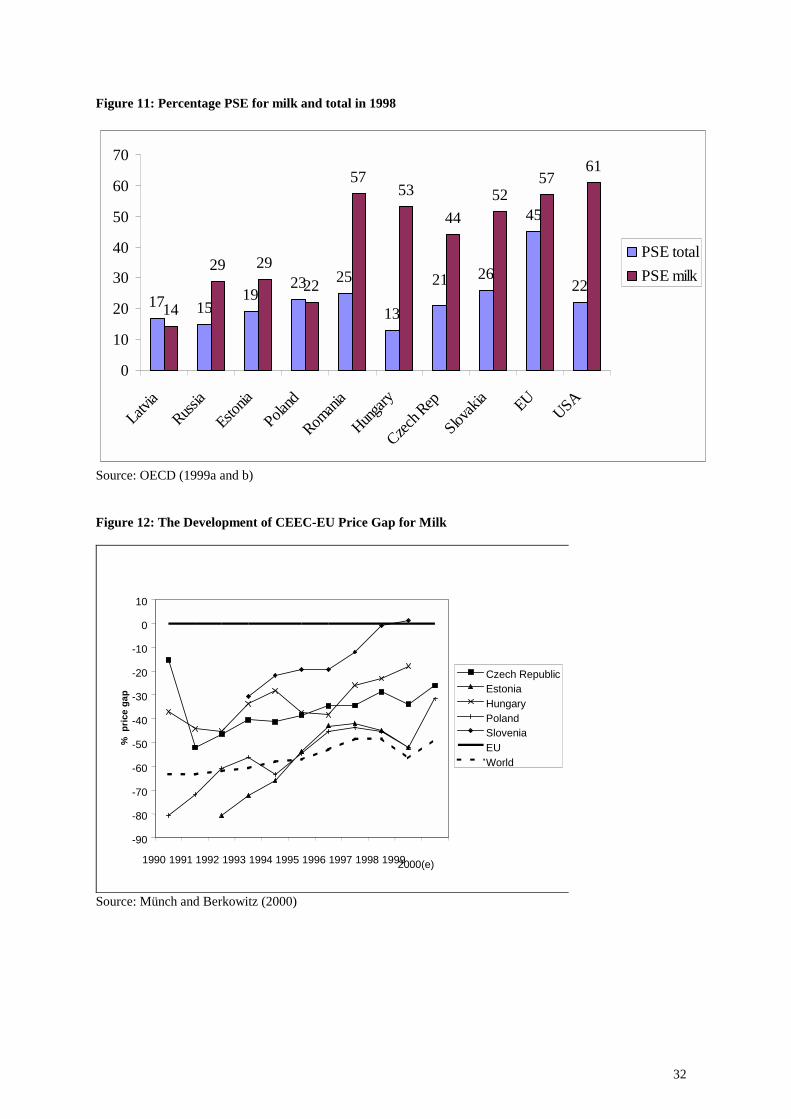
50%, respectively. Figure 11 shows that dairy producers are more heavily protected than farms on
average in almost all transition countries, as they are in the EU and the USA. In several countries,
such as Russia, Hungary, Romania, Slovakia, and the Czech Republic, subsidies to dairy producers
are at least twice the average agricultural protection level.
This transition policy pattern is not unique to the dairy sector. These three phases can be
observed in general in CEEC agriculture (Hartell and Swinnen 1998). The main reasons behind the
recent increase in protection are both political economy factors and alignment of their policies with
the EU's Common Agricultural Policy (CAP). For example, increases in protection have resulted
from increased market pressure on domestic producers, causing producers to pressure the
government to intervene in the market to protect the domestic producers against imports.
Recently, increased trade competition in east European dairy markets due to increased
domestic production in recent years, the closure of the Russian market with the 1998 Russian
financial crisis, and resulting low international prices caused much political pressure on CEEC
governments to increase protection to dairy farmers after 1999. Most CEEC governments
responded by increases in subsidies, including raising import tariffs on dairy products.
Policy instruments
Not only has the level of protection changed over the past decade, important changes
occurred in the instruments used for protecting the dairy sector. In most CEECs, dairy producers

15
benefited from a series of general support measures, such as credit subsidies and loan guarantee
programs which have become widespread in Eastern Europe.
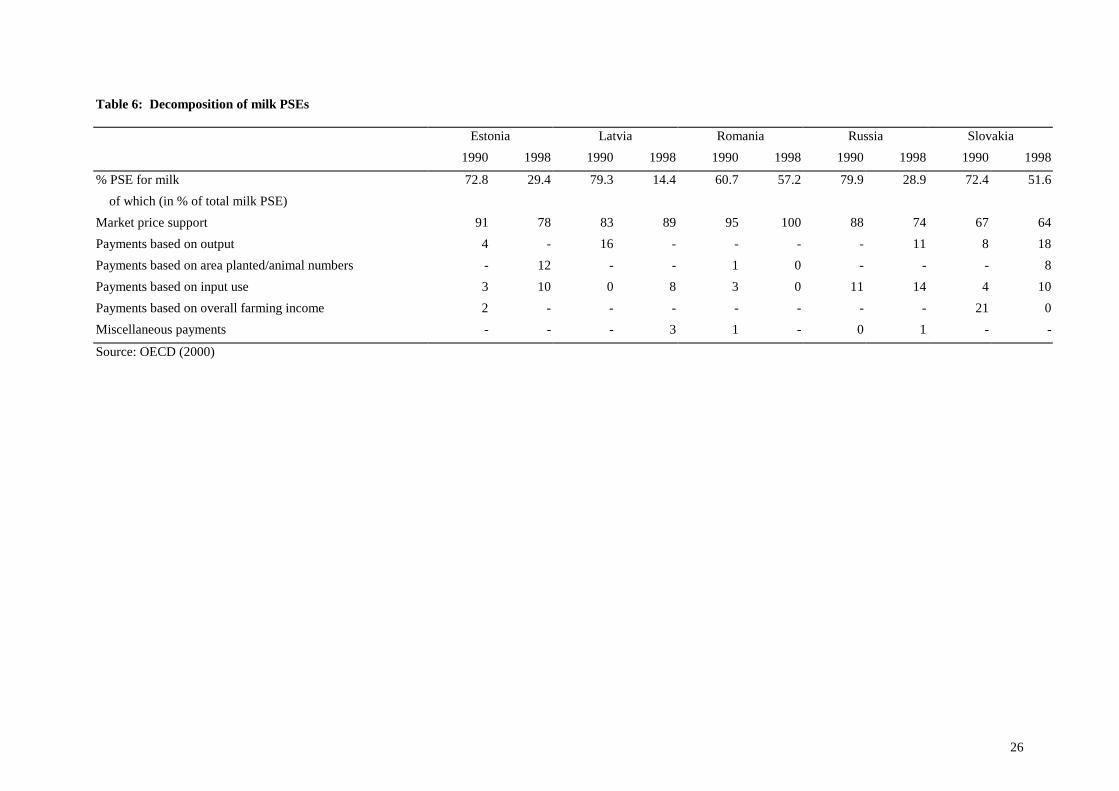
Regarding the policies specific to the dairy sector, the decomposition of the PSEs in table 6
shows that market price support is the most important support instrument, accounting for at least
two-thirds of the total support. Furthermore, in general, the instruments used for supporting dairy
producers increasingly take more features of the EU’s Common Agricultural Policy (CAP) dairy
policies. Initially, the main form of support was trade protection through import tariffs. Gradually
market interventions included other instruments such as export subsidies. For example Hungary,
Poland, and the Czech Republic have at various times subsidized dairy exports during the 1990s.
Several of the Central European countries (Czech Republic, Hungary, Poland, Romania, Slovakia)
have now introduced support prices for milk, although the implementation of the intervention
policies may differ quite strongly between them. One country (Slovakia) has already introduced
producer quota for milk, while two others (Czech Republic and Poland) have seriously discussed
introducing them, with the Czech Republic planning to introduce them as of 2001.
Eastern EU Enlargement and its expected effects on dairy markets and policies
When the CEECs join the EU they will have to adjust their agricultural policies to the CAP
as it stands at that time. After Agenda 2000 it is now reasonably clear how the CAP will look at the
time of enlargement. However, possibly the main area of uncertainty is on dairy policy. Dairy is
the sector where the final decision in the Berlin Council meeting differed most from the reform
proposals put forward by the European Commission. Many experts have since said that a reform of
the dairy policy will be required before enlargement.
Still, while an official review of the EU dairy policy is scheduled for 2003, there is also a
commitment to maintain much of the current policy until 2006 and a legal commitment to maintain
dairy quotas until 2008. Hence it is difficult to imagine a significant dairy policy reform before the

16
first CEECs will enter the EU, which is widely expected to be sometime around 2005. Obviously
extending the current dairy policy to the CEECs raises a number of important questions, none of
which have obvious solutions. For example, if dairy quotas are to be implemented, what is the
relevant base period for the CEECs, given their specific Communist and transition history ? How
can dairy quota be implemented in a country such as Poland with its hugely fragmented dairy farm
structure ? What will be the impact on prices and supply and what will be the impact on trade,
export subsidies, and WTO commitments, … ?
Let us start with the price effects. Figure 12 presents the price differences between EU-15
producer prices for milk and CEEC milk prices, where the prices are based on average milk quality
for the countries concerned. (The world market price is the adjusted New Zealand milk price.) It is
clear that, first, the price gap for milk with the EU-15 has diminished considerably for all the
CEECs since the early 1990s. While the average price gap with the EU was around 50% in 1993,
by 1999 the average gap had declined to 30%. Second, the price differences among CEECs are
large: while in Slovenia, the country with both the highest income and the highest protection of
farmers and a net importer of milk, producer prices equal those in the EU-15, in countries such as
Poland and Estonia producer prices are still only half of those in the EU-15.
Apart from differences in policies, quality differences explain a large part of the price gap.
For example, average producer prices in Poland increased dramatically in 1999-2000, partly due to
increased government support and partly due to significant improvements in the average milk
quality (see above). Furthermore, the relative EU-CEEC prices are also strongly affected by
exchange rate developments, and revaluations of the CEEC real exchange rates since the mid 1990s
have contributed to reducing nominal price gaps for agricultural products.
Hence if the current trends continue, price differences between EU and CEEC producers
may be much smaller than initially anticipated, even in dairy, a subsector where major problems
where initially anticipated. Still, most experts predict a significant price gap to remain at the time

17
of accession, with important potential output effects in CEEC dairy, unless production control
measures are imposed.
As far as the WTO is concerned, enlargement of the EU will be considered, in legal terms,
to be the enlargement of a customs union, governed by the povisions laid down in GATT article
XXIV (Tangermann, 2000).4 This article contains provisions for tariff bindings,5 but not for the
other commitments. In the ‘precedent’ of the Northern enlargement in 1995 commitments on
market access and domestic support and export subsidies were just added up, net of bilateral trade.
Probably the same procedure will be followed, although this may require compensation to trading
partners who are directly affected by the customs union – as was the case in the Northern
enlargement (Burrell, 2000).
Some CEECs were already GATT members when the URAA was negotiated (Czech,
Hungary, Poland, Romania, Slovakia). These countries accepted schedules of quantitative policy
commitments during the UR, like other countries, but as the UR overlapped with their transition
process, the starting conditions for these contries in the process of converting past policies into
future WTO commitments differs from Western countries, as finding a base period was a
particularly difficult issue. CEECs were given the option to adopt tariff bindings essentially
unrelated to past policies, similar as developing countries are treated. Other transition countries
have negotiated their accession to the WTO since the URAA and have become members (Bulgaria,
Estonia, Latvia, Slovenia) or are still negotiating. The fundamental nature of their agreement is
similar to that of others. Hence their agricultural parts specify commitments on market access,
export subsidization, and domestic support. However the commitments and details differ quite
significantly among CEECs.
4 This section draws strongly on Tangermann (2000); see there for a more extensive discussion.
18
Most CEECs have implemented tariff bindings considerably above actually implemented
tariffs. For example, Poland chose the same tariff bindings as the EU (max 3614 ECU/ton in 1995
to be reduced to max 2313 ECU/ton in 2000), and Hungary opted for bound tariffs considerably
higher than the actually used tariffs (e.g. tariffs on butter were 60% in 1994 and 1995 tariff bindings
were set at 159%, to be reduced by 36% by 2000). For both countries this implied a reduction of
bound tariffs from around 160% to 102% by 2000. These high tariff bindings have allowed the
CEECs to increase tariffs significantly recently without creating a conflict with WTO (see above).
Hence, for domestic support few problems are expected for EU enlargement since both the
EU-15 and the CEECs still have considerable slack in their commitments. However, problems may
arise on the level of tariff bindings and export subsidies. CEECs and the EU-15 already have
problems currently on export subsidies in some cases. Tariff bindings are, with the exception of
Poland, which aligned its commitments close to those of the EU, and Romania, which obtained
developing country status, on average considerably below those of the EU (see figure 13).
Also in terms of export subsidies there may be problems. While several CEECs obtained
fairly wide margins, compared to their commitment by 2002, both the Slovak Republic (111%) and,
especially, Hungary (312%) used more export subsidies for dairy products in 1997 (the last year for
which data are available) than will be allowed by 2002, while the Czech republic used only 60% of
its 2002 commitments (Twesten, 1999).
Clearly if the Millennium Round leads to either a disappearance of the blue box or to
considerable reductions in commitments, e.g. in export subsidies, such problems would be strongly
reinforced.
5 Tariff bindings after enlargement must not, on the whole, be higher than the average of the individual members before enlargement.

19

References
Berkowitz, P. and W. Münch, 2000, “The Competitiveness of Meat and Milk Production in Central and Eastern Europe - Challenges for the EU?”, Paper presented at the Conference “Globalization, Production Siting and Competitiveness of Livestock Products “ at the Federal Agricultural Research Center, Braunschweig, Germany, September 25, 2000
Burrell, A., 2000, “The World Trade Organisation and EU Agricultural Policy” in Burrell, A. and A. Oskam (eds.) Agricultural Policy and Enlargement of the European Union, Wageningen Pers, Wageningen.
Csaki, C. and Z. Lerman (Eds.), 2000, Structural Change in the Farming Sectors in Central and Eastern Europe. Washington DC: World Bank publications.
East Europe Agriculture and Food, various issues European Commission, 1998, Agricultural Situation and Prospects in the Central and Eastern
European Countries, various issues, European Commission DG Agriculture, Brussels. FAO, production and trade statistics, various issues Gow, H., 2000, "Restructuring the agribusiness sector and the role of foreign direct investment" in
Burrell, A. and A. Oskam (eds.) Agricultural Policy and Enlargement of the European Union, Wageningen Pers, Wageningen.
Gow, H. and J. Swinnen, 1998, "Agribusiness Restructuring, Foreign Direct Investment, and Hold-Up Problems in Agricultural Transition", European Review of Agricultural Economics, 25(4):331-350.
Hartell, J. and J. Swinnen, 1998, “Trends in Price and Trade Policy Instruments in Central European Agricultural and Food Markets”, The World Economy, 21(2):261-279.
Macours, K. and J. Swinnen, 2000, “Causes of Output Decline during Transition: The Case of Central and Eastern European Agriculture”, Journal of Comparative Economics, 28(1): 172-206.
Macours, K. and J. Swinnen, 2001, "Patterns of Agrarian Transition", Economic Development and Cultural Change, forthcoming
Mathijs E. and J. Swinnen, 2000, "Major Features of the New Farm Structures in Central and Eastern Europe", in Csaki, C. and Z. Lerman (Eds.), 2000, Structural Change in the Farming Sectors in Central and Eastern Europe. Washington DC: World Bank publications.
OECD, 1999a, Agricultural Policies in Emerging and Transition Economies, OECD, Paris. OECD, 1999b, Agricultural Policies in OECD Countries. Monitoring and Evaluation, OECD,
Paris. OECD, 2000, AGR NME, Internal database Poland Agri-bulletin October/November 2000. Richarts, E., 2000, “Dairy Markets in Prospective CEE Member Countries of the EU”, Paper
prepared for the Conference “Outlook for Central & Eastern Europe – Preparing for Accession”,Prague 22 – 23 May 2000.
21
Swinnen, J., 1996, "Endogenous Price and Trade Policy Developments in Central European Agriculture". European Review of Agricultural Economics, 23(2):133-160.
Swinnen, J., 2000, "Ten Years of Transition in East European Agriculture" paper presented at the KATO final conference on Understanding Transition in Agriculture, Berlin, 2 November 2000
Tangermann, S., 2000, “Widening the EU to Central and Eastern European Countries: WTO and the Perspectives of the New Member States” in Burrell, A. and A. Oskam (eds.) Agricultural Policy and Enlargement of the European Union, Wageningen Pers, Wageningen.
Twesten, H. , 1999, "Dokumentation und Analyse der Umsetzung des WTO-Agrarabkommens in ausgewählten Ländern Mittle- und Osteuropas" Unpublished manuscript, Institüt für Agrarökonomie der Universtät Göttingen.
Van Berkum, S., 2000, "Patterns of Intra-Industry Trade and Foreign Direct Investment in Agro-Food Products: Implications for East-West Integration" MOCT-MOST Economic Policy in Transition Economies 9: 57-74.
USDA, 1999, PSD, Internal database. ZMP, 2000, Agrarmarkte in Zahlen: Mittel- und Osteuropa 2000, ZMP, Bonn
22
Table 1: Milk production
Milk production (mio ton) Share in world milk production (%) 1990 1998 1990 1998
Czech Rep 4.8 2.7 1.0 0.6 Hungary 2.9 2.0 0.6 0.5 Poland 15.9 12.6 3.4 2.9 Slovak Rep 2.0 1.2 0.4 0.3 Slovenia 0.6 0.6 0.1 0.1 Bulgaria 2.5 1.7 0.5 0.4 Romania 4.6 5.7 1.0 1.3 Estonia 1.3 0.8 0.3 0.2 Latvia 1.9 1.0 0.4 0.2 Lithuania
3.2 2.0 0.7 0.5
CEEC10
39.4 30.2 8.3 7.0
EU15
130.6 124.0 27.6 28.8
Belarus 7.5 5.3 1.6 1.2 Kazakhstan 5.6 3.4 1.2 0.8 Russia 55.7 33.2 11.8 7.7 Ukraine
24.5 13.5 5.2 3.1
NIS4
93.3 55.4 19.7 12.9
Source: OECD (1999a)

23
Table 2: Per capita consumption of milk and dairy products (kg/capita)
Milk and Dairy Products1 Milk2
1990 1998 Change (%)
1997
Czech rep 256 195 -24 63
Hungary 167 133 -20 67
Poland 255 196 -23 79
Slovenia - - - 99
Estonia 502 286 -43 -
Latvia 454 272 -40 -
Lithuania 480 227 -53 -
Russia 386 226 -41 109
Ukraine 373 213 -43 -
Kazakhstan 304 209 -31 -
EU3 136 129 -5 -
France - - - 95
Germany - - - 65
The Netherlands - - - 95
1 Source: OECD (1999a) 2 Source: Richarts (2000) 3 EU-12 in 1990; EU-15 in 1998
24
Table 3: Trade in total dairy products* (mio US$)
1992 1998 X M X-M X M X-M
Bulgaria 49.5 6.8 42.8 15.5 13.0 2.5 Czech Rep 224.7 36.9 187.8 180.2 67.5 112.7 Hungary 61.1 46.5 14.6 86.9 37.9 49.0 Poland 261.3 128.2 133.1 288.3 100.7 187.6 Romania
5.2 38.8 -33.6 1.8 37.7 -35.8
Estonia 30.3 0.8 29.5 104.9 73.0 31.9 Latvia 12.7 1.2 11.5 70.1 27.5 42.7 Lithuania
96.1 0.7 95.4 216.3 26.3 190.1
Belarus 31.7 6.1 25.6 123.0 5.9 117.1 Kazakhstan 2.6 22.9 -20.3 4.1 30.3 -26.2 Russia 23.4 582.8 -559.4 119.4 468.4 -349.0 Source: FAO * Total dairy products = milk equivalent of all dairy products * 1992 for Czech Rep = 1993 Table 4: Trade in dairy products in Russia (ooo ton)
EXPORTS IMPORTS NET TRADE 1992 1994 1998 1992 1994 1998 1992 1994 1998
Dry milk 10.4 62.9 18.1 70.6 42.7 68.8 -60.2 20.2 -50.7 Skim milk 0 0 0.1 0.6 0 9.8 -0.6 0 -9.7 Butter 0 6.8 3 161 151 83 -161 -144.2 -80 Cheese 3 1.5 2 2.6 76 85 0.4 -74.5 -83
Source: FAO

Table 5: Trade in total dairy products for Poland and its most important trading partners
Export Import Total o.w. EU o.w. CAIRNS o.w. FSU Total o.w. EU o.w. NoAm o.w. FSU
1992 (mio EURO) 158.8 91.8 19.1 7.5 66.7 46.7 13.2 1.4Total (%) 100 100 100 100 100 100 100 100
share butter (%) 1 0 0 17 39 25 99 0share cream (%) 87 96 96 1 3 1 1 80share cheese (%) 5 2 0 1 48 61 0 14
share other (%) 8 2 4 81 10 13 0 61998 (mio EURO) 209.1 33.9 15.5 43.6 33.9 25.3 0.1 4.7
Total (%) 100 100 100 100 100 100 100 100share butter (%) 4 0 0 14 6 7 0 0share cream (%) 59 95 86 1 17 2 25 100share cheese (%) 30 1 7 73 49 55 40 0
share other (%) 7 4 7 12 28 36 34 0Source: European Commission
26
Table 6: Decomposition of milk PSEs
Estonia Latvia Romania Russia Slovakia 1990 1998 1990 1998 1990 1998 1990 1998 1990 1998
% PSE for milk 72.8 29.4 79.3 14.4 60.7 57.2 79.9 28.9 72.4 51.6 of which (in % of total milk PSE) Market price support 91 78 83 89 95 100 88 74 67 64Payments based on output 4 - 16 - - - - 11 8 18Payments based on area planted/animal numbers - 12 - - 1 0 - - - 8Payments based on input use 3 10 0 8 3 0 11 14 4 10Payments based on overall farming income 2 - - - - - - - 21 0Miscellaneous payments - - - 3 1 - 0 1 - -
Source: OECD (2000)
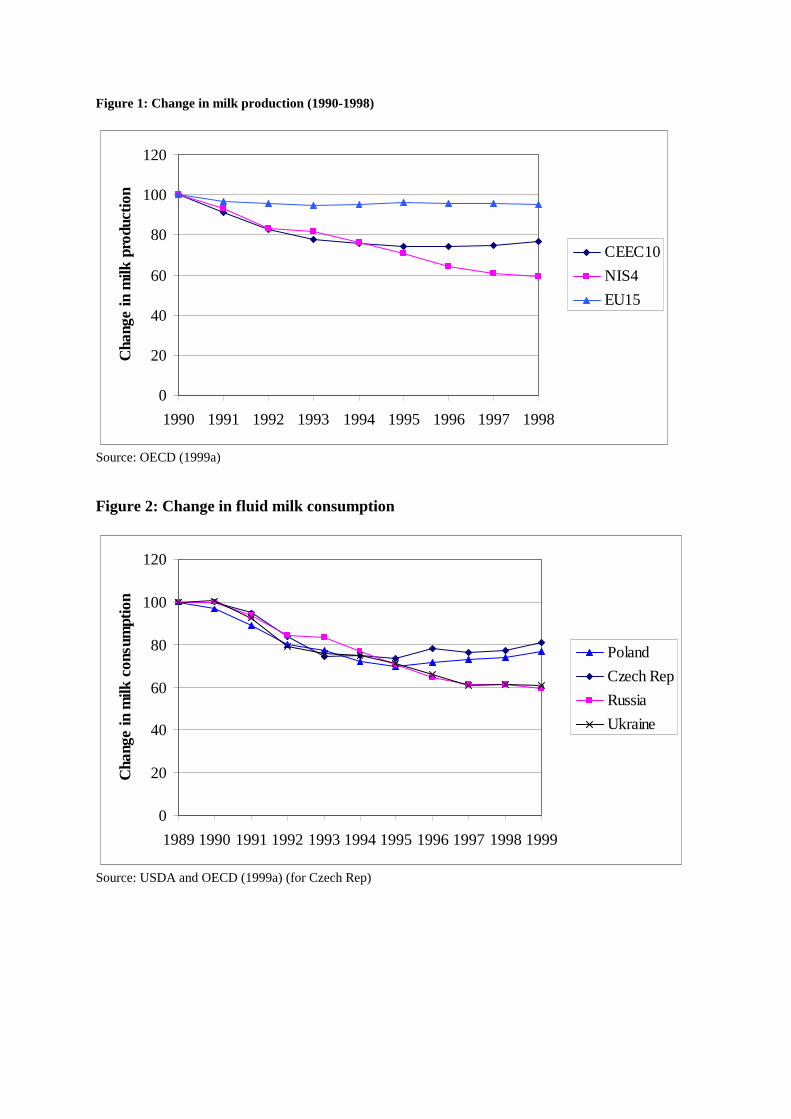
Figure 1: Change in milk production (1990-1998)
0
20
40
60
80
100
120
1990 1991 1992 1993 1994 1995 1996 1997 1998
Cha
nge
in m
ilk p
rodu
ctio
n
CEEC10NIS4EU15
Source: OECD (1999a) Figure 2: Change in fluid milk consumption
0
20
40
60
80
100
120
1989 1990 1991 1992 1993 1994 1995 1996 1997 1998 1999
Cha
nge
in m
ilk c
onsu
mpt
ion
PolandCzech RepRussiaUkraine
Source: USDA and OECD (1999a) (for Czech Rep)
28
Figure 3: Changes in GDP since 1989
-70
-60
-50
-40
-30
-20
-10
0
10
20
30
1989 1990 1991 1992 1993 1994 1995 1996 1997 1998
Chan
ge in
GD
P
BulgariaRomaniaSlovak RepSloveniaCzech RepHungaryPolandRussiaUkraine
Source: OECD (1999a) Figure 4: Cattle inventories
0
20
40
60
80
100
120
1990 1991 1992 1993 1994 1995 1996 1997 1998
Cat
tle s
tock
(mio
hea
ds)
CEEC10NIS4EU15
Source: OECD (1999a)
29
Figure 5: Change in cattle stock
0
20
40
60
80
100
120
1990 1991 1992 1993 1994 1995 1996 1997 1998
Cha
nge
in c
attle
sto
ck
BulgariaHungaryPolandRussia
Source: OECD (1999a) Figure 6: Milk yields *
0
1000
2000
3000
4000
5000
6000
1989 1990 1991 1992 1993 1994 1995 1996 1997 1998
Milk
yie
ld (k
g/co
w)
EU15CEEC8NIS3
Source: European Commission (1998), USDA (1999) and ZMP (2000) * CEEC8 = Bulgaria, Czech Rep, Estonia, Hungary, Latvia, Poland, Romania and Slovakia
30
Figure 7: Milk yield
0
1000
2000
3000
4000
5000
6000
1989 1990 1991 1992 1993 1994 1995 1996 1997 1998
Milk
yie
ld (k
g/co
w) BulgariaCzech RepHungaryPolandRussiaEU15
Source: European Commission (1998), USDA (1999) and ZMP (2000) Figure 8: Terms of trade for dairy farmers *
0
0.2
0.4
0.6
0.8
1
1.2
1989 1990 1991 1992 1993 1994 1995 1996 1997 1998
Milk
pric
e/ag
r IP
Czech RepPolandRomaniaRussia
Source: OECD (1999a) * Ratio of milk producer price over agricultural input price

31
Figure 9: Percentage PSE for milk
-150
-100
-50
0
50
100
1989 1990 1991 1992 1993 1994 1995 1996 1997 1998
% P
SE fo
r milk Estonia
LatviaRomaniaRussiaSlovakia
Source: OECD (1999a) Figure 10: Percentage PSE for milk
-31-20 -16
-3
8
3744
2
3323
13
4552
4657
50
34
534440
-40-30-20-10
010203040506070
Latvia
Russia
Estonia
Poland
Romani
a
Hungary
Czech R
ep
Slovaki
a EUUSA
% P
SE fo
r milk
1991-19931996-1998
Source: OECD (1999a and b)
32
Figure 11: Percentage PSE for milk and total in 1998
17 1519
23 25
13
26
45
2229 29
22
5753
4452
5761
21
14
0
10
20
30
40
50
60
70
Latvia
Russia
Estonia
Poland
Romani
a
Hungary
Czech R
ep
Slovak
ia EUUSA
PSE totalPSE milk
Source: OECD (1999a and b) Figure 12: The Development of CEEC-EU Price Gap for Milk
-90
-80
-70
-60
-50
-40
-30
-20
-10
0
10
1990 1991 1992 1993 1994 1995 1996 1997 1998 19992000(e)
% p
rice
gap
Czech RepublicEstoniaHungaryPolandSloveniaEUWorld
Source: Münch and Berkowitz (2000)

33
Figure 13: Final tariff bindings of selected CEECs relative to tariff bindings in the EU (EU bindings = 100)
0
100
200
300
SMP Butter Cheese
EU
Tar
iff B
indi
ng =
100
Czech Rep
Hungary
Poland
Slovak Rep
Source: Tangermann (2000)