Dairy intake, blood pressure and incident hypertension in a general British population: the 1946...
6
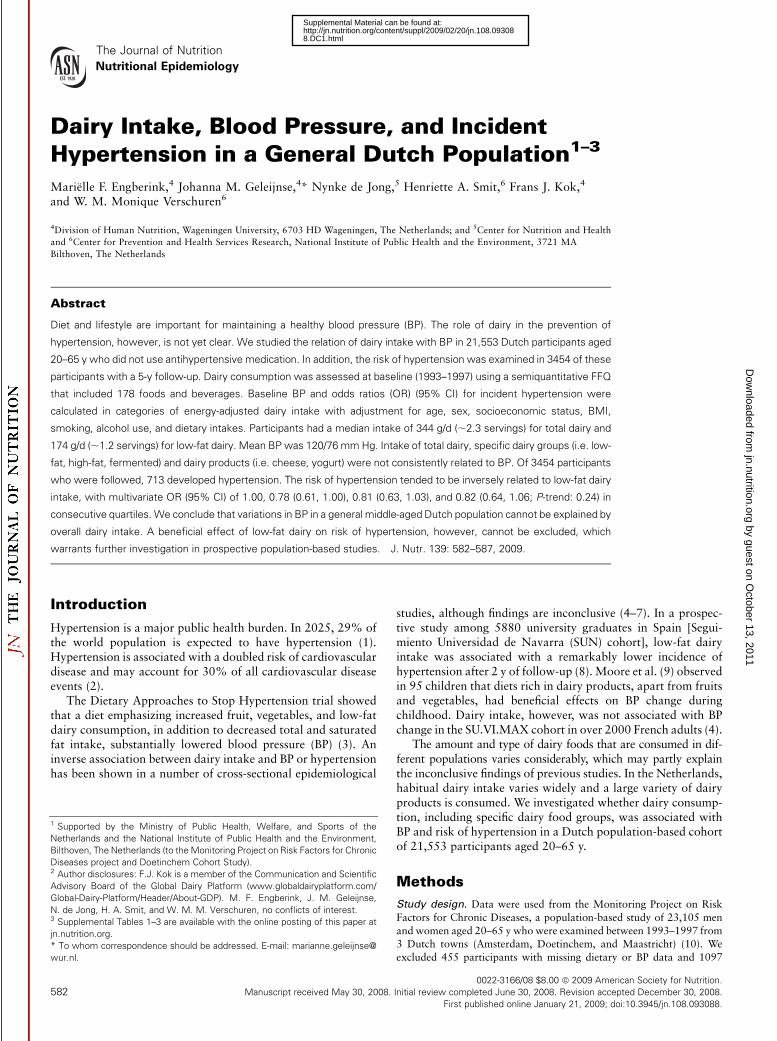
The Journal of Nutrition Nutritional Epidemiology Dairy Intake, Blood Pressure, and Incident Hypertension in a General Dutch Population 1–3 Marie ¨lle F. Engberink, 4 Johanna M. Geleijnse, 4 * Nynke de Jong, 5 Henriette A. Smit, 6 Frans J. Kok, 4 and W. M. Monique Verschuren 6 4 Division of Human Nutrition, Wageningen University, 6703 HD Wageningen, The Netherlands; and 5 Center for Nutrition and Health and 6 Center for Prevention and Health Services Research, National Institute of Public Health and the Environment, 3721 MA Bilthoven, The Netherlands Abstract Diet and lifestyle are important for maintaining a healthy blood pressure (BP). The role of dairy in the prevention of hypertension, however, is not yet clear. We studied the relation of dairy intake with BP in 21,553 Dutch participants aged 20–65 y who did not use antihypertensive medication. In addition, the risk of hypertension was examined in 3454 of these participants with a 5-y follow-up. Dairy consumption was assessed at baseline (1993–1997) using a semiquantitative FFQ that included 178 foods and beverages. Baseline BP and odds ratios (OR) (95% CI) for incident hypertension were calculated in categories of energy-adjusted dairy intake with adjustment for age, sex, socioeconomic status, BMI, smoking, alcohol use, and dietary intakes. Participants had a median intake of 344 g/d (;2.3 servings) for total dairy and 174 g/d (;1.2 servings) for low-fat dairy. Mean BP was 120/76 mm Hg. Intake of total dairy, specific dairy groups (i.e. low- fat, high-fat, fermented) and dairy products (i.e. cheese, yogurt) were not consistently related to BP. Of 3454 participants who were followed, 713 developed hypertension. The risk of hypertension tended to be inversely related to low-fat dairy intake, with multivariate OR (95% CI) of 1.00, 0.78 (0.61, 1.00), 0.81 (0.63, 1.03), and 0.82 (0.64, 1.06; P-trend: 0.24) in consecutive quartiles. We conclude that variations in BP in a general middle-aged Dutch population cannot be explained by overall dairy intake. A beneficial effect of low-fat dairy on risk of hypertension, however, cannot be excluded, which warrants further investigation in prospective population-based studies. J. Nutr. 139: 582–587, 2009. Introduction Hypertension is a major public health burden. In 2025, 29% of the world population is expected to have hypertension (1). Hypertension is associated with a doubled risk of cardiovascular disease and may account for 30% of all cardiovascular disease events (2). The Dietary Approaches to Stop Hypertension trial showed that a diet emphasizing increased fruit, vegetables, and low-fat dairy consumption, in addition to decreased total and saturated fat intake, substantially lowered blood pressure (BP) (3). An inverse association between dairy intake and BP or hypertension has been shown in a number of cross-sectional epidemiological studies, although findings are inconclusive (4–7). In a prospec- tive study among 5880 university graduates in Spain [Segui- miento Universidad de Navarra (SUN) cohort], low-fat dairy intake was associated with a remarkably lower incidence of hypertension after 2 y of follow-up (8). Moore et al. (9) observed in 95 children that diets rich in dairy products, apart from fruits and vegetables, had beneficial effects on BP change during childhood. Dairy intake, however, was not associated with BP change in the SU.VI.MAX cohort in over 2000 French adults (4). The amount and type of dairy foods that are consumed in dif- ferent populations varies considerably, which may partly explain the inconclusive findings of previous studies. In the Netherlands, habitual dairy intake varies widely and a large variety of dairy products is consumed. We investigated whether dairy consump- tion, including specific dairy food groups, was associated with BP and risk of hypertension in a Dutch population-based cohort of 21,553 participants aged 20–65 y. Methods Study design. Data were used from the Monitoring Project on Risk Factors for Chronic Diseases, a population-based study of 23,105 men and women aged 20–65 y who were examined between 1993–1997 from 3 Dutch towns (Amsterdam, Doetinchem, and Maastricht) (10). We excluded 455 participants with missing dietary or BP data and 1097 1 Supported by the Ministry of Public Health, Welfare, and Sports of the Netherlands and the National Institute of Public Health and the Environment, Bilthoven, The Netherlands (to the Monitoring Project on Risk Factors for Chronic Diseases project and Doetinchem Cohort Study). 2 Author disclosures: F.J. Kok is a member of the Communication and Scientific Advisory Board of the Global Dairy Platform (www.globaldairyplatform.com/ Global-Dairy-Platform/Header/About-GDP). M. F. Engberink, J. M. Geleijnse, N. de Jong, H. A. Smit, and W. M. M. Verschuren, no conflicts of interest. 3 Supplemental Tables 1–3 are available with the online posting of this paper at jn.nutrition.org. * To whom correspondence should be addressed. E-mail: marianne.geleijnse@ wur.nl. 0022-3166/08 $8.00 ª 2009 American Society for Nutrition. 582 Manuscript received May 30, 2008. Initial review completed June 30, 2008. Revision accepted December 30, 2008. First published online January 21, 2009; doi:10.3945/jn.108.093088. by guest on October 13, 2011 jn.nutrition.org Downloaded from 8.DC1.html http://jn.nutrition.org/content/suppl/2009/02/20/jn.108.09308 Supplemental Material can be found at:
Transcript of Dairy intake, blood pressure and incident hypertension in a general British population: the 1946...
The Journal of Nutrition
Nutritional Epidemiology
Dairy Intake, Blood Pressure, and IncidentHypertension in a General Dutch Population1–3
Marielle F. Engberink,4 Johanna M. Geleijnse,4* Nynke de Jong,5 Henriette A. Smit,6 Frans J. Kok,4
and W. M. Monique Verschuren6
4Division of Human Nutrition, Wageningen University, 6703 HD Wageningen, The Netherlands; and 5Center for Nutrition and Health
and 6Center for Prevention and Health Services Research, National Institute of Public Health and the Environment, 3721 MA
Bilthoven, The Netherlands
Abstract
Diet and lifestyle are important for maintaining a healthy blood pressure (BP). The role of dairy in the prevention of
hypertension, however, is not yet clear. We studied the relation of dairy intake with BP in 21,553 Dutch participants aged
20–65 y who did not use antihypertensive medication. In addition, the risk of hypertension was examined in 3454 of these
participants with a 5-y follow-up. Dairy consumption was assessed at baseline (1993–1997) using a semiquantitative FFQ
that included 178 foods and beverages. Baseline BP and odds ratios (OR) (95% CI) for incident hypertension were
calculated in categories of energy-adjusted dairy intake with adjustment for age, sex, socioeconomic status, BMI,
smoking, alcohol use, and dietary intakes. Participants had a median intake of 344 g/d (;2.3 servings) for total dairy and
174 g/d (;1.2 servings) for low-fat dairy. Mean BP was 120/76 mm Hg. Intake of total dairy, specific dairy groups (i.e. low-
fat, high-fat, fermented) and dairy products (i.e. cheese, yogurt) were not consistently related to BP. Of 3454 participants
who were followed, 713 developed hypertension. The risk of hypertension tended to be inversely related to low-fat dairy
intake, with multivariate OR (95% CI) of 1.00, 0.78 (0.61, 1.00), 0.81 (0.63, 1.03), and 0.82 (0.64, 1.06; P-trend: 0.24) in
consecutive quartiles. We conclude that variations in BP in a general middle-aged Dutch population cannot be explained by
overall dairy intake. A beneficial effect of low-fat dairy on risk of hypertension, however, cannot be excluded, which
warrants further investigation in prospective population-based studies. J. Nutr. 139: 582–587, 2009.
Introduction
Hypertension is a major public health burden. In 2025, 29% ofthe world population is expected to have hypertension (1).Hypertension is associated with a doubled risk of cardiovasculardisease and may account for 30% of all cardiovascular diseaseevents (2).
The Dietary Approaches to Stop Hypertension trial showedthat a diet emphasizing increased fruit, vegetables, and low-fatdairy consumption, in addition to decreased total and saturatedfat intake, substantially lowered blood pressure (BP) (3). Aninverse association between dairy intake and BP or hypertensionhas been shown in a number of cross-sectional epidemiological
studies, although findings are inconclusive (4–7). In a prospec-tive study among 5880 university graduates in Spain [Segui-miento Universidad de Navarra (SUN) cohort], low-fat dairyintake was associated with a remarkably lower incidence ofhypertension after 2 y of follow-up (8). Moore et al. (9) observedin 95 children that diets rich in dairy products, apart from fruitsand vegetables, had beneficial effects on BP change duringchildhood. Dairy intake, however, was not associated with BPchange in the SU.VI.MAX cohort in over 2000 French adults (4).
The amount and type of dairy foods that are consumed in dif-ferent populations varies considerably, which may partly explainthe inconclusive findings of previous studies. In the Netherlands,habitual dairy intake varies widely and a large variety of dairyproducts is consumed. We investigated whether dairy consump-tion, including specific dairy food groups, was associated withBP and risk of hypertension in a Dutch population-based cohortof 21,553 participants aged 20–65 y.
Methods
Study design. Data were used from the Monitoring Project on Risk
Factors for Chronic Diseases, a population-based study of 23,105 men
and women aged 20–65 y who were examined between 1993–1997 from3 Dutch towns (Amsterdam, Doetinchem, and Maastricht) (10). We
excluded 455 participants with missing dietary or BP data and 1097
1 Supported by the Ministry of Public Health, Welfare, and Sports of the
Netherlands and the National Institute of Public Health and the Environment,
Bilthoven, The Netherlands (to the Monitoring Project on Risk Factors for Chronic
Diseases project and Doetinchem Cohort Study).2 Author disclosures: F.J. Kok is a member of the Communication and Scientific
Advisory Board of the Global Dairy Platform (www.globaldairyplatform.com/
Global-Dairy-Platform/Header/About-GDP). M. F. Engberink, J. M. Geleijnse,
N. de Jong, H. A. Smit, and W. M. M. Verschuren, no conflicts of interest.3 Supplemental Tables 1–3 are available with the online posting of this paper at
jn.nutrition.org.
* To whom correspondence should be addressed. E-mail: marianne.geleijnse@
wur.nl.
0022-3166/08 $8.00 ª 2009 American Society for Nutrition.
582 Manuscript received May 30, 2008. Initial review completed June 30, 2008. Revision accepted December 30, 2008.
First published online January 21, 2009; doi:10.3945/jn.108.093088.
by guest on October 13, 2011
jn.nutrition.orgD
ownloaded from
8.DC1.html http://jn.nutrition.org/content/suppl/2009/02/20/jn.108.09308Supplemental Material can be found at:

participants who used antihypertensive medication, leaving 21,553 menand women for the analysis of dairy intake and BP.
Participants from Doetinchem (n ¼ 6579) were invited for follow-up
examination (including BP) in 1998–2002and 75% (n¼4917) responded
(11). Participants with hypertension at baseline (n ¼ 1384) or no
information on hypertension during follow-up (n ¼ 79) were excluded,
leaving 3454 participants for the analysis of dairy and incident hyperten-
sion. The study was approved by the Medical Ethics Committee of the
Organization for Applied Scientific Research-Zeist, the Netherlands.
Dietary variables and exposure categories. Dietary intake was
assessed using a validated, semiquantitative FFQ that inquired about
intake of 178 foods and beverages during the past year (12). Total energy
and nutrient intakes were calculated using a computerized Dutch Food
Composition Table (13). The reproducibility for milk and milk products
after 6 and 12 mo was 0.85 and 0.73 for men and 0.75 and 0.78 for
women, and the reproducibility for cheese was 0.77 and 0.71 for men
and 0.67 and 0.70 for women, respectively. The validity of the FFQ was
assessed against 12 monthly 24-h recalls over a 1-y period. Spearman
correlations were good for milk and milk products (r¼ 0.69 for men, r¼
0.77 for women) and moderate for cheese (r ¼ 0.56 and r ¼ 0.32,
respectively).
Total dairy included all dairy foods except butter and ice cream. Milk
and milk products included all kinds of milk, yogurt, coffee creamers,
curd, pudding, porridge, custard, and whipping cream. Cheese included
all types of cheese, as well as cheese spreads and cheese that was
consumed during dinner or as a snack. Low-fat dairy was defined as milk
and milk products with a fat concentration ,2.0 g/100 g or cheese with a
fat concentration ,20 g/100 g. High-fat dairy was defined as milk and
milk products with a fat concentration .3.5 g/100 g or cheese products
with a fat concentration . 20 g/100 g. Fermented dairy comprised
buttermilk, yogurts, and cheese.
Outcome measurements. BP was measured with a random zero
sphygmomanometer in sitting position by trained technicians. Systolic
BP was recorded at the appearance of sounds (first-phase Korotkoff) and
diastolic BP at the disappearance of sounds (5th-phase Korotkoff),
followed by a heart rate count for 30 s. BP measurement was repeated
and values were averaged. During the physical examination, regular
audits were performed to check adherence to the BP measuring protocol
TABLE 1 Characteristics of 21,553 Dutch adults by quintiles of energy-adjusted total dairy intake1
Quintiles of energy-adjusted total dairy Intake
1 2 3 4 5
n 4310 4311 4311 4311 4310
Median intake, g/d 110 245 363 512 765
Sex, % male 65 43 39 39 40
Age, y 42.3 6 10.6 42.3 6 10.8 42.3 6 11.2 42.5 6 11.4 41.5 6 11.7
Systolic BP, mm Hg 121.7 6 15.5 118.5 6 15.6 119.4 6 15.8 120.0 6 16.1 119.8 6 15.6
Diastolic BP, mm Hg 77.7 6 10.3 76.0 6 10.5 75.8 6 10.3 75.6 6 10.6 75.5 6 10.3
Hypertension2, % 16.7 14.8 13.8 14.9 14.2
BMI, kg/m2 25.1 6 4.0 24.9 6 3.9 24.8 6 3.8 24.9 6 3.8 25.0 6 3.9
Overweight (BMI $25 kg/m2), % 46.1 43.6 41.8 43.7 44.2
Self-reported history of MI, % 1.1 0.7 0.8 0.9 0.8
Self-reported diabetes, % 0.7 0.7 0.9 1.5 1.5
High socioeconomic status, % 20 23 26 25 26
Physical activity by intensity3, h/wk
Low (MET ,4) 26.6 6 19.0 27.6 6 19.1 27.1 6 18.8 27.9 6 18.8 28.3 6 18.5
Medium/high (MET $4) 9.6 6 14.1 7.8 6 10.8 8.4 6 10.7 8.6 6 10.7 9.1 6 11.2
Current alcohol consumer, % 88 85 86 85 84
Current smoker, % 44 38 36 33 32
Dietary intake
Total energy, MJ/d 10.8 6 3.1 8.8 6 2.8 8.8 6 2.6 9.1 6 2.6 10.0 6 3.1
Total dairy, g/d 140 6 94 217 6 110 337 6 108 498 6 115 860 6 312
Milk and milk products 106.1 6 86.8 183.0 6 104.4 301.7 6 102.5 462.9 6 109.7 822.1 6 307.6
Cheese 34.0 6 32.0 34.4 6 29.2 34.9 6 28.1 35.5 6 27.9 37.5 6 31.0
Low-fat dairy 38.9 6 46.0 86.3 6 70.5 163.3 6 83.6 277.6 6 105.9 535.6 6 259.9
Fermented dairy 63.7 6 50.7 92.8 6 67.9 133.8 6 94.5 181.8 6 133.6 294.8 6 264.5
Fruit, g/d 135 6 137 141 6 122 152 6 120 163 6 117 173 6 130
Vegetables, g/d 123 6 54 118 6 50 122 6 52 123 6 50 127 6 53
Fish, g/d 8.3 6 9.8 8.8 6 10.0 8.5 6 8.7 8.9 6 10.4 9.3 6 10.4
Meat, g/d 156.2 6 72.1 116.5 6 57.7 108.7 6 56.1 108.4 6 53.4 106.8 6 58.6
Bread, g/d 189.2 6 89.0 149.3 6 72.1 146.4 6 68.2 146.7 6 66.7 148.0 6 74.9
Coffee, mL/d 510.4 6 390.1 448.0 6 342.4 430.3 6 317.3 422.8 6 303.7 407.8 6 317.7
Tea, mL/d 181.3 6 241.1 194.2 6 230.7 196.5 6 225.4 199.3 6 214.9 200.2 6 220.0
Total fat, g/d 106.1 6 36.4 85.8 6 31.1 84.3 6 30.0 86.0 6 29.2 90.9 6 33.0
Saturated fat, g/d 41.8 6 15.6 34.6 6 13.3 34.7 6 12.6 36.0 6 12.7 39.5 6 14.9
Total protein, g/d 86.5 6 24.5 74.7 6 23.1 77.1 6 21.8 83.1 6 21.7 97.0 6 27.8
Total calcium, mg/d 788 6 320 837 6 313 982 6 300 1181 6 306 1637 6 501
1 Values are means 6 SD or %.2 Hypertension is defined as systolic BP $ 140 mm Hg or diastolic BP $ 90 mm Hg (participants using antihypertensive medication were excluded).3 Data on physical activity were available in 16,642 participants; n ¼ 3283 for the first quintile, n ¼ 3303 for the 2nd quintile; n ¼ 3349 for the 3rd quintile; n ¼ 3319 for the 4th
quintile, and n ¼ 3388 for the 5th quintile.
Dairy intake and blood pressure 583
by guest on October 13, 2011
jn.nutrition.orgD
ownloaded from

(e.g. resting time, adequate cuff size). BP data were checked for outliers
and errors before data analysis. Hypertension was defined as systolic BP
$140 mm Hg or diastolic BP $90 mm Hg or use of antihypertensive
medication.
Collection of risk factor data. Height was measured to the nearest
0.5 cm and weight to the nearest 0.1 kg with participants wearing light
indoor clothing without shoes. BMI was calculated as weight (kg)
divided by height squared (m2) and overweight was defined as BMI $
25 kg/m2. Participants completed a mailed questionnaire on lifestyle
factors, history of major diseases, medication use, and any prescribed
diets. Questions about physical activity were added in 1994 and com-
pleted by 16,642 participants (77% of cohort). These questionnaire data
were used to create variables on alcohol intake (6 categories), smoking
status (current cigarette smoking, yes/no), physical activity (h/wk), and
socioeconomic status (5 categories).
Statistical analysis. Data analysis was performed using SAS version 9.1
(SAS Institute). Intakes of total dairy, dairy groups, and dairy products
were first adjusted for total energy intake according to the residual
method (14). Participant characteristics in quintiles of energy-adjusted
total dairy consumption are presented as means with SD or percentages.
Mean BP with 95% CI were obtained in energy-adjusted dairy quintiles
using a general linear model, with adjustment for age, sex, total energy
intake (continuous), BMI (continuous), current cigarette smoking (yes/
no), socioeconomic status (5 categories), alcohol consumption (0, 0–1,
1–2, 2–4, 4–8, . 8 glasses/d), and intake of fruit, vegetables, fish, meat,
bread, coffee, and tea, all as continuous variables. Additional adjustment
for physical activity could only be performed in a subgroup of 16,642
participants for whom these data were available.A number of additional predefined subgroup analyses were performed,
i.e. by sex, age (,50 vs. $50 y), BMI (,25 vs. $25 kg/m2), and base-
line BP (,140/90 vs. $140/90 mm Hg). Most of our participantsappeared to be regular dairy consumers and habitual intake in our cohort
was relatively high. Because the impact of dairy on BP may be more
pronounced in populations with a low habitual intake of dairy, we
decided to conduct a post hoc analysis in which we further explored theassociation of total and low-fat dairy with BP at low intakes. Within the
bottom quintile (4310 participants), a fully adjusted linear regression
coefficient for BP was obtained per 50-g increase in dairy intake. The
results of the low-dairy group were then compared with the total studypopulation.
Prospective analysis on incidence of hypertension was based on a
smaller sample size (n ¼ 3454) and energy-adjusted dairy intake was
therefore divided into quartiles. Logistic regression models were used to
obtain odds ratios (OR) with 95% CI for incident hypertension in
categories of dairy intake, with adjustment for age and sex (model 1).Analyses were repeated using an extended multivariate model (model 2)
that included age, sex, total energy intake (continuous), BMI (continu-
ous), current cigarette smoking (yes/no), socioeconomic status (5 cate-
gories), and alcohol consumption (0, 0–1, 1–2, 2–4, 4–8, .8 glasses/d).Further adjustment was made for intake of fruit, vegetables, fish, meat,
bread, coffee, and tea, all as continuous variables (model 3).
To obtain a P-value for trend across categories of dairy intake,median values of categories were assigned to individuals and entered
continuously into the multivariate models. Two-sided P-values , 0.05
were considered significant.
Results
Population characteristics. Participant characteristics accord-ing to energy-adjusted dairy intake are shown (Table 1). MeanBP was 120.1 6 15.7 mm Hg systolic and 76.1 6 10.4 mm Hgdiastolic and 15% of the population had elevated BP (i.e. $140/90 mm Hg). Dairy intake was associated with fruit intake(positively), coffee intake (inversely), and nonsmoking. In thelowest dairy category, which included more men, intakes of totalenergy, meat, bread, and total and saturated fat were higher thanin other categories.
Dairy consumption. The median energy-adjusted total dairyintake of the study population was 344 g/d, ranging from 110 g/d(i.e. ,1 serving/d) in the lowest quintile to 765 g/d (i.e. .5servings/d) in the highest quintile. Dairy food items that contrib-uted to total dairy intake are presented (Supplemental Table 1).The Spearman correlation coefficient was 0.91 (P , 0.0001) forthe relation between total dairy and low-fat dairy and 0.41 (P ,
0.0001) for the relation between low-fat and high-fat dairy.
Dairy intake and BP. BP showed little variation across quintilesof total dairy, low-fat dairy, and high-fat dairy (Table 2). Forother dairy groups and products, BP was also similar acrossquintiles of intake (Supplemental Table 2). Excluding dessertsfrom the milk products category did not change the findings.Moreover, additional adjustment for complementary dairy foodgroups (e.g. low-fat dairy as a covariate when studying high-fat
TABLE 2 BP in 21,553 Dutch adults by type of dairy intake1
Quintiles of energy-adjusted dairy intake
1 2 3 4 5 P-trend
n 4310 4311 4311 4311 4310
Total dairy
Median intake, g/d 110 245 363 512 765
SBP,2 mm Hg 119.7 (119.3, 120.2) 119.6 (119.2, 120.0) 120.0 (119.6, 120.4) 120.5 (120.1, 120.9) 120.6 (120.2, 121.0) ,0.0001
DBP,3 mm Hg 76.7 (76.4, 76.9) 76.1 (75.8, 76.4) 76.1 (75.9, 76.4) 76.0 (75.7, 76.2) 75.9 (75.6, 76.1) ,0.0001
High-fat dairy
Median intake, g/d 27 63 88 116 188
SBP, mm Hg 119.8 (119.4, 120.3) 120.1 (119.7, 120.5) 120.3 (119.9, 120.8) 120.1 (119.7, 120.5) 120.0 (119.6, 120.4) 0.82
DBP, mm Hg 76.4 (76.1, 76.7) 76.3 (76.0, 76.6) 76.4 (76.1, 76.7) 75.9 (75.6, 76.2) 75.6 (75.4, 75.9) ,0.0001
Low-fat dairy
Median intake, g/d 21 89 174 294 507
SBP, mm Hg 119.6 (119.2, 120.1) 119.8 (119.4, 120.3) 119.9 (119.5, 120.3) 120.4 (120.0, 120.8) 120.6 (120.2, 121.0) ,0.001
DBP, mm Hg 76.5 (76.2, 76.8) 76.2 (76.0, 76.5) 76.2 (75.9, 76.5) 75.8 (75.5, 76.1) 76.0 (75.7, 76.3) ,0.01
1 Values are mean BP and 95% CI, adjusted for age (y), sex, total energy intake (MJ/d), socioeconomic status (5 categories), BMI (kg/m2), smoking (yes/no), and daily intake of
alcohol (6 categories), fruit (g), vegetables (g), fish (g), meat (g), bread (g), coffee (mL) and tea (mL).2 SBP, Systolic BP.3 DBP, Diastolic BP.
584 Engberink et al.
by guest on October 13, 2011
jn.nutrition.orgD
ownloaded from

dairy) or saturated fat did not materially change the results. Theresults did also not change when we reanalyzed the data afterexclusion of participants with self-reported myocardial infarc-tion or diabetes and additional adjustment for prescribed diet.Furthermore, additional inclusion of physical activity in themodel, using data of a subgroup of 16,642 participants in whomthis was assessed, did not change the results (data not shown).
Subgroup analyses showed that the association between low-fat dairy and BP did not vary among strata of age, sex, BMI, orBP (data not shown). When we examined the relation betweenlow-fat dairy and BP continuously in the total cohort, the fullyadjusted b (95% CI) per 50-g increase was 0.05 mm Hg (0.02,0.09) for systolic BP and 20.04 mm Hg (20.06, 20.02) fordiastolic BP. In the subgroup (n ¼ 4310) with a low habitualintake of dairy, these b were 0.19 mm Hg (20.13, 0.50) and20.09 mm Hg (20.30, 0.12) per 50 g, respectively.
Dairy intake and incidence of hypertension. The subcohortthat participated in the follow-up round was 49.5 6 9.6 y andcomprised 45% men. BP in these participants increased by 5.7 6
12.7 mm Hg systolic and 3.1 6 9.6 mm Hg diastolic during amedian follow-up period of 5 y and 713 (20.6%) new cases ofhypertension were identified.
After adjustment for potential confounders, total dairy, low-fat dairy, and high-fat dairy were not significantly associatedwith risk of hypertension (P-trend 0.60, 0.24, and 0.11, respec-tively) (Table 3). Also, other dairy groups and dairy products
were not clearly related to risk of hypertension (SupplementalTable 3).
After including physical activity in the multivariate model(n ¼ 2768), OR (95% CI) in the consecutive quartiles of low-fatdairy were 1.00, 0.83 (0.63, 1.10), 0.81 (0.61, 1.07), and 0.85(0.64, 1.13), respectively (P-trend ¼ 0.36). The associationbetween low-fat dairy and hypertension risk did not vary by sex(Table 3) or age (data not shown). After stratification by BMI(,25 vs. $25 kg/m2), OR in the 2nd to the 4th quartiles of low-fat dairy intake were 0.95 (0.68, 1.32), 0.97 (0.70, 1.36), and0.86 (0.61, 1.21; P-trend ¼ 0.42) for participants who wereoverweight and 0.60 (0.42, 0.87), 0.63 (0.43, 0.91), and 0.76(0.52, 1.11; P-trend ¼ 0.34), respectively, for participants whowere not overweight.
Discussion
In this cohort of 21,553 Dutch adults, overall dairy intake orintake of specific dairy groups or dairy products was not clearlyrelated to BP. Prospective analysis in 3454 participants showed noconsistent association of dairy intake with 5-y risk of hypertension,with a possible exception for low-fat dairy that was nonsignif-icantly related to a lower risk of hypertension (P-trend ¼ 0.24).
This study has several strengths and limitations. Our Dutchstudy is based in a country with naturally high intake of dairy. Itcomprise regular consumers of a variety of dairy products,enabling us to examine a broad range of several types of dairy
TABLE 3 Association of dairy intake with incident hypertension in 3454 Dutch adults1
Quartiles of energy-adjusted dairy intake
1 2 3 4 P- trend
n 863 864 864 863
Total dairy
Median intake, g/d 206 359 510 757
Incident cases, n 185 189 162 177
OR, model 12 1.00 1.01 (0.80, 1.27) 0.85 (0.67, 1.08) 0.98 (0.77, 1.24) 0.66
OR, model 23 1.00 1.06 (0.83, 1.35) 0.93 (0.72, 1.20) 1.07 (0.83, 1.37) 0.77
OR, model 34 1.00 1.08 (0.84, 1.38) 0.95 (0.73, 1.22) 1.11 (0.85, 1.44) 0.60
Men (n ¼ 1549), OR model 3 1.00 1.01 (0.73, 1.41) 0.78 (0.54, 1.12) 1.12 (0.78, 1.62) 0.81
Women (n ¼ 1905), OR model 3 1.00 1.15 (0.78, 1.69) 1.11 (0.76, 1.62) 1.12 (0.76, 1.66) 0.70
Low-fat dairy
Median intake, g/d 59 167 296 500
Incident cases, n 207 167 171 168
OR, model 1 1.00 0.77 (0.61, 0.98) 0.79 (0.62, 0.99) 0.80 (0.63, 1.01) 0.13
OR, model 2 1.00 0.78 (0.61, 0.99) 0.80 (0.63, 1.02) 0.81 (0.64, 1.04) 0.20
OR, model 3 1.00 0.78 (0.61, 1.00) 0.81 (0.63, 1.03) 0.82 (0.64, 1.06) 0.24
Men (n ¼ 1549), OR model 3 1.00 0.75 (0.54, 1.04) 0.73 (0.52, 1.05) 0.86 (0.60, 1.23) 0.43
Women (n ¼ 1905), OR model 3 1.00 0.81 (0.56, 1.18) 0.88 (0.61, 1.25) 0.82 (0.57, 1.18) 0.43
High-fat dairy
Median intake, g/d 43 77 106 166
Incident cases, n 178 176 172 187
OR, model 1 1.00 0.94 (0.74, 1.20) 0.92 (0.72, 1.17) 1.05 (0.83, 1.34) 0.58
OR, model 2 1.00 0.91 (0.70, 1.17) 0.91 (0.70, 1.17) 1.13 (0.88, 1.45) 0.20
OR, model 3 1.00 0.93 (0.72, 1.19) 0.93 (0.72, 1.21) 1.19 (0.92, 1.54) 0.11
Men (n ¼ 1549), OR model 3 1.00 0.90 (0.64, 1.26) 0.96 (0.67, 1.39) 1.45 (1.03, 2.06) 0.03
Women (n ¼ 1905), OR model 3 1.00 0.87 (0.59, 1.28) 0.79 (0.54, 1.18) 1.05 (1.03, 1.06) 0.74
1 Values are OR with 95% CI.2 Adjusted for age and sex.3 Adjusted for age, sex, total energy intake (MJ/d), socioeconomic status (5 categories), BMI (kg/m2), smoking (yes/no), and alcohol intake (6 categories).4 Adjusted for age, sex, total energy intake (MJ/d), socioeconomic status (5 categories), BMI (kg/m2), smoking (yes/no), alcohol intake (6 categories), and daily intake of fruit (g),
vegetables (g), fish (g), meat (g), bread (g), coffee (mL), and tea (mL).
Dairy intake and blood pressure 585
by guest on October 13, 2011
jn.nutrition.orgD
ownloaded from

products in relation to BP. Total dairy intake ranged from ,1 to.5 servings/d. The large sample size allowed more detailedexamination of BP in participants who consumed a low amountof dairy (i.e. ,185 g/d), but associations with BP were not foundwithin this low range of intake.
A major concern in epidemiological studies is residual con-founding. Data on physical activity, an important BP determi-nant, were available for only 77% of our participants. Repeatingmultivariate analysis with additional adjustment for physicalactivity in this subgroup did not influence the BP associationsand we think it is unlikely that incomplete physical activity datahave affected our findings. Dairy intake was assessed by self-report, which may have led to misclassification. Assessmentof dairy intake in our study was validated against 12 monthlyrepeated 24-h recalls. Milk and milk products were highly cor-related (r ¼ 0.7–0.8), indicating that participants could ade-quately be ranked according to milk intake (12). The validity forcheese, however, was much lower (r¼ 0.4–0.5), which may havediluted the cheese-BP associations. It cannot, however, explainour overall null result, because cheese contributed only 8.6% tototal dairy intake.
Scientific evidence for an effect of dairy on BP or hyperten-sion is inconsistent. Our data are in line with findings from theFrench SU.VI.MAX study among 4652 participants aged 35–63 y,in which overall dairy was not associated with BP or change(4). Ruidavets et al. (6), however, reported that dairy products(range, 93–335 g/d) and dietary calcium were significantly andindependently associated with lower systolic BP (7 mm Hg fortotal dairy and 4 mm Hg for calcium) in 912 French men aged45–64 y. Also, Djousse et al. (5) found that dairy intake (range,0.4–3.1 servings/d) was associated with a 38% lower prevalenceof hypertension, independent of calcium, in the National Heart,Lung, and Blood Institute Family Heart Study. Dairy intake inour study was higher (344 g/d, ;2.5 servings), which mayexplain differences in results. It may be possible that the impactof dairy intake on BP is more pronounced in persons with a lowhabitual intake of dairy. However, repeating our analyses withinthe low end of the distribution of dairy intake (0–185 g/d)yielded similar conclusions. In a previous cross-sectional studyof 2064 Dutch men and women aged 50–75 y (7), intake ofdairy, in particular dairy desserts, milk, and yogurt was inverselyassociated with BP. Apart from the somewhat higher dairyintake (4 servings/d), participants in that study were older thanin our cohort, which may partly account for the discrepancy infindings. When reanalyzing our data in participants aged $50 y,however, we still did not find an association of dairy with BP.Snijder et al. (7) found an association of high-fat rather thanlow-fat dairy with BP, in contrast to our findings for incidenthypertension. Alonso et al. (8), on the other hand, showed thatlow-fat dairy (mean intake of 140 g/d), but not high-fat dairy,was associated with a remarkable 54% reduced risk of hyper-tension during 2 y of follow-up of 5880 Spanish universitygraduates. A potential beneficial effect of low-fat dairy isconsistent with the Dietary Approaches to Stop Hypertensiontrial in which BP reductions were more pronounced when low-fat dairy (among other dietary changes) was added to a fruits-and-vegetables diet (3). In the Coronary Artery Risk Develop-ment in Young Adults study, both reduced-fat and high-fat dairyproducts were associated with a 21% reduced odds of 10-yincidence of elevated BP in 923 young overweight adults, but notin 2234 normal-weight participants (15). Overall dairy intakewas not related to 15-y incidence of elevated BP in the CoronaryArtery Risk Development in Young Adults study, whereas milkand dairy desserts had an inverse association (16).
It is yet unclear which specific dairy foods or componentscould be responsible for a beneficial effect on BP. Dairy is animportant source of protein and minerals (e.g. calcium,potassium, magnesium), which may lower BP (17–21). Becausevitamin D is critical for calcium absorption and homeostasis(22), vitamin D may also play a role in the prevention ofhypertension (23). Wang et al. (24) showed that intakes of low-fat dairy products, calcium, and vitamin D were each inverselyassociated with risk of hypertension in 28,886 middle-aged andolder women. In the Netherlands, however, milk products havenot yet been fortified with vitamin D. It can be speculated thatlow-fat dairy may be more beneficial to BP than high-fat dairybecause of its reduced concentration of saturated and naturaltrans fat, which may mitigate the beneficial effects of other dairycomponents.
Our findings suggest that dairy intake has little effect onpopulation BP in a generally healthy population of young andmiddle-aged Dutch adults. We found some evidence for a bene-ficial effect of low-fat dairy on risk of hypertension, although notsignificant, which needs to be confirmed in other population-based cohort studies.
Literature Cited
1. Kearney PM, Whelton M, Reynolds K, Muntner P, Whelton PK, He J.Global burden of hypertension: analysis of worldwide data. Lancet. 2005;365:217–23.
2. Wilson PW, D’Agostino RB, Levy D, Belanger AM, Silbershatz H,Kannel WB. Prediction of coronary heart disease using risk factorcategories. Circulation. 1998;97:1837–47.
3. Appel LJ, Moore TJ, Obarzanek E, Vollmer WM, Svetkey LP, SacksFM, Bray GA, Vogt TM, Cutler JA, et al. A clinical trial of the effects ofdietary patterns on blood pressure. DASH Collaborative ResearchGroup. N Engl J Med. 1997;336:1117–24.
4. Dauchet L, Kesse-Guyot E, Czernichow S, Bertrais S, Estaquio C,Peneau S, Vergnaud AC, Chat-Yung S, Castetbon K, et al. Dietary pat-terns and blood pressure change over 5-y follow-up in the SU.VI.MAXcohort. Am J Clin Nutr. 2007;85:1650–6.
5. Djousse L, Pankow JS, Hunt SC, Heiss G, Province MA, KabagambeEK, Ellison RC. Influence of saturated fat and linolenic acid on theassociation between intake of dairy products and blood pressure.Hypertension. 2006;48:335–41.
6. Ruidavets JB, Bongard V, Simon C, Dallongeville J, Ducimetiere P,Arveiler D, Amouyel P, Bingham A, Ferrieres J. Independent contri-bution of dairy products and calcium intake to blood pressure variationsat a population level. J Hypertens. 2006;24:671–81.
7. Snijder MB, van der Heijden AA, van Dam RM, Stehouwer CD,Hiddink GJ, Nijpels G, Heine RJ, Bouter LM, Dekker JM. Is higherdairy consumption associated with lower body weight and fewer met-abolic disturbances? The Hoorn Study. Am J Clin Nutr. 2007;85:989–95.
8. Alonso A, Beunza JJ, Delgado-Rodriguez M, Martinez JA, Martinez-Gonzalez MA. Low-fat dairy consumption and reduced risk of hy-pertension: the Seguimiento Universidad de Navarra (SUN) cohort. AmJ Clin Nutr. 2005;82:972–9.
9. Moore LL, Singer MR, Bradlee ML, Djousse L, Proctor MH, CupplesLA, Ellison RC. Intake of fruits, vegetables, and dairy products in earlychildhood and subsequent blood pressure change. Epidemiology. 2005;16:4–11.
10. Blokstra ASH, Bueno de Mesquita HB, Seidell JC, Verschuren WMM.Monitoring of risk factors and health in The Netherlands (MORGEN-project), 1993–1997. Lifestyle and risk factors: prevalences and trends2005 [cited 2008 Mar 10]. Available from: www.rivm.nl/bibliotheek/rapporten/263200008.html.
11. Verschuren W, Blokstra A, Picavet H, Smit H. Cohort profile: theDoetinchem Cohort Study. Int J Epidemiol 2008;37:1236–41.
12. Ocke MC, Bueno-de-Mesquita HB, Goddijn HE, Jansen A, Pols MA,van Staveren WA, Kromhout D. The Dutch EPIC food frequencyquestionnaire. I. Description of the questionnaire, and relative validity
586 Engberink et al.
by guest on October 13, 2011
jn.nutrition.orgD
ownloaded from

and reproducibility for food groups. Int J Epidemiol. 1997;26 Suppl
1:S37–48.
13. NEVO Foundation. Netherlands Food Composition Table 2001. The
Hague: Netherlands Nutrition Center; 2001.
14. Willett WC, Howe GR, Kushi LH. Adjustment for total energy intake in
epidemiologic studies. Am J Clin Nutr. 1997;65:S1220–8.
15. Pereira MA, Jacobs DR Jr, van Horn L, Slatterly ML, Kartashov AI,
Ludwig DS. Dairy consumption, obesity, and the insulin resistance
syndrome in young adults: the CARDIA Study. JAMA. 2002;287:
2081–9.
16. Steffen LM, Kroenke CH, Yu X, Pereira MA, Slatterly ML, van Horn L,
Gross MD, Jacobs DR Jr. Associations of plant food, dairy product, and
meat intakes with 15-y incidence of elevated blood pressure in young
black and white adults: the Coronary Artery Risk Development in
Young Adults (CARDIA) Study. Am J Clin Nutr. 2005;82:1169–77.
17. Geleijnse JM, Kok FJ, Grobbee DE. Blood pressure response to changes
in sodium and potassium intake: a metaregression analysis of ran-
domised trials. J Hum Hypertens. 2003;17:471–80.
18. Griffith LE, Guyatt GH, Cook RJ, Bucher HC, Cook DJ. The influence
of dietary and nondietary calcium supplementation on blood pressure:
an updated metaanalysis of randomized controlled trials. Am J Hy-pertens. 1999;12:84–92.
19. Mizushima S, Cappuccio FP, Nichols R, Elliott P. Dietary magnesiumintake and blood pressure: a qualitative overview of the observationalstudies. J Hum Hypertens. 1998;12:447–53.
20. van Mierlo LA, Arends LR, Streppel MT, Zeegers MP, Kok FJ, GrobbeeDE, Geleijnse JM. Blood pressure response to calcium supplementation:a meta-analysis of randomized controlled trials. J Hum Hypertens.2006;20:571–80.
21. Massey LK. Dairy food consumption, blood pressure and stroke. J Nutr.2001;131:1875–8.
22. Reichel H, Koeffler HP, Norman AW. The role of the vitamin Dendocrine system in health and disease. N Engl J Med. 1989;320:980–91.
23. Judd SE, Nanes MS, Ziegler TR, Wilson PW, Tangpricha V. Optimalvitamin D status attenuates the age-associated increase in systolic bloodpressure in white Americans: results from the third National Health andNutrition Examination Survey. Am J Clin Nutr. 2008;87:136–41.
24. Wang L, Manson JE, Buring JE, Lee IM, Sesso HD. Dietary intake ofdairy products, calcium, and vitamin D and the risk of hypertension inmiddle-aged and older women. Hypertension. 2008;51:1073–9.
Dairy intake and blood pressure 587
by guest on October 13, 2011
jn.nutrition.orgD
ownloaded from