D1.1 Strategy document on increasing impact of ICOS ...
126
This project has received funding from the European Union’s Horizon 2020 research and innovation programme under grant agreement No 730944 D1.1 RINGO (GA no 730944) Public Document Readiness of ICOS for Necessities of integrated Global Observations Strategy document on increasing the impact of ICOS including a recommendation to ESFRI for comprehensive impact analyses for distributed environmental Research Infrastructures (RIs). Ref. Ares(2019)7935452 - 31/12/2019
-
Upload
khangminh22 -
Category
Documents
-
view
1 -
download
0
Transcript of D1.1 Strategy document on increasing impact of ICOS ...
This project has received funding from the European Union’s Horizon 2020
research and innovation programme under grant agreement No 730944
D1.1
RINGO (GA no 730944)
Public Document
Readiness of ICOS for Necessities of integrated Global Observations
Strategy document on increasing the impact of ICOS
including a recommendation to ESFRI for
comprehensive impact analyses for distributed
environmental Research Infrastructures (RIs).
Ref. Ares(2019)7935452 - 31/12/2019
Page 2 of 22 This project has received funding from the Horizon 2020 under grant agreement No 730944
Deliverable: Strategy document on increasing impact of ICOS including a recommendation to ESFRI for
comprehensive impact analyses for environmental RIs.
Author(s): Werner L Kutsch, Evi-Carita Riikonen
Date: 31.12.2019
Activity: RINGO WP1, Task 1.1
Lead Partner: ICOS ERIC
Document Issue: 1
Dissemination Level: Public
Contact: Werner L Kutsch ([email protected])
Name Partner Date
From Werner L. Kutsch, Evi-Carita
Riikonen
ICOS ERIC
Reviewed by Janne-M. Rintala ICOS ERIC March 12th,
December 30th, 2019
Approved by Jouni Heiskanen ICOS ERIC December 30th, 2019
Version Date Comments/Changes Author/Partner
1st Draft March 12th Layout and text edits ICOS ERIC
2nd Draft June 26th Layout and text edits, text
updates, annexes
ICOS ERIC
3rd Draft (final) December 31st 2019 Text edits ICOS ERIC
Deliverable Review Checklist
A list of checkpoints has been created to be ticked off by the Task Leader before finalizing the deliverable. These checkpoints are
incorporated into the deliverable template where the Task Leader must tick off the list.
• Appearance is generally appealing and according to the RINGO template. Cover page has been updated
according to the Deliverable details.
✓ ☐
• The executive summary is provided giving a short and to the point description of the deliverable. ☐
• All abbreviations are explained in a separate list. ✓ ☐
• All references are listed in a concise list. ☐
• The deliverable clearly identifies all contributions from partners and justifies the resources used. ☐
• A full spell check has been executed and is completed. ☐
DISCLAIMER
This document has been produced in the context of the project Readiness of ICOS for Necessities of integrated Global Observations (RINGO)
The Research leading to these results has received funding from the European Union’s Horizon 2020 research and innovation programme under grant agreement
No 730944. All Information in this document is provided "as is" and no guarantee or warranty is given that the information is fit for any particular purpose. The
user thereof uses the information at its sole risk and liability. For the avoidance of all doubts, the European Commission has no liability in respect of this
document, which is merely representing the authors view.
Amendments, comments and suggestions should be sent to the authors.
Public document Page 3 of 22
Table of Contents
ABSTRACT ....................................................................................................................................................................... 4
1. INTRODUCTION AND CONTEXT .............................................................................................................................. 4
1.1 The structure of ICOS ...................................................................................................................................... 5
1.2 The mission of ICOS ......................................................................................................................................... 5
1.2.1 Strategic developments ............................................................................................................................. 5
2. APPROACH .............................................................................................................................................................. 6
2.1 ‘Performance’ and ‘Impact’ in Research Infrastructure context ..................................................................... 6
2.2 Things to consider in measuring the performance and impact of Environmental Research Infrastructures
(ENVRIs) ...................................................................................................................................................................... 8
2.3 Increasing and monitoring the performance and impact of ICOS ................................................................ 11
2.3.1 Connecting strategy and activities ........................................................................................................... 11
2.3.2 Defining Key Performance Indicators for ICOS – an integrated approach .............................................. 13
2.3.3 Linking Key Performance to Key Impact Indicators ................................................................................. 13
2.4 Demonstrating the performance and impact of ICOS: An example ............................................................. 14
2.5 Critical reflection ........................................................................................................................................... 18
3. RECOMMENDATIONS AND DISCUSSION .............................................................................................................. 18
3.1 Recommendations for a comprehensive performance and impact evaluation of environmental RIS ........ 18
3.2 ESFRI Working Group report on monitoring of Research Infrastructure Performance – a commentary ..... 19
ACRONYMS AND ABBREVIATIONS ................................................................................................................................ 21
ANNEXES ....................................................................................................................................................................... 22
Page 4 of 22 This project has received funding from the Horizon 2020 under grant agreement No 730944
ABSTRACT
This document describes the types of societal impact and the ways of measuring it for a distributed environmental
European Research Infrastructure, specialising in integrated greenhouse gas (GHG) observations, the Integrated
Carbon Observation System (ICOS RI). It identifies ways to monitor and increase impact via Key Impact Indicators
(KIIs), identified in the ’ICOS Impact Assessment’ Study, conducted in 2018 (see Annex A). This document,
furthermore, summarizes a holistic process of self-reflection that was run over a period of more than two years where
all bodies of this distributed research infrastructure contributed to. The process was well-timed towards the end of
the first five-year period of ICOS ERIC (2015 – 2019) and the transition from implementation to operation. In parallel
to the Impact Assessment Study and party inspired by it, ICOS developed a Strategy that will guide its development
through the upcoming decade e.g. by setting the goals for a five-year action plan 2020 – 2024 that has been approved
by the General Assembly in May 2019.
Furthermore, the aim of this document is to demonstrate how defining the societal expectations for an RI that
operates in specific fields is a unique process. To facilitate the recognising of the link between societal impact and
the work conducted in environmental RIs, this document introduces a strategical structure for managing and planning
the RIs operations by presenting a two-level framework that takes into account both the RI’s performance and impact
– both of which are crucial in the wider pan-European Research Infrastructure landscape. Thus, the starting point for
a comprehensive approach is based on strategic focus areas and connects these to core activities. This results in a
hierarchical system of processes and tasks connected to the Strategy and measurable with Key Performance
Indicators (KPIs). The connection of both, the KPIs and the Key Impact Indicators (KIIs) to the strategic focus areas
elegantly relates them to each other. As the consequence of a future assessment, it might, therefore, be possible to
work on better performance of ICOS RI or to modify the activities when the impact is not as expected.
Lastly, this document draws from the ICOS experiences accumulated in the course of the last two years a set of
recommendations for designing performance and impact analyses for environmental RIs, and discusses the
problematics in attempting to use a common set of indicators for all pan-European RIs.
1. INTRODUCTION AND CONTEXT
This is a description of an approach that links together ICOS’ mission, strategy and performance- and socio-economic
impact monitoring, and demonstrates how a novel systematic approach can be applied as a management structure,
implementable by an aligned Management Plan, to increase the socio-economic impact of ICOS RI.
Firstly, the specific context for ICOS RI is defined by introducing the structure of the RI and a general overlook into
its evolvement from the preparatory phase towards operational phase. The mission of ICOS is also discussed, setting
the scene for the strategic framework that is being discussed throughout the document. Secondly, the specificities
and challenges of ICOS RI, especially related to assessing its socio-economic impact as a distributed, pan-European
environmental Research Infrastructure, are discussed to enable the positioning of ICOS RI within the wider European
RI landscape and to highlight the fact that this landscape is very heterogenic. Thirdly, an outline of the
aforementioned management structure is described, starting from the linking together ICOS RI’s mission, strategy,
activities, performance indicators and impact indicators. Some concrete examples are shown to demonstrate how
this structure will serve as the backbone to an internal management plan and enable in increasing the impact of ICOS
RI. Fourthly, recommendations for structuring performance and socio-economic impact assessments for ENVRIs will
be suggested, taking into account and discussing the recently published ESFRI report on performance monitoring
indicators for Research Infrastructures.
The report is also a reflection of an important period in the life cycle of ICOS RI. It’s compilation spread over more
than 2 years when ICOS became fully operational by stepwise checking the compliance of stations before taking them
fully into the ICOS networks and data life cycle (‘station labelling’) and organising the administrative and financial
transition into the second five-year period of ICOS ERIC including the preparation of a comprehensive evaluation at
the end of the first five-year period. The documents attached to this report as annexes have provided important
input to this process, namely the ICOS Impact Assessment Study (Annex A) or are important outcome supported by
Public document Page 5 of 22
the RINGO Tasks 1.1 namely the ICOS Strategy (Annex B).
1.1 The structure of ICOS
The ICOS Research Infrastructure is coordinated by the Integrated Carbon Observation System European Research
Infrastructure Consortium (ICOS ERIC) established on 23 November 2015 by the European Commission (Official
Journal of the European Union 2015: L303/19) based on the request by Finland representing eight Members and one
Observer. The establishment was made on the basis of a regulation of the Council of the European Union
(EC/723/2009). The Finnish Parliament has provided a Finnish law about legal personality and partial tax-exempt
status in Finland according to which ICOS ERIC is a legal entity with legal capacity in Finland. ICOS ERIC has its
registered Head Office in Helsinki. The number of participating countries at the time of writing this document is 12
(11 members and 1 observer). ICOS aims to enlarge its observational capacity by attracting more member countries.
ICOS is a research infrastructure that integrates highly standardized networks from multiple domains (atmosphere,
terrestrial ecosystems, and oceans) and connects different carbon reservoirs. All stations provide high-quality
observations using state-of-the-art technologies. During the ICOS Preparatory and Interim Phases (2008 – 2015),
protocols and station specifications were formulated in an intense community effort. Finalized protocols for the
ecosystem stations were published in (2018). Once standards were achieved, stations were ingested into the network
through the labelling process to ensure compliance to the quality requirements and robustness. The measurement
stations are run in National Networks (NNs). Central Facilities (CFs) provide services and data integration for the
networks. ICOS ERIC operates the ICOS Carbon Portal, the central information portal through which all data and
higher-level data products produced by ICOS are available in an open and transparent way (according to the FAIR
principles of the FORCE11 group). ICOS ERIC acts in cooperation with end-users of data and research results, industry,
policy-makers, and the media, and coordinates the overall RI operations in its capacity as a recognised legal entity.
Detailed descriptions can be found in the ICOS Handbook that has been developed as Task 2.1: Building partnership
with countries, Deliverable 2.1 of the RINGO project.
In the context of this document, we refer to a number of different types of actors either operating within, or
using/observing the services and/or operations from outside the RI. These actors consist of operators, meaning the
staff responsible for the everyday functions of the RI in its different components; stakeholders, referring to people,
organisations or groups that benefit from the impact of ICOS including representatives from the national funding
bodies; and the users, a term describing the scientific communities and general public that are using the data that
ICOS RI generates and provides.
1.2 The mission of ICOS
The Integrated Carbon Observation System (ICOS) is a distributed research infrastructure operating standardized,
high-precision, and long-term observations, facilitating research to understand the carbon cycle, providing necessary
information on greenhouse gases. ICOS-based knowledge supports policy- and decision-making to combat climate
change and its impacts. ICOS is the European pillar of a global GHG observation system. It promotes technological
developments and demonstrations related to GHGs by the linking of research, education and innovation.
1.2.1 Strategic developments
Further developing the ICOS research infrastructure is constrained by two simultaneous challenges: while the
achieved observational networks have to be sustained, essential enhancements defined by novel requirements
arising, e.g., from the Paris Agreement have to be constantly developed and implemented.
ICOS’ strategy explores perspectives for the ideal future design of ICOS and possible ways to achieve them. The
required change management will be based on an agile system throughout the whole ICOS research infrastructure.
Task forces with contributions from the different bodies will be set up for each potential extension. The coordination
will be conducted by the Research Infrastructure Committee which will be discussing the supporting resources case
by case. Each enhancement will undergo scientific and technical feasibility studies. At the end of respective research
phases, operational standards will be developed and a formal decision about the extension will be presented to the
General Assembly.

Page 6 of 22 This project has received funding from the Horizon 2020 under grant agreement No 730944
Currently there are two research areas in which major developments can become urgently necessary. They are driven
by societal needs for specific knowledge about the climate emergency. The ICOS Strategy formulates two questions:
1. How do carbon-climate feedbacks induced by the anthropogenic perturbation of the global carbon cycle
change the natural carbon sinks and greenhouse gas emissions?
2. How can the primary agents of change be quantified, such as fossil fuel combustion and modifications of
global vegetation through land use change (deforestation, forest degradation) and intensified land
management?
The two questions are seen with similar priority but will not necessarily be developed in parallel and with similar time
lines, respectively. Their realisation may be strongly depending on funding opportunities.
A systematic structure is needed to be able to validate and monitor the materialisation of these strategic
developments and to demonstrate their alignment with the statutes, mission, strategy and vision of ICOS, Hence,
ICOS RI has developed and is in the process of developing further, a set of Key Performance Indicators that are linked
to Key Impact Indicators. Together, these two sets of indicators (KPIs & KIIs) will keep track how well the RI is
performing and the subsequent impacts it has on e.g. wider societal issues related to each of the strategical focus
areas defined for it. The indicators also serve as tools to steer the RI’s performance towards increasingly effective
actions, increasing the RI’s impact in the long run.
This system is further described and explained in the coming chapters.
2. APPROACH
2.1 ‘Performance’ and ‘Impact’ in Research Infrastructure context
When talking about measuring performance and impact, the common approach that resonates with most audiences
is derived from the corporate world and from the point of view with institutions and organisations with a long-
standing societal position, e.g. NGOs (Non-Governmental Institutions). In those contexts, deriving measurable
indicators and setting baselines against which to monitor and measure performance and impact has been focused
on and developed over a long period of time.
Discussion about measuring the performance and impact of RIs, has, however, developed much more recently – as
they are a relatively recent organisational form. Notwithstanding, as a result of the development of the RI landscape,
the need to demonstrate their performance and the subsequent impact has risen to the surface on many levels – the
national and EU-level funding and strategy planning and among the internal RI operators who need to demonstrate
their RIs’ competence in the demanding landscape of competing for funding and recognition. This has resulted in the
understanding that developing performance and impact indicators of RIs requires to some extent approaches that
are different than the ones that are commonly used in other fields.
As a starting point for a systematic conceptualisation of the questions pointed out in the introduction, it is important
to note that ICOS comprises of strategic objectives, input-dependent activities and subsequent outputs, and is
embedded into an outside world where the needs and problems exist that define the purpose of ICOS. The
performance of ICOS manifests as outcomes and impact (see Figure 1).
It is self-explanatory that the performed activities of an organisation like ICOS can be grouped under tasks, and
achieved tasks will result in tangible deliverables (e.g. the outputs). Thus, the approach that ICOS RI is currently
considering employs the idea that the Key Performance Indicators are concrete, measured outputs that demonstrate
the RI’s performance (e.g. operability and alignment with the goals formulated in the statutes, in the case of an RI
that is formed as an ERIC). The KPIs are directly linked to specific strategic core activities, each of which are
formulated under specific strategic focus areas. The logic behind this structure assumes that when the RI performs
compliantly (e.g. fulfils its’ set tasks and produces required deliverables; in other words, produces output), it
successfully executes its strategy and in doing so, fulfils its mission. The outcome of this performance can then be
Public document Page 7 of 22
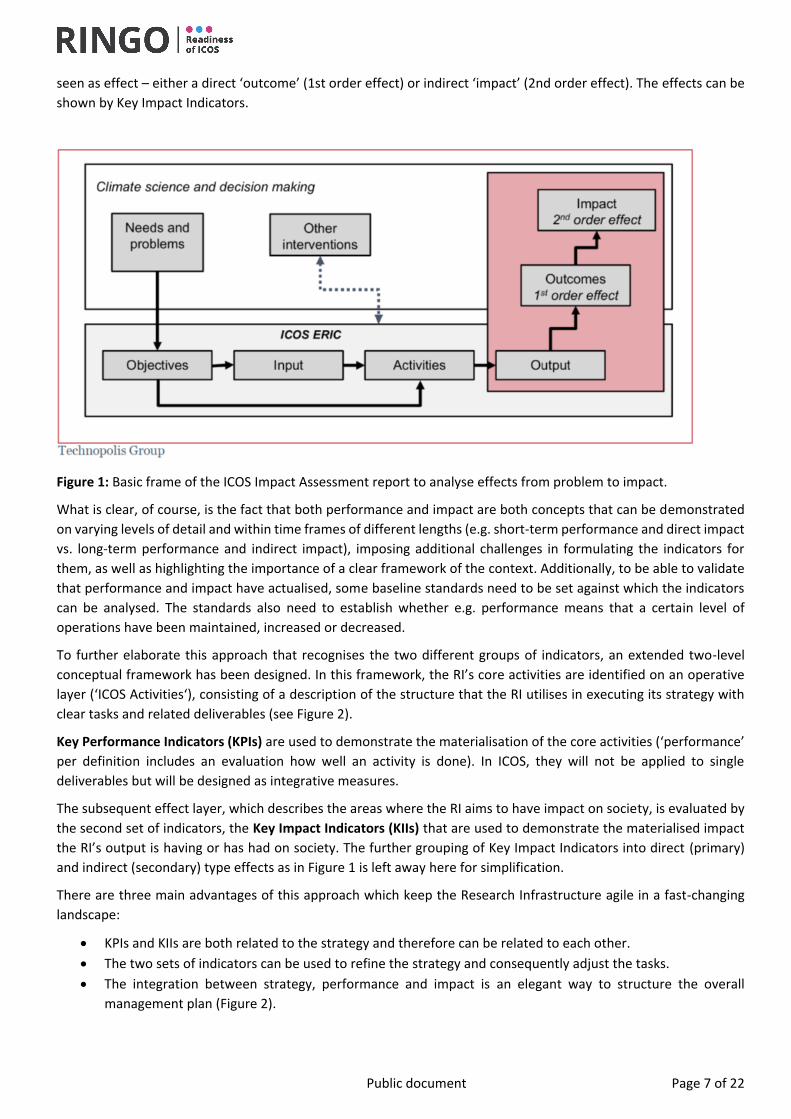
seen as effect – either a direct ‘outcome’ (1st order effect) or indirect ‘impact’ (2nd order effect). The effects can be
shown by Key Impact Indicators.
Figure 1: Basic frame of the ICOS Impact Assessment report to analyse effects from problem to impact.
What is clear, of course, is the fact that both performance and impact are both concepts that can be demonstrated
on varying levels of detail and within time frames of different lengths (e.g. short-term performance and direct impact
vs. long-term performance and indirect impact), imposing additional challenges in formulating the indicators for
them, as well as highlighting the importance of a clear framework of the context. Additionally, to be able to validate
that performance and impact have actualised, some baseline standards need to be set against which the indicators
can be analysed. The standards also need to establish whether e.g. performance means that a certain level of
operations have been maintained, increased or decreased.
To further elaborate this approach that recognises the two different groups of indicators, an extended two-level
conceptual framework has been designed. In this framework, the RI’s core activities are identified on an operative
layer (‘ICOS Activities‘), consisting of a description of the structure that the RI utilises in executing its strategy with
clear tasks and related deliverables (see Figure 2).
Key Performance Indicators (KPIs) are used to demonstrate the materialisation of the core activities (‘performance’
per definition includes an evaluation how well an activity is done). In ICOS, they will not be applied to single
deliverables but will be designed as integrative measures.
The subsequent effect layer, which describes the areas where the RI aims to have impact on society, is evaluated by
the second set of indicators, the Key Impact Indicators (KIIs) that are used to demonstrate the materialised impact
the RI’s output is having or has had on society. The further grouping of Key Impact Indicators into direct (primary)
and indirect (secondary) type effects as in Figure 1 is left away here for simplification.
There are three main advantages of this approach which keep the Research Infrastructure agile in a fast-changing
landscape:
• KPIs and KIIs are both related to the strategy and therefore can be related to each other.
• The two sets of indicators can be used to refine the strategy and consequently adjust the tasks.
• The integration between strategy, performance and impact is an elegant way to structure the overall
management plan (Figure 2).
Page 8 of 22 This project has received funding from the Horizon 2020 under grant agreement No 730944
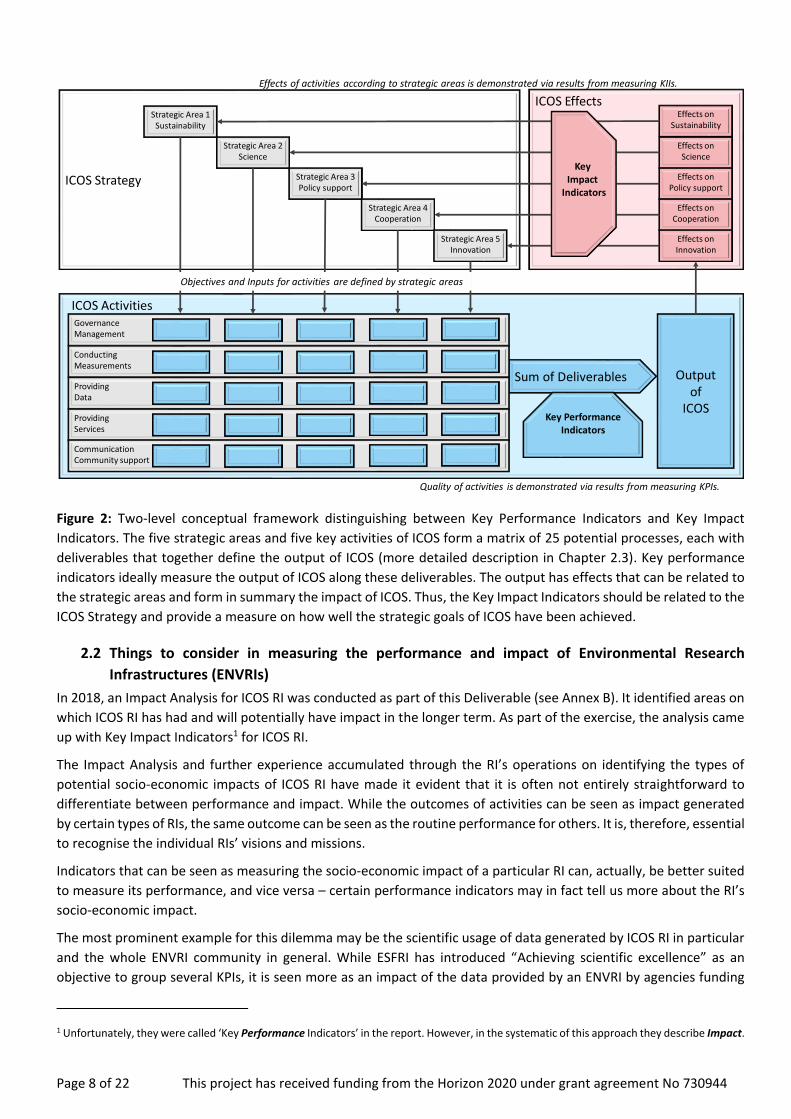
Figure 2: Two-level conceptual framework distinguishing between Key Performance Indicators and Key Impact
Indicators. The five strategic areas and five key activities of ICOS form a matrix of 25 potential processes, each with
deliverables that together define the output of ICOS (more detailed description in Chapter 2.3). Key performance
indicators ideally measure the output of ICOS along these deliverables. The output has effects that can be related to
the strategic areas and form in summary the impact of ICOS. Thus, the Key Impact Indicators should be related to the
ICOS Strategy and provide a measure on how well the strategic goals of ICOS have been achieved.
2.2 Things to consider in measuring the performance and impact of Environmental Research
Infrastructures (ENVRIs)
In 2018, an Impact Analysis for ICOS RI was conducted as part of this Deliverable (see Annex B). It identified areas on
which ICOS RI has had and will potentially have impact in the longer term. As part of the exercise, the analysis came
up with Key Impact Indicators1 for ICOS RI.
The Impact Analysis and further experience accumulated through the RI’s operations on identifying the types of
potential socio-economic impacts of ICOS RI have made it evident that it is often not entirely straightforward to
differentiate between performance and impact. While the outcomes of activities can be seen as impact generated
by certain types of RIs, the same outcome can be seen as the routine performance for others. It is, therefore, essential
to recognise the individual RIs’ visions and missions.
Indicators that can be seen as measuring the socio-economic impact of a particular RI can, actually, be better suited
to measure its performance, and vice versa – certain performance indicators may in fact tell us more about the RI’s
socio-economic impact.
The most prominent example for this dilemma may be the scientific usage of data generated by ICOS RI in particular
and the whole ENVRI community in general. While ESFRI has introduced “Achieving scientific excellence” as an
objective to group several KPIs, it is seen more as an impact of the data provided by an ENVRI by agencies funding
1 Unfortunately, they were called ‘Key Performance Indicators’ in the report. However, in the systematic of this approach they describe Impact.
ICOS Activities
ICOS Strategy
ICOS Effects
Strategic Area 2Science
Strategic Area 3Policy support
Strategic Area 4Cooperation
Strategic Area 5Innovation
GovernanceManagement
Sum of Deliverables Output of
ICOS
Effects on Science
Effects onPolicy support
Effects onCooperation
Effects onInnovation
Key Performance Indicators
Quality of activities is demonstrated via results from measuring KPIs.
Effects of activities according to strategic areas is demonstrated via results from measuring KIIs.
Strategic Area 1Sustainability
Effects on Sustainability
ConductingMeasurements
Providing Data
Providing Services
CommunicationCommunity support
Objectives and Inputs for activities are defined by strategic areas
Key Impact
Indicators
Public document Page 9 of 22
ICOS. According to their definition, they pay from their RI budget only the observations and have other funding
streams for the science that is using the RI data. Consequently, ICOS has defined several KIIs under the strategic
objective “Stimulating scientific studies and modelling efforts”. The difference may be subtle but places “Science”
into a grey zone between performance and impact.
A way to solve this dilemma is related to the fact that many data sets that ICOS provides increase in their value for
scientists (and society) with accuracy, comparability (through standardisation and calibration), steadiness (length and
time coverage of measurements), and accessibility (FAIRness). All of these values can be related to a clear set of
indicators that describe the performance of the ‘inner machinery’ of ICOS, but are indispensable for excellent science
by using the data. The respective core activity ‘conducting the measurements’ has therefore been more elaborated
as an example for the performance monitoring of ICOS.
An important feature that has to be recognized when measuring socio-economic impact is that it can be seen to
unfold within very different timeframes. While it is easy to see that for example ‘Number of publications’ (indicator
3 in the Impact Assessment report) can be clearly visible within a relatively short time period, ‘The ability to provide
policy-relevant data’ (indicator 7 in the Impact Assessment report) may not be detectable until much later,
sometimes several years or even decades. Even longer time-frames may be considered when it comes to the ultimate
societal impact, ‘Improved long-term decisions through enhanced political discourse based on evidence’ (indicator
11 in the Impact Assessment report. This is a general challenge of ENVRIs, which are observing long-term
environmental phenomena where scientifically understanding relies on long time series of data and which are
providing knowledge for societal mitigation and adaptation processes, that often take decades if not centuries.
For this purpose, it is important to define the impact indicators for both first and second effect impacts and to justify
the time frames used to measure them. While identifying the order of impact levels, it can sometimes become clear
that some impact indicators are, in fact, closer related to performance than to general socio-economic impact –
making it important to define what the hoped-for impacts of an RI actually are, and how wide the ‘socio-economic
impact’ -dimension actually needs to be or can be for a particular RI.
In the framework of this study, a clearer distinction between first and second effect impacts have been derived from
“Science driving policy” and “Policy driving science” paradigm resulting from the Paris Agreement (Joanna Post,
UNFCCC, personal communication, see ICOS Strategy, Figure 3), where the relation between the science sphere and
the policy sphere is shown as mutual information and expectation cycle. The science sphere provides the necessary
knowledge towards the policy sphere – in this case represented by the UNFCCC Conference of Parties, represented
by its Subsidiary Body for Scientific and Technological Advice (SBSTA) – in a value chain that comprises observations,
research and assessment.
Important to note is that the 1st order effects (usage of ICOS data in research and assessment) boost the 2nd order
effects (socio-economic impact of knowledge based on ICOS data). ICOS observations alone may already provide a
very powerful message to policy makers and the public, but understanding the underlying processes scientifically and
assessing them provides societies with knowledge that can be transferred into actions. It’s noteworthy that this boost
at the same time causes a dilution of the ICOS trace along the value chain since data from other sources are ingested
and other organisations (e.g. the IPCC) adds additional intellectual input.
Page 10 of 22 This project has received funding from the Horizon 2020 under grant agreement No 730944
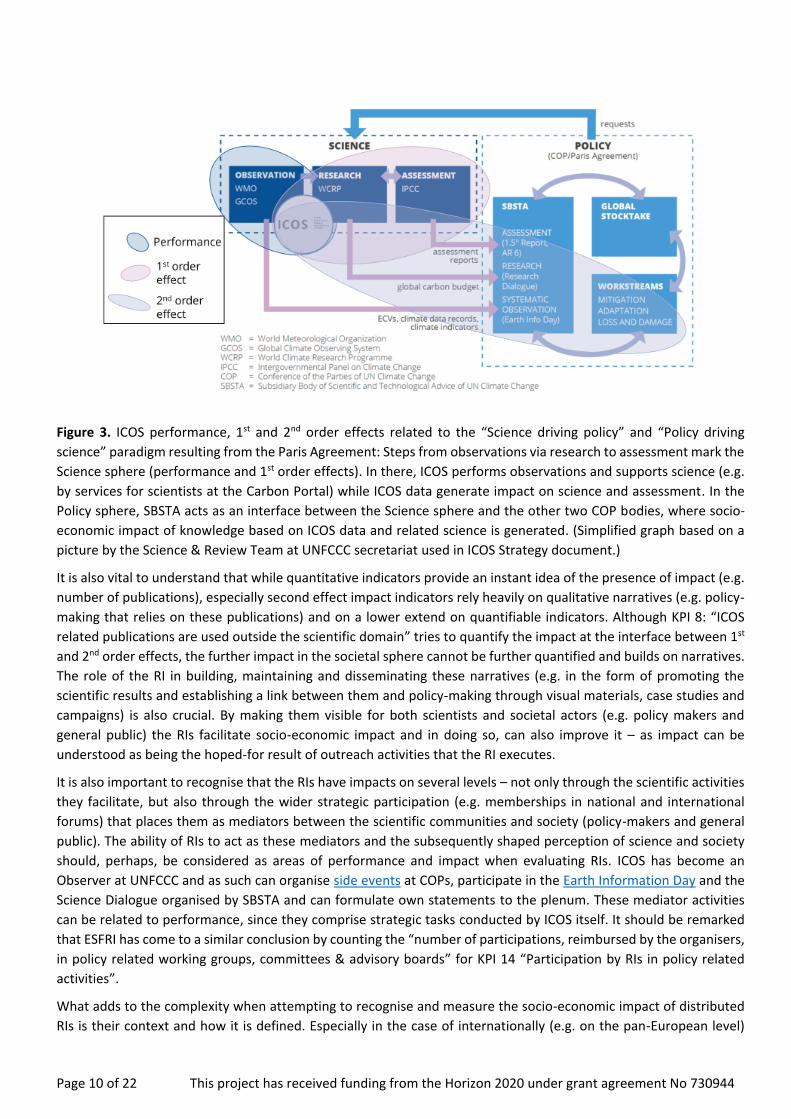
Figure 3. ICOS performance, 1st and 2nd order effects related to the “Science driving policy” and “Policy driving
science” paradigm resulting from the Paris Agreement: Steps from observations via research to assessment mark the
Science sphere (performance and 1st order effects). In there, ICOS performs observations and supports science (e.g.
by services for scientists at the Carbon Portal) while ICOS data generate impact on science and assessment. In the
Policy sphere, SBSTA acts as an interface between the Science sphere and the other two COP bodies, where socio-
economic impact of knowledge based on ICOS data and related science is generated. (Simplified graph based on a
picture by the Science & Review Team at UNFCCC secretariat used in ICOS Strategy document.)
It is also vital to understand that while quantitative indicators provide an instant idea of the presence of impact (e.g.
number of publications), especially second effect impact indicators rely heavily on qualitative narratives (e.g. policy-
making that relies on these publications) and on a lower extend on quantifiable indicators. Although KPI 8: “ICOS
related publications are used outside the scientific domain” tries to quantify the impact at the interface between 1st
and 2nd order effects, the further impact in the societal sphere cannot be further quantified and builds on narratives.
The role of the RI in building, maintaining and disseminating these narratives (e.g. in the form of promoting the
scientific results and establishing a link between them and policy-making through visual materials, case studies and
campaigns) is also crucial. By making them visible for both scientists and societal actors (e.g. policy makers and
general public) the RIs facilitate socio-economic impact and in doing so, can also improve it – as impact can be
understood as being the hoped-for result of outreach activities that the RI executes.
It is also important to recognise that the RIs have impacts on several levels – not only through the scientific activities
they facilitate, but also through the wider strategic participation (e.g. memberships in national and international
forums) that places them as mediators between the scientific communities and society (policy-makers and general
public). The ability of RIs to act as these mediators and the subsequently shaped perception of science and society
should, perhaps, be considered as areas of performance and impact when evaluating RIs. ICOS has become an
Observer at UNFCCC and as such can organise side events at COPs, participate in the Earth Information Day and the
Science Dialogue organised by SBSTA and can formulate own statements to the plenum. These mediator activities
can be related to performance, since they comprise strategic tasks conducted by ICOS itself. It should be remarked
that ESFRI has come to a similar conclusion by counting the “number of participations, reimbursed by the organisers,
in policy related working groups, committees & advisory boards” for KPI 14 “Participation by RIs in policy related
activities”.
What adds to the complexity when attempting to recognise and measure the socio-economic impact of distributed
RIs is their context and how it is defined. Especially in the case of internationally (e.g. on the pan-European level)
Public document Page 11 of 22
distributed RIs, it is clear the context in which they operate is multidimensional. What do we, then, mean when we
talk about ‘socio-economic’? Do we mean the societal and economic processes and structures of one specific country
that is part of the RI, all of them on average, or do we apply some kind of pre-defined template that is seen as a kind
of ‘one size fits all’-approach? This is, of course, risky.
When the infrastructure is physically located in multiple places on several scales (nationally and internationally), and
is thus observed from multiple different natural, cultural, historic, political and linguistic viewpoints, it is clear that
also the perceived and expected types of impact can differ, both inside the RI and also from the point of view of
national stakeholders and general public. Hence, it is important that the methods that are used to define the metrics
for both performance and impact, and the steps taken in deriving the measurements, are made transparent, iterative
and also adjusted to the context in which they are being derived – defining the RI’s mission and the relevant, related
societal and economic processes and structures that are being focused on, and taking into account the geographically
specific societal nuances.
2.3 Increasing and monitoring the performance and impact of ICOS
Systematic management of a distributed research infrastructure such as ICOS forms the base for achieving significant
impact. It requires the integration of all constitutional documents including the ICOS Statutes, the ICOS Strategy, the
ICOS Impact Analysis, internal Cooperation Agreements between ICOS ERIC and the Central Facilities and National
Networks, internal rules as the ICOS Financial Rules, the ICOS Cooperation Rules, and internal policies like the ICOS
Data Policy and the ICOS Employment Policy. Rules and policies usually have general character and are concretized
in detailed management documents. The following section is an outline of this systematic management approach.
2.3.1 Connecting strategy and activities
The complexity of ICOS’ activities and their distributed character require a nested hierarchical approach of three
levels inside a wider strategic framework. These levels are named ‘core activities’, ‘processes’ and ‘tasks’. The five
identifies Core Activities (Governance and Management, Conducting the Measurements, Providing Data, Providing
Services, and Communication, Dissemination and Community Support) are general and related to the research
infrastructure as a whole. Each core activity can be broken down to several more detailed Processes when being
related to the strategic focus areas within the matrix. Processes are still defined at the level of the research
infrastructure as a whole, while Tasks describe the manifestation of very concrete actions related to the different
bodies of the research infrastructure such as Head Office, Carbon Portal, Central Facilities, National Networks or even
single stations. Responsibilities and required output (deliverables) are defined and assigned on task level.
This approach further serving as the backbone of the RI’s internal Management Plan, visualises the apparent
interrelatedness between the different RI components’ input that is required to fulfil the RI’s mission, and it also
facilitates planning and managing these inputs in a wider RI scope. Simultaneously, it facilitates the understanding or
the interrelatedness of performance and impact.
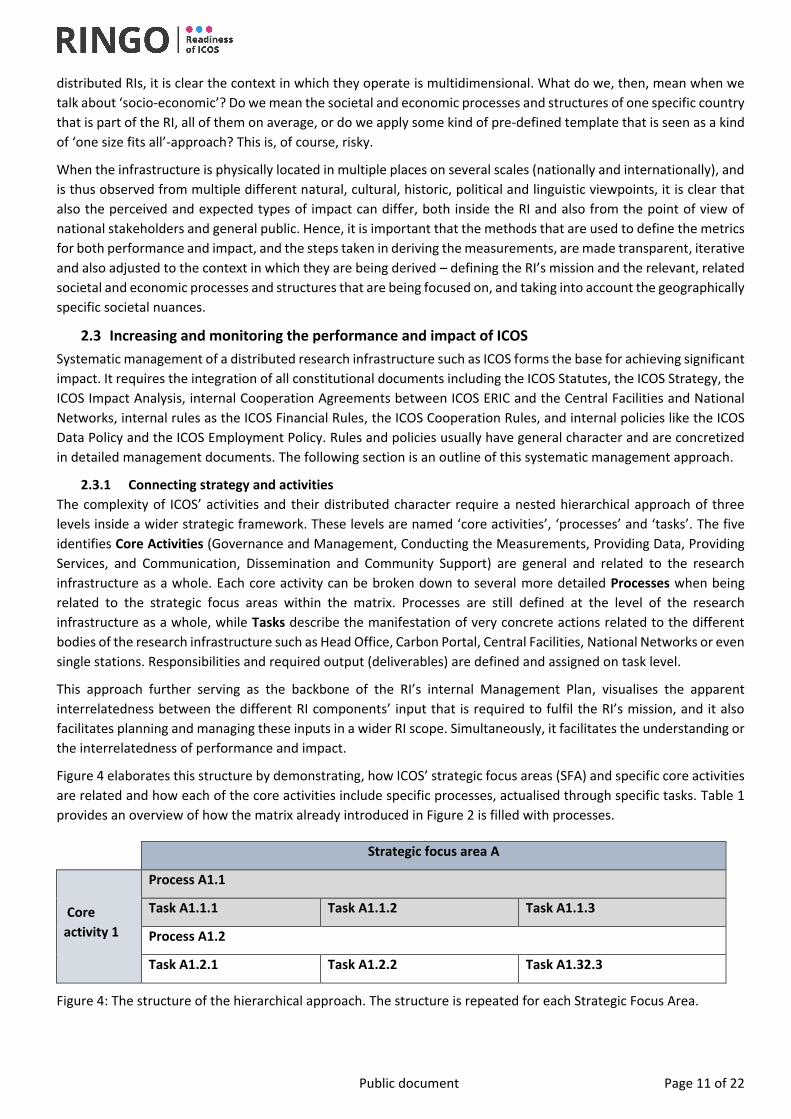
Figure 4 elaborates this structure by demonstrating, how ICOS’ strategic focus areas (SFA) and specific core activities
are related and how each of the core activities include specific processes, actualised through specific tasks. Table 1
provides an overview of how the matrix already introduced in Figure 2 is filled with processes.
Strategic focus area A
Core
activity 1
Process A1.1
Task A1.1.1 Task A1.1.2 Task A1.1.3
Process A1.2
Task A1.2.1 Task A1.2.2 Task A1.32.3
Figure 4: The structure of the hierarchical approach. The structure is repeated for each Strategic Focus Area.
Page 12 of 22 This project has received funding from the Horizon 2020 under grant agreement No 730944
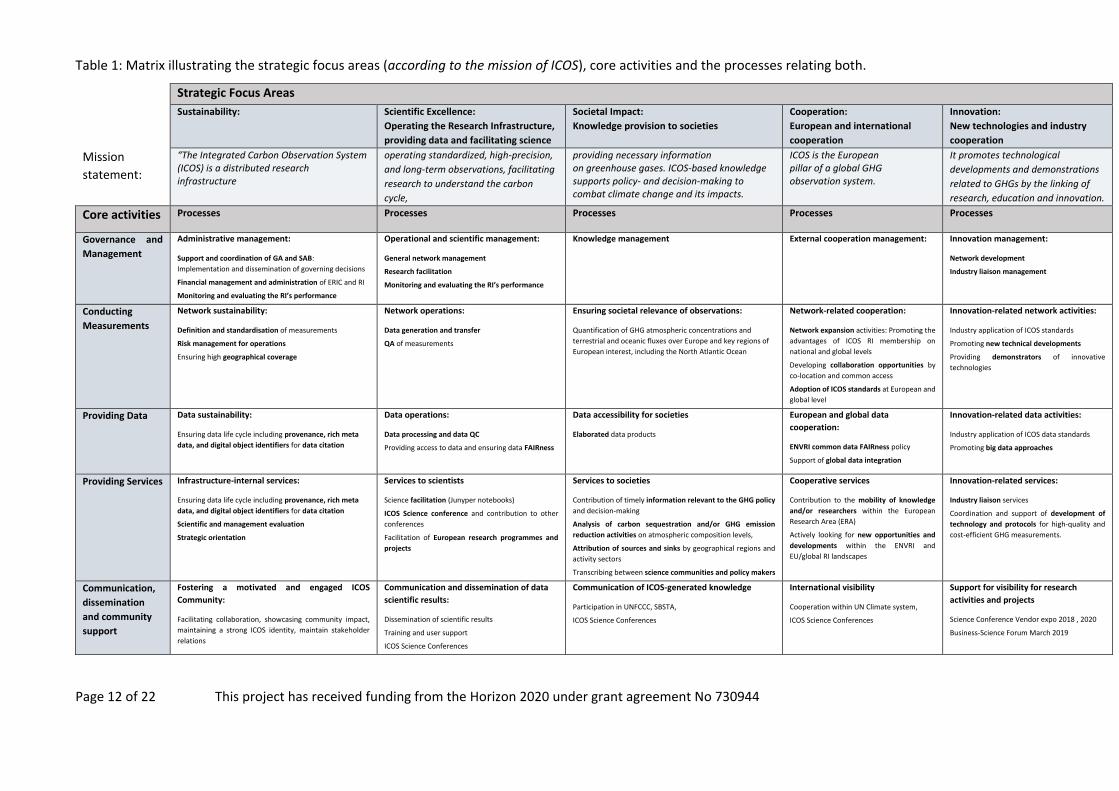
Table 1: Matrix illustrating the strategic focus areas (according to the mission of ICOS), core activities and the processes relating both.
Strategic Focus Areas
Sustainability:
Scientific Excellence:
Operating the Research Infrastructure,
providing data and facilitating science
Societal Impact:
Knowledge provision to societies
Cooperation:
European and international
cooperation
Innovation:
New technologies and industry
cooperation
Mission
statement:
“The Integrated Carbon Observation System (ICOS) is a distributed research infrastructure
operating standardized, high-precision,
and long-term observations, facilitating
research to understand the carbon
cycle,
providing necessary information on greenhouse gases. ICOS-based knowledge supports policy- and decision-making to combat climate change and its impacts.
ICOS is the European pillar of a global GHG observation system.
It promotes technological
developments and demonstrations
related to GHGs by the linking of
research, education and innovation.
Core activities Processes Processes Processes Processes Processes
Governance and
Management
Administrative management:
Support and coordination of GA and SAB:
Implementation and dissemination of governing decisions
Financial management and administration of ERIC and RI
Monitoring and evaluating the RI’s performance
Operational and scientific management:
General network management
Research facilitation
Monitoring and evaluating the RI’s performance
Knowledge management External cooperation management:
Innovation management:
Network development
Industry liaison management
Conducting
Measurements
Network sustainability:
Definition and standardisation of measurements
Risk management for operations
Ensuring high geographical coverage
Network operations:
Data generation and transfer
QA of measurements
Ensuring societal relevance of observations:
Quantification of GHG atmospheric concentrations and
terrestrial and oceanic fluxes over Europe and key regions of
European interest, including the North Atlantic Ocean
Network-related cooperation:
Network expansion activities: Promoting the
advantages of ICOS RI membership on
national and global levels
Developing collaboration opportunities by
co-location and common access
Adoption of ICOS standards at European and
global level
Innovation-related network activities:
Industry application of ICOS standards
Promoting new technical developments
Providing demonstrators of innovative
technologies
Providing Data Data sustainability:
Ensuring data life cycle including provenance, rich meta
data, and digital object identifiers for data citation
Data operations:
Data processing and data QC
Providing access to data and ensuring data FAIRness
Data accessibility for societies
Elaborated data products
European and global data
cooperation:
ENVRI common data FAIRness policy
Support of global data integration
Innovation-related data activities:
Industry application of ICOS data standards
Promoting big data approaches
Providing Services Infrastructure-internal services:
Ensuring data life cycle including provenance, rich meta
data, and digital object identifiers for data citation
Scientific and management evaluation
Strategic orientation
Services to scientists
Science facilitation (Junyper notebooks)
ICOS Science conference and contribution to other
conferences
Facilitation of European research programmes and
projects
Services to societies
Contribution of timely information relevant to the GHG policy
and decision-making
Analysis of carbon sequestration and/or GHG emission
reduction activities on atmospheric composition levels,
Attribution of sources and sinks by geographical regions and
activity sectors
Transcribing between science communities and policy makers
Cooperative services
Contribution to the mobility of knowledge
and/or researchers within the European
Research Area (ERA)
Actively looking for new opportunities and
developments within the ENVRI and
EU/global RI landscapes
Innovation-related services:
Industry liaison services
Coordination and support of development of
technology and protocols for high-quality and
cost-efficient GHG measurements.
Communication,
dissemination
and community
support
Fostering a motivated and engaged ICOS
Community:
Facilitating collaboration, showcasing community impact,
maintaining a strong ICOS identity, maintain stakeholder
relations
Communication and dissemination of data
scientific results:
Dissemination of scientific results
Training and user support
ICOS Science Conferences
Communication of ICOS-generated knowledge
Participation in UNFCCC, SBSTA,
ICOS Science Conferences
International visibility
Cooperation within UN Climate system,
ICOS Science Conferences
Support for visibility for research
activities and projects
Science Conference Vendor expo 2018 , 2020
Business-Science Forum March 2019
Public document Page 13 of 22
2.3.2 Defining Key Performance Indicators for ICOS – an integrated approach
Based on the structure described in Table 1 a clear blueprint can now be designed that enables to describe all
processes and tasks and assign each task to the different elements from the RI. The same blueprint allows the
derivation of the KPIs and the indication of their relation to the RI strategic management as well as to the RI’s impact
areas. Finally, it allows to define metrics that would indicate how well the RI is performing. Describing a task includes
its location within the matrix (relation to a process), the desired output (‘deliverables’) and the identification of the
RI component responsible for the task and deliverable. In this way, it was possible to map out all the input from
different components of the RI and define how their output, examined as an integrated effort, could best be
demonstrated through specific KPIs that would highlight the RI’s performance collectively.
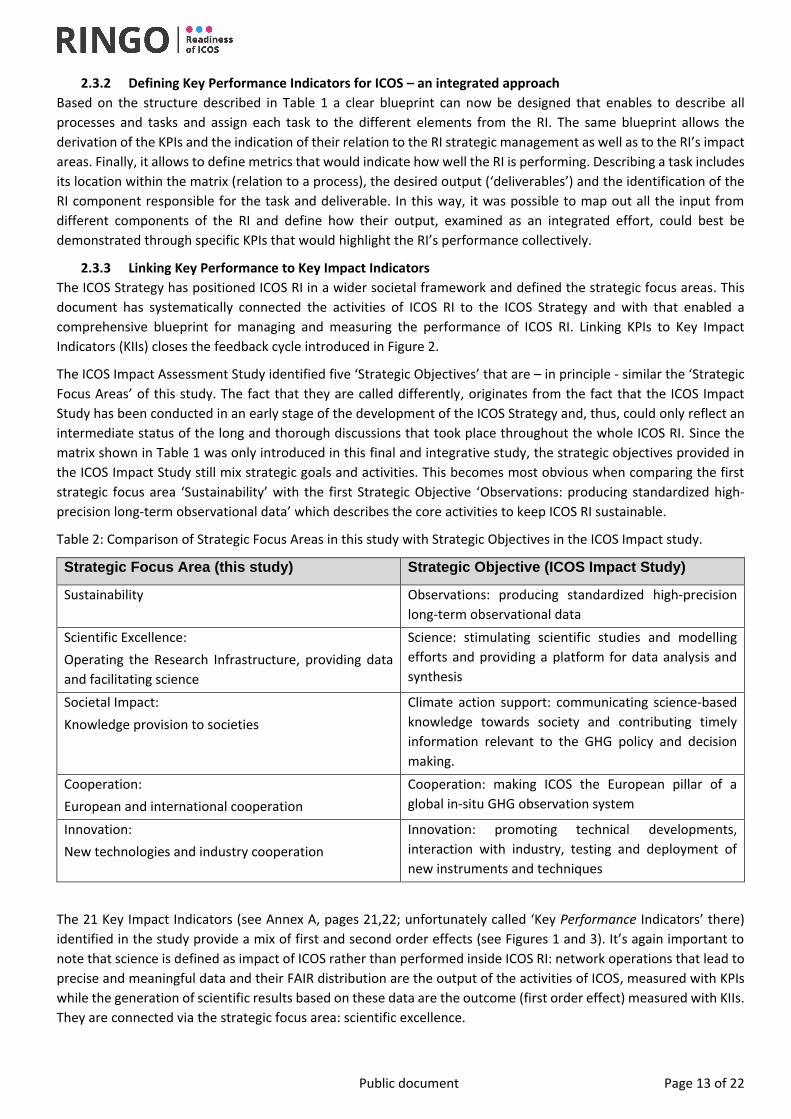
2.3.3 Linking Key Performance to Key Impact Indicators
The ICOS Strategy has positioned ICOS RI in a wider societal framework and defined the strategic focus areas. This
document has systematically connected the activities of ICOS RI to the ICOS Strategy and with that enabled a
comprehensive blueprint for managing and measuring the performance of ICOS RI. Linking KPIs to Key Impact
Indicators (KIIs) closes the feedback cycle introduced in Figure 2.
The ICOS Impact Assessment Study identified five ‘Strategic Objectives’ that are – in principle - similar the ‘Strategic
Focus Areas’ of this study. The fact that they are called differently, originates from the fact that the ICOS Impact
Study has been conducted in an early stage of the development of the ICOS Strategy and, thus, could only reflect an
intermediate status of the long and thorough discussions that took place throughout the whole ICOS RI. Since the
matrix shown in Table 1 was only introduced in this final and integrative study, the strategic objectives provided in
the ICOS Impact Study still mix strategic goals and activities. This becomes most obvious when comparing the first
strategic focus area ‘Sustainability’ with the first Strategic Objective ‘Observations: producing standardized high-
precision long-term observational data’ which describes the core activities to keep ICOS RI sustainable.
Table 2: Comparison of Strategic Focus Areas in this study with Strategic Objectives in the ICOS Impact study.
Strategic Focus Area (this study) Strategic Objective (ICOS Impact Study)
Sustainability Observations: producing standardized high-precision
long-term observational data
Scientific Excellence:
Operating the Research Infrastructure, providing data
and facilitating science
Science: stimulating scientific studies and modelling
efforts and providing a platform for data analysis and
synthesis
Societal Impact:
Knowledge provision to societies
Climate action support: communicating science-based
knowledge towards society and contributing timely
information relevant to the GHG policy and decision
making.
Cooperation:
European and international cooperation
Cooperation: making ICOS the European pillar of a
global in-situ GHG observation system
Innovation:
New technologies and industry cooperation
Innovation: promoting technical developments,
interaction with industry, testing and deployment of
new instruments and techniques
The 21 Key Impact Indicators (see Annex A, pages 21,22; unfortunately called ‘Key Performance Indicators’ there)
identified in the study provide a mix of first and second order effects (see Figures 1 and 3). It’s again important to
note that science is defined as impact of ICOS rather than performed inside ICOS RI: network operations that lead to
precise and meaningful data and their FAIR distribution are the output of the activities of ICOS, measured with KPIs
while the generation of scientific results based on these data are the outcome (first order effect) measured with KIIs.
They are connected via the strategic focus area: scientific excellence.
Page 14 of 22 This project has received funding from the Horizon 2020 under grant agreement No 730944
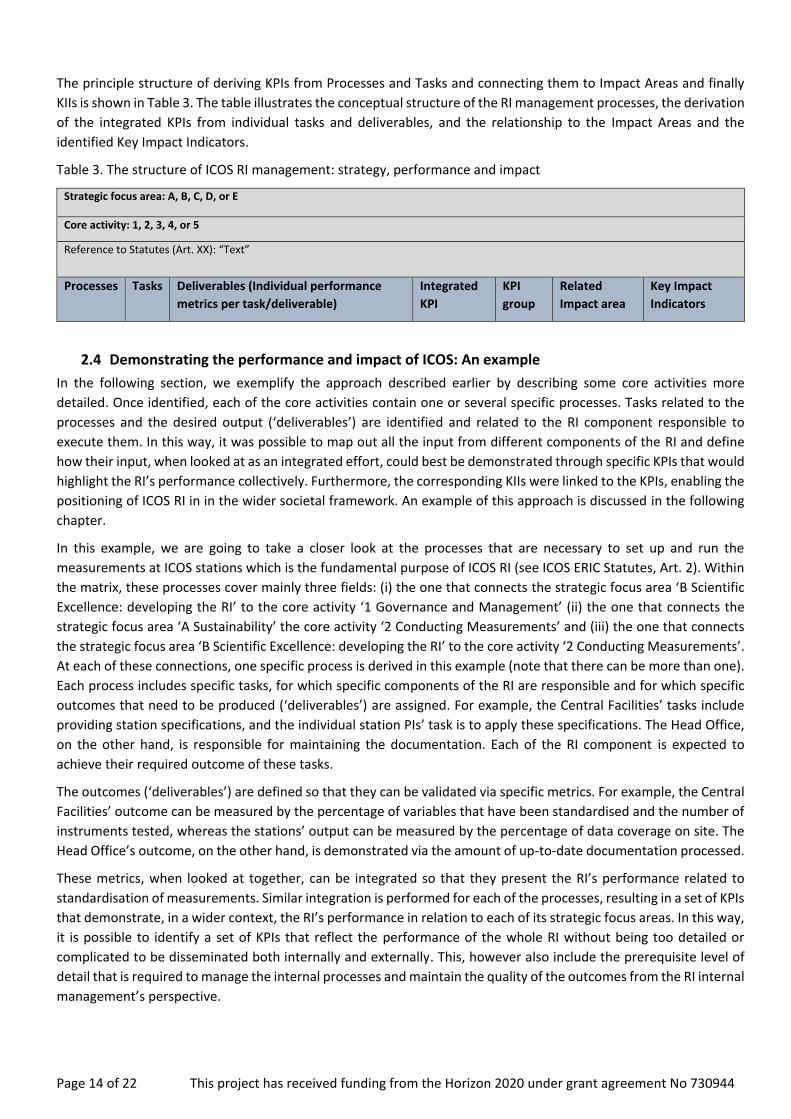
The principle structure of deriving KPIs from Processes and Tasks and connecting them to Impact Areas and finally
KIIs is shown in Table 3. The table illustrates the conceptual structure of the RI management processes, the derivation
of the integrated KPIs from individual tasks and deliverables, and the relationship to the Impact Areas and the
identified Key Impact Indicators.
Table 3. The structure of ICOS RI management: strategy, performance and impact
Strategic focus area: A, B, C, D, or E
Core activity: 1, 2, 3, 4, or 5
Reference to Statutes (Art. XX): “Text”
Processes Tasks Deliverables (Individual performance
metrics per task/deliverable)
Integrated
KPI
KPI
group
Related
Impact area
Key Impact
Indicators
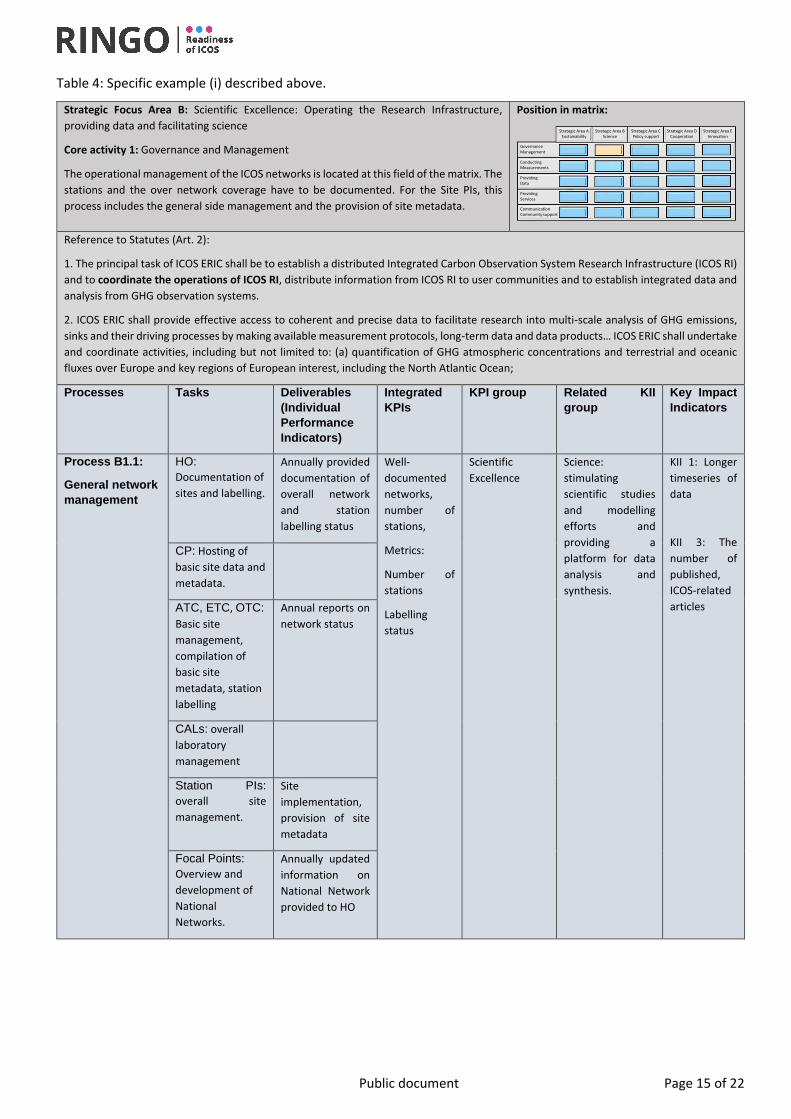
2.4 Demonstrating the performance and impact of ICOS: An example
In the following section, we exemplify the approach described earlier by describing some core activities more
detailed. Once identified, each of the core activities contain one or several specific processes. Tasks related to the
processes and the desired output (‘deliverables’) are identified and related to the RI component responsible to
execute them. In this way, it was possible to map out all the input from different components of the RI and define
how their input, when looked at as an integrated effort, could best be demonstrated through specific KPIs that would
highlight the RI’s performance collectively. Furthermore, the corresponding KIIs were linked to the KPIs, enabling the
positioning of ICOS RI in in the wider societal framework. An example of this approach is discussed in the following
chapter.
In this example, we are going to take a closer look at the processes that are necessary to set up and run the
measurements at ICOS stations which is the fundamental purpose of ICOS RI (see ICOS ERIC Statutes, Art. 2). Within
the matrix, these processes cover mainly three fields: (i) the one that connects the strategic focus area ‘B Scientific
Excellence: developing the RI’ to the core activity ‘1 Governance and Management’ (ii) the one that connects the
strategic focus area ‘A Sustainability’ the core activity ‘2 Conducting Measurements’ and (iii) the one that connects
the strategic focus area ‘B Scientific Excellence: developing the RI’ to the core activity ‘2 Conducting Measurements’.
At each of these connections, one specific process is derived in this example (note that there can be more than one).
Each process includes specific tasks, for which specific components of the RI are responsible and for which specific
outcomes that need to be produced (‘deliverables’) are assigned. For example, the Central Facilities’ tasks include
providing station specifications, and the individual station PIs’ task is to apply these specifications. The Head Office,
on the other hand, is responsible for maintaining the documentation. Each of the RI component is expected to
achieve their required outcome of these tasks.
The outcomes (‘deliverables’) are defined so that they can be validated via specific metrics. For example, the Central
Facilities’ outcome can be measured by the percentage of variables that have been standardised and the number of
instruments tested, whereas the stations’ output can be measured by the percentage of data coverage on site. The
Head Office’s outcome, on the other hand, is demonstrated via the amount of up-to-date documentation processed.
These metrics, when looked at together, can be integrated so that they present the RI’s performance related to
standardisation of measurements. Similar integration is performed for each of the processes, resulting in a set of KPIs
that demonstrate, in a wider context, the RI’s performance in relation to each of its strategic focus areas. In this way,
it is possible to identify a set of KPIs that reflect the performance of the whole RI without being too detailed or
complicated to be disseminated both internally and externally. This, however also include the prerequisite level of
detail that is required to manage the internal processes and maintain the quality of the outcomes from the RI internal
management’s perspective.
Public document Page 15 of 22
Table 4: Specific example (i) described above.
Strategic Focus Area B: Scientific Excellence: Operating the Research Infrastructure,
providing data and facilitating science
Core activity 1: Governance and Management
The operational management of the ICOS networks is located at this field of the matrix. The
stations and the over network coverage have to be documented. For the Site PIs, this
process includes the general side management and the provision of site metadata.
Position in matrix:
Reference to Statutes (Art. 2):
1. The principal task of ICOS ERIC shall be to establish a distributed Integrated Carbon Observation System Research Infrastructure (ICOS RI)
and to coordinate the operations of ICOS RI, distribute information from ICOS RI to user communities and to establish integrated data and
analysis from GHG observation systems.
2. ICOS ERIC shall provide effective access to coherent and precise data to facilitate research into multi-scale analysis of GHG emissions,
sinks and their driving processes by making available measurement protocols, long-term data and data products… ICOS ERIC shall undertake
and coordinate activities, including but not limited to: (a) quantification of GHG atmospheric concentrations and terrestrial and oceanic
fluxes over Europe and key regions of European interest, including the North Atlantic Ocean;
Processes Tasks Deliverables
(Individual
Performance
Indicators)
Integrated
KPIs
KPI group Related KII
group
Key Impact
Indicators
Process B1.1:
General network
management
HO:
Documentation of
sites and labelling.
Annually provided
documentation of
overall network
and station
labelling status
Well-
documented
networks,
number of
stations,
Metrics:
Number of
stations
Labelling
status
Scientific
Excellence
Science:
stimulating
scientific studies
and modelling
efforts and
providing a
platform for data
analysis and
synthesis.
KII 1: Longer
timeseries of
data
KII 3: The
number of
published,
ICOS-related
articles
CP: Hosting of
basic site data and
metadata.
ATC, ETC, OTC:
Basic site
management,
compilation of
basic site
metadata, station
labelling
Annual reports on
network status
CALs: overall
laboratory
management
Station PIs:
overall site
management.
Site
implementation,
provision of site
metadata
Focal Points:
Overview and
development of
National
Networks.
Annually updated
information on
National Network
provided to HO
GovernanceManagement
ConductingMeasurements
Providing Data
Providing Services
CommunicationCommunity support
Strategic Area BScience
Strategic Area CPolicy support
Strategic Area DCooperation
Strategic Area EInnovation
Strategic Area ASustainability
Page 16 of 22 This project has received funding from the Horizon 2020 under grant agreement No 730944
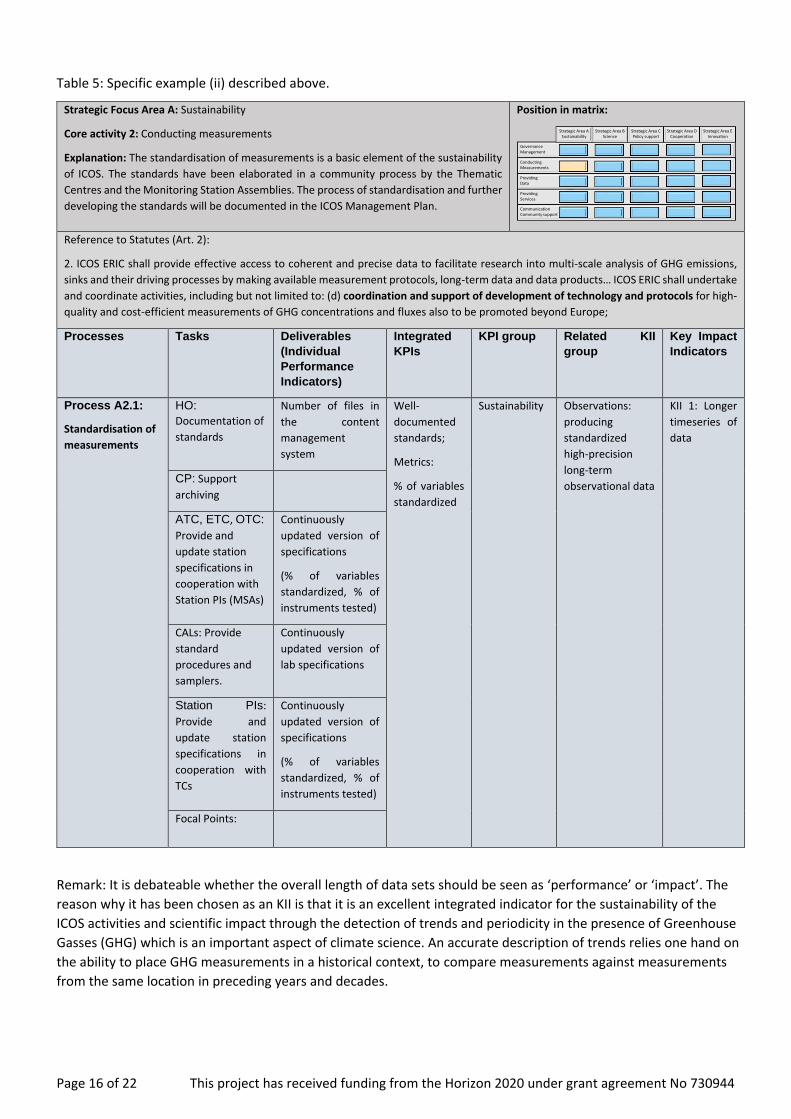
Table 5: Specific example (ii) described above.
Strategic Focus Area A: Sustainability
Core activity 2: Conducting measurements
Explanation: The standardisation of measurements is a basic element of the sustainability
of ICOS. The standards have been elaborated in a community process by the Thematic
Centres and the Monitoring Station Assemblies. The process of standardisation and further
developing the standards will be documented in the ICOS Management Plan.
Position in matrix:
Reference to Statutes (Art. 2):
2. ICOS ERIC shall provide effective access to coherent and precise data to facilitate research into multi-scale analysis of GHG emissions,
sinks and their driving processes by making available measurement protocols, long-term data and data products… ICOS ERIC shall undertake
and coordinate activities, including but not limited to: (d) coordination and support of development of technology and protocols for high-
quality and cost-efficient measurements of GHG concentrations and fluxes also to be promoted beyond Europe;
Processes Tasks Deliverables
(Individual
Performance
Indicators)
Integrated
KPIs
KPI group Related KII
group
Key Impact
Indicators
Process A2.1:
Standardisation of
measurements
HO:
Documentation of
standards
Number of files in
the content
management
system
Well-
documented
standards;
Metrics:
% of variables
standardized
Sustainability Observations:
producing
standardized
high-precision
long-term
observational data
KII 1: Longer
timeseries of
data
CP: Support
archiving
ATC, ETC, OTC:
Provide and
update station
specifications in
cooperation with
Station PIs (MSAs)
Continuously
updated version of
specifications
(% of variables
standardized, % of
instruments tested)
CALs: Provide
standard
procedures and
samplers.
Continuously
updated version of
lab specifications
Station PIs:
Provide and
update station
specifications in
cooperation with
TCs
Continuously
updated version of
specifications
(% of variables
standardized, % of
instruments tested)
Focal Points:
Remark: It is debateable whether the overall length of data sets should be seen as ‘performance’ or ‘impact’. The
reason why it has been chosen as an KII is that it is an excellent integrated indicator for the sustainability of the
ICOS activities and scientific impact through the detection of trends and periodicity in the presence of Greenhouse
Gasses (GHG) which is an important aspect of climate science. An accurate description of trends relies one hand on
the ability to place GHG measurements in a historical context, to compare measurements against measurements
from the same location in preceding years and decades.
GovernanceManagement
ConductingMeasurements
Providing Data
Providing Services
CommunicationCommunity support
Strategic Area BScience
Strategic Area CPolicy support
Strategic Area DCooperation
Strategic Area EInnovation
Strategic Area ASustainability
Public document Page 17 of 22
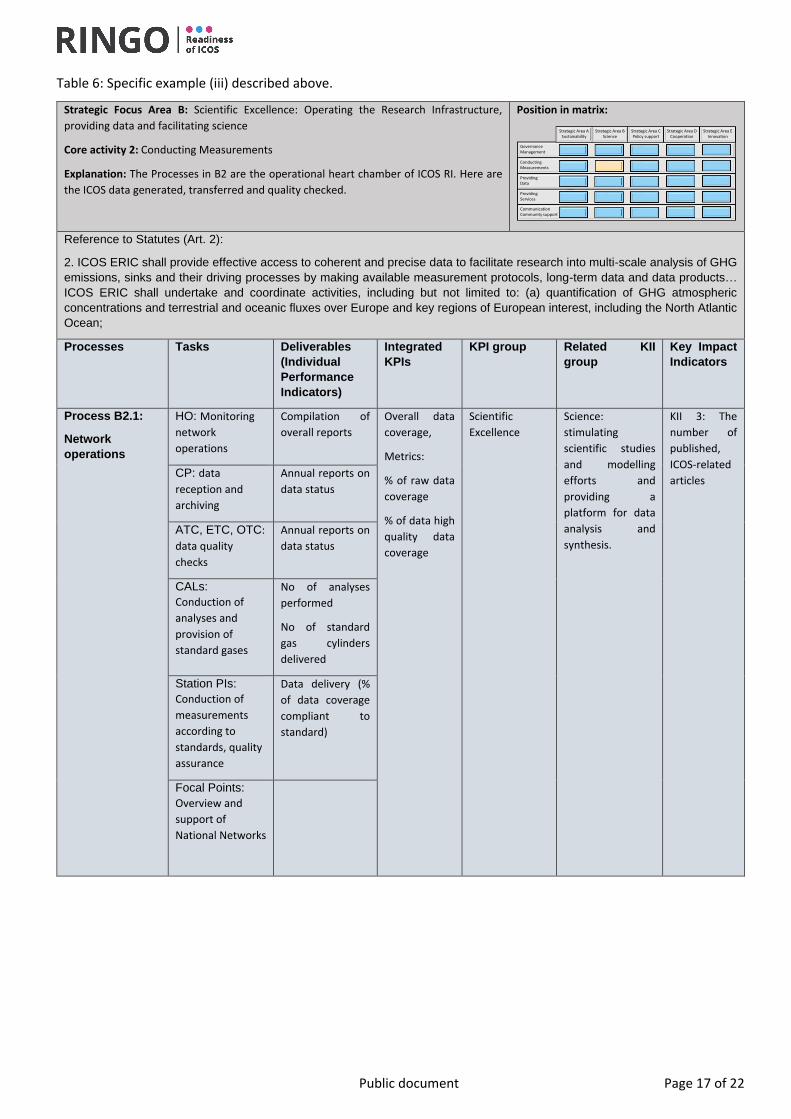
Table 6: Specific example (iii) described above.
Strategic Focus Area B: Scientific Excellence: Operating the Research Infrastructure,
providing data and facilitating science
Core activity 2: Conducting Measurements
Explanation: The Processes in B2 are the operational heart chamber of ICOS RI. Here are
the ICOS data generated, transferred and quality checked.
Position in matrix:
Reference to Statutes (Art. 2):
2. ICOS ERIC shall provide effective access to coherent and precise data to facilitate research into multi-scale analysis of GHG
emissions, sinks and their driving processes by making available measurement protocols, long-term data and data products…
ICOS ERIC shall undertake and coordinate activities, including but not limited to: (a) quantification of GHG atmospheric
concentrations and terrestrial and oceanic fluxes over Europe and key regions of European interest, including the North Atlantic
Ocean;
Processes Tasks Deliverables
(Individual
Performance
Indicators)
Integrated
KPIs
KPI group Related KII
group
Key Impact
Indicators
Process B2.1:
Network
operations
HO: Monitoring
network
operations
Compilation of
overall reports
Overall data
coverage,
Metrics:
% of raw data
coverage
% of data high
quality data
coverage
Scientific
Excellence
Science:
stimulating
scientific studies
and modelling
efforts and
providing a
platform for data
analysis and
synthesis.
KII 3: The
number of
published,
ICOS-related
articles CP: data
reception and
archiving
Annual reports on
data status
ATC, ETC, OTC:
data quality
checks
Annual reports on
data status
CALs:
Conduction of
analyses and
provision of
standard gases
No of analyses
performed
No of standard
gas cylinders
delivered
Station PIs:
Conduction of
measurements
according to
standards, quality
assurance
Data delivery (%
of data coverage
compliant to
standard)
Focal Points:
Overview and
support of
National Networks
GovernanceManagement
ConductingMeasurements
Providing Data
Providing Services
CommunicationCommunity support
Strategic Area BScience
Strategic Area CPolicy support
Strategic Area DCooperation
Strategic Area EInnovation
Strategic Area ASustainability
Page 18 of 22 This project has received funding from the Horizon 2020 under grant agreement No 730944
2.5 Critical reflection
The mission (statutes) and the strategy are key for the identification and understanding of the performance and the
impacts generated by research infrastructures. In describing the RI operations from the task level to the output level,
and linking the outputs to the different orders of outcome, and simultaneously maintaining the alignment to the
mission and strategy structure, it becomes possible for the different actor groups (especially to the internal RI
operators and national stakeholders, as well as external bodies involved in the RI landscape evaluations) to recognise
the areas in the RI’s operations that correspond to the groups’ interests, needs and expectations. Opportunities to
influence the way the RI is operating and the areas, where their specific outputs generate impact that is relevant to
them also become visible. Thus, this approach verifies the overall RI management in defining priorities in a
transparent and strategic way.
One of the most crucial perspectives of this exercise is the recognition to be able to maintain such a structure and
the related monitoring and evaluating exercises, the clarity and relevance of the structure is necessary to be
commonly known, understood, justified and accepted among the whole RI community to be committed to it. It does
not serve a purpose to just implement a complex structure and expect the community to comply with it. Mapping
out the RI operations on task level and gradually expanding the view to the strategy- and societal levels enables the
different components of the RI to position themselves in a number of wider frameworks: not only within the RI and
its domains, but also nationally and globally. This, in turn, facilitates the comprehension of the relevance of the RI
and further fosters a motivated, committed and competent community. However, the resulting positioning and RI-
wise understanding of a common agenda requires trustworthy communication.
3. RECOMMENDATIONS AND DISCUSSION
3.1 Recommendations for a comprehensive performance and impact evaluation of environmental
RIS
Hence, we recommend that the RI’s Performance and Impact are to be kept together by linking both sets of indicators
to the wider strategic context of an RI, as well as to the strategic and political context of the EC, ESFRI and ERA.
Specifically, we recommend that:
1. The type (single-sited or distributed) of the Research Infrastructure is the key starting point: this defines
approaches needed to start mapping out the performance and societal impact of the RI. In the case of a
distributed RI, several entities are contributing to the performance and impact – ranging from institutions
governed by differing national legislations to varying types of research cultures and societal needs. This
means that the set of governing documents that are required vary considerably – it is important to identify
all the necessary scopes in which the performance and impact need to be considered.
2. The field of the RI is also crucial – despite the benefits of administering all pan-European RIs in a somewhat
corresponding manner, it is clear that the scientific fields and subsequent societal missions of the RIs differ
considerably. It is, hence, crucial to elaborate on the specificity of the RI’s field when addressing what is
considered as its ‘impact’ and ‘performance’. It is useful to demonstrate this e.g. through specific case studies
that elaborate the research landscape and methodologies behind the RI as compared to other RIs. If possible,
it would be extremely useful to conduct a landscape exercise on methodologies behind the different types
of RIs – this would further highlight and elaborate the most common differences in approaches between the
RIs and explain why it is not possible to apply a ‘one size fits all’-approach to all RIs.
3. It is crucial to differentiate between performance and impact. While similar in nature and often described
together, these two concepts differ considerably from management’s perspective: performance can be used
to describe and measure how well the RI is fulfilling the mission set out in its statutes, while impact can
describe and measure the RI’s relevance and role in a wider societal framework, e.g. in the European
Public document Page 19 of 22
Research Landscape (ERA), in society(ies) in general, or in a global RI – and societal landscape. Hence, the
recommendation is to clearly differentiate between performance and impact and demonstrate the RI’s
relevance via both indicators (KPIs and KIIs).
4. The time span within which performance and impact are considered can vary tremendously between
different type of RIs. While it is sometimes clearly visible that action A produces output B and this, in turn,
the outcome C. This can take several years or even decades in the case of e.g. environmental RIs. Hence, it is
important to recognise the importance of clearly defined timeframes for measuring performance and
especially impact, and to differentiate between primary and secondary impact.
5. The mission and strategy of an RI needs to be well elaborated and communicated before any performance
and impact related requirements are drawn together and implemented as part of the management plan. For
any types of reporting, justification or dissemination purposes, a well-structured strategy and
correspondingly described activities and process- and task descriptions form the backbone for KPI and KII
definitions and facilitate the comprehension of the role and position of the RI in both European and global
contexts. This facilitates efficient management, reporting and demonstration of impact and performance.
6. The positioning of the RI in the wider European RI landscape and also in relation to the EC, ESFRI and ERA
needs to be taken into account when establishing how the performance and impact of the RI are approached.
It may be beneficial to differentiate between several levels of ‘performance’ and ‘impact’ when looking at
the RI’s operational ability. On one hand, the internal operators running the RI need to be able to see that
the rudimentary operations are functioning towards fulfilling the RI’s operational potential. On the other
hand, the RI also needs to fit into the wider strategic frameworks set by the EC, ESFRI and ERA and be able
to demonstrate its significance within these frameworks.
3.2 ESFRI Working Group report on monitoring of Research Infrastructure Performance – a
commentary
In autumn 2019, ESFRI, following a mandate from Competitiveness Council of 29 May 2018, reported the work done
in working group on monitoring of Research Infrastructures performance and established that a common set of KPIs
for all European Research Infrastructures would be beneficial in the context of the periodic reviews of ESFRI
Landmarks, and that the KPIs would benefit funding authorities and stakeholders (Report of the ESFRI Working Group
on monitoring of Research Infrastructures performance, 2019). The report states that the suggested KPIs were
‘developed to address the most commonly held objectives of pan-European RIs’.
This brings us directly to some of the problems voiced during the workshops that the ESFRI working group held
together with representatives from several European RIs and via rounds of feedback gathered via questionnaires.
While the idea of a common set of KPIs was received with a careful acceptance among the RIs, several challenges to
the common approach were identified, highlighting the importance of a clearly defined context – for what purpose
are these KPIs used? While they would, perhaps, tell existing or potential funders and stakeholders certain things
about the quality of the RI, and the EC about how well the RI is fitting into the EC’s strategic objectives related to the
RIs in general, they would likely fail to explain about the actual operational performance and the quality of
management of an RI and the subsequent sustainability of it – specifically as not all RIs generate knowledge capital
that is straightforwardly measurable in numeric values. The subsequent measuring of an RIs socio-economic impact
would also not be straightforwardly derivable from this approach.
Hence, the ontology of these common KPIs still requires to be clarified in more detail: Why and for whom do they
exist, and in what categories should they be understood - in the context of individual RIs, pan-European RIs, the EC,
ESFRI, or ERA in general? Should they be seen as general, broad representatives of RI-specific, integrated KPIs that
have been developed in the specific context of each RI, and used for monitoring the RI’s performance on a level that
Page 20 of 22 This project has received funding from the Horizon 2020 under grant agreement No 730944
can be aligned with the EC’s and ESFRI’s strategic goals? This could be one possibility, taking into account the several
concerns about the common approach potentially lacking the ability to accommodate the specificities of each
individual RI’s operational purposes and would, essentially, be seen as a comparing tool with which RIs would end up
being positioned against each other rather than being individually important parts in contributing to the competence
of the pan-European RI landscape.
Furthermore, the KPIs include a number of concepts that are seemingly clear, but would still need clearer
contextualisation. Data, for example, being the main product of the RIs, can have a plethora of definitions, especially
when looked at against the RI landscape – the data produced is highly interdisciplinary and hence subjected to
different methods of collecting, measuring and interpreting it. Most RIs would, of course, have a KPI or KPIs related
to its data – but ‘data’ is one of the most challenging entity to generalise into a KPI that could be used as an indicator
of the performance of RIs in general; especially as RIs are at different stages of operational maturity with some
already producing data and engaging a wide user community, and others preparing for their data releases. It is also
crucial to recognise that due to the interdisciplinary domains of the RIs, some types of data produced by the RIs can
be used sooner and more readily by policy-makers, while other types of data will take longer to be made into policy-
relevant data products.
Similar question about contextualisation is related to ‘international co-operation’ – on what scale should this be
understood? Are internationally distributed RIs engaging in international cooperation by default, or would their
operations be considered international only if they cooperated globally? On what scales would single-sited RIs’ be
required to invest in international co-operation? Another concept that would need a clear contextualisation is related
to ‘industry’. While the report suggests a KPI on facilitating economic activities, it does not take into account the fact
that some RIs are not allowed to generate revenue, and that collaborating with industry can take several forms – the
RI or the industry partner could, for example, be a collaborator, beneficiary, customer, service provider or a co-
founder. These examples highlight the need to recognise the contexts of individual RI’s in terms of their own strategic
goals and missions, maturity and operational landscape.
Taking into account all of the above, it is clear that the individual RI identity, observed by the members of the RI, is
tremendously important to recognise and preserve. The work done by scientific and other expert communities
involved in building the RIs has been not only scientifically specific, but also community-specific. It is, hence, natural
to express concerns over lost identities and the emerging of generalising comparisons ‘from above’, as well as
concerns over the implications of such potential comparisons in terms of e.g. funding and other resources available.
While it is, nonetheless, important to harmonise the pan-European RI landscape into a capable, agile and highly
expert body in the wider global RI landscape, this cannot be done at the expense of individual RIs losing their sense
of specificity. While this has been discussed extensively between the ESFRI and the RIs and it has been expressed
that RIs could choose to not include KPIs that are not helpful, fit-for-purpose nor useful to represent and measure
their performance, and could also formulate their own rationales for the metrics they want to use, or even include
their own indicators. One solution could be to agree on common general, wider KPI groups, under which each RI
could formulate their own performance metrics and their rationales that would be exclusively aimed at enabling their
performance monitoring on the wider EC / ESFRI level. Those KPIs would, essentially, need to be derived from more
specific internal, integrated KPIs from within the RI.
In discussing the common KPI system for RIs, another set of valid criticism aroused, once more related to definitions.
While certain activity can be seen as performance in one RI’s context, the same activity would essentially be
considered as impact in other RIs’ context. This highlights the importance of defining the context to the forefront and
calls for further analysis into the RI landscape and the ways their performance and impact should be understood,
measured and increased.
Public document Page 21 of 22
ACRONYMS AND ABBREVIATIONS
ATC Amosphere Thematic Centre coordinates the atmospheric measurement network of ICOS
CALs The Central Analytical Laboratories are one of the ICOS - Central Facilities that support the monitoring
activities of the observational networks. CALs include several laboratories i.e. The Flask and Calibration
Laboratory in Jena, Germany, which performs analysis of greenhouse gas concentrations and of other
tracers that carry auxiliary information on the origin of the air samples (CO2 stable isotope
composition, O2 level, additional gases) and produces calibrated real air reference gases and provides
support on the material used in the continuous in-situ measurements performed at the monitoring
stations. Whilst, the Central Radiocarbon Laboratory (CRL ☛) in Heidelberg provided radiocarbon
content of CO2 in air samples and develops methods to derive the fossil fuel contribution to
atmospheric CO2.
CP Carbon portal. The conbined real and virtual data centre in which ICOS observational and elaborated
data products and associated metadata are stored, archived, accessed and curated.
EC European Commission
ERA European Research Area
ESFRI the European Strategy Forum on Research Infrastructures, is a strategic instrument to develop the
scientific integration of Europe and to strengthen its international outreach. The competitive and open
access to high quality Research Infrastructures supports and benchmarks the quality of the activities
of European scientists, and attracts the best researchers from around the world.
ETC Ecosystem Thematic Centre of ICOS.
FAIR Findable, Accessible, Interoperable and Re-usable. The FAIR data principles published in 2016 by
Force11. The Council of the European Union emphasises that “the opportunities for the optimal reuse
of research data can only be realised if data are consistent with the FAIR principles within a secure and
trustworthy environment” (Council conclusions on the transition towards an open science system).
GHG Green House Gases (CO2, NH4, N3)
HO Head Office. The operational unit in which work the administrative staff in charge of supporting the
Director General in ICOS ERIC’s day-to-day management and that is mainly located in the premises of
the statutory seat but may also have components in other countries.
ICOS Integrated Carbon Observation System.
ICOS ERIC Integrated Carbon Observation System European Research Infrastructure Concortium.
ICOS RI Integrated Carbon Observation System Research Infrastructure. The distributed research
infrastructure that is coordinated by ICOS ERIc and involves Central Facilities and ICOS NNs.
KPI Key Performance Indicator
KII Key Impact Indicators
OTC Ocean Thematic Centre is the operational element of Marine ICOS, the network of observing platforms
(VOS, fixed stations and repeat hydrography) represented in the Monitoring Station Assembly, deliver
its core mission of providing the data needed to quantify the changing role of the ocean in the global
carbon cycle.
PI principal Investigator
RI Research infrastructure

Page 22 of 22 This project has received funding from the Horizon 2020 under grant agreement No 730944
RINGO is a 4-year H2020 project to enhance the Readiness of ICOS for Necessities of Integrated Global
Observations' with a total budget of 4,719,680.00 euros. RINGO has 43 partners in 19 countries and
consists of 5 work packages (scientific-, geographic-, technological-, data and political & administrative
readinesses) with specific emphasis on the further development of the readiness of ICOS Research
Infrastructure (ICOS RI) to foster its sustainability.
SFA Strategic Focus Areas
ANNEXES
Annex A. ICOS Impact Analysis
Annex B. ICOS Strategy document approved by the 7. General Assembly in November 2018
ICOS Impact Assessment: Methods Report
i
August 2018
ICOS Impact Assessment Report
ICOS Impact Assessment Report
technopolis |group| August 2018
Janna van Belle Joost van Barneveld – Biesma Veerle Bastiaanssen Alexander Buitenhuis Lisanne Saes Geert van Veen
Executive summary The findings in this report are the outcome of an unbiased evaluation of the ICOS ERIC by Technopolis during the six- month period January-June 2018. This report communicates the findings of the baseline study for ICOS’ performance on achieving its strategic objectives, which have been operationalised in 17 distinct Key Performance Indicators (KPI). We have structured the executive summary along the strategic objectives and report our findings for each of the KPIs separately. Overall, our findings support the conclusion that ICOS generally realises their mission: on three of the five parts of its strategic objectives ICOS is already able to realize to larger extent, namely in producing standardized high-precision long-term observational data, in stimulating scientific studies and modelling efforts and providing platform for data analysis and synthesis, and in being a European pillar of a global GHG observation system. On two out of five parts, communicating science-based knowledge towards society and contributing timely information relevant to the GHG policy and decision-making, and promoting technical developments, realization of its mission is still under development, and already achieved to some extent.
Producing standardized high-precision long-term observational data ICOS improves the quality, spatial resolution and time series length of GHG observations by 1) enabling the combination of different data sets from different countries and across the atmosphere, ecosystem and ocean domain; 2) providing certainty for measurement stations to operate longer than the time horizon of (often) single operating personnel as it gives measurement sites an institutional basis, and 3) setting a (high) level of standardisation. This, together with the generally observed increase in data quality that is attributed to ICOS, is acknowledged and rewarded by member states contributing to ICOS, resulting in prolonged site operation as funding is secured for longer time periods.
ICOS has since its inception made a significant contribution to the European and the global climate science community by:
• Increasing the volume of data available
• Greatly enhancing the measurement and data quality of many measurement sites that lacked knowledge, funds or instruments to meet ICOS standards. Of the 134 ICOS measurement stations, 48 stations are currently in the last step of the evaluation process, and 17 stations hold the status of an official ICOS station.
• Improving access to data and data uniformity throughout its network
• Developing measurement standards and protocols
• Providing reference samples through central analytical facilities Even though ICOS has only recently started to provide data from ICOS labelled stations there is already a large number of researchers who indicate that they make use of ICOS services. This statement is also supported by the global coverage of IP addresses accessing ICOS data.
Stimulating scientific studies and modelling efforts and providing platform for data analysis and synthesis A baseline bibliometric analysis of ICOS publications was performed and, the analysis being a baseline, it is not possible to discuss trends or relative performance. The study should mention that future bibliometric work, and to a large extent generating evidence for the performance of ICOS on this strategic objective, will benefit from a less voluntary, stricter reference regime for papers using ICOS originating data. At the time of writing, there exists a well-defined DOI minting process, and a regime to improve adherence to this process is still under development. Results from the bibliometric analysis
show that ICOS originating papers have the potential to be widely cited. In addition, possibly because of the breadth of ICOS covering ocean, atmosphere and land-based observations, ICOS originating publications cover a large variety of different journals. While this is good for exposure, it prohibits effective measurement of the impact factor.
Many scientists we interviewed argued that the combination of ocean, atmosphere and ecosystems data and their measurement/analysis communities provides added value. This added value lies in connecting the previously separated domains, making cross-comparisons possible and sprouting original research ideas.
ICOS provision of analytics and synthesis services can also be measured by the provision of data products. ICOS is the main European provider to the globally used OBSPACK, Carbontracker and Globalviewplus products, that are integrally used in (inverse) modelling by the global climate modelling community.
ICOS also provides physical services through the thematic centres and the central analytical facilities (CAL). These are widely used and the CAL is gaining importance in the global reference sample network, being second to only one other institution, NOAA, which has carried out this role for decades.
Communicating science-based knowledge towards society and contributing timely information relevant to the GHG policy and decision-making AltMetric data show that ICOS related publications catch attention inside and outside of the scientific domain. Evidence shows that ICOS contributes data to a number of organizations which use (inverse) modelling to provide information directly to policy makers, among them the World Meteorological Organisation (WMO) with the Global Atmosphere Watch (GAW) program and the Integrated Global Greenhouse Gas Information System (IG3IS) program, the Global Carbon Project (GCP), the Global Climate Observation System (GCOS) and the Group on Earth Observation (GEO). Furthermore, ICOS has provided information directly to the United Nations Framework Convention on Climate Change (UNFCCC) during COP1 21-23). ICOS has recently been admitted as observer organization for the COP, which means they can send representatives to attend any sessions or meetings. The provision of data is essential for developing models and subsequent insights that are relevant to policy makers. Indeed, although currently the data that ICOS RI provides are in such a format that they are primarily used by climate scientists, there is an explicit expectation from stakeholders that ICOS contributes to better decisions by means of better data.
At this time, we have only been able to substantiate this claim with references to articles that pre-date ICOS, because the most recent Assessment Report published by the IPCC dates from 2013. As such it does not (and cannot) refer to official ICOS data, only the pre-ICOS data. We do know that current ICOS related information feeds into the right bodies and expect ICOS references in future IPCC publications. Indeed, a vast majority of interviewees feel that there will be a step change in the impact of publications based on ICOS data when these will be based on ICOS data from certified measurement stations.
ICOS shows regular (conventional) media coverage in at least 10 countries, with a second highest score of coverage in the United States. On social media, ICOS performs best with the ICOSscapes campaign on Instagram. Collaborations with ICOS can sometimes lead to media coverage that is valued by scientists.
ICOS also reaches primary- and secondary school audiences, mostly through local researchers. Over 1/2 of them gave public lectures outside academia and a similar fraction reached mainstream media or popular science. Almost 1/3 of researchers gave lessons at a primary or secondary school about ICOS –
1 COP (Conference of the Parties) is the supreme decision-making body of the UNFCCC. It brings together representatives of all those countries that have signed and ratified the UN Framework Convention on Climate Change (UNFCCC).
all of these fractions did so often or “a few times”. This conclusion is supported by the results of the survey, where a majority of the participants is convinced (80%) that ICOS will lead to an improved quality of decision making on CO2 -relevant topics.
ICOS also has a unifying effect on the governmental levels by means of science diplomacy. An international collaboration like ICOS brings together not only scientists but also representatives of environment-related ministries that participate. The fact that there is a high level of rigor and organization in the production of data sends a clear message to stakeholders that there is a broader vision than one project or even national strategy. Interviewees external to ICOS member states mention the fact that countries from the EU have successfully come together to make a joint observation facility should not be underestimated, and that getting people on the same page is very important and non-trivial.
Promoting technical developments Technical developments can be understood as “software” in the form of technical protocols for measurement and data administration, as well as hardware for measuring data and acquiring samples.
In both respects, our findings suggest that ICOS has made a positive contribution to both the European and the global measurement standards. For what concerns protocols and technical standards, 68% of the survey respondents argued that ICOS has to a large extent been successful in coordinating and developing protocols for measurements of GHG concentration and fluxes. ICOS, as one of the largest single procurers of GHG measurement instruments, can set demands for instruments because of the promise of volume of sold devices for those who comply. In addition, complying with ICOS standards is advertised by suppliers as a seal of quality. Instrument makers expect that this influence will only increase as ICOS data starts flowing more steadily in the near future, as this causes increased exposure.
Finally, although one third of the survey respondents indicate that collaborating with ICOS has led to new or improved instruments or other hardware, at this point in time this has led to a very limited number of public-private partnerships.
ICOS as the European pillar of a global GHG observation system ICOS has successfully placed itself in the international Climate Science, primarily as a provider of excellent data. In this role, ICOS is well connected to global scientific bodies such as the WMO, IG3IS, GCOS and NOAA in the US, as well as to global data initiatives such as FLUXNET or SOCAt2.
As it connects well to other European climate science projects and other (ESFRI) Environmental Research Infrastructures, ICOS has achieved a core position as European pillar of a global GHG observation system. In addition, ICOS successfully gathers new or renewed funding commitments from European member states, which is an indicator for their relevance as perceived by stakeholders -those external to ICOS or climate science. The RINGO project3, which successfully binds 43 partners across 19 countries to ICOS RI and connects them with each other, is a good example of this.
ICOS’ value to the research community is more directly captured by the success of the bi-annual science conference organised by ICOS. This conference is attended by both European researchers (on average 90% of the participants is associated with a European research institute) and researchers from around
2 World Meteorological Organisation (WMO) Integrated Global Greenhouse Gas Information System (IG3IS) and Global Climate Observing System (GCOS) National Oceanic and Atmospheric Administration (NOAA), Surface Ocean CO₂ Atlas (SOCAt). Also see glossary, appendix C. 3 The Readiness of ICOS for Necessities of Integrated Global Observations (RINGO project is a 4-year H2020 project with a total budget of 4,719,680.00 euros with specific emphasis on the further development of the readiness of ICOS Research Infrastructure (ICOS RI) to foster its sustainability.
the world (on average 10% of the participants has an affiliation outside Europe). Over the past 6 years, this conference has developed a stable attendance pattern of on average 200 participants from more than 20 countries who attend each conference.
ICOS relatively young age, combined with its distributed nature, poses a challenge to achieving both a global presence and a clear position within Europe. Although ICOS is unique in providing integrated and standardized data, it is not a European climate science research institution, and doesn’t aim to be a research institute either. It consists of contributions from about 70 research institutions which all have their own scientific profiles and themselves are evaluated for their performance and impact- independent of ICOS. This raises two challenges: (1) the contributing organisations need incentives to invest into ICOS and (2) ICOS needs a position that is not perceived as competition by its host institutions. The latter conflict is also seen from outside: members from international panels mentioned that it is currently not always clear who is the best party to deal with: a constituent institution or ICOS ERIC? Careful consideration of the ICOS role is therefore necessary. ICOS can claim a place in the global climate science field as a representative of 70 European research institutes; however, to do so it needs to earn this role through thorough internal discussion that leads to an endorsement of this role by these participating organisations.
Conclusions This is the first impact assessment of a distributed environmental research infrastructure. The methodology we used, and pitfalls that we encountered, can inform future impact evaluations of this type. Although there are many variables that affect impact, such as size, level of distribution and field of research, we found that the high level of internal organisation in ICOS was a key factor in its ability to reach its aims.
Although in many cases it is too early to review quantitative evidence of the impact that ICOS has generated, this study has gathered a substantial base of qualitative evidence for ICOS’ impacts. Together with the available documentation and survey results it paints a picture of a research infrastructure that is highly relevant within the European GHG research community. It has obtained this position for an important part through the successful implementation of measurement protocols throughout the research infrastructure, and its ability to provide datasets of consistently high quality.
One of the core tasks of ICOS since the start has been, and still is, the development of the standardization requirements of the National Networks. Although many stations are still awaiting approval, the first stations that have undergone the station labelling process have now received the status of an official ICOS station, and are publishing data through the CP. Despite the long duration of this process, and the fact that data are only now becoming available, scientist working with ICOS are very positive about the improvements in data quality that ICOS has brought about: not only the quality of the physical measurements done by the measurement stations, but also to the transparency of the data processing chain, and reliability of the data quality. According to scientist themselves improvements in data quality and the harmonising of data processing protocols across measurement stations are already improving the quality of scientific output. With the projection that by the end of 2019, 80-90 % of the stations will be labelled, the focus of the thematic centres is expected to shift more and more towards the further development of the ICOS RI, through data analysis and providing support to the national networks. In many cases this is a desired development for the scientist involved.
Despite the clear narrative on ICOS scientific impact, is was not possible to measure this using traditional methods like bibliometrics of academic publications. This is a direct consequence of the fact that official ICOS data have only very recently become available, and that the impact of academic publications occurs with a time lag. The bibliometric analysis that was performed using publications which predate the ICOS ERIC indicate the high potential that regularly updated ICOS data from ICOS certified stations has, both inside and outside the academic world. The fact that there is a high uptake of ICOS’ data-related services and global data products, even in the absence of ICOS-certified measurements suggest that ICOS fulfils a need in providing a platform for data analysis. The DOI
minting process recently implemented by ICOS should improve attribution to ICOS both in academic publications and can potentially be used to improve attribution to ICOS data products, provided that this process is adequately implemented.
ICOS effectiveness to unify the European climate science field has also had effects on innovation and R&D. These originate mostly from the fact that ICOS is a single large procurer with high demands. Suppliers of sensors and other measurement instrumentation mention that being an ICOS client counts as a sort of quality certificate. Upstream economic impacts in the way of investments mobilized by ICOS are significant and are primarily related to country contributions, 90% of which is used for national network development and further development of central facilities.
ICOS is firmly integrated in the European research infrastructure landscape, certified by the large number of joint research activities with other RIs, and the use of various methods and practices developed by ICOS in other research infrastructures. At the same time ICOS is involved in a wide range of projects with a global coverage. The large number of services and collaborations linked to global projects is testimony of the fact that the data gathered by ICOS have added value to the research community beyond the ICOS members.
The combination reliable high-quality data on GHG, pan-European coverage and the presence of a research community means that ICOS data, even in their early stage, are already used by various communities and organizations who provide information to policy makers. The ‘contribution of timely information relevant to the GHG policy and decision making’ is one of ICOS’ explicit aims, and at the same time an example of an outcome where it is very difficult, if not impossible to attribute impact to ICOS. The narrative is that knowledge about the what type of information is required to reach decision makers, about where ICOS data can contribute to improve policy decisions, and about what the current visibility is of ICOS, is crucial help to monitor ICOS’ relevance to climate action support. One example of this is the Fifth Assessment Reports (AR5) of the IPCC, where ICOS contributed to several datasets. In addition, the report makes the explicit recommendation to use longer timeseries in the estimation of changes in atmospheric concentrations of GHG. ICOS can deliver these data, and thus this can be read as a clear mandate for ICOS to produce this type of data.
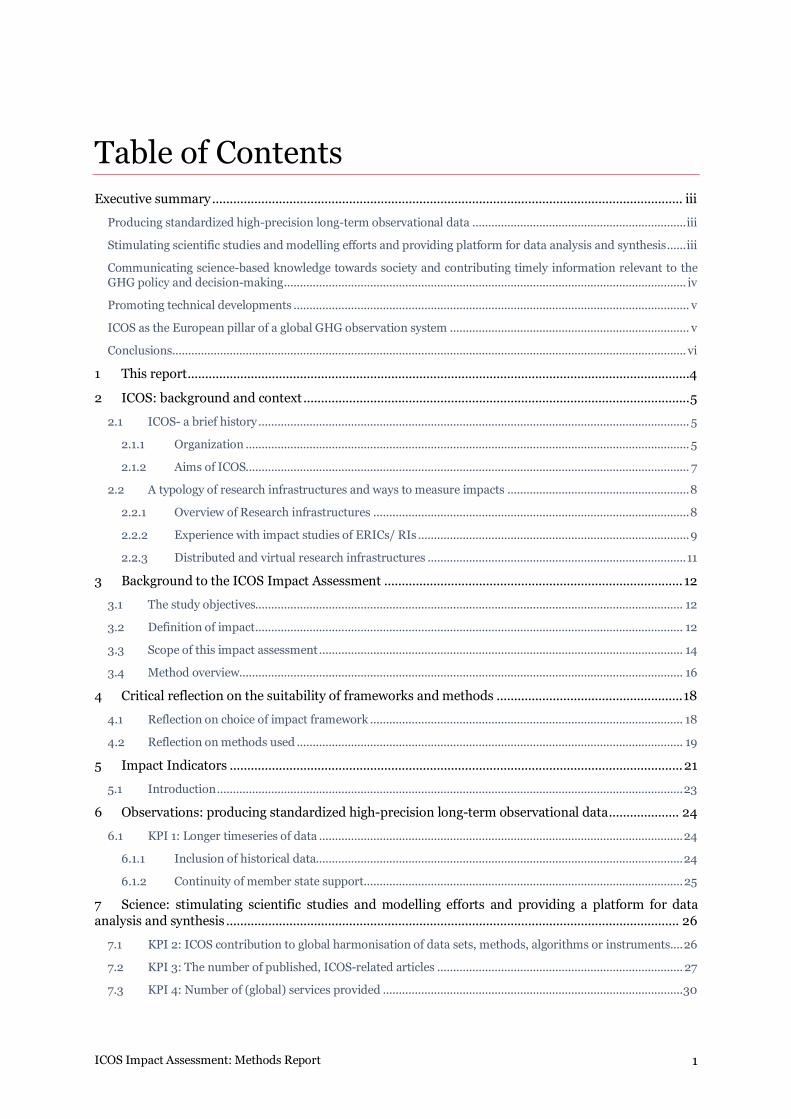
ICOS Impact Assessment: Methods Report
1
Table of Contents Executive summary ...................................................................................................................................... iii
Producing standardized high-precision long-term observational data ................................................................... iii Stimulating scientific studies and modelling efforts and providing platform for data analysis and synthesis ...... iii Communicating science-based knowledge towards society and contributing timely information relevant to the GHG policy and decision-making .............................................................................................................................. iv Promoting technical developments ............................................................................................................................ v ICOS as the European pillar of a global GHG observation system ........................................................................... v Conclusions................................................................................................................................................................. vi
1 This report ...............................................................................................................................................4 2 ICOS: background and context .............................................................................................................. 5
2.1 ICOS- a brief history ....................................................................................................................................... 5 2.1.1 Organization ........................................................................................................................................... 5 2.1.2 Aims of ICOS........................................................................................................................................... 7
2.2 A typology of research infrastructures and ways to measure impacts ......................................................... 8 2.2.1 Overview of Research infrastructures ................................................................................................... 8 2.2.2 Experience with impact studies of ERICs/ RIs ..................................................................................... 9 2.2.3 Distributed and virtual research infrastructures ................................................................................. 11
3 Background to the ICOS Impact Assessment ..................................................................................... 12 3.1 The study objectives...................................................................................................................................... 12 3.2 Definition of impact ...................................................................................................................................... 12 3.3 Scope of this impact assessment .................................................................................................................. 14 3.4 Method overview........................................................................................................................................... 16
4 Critical reflection on the suitability of frameworks and methods ..................................................... 18 4.1 Reflection on choice of impact framework .................................................................................................. 18 4.2 Reflection on methods used ......................................................................................................................... 19
5 Impact Indicators ................................................................................................................................. 21 5.1 Introduction .................................................................................................................................................. 23
6 Observations: producing standardized high-precision long-term observational data .................... 24 6.1 KPI 1: Longer timeseries of data .................................................................................................................. 24
6.1.1 Inclusion of historical data................................................................................................................... 24 6.1.2 Continuity of member state support .................................................................................................... 25
7 Science: stimulating scientific studies and modelling efforts and providing a platform for data analysis and synthesis ................................................................................................................................. 26
7.1 KPI 2: ICOS contribution to global harmonisation of data sets, methods, algorithms or instruments.... 26 7.2 KPI 3: The number of published, ICOS-related articles ............................................................................. 27 7.3 KPI 4: Number of (global) services provided .............................................................................................. 30
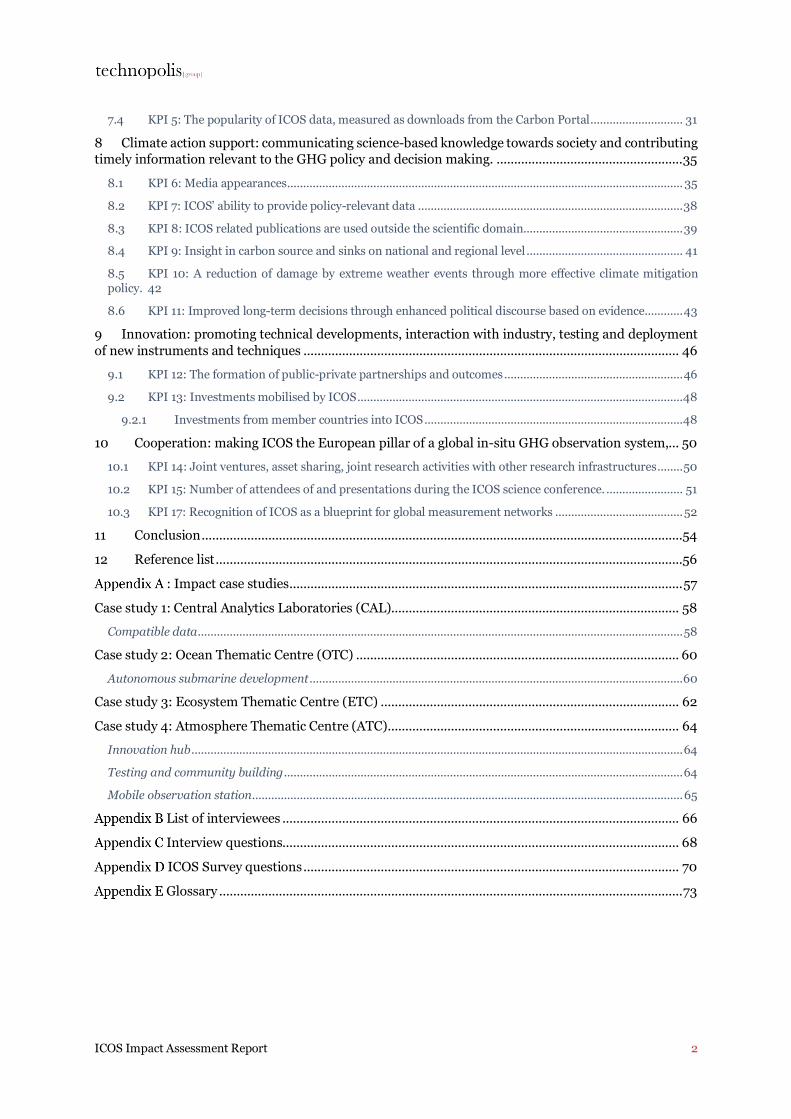
ICOS Impact Assessment Report
2
7.4 KPI 5: The popularity of ICOS data, measured as downloads from the Carbon Portal ............................. 31 8 Climate action support: communicating science-based knowledge towards society and contributing timely information relevant to the GHG policy and decision making. ..................................................... 35
8.1 KPI 6: Media appearances ............................................................................................................................ 35 8.2 KPI 7: ICOS’ ability to provide policy-relevant data ................................................................................... 38 8.3 KPI 8: ICOS related publications are used outside the scientific domain. ................................................. 39 8.4 KPI 9: Insight in carbon source and sinks on national and regional level ................................................. 41 8.5 KPI 10: A reduction of damage by extreme weather events through more effective climate mitigation policy. 42 8.6 KPI 11: Improved long-term decisions through enhanced political discourse based on evidence............ 43
9 Innovation: promoting technical developments, interaction with industry, testing and deployment of new instruments and techniques ........................................................................................................... 46
9.1 KPI 12: The formation of public-private partnerships and outcomes ........................................................ 46 9.2 KPI 13: Investments mobilised by ICOS ...................................................................................................... 48
9.2.1 Investments from member countries into ICOS ................................................................................. 48 10 Cooperation: making ICOS the European pillar of a global in-situ GHG observation system,... 50
10.1 KPI 14: Joint ventures, asset sharing, joint research activities with other research infrastructures ........ 50 10.2 KPI 15: Number of attendees of and presentations during the ICOS science conference. ........................ 51 10.3 KPI 17: Recognition of ICOS as a blueprint for global measurement networks ........................................ 52
11 Conclusion .........................................................................................................................................54 12 Reference list .....................................................................................................................................56
: Impact case studies ................................................................................................................ 57 Case study 1: Central Analytics Laboratories (CAL).................................................................................. 58
Compatible data ........................................................................................................................................................ 58 Case study 2: Ocean Thematic Centre (OTC) ............................................................................................ 60
Autonomous submarine development ..................................................................................................................... 60 Case study 3: Ecosystem Thematic Centre (ETC) ..................................................................................... 62 Case study 4: Atmosphere Thematic Centre (ATC) ................................................................................... 64
Innovation hub .......................................................................................................................................................... 64 Testing and community building ............................................................................................................................. 64 Mobile observation station ....................................................................................................................................... 65
List of interviewees ................................................................................................................. 66 Interview questions................................................................................................................. 68 ICOS Survey questions ........................................................................................................... 70 Glossary .................................................................................................................................... 73
ICOS Impact Assessment Report
3
Tables Table 1: ICOS revised strategy objectives with corresponding KPIs as used in the headline report ......................... 13 Table 2: Table with impact indicators used in this study, a description how they are measured, and the link to ICOS strategic objectives. .............................................................................................................................................. 21 Table 3: List of interviewees.......................................................................................................................................... 66
Figures Figure 1: Organisational Structure ICOS RI. .................................................................................................................. 6 Figure 2: Framework to analyse effects from problem to impact ............................................................................... 14 Figure 3: ICOS strategy placed in an impact framework. Numbered items correspond with strategy objectives .... 15 Figure 4: Results of the audience vote during RINGO meeting: perceived importance of impact areas with number of votes along the top row. ............................................................................................................................................ 16 Figure 5: Methods employed per work package ........................................................................................................... 16 Figure 6: Impact assessment framework for physical infrastructures ........................................................................ 18 Figure 7: Policy Impact assessment framework ........................................................................................................... 19 Figure 8: number of measurement stations (y- axis) and length of timeseries (x- axis) held by ICOS measurement stations in 2018, for the atmosphere (ATM), ecosystem (ECO), and Ocean domain................................................. 25 Figure 9: Survey findings on how ICOS improves climate scientist’s work ................................................................ 27 Figure 10: ICOS related articles published per year .................................................................................................... 28 Figure 11: Top 10 sources publishing ICOS related articles – including their impact factor ..................................... 29 Figure 12: distribution of ICOS related articles across impact factor groups ............................................................. 29 Figure 13: Top 10 affiliation for ICOS related articles ................................................................................................. 30 Figure 14: Total number of downloads from Carbon Portal between 1 September 2017 and 1st of July 2018 per country. The coloured bar on the left gives the number of users. ............................................................................... 32 Figure 15: Overview of most used parts of ICOS .......................................................................................................... 33 Figure 16: Survey insights on to what extent ICOS is realising its objectives ............................................................. 34 Figure 17: The number of media articles mentioning ICOS in the period 2013-2017 ................................................ 36 Figure 18: Achieved and potential reach of media attention for ICOS in different countries .................................... 37 Figure 19: Academic and media outreach of ICOS....................................................................................................... 37 Figure 20: Chart with This chart showing all mentions for 323 research articles by ICOS. ...................................... 40 Figure 21: The role of ICOS in knowledge networks .................................................................................................... 41 Figure 22: Potential influence ICOS on policy making I ............................................................................................. 44 Figure 23: Potential influence ICOS on policy making II ............................................................................................ 44 Figure 24: Industrial influence of ICOS ....................................................................................................................... 47 Figure 25: Influence of ICOS on spin-offs and employment ....................................................................................... 48 Figure 26: Map showing the locations of ICOS fixed ocean stations (pins) and routes of voluntary observing ships (red lines). From https://otc.icos-cp.eu/. .................................................................................................................... 60 Figure 27: Mobile measuring station. ........................................................................................................................... 65
ICOS Impact Assessment Report
4
1 This report
This report presents the findings of the impact analysis for the Integrated Carbon Observation System Research Infrastructure (ICOS RI). The study was commissioned by ICOS in November 2017 and carried out by Technopolis between January and June 2018.
The aims of this study were four-fold: 1. To develop a comprehensive framework for the analyses of the impact of distributed research
Infrastructures in general and specifically the ICOS RI; 2. To develop a set of relevant and usable Key Performance Indicators (KPIs) enabling ICOS RI to
evaluate its impact; 3. To provide ICOS with the knowledge and capacity to determine the value of these KPIs and the
relationship amongst them; 4. To give ICOS relevant advice, based on prior experience with RI and the research undertaken
during this assignment, on a strategy to improve ICOS’ impact and performance.
To meet best the different demands, we have written up the findings of this study in two separate reports, of which this one is the first. Each report covers a separate part of the study, and as such can be read on itself; together these reports fully address the aim of the study. The reports cover the following areas:
Report I Methods report. This report provides a comprehensive background on the evaluation of distributed research infrastructures, and ICOS in particular. It describes the types of impacts that can be expected from research infrastructures based on our experience and according to the literature and specifies how these apply to ICOS. It explains the methodology used in this study and makes clear what the limitations are of this impact analysis. This report ends with a table that contains the 17 Key Performance Indicators (KPI) that are used in this study, and their operationalisation.
Report II Impact indicator rapport. This report contains the results of our in-depth exploration of the 17 KPIs, together with the executive summary and study conclusions. It describes the impacts of ICOS in each of the areas covered by the impact indicators, and places these impacts in the context of the impact framework set out in report I. The structure of this report follows the categories outlined in ICOS strategic objectives, as formulated for the GA held in May 2018. As such, this report not only reports on the findings of the 17 impact indicators, but also gives an insight in ICOS’ current positioning within its strategy. The goal of this report is to serve as a baseline for future monitoring and assessment.
The distinction between the ICOS RI, which consists of the National Networks (NN), central facilities (CF) and Head Office (HO), and the ICOS ERIC, which is the legal entity that governs this distributed infrastructure and contains the data portal, is non-trivial. Throughout this report we will use ICOS ERIC to refer to the governing entity, and ICOS to refer to the ICOS RI unless stated otherwise.
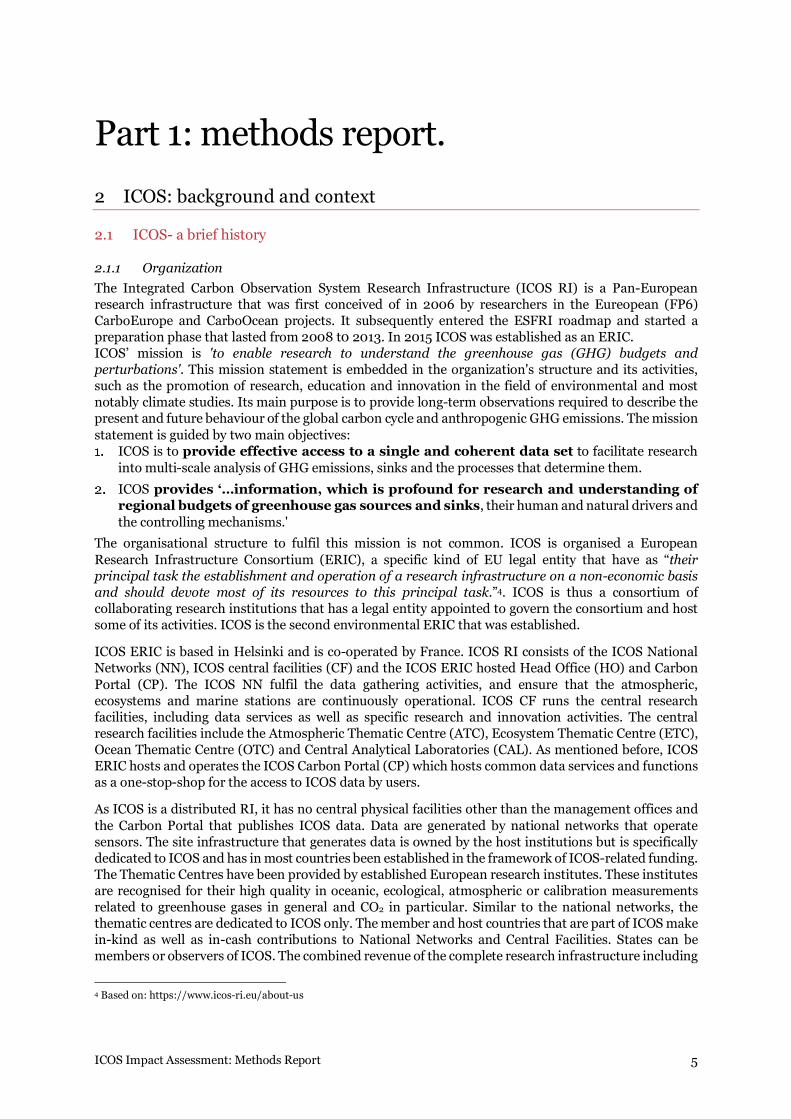
ICOS Impact Assessment: Methods Report
5
Part 1: methods report. 2 ICOS: background and context
2.1 ICOS- a brief history
2.1.1 Organization The Integrated Carbon Observation System Research Infrastructure (ICOS RI) is a Pan-European research infrastructure that was first conceived of in 2006 by researchers in the Eureopean (FP6) CarboEurope and CarboOcean projects. It subsequently entered the ESFRI roadmap and started a preparation phase that lasted from 2008 t0 2013. In 2015 ICOS was established as an ERIC. ICOS’ mission is 'to enable research to understand the greenhouse gas (GHG) budgets and perturbations'. This mission statement is embedded in the organization's structure and its activities, such as the promotion of research, education and innovation in the field of environmental and most notably climate studies. Its main purpose is to provide long-term observations required to describe the present and future behaviour of the global carbon cycle and anthropogenic GHG emissions. The mission statement is guided by two main objectives:
ICOS is to provide effective access to a single and coherent data set to facilitate research into multi-scale analysis of GHG emissions, sinks and the processes that determine them.
ICOS provides ‘…information, which is profound for research and understanding of regional budgets of greenhouse gas sources and sinks, their human and natural drivers and the controlling mechanisms.'
The organisational structure to fulfil this mission is not common. ICOS is organised a European Research Infrastructure Consortium (ERIC), a specific kind of EU legal entity that have as “their principal task the establishment and operation of a research infrastructure on a non-economic basis and should devote most of its resources to this principal task.”4. ICOS is thus a consortium of collaborating research institutions that has a legal entity appointed to govern the consortium and host some of its activities. ICOS is the second environmental ERIC that was established.
ICOS ERIC is based in Helsinki and is co-operated by France. ICOS RI consists of the ICOS National Networks (NN), ICOS central facilities (CF) and the ICOS ERIC hosted Head Office (HO) and Carbon Portal (CP). The ICOS NN fulfil the data gathering activities, and ensure that the atmospheric, ecosystems and marine stations are continuously operational. ICOS CF runs the central research facilities, including data services as well as specific research and innovation activities. The central research facilities include the Atmospheric Thematic Centre (ATC), Ecosystem Thematic Centre (ETC), Ocean Thematic Centre (OTC) and Central Analytical Laboratories (CAL). As mentioned before, ICOS ERIC hosts and operates the ICOS Carbon Portal (CP) which hosts common data services and functions as a one-stop-shop for the access to ICOS data by users.
As ICOS is a distributed RI, it has no central physical facilities other than the management offices and the Carbon Portal that publishes ICOS data. Data are generated by national networks that operate sensors. The site infrastructure that generates data is owned by the host institutions but is specifically dedicated to ICOS and has in most countries been established in the framework of ICOS-related funding. The Thematic Centres have been provided by established European research institutes. These institutes are recognised for their high quality in oceanic, ecological, atmospheric or calibration measurements related to greenhouse gases in general and CO2 in particular. Similar to the national networks, the thematic centres are dedicated to ICOS only. The member and host countries that are part of ICOS make in-kind as well as in-cash contributions to National Networks and Central Facilities. States can be members or observers of ICOS. The combined revenue of the complete research infrastructure including
4 Based on: https://www.icos-ri.eu/about-us
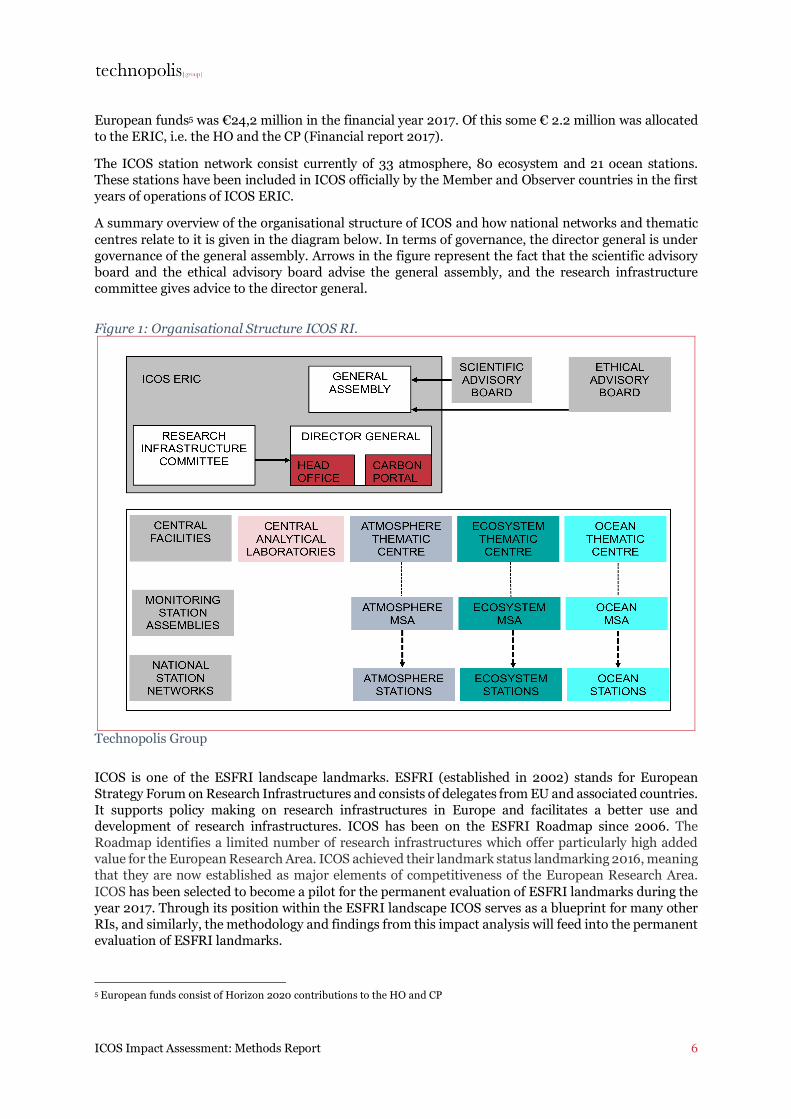
ICOS Impact Assessment: Methods Report
6
European funds5 was €24,2 million in the financial year 2017. Of this some € 2.2 million was allocated to the ERIC, i.e. the HO and the CP (Financial report 2017).
The ICOS station network consist currently of 33 atmosphere, 80 ecosystem and 21 ocean stations. These stations have been included in ICOS officially by the Member and Observer countries in the first years of operations of ICOS ERIC.
A summary overview of the organisational structure of ICOS and how national networks and thematic centres relate to it is given in the diagram below. In terms of governance, the director general is under governance of the general assembly. Arrows in the figure represent the fact that the scientific advisory board and the ethical advisory board advise the general assembly, and the research infrastructure committee gives advice to the director general.
Figure 1: Organisational Structure ICOS RI.
Technopolis Group
ICOS is one of the ESFRI landscape landmarks. ESFRI (established in 2002) stands for European Strategy Forum on Research Infrastructures and consists of delegates from EU and associated countries. It supports policy making on research infrastructures in Europe and facilitates a better use and development of research infrastructures. ICOS has been on the ESFRI Roadmap since 2006. The Roadmap identifies a limited number of research infrastructures which offer particularly high added value for the European Research Area. ICOS achieved their landmark status landmarking 2016, meaning that they are now established as major elements of competitiveness of the European Research Area. ICOS has been selected to become a pilot for the permanent evaluation of ESFRI landmarks during the year 2017. Through its position within the ESFRI landscape ICOS serves as a blueprint for many other RIs, and similarly, the methodology and findings from this impact analysis will feed into the permanent evaluation of ESFRI landmarks.
5 European funds consist of Horizon 2020 contributions to the HO and CP
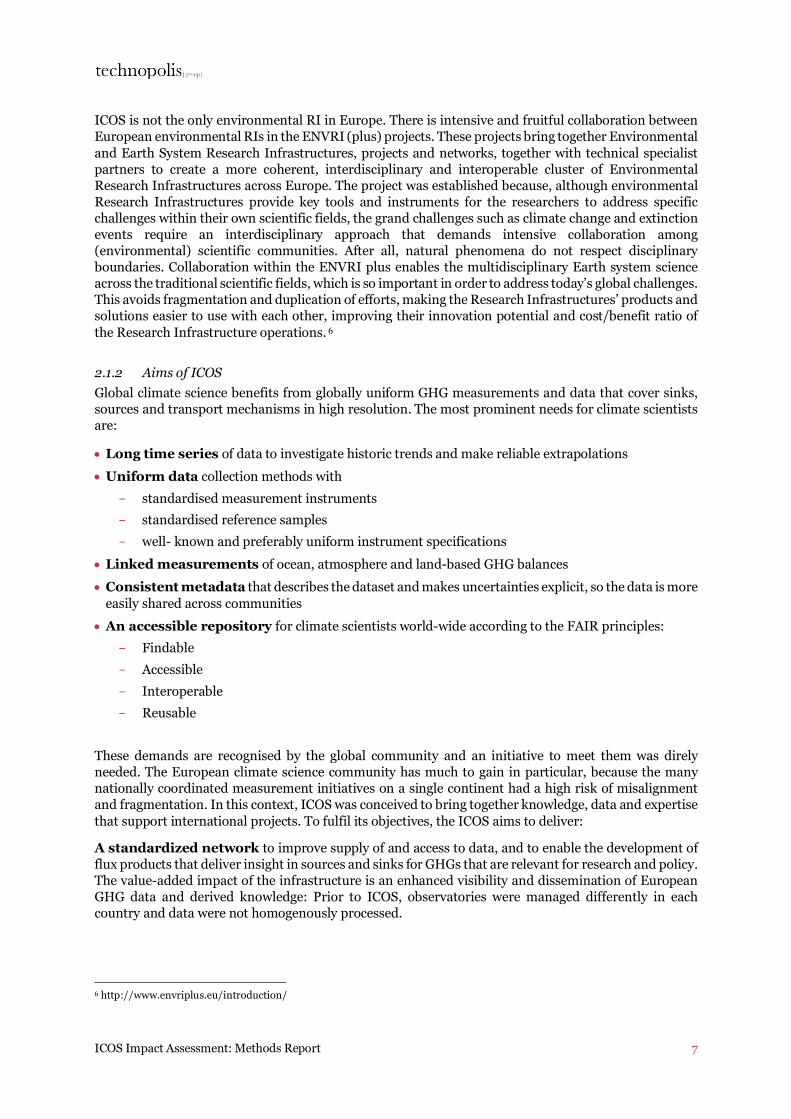
ICOS Impact Assessment: Methods Report
7
ICOS is not the only environmental RI in Europe. There is intensive and fruitful collaboration between European environmental RIs in the ENVRI (plus) projects. These projects bring together Environmental and Earth System Research Infrastructures, projects and networks, together with technical specialist partners to create a more coherent, interdisciplinary and interoperable cluster of Environmental Research Infrastructures across Europe. The project was established because, although environmental Research Infrastructures provide key tools and instruments for the researchers to address specific challenges within their own scientific fields, the grand challenges such as climate change and extinction events require an interdisciplinary approach that demands intensive collaboration among (environmental) scientific communities. After all, natural phenomena do not respect disciplinary boundaries. Collaboration within the ENVRI plus enables the multidisciplinary Earth system science across the traditional scientific fields, which is so important in order to address today’s global challenges. This avoids fragmentation and duplication of efforts, making the Research Infrastructures’ products and solutions easier to use with each other, improving their innovation potential and cost/benefit ratio of the Research Infrastructure operations. 6
2.1.2 Aims of ICOS Global climate science benefits from globally uniform GHG measurements and data that cover sinks, sources and transport mechanisms in high resolution. The most prominent needs for climate scientists are:
• Long time series of data to investigate historic trends and make reliable extrapolations • Uniform data collection methods with
- standardised measurement instruments - standardised reference samples - well- known and preferably uniform instrument specifications
• Linked measurements of ocean, atmosphere and land-based GHG balances • Consistent metadata that describes the dataset and makes uncertainties explicit, so the data is more
easily shared across communities • An accessible repository for climate scientists world-wide according to the FAIR principles:
- Findable - Accessible - Interoperable - Reusable
These demands are recognised by the global community and an initiative to meet them was direly needed. The European climate science community has much to gain in particular, because the many nationally coordinated measurement initiatives on a single continent had a high risk of misalignment and fragmentation. In this context, ICOS was conceived to bring together knowledge, data and expertise that support international projects. To fulfil its objectives, the ICOS aims to deliver:
A standardized network to improve supply of and access to data, and to enable the development of flux products that deliver insight in sources and sinks for GHGs that are relevant for research and policy. The value-added impact of the infrastructure is an enhanced visibility and dissemination of European GHG data and derived knowledge: Prior to ICOS, observatories were managed differently in each country and data were not homogenously processed.
6 http://www.envriplus.eu/introduction/
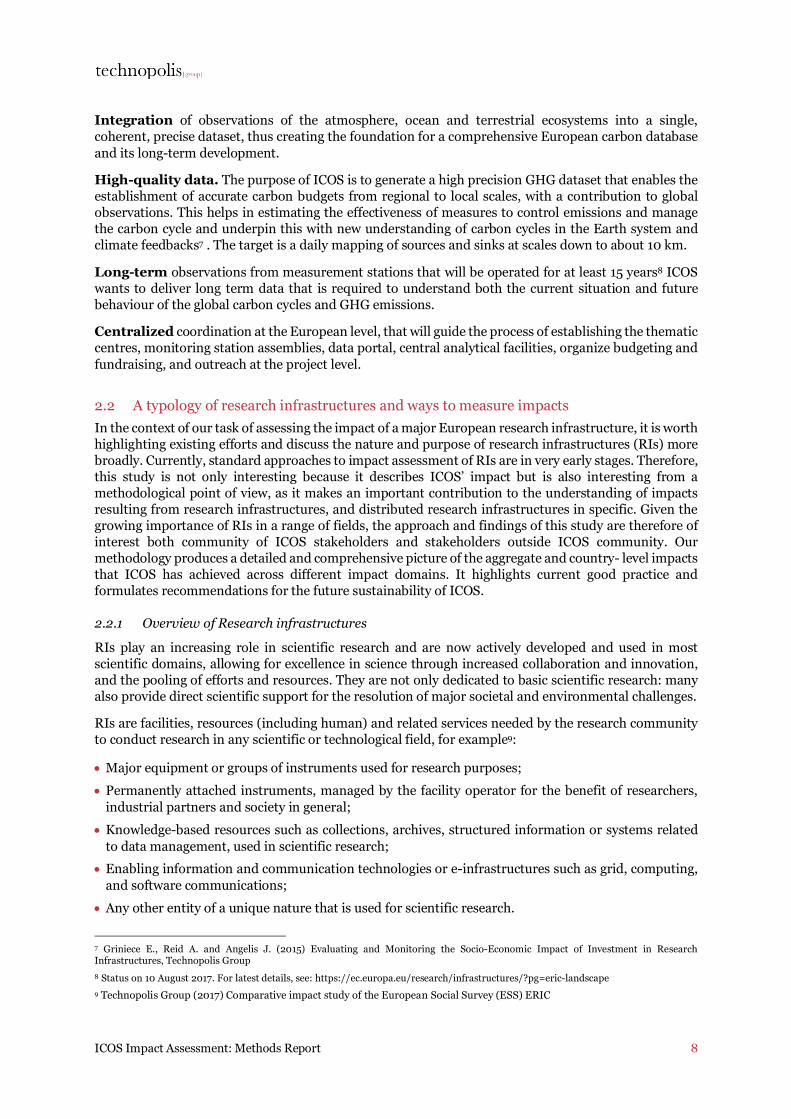
ICOS Impact Assessment: Methods Report
8
Integration of observations of the atmosphere, ocean and terrestrial ecosystems into a single, coherent, precise dataset, thus creating the foundation for a comprehensive European carbon database and its long-term development.
High-quality data. The purpose of ICOS is to generate a high precision GHG dataset that enables the establishment of accurate carbon budgets from regional to local scales, with a contribution to global observations. This helps in estimating the effectiveness of measures to control emissions and manage the carbon cycle and underpin this with new understanding of carbon cycles in the Earth system and climate feedbacks7 . The target is a daily mapping of sources and sinks at scales down to about 10 km.
Long-term observations from measurement stations that will be operated for at least 15 years8 ICOS wants to deliver long term data that is required to understand both the current situation and future behaviour of the global carbon cycles and GHG emissions.
Centralized coordination at the European level, that will guide the process of establishing the thematic centres, monitoring station assemblies, data portal, central analytical facilities, organize budgeting and fundraising, and outreach at the project level.
2.2 A typology of research infrastructures and ways to measure impacts In the context of our task of assessing the impact of a major European research infrastructure, it is worth highlighting existing efforts and discuss the nature and purpose of research infrastructures (RIs) more broadly. Currently, standard approaches to impact assessment of RIs are in very early stages. Therefore, this study is not only interesting because it describes ICOS’ impact but is also interesting from a methodological point of view, as it makes an important contribution to the understanding of impacts resulting from research infrastructures, and distributed research infrastructures in specific. Given the growing importance of RIs in a range of fields, the approach and findings of this study are therefore of interest both community of ICOS stakeholders and stakeholders outside ICOS community. Our methodology produces a detailed and comprehensive picture of the aggregate and country- level impacts that ICOS has achieved across different impact domains. It highlights current good practice and formulates recommendations for the future sustainability of ICOS.
2.2.1 Overview of Research infrastructures
RIs play an increasing role in scientific research and are now actively developed and used in most scientific domains, allowing for excellence in science through increased collaboration and innovation, and the pooling of efforts and resources. They are not only dedicated to basic scientific research: many also provide direct scientific support for the resolution of major societal and environmental challenges.
RIs are facilities, resources (including human) and related services needed by the research community to conduct research in any scientific or technological field, for example9:
• Major equipment or groups of instruments used for research purposes; • Permanently attached instruments, managed by the facility operator for the benefit of researchers,
industrial partners and society in general; • Knowledge-based resources such as collections, archives, structured information or systems related
to data management, used in scientific research; • Enabling information and communication technologies or e-infrastructures such as grid, computing,
and software communications; • Any other entity of a unique nature that is used for scientific research. 7 Griniece E., Reid A. and Angelis J. (2015) Evaluating and Monitoring the Socio-Economic Impact of Investment in Research Infrastructures, Technopolis Group 8 Status on 10 August 2017. For latest details, see: https://ec.europa.eu/research/infrastructures/?pg=eric-landscape 9 Technopolis Group (2017) Comparative impact study of the European Social Survey (ESS) ERIC
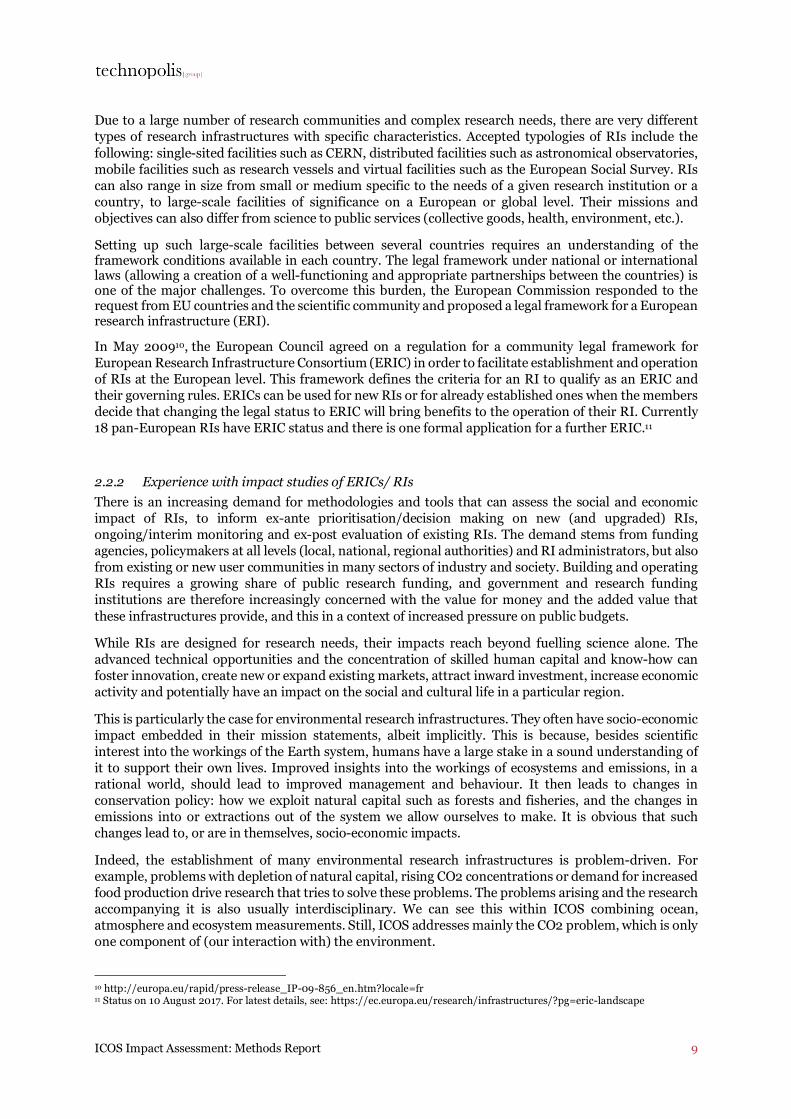
ICOS Impact Assessment: Methods Report
9
Due to a large number of research communities and complex research needs, there are very different types of research infrastructures with specific characteristics. Accepted typologies of RIs include the following: single-sited facilities such as CERN, distributed facilities such as astronomical observatories, mobile facilities such as research vessels and virtual facilities such as the European Social Survey. RIs can also range in size from small or medium specific to the needs of a given research institution or a country, to large-scale facilities of significance on a European or global level. Their missions and objectives can also differ from science to public services (collective goods, health, environment, etc.). Setting up such large-scale facilities between several countries requires an understanding of the framework conditions available in each country. The legal framework under national or international laws (allowing a creation of a well-functioning and appropriate partnerships between the countries) is one of the major challenges. To overcome this burden, the European Commission responded to the request from EU countries and the scientific community and proposed a legal framework for a European research infrastructure (ERI). In May 200910, the European Council agreed on a regulation for a community legal framework for European Research Infrastructure Consortium (ERIC) in order to facilitate establishment and operation of RIs at the European level. This framework defines the criteria for an RI to qualify as an ERIC and their governing rules. ERICs can be used for new RIs or for already established ones when the members decide that changing the legal status to ERIC will bring benefits to the operation of their RI. Currently 18 pan-European RIs have ERIC status and there is one formal application for a further ERIC.11
2.2.2 Experience with impact studies of ERICs/ RIs There is an increasing demand for methodologies and tools that can assess the social and economic impact of RIs, to inform ex-ante prioritisation/decision making on new (and upgraded) RIs, ongoing/interim monitoring and ex-post evaluation of existing RIs. The demand stems from funding agencies, policymakers at all levels (local, national, regional authorities) and RI administrators, but also from existing or new user communities in many sectors of industry and society. Building and operating RIs requires a growing share of public research funding, and government and research funding institutions are therefore increasingly concerned with the value for money and the added value that these infrastructures provide, and this in a context of increased pressure on public budgets.
While RIs are designed for research needs, their impacts reach beyond fuelling science alone. The advanced technical opportunities and the concentration of skilled human capital and know-how can foster innovation, create new or expand existing markets, attract inward investment, increase economic activity and potentially have an impact on the social and cultural life in a particular region.
This is particularly the case for environmental research infrastructures. They often have socio-economic impact embedded in their mission statements, albeit implicitly. This is because, besides scientific interest into the workings of the Earth system, humans have a large stake in a sound understanding of it to support their own lives. Improved insights into the workings of ecosystems and emissions, in a rational world, should lead to improved management and behaviour. It then leads to changes in conservation policy: how we exploit natural capital such as forests and fisheries, and the changes in emissions into or extractions out of the system we allow ourselves to make. It is obvious that such changes lead to, or are in themselves, socio-economic impacts.
Indeed, the establishment of many environmental research infrastructures is problem-driven. For example, problems with depletion of natural capital, rising CO2 concentrations or demand for increased food production drive research that tries to solve these problems. The problems arising and the research accompanying it is also usually interdisciplinary. We can see this within ICOS combining ocean, atmosphere and ecosystem measurements. Still, ICOS addresses mainly the CO2 problem, which is only one component of (our interaction with) the environment.
10 http://europa.eu/rapid/press-release_IP-09-856_en.htm?locale=fr 11 Status on 10 August 2017. For latest details, see: https://ec.europa.eu/research/infrastructures/?pg=eric-landscape
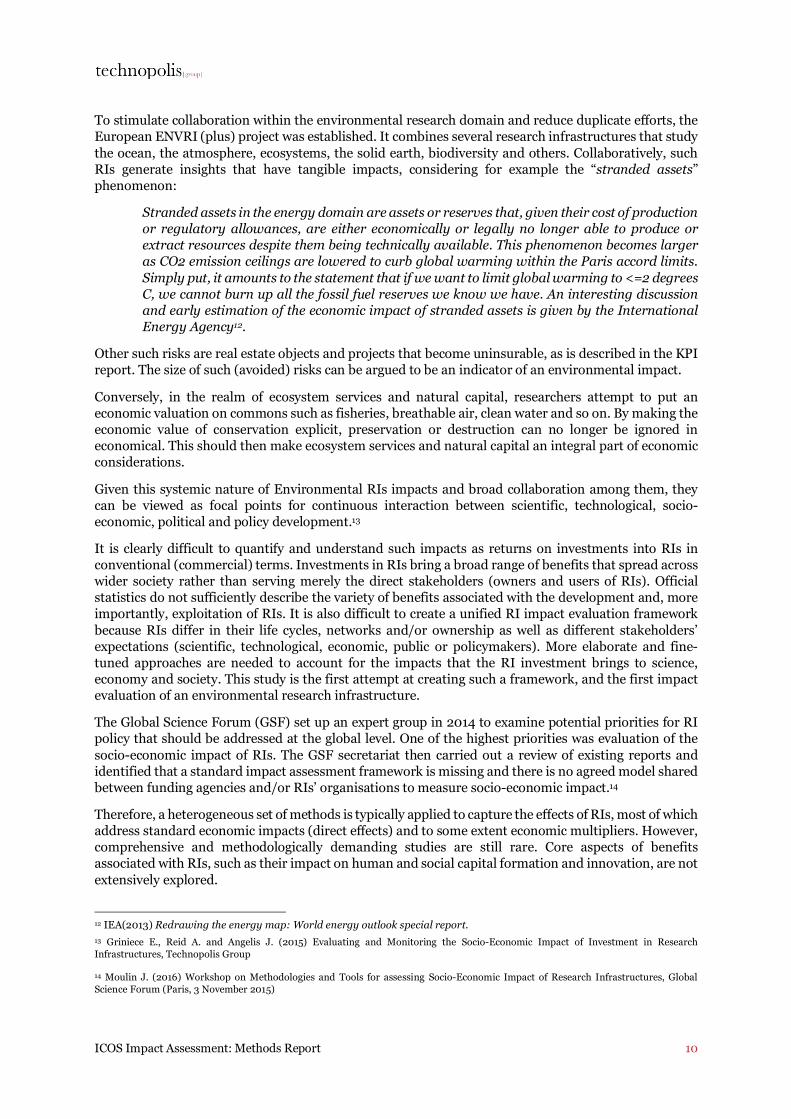
ICOS Impact Assessment: Methods Report
10
To stimulate collaboration within the environmental research domain and reduce duplicate efforts, the European ENVRI (plus) project was established. It combines several research infrastructures that study the ocean, the atmosphere, ecosystems, the solid earth, biodiversity and others. Collaboratively, such RIs generate insights that have tangible impacts, considering for example the “stranded assets” phenomenon:
Stranded assets in the energy domain are assets or reserves that, given their cost of production or regulatory allowances, are either economically or legally no longer able to produce or extract resources despite them being technically available. This phenomenon becomes larger as CO2 emission ceilings are lowered to curb global warming within the Paris accord limits. Simply put, it amounts to the statement that if we want to limit global warming to <=2 degrees C, we cannot burn up all the fossil fuel reserves we know we have. An interesting discussion and early estimation of the economic impact of stranded assets is given by the International Energy Agency12.
Other such risks are real estate objects and projects that become uninsurable, as is described in the KPI report. The size of such (avoided) risks can be argued to be an indicator of an environmental impact.
Conversely, in the realm of ecosystem services and natural capital, researchers attempt to put an economic valuation on commons such as fisheries, breathable air, clean water and so on. By making the economic value of conservation explicit, preservation or destruction can no longer be ignored in economical. This should then make ecosystem services and natural capital an integral part of economic considerations.
Given this systemic nature of Environmental RIs impacts and broad collaboration among them, they can be viewed as focal points for continuous interaction between scientific, technological, socio-economic, political and policy development.13
It is clearly difficult to quantify and understand such impacts as returns on investments into RIs in conventional (commercial) terms. Investments in RIs bring a broad range of benefits that spread across wider society rather than serving merely the direct stakeholders (owners and users of RIs). Official statistics do not sufficiently describe the variety of benefits associated with the development and, more importantly, exploitation of RIs. It is also difficult to create a unified RI impact evaluation framework because RIs differ in their life cycles, networks and/or ownership as well as different stakeholders’ expectations (scientific, technological, economic, public or policymakers). More elaborate and fine-tuned approaches are needed to account for the impacts that the RI investment brings to science, economy and society. This study is the first attempt at creating such a framework, and the first impact evaluation of an environmental research infrastructure.
The Global Science Forum (GSF) set up an expert group in 2014 to examine potential priorities for RI policy that should be addressed at the global level. One of the highest priorities was evaluation of the socio-economic impact of RIs. The GSF secretariat then carried out a review of existing reports and identified that a standard impact assessment framework is missing and there is no agreed model shared between funding agencies and/or RIs’ organisations to measure socio-economic impact.14
Therefore, a heterogeneous set of methods is typically applied to capture the effects of RIs, most of which address standard economic impacts (direct effects) and to some extent economic multipliers. However, comprehensive and methodologically demanding studies are still rare. Core aspects of benefits associated with RIs, such as their impact on human and social capital formation and innovation, are not extensively explored.
12 IEA(2013) Redrawing the energy map: World energy outlook special report. 13 Griniece E., Reid A. and Angelis J. (2015) Evaluating and Monitoring the Socio-Economic Impact of Investment in Research Infrastructures, Technopolis Group
14 Moulin J. (2016) Workshop on Methodologies and Tools for assessing Socio-Economic Impact of Research Infrastructures, Global Science Forum (Paris, 3 November 2015)
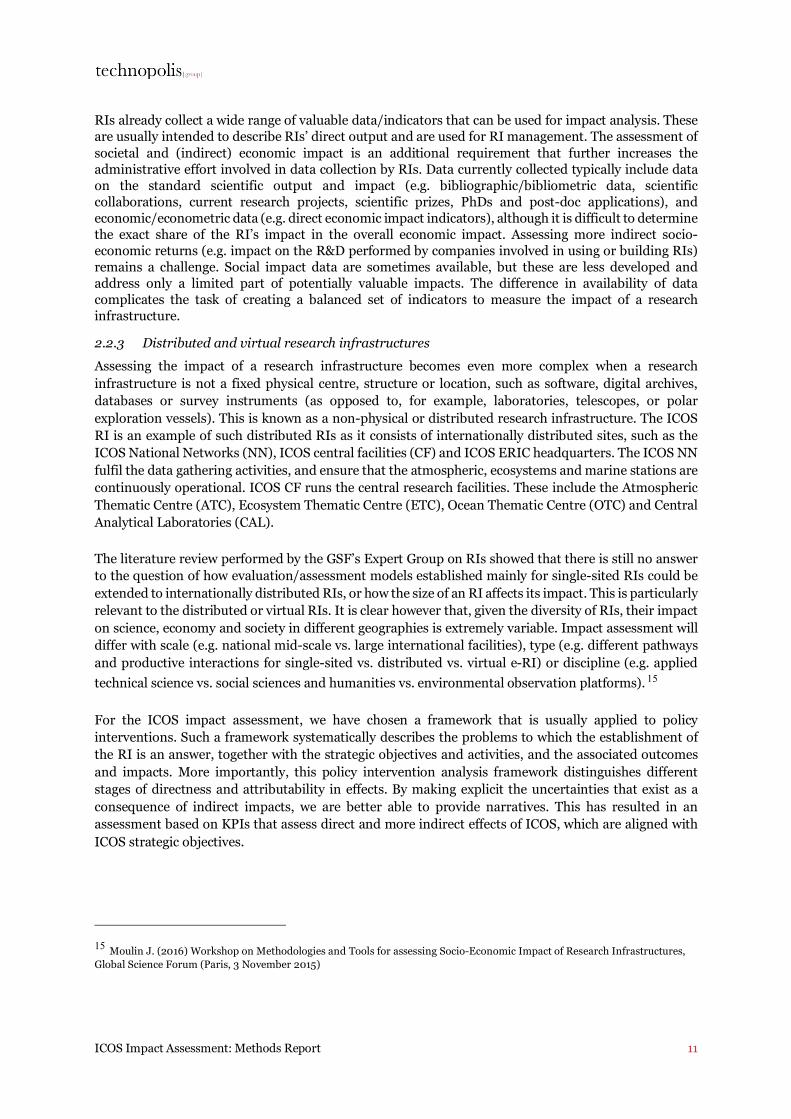
ICOS Impact Assessment: Methods Report
11
RIs already collect a wide range of valuable data/indicators that can be used for impact analysis. These are usually intended to describe RIs’ direct output and are used for RI management. The assessment of societal and (indirect) economic impact is an additional requirement that further increases the administrative effort involved in data collection by RIs. Data currently collected typically include data on the standard scientific output and impact (e.g. bibliographic/bibliometric data, scientific collaborations, current research projects, scientific prizes, PhDs and post-doc applications), and economic/econometric data (e.g. direct economic impact indicators), although it is difficult to determine the exact share of the RI’s impact in the overall economic impact. Assessing more indirect socio-economic returns (e.g. impact on the R&D performed by companies involved in using or building RIs) remains a challenge. Social impact data are sometimes available, but these are less developed and address only a limited part of potentially valuable impacts. The difference in availability of data complicates the task of creating a balanced set of indicators to measure the impact of a research infrastructure.
2.2.3 Distributed and virtual research infrastructures Assessing the impact of a research infrastructure becomes even more complex when a research infrastructure is not a fixed physical centre, structure or location, such as software, digital archives, databases or survey instruments (as opposed to, for example, laboratories, telescopes, or polar exploration vessels). This is known as a non-physical or distributed research infrastructure. The ICOS RI is an example of such distributed RIs as it consists of internationally distributed sites, such as the ICOS National Networks (NN), ICOS central facilities (CF) and ICOS ERIC headquarters. The ICOS NN fulfil the data gathering activities, and ensure that the atmospheric, ecosystems and marine stations are continuously operational. ICOS CF runs the central research facilities. These include the Atmospheric Thematic Centre (ATC), Ecosystem Thematic Centre (ETC), Ocean Thematic Centre (OTC) and Central Analytical Laboratories (CAL).
The literature review performed by the GSF’s Expert Group on RIs showed that there is still no answer to the question of how evaluation/assessment models established mainly for single-sited RIs could be extended to internationally distributed RIs, or how the size of an RI affects its impact. This is particularly relevant to the distributed or virtual RIs. It is clear however that, given the diversity of RIs, their impact on science, economy and society in different geographies is extremely variable. Impact assessment will differ with scale (e.g. national mid-scale vs. large international facilities), type (e.g. different pathways and productive interactions for single-sited vs. distributed vs. virtual e-RI) or discipline (e.g. applied technical science vs. social sciences and humanities vs. environmental observation platforms). 15
For the ICOS impact assessment, we have chosen a framework that is usually applied to policy interventions. Such a framework systematically describes the problems to which the establishment of the RI is an answer, together with the strategic objectives and activities, and the associated outcomes and impacts. More importantly, this policy intervention analysis framework distinguishes different stages of directness and attributability in effects. By making explicit the uncertainties that exist as a consequence of indirect impacts, we are better able to provide narratives. This has resulted in an assessment based on KPIs that assess direct and more indirect effects of ICOS, which are aligned with ICOS strategic objectives.
15 Moulin J. (2016) Workshop on Methodologies and Tools for assessing Socio-Economic Impact of Research Infrastructures, Global Science Forum (Paris, 3 November 2015)
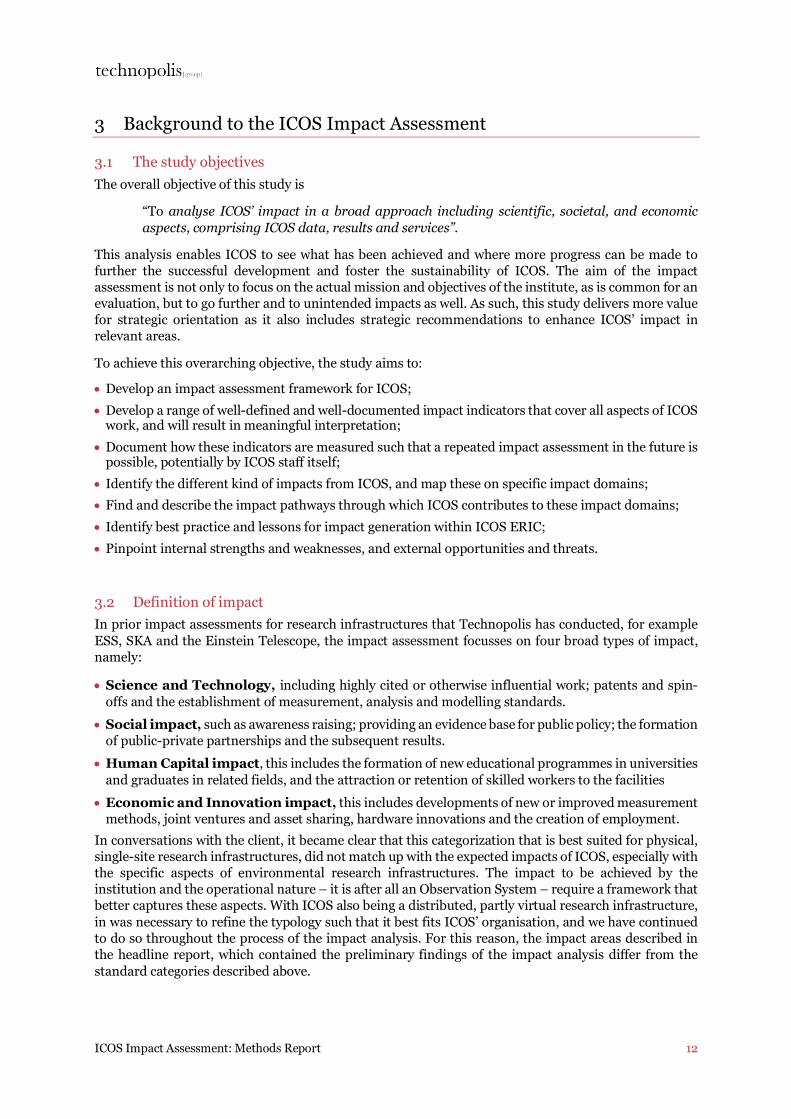
ICOS Impact Assessment: Methods Report
12
3 Background to the ICOS Impact Assessment
3.1 The study objectives The overall objective of this study is
“To analyse ICOS’ impact in a broad approach including scientific, societal, and economic aspects, comprising ICOS data, results and services”.
This analysis enables ICOS to see what has been achieved and where more progress can be made to further the successful development and foster the sustainability of ICOS. The aim of the impact assessment is not only to focus on the actual mission and objectives of the institute, as is common for an evaluation, but to go further and to unintended impacts as well. As such, this study delivers more value for strategic orientation as it also includes strategic recommendations to enhance ICOS’ impact in relevant areas.
To achieve this overarching objective, the study aims to:
• Develop an impact assessment framework for ICOS; • Develop a range of well-defined and well-documented impact indicators that cover all aspects of ICOS
work, and will result in meaningful interpretation; • Document how these indicators are measured such that a repeated impact assessment in the future is
possible, potentially by ICOS staff itself; • Identify the different kind of impacts from ICOS, and map these on specific impact domains; • Find and describe the impact pathways through which ICOS contributes to these impact domains; • Identify best practice and lessons for impact generation within ICOS ERIC; • Pinpoint internal strengths and weaknesses, and external opportunities and threats.
3.2 Definition of impact In prior impact assessments for research infrastructures that Technopolis has conducted, for example ESS, SKA and the Einstein Telescope, the impact assessment focusses on four broad types of impact, namely:
• Science and Technology, including highly cited or otherwise influential work; patents and spin-offs and the establishment of measurement, analysis and modelling standards.
• Social impact, such as awareness raising; providing an evidence base for public policy; the formation of public-private partnerships and the subsequent results.
• Human Capital impact, this includes the formation of new educational programmes in universities and graduates in related fields, and the attraction or retention of skilled workers to the facilities
• Economic and Innovation impact, this includes developments of new or improved measurement methods, joint ventures and asset sharing, hardware innovations and the creation of employment.
In conversations with the client, it became clear that this categorization that is best suited for physical, single-site research infrastructures, did not match up with the expected impacts of ICOS, especially with the specific aspects of environmental research infrastructures. The impact to be achieved by the institution and the operational nature – it is after all an Observation System – require a framework that better captures these aspects. With ICOS also being a distributed, partly virtual research infrastructure, in was necessary to refine the typology such that it best fits ICOS’ organisation, and we have continued to do so throughout the process of the impact analysis. For this reason, the impact areas described in the headline report, which contained the preliminary findings of the impact analysis differ from the standard categories described above.
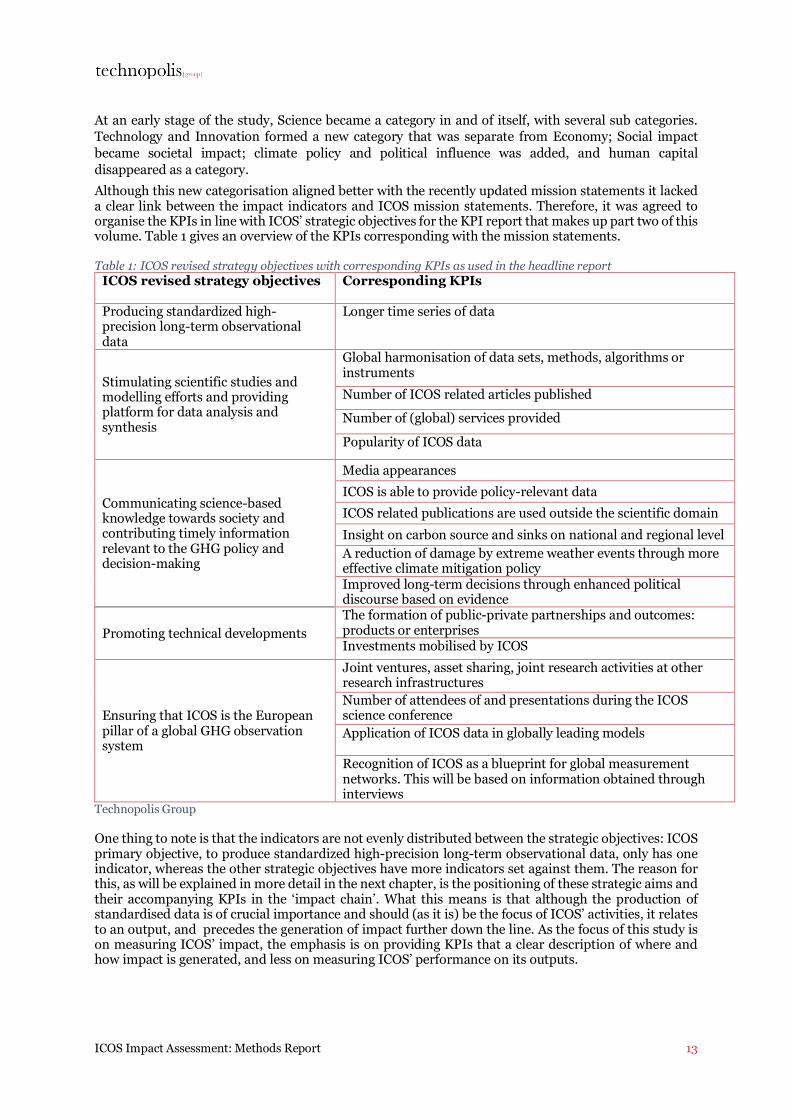
ICOS Impact Assessment: Methods Report
13
At an early stage of the study, Science became a category in and of itself, with several sub categories. Technology and Innovation formed a new category that was separate from Economy; Social impact became societal impact; climate policy and political influence was added, and human capital disappeared as a category. Although this new categorisation aligned better with the recently updated mission statements it lacked a clear link between the impact indicators and ICOS mission statements. Therefore, it was agreed to organise the KPIs in line with ICOS’ strategic objectives for the KPI report that makes up part two of this volume. Table 1 gives an overview of the KPIs corresponding with the mission statements. Table 1: ICOS revised strategy objectives with corresponding KPIs as used in the headline report
ICOS revised strategy objectives Corresponding KPIs
Producing standardized high-precision long-term observational data
Longer time series of data
Stimulating scientific studies and modelling efforts and providing platform for data analysis and synthesis
Global harmonisation of data sets, methods, algorithms or instruments Number of ICOS related articles published
Number of (global) services provided
Popularity of ICOS data
Communicating science-based knowledge towards society and contributing timely information relevant to the GHG policy and decision-making
Media appearances ICOS is able to provide policy-relevant data ICOS related publications are used outside the scientific domain Insight on carbon source and sinks on national and regional level A reduction of damage by extreme weather events through more effective climate mitigation policy Improved long-term decisions through enhanced political discourse based on evidence
Promoting technical developments The formation of public-private partnerships and outcomes: products or enterprises Investments mobilised by ICOS
Ensuring that ICOS is the European pillar of a global GHG observation system
Joint ventures, asset sharing, joint research activities at other research infrastructures Number of attendees of and presentations during the ICOS science conference Application of ICOS data in globally leading models
Recognition of ICOS as a blueprint for global measurement networks. This will be based on information obtained through interviews
Technopolis Group One thing to note is that the indicators are not evenly distributed between the strategic objectives: ICOS primary objective, to produce standardized high-precision long-term observational data, only has one indicator, whereas the other strategic objectives have more indicators set against them. The reason for this, as will be explained in more detail in the next chapter, is the positioning of these strategic aims and their accompanying KPIs in the ‘impact chain’. What this means is that although the production of standardised data is of crucial importance and should (as it is) be the focus of ICOS’ activities, it relates to an output, and precedes the generation of impact further down the line. As the focus of this study is on measuring ICOS’ impact, the emphasis is on providing KPIs that a clear description of where and how impact is generated, and less on measuring ICOS’ performance on its outputs.
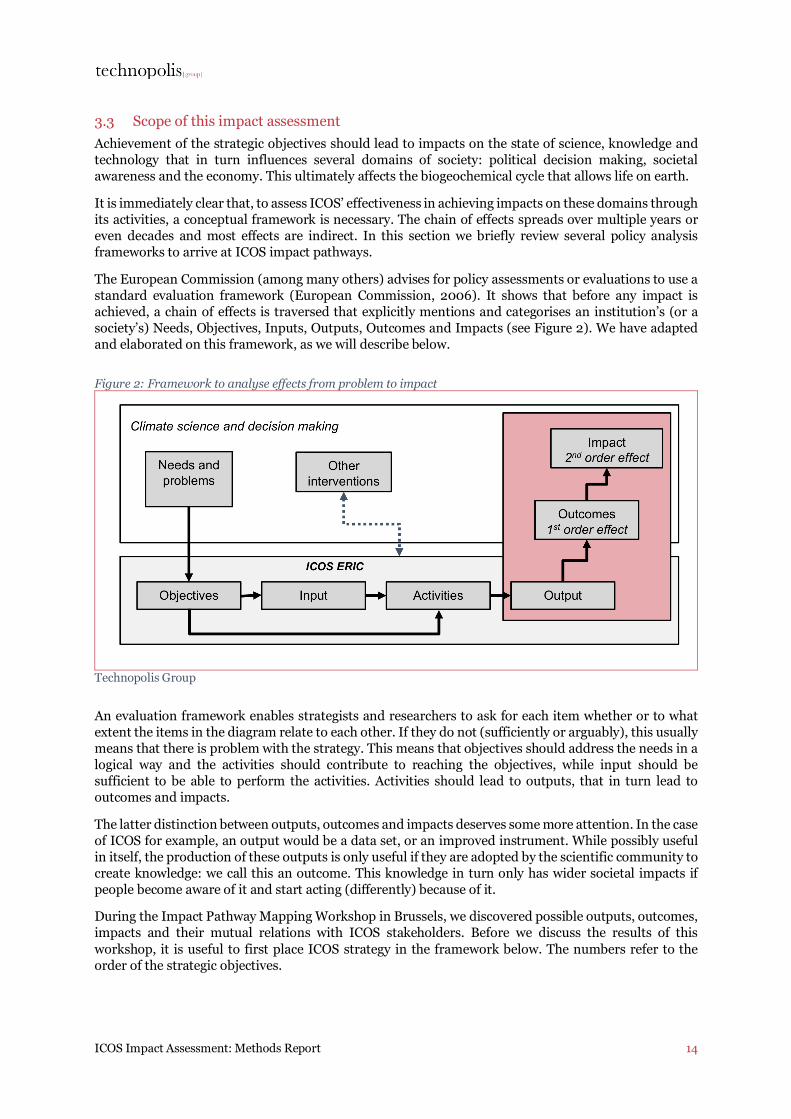
ICOS Impact Assessment: Methods Report
14
3.3 Scope of this impact assessment Achievement of the strategic objectives should lead to impacts on the state of science, knowledge and technology that in turn influences several domains of society: political decision making, societal awareness and the economy. This ultimately affects the biogeochemical cycle that allows life on earth.
It is immediately clear that, to assess ICOS’ effectiveness in achieving impacts on these domains through its activities, a conceptual framework is necessary. The chain of effects spreads over multiple years or even decades and most effects are indirect. In this section we briefly review several policy analysis frameworks to arrive at ICOS impact pathways.
The European Commission (among many others) advises for policy assessments or evaluations to use a standard evaluation framework (European Commission, 2006). It shows that before any impact is achieved, a chain of effects is traversed that explicitly mentions and categorises an institution’s (or a society’s) Needs, Objectives, Inputs, Outputs, Outcomes and Impacts (see Figure 2). We have adapted and elaborated on this framework, as we will describe below.
Figure 2: Framework to analyse effects from problem to impact
Technopolis Group
An evaluation framework enables strategists and researchers to ask for each item whether or to what extent the items in the diagram relate to each other. If they do not (sufficiently or arguably), this usually means that there is problem with the strategy. This means that objectives should address the needs in a logical way and the activities should contribute to reaching the objectives, while input should be sufficient to be able to perform the activities. Activities should lead to outputs, that in turn lead to outcomes and impacts.
The latter distinction between outputs, outcomes and impacts deserves some more attention. In the case of ICOS for example, an output would be a data set, or an improved instrument. While possibly useful in itself, the production of these outputs is only useful if they are adopted by the scientific community to create knowledge: we call this an outcome. This knowledge in turn only has wider societal impacts if people become aware of it and start acting (differently) because of it.
During the Impact Pathway Mapping Workshop in Brussels, we discovered possible outputs, outcomes, impacts and their mutual relations with ICOS stakeholders. Before we discuss the results of this workshop, it is useful to first place ICOS strategy in the framework below. The numbers refer to the order of the strategic objectives.
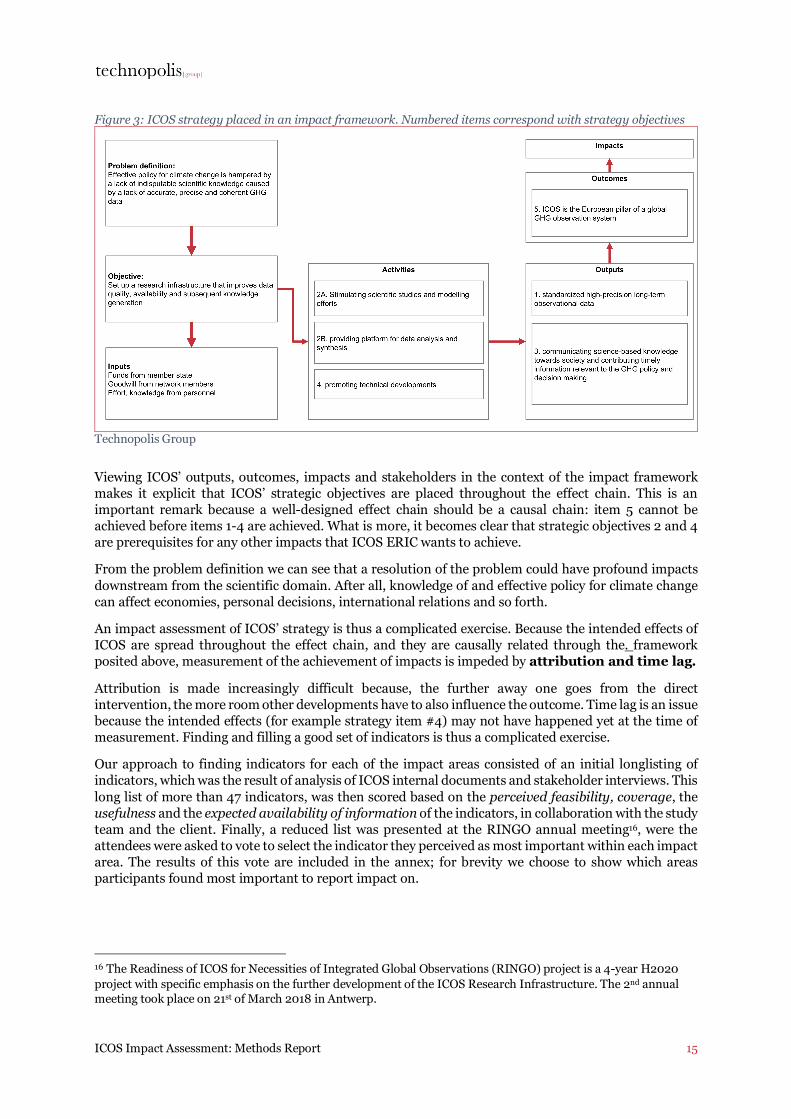
ICOS Impact Assessment: Methods Report
15
Figure 3: ICOS strategy placed in an impact framework. Numbered items correspond with strategy objectives
Technopolis Group
Viewing ICOS’ outputs, outcomes, impacts and stakeholders in the context of the impact framework makes it explicit that ICOS’ strategic objectives are placed throughout the effect chain. This is an important remark because a well-designed effect chain should be a causal chain: item 5 cannot be achieved before items 1-4 are achieved. What is more, it becomes clear that strategic objectives 2 and 4 are prerequisites for any other impacts that ICOS ERIC wants to achieve.
From the problem definition we can see that a resolution of the problem could have profound impacts downstream from the scientific domain. After all, knowledge of and effective policy for climate change can affect economies, personal decisions, international relations and so forth.
An impact assessment of ICOS’ strategy is thus a complicated exercise. Because the intended effects of ICOS are spread throughout the effect chain, and they are causally related through the. framework posited above, measurement of the achievement of impacts is impeded by attribution and time lag.
Attribution is made increasingly difficult because, the further away one goes from the direct intervention, the more room other developments have to also influence the outcome. Time lag is an issue because the intended effects (for example strategy item #4) may not have happened yet at the time of measurement. Finding and filling a good set of indicators is thus a complicated exercise.
Our approach to finding indicators for each of the impact areas consisted of an initial longlisting of indicators, which was the result of analysis of ICOS internal documents and stakeholder interviews. This long list of more than 47 indicators, was then scored based on the perceived feasibility, coverage, the usefulness and the expected availability of information of the indicators, in collaboration with the study team and the client. Finally, a reduced list was presented at the RINGO annual meeting16, were the attendees were asked to vote to select the indicator they perceived as most important within each impact area. The results of this vote are included in the annex; for brevity we choose to show which areas participants found most important to report impact on.
16 The Readiness of ICOS for Necessities of Integrated Global Observations (RINGO) project is a 4-year H2020 project with specific emphasis on the further development of the ICOS Research Infrastructure. The 2nd annual meeting took place on 21st of March 2018 in Antwerp.
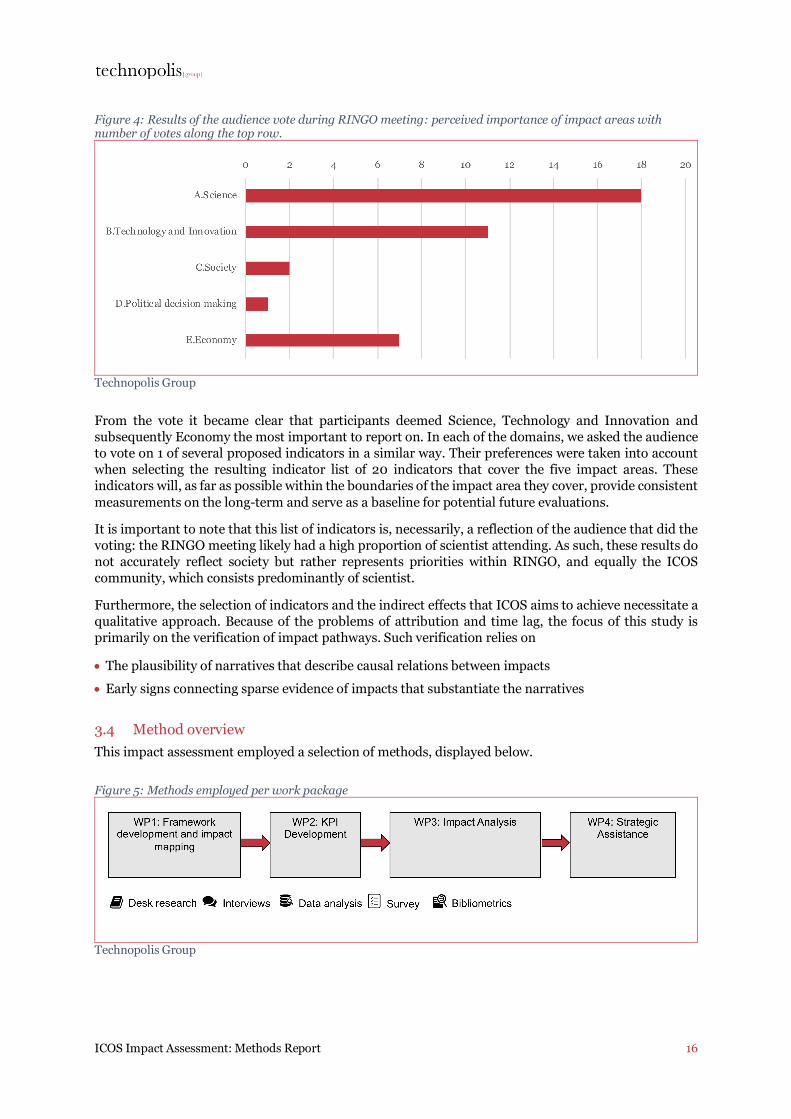
ICOS Impact Assessment: Methods Report
16
Figure 4: Results of the audience vote during RINGO meeting: perceived importance of impact areas with number of votes along the top row.
Technopolis Group
From the vote it became clear that participants deemed Science, Technology and Innovation and subsequently Economy the most important to report on. In each of the domains, we asked the audience to vote on 1 of several proposed indicators in a similar way. Their preferences were taken into account when selecting the resulting indicator list of 20 indicators that cover the five impact areas. These indicators will, as far as possible within the boundaries of the impact area they cover, provide consistent measurements on the long-term and serve as a baseline for potential future evaluations.
It is important to note that this list of indicators is, necessarily, a reflection of the audience that did the voting: the RINGO meeting likely had a high proportion of scientist attending. As such, these results do not accurately reflect society but rather represents priorities within RINGO, and equally the ICOS community, which consists predominantly of scientist.
Furthermore, the selection of indicators and the indirect effects that ICOS aims to achieve necessitate a qualitative approach. Because of the problems of attribution and time lag, the focus of this study is primarily on the verification of impact pathways. Such verification relies on
• The plausibility of narratives that describe causal relations between impacts • Early signs connecting sparse evidence of impacts that substantiate the narratives
3.4 Method overview This impact assessment employed a selection of methods, displayed below.
Figure 5: Methods employed per work package
Technopolis Group
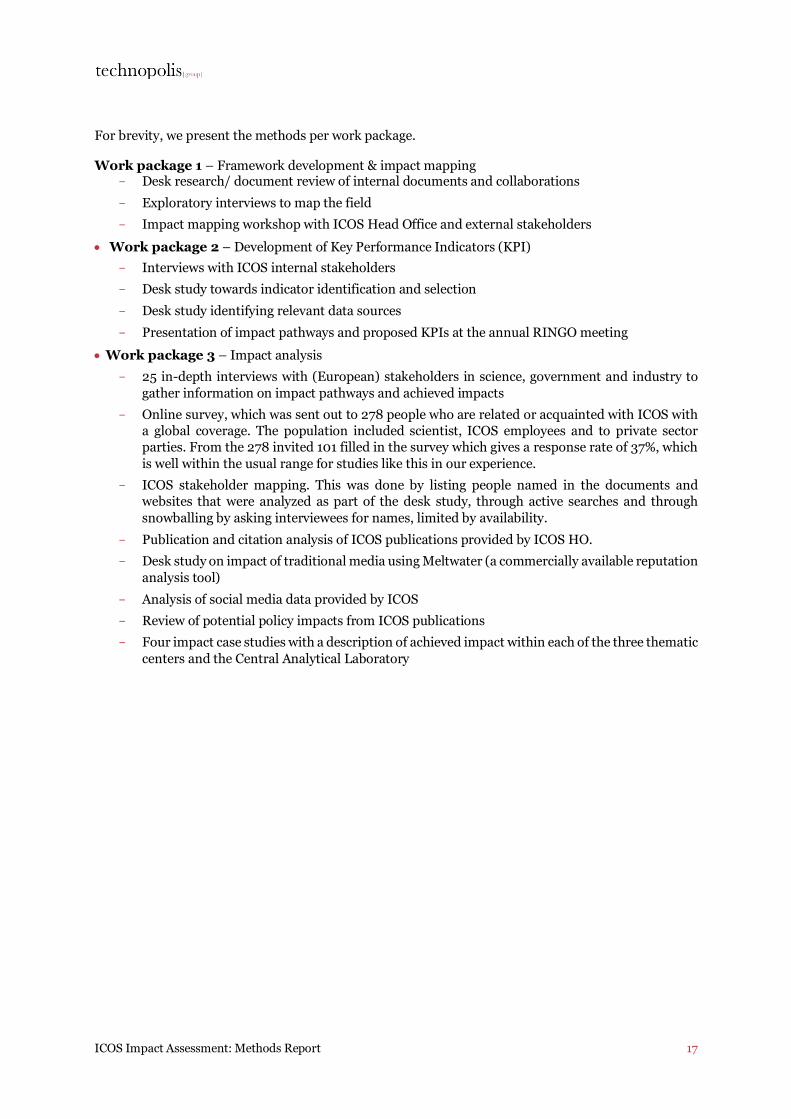
ICOS Impact Assessment: Methods Report
17
For brevity, we present the methods per work package. Work package 1 – Framework development & impact mapping
- Desk research/ document review of internal documents and collaborations - Exploratory interviews to map the field - Impact mapping workshop with ICOS Head Office and external stakeholders
• Work package 2 – Development of Key Performance Indicators (KPI) - Interviews with ICOS internal stakeholders - Desk study towards indicator identification and selection - Desk study identifying relevant data sources - Presentation of impact pathways and proposed KPIs at the annual RINGO meeting
• Work package 3 – Impact analysis - 25 in-depth interviews with (European) stakeholders in science, government and industry to
gather information on impact pathways and achieved impacts - Online survey, which was sent out to 278 people who are related or acquainted with ICOS with
a global coverage. The population included scientist, ICOS employees and to private sector parties. From the 278 invited 101 filled in the survey which gives a response rate of 37%, which is well within the usual range for studies like this in our experience.
- ICOS stakeholder mapping. This was done by listing people named in the documents and websites that were analyzed as part of the desk study, through active searches and through snowballing by asking interviewees for names, limited by availability.
- Publication and citation analysis of ICOS publications provided by ICOS HO. - Desk study on impact of traditional media using Meltwater (a commercially available reputation
analysis tool) - Analysis of social media data provided by ICOS - Review of potential policy impacts from ICOS publications - Four impact case studies with a description of achieved impact within each of the three thematic
centers and the Central Analytical Laboratory

ICOS Impact Assessment: Methods Report
18
4 Critical reflection on the suitability of frameworks and methods
4.1 Reflection on choice of impact framework The study team planned to use a “standard” framework that they often applied to research infrastructure impact assessments. Developed by Technopolis for the UK ministry of Business, Innovation and Skills in 2013, it aims to capture “by products” of large scientific infrastructures. Such by products are allocated in first-order effects (mostly employment) and second order effects of innovations, spin-offs and spill-overs, joint ventures, capacity building. The effects are generated in different phases of the lifetime of the infrastructure: from construction, to operation and (scientific) output. A graphical representation is given below: Figure 6: Impact assessment framework for physical infrastructures
Technopolis Group
It soon became clear that this framework was not well suited for the assignment, because:
• The virtual nature of ICOS makes it hard to distinguish phases of construction and operation. After all, most elements of the RI were already in existence before ICOS ERIC came into being;
• A distributed research infrastructure makes attribution of economic as well as societal and innovation effects very difficult;
• The mission statements of ICOS have a more qualitative nature than the usual “production of scientific output”, which are hard to capture in an innovation science framework;
• The Impact assessment was too early in ICOS ERIC’s lifetime to be able to trace (quantitatively) measurable effects. Official ICOS data is only now about to be published. In addition, he ICOS data attribution policy, where scientists using ICOS data are obliged to mention ICOS, was not yet functional to a satisfactory degree when the assessment was made.
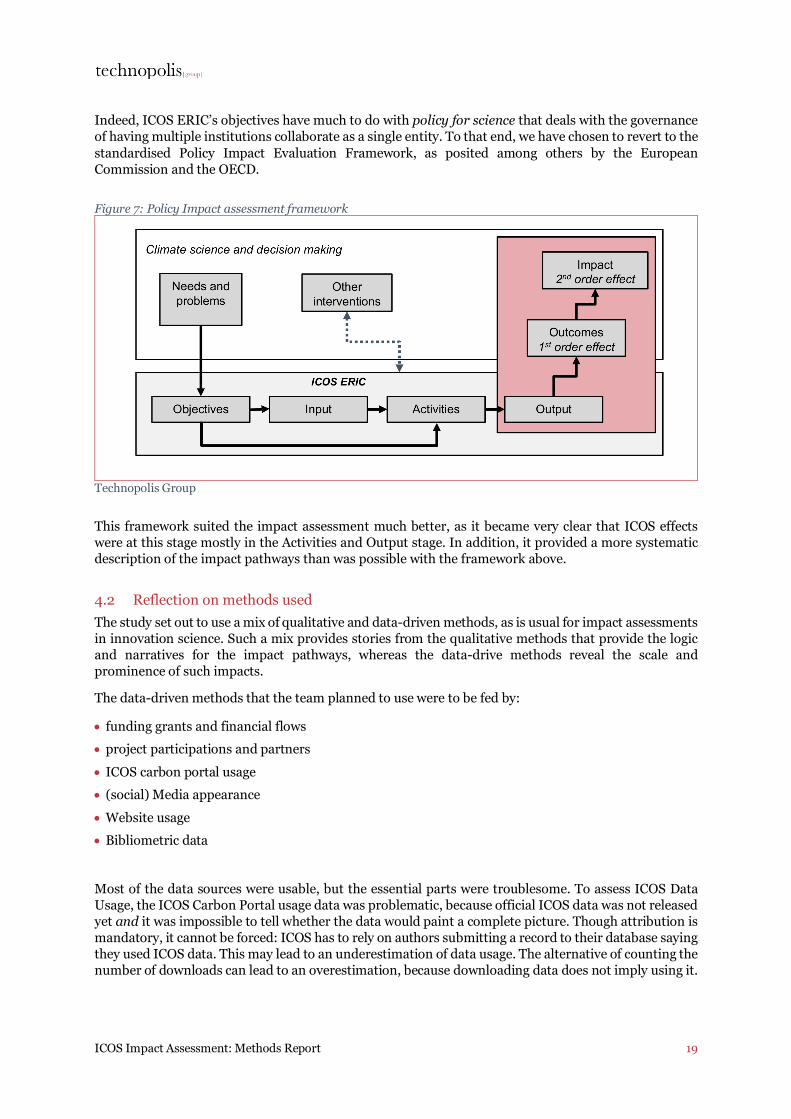
ICOS Impact Assessment: Methods Report
19
Indeed, ICOS ERIC’s objectives have much to do with policy for science that deals with the governance of having multiple institutions collaborate as a single entity. To that end, we have chosen to revert to the standardised Policy Impact Evaluation Framework, as posited among others by the European Commission and the OECD.
Figure 7: Policy Impact assessment framework
Technopolis Group
This framework suited the impact assessment much better, as it became very clear that ICOS effects were at this stage mostly in the Activities and Output stage. In addition, it provided a more systematic description of the impact pathways than was possible with the framework above.
4.2 Reflection on methods used The study set out to use a mix of qualitative and data-driven methods, as is usual for impact assessments in innovation science. Such a mix provides stories from the qualitative methods that provide the logic and narratives for the impact pathways, whereas the data-drive methods reveal the scale and prominence of such impacts.
The data-driven methods that the team planned to use were to be fed by:
• funding grants and financial flows • project participations and partners • ICOS carbon portal usage • (social) Media appearance • Website usage • Bibliometric data
Most of the data sources were usable, but the essential parts were troublesome. To assess ICOS Data Usage, the ICOS Carbon Portal usage data was problematic, because official ICOS data was not released yet and it was impossible to tell whether the data would paint a complete picture. Though attribution is mandatory, it cannot be forced: ICOS has to rely on authors submitting a record to their database saying they used ICOS data. This may lead to an underestimation of data usage. The alternative of counting the number of downloads can lead to an overestimation, because downloading data does not imply using it.
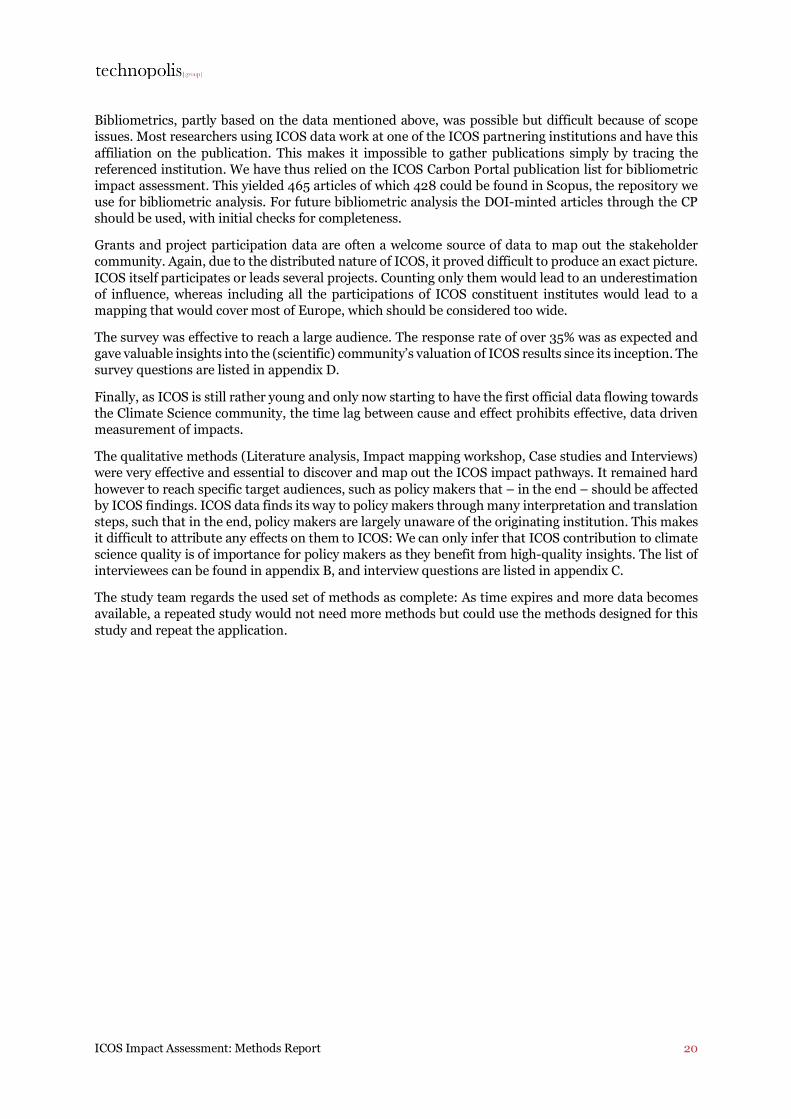
ICOS Impact Assessment: Methods Report
20
Bibliometrics, partly based on the data mentioned above, was possible but difficult because of scope issues. Most researchers using ICOS data work at one of the ICOS partnering institutions and have this affiliation on the publication. This makes it impossible to gather publications simply by tracing the referenced institution. We have thus relied on the ICOS Carbon Portal publication list for bibliometric impact assessment. This yielded 465 articles of which 428 could be found in Scopus, the repository we use for bibliometric analysis. For future bibliometric analysis the DOI-minted articles through the CP should be used, with initial checks for completeness.
Grants and project participation data are often a welcome source of data to map out the stakeholder community. Again, due to the distributed nature of ICOS, it proved difficult to produce an exact picture. ICOS itself participates or leads several projects. Counting only them would lead to an underestimation of influence, whereas including all the participations of ICOS constituent institutes would lead to a mapping that would cover most of Europe, which should be considered too wide.
The survey was effective to reach a large audience. The response rate of over 35% was as expected and gave valuable insights into the (scientific) community’s valuation of ICOS results since its inception. The survey questions are listed in appendix D.
Finally, as ICOS is still rather young and only now starting to have the first official data flowing towards the Climate Science community, the time lag between cause and effect prohibits effective, data driven measurement of impacts.
The qualitative methods (Literature analysis, Impact mapping workshop, Case studies and Interviews) were very effective and essential to discover and map out the ICOS impact pathways. It remained hard however to reach specific target audiences, such as policy makers that – in the end – should be affected by ICOS findings. ICOS data finds its way to policy makers through many interpretation and translation steps, such that in the end, policy makers are largely unaware of the originating institution. This makes it difficult to attribute any effects on them to ICOS: We can only infer that ICOS contribution to climate science quality is of importance for policy makers as they benefit from high-quality insights. The list of interviewees can be found in appendix B, and interview questions are listed in appendix C.
The study team regards the used set of methods as complete: As time expires and more data becomes available, a repeated study would not need more methods but could use the methods designed for this study and repeat the application.
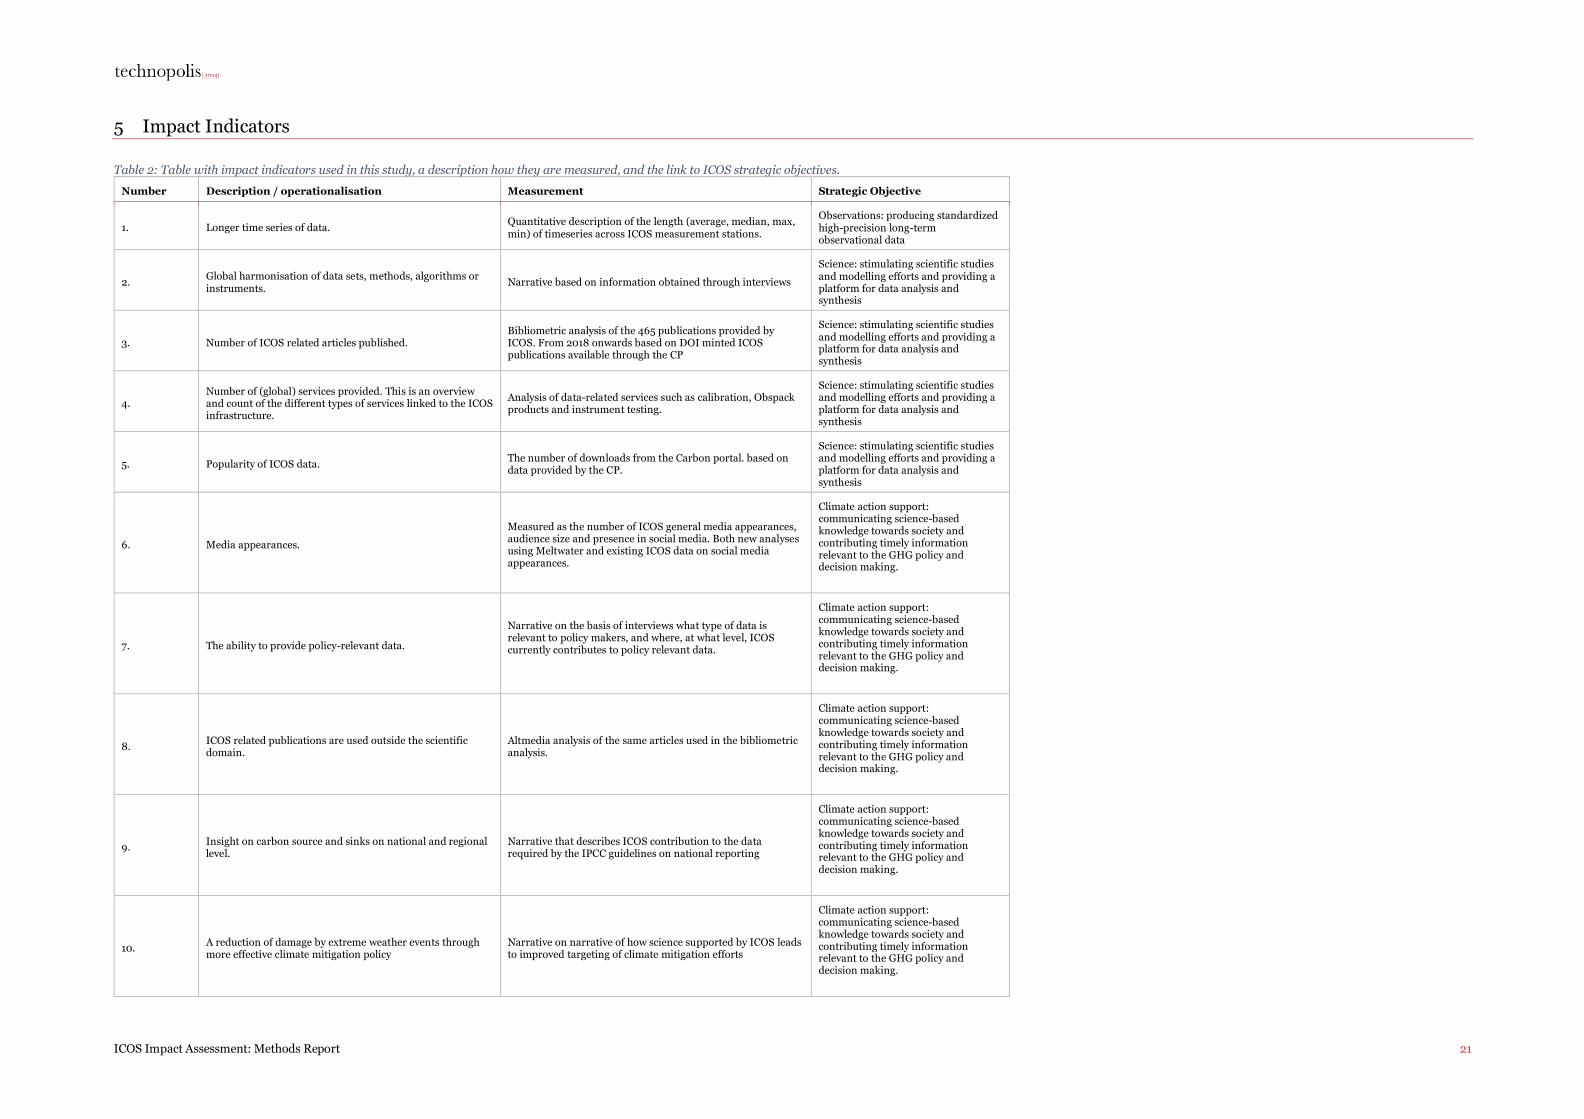
ICOS Impact Assessment: Methods Report
21
5 Impact Indicators
Table 2: Table with impact indicators used in this study, a description how they are measured, and the link to ICOS strategic objectives. Number Description / operationalisation Measurement Strategic Objective
1. Longer time series of data. Quantitative description of the length (average, median, max, min) of timeseries across ICOS measurement stations.
Observations: producing standardized high-precision long-term observational data
2. Global harmonisation of data sets, methods, algorithms or instruments. Narrative based on information obtained through interviews
Science: stimulating scientific studies and modelling efforts and providing a platform for data analysis and synthesis
3. Number of ICOS related articles published. Bibliometric analysis of the 465 publications provided by ICOS. From 2018 onwards based on DOI minted ICOS publications available through the CP
Science: stimulating scientific studies and modelling efforts and providing a platform for data analysis and synthesis
4. Number of (global) services provided. This is an overview and count of the different types of services linked to the ICOS infrastructure.
Analysis of data-related services such as calibration, Obspack products and instrument testing.
Science: stimulating scientific studies and modelling efforts and providing a platform for data analysis and synthesis
5. Popularity of ICOS data. The number of downloads from the Carbon portal. based on data provided by the CP.
Science: stimulating scientific studies and modelling efforts and providing a platform for data analysis and synthesis
6. Media appearances.
Measured as the number of ICOS general media appearances, audience size and presence in social media. Both new analyses using Meltwater and existing ICOS data on social media appearances.
Climate action support: communicating science-based knowledge towards society and contributing timely information relevant to the GHG policy and decision making.
7. The ability to provide policy-relevant data.
Narrative on the basis of interviews what type of data is relevant to policy makers, and where, at what level, ICOS currently contributes to policy relevant data.
Climate action support: communicating science-based knowledge towards society and contributing timely information relevant to the GHG policy and decision making.
8. ICOS related publications are used outside the scientific domain.
Altmedia analysis of the same articles used in the bibliometric analysis.
Climate action support: communicating science-based knowledge towards society and contributing timely information relevant to the GHG policy and decision making.
9. Insight on carbon source and sinks on national and regional level.
Narrative that describes ICOS contribution to the data required by the IPCC guidelines on national reporting
Climate action support: communicating science-based knowledge towards society and contributing timely information relevant to the GHG policy and decision making.
10. A reduction of damage by extreme weather events through more effective climate mitigation policy
Narrative on narrative of how science supported by ICOS leads to improved targeting of climate mitigation efforts
Climate action support: communicating science-based knowledge towards society and contributing timely information relevant to the GHG policy and decision making.

ICOS Impact Assessment: Methods Report
22
11. Improved long-term decisions through enhanced political discourse based on evidence
Analysis based on Almetrics results to map how many different institutions that are involved in climate policy have referred to ICOS
Climate action support: communicating science-based knowledge towards society and contributing timely information relevant to the GHG policy and decision making.
12. The formation of public-private partnerships and outcomes: products or enterprises. The number and appreciation of partnerships between ICOS and commercial enterprises.
Based on document analysis and narrative based on interviews with commercial partners.
Innovation: promoting technical developments, interaction with industry, testing and deployment of new instruments and techniques
13. Investments mobilised by ICOS. These are the costs associated with building the ICOS network assuming no prior infrastructure (this is the method used by ESFRI). Based on financial documents provided by the HO.
Innovation: promoting technical developments, interaction with industry, testing and deployment of new instruments and techniques
14. Joint ventures, asset sharing, joint research activities with other research infrastructures.
Count and description of the number of joint research projects that ICOS takes part in. This includes description of services such as management services, data lifecycle documents and statutes.
Cooperation: making ICOS the European pillar of a global in-situ GHG observation system
15. Number of attendees of and presentations during the ICOS science conference
Count of attendees, oral presentations and poster presentations during the most recent science conference (2016 in this report)
Cooperation: making ICOS the European pillar of a global in-situ GHG observation system
16. Application of ICOS data in globally leading models Narrative based on document analysis and interviews. Cooperation: making ICOS the European pillar of a global in-situ GHG observation system
17.
Recognition of ICOS as a blueprint for global measurement networks. Narrative based on information obtained through interviews.
Cooperation: making ICOS the European pillar of a global in-situ GHG observation system
ICOS Impact Assessment: Impact indicator report 23
Part 2: Impact indicator report
5.1 Introduction This impact indicators report is the second part of the two-part report that describes the findings from the impact analysis of the ICOS ERIC, performed by Technopolis between January – June 2018. Part one, the methods report, provides context and background to the impact analysis and describes the impact framework and methods that were used in this study. It also provides a critical reflection on the methods. The methods report ends with a table of 17 Key Performance Indicators (KPIs, from here on referred to as impact indicators) that were used to measure ICOS impacts, that are the topic of this second report.
The report below, the impact indicator report, describes the findings from our analysis of these 17 impact indicators. These findings provide a reflection of the current direct and indirect impacts of the ICOS ERIC. The findings on these 17 impact indicators are intended to serve as a baseline for future monitoring and assessment, which is why they are presented in a separate stand-alone report.
Although these impact indicators are stand-alone, we have chosen to present them in the order and categories that align with ICOS recently updated strategic objectives. These objectives are:
• Producing standardized high-precision long-term observational data • Stimulating scientific studies and modelling efforts and providing platform for data analysis and
synthesis • Communicating science-based knowledge towards society and contributing timely information
relevant to the GHG policy and decision-making • Promoting technical developments • Ensuring that ICOS is the European pillar of a global GHG observation system
Hence, these are the headers of the sections in this impact indicator report. Table 2 in the methods report gives a one-glance overview of how the impact indicators map on ICOS’ strategic objectives. The intention is that these impact indicators and their results can inform future revisions of ICOS’ strategic objectives.
It is important to note that although the strategic objectives are separate, this is not to say that they differ in their aim: as can be seen in figure 3 in the methods report, they merely hold different positions in the impact framework that describes how ICOS actions contribute to impacts. At the beginning of each section in this report there is a short description on where each of the impact indicators in that section fit in the impact framework which divides the impact pathway into Activities, Outputs, Outcomes and subsequently Impacts.
Lastly, a number of stakeholders mentioned the high level of organisation within ICOS as an important contributor to ICOS success. To emphasise this role of organisational structure in achieving impact, we describe this at the beginning of each impact indicator where relevant. This report ends with conclusion in which we summarise the findings and provide an overview of where ICOS stands, based on the findings on the impact indicators. The appendix of this report (Appendix A) contains four case studies. Each case study covers one of the four central research facilities within ICOS: The Atmospheric Thematic Centre (ATC), the Ecosystem Thematic Centre (ETC), the Ocean Thematic Centre (OTC) and the Central Analytical Laboratories (CAL). These case studies are based on interviews and desk study and provide a two-page in-depth illustration of how impacts are generated within each area.
Similar to the methods report, we will throughout the texts use ICOS ERIC to refer to itself, and ICOS to refer to the ICOS RI, unless stated otherwise.
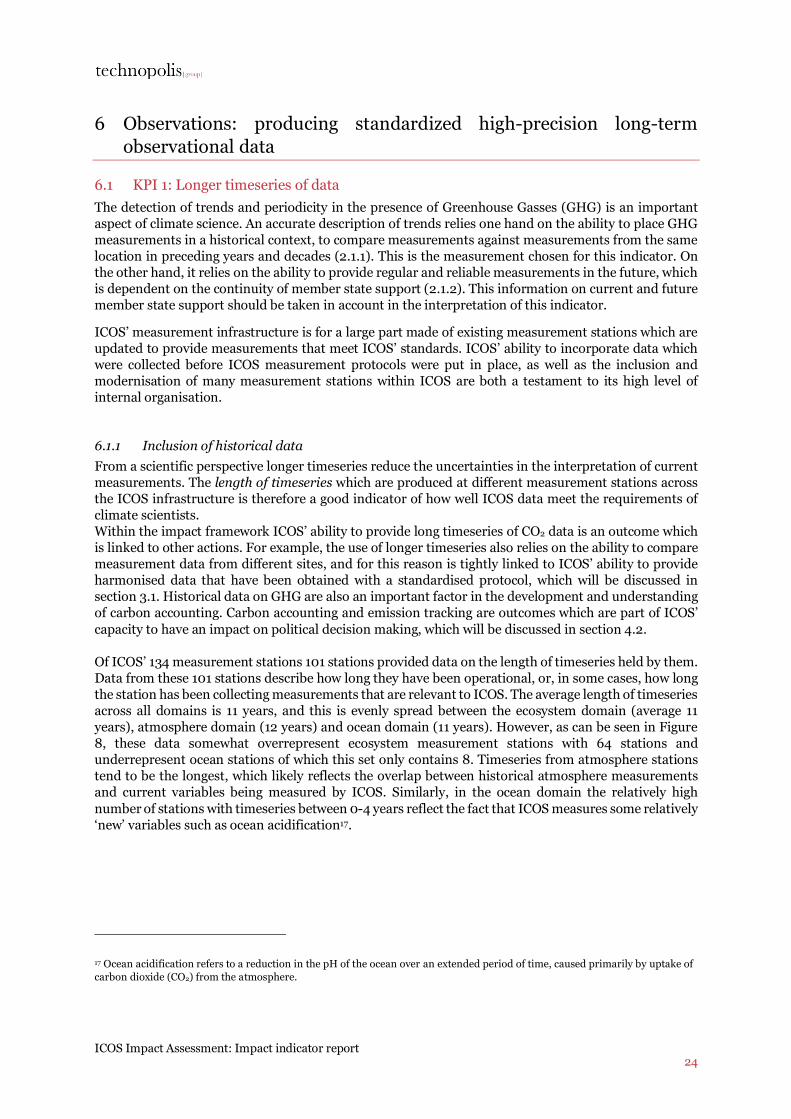
ICOS Impact Assessment: Impact indicator report 24
6 Observations: producing standardized high-precision long-term observational data
6.1 KPI 1: Longer timeseries of data The detection of trends and periodicity in the presence of Greenhouse Gasses (GHG) is an important aspect of climate science. An accurate description of trends relies one hand on the ability to place GHG measurements in a historical context, to compare measurements against measurements from the same location in preceding years and decades (2.1.1). This is the measurement chosen for this indicator. On the other hand, it relies on the ability to provide regular and reliable measurements in the future, which is dependent on the continuity of member state support (2.1.2). This information on current and future member state support should be taken in account in the interpretation of this indicator.
ICOS’ measurement infrastructure is for a large part made of existing measurement stations which are updated to provide measurements that meet ICOS’ standards. ICOS’ ability to incorporate data which were collected before ICOS measurement protocols were put in place, as well as the inclusion and modernisation of many measurement stations within ICOS are both a testament to its high level of internal organisation.
6.1.1 Inclusion of historical data From a scientific perspective longer timeseries reduce the uncertainties in the interpretation of current measurements. The length of timeseries which are produced at different measurement stations across the ICOS infrastructure is therefore a good indicator of how well ICOS data meet the requirements of climate scientists. Within the impact framework ICOS’ ability to provide long timeseries of CO2 data is an outcome which is linked to other actions. For example, the use of longer timeseries also relies on the ability to compare measurement data from different sites, and for this reason is tightly linked to ICOS’ ability to provide harmonised data that have been obtained with a standardised protocol, which will be discussed in section 3.1. Historical data on GHG are also an important factor in the development and understanding of carbon accounting. Carbon accounting and emission tracking are outcomes which are part of ICOS’ capacity to have an impact on political decision making, which will be discussed in section 4.2. Of ICOS’ 134 measurement stations 101 stations provided data on the length of timeseries held by them. Data from these 101 stations describe how long they have been operational, or, in some cases, how long the station has been collecting measurements that are relevant to ICOS. The average length of timeseries across all domains is 11 years, and this is evenly spread between the ecosystem domain (average 11 years), atmosphere domain (12 years) and ocean domain (11 years). However, as can be seen in Figure 8, these data somewhat overrepresent ecosystem measurement stations with 64 stations and underrepresent ocean stations of which this set only contains 8. Timeseries from atmosphere stations tend to be the longest, which likely reflects the overlap between historical atmosphere measurements and current variables being measured by ICOS. Similarly, in the ocean domain the relatively high number of stations with timeseries between 0-4 years reflect the fact that ICOS measures some relatively ‘new’ variables such as ocean acidification17.
17 Ocean acidification refers to a reduction in the pH of the ocean over an extended period of time, caused primarily by uptake of carbon dioxide (CO2) from the atmosphere.
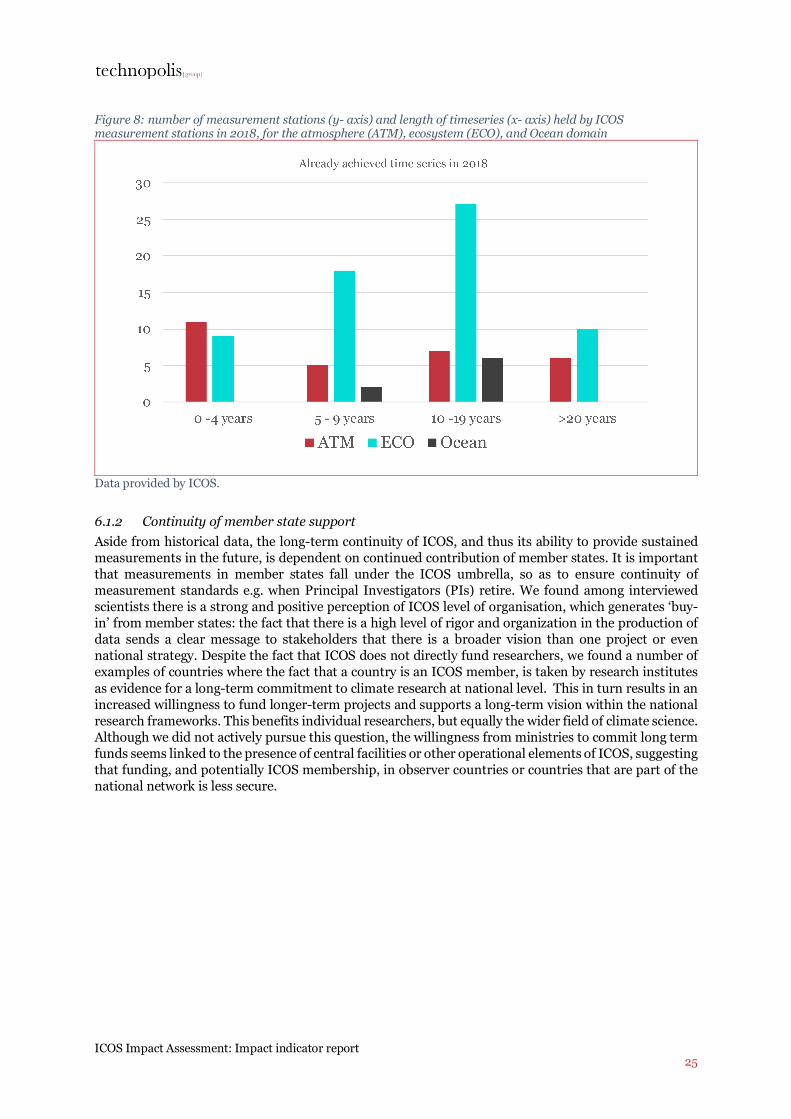
ICOS Impact Assessment: Impact indicator report 25
Figure 8: number of measurement stations (y- axis) and length of timeseries (x- axis) held by ICOS measurement stations in 2018, for the atmosphere (ATM), ecosystem (ECO), and Ocean domain
Data provided by ICOS.
6.1.2 Continuity of member state support Aside from historical data, the long-term continuity of ICOS, and thus its ability to provide sustained measurements in the future, is dependent on continued contribution of member states. It is important that measurements in member states fall under the ICOS umbrella, so as to ensure continuity of measurement standards e.g. when Principal Investigators (PIs) retire. We found among interviewed scientists there is a strong and positive perception of ICOS level of organisation, which generates ‘buy-in’ from member states: the fact that there is a high level of rigor and organization in the production of data sends a clear message to stakeholders that there is a broader vision than one project or even national strategy. Despite the fact that ICOS does not directly fund researchers, we found a number of examples of countries where the fact that a country is an ICOS member, is taken by research institutes as evidence for a long-term commitment to climate research at national level. This in turn results in an increased willingness to fund longer-term projects and supports a long-term vision within the national research frameworks. This benefits individual researchers, but equally the wider field of climate science. Although we did not actively pursue this question, the willingness from ministries to commit long term funds seems linked to the presence of central facilities or other operational elements of ICOS, suggesting that funding, and potentially ICOS membership, in observer countries or countries that are part of the national network is less secure.
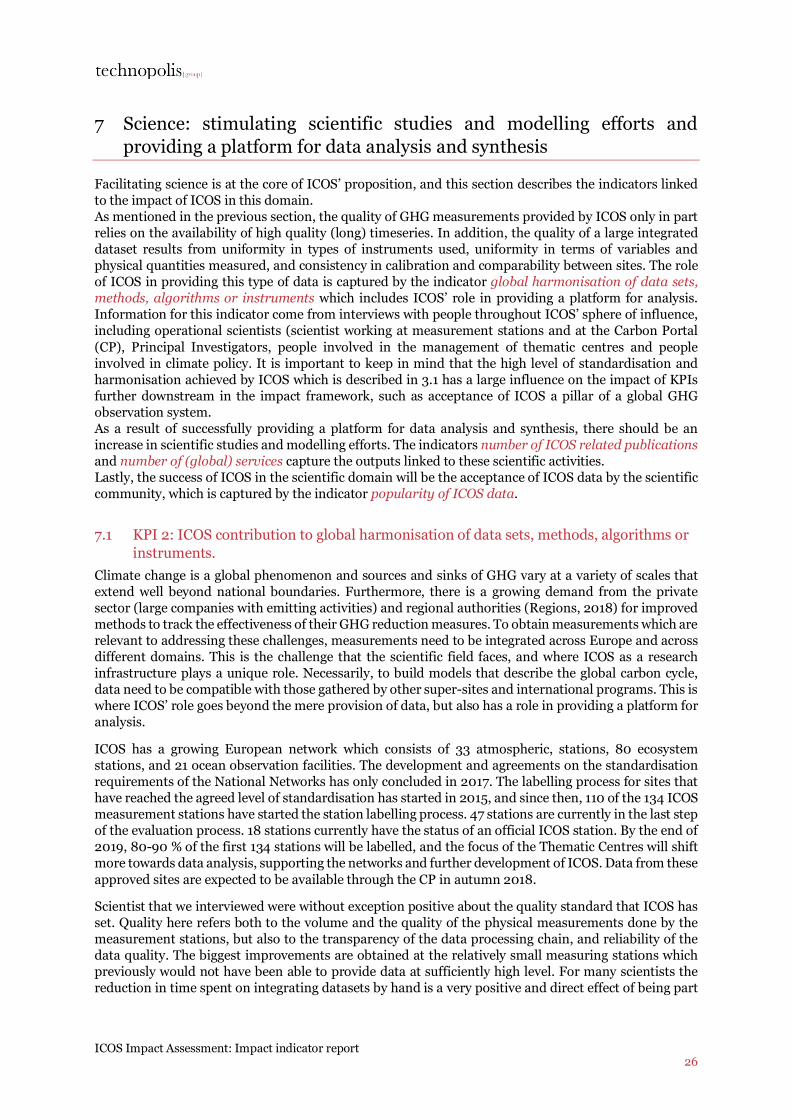
ICOS Impact Assessment: Impact indicator report 26
7 Science: stimulating scientific studies and modelling efforts and providing a platform for data analysis and synthesis
Facilitating science is at the core of ICOS’ proposition, and this section describes the indicators linked to the impact of ICOS in this domain. As mentioned in the previous section, the quality of GHG measurements provided by ICOS only in part relies on the availability of high quality (long) timeseries. In addition, the quality of a large integrated dataset results from uniformity in types of instruments used, uniformity in terms of variables and physical quantities measured, and consistency in calibration and comparability between sites. The role of ICOS in providing this type of data is captured by the indicator global harmonisation of data sets, methods, algorithms or instruments which includes ICOS’ role in providing a platform for analysis. Information for this indicator come from interviews with people throughout ICOS’ sphere of influence, including operational scientists (scientist working at measurement stations and at the Carbon Portal (CP), Principal Investigators, people involved in the management of thematic centres and people involved in climate policy. It is important to keep in mind that the high level of standardisation and harmonisation achieved by ICOS which is described in 3.1 has a large influence on the impact of KPIs further downstream in the impact framework, such as acceptance of ICOS a pillar of a global GHG observation system. As a result of successfully providing a platform for data analysis and synthesis, there should be an increase in scientific studies and modelling efforts. The indicators number of ICOS related publications and number of (global) services capture the outputs linked to these scientific activities. Lastly, the success of ICOS in the scientific domain will be the acceptance of ICOS data by the scientific community, which is captured by the indicator popularity of ICOS data.
7.1 KPI 2: ICOS contribution to global harmonisation of data sets, methods, algorithms or instruments.
Climate change is a global phenomenon and sources and sinks of GHG vary at a variety of scales that extend well beyond national boundaries. Furthermore, there is a growing demand from the private sector (large companies with emitting activities) and regional authorities (Regions, 2018) for improved methods to track the effectiveness of their GHG reduction measures. To obtain measurements which are relevant to addressing these challenges, measurements need to be integrated across Europe and across different domains. This is the challenge that the scientific field faces, and where ICOS as a research infrastructure plays a unique role. Necessarily, to build models that describe the global carbon cycle, data need to be compatible with those gathered by other super-sites and international programs. This is where ICOS’ role goes beyond the mere provision of data, but also has a role in providing a platform for analysis.
ICOS has a growing European network which consists of 33 atmospheric, stations, 80 ecosystem stations, and 21 ocean observation facilities. The development and agreements on the standardisation requirements of the National Networks has only concluded in 2017. The labelling process for sites that have reached the agreed level of standardisation has started in 2015, and since then, 110 of the 134 ICOS measurement stations have started the station labelling process. 47 stations are currently in the last step of the evaluation process. 18 stations currently have the status of an official ICOS station. By the end of 2019, 80-90 % of the first 134 stations will be labelled, and the focus of the Thematic Centres will shift more towards data analysis, supporting the networks and further development of ICOS. Data from these approved sites are expected to be available through the CP in autumn 2018.
Scientist that we interviewed were without exception positive about the quality standard that ICOS has set. Quality here refers both to the volume and the quality of the physical measurements done by the measurement stations, but also to the transparency of the data processing chain, and reliability of the data quality. The biggest improvements are obtained at the relatively small measuring stations which previously would not have been able to provide data at sufficiently high level. For many scientists the reduction in time spent on integrating datasets by hand is a very positive and direct effect of being part
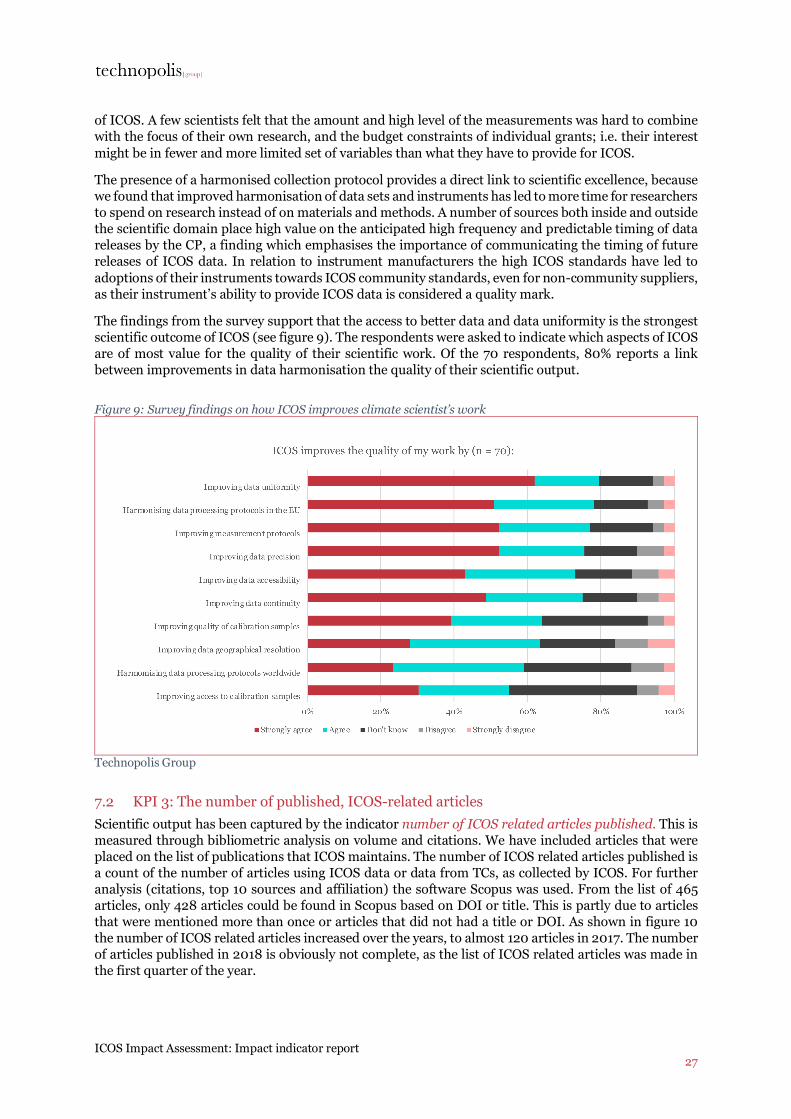
ICOS Impact Assessment: Impact indicator report 27
of ICOS. A few scientists felt that the amount and high level of the measurements was hard to combine with the focus of their own research, and the budget constraints of individual grants; i.e. their interest might be in fewer and more limited set of variables than what they have to provide for ICOS.
The presence of a harmonised collection protocol provides a direct link to scientific excellence, because we found that improved harmonisation of data sets and instruments has led to more time for researchers to spend on research instead of on materials and methods. A number of sources both inside and outside the scientific domain place high value on the anticipated high frequency and predictable timing of data releases by the CP, a finding which emphasises the importance of communicating the timing of future releases of ICOS data. In relation to instrument manufacturers the high ICOS standards have led to adoptions of their instruments towards ICOS community standards, even for non-community suppliers, as their instrument’s ability to provide ICOS data is considered a quality mark.
The findings from the survey support that the access to better data and data uniformity is the strongest scientific outcome of ICOS (see figure 9). The respondents were asked to indicate which aspects of ICOS are of most value for the quality of their scientific work. Of the 70 respondents, 80% reports a link between improvements in data harmonisation the quality of their scientific output.
Figure 9: Survey findings on how ICOS improves climate scientist’s work
Technopolis Group
7.2 KPI 3: The number of published, ICOS-related articles Scientific output has been captured by the indicator number of ICOS related articles published. This is measured through bibliometric analysis on volume and citations. We have included articles that were placed on the list of publications that ICOS maintains. The number of ICOS related articles published is a count of the number of articles using ICOS data or data from TCs, as collected by ICOS. For further analysis (citations, top 10 sources and affiliation) the software Scopus was used. From the list of 465 articles, only 428 articles could be found in Scopus based on DOI or title. This is partly due to articles that were mentioned more than once or articles that did not had a title or DOI. As shown in figure 10 the number of ICOS related articles increased over the years, to almost 120 articles in 2017. The number of articles published in 2018 is obviously not complete, as the list of ICOS related articles was made in the first quarter of the year.
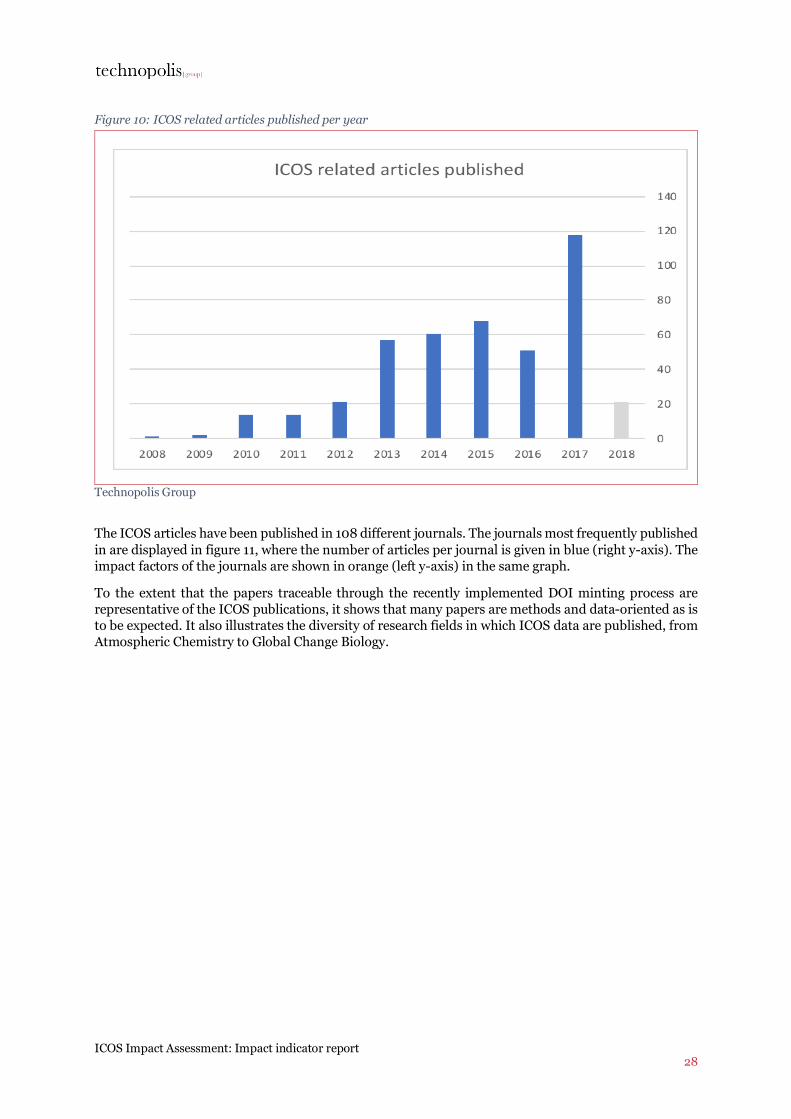
ICOS Impact Assessment: Impact indicator report 28
Figure 10: ICOS related articles published per year
Technopolis Group
The ICOS articles have been published in 108 different journals. The journals most frequently published in are displayed in figure 11, where the number of articles per journal is given in blue (right y-axis). The impact factors of the journals are shown in orange (left y-axis) in the same graph.
To the extent that the papers traceable through the recently implemented DOI minting process are representative of the ICOS publications, it shows that many papers are methods and data-oriented as is to be expected. It also illustrates the diversity of research fields in which ICOS data are published, from Atmospheric Chemistry to Global Change Biology.
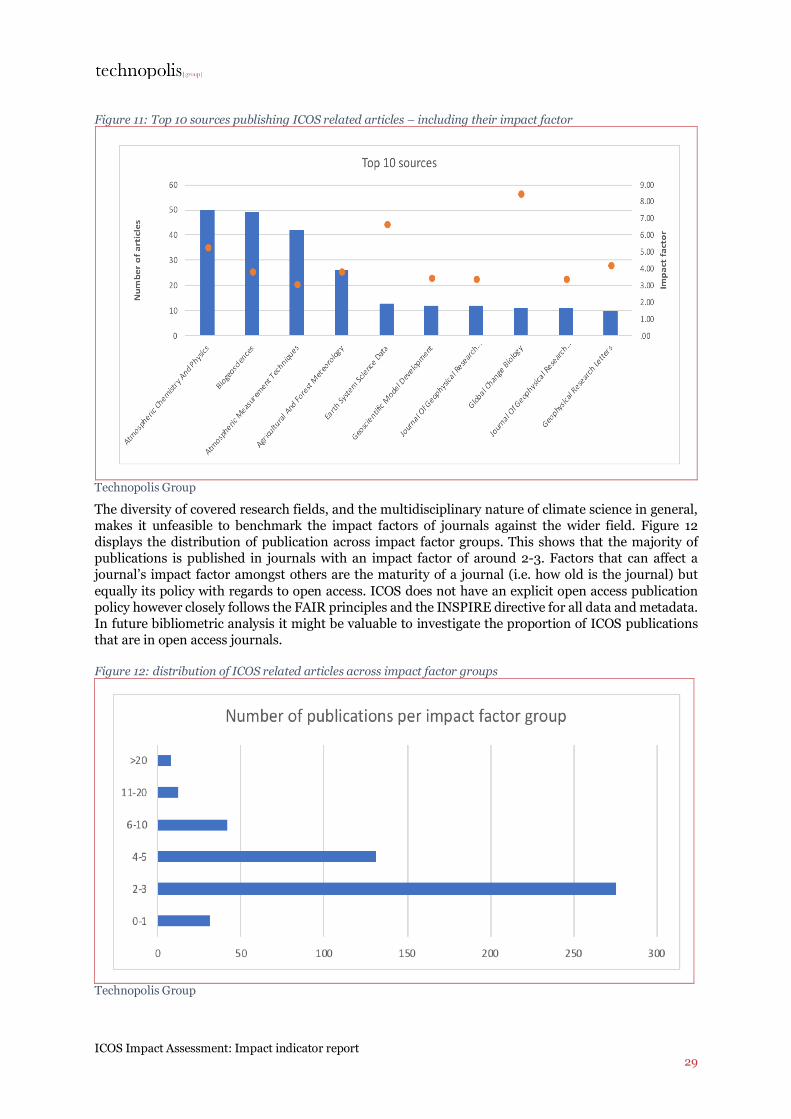
ICOS Impact Assessment: Impact indicator report 29
Figure 11: Top 10 sources publishing ICOS related articles – including their impact factor
Technopolis Group
The diversity of covered research fields, and the multidisciplinary nature of climate science in general, makes it unfeasible to benchmark the impact factors of journals against the wider field. Figure 12 displays the distribution of publication across impact factor groups. This shows that the majority of publications is published in journals with an impact factor of around 2-3. Factors that can affect a journal’s impact factor amongst others are the maturity of a journal (i.e. how old is the journal) but equally its policy with regards to open access. ICOS does not have an explicit open access publication policy however closely follows the FAIR principles and the INSPIRE directive for all data and metadata. In future bibliometric analysis it might be valuable to investigate the proportion of ICOS publications that are in open access journals.
Figure 12: distribution of ICOS related articles across impact factor groups
Technopolis Group
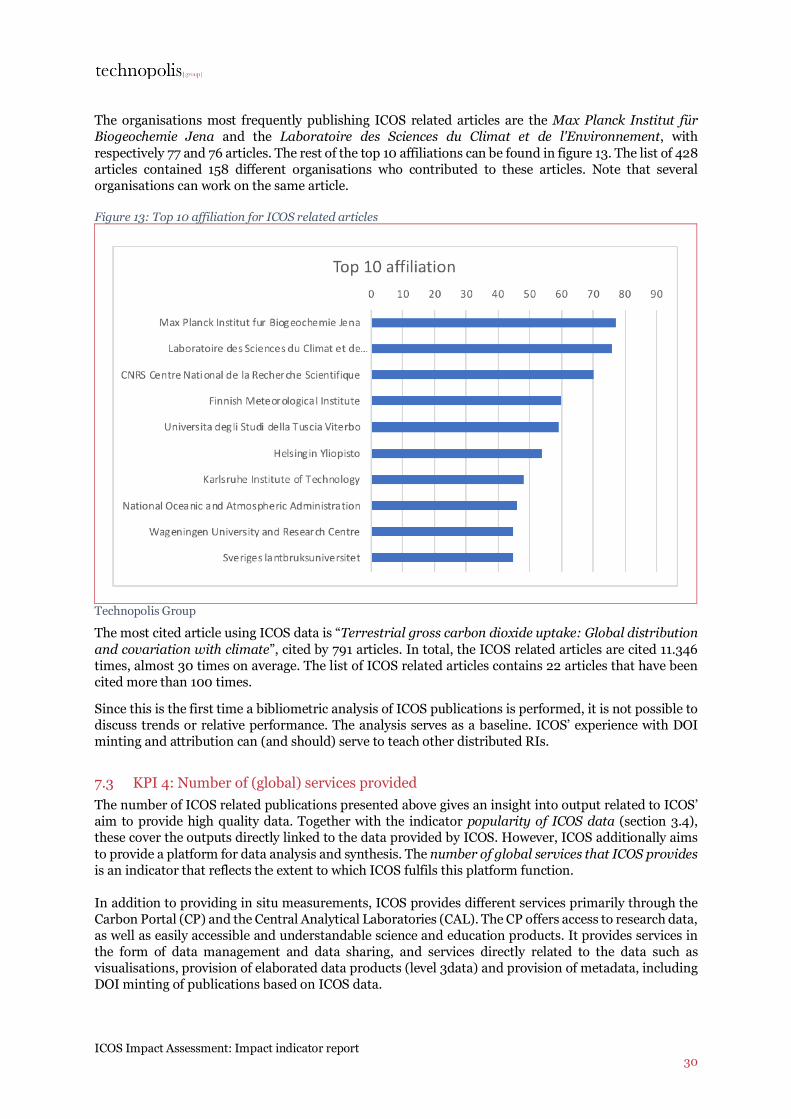
ICOS Impact Assessment: Impact indicator report 30
The organisations most frequently publishing ICOS related articles are the Max Planck Institut für Biogeochemie Jena and the Laboratoire des Sciences du Climat et de l'Environnement, with respectively 77 and 76 articles. The rest of the top 10 affiliations can be found in figure 13. The list of 428 articles contained 158 different organisations who contributed to these articles. Note that several organisations can work on the same article.
Figure 13: Top 10 affiliation for ICOS related articles
Technopolis Group
The most cited article using ICOS data is “Terrestrial gross carbon dioxide uptake: Global distribution and covariation with climate”, cited by 791 articles. In total, the ICOS related articles are cited 11.346 times, almost 30 times on average. The list of ICOS related articles contains 22 articles that have been cited more than 100 times.
Since this is the first time a bibliometric analysis of ICOS publications is performed, it is not possible to discuss trends or relative performance. The analysis serves as a baseline. ICOS’ experience with DOI minting and attribution can (and should) serve to teach other distributed RIs.
7.3 KPI 4: Number of (global) services provided The number of ICOS related publications presented above gives an insight into output related to ICOS’ aim to provide high quality data. Together with the indicator popularity of ICOS data (section 3.4), these cover the outputs directly linked to the data provided by ICOS. However, ICOS additionally aims to provide a platform for data analysis and synthesis. The number of global services that ICOS provides is an indicator that reflects the extent to which ICOS fulfils this platform function. In addition to providing in situ measurements, ICOS provides different services primarily through the Carbon Portal (CP) and the Central Analytical Laboratories (CAL). The CP offers access to research data, as well as easily accessible and understandable science and education products. It provides services in the form of data management and data sharing, and services directly related to the data such as visualisations, provision of elaborated data products (level 3data) and provision of metadata, including DOI minting of publications based on ICOS data.
ICOS Impact Assessment: Impact indicator report 31
One example of the level 3 data offered by the CP are ObsPack products. ObsPack products are data archives which contain CO2 measurements from stations across the globe, around half of which are measurements from ICOS stations. They are produced together with the American counterpart of ICOS, the National Oceanic and Atmospheric Administration (NOAA), and are distributed by the NOAA on a quarterly basis. The uptake of these products is high: the CO2 GLOBALVIEWplus ObsPack product (combined count of V1 and V2) was downloaded on average 184 times a year in the years 2015-201718, and the CarbonTracker_CT ObsPack product 75 times a year in the years 2014-2017. We understand that almost all researchers that do global inverse modelling use these products. They are also used for satellite validation, model evaluation, measurement inter comparison and teaching. Additionally, these ObsPack products are used in the Global Carbon Project, an international research project which publishes the highly influential yearly Carbon Budget (see section 3.2). The fact that these products are published by NOAA limits the attribution to ICOS: although both NOAA and the models and products on which the global carbon project is based are named in the acknowledgements, ICOS is not mentioned. In general ObsPack data archives have a DOI which links it to NOAA, and scientist who use these data are required to include the ObsPack product citation in any publication or presentation using the product. In addition to these ObsPack products, the CP has 11 different level 3 data products available, downloads of which are tracked by the CP. Tangible services are also provided, as the CAL provides reference services that aim to ensure the accuracy of ICOS atmospheric measurement data. These services include the provision of reference gases for calibration of continuous in-situ measurements performed at the monitoring stations, the analysis of air samples taken at the ICOS monitoring stations, the maintenance of sampling containers, the development of sampling equipment and the support of quality control activities. For more information on the CAL, and the impacts of the work it does, see case study 1 under Appendix A. 7.4 KPI 5: The popularity of ICOS data, measured as downloads from the Carbon Portal The Carbon Portal (CP), which is jointly hosted by Sweden and the Netherlands, is an important and integral part of the ICOS ERIC. In its function as information portal the main goal of the CP is to facilitate access to ICOS data, and as such, visitors of the CP websites and downloads of data are a good indicator of how successful ICOS is in providing access to its data. In line with ICOS’ task to operate on a non-economic basis, as outlined in its statutes, the CP offers downloadable research and measurement data under the Creative Commons 4.0 BY licence. This licence allows researchers and students to freely use and analyse the data. The CP registers website usage and data downloads, and although collection of these data has started late 2017, we feel that these are sufficient to give an impression to present here. Data show that over the period September 2017 – March 2018 the Carbon Portal has had 3104 unique users, of which 58% was a returning visitor. Currently the CP has around 400 visits per week. As can be seen in figure 14 visitors to the CP (not downloads) are distributed all over the globe and concentrated in Europe.
18 In the data provided the last quarter of 2017 was missing for the GLOBALVIEWplus V2; data for this quarter have been estimated based on the quarterly average for that year.
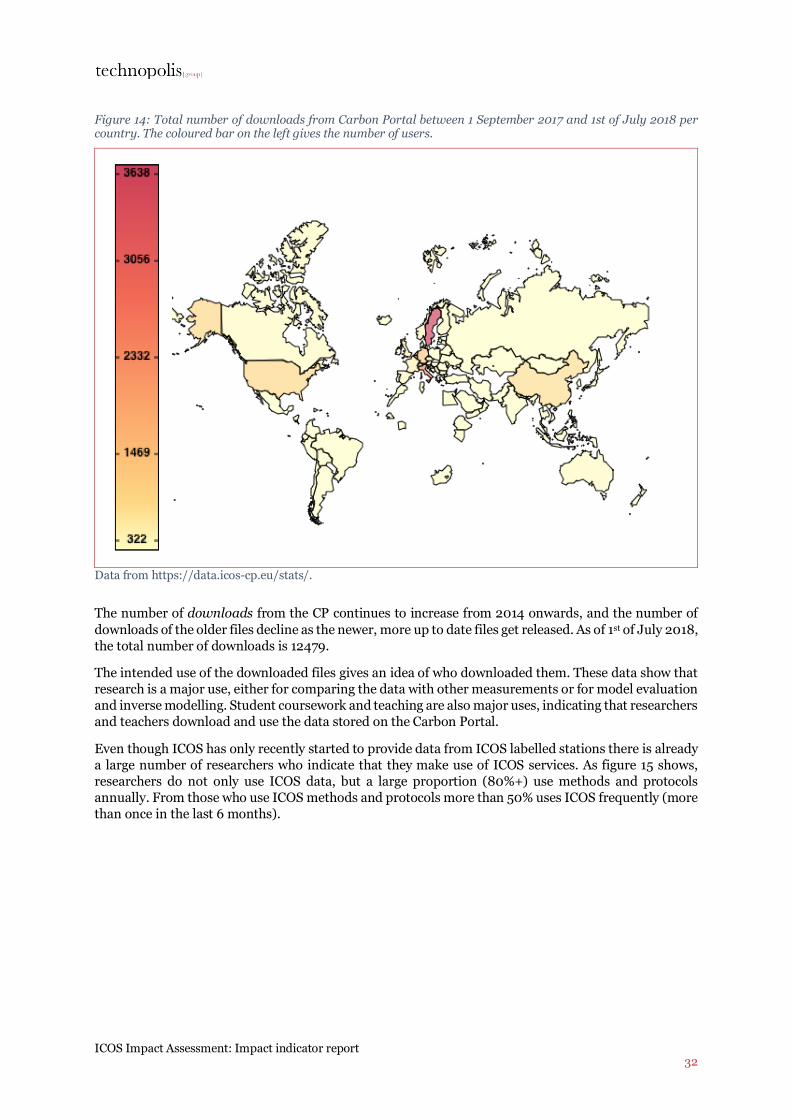
ICOS Impact Assessment: Impact indicator report 32
Figure 14: Total number of downloads from Carbon Portal between 1 September 2017 and 1st of July 2018 per country. The coloured bar on the left gives the number of users.
Data from https://data.icos-cp.eu/stats/.
The number of downloads from the CP continues to increase from 2014 onwards, and the number of downloads of the older files decline as the newer, more up to date files get released. As of 1st of July 2018, the total number of downloads is 12479.
The intended use of the downloaded files gives an idea of who downloaded them. These data show that research is a major use, either for comparing the data with other measurements or for model evaluation and inverse modelling. Student coursework and teaching are also major uses, indicating that researchers and teachers download and use the data stored on the Carbon Portal.
Even though ICOS has only recently started to provide data from ICOS labelled stations there is already a large number of researchers who indicate that they make use of ICOS services. As figure 15 shows, researchers do not only use ICOS data, but a large proportion (80%+) use methods and protocols annually. From those who use ICOS methods and protocols more than 50% uses ICOS frequently (more than once in the last 6 months).
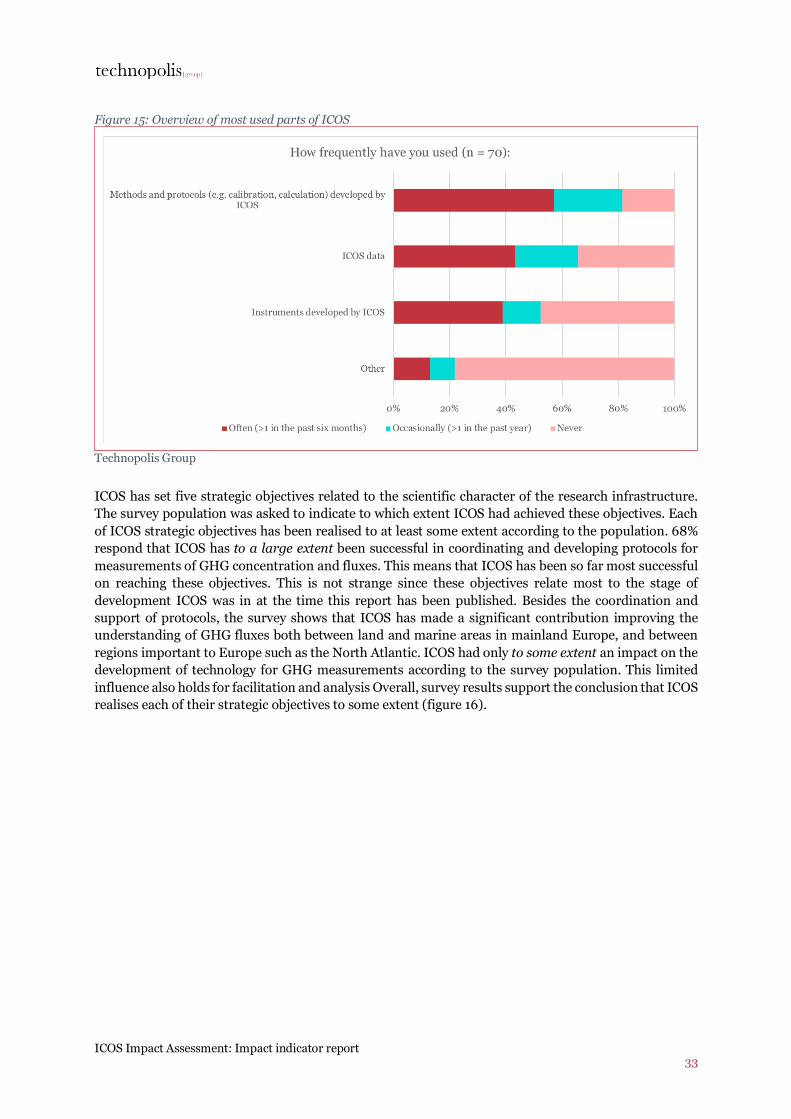
ICOS Impact Assessment: Impact indicator report 33
Figure 15: Overview of most used parts of ICOS
Technopolis Group
ICOS has set five strategic objectives related to the scientific character of the research infrastructure. The survey population was asked to indicate to which extent ICOS had achieved these objectives. Each of ICOS strategic objectives has been realised to at least some extent according to the population. 68% respond that ICOS has to a large extent been successful in coordinating and developing protocols for measurements of GHG concentration and fluxes. This means that ICOS has been so far most successful on reaching these objectives. This is not strange since these objectives relate most to the stage of development ICOS was in at the time this report has been published. Besides the coordination and support of protocols, the survey shows that ICOS has made a significant contribution improving the understanding of GHG fluxes both between land and marine areas in mainland Europe, and between regions important to Europe such as the North Atlantic. ICOS had only to some extent an impact on the development of technology for GHG measurements according to the survey population. This limited influence also holds for facilitation and analysis Overall, survey results support the conclusion that ICOS realises each of their strategic objectives to some extent (figure 16).
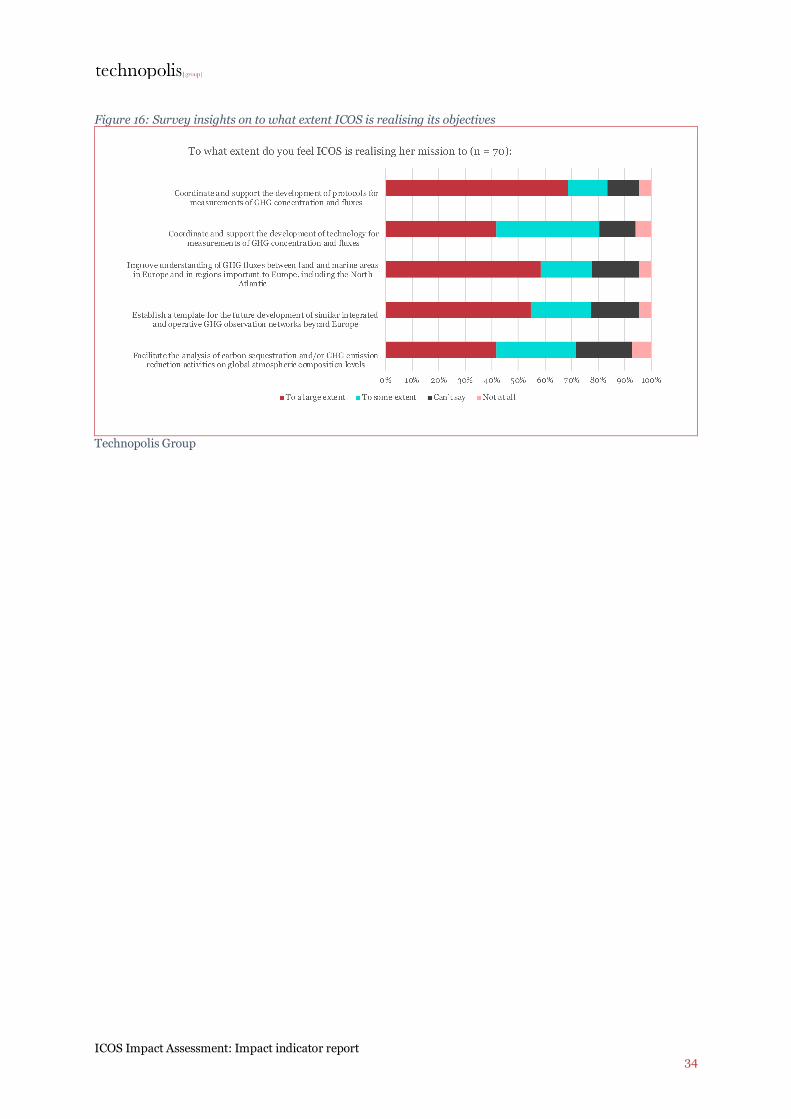
ICOS Impact Assessment: Impact indicator report 34
Figure 16: Survey insights on to what extent ICOS is realising its objectives
Technopolis Group
ICOS Impact Assessment: Impact indicator report 35
8 Climate action support: communicating science-based knowledge towards society and contributing timely information relevant to the GHG policy and decision making.
The political relevance of research facilitated by ICOS is acknowledged in the ICOS ERIC statutes where it is noted that ‘observing essential climate variables, including GHG, is required to support the work of the United Nations Framework Convention on Climate Change (UNFCCC) and the Intergovernmental Panel on Climate Change (IPCC)’ together with a statement that describes the need to coordinate GHG research at a European level to improve understanding of how natural and human contributions influence regional budgets of GHG sources and sinks. The path between facilitating good science and societal impact is long, and indirect. Yet, knowing which data are required to reach decision makers, where ICOS data can contribute to improve policy decisions is at policy level, and the current visibility of ICOS is crucial help to monitor ICOS’ relevance to climate action support. Both the indicator media appearances and the indicator ability to provide policy-relevant data are actions within the impact framework which describe ICOS current position in the social and policy domain, by describing how and where ICOS appears in (social) media outlets, and to what extent their work currently fits the requirements of policy makers. The indicator use of ICOS related publications outside the scientific domain describes an outcome of ICOS current ability to provide policy-relevant data. The final three indicators provide a narrative of the wider impacts associated with successful climate change mitigation, which, although not directly an outcome of ICOS data, could be influenced by ICOS. These narratives serve to clarify ICOS potential role in climate policy. These indicators are insight on carbon source and sinks on national and regional level, a reduction of damage by extreme weather events through more effective climate mitigation policy and improved long-term decisions through enhanced political discourse based on evidence.
8.1 KPI 6: Media appearances Awareness of ICOS’ work is an important indicator of ICOS’ presence in the social domain. Its most direct operationalization is media appearances. ICOS features several social media channels to reach out to the community. The most prominent is their presence on Instagram, through the ICOSscapes campaign, which features photographs of ICOS measurement locations. Their follower count has risen in less than a year from 7 to more than 2995 at the time of writing. ICOS also actively uses Twitter, where in less than a year it has built a stable (though small) population of currently 748 followers. Job announcements, videos and feature articles attract the most attention. On LinkedIn the ICOS has 405 members and around 72 followers. ICOS’ website’s performance is measured using Google Analytics. Since this has only run from January 2018 on, we can’t speak of trends in these indicators. The number of unique visitors lies around 350 per week, with spikes to 430 in the case of job advertisements. About half of all visitors only visit the home page and do not click to other (sub) pages. Activities in the educational domain are still under investigation. One initiative that has been highlighted is ‘Carbon tree’, and educational resource which includes an app, which uses data from the ICOS website. The information above was provided by ICOS ERIC communications unit. ICOS’ communication unit also provides a link between the ERIC and the national ICOS initiatives, who have their own (social) media channels. Communications from the national networks primarily concerns local news and issues and is therefore done in the national language. They will relay any news that comes from the HO, and if possible provide national perspective. ICOS HO provides brochures and artwork to the national network to facilitate this. Conversely the HO will relay any news from the national networks which is of interest to the wider ICOS audience in English. Although media tracking at the level of the national networks is
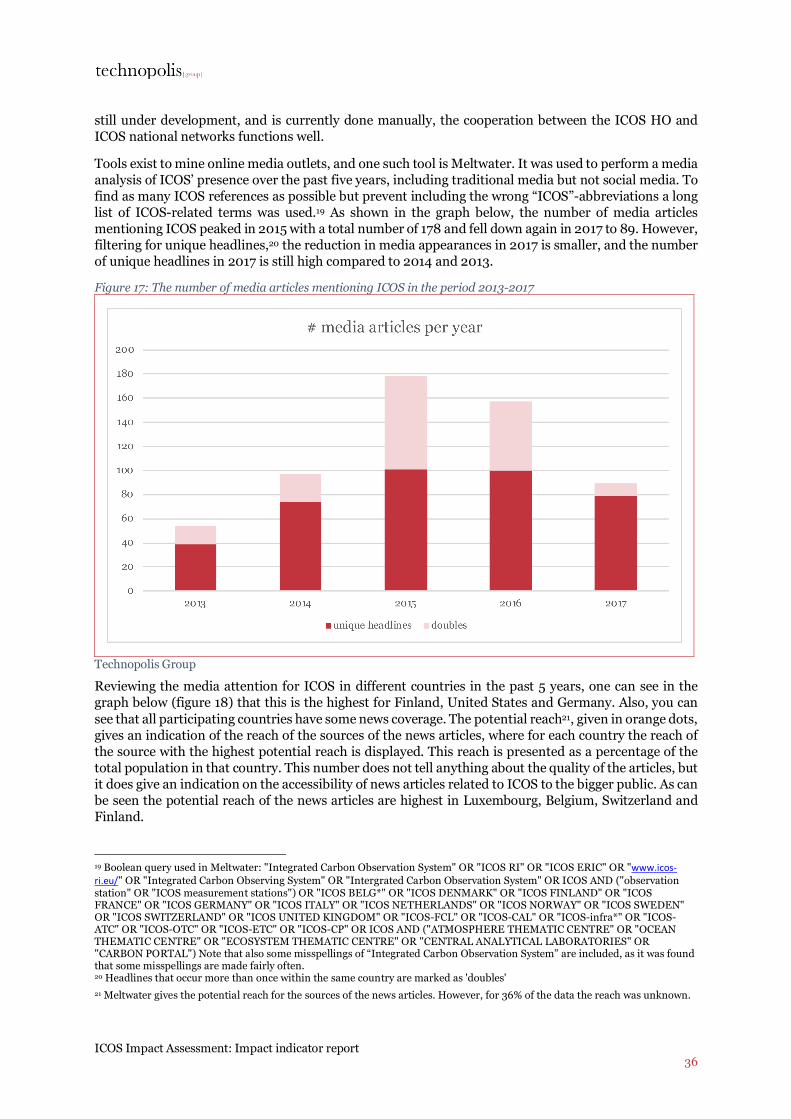
ICOS Impact Assessment: Impact indicator report 36
still under development, and is currently done manually, the cooperation between the ICOS HO and ICOS national networks functions well.
Tools exist to mine online media outlets, and one such tool is Meltwater. It was used to perform a media analysis of ICOS’ presence over the past five years, including traditional media but not social media. To find as many ICOS references as possible but prevent including the wrong “ICOS”-abbreviations a long list of ICOS-related terms was used.19 As shown in the graph below, the number of media articles mentioning ICOS peaked in 2015 with a total number of 178 and fell down again in 2017 to 89. However, filtering for unique headlines,20 the reduction in media appearances in 2017 is smaller, and the number of unique headlines in 2017 is still high compared to 2014 and 2013.
Figure 17: The number of media articles mentioning ICOS in the period 2013-2017
Technopolis Group
Reviewing the media attention for ICOS in different countries in the past 5 years, one can see in the graph below (figure 18) that this is the highest for Finland, United States and Germany. Also, you can see that all participating countries have some news coverage. The potential reach21, given in orange dots, gives an indication of the reach of the sources of the news articles, where for each country the reach of the source with the highest potential reach is displayed. This reach is presented as a percentage of the total population in that country. This number does not tell anything about the quality of the articles, but it does give an indication on the accessibility of news articles related to ICOS to the bigger public. As can be seen the potential reach of the news articles are highest in Luxembourg, Belgium, Switzerland and Finland.
19 Boolean query used in Meltwater: "Integrated Carbon Observation System" OR "ICOS RI" OR "ICOS ERIC" OR "www.icos-ri.eu/" OR "Integrated Carbon Observing System" OR "Intergrated Carbon Observation System" OR ICOS AND ("observation station" OR "ICOS measurement stations") OR "ICOS BELG*" OR "ICOS DENMARK" OR "ICOS FINLAND" OR "ICOS FRANCE" OR "ICOS GERMANY" OR "ICOS ITALY" OR "ICOS NETHERLANDS" OR "ICOS NORWAY" OR "ICOS SWEDEN" OR "ICOS SWITZERLAND" OR "ICOS UNITED KINGDOM" OR "ICOS-FCL" OR "ICOS-CAL" OR "ICOS-infra*" OR "ICOS-ATC" OR "ICOS-OTC" OR "ICOS-ETC" OR "ICOS-CP" OR ICOS AND ("ATMOSPHERE THEMATIC CENTRE" OR "OCEAN THEMATIC CENTRE" OR "ECOSYSTEM THEMATIC CENTRE" OR "CENTRAL ANALYTICAL LABORATORIES" OR "CARBON PORTAL") Note that also some misspellings of “Integrated Carbon Observation System” are included, as it was found that some misspellings are made fairly often. 20 Headlines that occur more than once within the same country are marked as 'doubles' 21 Meltwater gives the potential reach for the sources of the news articles. However, for 36% of the data the reach was unknown.
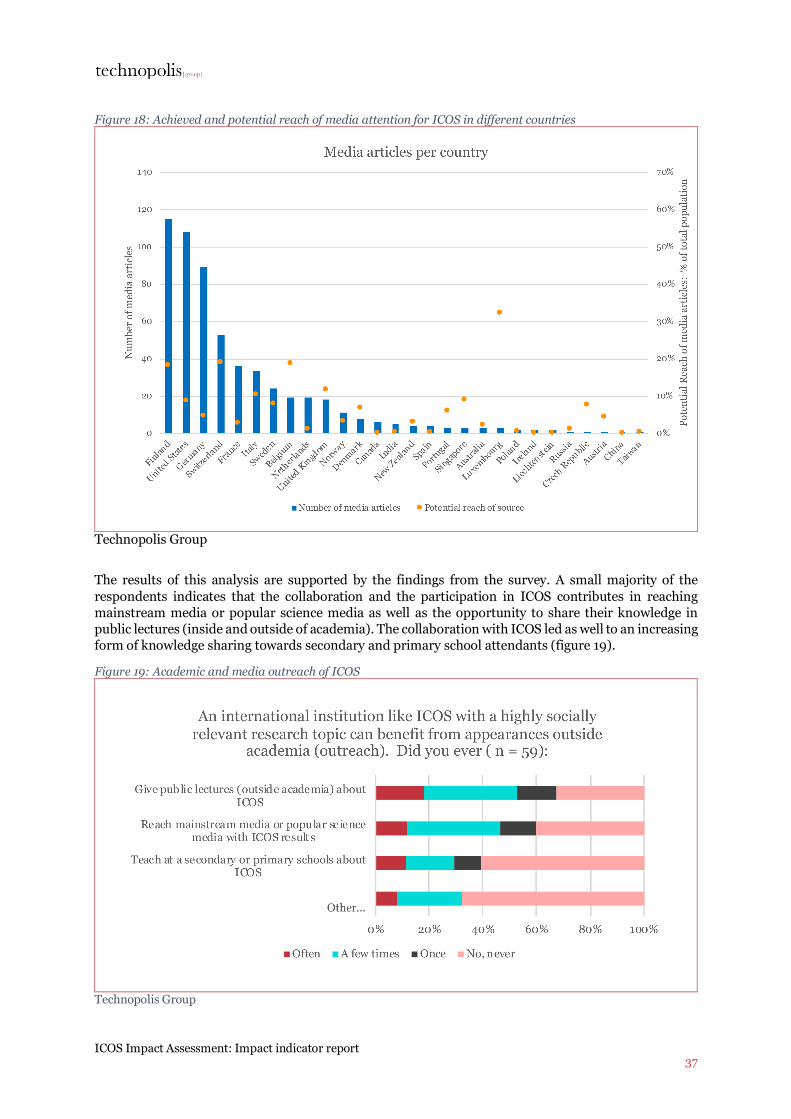
ICOS Impact Assessment: Impact indicator report 37
Figure 18: Achieved and potential reach of media attention for ICOS in different countries
Technopolis Group
The results of this analysis are supported by the findings from the survey. A small majority of the respondents indicates that the collaboration and the participation in ICOS contributes in reaching mainstream media or popular science media as well as the opportunity to share their knowledge in public lectures (inside and outside of academia). The collaboration with ICOS led as well to an increasing form of knowledge sharing towards secondary and primary school attendants (figure 19).
Figure 19: Academic and media outreach of ICOS
Technopolis Group
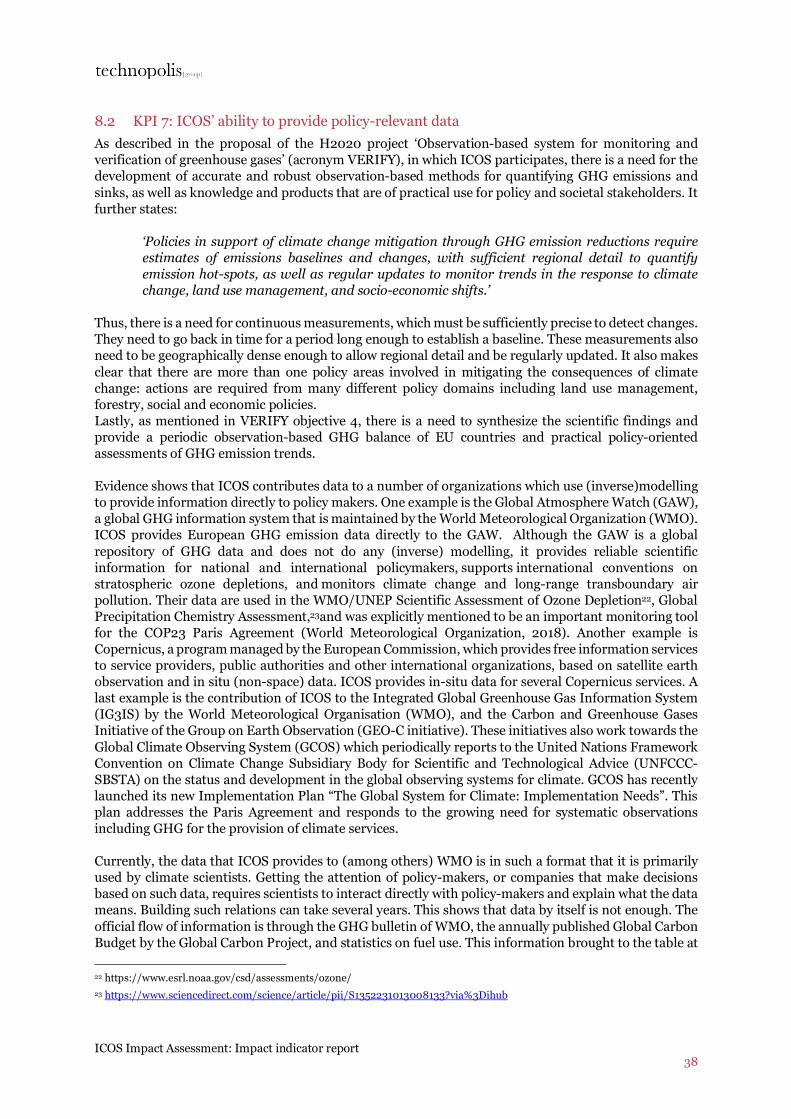
ICOS Impact Assessment: Impact indicator report 38
8.2 KPI 7: ICOS’ ability to provide policy-relevant data As described in the proposal of the H2020 project ‘Observation-based system for monitoring and verification of greenhouse gases’ (acronym VERIFY), in which ICOS participates, there is a need for the development of accurate and robust observation-based methods for quantifying GHG emissions and sinks, as well as knowledge and products that are of practical use for policy and societal stakeholders. It further states:
‘Policies in support of climate change mitigation through GHG emission reductions require estimates of emissions baselines and changes, with sufficient regional detail to quantify emission hot-spots, as well as regular updates to monitor trends in the response to climate change, land use management, and socio-economic shifts.’
Thus, there is a need for continuous measurements, which must be sufficiently precise to detect changes. They need to go back in time for a period long enough to establish a baseline. These measurements also need to be geographically dense enough to allow regional detail and be regularly updated. It also makes clear that there are more than one policy areas involved in mitigating the consequences of climate change: actions are required from many different policy domains including land use management, forestry, social and economic policies. Lastly, as mentioned in VERIFY objective 4, there is a need to synthesize the scientific findings and provide a periodic observation-based GHG balance of EU countries and practical policy-oriented assessments of GHG emission trends. Evidence shows that ICOS contributes data to a number of organizations which use (inverse)modelling to provide information directly to policy makers. One example is the Global Atmosphere Watch (GAW), a global GHG information system that is maintained by the World Meteorological Organization (WMO). ICOS provides European GHG emission data directly to the GAW. Although the GAW is a global repository of GHG data and does not do any (inverse) modelling, it provides reliable scientific information for national and international policymakers, supports international conventions on stratospheric ozone depletions, and monitors climate change and long-range transboundary air pollution. Their data are used in the WMO/UNEP Scientific Assessment of Ozone Depletion22, Global Precipitation Chemistry Assessment,23and was explicitly mentioned to be an important monitoring tool for the COP23 Paris Agreement (World Meteorological Organization, 2018). Another example is Copernicus, a program managed by the European Commission, which provides free information services to service providers, public authorities and other international organizations, based on satellite earth observation and in situ (non-space) data. ICOS provides in-situ data for several Copernicus services. A last example is the contribution of ICOS to the Integrated Global Greenhouse Gas Information System (IG3IS) by the World Meteorological Organisation (WMO), and the Carbon and Greenhouse Gases Initiative of the Group on Earth Observation (GEO-C initiative). These initiatives also work towards the Global Climate Observing System (GCOS) which periodically reports to the United Nations Framework Convention on Climate Change Subsidiary Body for Scientific and Technological Advice (UNFCCC-SBSTA) on the status and development in the global observing systems for climate. GCOS has recently launched its new Implementation Plan “The Global System for Climate: Implementation Needs”. This plan addresses the Paris Agreement and responds to the growing need for systematic observations including GHG for the provision of climate services. Currently, the data that ICOS provides to (among others) WMO is in such a format that it is primarily used by climate scientists. Getting the attention of policy-makers, or companies that make decisions based on such data, requires scientists to interact directly with policy-makers and explain what the data means. Building such relations can take several years. This shows that data by itself is not enough. The official flow of information is through the GHG bulletin of WMO, the annually published Global Carbon Budget by the Global Carbon Project, and statistics on fuel use. This information brought to the table at 22 https://www.esrl.noaa.gov/csd/assessments/ozone/ 23 https://www.sciencedirect.com/science/article/pii/S1352231013008133?via%3Dihub
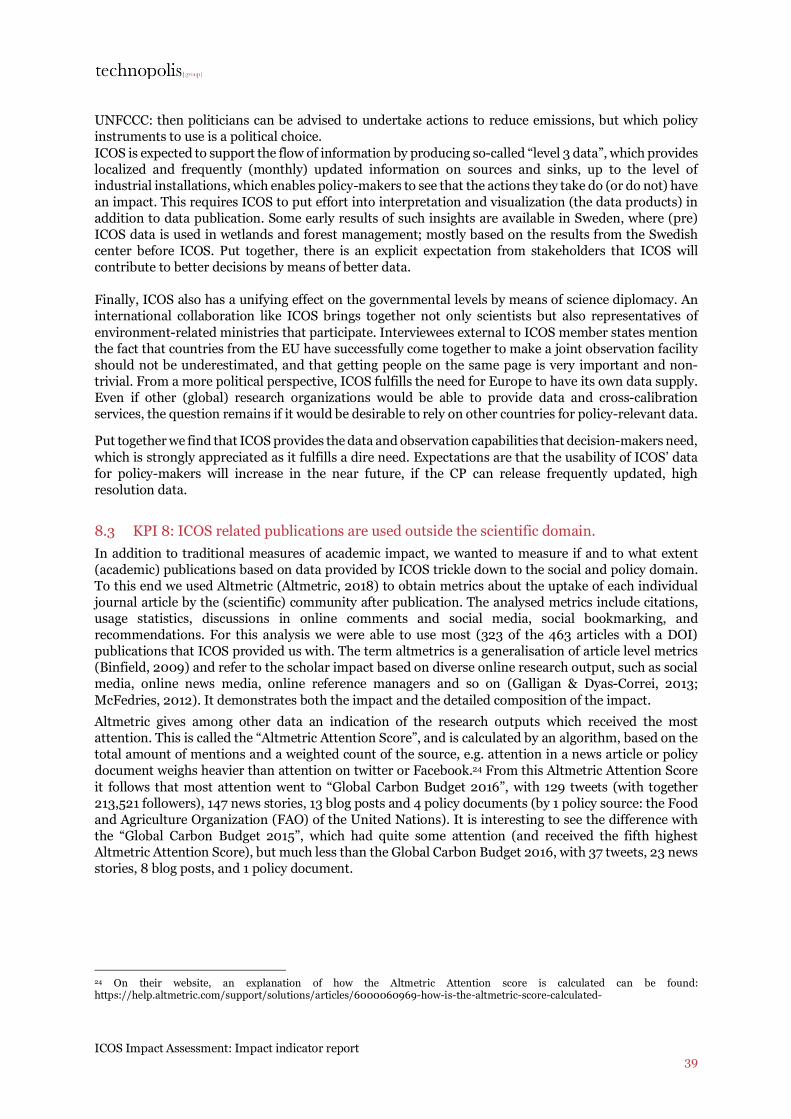
ICOS Impact Assessment: Impact indicator report 39
UNFCCC: then politicians can be advised to undertake actions to reduce emissions, but which policy instruments to use is a political choice. ICOS is expected to support the flow of information by producing so-called “level 3 data”, which provides localized and frequently (monthly) updated information on sources and sinks, up to the level of industrial installations, which enables policy-makers to see that the actions they take do (or do not) have an impact. This requires ICOS to put effort into interpretation and visualization (the data products) in addition to data publication. Some early results of such insights are available in Sweden, where (pre) ICOS data is used in wetlands and forest management; mostly based on the results from the Swedish center before ICOS. Put together, there is an explicit expectation from stakeholders that ICOS will contribute to better decisions by means of better data. Finally, ICOS also has a unifying effect on the governmental levels by means of science diplomacy. An international collaboration like ICOS brings together not only scientists but also representatives of environment-related ministries that participate. Interviewees external to ICOS member states mention the fact that countries from the EU have successfully come together to make a joint observation facility should not be underestimated, and that getting people on the same page is very important and non-trivial. From a more political perspective, ICOS fulfills the need for Europe to have its own data supply. Even if other (global) research organizations would be able to provide data and cross-calibration services, the question remains if it would be desirable to rely on other countries for policy-relevant data.
Put together we find that ICOS provides the data and observation capabilities that decision-makers need, which is strongly appreciated as it fulfills a dire need. Expectations are that the usability of ICOS’ data for policy-makers will increase in the near future, if the CP can release frequently updated, high resolution data.
8.3 KPI 8: ICOS related publications are used outside the scientific domain. In addition to traditional measures of academic impact, we wanted to measure if and to what extent (academic) publications based on data provided by ICOS trickle down to the social and policy domain. To this end we used Altmetric (Altmetric, 2018) to obtain metrics about the uptake of each individual journal article by the (scientific) community after publication. The analysed metrics include citations, usage statistics, discussions in online comments and social media, social bookmarking, and recommendations. For this analysis we were able to use most (323 of the 463 articles with a DOI) publications that ICOS provided us with. The term altmetrics is a generalisation of article level metrics (Binfield, 2009) and refer to the scholar impact based on diverse online research output, such as social media, online news media, online reference managers and so on (Galligan & Dyas-Correi, 2013; McFedries, 2012). It demonstrates both the impact and the detailed composition of the impact. Altmetric gives among other data an indication of the research outputs which received the most attention. This is called the “Altmetric Attention Score”, and is calculated by an algorithm, based on the total amount of mentions and a weighted count of the source, e.g. attention in a news article or policy document weighs heavier than attention on twitter or Facebook.24 From this Altmetric Attention Score it follows that most attention went to “Global Carbon Budget 2016”, with 129 tweets (with together 213,521 followers), 147 news stories, 13 blog posts and 4 policy documents (by 1 policy source: the Food and Agriculture Organization (FAO) of the United Nations). It is interesting to see the difference with the “Global Carbon Budget 2015”, which had quite some attention (and received the fifth highest Altmetric Attention Score), but much less than the Global Carbon Budget 2016, with 37 tweets, 23 news stories, 8 blog posts, and 1 policy document.
24 On their website, an explanation of how the Altmetric Attention score is calculated can be found: https://help.altmetric.com/support/solutions/articles/6000060969-how-is-the-altmetric-score-calculated-
ICOS Impact Assessment: Impact indicator report 40
For the five articles with the most attention25 (based on the highest Altmetric Attention Score), we looked at the contribution of ICOS to these articles. There is a large variation in the way attribution to ICOS data takes place, and this made it hard to compare ICOS’ contribution between the five selected articles. Some articles mentioned “ICOS”, but mostly referring to research sponsored by ICOS. References to ICOS data used are not made explicitly, but references to Fluxnet, Jena Carboscope and SOCAt indicate that ICOS data might be used for these articles.
Altmetric’s further analysis of the full list of publications shows that the 323 articles resulted in a total of 3514 mentions in the period between the earliest publication from 2008 (which precedes ICOS by 7 years) and April 2018. The earliest mention is from a news article from mid-2010, and the number of mentions overall show a clear upwards trend over time (see figure 20)
Figure 20: Chart with This chart showing all mentions for 323 research articles by ICOS.
Technopolis Group
A large proportion of this, as is to be expected, are Twitter mentions (2744). However other notable sources include news mentions (395), blog mentions (180), policy mentions (28), Facebook mentions, (109) and patents (5). Interestingly, by far the highest percentage of unique Tweets linked to these publications comes from the US (19.5%). Similarly, both the highest proportion of unique news stories and the overall highest proportion of news stories originates from the US (43.8% and 45.1% respectively). Although potentially interesting, and worth further investing, what these results show is that (alt)media impact is tightly linked to the articles that it is based on. In this case, a large proportion of the articles precedes ICOS, and, more importantly, do not clearly attribute their data to ICOS sources. As such, these data illustrate the potential for impact beyond the impact measured by bibliometric analysis but should not be taken as evidence of current impact resulting from the ICOS ERIC by itself.
25 Global Carbon Budget 2016; Newly detected ozone-depleting substances in the atmosphere; A 21st century shift from fossil-fuel to biogenic methane emissions indicated by 13CH4; The reinvigoration of the Southern Ocean carbon sink; and Global Carbon Budget 2015.
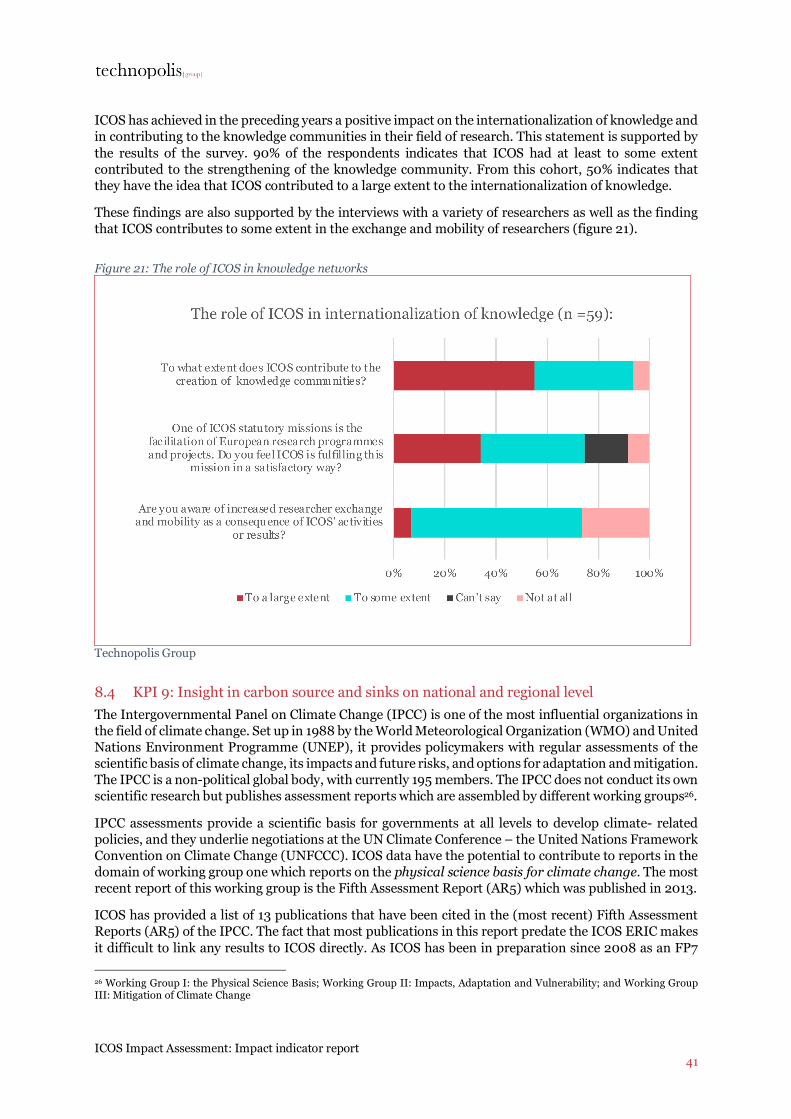
ICOS Impact Assessment: Impact indicator report 41
ICOS has achieved in the preceding years a positive impact on the internationalization of knowledge and in contributing to the knowledge communities in their field of research. This statement is supported by the results of the survey. 90% of the respondents indicates that ICOS had at least to some extent contributed to the strengthening of the knowledge community. From this cohort, 50% indicates that they have the idea that ICOS contributed to a large extent to the internationalization of knowledge.
These findings are also supported by the interviews with a variety of researchers as well as the finding that ICOS contributes to some extent in the exchange and mobility of researchers (figure 21).
Figure 21: The role of ICOS in knowledge networks
Technopolis Group
8.4 KPI 9: Insight in carbon source and sinks on national and regional level The Intergovernmental Panel on Climate Change (IPCC) is one of the most influential organizations in the field of climate change. Set up in 1988 by the World Meteorological Organization (WMO) and United Nations Environment Programme (UNEP), it provides policymakers with regular assessments of the scientific basis of climate change, its impacts and future risks, and options for adaptation and mitigation. The IPCC is a non-political global body, with currently 195 members. The IPCC does not conduct its own scientific research but publishes assessment reports which are assembled by different working groups26.
IPCC assessments provide a scientific basis for governments at all levels to develop climate- related policies, and they underlie negotiations at the UN Climate Conference – the United Nations Framework Convention on Climate Change (UNFCCC). ICOS data have the potential to contribute to reports in the domain of working group one which reports on the physical science basis for climate change. The most recent report of this working group is the Fifth Assessment Report (AR5) which was published in 2013.
ICOS has provided a list of 13 publications that have been cited in the (most recent) Fifth Assessment Reports (AR5) of the IPCC. The fact that most publications in this report predate the ICOS ERIC makes it difficult to link any results to ICOS directly. As ICOS has been in preparation since 2008 as an FP7 26 Working Group I: the Physical Science Basis; Working Group II: Impacts, Adaptation and Vulnerability; and Working Group III: Mitigation of Climate Change
ICOS Impact Assessment: Impact indicator report 42
Infrastructures project, the publications in this report are likely ‘pre-ICOS’ data, based on measurements from ICOS measurement stations before certification. It illustrates however the potential reach of ICOS data: ICOS contributed to both the in-situ air chemistry, the marine observations, and the carbon flux observations that were used in the report. The report further illustrates the points made in section 2.1, that more and longer timeseries, which ICOS could provide, are crucial to establish a historical baseline against which to interpret recent changes concentration: the timeseries presented in the report come from a few historical measurement stations which have CO2 observations dating back to 1958 (i.e. the Mauna Loa station on Hawaii and the South Pole observatory, both NOAA stations).
Lastly, it is very likely that ICOS will be selected to provide atmospheric GHG measurements for use in the next IPCC Report. Updates to the 2006 IPCC guidelines, which set out the methodology related to measuring national GHG inventories, are currently under revision. The report with updated guidelines will be published in early 2019 and is expected to have as one of its actions the implementation a quality assurance and verification system to verify national GHG inventories through atmospheric measurements. It is likely that ICOS will be asked to provide these data on the basis that it is one of the only providers of sufficiently high-quality in-situ atmospheric GHG data at European scale. However, this will need to be verified after publication of the updated guideline report.
8.5 KPI 10: A reduction of damage by extreme weather events through more effective climate mitigation policy.
GHG measurements and reports of ICOS contribute to science on causes and impacts of climate change, which can provide valuable information for climate mitigation efforts such as damage reduction of extreme weather events. In particular, the financial and insurance industry can use climate science for mitigating damage by extreme weather events. Storms, floods, heat waves and droughts can cause major damage. In 2015, there were 198 recorded natural catastrophes worldwide, the most ever recorded per year, with estimated overall losses of $80 billion. Such catastrophes are expected to be more frequent and severe due to climate change. This provides both opportunities and risks for insurers, and for society in general.
The basic societal impact of ICOS is to support mitigation efforts that reduce societal risks on loss and damage. We are absolutely aware that the ICOS impact on conserving societal values from loss and damage is very indirect. However, it shows the basic societal purpose of ICOS (“addressing climate change arising from anthropogenic emissions of greenhouse gases (GHG) is a global challenge”) and shows that investments on ICOS are responding to enormous societal values at stake.
Opportunities for (re)insurers include new products and services that can be developed as more people and businesses wish to be protected against the damage that might be caused by climate change. However, risks for (re)insurers include the increasing unpredictability of the occurrence of disasters and the resulting increased volatility in the insurance and finance industry. (Re)insurance companies around the world are already using climate scenarios for damage prediction and developing their product portfolio. For instance, commercial 'loss models' use scientific scenarios of long-term climate change impacts to predict damage by major disasters such as hurricanes, floods and fires. In Florida, a catastrophe-prone region, (re)insurers are at the forefront of research regarding the effects of climate change on future loss costs, loss uncertainty, and opportunity. They assess the risks of flood and act at local level to mitigate flood risks. However, some of these risks are insurable today but may become uninsurable over the long term when they are not sufficiently mitigated. On the Florida coast, many houses may become inaccessible or flooded due to the rising sea level. This may result in climate-driven price drops and housing crises for coastal areas. In Europe, insurance companies are active too in minimising future climate change-related losses and to ensure sustainable insurance cover in the coming years. In 2015, at the time of the COP21 in Paris, Insurance Europe and over 2000 parties related to insurance pledged their support to act to limit the effects of climate change to meet the requirements of the Paris agreement. Actions include increased use of scientific insights for predicting future risks. Using climate data, Dutch insurers are taking measures
ICOS Impact Assessment: Impact indicator report 43
for prevention of damage by storm, hail and extreme rainfall. Banks and other financial institutions also use climate data to model the economic and financial impact of climate change. Results of these analyses are used to divest, try to change strategies of companies or invest in companies that aim for mitigation. Aside from reduced cost for insurance companies, there are wider societal cost related to climate change. A recent article estimated that achieving the most stringent climate change target set in the global Paris agreement will save the world about $30tn in damages, far more than the costs of cutting carbon emissions economic costs (Burke et al.,2018). Improved long-term decisions through enhanced political discourse based on evidence. These narratives show that economic actors are already taking account of climate change by using models that are fed by data that partly originates from ICOS. Thus, ICOS mitigates damages by enabling better ensuring and by facilitating less carbon-intense choices by investors.
8.6 KPI 11: Improved long-term decisions through enhanced political discourse based on evidence
The essence of this indicator is in the last words: based on evidence. Assuming that ICOS realises impacts along the full range of the impact framework, there will be high quality observations, which will be disseminated in publications or products which are relevant to policy makers. These policy makers in turn have the potential to influence science policy. The point of this indicator is not to quantify the likelihood that this impact happens, but to describe how it can be measured in an objective fashion. Here we use Altmetrics to pinpoint how much policy attention has been paid to the ICOS related publications, and who these policy bodies are. This should be read as a baseline to be used in future monitoring of the ‘real’ ICOS data. The Altmetric analysis presented in section 6.3, which was based in the list of 323 publications provided by ICOS show a total of 28 policy mentions. The Food and Agricultural Organisation (FAO) of the UN, the Publications office of the EU, National Academies Press, UK Government, the IPCC, and the Dutch Government are amongst the bodies that have paid attention to these publications. For example, an IPCC document from 2013 (Climate Change 2013: The Physical Science Basis, IPCC 2013) refers to two of the articles that were provided. Although this total of 28 may not seem a lot, is important to keep in mind that this analysis was based on data which pre-date ICOS-certified data. A vast majority of people we have spoken to feel that there will be a step change in the impact of publications based on ICOS data when these will be based on ICOS data from certified measurement stations.
This conclusion is supported by the results of the survey, a majority of the participants is convinced (80%) that ICOS will lead to an improved quality of decision making on CO2 -relevant topics. Beside that is the population indicating (90%) that the data delivered by ICOS will lead to a better understanding of GHG emissions and uptake (figure 22). Besides this, the respondents support the statement that ICOS will contribute to the delivery or production of timely information relevant to the improvement of the GHG policy and decision-making (figure 23).
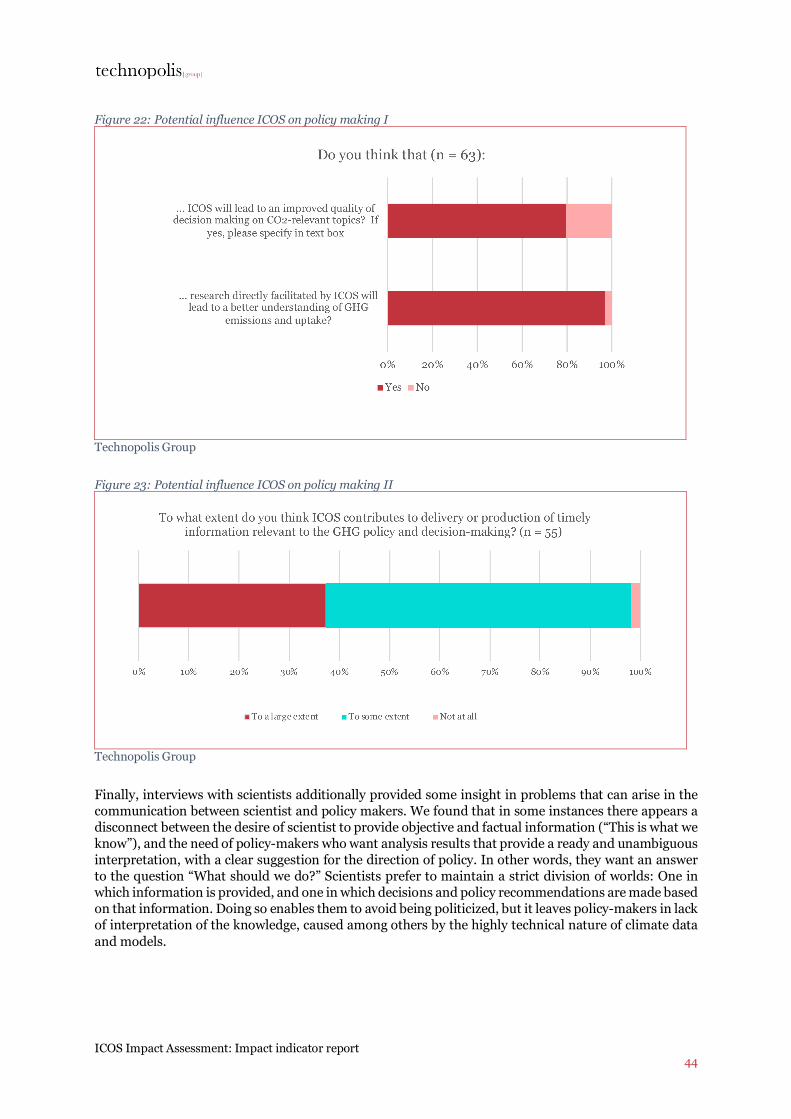
ICOS Impact Assessment: Impact indicator report 44
Figure 22: Potential influence ICOS on policy making I
Technopolis Group
Figure 23: Potential influence ICOS on policy making II
Technopolis Group
Finally, interviews with scientists additionally provided some insight in problems that can arise in the communication between scientist and policy makers. We found that in some instances there appears a disconnect between the desire of scientist to provide objective and factual information (“This is what we know”), and the need of policy-makers who want analysis results that provide a ready and unambiguous interpretation, with a clear suggestion for the direction of policy. In other words, they want an answer to the question “What should we do?” Scientists prefer to maintain a strict division of worlds: One in which information is provided, and one in which decisions and policy recommendations are made based on that information. Doing so enables them to avoid being politicized, but it leaves policy-makers in lack of interpretation of the knowledge, caused among others by the highly technical nature of climate data and models.

ICOS Impact Assessment: Impact indicator report 45
We found many policy-makers who respect this scientific divide, and approach scientific bodies, such as WMO, as technical agencies that provide data or analytical services, such as GHG measurements, carbon budgets, or impact assessments of policy propositions. This illustrates that societal impact of scientific measurements may be present but can only be the result of decision-makers that are sensitive to factual information, know where to find it, and willing and able to act upon it. It also illustrates that the interpretive role of agencies such as WMO is paramount to brining knowledge to policy makers. This makes them an important stakeholder in ICOS mission to improve long-term, decision making.
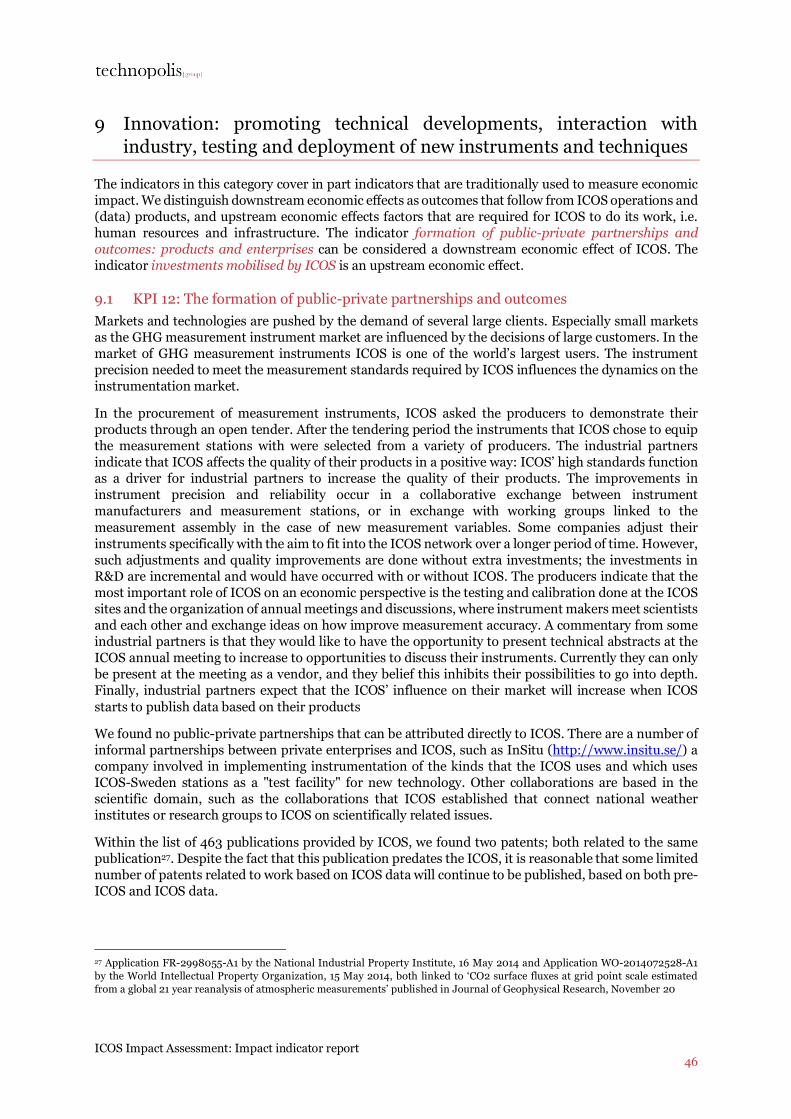
ICOS Impact Assessment: Impact indicator report 46
9 Innovation: promoting technical developments, interaction with industry, testing and deployment of new instruments and techniques
The indicators in this category cover in part indicators that are traditionally used to measure economic impact. We distinguish downstream economic effects as outcomes that follow from ICOS operations and (data) products, and upstream economic effects factors that are required for ICOS to do its work, i.e. human resources and infrastructure. The indicator formation of public-private partnerships and outcomes: products and enterprises can be considered a downstream economic effect of ICOS. The indicator investments mobilised by ICOS is an upstream economic effect.
9.1 KPI 12: The formation of public-private partnerships and outcomes Markets and technologies are pushed by the demand of several large clients. Especially small markets as the GHG measurement instrument market are influenced by the decisions of large customers. In the market of GHG measurement instruments ICOS is one of the world’s largest users. The instrument precision needed to meet the measurement standards required by ICOS influences the dynamics on the instrumentation market.
In the procurement of measurement instruments, ICOS asked the producers to demonstrate their products through an open tender. After the tendering period the instruments that ICOS chose to equip the measurement stations with were selected from a variety of producers. The industrial partners indicate that ICOS affects the quality of their products in a positive way: ICOS’ high standards function as a driver for industrial partners to increase the quality of their products. The improvements in instrument precision and reliability occur in a collaborative exchange between instrument manufacturers and measurement stations, or in exchange with working groups linked to the measurement assembly in the case of new measurement variables. Some companies adjust their instruments specifically with the aim to fit into the ICOS network over a longer period of time. However, such adjustments and quality improvements are done without extra investments; the investments in R&D are incremental and would have occurred with or without ICOS. The producers indicate that the most important role of ICOS on an economic perspective is the testing and calibration done at the ICOS sites and the organization of annual meetings and discussions, where instrument makers meet scientists and each other and exchange ideas on how improve measurement accuracy. A commentary from some industrial partners is that they would like to have the opportunity to present technical abstracts at the ICOS annual meeting to increase to opportunities to discuss their instruments. Currently they can only be present at the meeting as a vendor, and they belief this inhibits their possibilities to go into depth. Finally, industrial partners expect that the ICOS’ influence on their market will increase when ICOS starts to publish data based on their products
We found no public-private partnerships that can be attributed directly to ICOS. There are a number of informal partnerships between private enterprises and ICOS, such as InSitu (http://www.insitu.se/) a company involved in implementing instrumentation of the kinds that the ICOS uses and which uses ICOS-Sweden stations as a "test facility" for new technology. Other collaborations are based in the scientific domain, such as the collaborations that ICOS established that connect national weather institutes or research groups to ICOS on scientifically related issues.
Within the list of 463 publications provided by ICOS, we found two patents; both related to the same publication27. Despite the fact that this publication predates the ICOS, it is reasonable that some limited number of patents related to work based on ICOS data will continue to be published, based on both pre-ICOS and ICOS data.
27 Application FR-2998055-A1 by the National Industrial Property Institute, 16 May 2014 and Application WO-2014072528-A1 by the World Intellectual Property Organization, 15 May 2014, both linked to ‘CO2 surface fluxes at grid point scale estimated from a global 21 year reanalysis of atmospheric measurements’ published in Journal of Geophysical Research, November 20
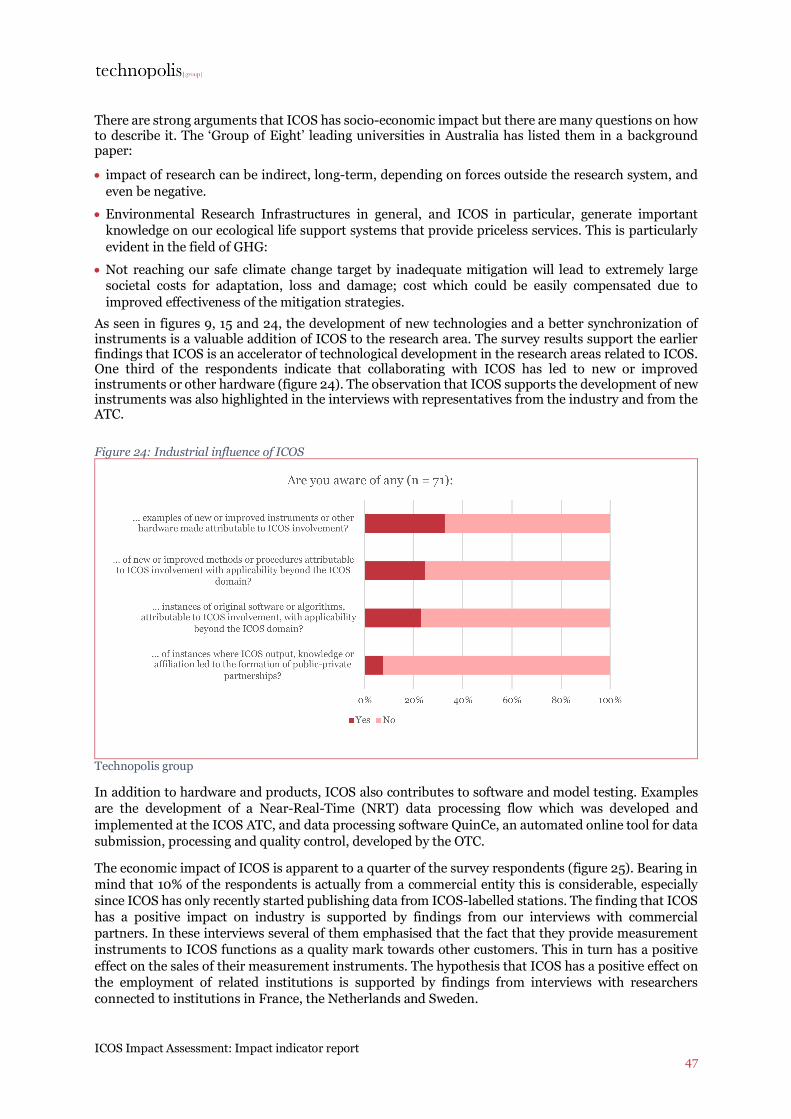
ICOS Impact Assessment: Impact indicator report 47
There are strong arguments that ICOS has socio-economic impact but there are many questions on how to describe it. The ‘Group of Eight’ leading universities in Australia has listed them in a background paper:
• impact of research can be indirect, long-term, depending on forces outside the research system, and even be negative.
• Environmental Research Infrastructures in general, and ICOS in particular, generate important knowledge on our ecological life support systems that provide priceless services. This is particularly evident in the field of GHG:
• Not reaching our safe climate change target by inadequate mitigation will lead to extremely large societal costs for adaptation, loss and damage; cost which could be easily compensated due to improved effectiveness of the mitigation strategies.
As seen in figures 9, 15 and 24, the development of new technologies and a better synchronization of instruments is a valuable addition of ICOS to the research area. The survey results support the earlier findings that ICOS is an accelerator of technological development in the research areas related to ICOS. One third of the respondents indicate that collaborating with ICOS has led to new or improved instruments or other hardware (figure 24). The observation that ICOS supports the development of new instruments was also highlighted in the interviews with representatives from the industry and from the ATC. Figure 24: Industrial influence of ICOS
Technopolis group
In addition to hardware and products, ICOS also contributes to software and model testing. Examples are the development of a Near-Real-Time (NRT) data processing flow which was developed and implemented at the ICOS ATC, and data processing software QuinCe, an automated online tool for data submission, processing and quality control, developed by the OTC.
The economic impact of ICOS is apparent to a quarter of the survey respondents (figure 25). Bearing in mind that 10% of the respondents is actually from a commercial entity this is considerable, especially since ICOS has only recently started publishing data from ICOS-labelled stations. The finding that ICOS has a positive impact on industry is supported by findings from our interviews with commercial partners. In these interviews several of them emphasised that the fact that they provide measurement instruments to ICOS functions as a quality mark towards other customers. This in turn has a positive effect on the sales of their measurement instruments. The hypothesis that ICOS has a positive effect on the employment of related institutions is supported by findings from interviews with researchers connected to institutions in France, the Netherlands and Sweden.
ICOS Impact Assessment: Impact indicator report 48
Figure 25: Influence of ICOS on spin-offs and employment
Technopolis Group
9.2 KPI 13: Investments mobilised by ICOS The investments mobilized by ICOS can be considered an upstream economic effect of the ICOS ERIC. This indicator reflects the costs associated with building the ICOS network assuming no prior infrastructure (this is the method used by ESFRI) and provides a baseline for the growth of the ICOS infrastructure over the coming years.
9.2.1 Investments from member countries into ICOS ICOS mobilised a capital value creation of €108 M, this sum can be split into intangible and tangible investments. The tangible value creation was €85 M of the total sum and the other €23 M was intangible value creation28. The largest part of the tangible value was created by the development and construction of the observational network. For this specific part ICOS mobilised €66 M. The largest value creation by the construction of the national observational network construction was done through investments in the hardware of the ecosystem stations and the construction work at the ecosystem stations. Another large tangible investment post was the construction of the central facilities, the construction of the facilities varied from €1,5 M for the OTC to up to €3,6 M for the ATC and the FCL. Beside the tangible value creation ICOS also mobilised intangible value creation in three different economic sectors. In the IT sector ICOS mobilised €10,8 M linked to the development and implementation of data life cycle. The second largest intangible value creation is related to the overhead of the ICOS head office, set-up and management of this new research infrastructure: to get all these developments in place ICOS mobilised €6,610,00. A third and final intangible investment stream linked to ICOS is described as the conceptualisation of observational networks.
The membership contributions consisted of both tangible (measurement stations) and intangible (research networks) investments. The membership contributions were in part supported by the EU funding, and were used to facilitate salaries, equipment, operations and overhead costs. Contributions are initially transferred to ICOS as a general income and then get redistributed to the Head Office, Carbon Portal, ATC, ETC, OTC, FCL, and the CRL. These funds were for a large majority (69% of the budget) used to develop the national networks, ten percent of the budget was used to facilitated ICOS-
28 Tangible assets are physical in nature that can be either long-term or short-term assets, whereas intangible assets are long-term assets that are not physical, but intellectual property.

ICOS Impact Assessment: Impact indicator report 49
ERIC and the other fifth of the budget went to the further development of the central facilities. From the central facilities the ATC received most funding (€1.5 M), followed by the FCL (€1.3 M); the ETC, OTC and the CRL each received less than €1 M. An interesting observation is that the large majority of the investments was in cash and not in kind; only Norway and Italy contributed both in cash and in kind to the development of the thematic centers (ICOS draft financial report, 2017).
ICOS Impact Assessment: Impact indicator report 50
10 Cooperation: making ICOS the European pillar of a global in-situ GHG observation system,
ICOS’ ability to build positive collaborative relationships with other infrastructures, its success in integrating its work with that of other GHG observation systems, and the acceptance of ICOS by researchers are important factors that determine the success of ICOS in becoming a European pillar of the global in-situ GHG observation system. The indicator joint ventures, asset sharing, joint research activities with other research infrastructures gives an overview of ICOS’ position in the field of climate research and describes the extent to which ICOS has become a blueprint for other infrastructures. This indicator is again shaped for a large extent by the level of internal organisation of ICOS. The number of attendees of and presentations during the ICOS science conference and application of ICOS data in globally leading models are both indicators which reflect the extent to which the research community accepts ICOS Finally, the indicator recognition of ICOS as a blueprint for global measurement networks describes the current perception ICOS’ success in this area, based on information from interviews and document analysis.
10.1 KPI 14: Joint ventures, asset sharing, joint research activities with other research infrastructures
ICOS is involved in a large number of important collaborations. One part consists of joint activities and collaboration with (other) existing RIs. Examples are the ENVRIPLUS project, that aims to find solutions to shared challenges specifically for 22 European Environmental and Earth System Research Infrastructures (RIs) and the ENVRI-FAIR, which aims to implement the FAIR principles (Findable, Accessible, Interoperable and Re-usable) into European Environmental and Earth Systems Research Infrastructures (ENVRIs) and connect it to the European Open Science Cloud (EOSC). In the EOSC pilot, ICOS integrates climate data from different sources with different simulation models. In addition, RIs from the current ESFRI roadmap environmental and associated fields collaborate with developing RI networks and technical partners to strengthen interoperability and improve their services. The ERICforum project, currently awaiting grant assignment, is a proposed project in which all existing European Research Infrastructure Consortia (ERICs) will come together to improve structural collaboration and coordination. To be able to sustain ICOS, ICOS initiated collaboration with 21 research institutes in the RINGO project. It aims to consolidate and enhance the quality of the observational networks, improve data streams and technology to meet the demands of science. Furthermore, the project aims to support countries in building a national consortium and work on political and administrative readiness for sustainable continuation of ICOS. ICOS and other European also RIs collaborate in international networks. ICOS contributes to an analysis report on the position and complementarities of the major European research infrastructures in the international research infrastructure landscape (RISCAPE project). It helps to develop interoperable systems and a research agenda for observation of the carbon cycle, greenhouse gases and air quality measurements in EU-Africa RI cooperation. Furthermore, ICOS contributes to Global Initiatives to observe carbon and greenhouse gases (VERIFY project) and has been instrumental in bringing together the research community in projects such as the Group on Earth Observations Carbon and Greenhouse Gas Initiative (GEO-C) and the Global Greenhouse Gas Information System (IG3IS). Both these latter two projects aim to bridge the divide between (fundamental) research findings and the application of this knowledge by high-level decision makers, and ICOS involvement in these projects rightly capitalizes on the unique position that ICOS holds at European level. In addition to these activities, ICOS has been actively in contact with several European countries that have expressed their interest in joining ICOS. The Director General visited most of these countries to advocate ICOS and the benefits of joining ICOS (annual report 2016). These efforts are fruitful. The Scientific Advisory Board was impressed by the progress made in obtaining commitments from nations
ICOS Impact Assessment: Impact indicator report 51
to ensure long-term continuity of sites with the ICOS Thematic Centres (SAB). They concluded that ICOS has been proactive in tapping funding opportunities and developing relationships with research organizations, demonstrating that it is providing added value to the scientific community ICOS ERIC has currently no centrally coordinated access programme to the ICOS sites, however, experiences were gained during the InGOS Integrated Activity (2011 – 2015) where several common experiments were conducted at ecosystem sites through the Trans National Access (TNA) (e.g. on comparing chamber and eddy-covariance measurements on N2O fluxes). ICOS ERIC currently coordinates the research infrastructure cluster project ENVRIplus (2015 -2019) that has two work packages that tackle the problem of access to large distributed research infrastructures. The potential participation of ICOS ERIC in TREEFORCE (funding pending) will allow asset sharing by enabling coordinated access to all 23 long-term highly equipped and standardized forest observational sites in ICOS (TREEFORCE proposal)
The ICOS ERIC is an active player in developing the European environmental research infrastructures landscape and provides support to other research infrastuctures. Examples are ICOS support to the SACRIFOG network developing its measurement network and data management, and ICOS involvement in different ENVRI FAIR29 work packages, including communication strategies and tools, development of (meta)data services and biodiversity and ecosystem subdomain implementation. Through the provision of these services ICOS is increasingly considered a blueprint for other research infrastructures.
ICOS is one of the early adopter communities that were invited in the EUDAT2020 project to take up the cloud technologies designed as the B2-suite that will now form the core of the CDI (Collaborative Data Infrastructure), serviced in the European Open Source Cloud. ICOS is also being represented in Group of European Data Experts (GEDE).
10.2 KPI 15: Number of attendees of and presentations during the ICOS science conference. The collaborations described above are an indicator of large-scale joint research activities. At a smaller scale, ICOS also has an important community function in bringing together researchers from different scientific domains across Europe. A clear and instant reflection of the size of ICOS’ community is ICOS’ bi-annual science conference, which started in 2014 and of which the third edition will take place 11-13th of September 2018 in Prague. The number of attendees and presentations at the ICOS science conference is an indicator of acceptance of ICOS by researchers in the field, as it reflects to what extent ICOS is considered the go-to place to disseminate research findings.
The participant numbers show that there is a stable attendance rate of around 200 participants for each of the conference editions so far: 214 in 2014, 207 in 2016 and 153 this year (2018), counted three weeks before the registration deadline. Attendees come from research groups all over the world, with an average over 23 nationalities represented at the ICOS science conference, ranging from China and Kenya to Switzerland. On average 10% of the attendees has an affiliation outside Europe. In addition to the participants, the ICOS science conferences are also well-attended by exhibitors. These exhibitors are companies who currently work with ICOS or who are interested to do so. In 2016, 20 commercial companies sent representatives to attend the science conference, and in 2018 so far (three weeks before the deadline) 11 companies have representatives registered to attend30.
29 ENVRI-FAIR is the connection of the ESFRI Cluster of Environmental Research Infrastructures (ENVRI) to the European Open Science Cloud (EOSC) and builds on the capacities if research infrastructures which have developed in-depth expertise on their different fields of environmental research. 30 There were no data are available on the number of exhibitors at the 2014 science conference.
ICOS Impact Assessment: Impact indicator report 52
KPI 16: Application of ICOS data in globally leading models.
The provision of data that are compatible with those gathered by ther super-sites and international programs is a prerequisite in order to build models that describe the global carbon cycle. The application of ICOS data is in part guided by the acceptance of ICOS data and models by the scientific community. The indicator application of ICOS data in globally leading models describes how ICOS data and models are used by the scientific community. It also revolves around the question of the type of data that ICOS currently provides, and what type of data would enhance the application of ICOS data in globally leading models. ICOS data are currently used by a number of organisations which provide level 2 and level 3 data31 such as the World Meteorological Organisation (WMO) Integrated Global Greenhouse Gas Information System (IG3IS) and Global Climate Observing System (GCOS) and the National Oceanic and Atmospheric Administration (NOAA) in the US. ICOS also provides metadata; this includes information about data provenance, description, quality, processing, maturity level (raw data streams, automated quality control, processed, derivative products), and collection context. Although attribution to ICOS metadata is hard to find, a number of interviewees at organisational level mention that especially these metadata are a valuable source to new research groups and research infrastructures providing support for interoperability with other observatories, archives, and databases Given the accepted high quality of ICOS data, we found that, specifically when there will be regular ICOS data coming through the CP, there is a potential demand for level 3 data provided by ICOS. It has been agreed that the Carbon Portal will provide operational products – e.g. flux maps from inverse modelling – and supports the integration of external modelling results. ICOS holds the capacity to establish the information infrastructure for a European GHG information system as outlined in the respective COPERNICUS reports and the VERIFY project.
10.3 KPI 17: Recognition of ICOS as a blueprint for global measurement networks As described in section 3.1, climate change is a global phenomenon and relies on global measurements to inform models. The previous sections described ICOS place within the network of European research infrastructures (5.1), and the acceptance of ICOS data in global models (5.3) The indicator recognition of ICOS as a blueprint for global measurement networks describes ICOS positioning in the global measurement networks, and extent to which ICOS is considered a bluemprint for global measurement networks according to the perceptions of the the different stakeholders we talked to. ICOS is involved in a wide range of projects with a global coverage. The large number of joint research activities that ICOS is involved in is testimony to the fact that the data gathered by ICOS have added value to the research community beyond the ICOS members. Examples of programs that ICOS is involved in are global networks such as the WMO World Data Center for Greenhouse Gases (WDCGG), the Surface Ocean Carbon Atlas (SOCAt), and the global data base on ecosystem fluxes (FLUXNET), super sites such as the Advanced Global Atmospheric Gases Experiment (AGAGE) and National Oceanic and Atmospheric Administration (NOAAA) in the US, and the WMO Global Atmosphere Watch (GAW), the US Global Change Research (GCR) and Carbon Cycle Science Program (CCSP), and the Global Climate Observing System (GCOS), Global Earth Observation System of Systems (GEOSS), Global Carbon Project (GCP) in Europe. Co-location of measuring sites and participation in international inter comparison programs (ICP) are some of the steps that ICOS has taken to facilitate this inter-operability.
31 Data levels are Level 0: raw sensor output; Level 1: data reduction and automatic quality assurance performed; Level 2: final data set, QCed by PI; Level 3: elaborated data products using ICOS data
ICOS Impact Assessment: Impact indicator report 53
This list also illustrates the complexity of the research landscape in which ICOS operates: on one hand its data collection and research activities are aligned with globally operating infrastructures, whilst on the other hand it has a clear mandate to strengthen and structure the European research area (ERA), working with ESFRI projects in Europe. These two activities are not mutually exclusive, but we found that for some stakeholders it is unclear where ICOS strategic emphasis lies. Co-location of measuring sites and participation in international inter comparison programs (ICP) are some of the steps that ICOS has taken to facilitate inter-operability. However, the acceptance of ICOS data and models at this moment in time depends on the ICOS data that are forthcoming from the CP.
ICOS Impact Assessment: Conclusion 54
11 Conclusion
A core objective of this study was to analyse the impacts achieved by ICOS ERIC and provide ICOS ERIC with an impact framework which consists of useable and relevant indicators. As this report shows, ICOS has been successful in establishing positive impact on most impact indicators. This is specifically an achievement because ICOS is both a distributed and a virtual research infrastructure, which means that ICOS faces specific challenges.
Some of these challenges are specific to distributed research infrastructures, and, as identified by ESFRI, revolve around the need for effective data access, data analysis capability and long-term preservation of data. Other critical features of distributed research infrastructures are the fine balance between on the one hand added value in being an international research program, and on the other hand added value of a distributed, yet integrated, RI. Challenges that are specific to environmental research as opposed to research on more exact topics include the multidisciplinary nature of ICOS’ research and potential reliance on technologies that develop at a fast pace (ESFRI 2016). The complexity of the challenges is reflected in the equally challenging aims and positioning of ICOS. For example, to both support scientific excellence and to contribute timely information relevant to the GHG policy and decision making; to be part of a global information system on Green House Gasses and be a European pillar of global in-situ GHG observations.
The impact indicators presented in this report have been developed throughout the study with these challenges in mind. The results of this study show ICOS achieved impacts and puts these in the context of ICOS strategic objectives. To some degree, it can be read as a reflection of how well ICOS meets the challenges faced by virtual and distributed research infrastructures in general.
Although in many cases it is too early to review quantitative evidence of the impact that ICOS has generated, this study has gathered a substantial base of qualitative evidence for ICOS’ impacts. Together with the available documentation and survey results it paints a picture of a research infrastructure that is highly relevant within the European GHG research community. It has obtained this position for an important part through the successful implementation of measurement protocols throughout the research infrastructure combined with a transparent and efficient data life cycle. One of the core tasks of ICOS since the start has been, and still is, the development of the standardization requirements of the National Networks. Although many stations are still awaiting approval, the first stations that have undergone the station labelling process have now received the status of an official ICOS station, and are publishing data through the CP. Despite the long duration of this process, and the fact that data are only now becoming available, scientist working with ICOS are very positive about the improvements in data quality that ICOS has brought about: not only the quality of the physical measurements done by the measurement stations, but also to the transparency of the data processing chain, and reliability of the data quality. According to scientist themselves improvements in data quality and the harmonising of data processing protocols across measurement stations are already improving the quality of scientific output. With the projection that by the end of 2019, 80-90 % of the stations will be labelled, the focus of the thematic centres is expected to shift more and more towards the further development of the ICOS RI, through data analysis and providing support to the national networks. In many cases this is a desired development for the scientist involved.
The bibliometric analysis that was performed using publications which predate the ICOS ERIC indicate the high potential that regularly updated ICOS data from ICOS certified stations has, both inside and outside the academic world. The fact that there is a high uptake of ICOS’ data-related services and global data products, even in the absence of ICOS-certified measurements suggest that ICOS fulfils a need in providing a platform for data analysis. The DOI minting process recently implemented by ICOS should improve attribution to ICOS both in academic publications and can potentially be used to improve attribution to ICOS data products, provided that this process is adequately implemented.

ICOS Impact Assessment: Conclusion 55
ICOS effectiveness to unify the European climate science field has also had effects on innovation and R&D. These originate mostly from the fact that ICOS is a single large procurer with high demands. Suppliers of sensors and other measurement instrumentation mention that being an ICOS client counts as a sort of quality certificate. Upstream economic impacts in the way of investments mobilized by ICOS are significant and are primarily related to country contributions, 90% of which is used for national network development and further development of central facilities.
ICOS is firmly integrated in the European research infrastructure landscape, certified by the large number of joint research activities with other RIs, and the use of various methods and practices developed by ICOS in other research infrastructures. At the same time ICOS is involved in a wide range of projects with a global coverage. The large number of services and collaborations linked to global projects is testimony of the fact that the data gathered by ICOS have added value to the research community beyond the ICOS members.
The combination reliable high-quality data on GHG, national coverage and the presence of a research community means that ICOS data, even in their early stage, are already used by various communities and organizations who provide information to policy makers. The ‘contribution of timely information relevant to the GHG policy and decision making’ is one of ICOS’ explicit aims, and at the same time an example of an outcome where it is very difficult, if not impossible to attribute impact to ICOS. The narrative is that knowledge about which data are required to reach decision makers, where ICOS data can contribute to improve policy decisions, and what the current visibility is of ICOS, is crucial help to monitor ICOS’ relevance to climate action support. One example of this is the Fifth Assessment Reports (AR5) of the IPCC, where ICOS contributed to several datasets. In addition, the report makes the explicit recommendation to use longer timeseries in the estimation of changes in atmospheric concentrations of GHG. ICOS can deliver these data, and thus this can be read as a clear mandate for ICOS to produce this type of data.
ICOS Impact Assessment Report 56
12 Reference list
Scientific articles: Burke, M., Davis, W. M., & Diffenbaugh, N. S. (2018). Large potential reduction in economic damages under UN mitigation targets. Nature, 557(7706), 549–553. https://doi.org/10.1038/s41586-018-0071-9 European Strategy Forum on Research Infrastructures (ESFRI). (2016). Strategy Report on Research Infrastructures. Galligan, F., & Dyas-Correi, S. (2013). Altmetrics: Rethinking the way we measure. Serials Review, 39(1), 56–61. https://doi.org/10.1080/00987913.2013.10765486
Landschützer, P., Gruber, N., Haumann, F. A., Rödenbeck, C., Bakker, D. C. E., van Heuven, S., Wanninkhof, R. (2015). The reinvigoration of the Southern Ocean carbon sink. Science (New York, N.Y.), 349(6253), 1221–1224. https://doi.org/10.1126/science.aab2620
McFedries, P. (2012). Measuring the impact of altmetrics. IEEE Spectrum. https://doi.org/10.1109/MSPEC.2012.6247557
Web sources: Altmetric (2018). Available online: altmetric.com
Argo (2018). Available online: argo.ucsd.edu
AVS Global (2018). Available online: asvglobal.com British Parliament (2018). Available online: publications.parliament.uk/pa/cm201617/cmselect/cmsctech/145/14507.html
Ewoce (2018). Available online: ewoce.org
ICOS atmospheric thematic centre (2018). Data unit information. Available online: icos-atc.lsce.ipsl.fr
ICOS Central Analytical Laboratories(2018). Available online: icos-cal.eu ICOS RI (2018). Available online: icos-ri.eu/sites/default/files/2017-09/ICOS Mailchi (2018). ICOS newsletter winter 2017. Available online: mailchi.mp/47d77b9d4c9f/icos-newsletter-winter-2017 Regions 20 (2018). Available online: Regions20.org/approach/mrv/ World Meteorological Organization (2018) Available online: http://www.wmo.int/pages/prog/arep/gaw/ghg/IG3IS-info.html
ICOS Impact Assessment Report 57
: Impact case studies
The case studies form a collection 2-page stories on ICOS’ impacts within the following Central Facilities:
• Central Analytics Laboratories • Ocean Thematic Centre • Ecosystem Thematic Centre • Atmosphere Thematic Centre The other Central Facilities are the Carbon Portal and the ICOS ERIC head office. The Central facilities collect, process and store the data measured at the ICOS stations.
The impact cases provide information and showcase examples of how impacts linked to ICOS came about.

ICOS Impact Assessment Report 58
Case study 1: Central Analytics Laboratories (CAL)
The Central Analytical Laboratories (CAL) aims to “ensure the accuracy of ICOS atmospheric measurement data”. The CAL has the following tasks:
• provision of reference gases for calibration of continuous in-situ measurements performed at the monitoring stations;
• the analysis of ancillary parameters in air samples taken at the ICOS monitoring stations;
• maintenance of sampling containers;
• development of sampling equipment;
• support of quality control activities (ICOS-CAL website, 2018).
The CAL currently consist of two laboratories: • The Central Radiocarbon Laboratory (CRL), which is situated in Heidelberg and hosted by the
Institute of Environmental Physics of the University of Heidelberg. Tasks of the CRL include 14 CO2 analysis; developing new 14CO2 sampling equipment; helping the atmospheric ICOS sampling network; and testing and implementing fossil fuel CO2 (ff CO2 ) quantification, with the help of an atmospheric pilot station.
• The Flask and Calibration Laboratory (FCL), which is situated in Jena and hosted by the Max-Planck-Institute of Biogeochemistry. Tasks of the FCL include providing consistently calibrated real air reference gases for ICOS stations; analysing gas concentrations, stable isotopes of CO2 and O2 level in air samples from ICOS stations; providing support on the material involve; and quality control. For the quality control they maintain internal quality assurance procedures and organize international comparison (COS-CAL website, 2018).
This case study focuses on the Flask and Calibration Laboratory. It first shows how the FCL contributes to ICOS’ ability to provide harmonized data (compatible between stations), which is considered an important attribute of high-quality data by scientist who work with ICOS data. Then, it discusses the flask sampler machine as an example of the work that the CAL has done in the development of sampling equipment. Finally, the cases study shows the contribution of the FCL to community building & international cooperation. The information for this case study comes from public sources like the CAL website (https://www.icos-cal.eu/) and several interviews with people working for the CAL.
Compatible data The most obvious added value of the CAL is its role in improving the consistency of ICOS data, which makes the data more accurate. Using the same reference standards for all stations is mentioned in several interviews as a great advantage of ICOS. Prior to ICOS’ existence, each measurement station was responsible for ensuring consistency in the data it produced. ICOS provides a centralized means to organize comparisons between measurement stations at an international level. ICOS also led to a change in the scale of operations for the CRL, resulting in a large increase in the number of samples that they handle on a yearly basis (from a few dozens of samples to hundreds of samples). Also, before the Central Analytical Laboratories became the central point for analysing flask samples, providing reference gases and data evaluation a lot of effort was put in comparability by individual stations with mixed results, often leading to incomparable data records. Now, the same reference standards are used for all stations. This means that if a station sees a change in a gas concentration and other stations see it as well, it can be quantified.
One of the roles of the laboratories is to facilitate inter comparable data, by the provision of reference gases to all stations. The FCL has been doing this since 2014. In the beginning it was very busy, so PI’s had to wait for the reference gases. But now all stations are equipped with reference gases which are replaced when they run dry. Some stations are difficult to reach (e.g. in the mountains), making it more difficult to deliver the reference gases, however this is taken in to account in the delivery schedule.
ICOS Impact Assessment Report 59
Also, some of the analysis is done centrally in the laboratories, mostly when the amount of energy needed is high or if it is expensive to do the analysis on site, for example when expensive equipment is needed. In order to centrally analyse the gases in the Flask and Calibration Laboratory, stations fill flasks of 2 litres of gas. However, in April 2018 only three stations are delivering flasks to FCL, as the others are not yet able to fill the flasks.
Even though great steps have been taken to achieve data harmonisation across the ICOS network, there is still room for improvements. There are still differences between the equipment used in the stations, and the guidelines are not always being followed, which has led to problems on several occasions.
Development of flask sampler machine One of the tasks of the Central Analytical Laboratories is to develop sampling equipment. One example of equipment developed by the CAL is the flask sampler machine. The flask sampler machine has been developed as part of the ICOS preparatory phase (EC-FP7). Most stations are not able to fill flasks and the ones that do (only three ICOS stations) are using primitive constructions: a simple pump that fills a volume and needs to be stopped by the operator. The flask sampler machine developed by ICOS is easier to handle and more convenient, as it communicates directly with the FCL databases. You can program it, when and where you want a sample, and the instrument sends metadata about the filling to the database. The ICOS flasks sampler also meets the standards set by data protocols. In 2017 a prototype of the flask sampler was tested in four pilot stations. This yielded lots of feedback, which helped improving the instrument. Only these four stations are currently using the flask sampler machine, because of the high purchase cost. In 2018 the projection is to produce ten more (?) flask sampler machines. The production of the machines is done by FCL, because the production volume is too small for a company. As the machine does contain any parts that are unique to ICOS, it can be used by the wider (non-ICOS) air sampling community. There is already a broader interest for the machine.
Community building & international cooperation At the FCL they have noticed that ICOS has improved community building and international cooperation. The scientific community that existed before ICOS was grouped along EU projects which are temporary in nature. ICOS provides more continuity in the community. Specifically, the Monitoring Station Assemblies (MSAs) are considered very beneficial to the sense of community by those involved. There are MSAs for the Atmosphere, Ecosystem and Ocean Station Network. All Station Principal Investigators (PIs) are part of the MSA and meet twice a year. Also, the international collaboration is easier with ICOS. For example, collaborating with the American agency NOAA (National Oceanic and Atmospheric Administration), is much easier when communications go through one institution in the EU, instead of having different groups communicating with them. When the FCL had the first inter comparison with the USA they were listed in the result sheet as “EU”. This indicates that they see he FCL as a European effort, not as a German organisation (since it is located in Jena, Germany).
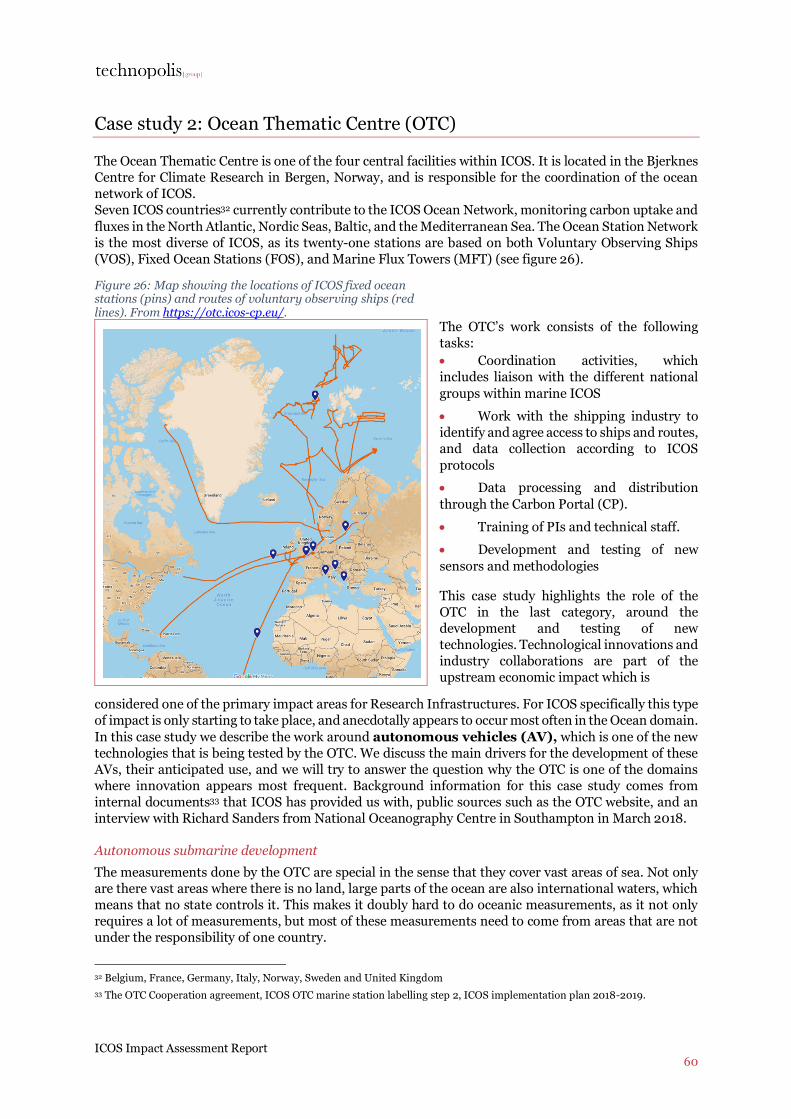
ICOS Impact Assessment Report 60
Case study 2: Ocean Thematic Centre (OTC)
The Ocean Thematic Centre is one of the four central facilities within ICOS. It is located in the Bjerknes Centre for Climate Research in Bergen, Norway, and is responsible for the coordination of the ocean network of ICOS. Seven ICOS countries32 currently contribute to the ICOS Ocean Network, monitoring carbon uptake and fluxes in the North Atlantic, Nordic Seas, Baltic, and the Mediterranean Sea. The Ocean Station Network is the most diverse of ICOS, as its twenty-one stations are based on both Voluntary Observing Ships (VOS), Fixed Ocean Stations (FOS), and Marine Flux Towers (MFT) (see figure 26).
Figure 26: Map showing the locations of ICOS fixed ocean stations (pins) and routes of voluntary observing ships (red lines). From https://otc.icos-cp.eu/.
The OTC’s work consists of the following tasks: • Coordination activities, which includes liaison with the different national groups within marine ICOS • Work with the shipping industry to identify and agree access to ships and routes, and data collection according to ICOS protocols • Data processing and distribution through the Carbon Portal (CP). • Training of PIs and technical staff. • Development and testing of new sensors and methodologies
This case study highlights the role of the OTC in the last category, around the development and testing of new technologies. Technological innovations and industry collaborations are part of the upstream economic impact which is
considered one of the primary impact areas for Research Infrastructures. For ICOS specifically this type of impact is only starting to take place, and anecdotally appears to occur most often in the Ocean domain. In this case study we describe the work around autonomous vehicles (AV), which is one of the new technologies that is being tested by the OTC. We discuss the main drivers for the development of these AVs, their anticipated use, and we will try to answer the question why the OTC is one of the domains where innovation appears most frequent. Background information for this case study comes from internal documents33 that ICOS has provided us with, public sources such as the OTC website, and an interview with Richard Sanders from National Oceanography Centre in Southampton in March 2018.
Autonomous submarine development The measurements done by the OTC are special in the sense that they cover vast areas of sea. Not only are there vast areas where there is no land, large parts of the ocean are also international waters, which means that no state controls it. This makes it doubly hard to do oceanic measurements, as it not only requires a lot of measurements, but most of these measurements need to come from areas that are not under the responsibility of one country.
32 Belgium, France, Germany, Italy, Norway, Sweden and United Kingdom 33 The OTC Cooperation agreement, ICOS OTC marine station labelling step 2, ICOS implementation plan 2018-2019.
ICOS Impact Assessment Report 61
Despite this lack of ownership around ocean measurements, there is a long history of international collaborations in longitudinal ocean measurements for climate research. Examples are the world ocean circulation experiment (WOCE)(WOCE website, 2018),which ran between 1990 and 1998, the still ongoing Global Ocean Observing System (GOOS), started in 1991, Global Ocean Ship-based Hydrographic Investigations Program (GO-SHIP) since 2010, and the Surface Ocean CO₂ Atlas (SOCAt) which started in 2007. ICOS membership (for the UK in this case) has resulted in structural funding for longitudinal ocean measurements, and a higher level of internal organisation than was previously the case, as a consequence of the high-level measurements required for ICOS. From a scientific perspective, ICOS has an impact by improving the level of long-term monitoring, and through its aim to measure natural changes in the carbon cycle, which is imperative in order to understand the extent of human contributions to perturbations of the carbon cycle. This context explains to some extent why so many technological innovations take place in the ocean domain: the presence of stakeholders and (overlapping) initiatives, which bring longitudinal funding, that require measurements from large swaths of ocean that are not owned by anyone.
The development of autonomous vehicles for ocean carbon measurement at this time is driven by various reasons: 1. The need for more data: although there are sufficient shipping routes in the northern hemisphere,
the southern oceans, from about 40 degrees south, are very deserted and do contain some of the largest carbon sinks (Landschützer et al.,2015). Covering this area requires a large capacity of measurement stations/ vessels.
2. Communication and coordination with merchant ship takes a lot of time. 3. The need to de-risk the wider field of oceanic measurements such as measurements under ice, or
measurements around oil spills. 4. Money. Autonomous vehicles can cover large areas and do it cheaply.
In 2014 the UK adopted the ‘UK Robotic and Autonomous Systems (RAS)’ strategy (British Parliament, 2018), which had as one of its aims to develop a new breed of unmanned surface vehicles (USV). This strategy saw £400 million pounds (455m Euro) earmarked for key sectors including the marine industry and an ongoing commitment to robotics. The Readiness of ICOS for Necessities of integrated Global Observations (RINGO) project, a 3-year project which started in 2017 additionally provided funding to develop the use of autonomous vehicles as part of WP3.3 ‘Moving towards an autonomous system to measure ocean surface carbon uptake in regions and seasons where merchant vessel- based systems are not suitable’.
Currently OTC measurements rely on a combination of sampling done by manned (research vessels, carbonate system sensors on commercial ships) and unmanned stations. In addition, there are measurements that are collected with floats, which drift on currents around the oceans. These ARGO floats (Argo, 2018), which form global array of 3,800 free-drifting profiling floats, were first released in 2000, and originally only measured temperature and salinity in the ocean. More recently, p CO2 /pH sensors are added to these floats, which at this moment in time give crude CO2measurements. ARGO floats are managed at European level by the EURO ARGO RI, which in turn coordinates the integration of p CO2 /pH sensors on Argo floats with ICOS. Since these floats are undirected they cannot be coordinated, and each year around 200 floats are released to replace floats that have reached the end of their lifecycle (which is about 10 years). Here measurement instruments in an AV would bring the advantage of being able to do better measurements, because of the type of instruments that can be carried by an AV instead of a float, and that it would be possible to direct it, and bring to land when needed to get the data and/or do maintenance.
The development of an autonomous vehicle for use by the OTC is a collaboration between the National Oceanography Centre in Southampton (UK), the university of Exeter, and ASV (ASV global, 2018), a company which develops unmanned marine systems. At this moment in time they are working on a proof of principle, and the expectation is that the first test in UK waters will take place later this year. The core principle that is being developed is that of miniaturisation: to make the existing instruments small enough to fit in a vehicle the size of a canoe. Most of the development of the shell takes part in ASV, whilst the instrument development is primarily done in the university environment.
ICOS Impact Assessment Report 62
Case study 3: Ecosystem Thematic Centre (ETC)
The Ecosystem Thematic Centre (ETC) is one of the central research facilities of ICOS and coordinates the ecosystem station network. The mission of the ETC is:
1. The ETC coordinates the ecosystem station network by providing the highly standardized protocols and instructions for the measurements and evaluating and safeguarding the quality of the data.
2. The ETC supports the ecosystem station network with various services such as the centralized chemical analysis of soil and plant samples and the centralized processing of all the data collected.
3. The ETC ensures the continuous development of the ecosystem station network by testing new instruments and methods to be deployed in the network (ICOS,2018).
The Ecosystem Thematic Centre is coordinated and operated by research institutes of three countries: Italy, France and Belgium. In April 2012 they signed a Memorandum of Understanding, confirming the joint effort for establishing and operating the ETC. It is organized in four main units: ETC Executive Committee Unit, Data unit, Test unit and Network unit.
In 2017 the first three ecosystem stations received a Certificate for meeting the high standards of ICOS: Siikaneva in Finland, Lonzée in Belgium, and Torgnon in Italy. By the end of 2019 all ICOS stations should meet these standards. Also, in 2016 definitions of standards were made, data transfer was tested and a web interface for metadata was developed. Another achievement in 2016 was the preparation of “Instruction documents”, including clear and standardized methodologies. Furthermore, the first vegetation samples were analyzed at the ETC labs in France (Mailchi ,2018).
This case study gives more insight in the role of the Ecosystem Thematic Centre within ICOS and provides an example of innovations through the ETC. It starts with elaborating on how the ETC develops standardized protocols and instructions, using a bottom-up approach. And subsequently, the case study shows ETC’s contribution to testing new instruments and methods, like a laser scanner to measure the volume of wood in a forest. For this case study publicly available information is used, like the ETC website (http://gaia.agraria.unitus.it/icos/), and interviews are conducted with two employees of the ETC.
Bottom-up approach using working groups For defining protocols for instruments, methods, and processing of all variables the Ecosystem Thematic Centre has chosen a bottom-up approach. This in contrary to the National Oceanic and Atmospheric Administration (NOAA) where a top-down approach is used. The bottom-up approach of ETC works with Working Groups (WG), where for each variable a new Working Group is started. The WG makes instruction documents on the standardization agreements, like types of sensors used, methods used and other instructions. The Working Groups are open to everyone, including individuals outside of ICOS, and often consists of researchers from all over the world. Typically, at the beginning of a working group the ETC starts by asking in their network who wants to coordinate a WG, and by inviting key people from other networks (like the US, Canada and Australia) to join. Companies are also invited to participate in the WG’s and multiple companies currently take part in different WGs. Although this is a potential conflict of interest, companies also provide experts on sensors. The companies do not have a say in the final decisions, but their knowledge is being used. Most of the WG’s are finished at this time, but when new technologies are tested, the WG for that variable will start a discussion on whether to use the old or the new technology. Also, if there is a new variable that could be interesting, ETC starts a new working group.
The process for the working groups is simple and efficient. The WG’s start with workshops, where it is discussed what should be in the documents. The coordinators write it up and ask for feedback from the participants of the WG. After a few iterations the Principal Investigators (PI’s) of the stations reach consensus and the documents are finalized.
ICOS Impact Assessment Report 63
This bottom-up approach is time consuming but works well and has advantages such as the fact that all knowledge from direct stakeholders is used in making decisions, which in turn makes it easy to implement the decisions in the network as they are supported by the internal community and everybody has had an opportunity to contribute.
Testing and implementing new technologies The ETC also looks at new technologies. They follow new technologies that come out, and if deemed interesting for ICOS, they test it by using it for measurements which run parallel to the existing measurement. After the test, the decision to use the new technology is made by the working group based on the test results. After approval the ETC coordinates the implementation of the new technology. An example of a new technology the ETC is currently testing is a laser scanner which could be used to make a 3d-scan of the volume of wood in a forest. This tree volume is difficult to measure as you cannot use a destructive method, which is used for example for measuring biomass volume. The measurement using the laser scanner is likely to be more accurate than the traditional method that is currently used, which determines the volume of the tree based on measurements of the diameter at breast height. Also, this traditional method requires a large sample size and it is labour-intensive. To verify the accuracy of the test measures of the laser scanner, trees are felled after the scan has been made to define the exact volume of the trees.
The technology for the laser scanner is not new, however the application of this technology to ecosystem measurements is new. It is already used for estimating volumes in mining or in the building environment to make scans of indoor rooms. After the tests of ETC it will be discussed in the broad network and decided in the working group if this technology can be used to further improve ICOS measurements.
ICOS Impact Assessment Report 64
Case study 4: Atmosphere Thematic Centre (ATC)
The Atmosphere Thematic Centre (ATC) is one of the four central facilities of ICOS. Each of the four facilities has its own specific tasks to support the ICOS network. The main aim of the ATC is to coordinate the atmospheric measurements of the ICOS measurement stations.
To fulfil this aim, the ATC has the following tasks: • Regularly fulfil measurement technology surveys; • Test and analyse the GHG and isotope measurement instruments of tomorrow; • Develop new sensors through R&D programs at a national and international level; • Maintaining a link with the industry (ICOS atmospheric thematic centre (2018). The ATC has two laboratories in use: • The Laboratory for Climatological and Environmental Science (LSCE) in Gif sur Yvette; • The ATC mobile lab in Finland hosted by the Finnish Meteorological Institute in Helsinki. Outside the two laboratories a large share of the activities of the ATC takes place at their data unit, which is based in Gif sur Yvette has the daily task to process data and to offer support in the preparation of data. Besides the handling of data the ATC supervises the data processing chain, and develops and maintains in-house software to centrally process and quality control the data from the atmospheric ICOS networks. The ATC ensures communication with ICOS Carbon Portal for (meta)data and allows the data to be traceable to the international primary standard for GHG. It produces Near Real Time (NRT) data products for ICOS researchers. Furthermore, the ATC serves as a training centre for ICOS atmospheric measurements and quality control, quality assessment.’ 34 This case study will describe some of the unique features of the ATC such as: • The ATC as innovation hub • The ATC as a centre for testing and community building • The mobile observation and calibration centre To come to these observations and analysis publicly available resources were used, such as the ATC website ( https://icos-atc.lsce.ipsl.fr/) and interviews with ICOS and ATC related researchers.
Innovation hub The ATC is considered to be an innovation hub in the area of scientific instruments. Employees from the ATC and commercial partners (who use the ATC to develop their products) indicate that the facilities offer the opportunity to improve the quality of their measurement tools. The access to and availability of test facilities encourage manufacturers to develop instruments that can connect to other instruments more easily. The employees also indicated that the emphasis from ICOS and the ATC on the measurement of N2O enhanced the focus on this greenhouse gas. The manufacturers indicated that the support from the ATC during test sessions strengthened their collaboration and helped to improve their N2O measurements. The activities at the ATC helped to improve the instruments to become less sensitive to atmospheric pressure and helped the stabilization of the instruments.
Testing and community building The ATC is a central and recognizable place in the ICOS infrastructure. Researchers and manufacturers come from all over Europe to test their measurement instruments and discuss their scientific findings. The ATC performs technological tests to find the best way to use the instruments for ICOS. The tests bring together engineers and researchers from the entire world. For example: A partnership with an Australian developer called Eco-Tech led to the further development of the Spectronus instrument. The
34 https://icos-atc.lsce.ipsl.fr/dataunit
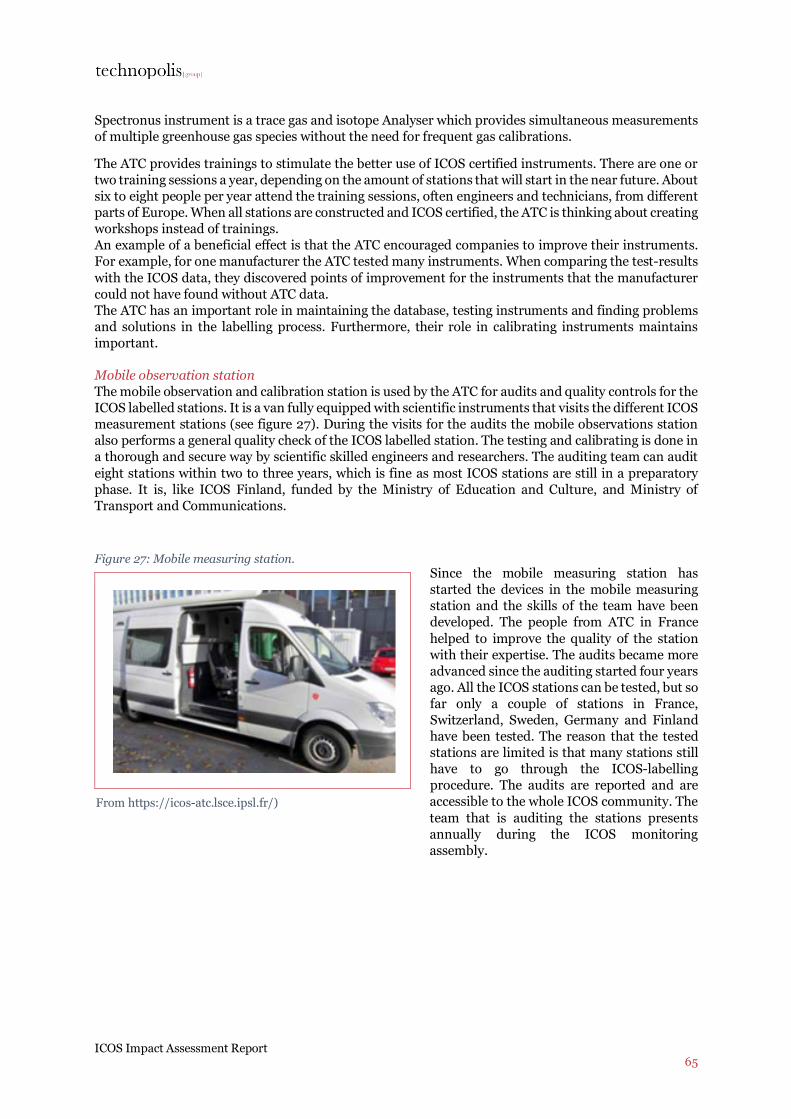
ICOS Impact Assessment Report 65
Spectronus instrument is a trace gas and isotope Analyser which provides simultaneous measurements of multiple greenhouse gas species without the need for frequent gas calibrations.
The ATC provides trainings to stimulate the better use of ICOS certified instruments. There are one or two training sessions a year, depending on the amount of stations that will start in the near future. About six to eight people per year attend the training sessions, often engineers and technicians, from different parts of Europe. When all stations are constructed and ICOS certified, the ATC is thinking about creating workshops instead of trainings. An example of a beneficial effect is that the ATC encouraged companies to improve their instruments. For example, for one manufacturer the ATC tested many instruments. When comparing the test-results with the ICOS data, they discovered points of improvement for the instruments that the manufacturer could not have found without ATC data. The ATC has an important role in maintaining the database, testing instruments and finding problems and solutions in the labelling process. Furthermore, their role in calibrating instruments maintains important.
Mobile observation station The mobile observation and calibration station is used by the ATC for audits and quality controls for the ICOS labelled stations. It is a van fully equipped with scientific instruments that visits the different ICOS measurement stations (see figure 27). During the visits for the audits the mobile observations station also performs a general quality check of the ICOS labelled station. The testing and calibrating is done in a thorough and secure way by scientific skilled engineers and researchers. The auditing team can audit eight stations within two to three years, which is fine as most ICOS stations are still in a preparatory phase. It is, like ICOS Finland, funded by the Ministry of Education and Culture, and Ministry of Transport and Communications.
Figure 27: Mobile measuring station. Since the mobile measuring station has started the devices in the mobile measuring station and the skills of the team have been developed. The people from ATC in France helped to improve the quality of the station with their expertise. The audits became more advanced since the auditing started four years ago. All the ICOS stations can be tested, but so far only a couple of stations in France, Switzerland, Sweden, Germany and Finland have been tested. The reason that the tested stations are limited is that many stations still have to go through the ICOS-labelling procedure. The audits are reported and are accessible to the whole ICOS community. The team that is auditing the stations presents annually during the ICOS monitoring assembly.
From https://icos-atc.lsce.ipsl.fr/)
<click to type Source>
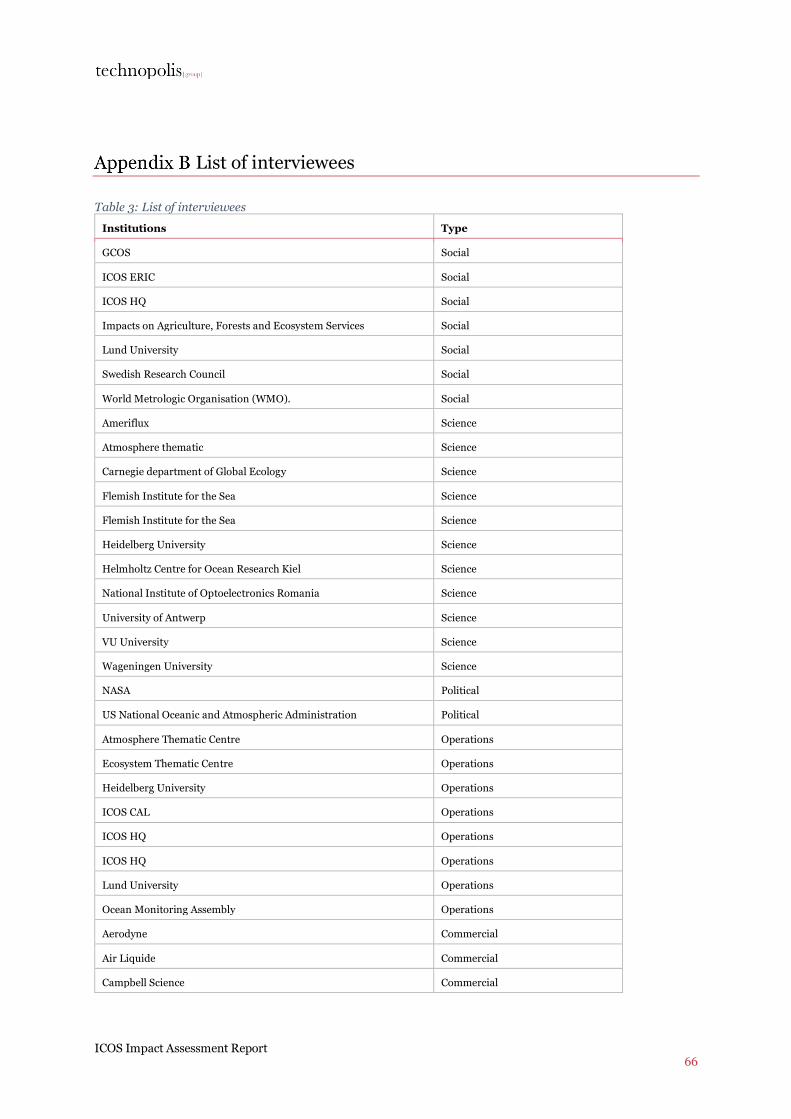
ICOS Impact Assessment Report 66
List of interviewees
Table 3: List of interviewees Institutions Type
GCOS Social
ICOS ERIC Social
ICOS HQ Social
Impacts on Agriculture, Forests and Ecosystem Services Social
Lund University Social
Swedish Research Council Social
World Metrologic Organisation (WMO). Social
Ameriflux Science
Atmosphere thematic Science
Carnegie department of Global Ecology Science
Flemish Institute for the Sea Science
Flemish Institute for the Sea Science
Heidelberg University Science
Helmholtz Centre for Ocean Research Kiel Science
National Institute of Optoelectronics Romania Science
University of Antwerp Science
VU University Science
Wageningen University Science
NASA Political
US National Oceanic and Atmospheric Administration Political
Atmosphere Thematic Centre Operations
Ecosystem Thematic Centre Operations
Heidelberg University Operations
ICOS CAL Operations
ICOS HQ Operations
ICOS HQ Operations
Lund University Operations
Ocean Monitoring Assembly Operations
Aerodyne Commercial
Air Liquide Commercial
Campbell Science Commercial

ICOS Impact Assessment Report 67
Institutions Type
Gill instruments Commercial
Licor Commercial
Picarro Commercial Technopolis Group
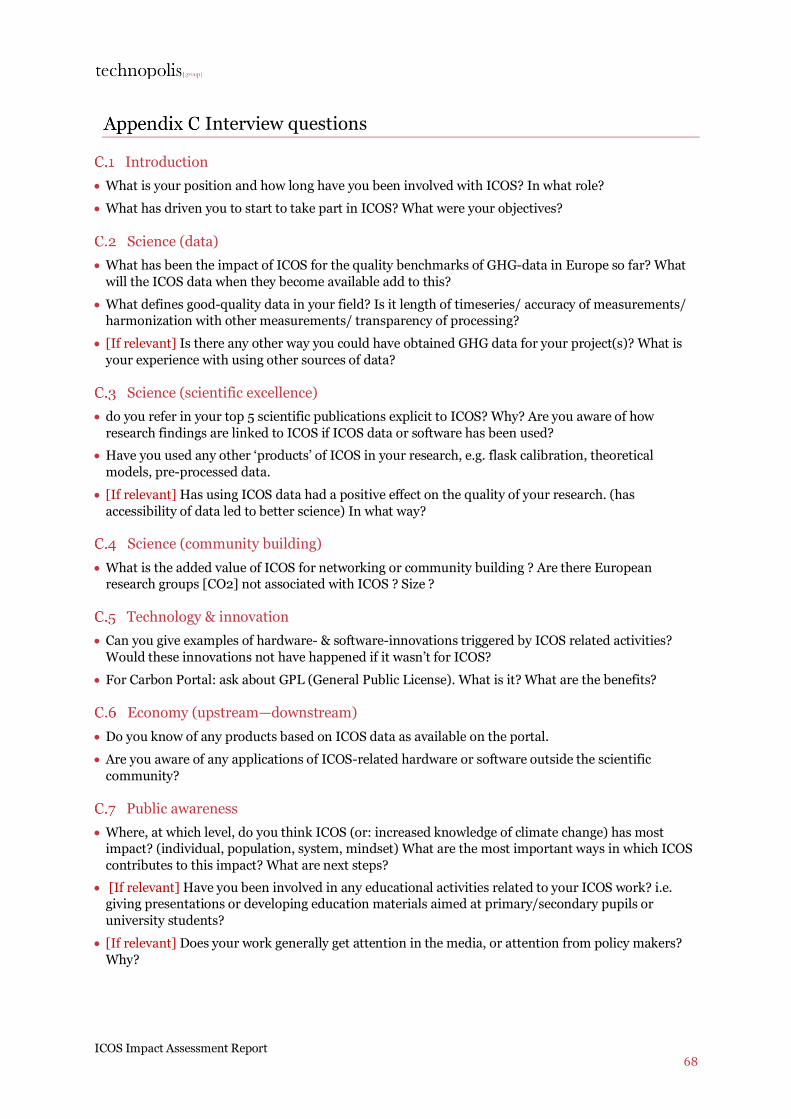
ICOS Impact Assessment Report 68
Interview questions
Introduction • What is your position and how long have you been involved with ICOS? In what role? • What has driven you to start to take part in ICOS? What were your objectives?
Science (data) • What has been the impact of ICOS for the quality benchmarks of GHG-data in Europe so far? What
will the ICOS data when they become available add to this? • What defines good-quality data in your field? Is it length of timeseries/ accuracy of measurements/
harmonization with other measurements/ transparency of processing? • [If relevant] Is there any other way you could have obtained GHG data for your project(s)? What is
your experience with using other sources of data?
Science (scientific excellence) • do you refer in your top 5 scientific publications explicit to ICOS? Why? Are you aware of how
research findings are linked to ICOS if ICOS data or software has been used? • Have you used any other ‘products’ of ICOS in your research, e.g. flask calibration, theoretical
models, pre-processed data. • [If relevant] Has using ICOS data had a positive effect on the quality of your research. (has
accessibility of data led to better science) In what way?
Science (community building) • What is the added value of ICOS for networking or community building ? Are there European
research groups [CO2] not associated with ICOS ? Size ?
Technology & innovation • Can you give examples of hardware- & software-innovations triggered by ICOS related activities?
Would these innovations not have happened if it wasn’t for ICOS? • For Carbon Portal: ask about GPL (General Public License). What is it? What are the benefits?
Economy (upstream—downstream) • Do you know of any products based on ICOS data as available on the portal. • Are you aware of any applications of ICOS-related hardware or software outside the scientific
community?
Public awareness • Where, at which level, do you think ICOS (or: increased knowledge of climate change) has most
impact? (individual, population, system, mindset) What are the most important ways in which ICOS contributes to this impact? What are next steps?
• [If relevant] Have you been involved in any educational activities related to your ICOS work? i.e. giving presentations or developing education materials aimed at primary/secondary pupils or university students?
• [If relevant] Does your work generally get attention in the media, or attention from policy makers? Why?
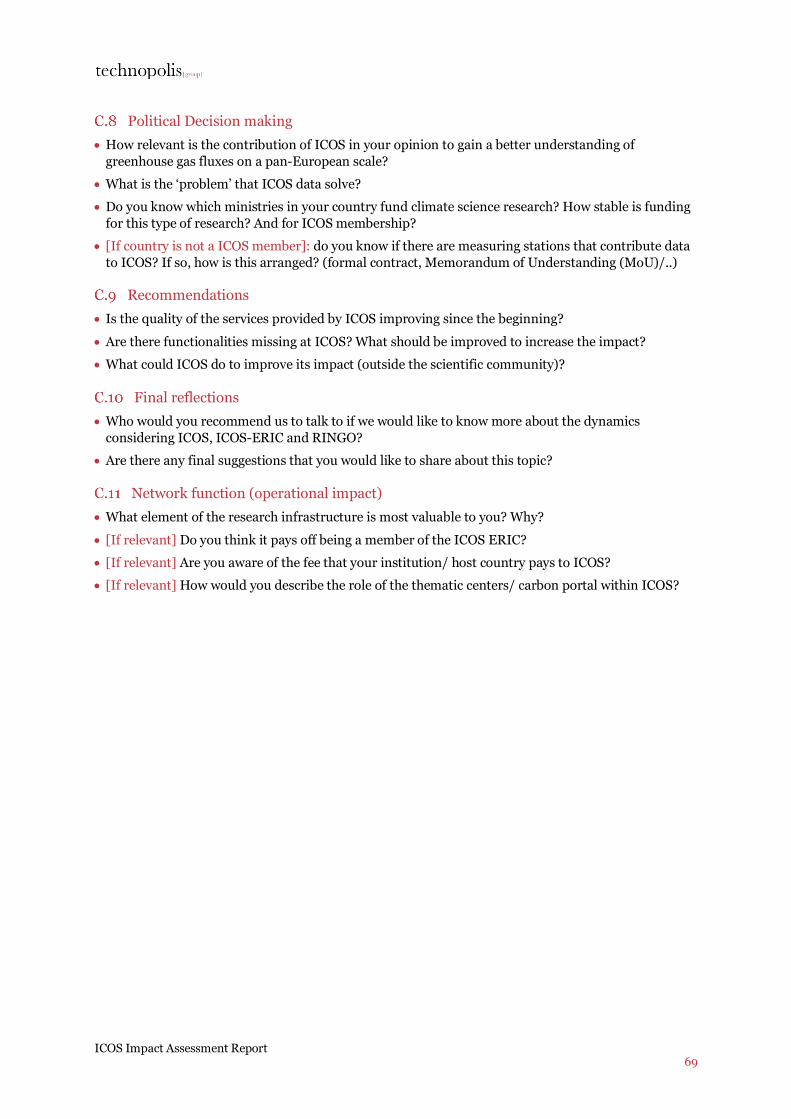
ICOS Impact Assessment Report 69
Political Decision making • How relevant is the contribution of ICOS in your opinion to gain a better understanding of
greenhouse gas fluxes on a pan-European scale? • What is the ‘problem’ that ICOS data solve? • Do you know which ministries in your country fund climate science research? How stable is funding
for this type of research? And for ICOS membership? • [If country is not a ICOS member]: do you know if there are measuring stations that contribute data
to ICOS? If so, how is this arranged? (formal contract, Memorandum of Understanding (MoU)/..)
Recommendations • Is the quality of the services provided by ICOS improving since the beginning? • Are there functionalities missing at ICOS? What should be improved to increase the impact? • What could ICOS do to improve its impact (outside the scientific community)?
Final reflections • Who would you recommend us to talk to if we would like to know more about the dynamics
considering ICOS, ICOS-ERIC and RINGO? • Are there any final suggestions that you would like to share about this topic?
Network function (operational impact) • What element of the research infrastructure is most valuable to you? Why? • [If relevant] Do you think it pays off being a member of the ICOS ERIC? • [If relevant] Are you aware of the fee that your institution/ host country pays to ICOS? • [If relevant] How would you describe the role of the thematic centers/ carbon portal within ICOS?
ICOS Impact Assessment Report 70
ICOS Survey questions
Dear reader,
Thank you for opening this survey. For ICOS ERIC, this year is themed with community interaction. Therefore, we are running two projects. The ICOS Identity Study, for which you have already received an invitation, and the ICOS Impact Assessment. The Impact Assessment of which this survey is a part, enables us to look back what has been achieved already, and prepare our strategy for the near future. We know this community interaction take valuable time that you probably want to spend on your research topic. Still, we urge you to provide us with your valuable insights: this enables us to improve ICOS and thus the way we can serve you.
This survey
Population parameters – 2 questions 1. Do you consider yourself as a researcher, or an applier of research results?
- I do fundamental research - I do applied research - I do both fundamental and applied research - I use results from research to develop products - None of the above (please specify)
Science – 6 questions 2. Please tell us, how frequently have you used ICOS?
- ICOS Data; Methods and protocols (e.g. calibration, calculation) developed by ICOS; Instruments developed for ICOS; Other (specify).
3. Please indicate your agreement with the following statements
- ICOS improves the quality of my work by: improving data accessibility; improving data continuity; improving data geographical resolution; Improving data time series length; Improving data geographical coverage; Improving the availability of standardised data; Improving the precision of measurements; Improving calibration samples; Improving access to calibration samples; Improving measurement protocols; Harmonising data processing protocols in the EU; Harmomising data processing protocols worldwide.
ICOS Impact Assessment Report 71
4. To what extent is ICOS’ CAL, OTC, ATC and ETC important for your research and analysis tasks?
5. To what extend do you feel ICOS is realising her mission to?
6. Have you experienced situations where existing models or processing methods were adjusted because of observations or measurements made by ICOS? If so, how/why?
7. Can you give us us citation references and/or DOIs of your (five) best articles using ICOS data or methods?
Tech and Innovation + Economy – 7 questions 1. Are you aware of instances where ICOS output, knowledge or affiliation led to the formation of public-private partnerships?
2. To your knowledge, did ICOS facilitate the development of new or improved methods, with applicability beyond the ICOS domain?
3. Are you aware of any examples of new or improved instruments made because of ICOS involvement?
4. Are you aware of any instances of original software or algorithms developed by ICOS?
5. Are you aware of any spin-offs or spin-outs linked to sample analysis hardware/ software?
6. Are you aware of instances where ICOS activities led/ will lead to increased employment and turnover?
7. Are you aware of application of ICOS methods and/or data in commercial products (e.g. software applications using ICOS data, weather models, calibration methods)?
Political decision making – 5 questions 1. Do you know of instances where political decision makers have based their decisions on recommendations based on ICOS? If so, from what political level?
- No - Yes, municipalities - Yes, province or region - Yes, country - Yes, EU - Yes, supranational (e.g. IPCC, UN) - Yes, other (please specify)
2. If yes, what raises interest?
- Insights in CO2 emitters and uptakers - Policy effectiveness - Harmonisation of climate science - Other, please specify
3. Do you think that research directly facilitated by ICOS will lead to a better understanding of GHG emissions and uptake?
4. What would be the primary mechanism behind this improved understanding of GHG emissions?
5. Do you think ICOS will lead to improved quality of decision making on CO2-relvant topics?
ICOS Impact Assessment Report 72
6. Can you give the names of the most important policy documents and/or organisations (political bodies) (you’re aware of) using ICOS related research results?
Society – 4 questions 1. Did you ever…
- Reach mainstream media or popular science media with ICOS related research results? - Give public lectures (outside academia) about ICOS or research topics supported by ICOS
activities? - Teach at secondary or primary schools about ICOS or research topics supported by ICOS
activities? 2. Can you give examples (hyperlinks) of media or popular science media that you or your research results have reached?
3. To your knowledge, does ICOS contribute to any of the following:
- Increased number or improved quality of education programmes on climate science If yes, can you lead us to evidence: what programmes at which institution?
- More students for research topics initiated by ICOS If yes, can you lead us to evidence what: programmes at which institution?
- More graduations in research topics initiated by ICOS If yes, can you lead us to evidence: what programmes at which institution?
4. One of ICOS statutory missions is the Facilitation of European research programmes and projects. How do you feel about ICOS role in European research programmes and projects?
5. Are you aware of increased researcher exchange and mobility as a consequence of ICOS’ research?
6. To what extent does ICOS contribute to the existence of research, measurement or other communities?
Wind-up – 4 questions 1. Who did/do you want to reach with your research based on the data from ICOS?
2. What challenges should ICOS overcome to have a more prominent impact? In
- Science - Technology and innovation - Political decision making - Society - Other.
3. Do you have anything else you’d like to share?
4. Thank you very much for participating in this survey. Can we contact you for an interview on your experiences?
ICOS Impact Assessment Report 73
Glossary
ATC The Atmospheric Thematic Centre
CAL Central Analytical Laboratories
CF ICOS central facilities
CO2 Carbon dioxide
CP ICOS Carbon Portal
DOI Digital Objective Identifier
ENVRI Environmental and Earth System Research Infrastructures
ERIC European Research Infrastructure Consortium
ESFRI European Strategy Forum on Research Infrastructures
ESS European Spallation Source
ETC Ecosystem Thematic Centre
FP6 The Sixth framework program
GHG greenhouse gas
GSF The Global Science Forum
HO ICOS ERIC head office
ICOSRI The Integrated Carbon Observation System Research Infrastructure
KPI Key Performance Indicators
NN ICOS National Networks
OECD The Organisation for Economic Co-operation and Development
OTC Ocean Thematic Centre
RINGO Readiness of ICOS for Necessities of Integrated Global Observations
SKA Square Kilometre Array
UK United Kingdom
technopolis |group| The Netherlands Spuistraat 283 1012 VR Amsterdam The Netherlands T +31 20 535 2244 F +31 20 428 9656 E [email protected] www.technopolis-group.com
Pictures front cover and back cover: Konsta Punkka for #ICOScapes Campaign: https://www.icos-ri.eu/icoscapes
ICOS strategy

Contents
EXECUTIVE SUMMARY 1
BACKGROUND 6The mission of ICOS 6The structure of ICOS 6
FRAMEWORK 8Scientific excellence: ICOS as an ESFRI Landmark 8Societal impact: the role of ICOS in the Paris Agreement 9
ICOS as part of the Global Climate Observation System (GCOS) 12ICOS in the European Framework (COPERNICUS) 14
A VISION OF ICOS BEYOND THE NEXT DECADE 15
ACTIVITIES TOWARDS OUR VISION 18Developing the infrastructure 18
Quality of measurements 18Network coverage 18Comprehensive set of parameters 19Interoperability 19Realizing a reliable data life cycle from sensors to users 21Usage tracking 22Stability 22
Current and future science 24Demands from science to improve ICOS observations and services 24Detecting trends and understanding the drivers in land and ocean sinks 25City observatories 25Terrestrial ecosystem management between food production, bioenergy and greenhouse gas mitigation 26Services supporting science 26
The ICOS communities 28Maintaining the engagement of the community of ICOS operators 29Feedback from users of ICOS data 29Dialog with stakeholders: societal impact of greenhouse gas observations 30
International cooperation 31Cooperation among European Environmental Research Infrastructures 31Further development of international data initiatives 32Involvement in international initiatives 32Active support for the construction of networks in less developed regions 33
APPENDIX 1: ABBREVIATIONS 34
APPENDIX 2: RELEVANT DOCUMENTS 38
APPENDIX 3: REFERENCES 39
CONTACTS 40
Executive Summary
The Integrated Carbon Observation System
(ICOS) is a distributed pan-European research
infrastructure producing high-quality data on
greenhouse gas concentrations in the atmo-
sphere, as well as on carbon fluxes between the
atmosphere, the land surface and the oceans. It
was listed on the first Roadmap for European
Research Infrastructures in 2006, reaching its
final legal status (ICOS ERIC) in 2015.
The research infrastructure became fully
operational towards the end of the first five-year
period of ICOS ERIC, and this milestone seems
to be the right time to reflect and orient further
developments. The framework in which ICOS
is operating has been dynamic during the past
years; Earth observation is increasingly an inte-
gration of increasing in-situ observations and
remote sensing, supported by big data applica-
tions that have recently become available. The
high quality data and related products provided
by ICOS are becoming part of a global system
of science and observation that supports the
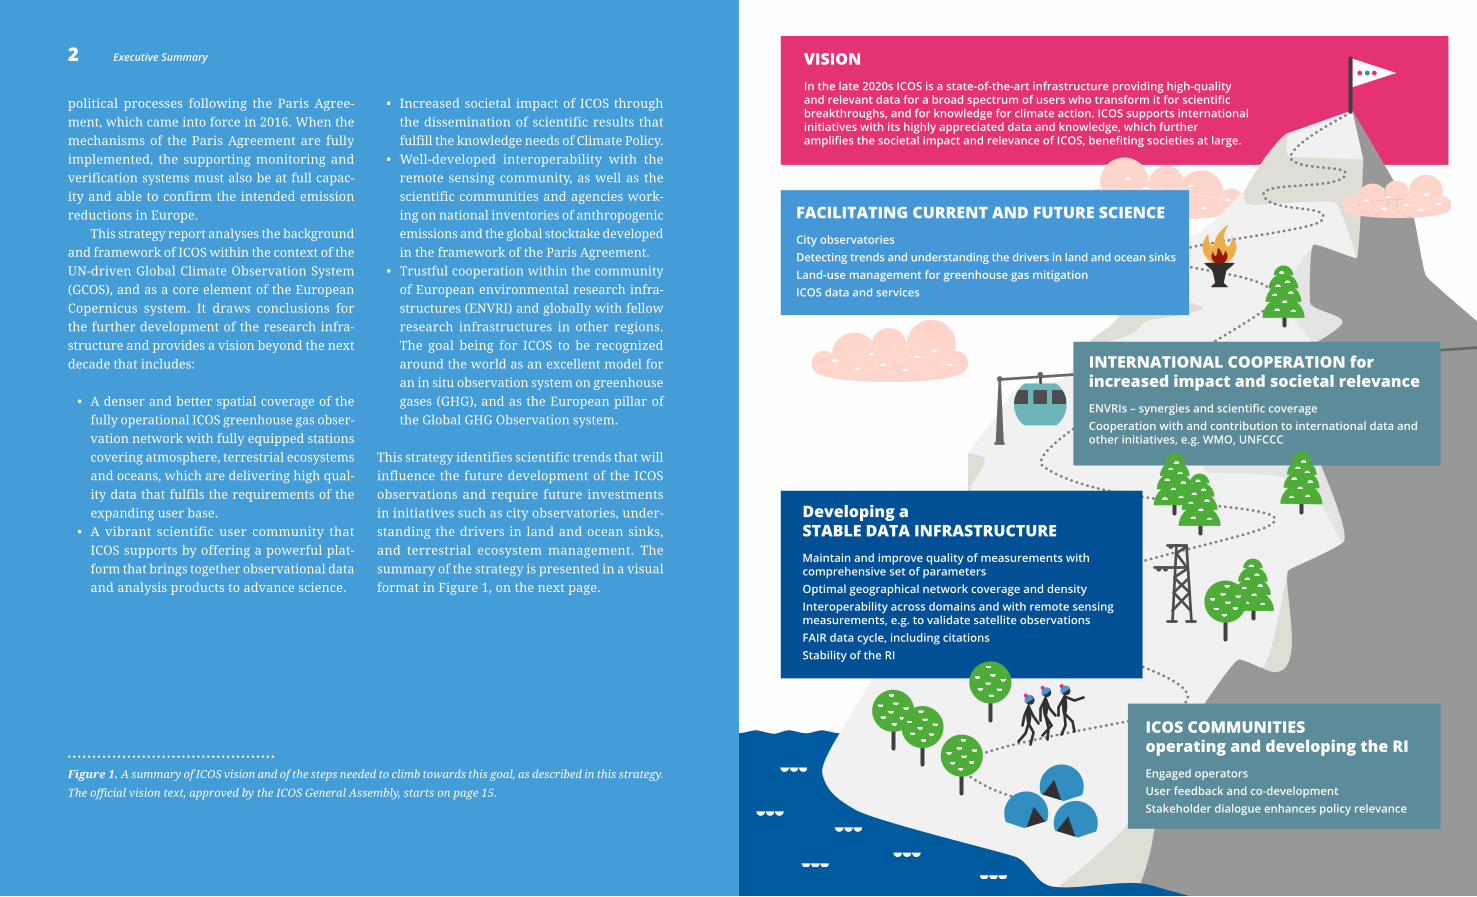
2 Executive Summary
political processes following the Paris Agree-
ment, which came into force in 2016. When the
mechanisms of the Paris Agreement are fully
implemented, the supporting monitoring and
verification systems must also be at full capac-
ity and able to confirm the intended emission
reductions in Europe.
This strategy report analyses the background
and framework of ICOS within the context of the
UN-driven Global Climate Observation System
(GCOS), and as a core element of the European
Copernicus system. It draws conclusions for
the further development of the research infra-
structure and provides a vision beyond the next
decade that includes:
• A denser and better spatial coverage of the
fully operational ICOS greenhouse gas obser-
vation network with fully equipped stations
covering atmosphere, terrestrial ecosystems
and oceans, which are delivering high qual-
ity data that fulfils the requirements of the
expanding user base.
• A vibrant scientific user community that
ICOS supports by offering a powerful plat-
form that brings together observational data
and analysis products to advance science.
• Increased societal impact of ICOS through
the dissemination of scientific results that
fulfill the knowledge needs of Climate Policy.
• Well-developed interoperability with the
remote sensing community, as well as the
scientific communities and agencies work-
ing on national inventories of anthropogenic
emissions and the global stocktake developed
in the framework of the Paris Agreement.
• Trustful cooperation within the community
of European environmental research infra-
structures (ENVRI) and globally with fellow
research infrastructures in other regions.
The goal being for ICOS to be recognized
around the world as an excellent model for
an in situ observation system on greenhouse
gases (GHG), and as the European pillar of
the Global GHG Observation system.
This strategy identifies scientific trends that will
influence the future development of the ICOS
observations and require future investments
in initiatives such as city observatories, under-
standing the drivers in land and ocean sinks,
and terrestrial ecosystem management. The
summary of the strategy is presented in a visual
format in Figure 1, on the next page.
• • • • • • • • • • • • • • • • • • • • • • • • • • • • • • • • • • • • • • • • • •
Figure 1. A summary of ICOS vision and of the steps needed to climb towards this goal, as described in this strategy.
The official vision text, approved by the ICOS General Assembly, starts on page 15.
ICOS COMMUNITIES operating and developing the RIEngaged operatorsUser feedback and co-developmentStakeholder dialogue enhances policy relevance
INTERNATIONAL COOPERATION for increased impact and societal relevanceENVRIs – synergies and scientific coverageCooperation with and contribution to international data and other initiatives, e.g. WMO, UNFCCC
FACILITATING CURRENT AND FUTURE SCIENCECity observatoriesDetecting trends and understanding the drivers in land and ocean sinksLand-use management for greenhouse gas mitigationICOS data and services
Developing a STABLE DATA INFRASTRUCTUREMaintain and improve quality of measurements with comprehensive set of parametersOptimal geographical network coverage and densityInteroperability across domains and with remote sensing measurements, e.g. to validate satellite observationsFAIR data cycle, including citationsStability of the RI
VISIONIn the late 2020s ICOS is a state-of-the-art infrastructure providing high-quality and relevant data for a broad spectrum of users who transform it for scientific breakthroughs, and for knowledge for climate action. ICOS supports international initiatives with its highly appreciated data and knowledge, which further amplifies the societal impact and relevance of ICOS, benefiting societies at large.
2 Executive Summary
4 5Executive SummaryExecutive Summary
A strategy is a ‘plan of action designed to
achieve a long-term or overall aim’, according
to Oxford Dictionaries1. Furthermore, as Rich-
ard Chapman writes2, it is the basis of intentional
(purposeful), collaborative, and coherent action
based on an assessment of
i. the current situation (‘as is’),
ii. the preferred future (‘to be’) and
iii. the next steps / action plan (‘to do’).
This document is part of a collection of four
documents that together outline the current status
and the strategy for future development of ICOS. The
current situation is described by a progress report3
and an impact analysis4 of ICOS. These documents
are only briefly referred to here. This document
focuses on the long-term, overall aim or preferred
future. The next steps are outlined in a separate doc-
ument, the five-year action plan 2020–2024.
ICOS has a complex financial structure.
The revenues for the observational stations
are organised in the National Networks with
a mosaic of funding from national funding
agencies and host institutions. The Central
Facilities and the ERIC institutions (Head
Office and Carbon Portal) receive revenues
through host premium contributions and
ERIC contributions. Investments in the further
development of ICOS that go beyond the
maintenance of the currently implemented
operations need thorough planning and
decision making on a case-by-case basis. The
financial aspects of further development of
ICOS are therefore only mentioned briefly in
this strategy but articulated fully in the five-
year plan(s). Notwithstanding, perspectives
to broaden the financial basis of ICOS beyond
public funding are strategically useful and will
be explored during the upcoming years.
4 5Executive Summary
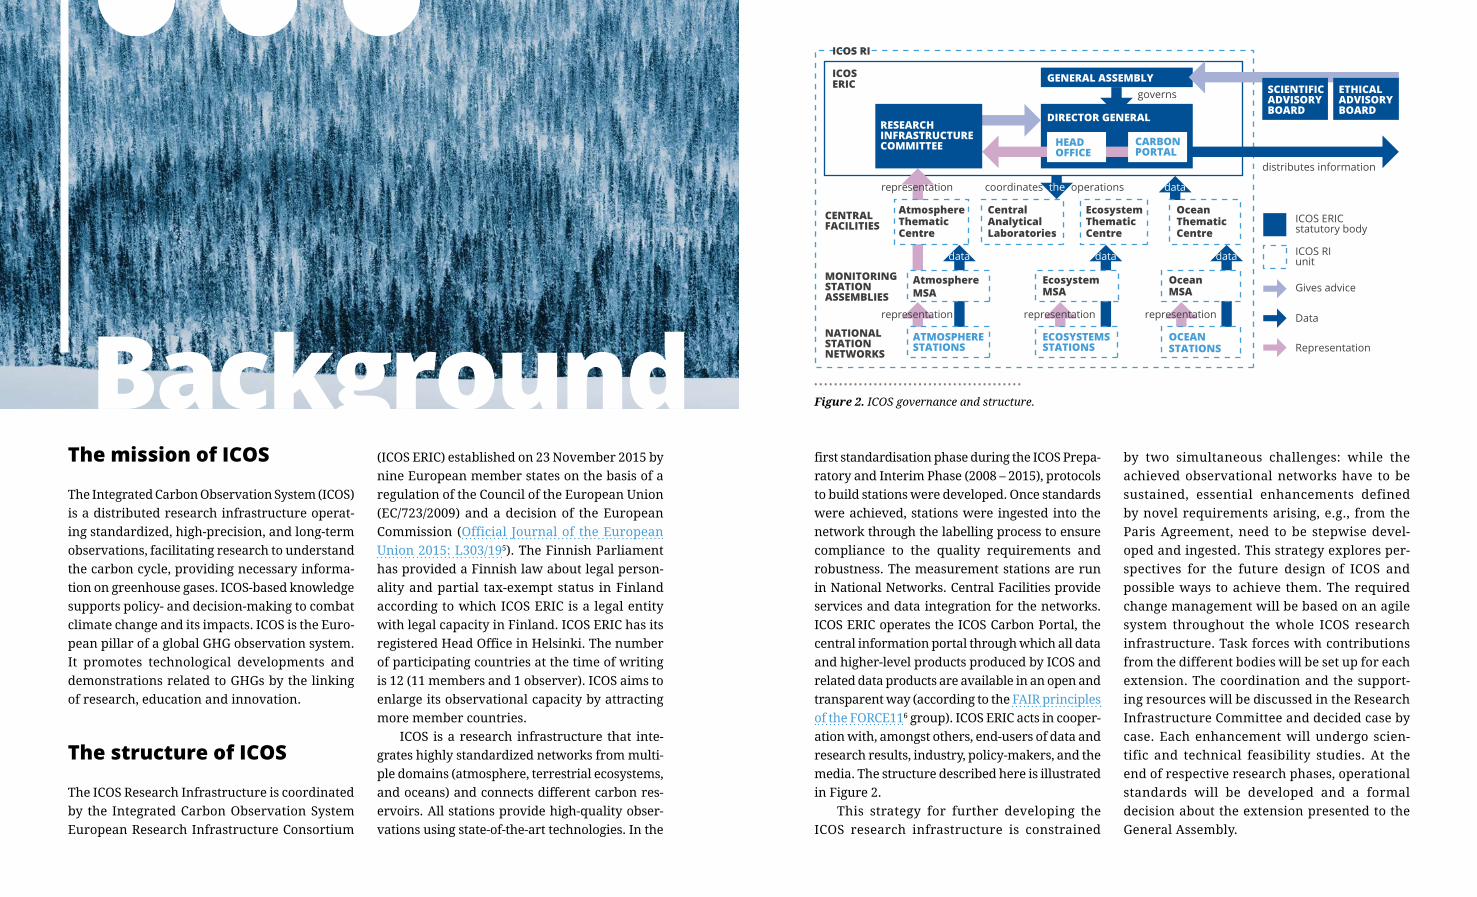
BackgroundThe mission of ICOS
The Integrated Carbon Observation System (ICOS)
is a distributed research infrastructure operat-
ing standardized, high-precision, and long-term
observations, facilitating research to understand
the carbon cycle, providing necessary informa-
tion on greenhouse gases. ICOS-based knowledge
supports policy- and decision-making to combat
climate change and its impacts. ICOS is the Euro-
pean pillar of a global GHG observation system.
It promotes technological developments and
demonstrations related to GHGs by the linking
of research, education and innovation.
The structure of ICOS
The ICOS Research Infrastructure is coordinated
by the Integrated Carbon Observation System
European Research Infrastructure Consortium
(ICOS ERIC) established on 23 November 2015 by
nine European member states on the basis of a
regulation of the Council of the European Union
(EC/723/2009) and a decision of the European
Commission (Official Journal of the European
Union 2015: L303/195). The Finnish Parliament
has provided a Finnish law about legal person-
ality and partial tax-exempt status in Finland
according to which ICOS ERIC is a legal entity
with legal capacity in Finland. ICOS ERIC has its
registered Head Office in Helsinki. The number
of participating countries at the time of writing
is 12 (11 members and 1 observer). ICOS aims to
enlarge its observational capacity by attracting
more member countries.
ICOS is a research infrastructure that inte-
grates highly standardized networks from multi-
ple domains (atmosphere, terrestrial ecosystems,
and oceans) and connects different carbon res-
ervoirs. All stations provide high-quality obser-
vations using state-of-the-art technologies. In the
first standardisation phase during the ICOS Prepa-
ratory and Interim Phase (2008 – 2015), protocols
to build stations were developed. Once standards
were achieved, stations were ingested into the
network through the labelling process to ensure
compliance to the quality requirements and
robustness. The measurement stations are run
in National Networks. Central Facilities provide
services and data integration for the networks.
ICOS ERIC operates the ICOS Carbon Portal, the
central information portal through which all data
and higher-level products produced by ICOS and
related data products are available in an open and
transparent way (according to the FAIR principles
of the FORCE116 group). ICOS ERIC acts in cooper-
ation with, amongst others, end-users of data and
research results, industry, policy-makers, and the
media. The structure described here is illustrated
in Figure 2.
This strategy for further developing the
ICOS research infrastructure is constrained
by two simultaneous challenges: while the
achieved observational networks have to be
sustained, essential enhancements defined
by novel requirements arising, e.g., from the
Paris Agreement, need to be stepwise devel-
oped and ingested. This strategy explores per-
spectives for the future design of ICOS and
possible ways to achieve them. The required
change management will be based on an agile
system throughout the whole ICOS research
infrastructure. Task forces with contributions
from the different bodies will be set up for each
extension. The coordination and the support-
ing resources will be discussed in the Research
Infrastructure Committee and decided case by
case. Each enhancement will undergo scien-
tific and technical feasibility studies. At the
end of respective research phases, operational
standards will be developed and a formal
decision about the extension presented to the
General Assembly.
• • • • • • • • • • • • • • • • • • • • • • • • • • • • • • • • • • • • • • • • • •
Figure 2. ICOS governance and structure.
data
ICOS RI
ERICICOS GENERAL ASSEMBLY
MONITORINGSTATIONASSEMBLIES
HEADOFFICE
CARBONPORTAL
governs
representation representation
Representation
Data
Gives advice
ICOS RI unit
coordinates the operations
data
distributes information
NATIONAL STATION NETWORKS
DIRECTOR GENERAL
representation
CENTRALFACILITIES
Central Analytical Laboratories
EcosystemThematicCentre
AtmosphereThematicCentre
ICOS ERIC statutory body
Atmosphere MSA
Ecosystem MSA
ATMOSPHERESTATIONS
ECOSYSTEMSSTATIONS
data
representation
data
OceanThematicCentre
Ocean MSA
OCEANSTATIONS
RESEARCHINFRASTRUCTURECOMMITTEE
ETHICAL ADVISORY BOARD
SCIENTIFICADVISORYBOARD
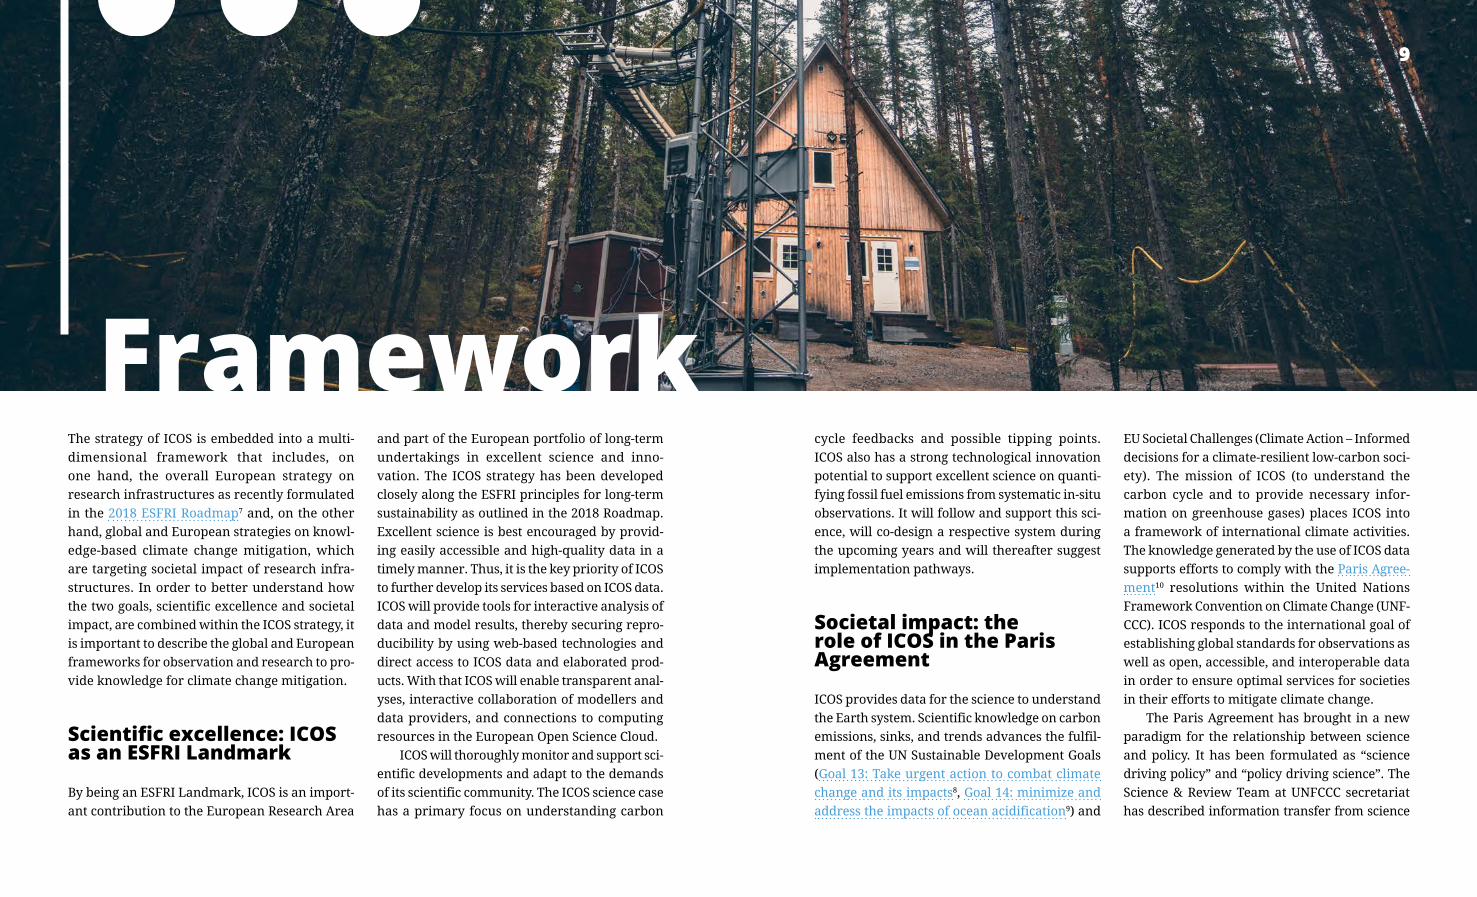
9Framework
FrameworkThe strategy of ICOS is embedded into a multi-
dimensional framework that includes, on
one hand, the overall European strategy on
research infrastructures as recently formulated
in the 2018 ESFRI Roadmap7 and, on the other
hand, global and European strategies on knowl-
edge-based climate change mitigation, which
are targeting societal impact of research infra-
structures. In order to better understand how
the two goals, scientific excellence and societal
impact, are combined within the ICOS strategy, it
is important to describe the global and European
frameworks for observation and research to pro-
vide knowledge for climate change mitigation.
Scientific excellence: ICOS as an ESFRI Landmark
By being an ESFRI Landmark, ICOS is an import-
ant contribution to the European Research Area
and part of the European portfolio of long-term
undertakings in excellent science and inno-
vation. The ICOS strategy has been developed
closely along the ESFRI principles for long-term
sustainability as outlined in the 2018 Roadmap.
Excellent science is best encouraged by provid-
ing easily accessible and high-quality data in a
timely manner. Thus, it is the key priority of ICOS
to further develop its services based on ICOS data.
ICOS will provide tools for interactive analysis of
data and model results, thereby securing repro-
ducibility by using web-based technologies and
direct access to ICOS data and elaborated prod-
ucts. With that ICOS will enable transparent anal-
yses, interactive collaboration of modellers and
data providers, and connections to computing
resources in the European Open Science Cloud.
ICOS will thoroughly monitor and support sci-
entific developments and adapt to the demands
of its scientific community. The ICOS science case
has a primary focus on understanding carbon
cycle feedbacks and possible tipping points.
ICOS also has a strong technological innovation
potential to support excellent science on quanti-
fying fossil fuel emissions from systematic in-situ
observations. It will follow and support this sci-
ence, will co-design a respective system during
the upcoming years and will thereafter suggest
implementation pathways.
Societal impact: the role of ICOS in the Paris Agreement
ICOS provides data for the science to understand
the Earth system. Scientific knowledge on carbon
emissions, sinks, and trends advances the fulfil-
ment of the UN Sustainable Development Goals
(Goal 13: Take urgent action to combat climate
change and its impacts8, Goal 14: minimize and
address the impacts of ocean acidification9) and
EU Societal Challenges (Climate Action – Informed
decisions for a climate-resilient low-carbon soci-
ety). The mission of ICOS (to understand the
carbon cycle and to provide necessary infor-
mation on greenhouse gases) places ICOS into
a framework of international climate activities.
The knowledge generated by the use of ICOS data
supports efforts to comply with the Paris Agree-
ment10 resolutions within the United Nations
Framework Convention on Climate Change (UNF-
CCC). ICOS responds to the international goal of
establishing global standards for observations as
well as open, accessible, and interoperable data
in order to ensure optimal services for societies
in their efforts to mitigate climate change.
The Paris Agreement has brought in a new
paradigm for the relationship between science
and policy. It has been formulated as “science
driving policy” and “policy driving science”. The
Science & Review Team at UNFCCC secretariat
has described information transfer from science
99
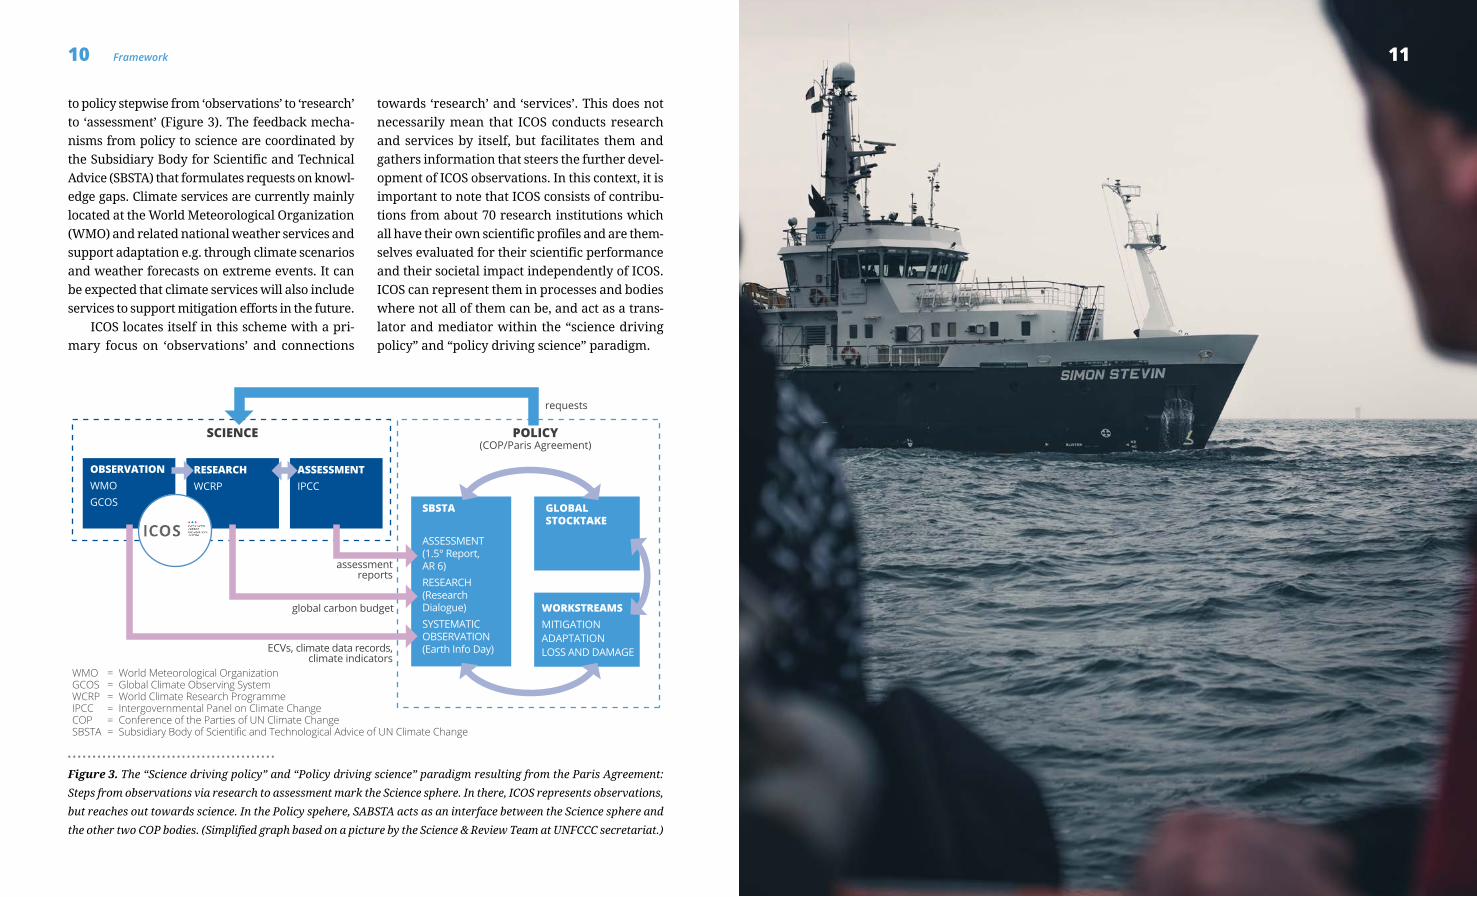
10 11FrameworkFramework
GLOBAL STOCKTAKE
OBSERVATIONWMOGCOS
RESEARCHWCRP
ASSESSMENTIPCC
SCIENCE POLICY (COP/Paris Agreement)
ASSESSMENT (1.5° Report, AR 6) RESEARCH (Research Dialogue) SYSTEMATIC OBSERVATION (Earth Info Day)
SBSTA
WORKSTREAMSMITIGATIONADAPTATIONLOSS AND DAMAGEECVs, climate data records,
climate indicators
global carbon budget
assessment reports
requests
WMO = World Meteorological OrganizationGCOS = Global Climate Observing SystemWCRP = World Climate Research ProgrammeIPCC = Intergovernmental Panel on Climate ChangeCOP = Conference of the Parties of UN Climate ChangeSBSTA = Subsidiary Body of Scientific and Technological Advice of UN Climate Change
to policy stepwise from ‘observations’ to ‘research’
to ‘assessment’ (Figure 3). The feedback mecha-
nisms from policy to science are coordinated by
the Subsidiary Body for Scientific and Technical
Advice (SBSTA) that formulates requests on knowl-
edge gaps. Climate services are currently mainly
located at the World Meteorological Organization
(WMO) and related national weather services and
support adaptation e.g. through climate scenarios
and weather forecasts on extreme events. It can
be expected that climate services will also include
services to support mitigation efforts in the future.
ICOS locates itself in this scheme with a pri-
mary focus on ‘observations’ and connections
towards ‘research’ and ‘services’. This does not
necessarily mean that ICOS conducts research
and services by itself, but facilitates them and
gathers information that steers the further devel-
opment of ICOS observations. In this context, it is
important to note that ICOS consists of contribu-
tions from about 70 research institutions which
all have their own scientific profiles and are them-
selves evaluated for their scientific performance
and their societal impact independently of ICOS.
ICOS can represent them in processes and bodies
where not all of them can be, and act as a trans-
lator and mediator within the “science driving
policy” and “policy driving science” paradigm.
• • • • • • • • • • • • • • • • • • • • • • • • • • • • • • • • • • • • • • • • • •
Figure 3. The “Science driving policy” and “Policy driving science” paradigm resulting from the Paris Agreement:
Steps from observations via research to assessment mark the Science sphere. In there, ICOS represents observations,
but reaches out towards science. In the Policy spehere, SABSTA acts as an interface between the Science sphere and
the other two COP bodies. (Simplified graph based on a picture by the Science & Review Team at UNFCCC secretariat.)
11
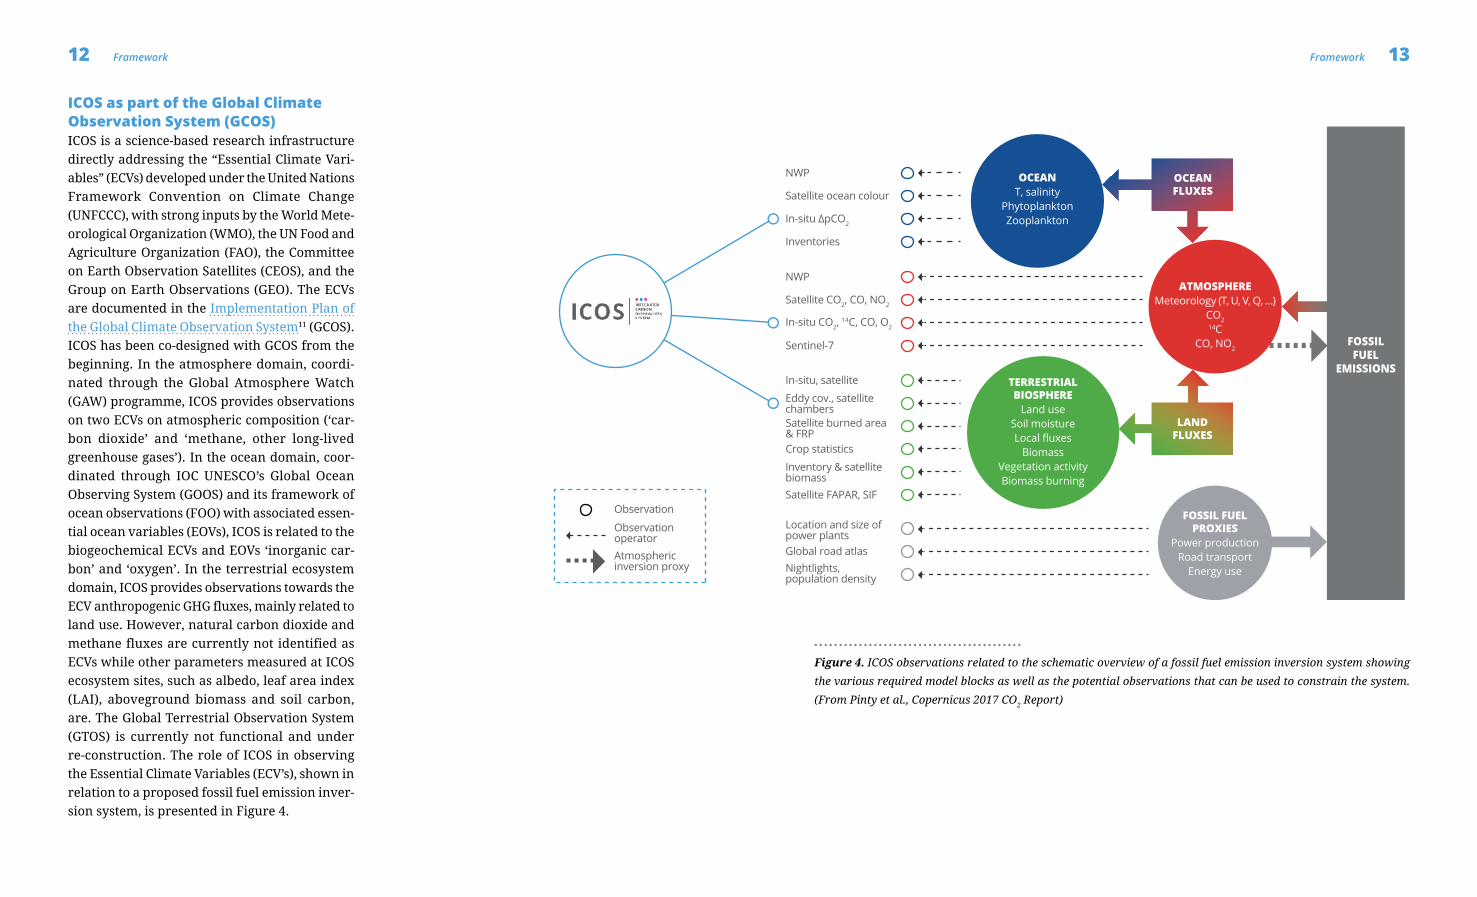
12 13FrameworkFramework
ICOS as part of the Global Climate Observation System (GCOS) ICOS is a science-based research infrastructure
directly addressing the “Essential Climate Vari-
ables” (ECVs) developed under the United Nations
Framework Convention on Climate Change
(UNFCCC), with strong inputs by the World Mete-
orological Organization (WMO), the UN Food and
Agriculture Organization (FAO), the Committee
on Earth Observation Satellites (CEOS), and the
Group on Earth Observations (GEO). The ECVs
are documented in the Implementation Plan of
the Global Climate Observation System11 (GCOS).
ICOS has been co-designed with GCOS from the
beginning. In the atmosphere domain, coordi-
nated through the Global Atmosphere Watch
(GAW) programme, ICOS provides observations
on two ECVs on atmospheric composition (‘car-
bon dioxide’ and ‘methane, other long-lived
greenhouse gases’). In the ocean domain, coor-
dinated through IOC UNESCO’s Global Ocean
Observing System (GOOS) and its framework of
ocean observations (FOO) with associated essen-
tial ocean variables (EOVs), ICOS is related to the
biogeochemical ECVs and EOVs ‘inorganic car-
bon’ and ‘oxygen’. In the terrestrial ecosystem
domain, ICOS provides observations towards the
ECV anthropogenic GHG fluxes, mainly related to
land use. However, natural carbon dioxide and
methane fluxes are currently not identified as
ECVs while other parameters measured at ICOS
ecosystem sites, such as albedo, leaf area index
(LAI), aboveground biomass and soil carbon,
are. The Global Terrestrial Observation System
(GTOS) is currently not functional and under
re-construction. The role of ICOS in observing
the Essential Climate Variables (ECV’s), shown in
relation to a proposed fossil fuel emission inver-
sion system, is presented in Figure 4.
NWP
Satellite ocean colour
In-situ ∆pCO2
In-situ, satellite
Crop statistics
Satellite burned area & FRP
Eddy cov., satellite chambers
Inventories
Inventory & satellite biomass
NWP
Satellite CO2, CO, NO2
Sentinel-7
In-situ CO2, 14C, CO, O2
Satellite FAPAR, SIF
Location and size of power plantsGlobal road atlasNightlights, population density
TERRESTRIAL BIOSPHERE
Land useSoil moistureLocal fluxes
BiomassVegetation activityBiomass burning
OCEANT, salinity
PhytoplanktonZooplankton
LAND FLUXES
FOSSIL FUEL
EMISSIONS
FOSSIL FUEL PROXIES
Power productionRoad transport
Energy useAtmosphericinversion proxy
Observation
Observation operator
ATMOSPHEREMeteorology (T, U, V, Q, …)
CO214C
CO, NO2
OCEAN FLUXES
• • • • • • • • • • • • • • • • • • • • • • • • • • • • • • • • • • • • • • • • • •
Figure 4. ICOS observations related to the schematic overview of a fossil fuel emission inversion system showing
the various required model blocks as well as the potential observations that can be used to constrain the system.
(From Pinty et al., Copernicus 2017 CO2 Report)
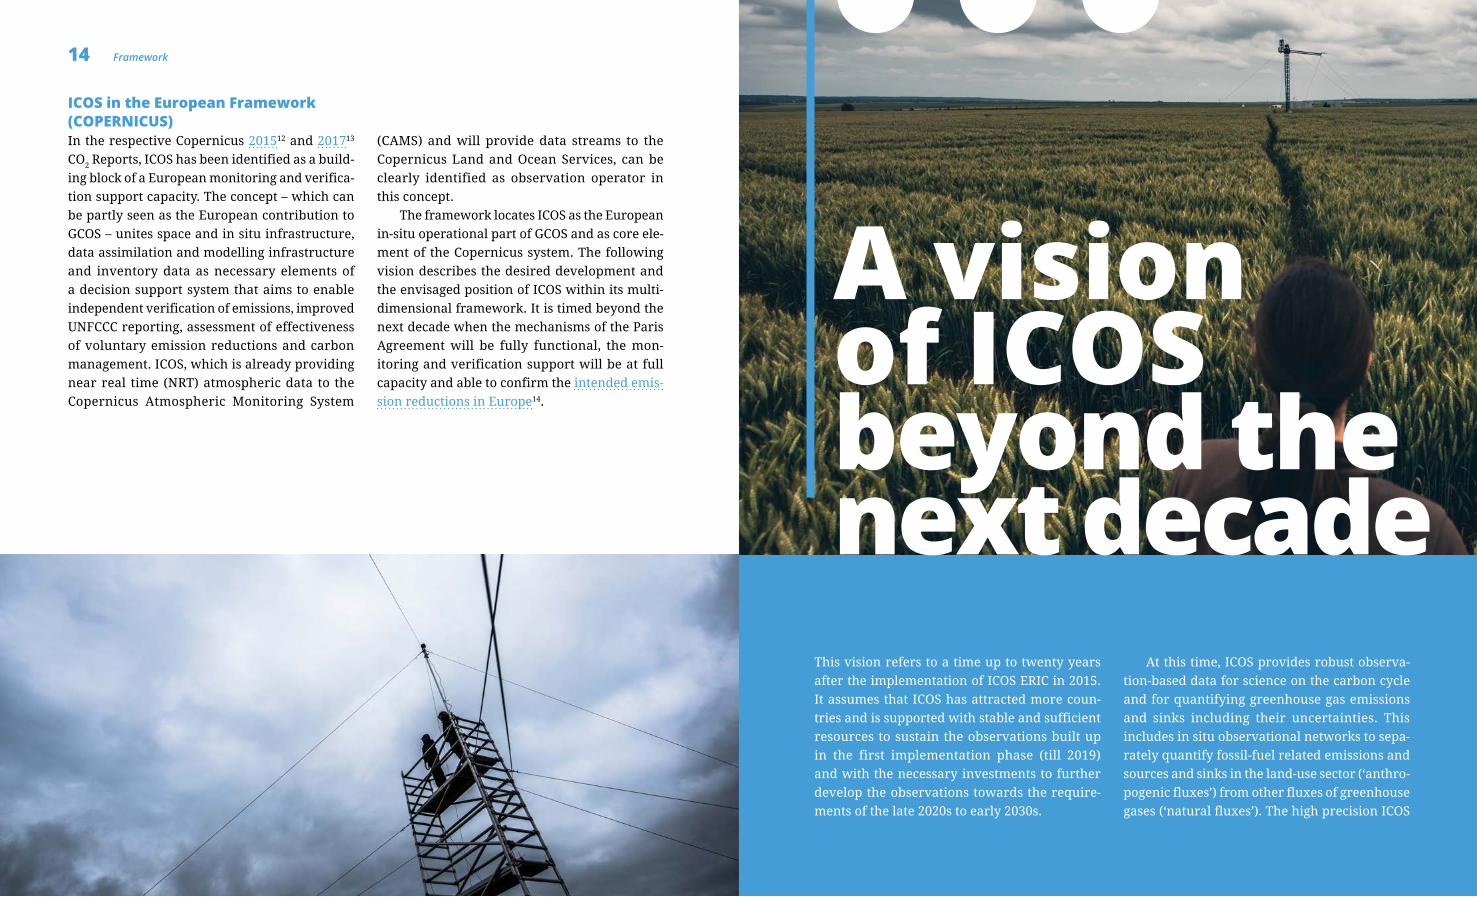
14 Framework
ICOS in the European Framework (COPERNICUS)In the respective Copernicus 201512 and 201713
CO2 Reports, ICOS has been identified as a build-
ing block of a European monitoring and verifica-
tion support capacity. The concept – which can
be partly seen as the European contribution to
GCOS – unites space and in situ infrastructure,
data assimilation and modelling infrastructure
and inventory data as necessary elements of
a decision support system that aims to enable
independent verification of emissions, improved
UNFCCC reporting, assessment of effectiveness
of voluntary emission reductions and carbon
management. ICOS, which is already providing
near real time (NRT) atmospheric data to the
Copernicus Atmospheric Monitoring System
(CAMS) and will provide data streams to the
Copernicus Land and Ocean Services, can be
clearly identified as observation operator in
this concept.
The framework locates ICOS as the European
in-situ operational part of GCOS and as core ele-
ment of the Copernicus system. The following
vision describes the desired development and
the envisaged position of ICOS within its multi-
dimensional framework. It is timed beyond the
next decade when the mechanisms of the Paris
Agreement will be fully functional, the mon-
itoring and verification support will be at full
capacity and able to confirm the intended emis-
sion reductions in Europe14.
A vision of ICOS beyond the next decade
This vision refers to a time up to twenty years
after the implementation of ICOS ERIC in 2015.
It assumes that ICOS has attracted more coun-
tries and is supported with stable and sufficient
resources to sustain the observations built up
in the first implementation phase (till 2019)
and with the necessary investments to further
develop the observations towards the require-
ments of the late 2020s to early 2030s.
At this time, ICOS provides robust observa-
tion-based data for science on the carbon cycle
and for quantifying greenhouse gas emissions
and sinks including their uncertainties. This
includes in situ observational networks to sepa-
rately quantify fossil-fuel related emissions and
sources and sinks in the land-use sector (‘anthro-
pogenic fluxes’) from other fluxes of greenhouse
gases (‘natural fluxes’). The high precision ICOS
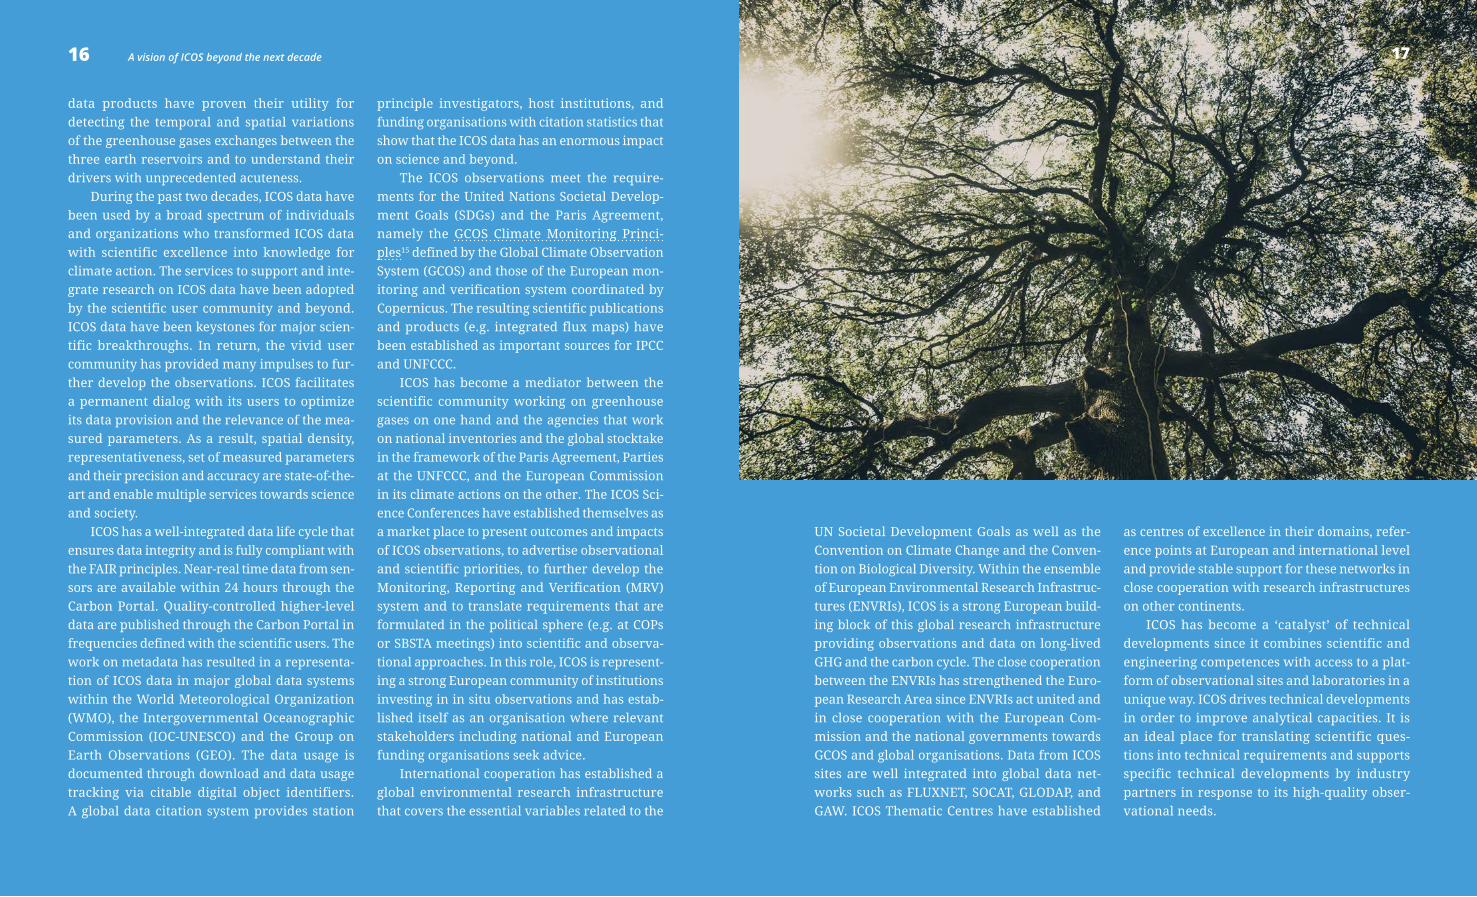
16 17A vision of ICOS beyond the next decade A vision of ICOS beyond the next decade
data products have proven their utility for
detecting the temporal and spatial variations
of the greenhouse gases exchanges between the
three earth reservoirs and to understand their
drivers with unprecedented acuteness.
During the past two decades, ICOS data have
been used by a broad spectrum of individuals
and organizations who transformed ICOS data
with scientific excellence into knowledge for
climate action. The services to support and inte-
grate research on ICOS data have been adopted
by the scientific user community and beyond.
ICOS data have been keystones for major scien-
tific breakthroughs. In return, the vivid user
community has provided many impulses to fur-
ther develop the observations. ICOS facilitates
a permanent dialog with its users to optimize
its data provision and the relevance of the mea-
sured parameters. As a result, spatial density,
representativeness, set of measured parameters
and their precision and accuracy are state-of-the-
art and enable multiple services towards science
and society.
ICOS has a well-integrated data life cycle that
ensures data integrity and is fully compliant with
the FAIR principles. Near-real time data from sen-
sors are available within 24 hours through the
Carbon Portal. Quality-controlled higher-level
data are published through the Carbon Portal in
frequencies defined with the scientific users. The
work on metadata has resulted in a representa-
tion of ICOS data in major global data systems
within the World Meteorological Organization
(WMO), the Intergovernmental Oceanographic
Commission (IOC-UNESCO) and the Group on
Earth Observations (GEO). The data usage is
documented through download and data usage
tracking via citable digital object identifiers.
A global data citation system provides station
principle investigators, host institutions, and
funding organisations with citation statistics that
show that the ICOS data has an enormous impact
on science and beyond.
The ICOS observations meet the require-
ments for the United Nations Societal Develop-
ment Goals (SDGs) and the Paris Agreement,
namely the GCOS Climate Monitoring Princi-
ples15 defined by the Global Climate Observation
System (GCOS) and those of the European mon-
itoring and verification system coordinated by
Copernicus. The resulting scientific publications
and products (e.g. integrated flux maps) have
been established as important sources for IPCC
and UNFCCC.
ICOS has become a mediator between the
scientific community working on greenhouse
gases on one hand and the agencies that work
on national inventories and the global stocktake
in the framework of the Paris Agreement, Parties
at the UNFCCC, and the European Commission
in its climate actions on the other. The ICOS Sci-
ence Conferences have established themselves as
a market place to present outcomes and impacts
of ICOS observations, to advertise observational
and scientific priorities, to further develop the
Monitoring, Reporting and Verification (MRV)
system and to translate requirements that are
formulated in the political sphere (e.g. at COPs
or SBSTA meetings) into scientific and observa-
tional approaches. In this role, ICOS is represent-
ing a strong European community of institutions
investing in in situ observations and has estab-
lished itself as an organisation where relevant
stakeholders including national and European
funding organisations seek advice.
International cooperation has established a
global environmental research infrastructure
that covers the essential variables related to the
16 A vision of ICOS beyond the next decade
UN Societal Development Goals as well as the
Convention on Climate Change and the Conven-
tion on Biological Diversity. Within the ensemble
of European Environmental Research Infrastruc-
tures (ENVRIs), ICOS is a strong European build-
ing block of this global research infrastructure
providing observations and data on long-lived
GHG and the carbon cycle. The close cooperation
between the ENVRIs has strengthened the Euro-
pean Research Area since ENVRIs act united and
in close cooperation with the European Com-
mission and the national governments towards
GCOS and global organisations. Data from ICOS
sites are well integrated into global data net-
works such as FLUXNET, SOCAT, GLODAP, and
GAW. ICOS Thematic Centres have established
as centres of excellence in their domains, refer-
ence points at European and international level
and provide stable support for these networks in
close cooperation with research infrastructures
on other continents.
ICOS has become a ‘catalyst’ of technical
developments since it combines scientific and
engineering competences with access to a plat-
form of observational sites and laboratories in a
unique way. ICOS drives technical developments
in order to improve analytical capacities. It is
an ideal place for translating scientific ques-
tions into technical requirements and supports
specific technical developments by industry
partners in response to its high-quality obser-
vational needs.
17
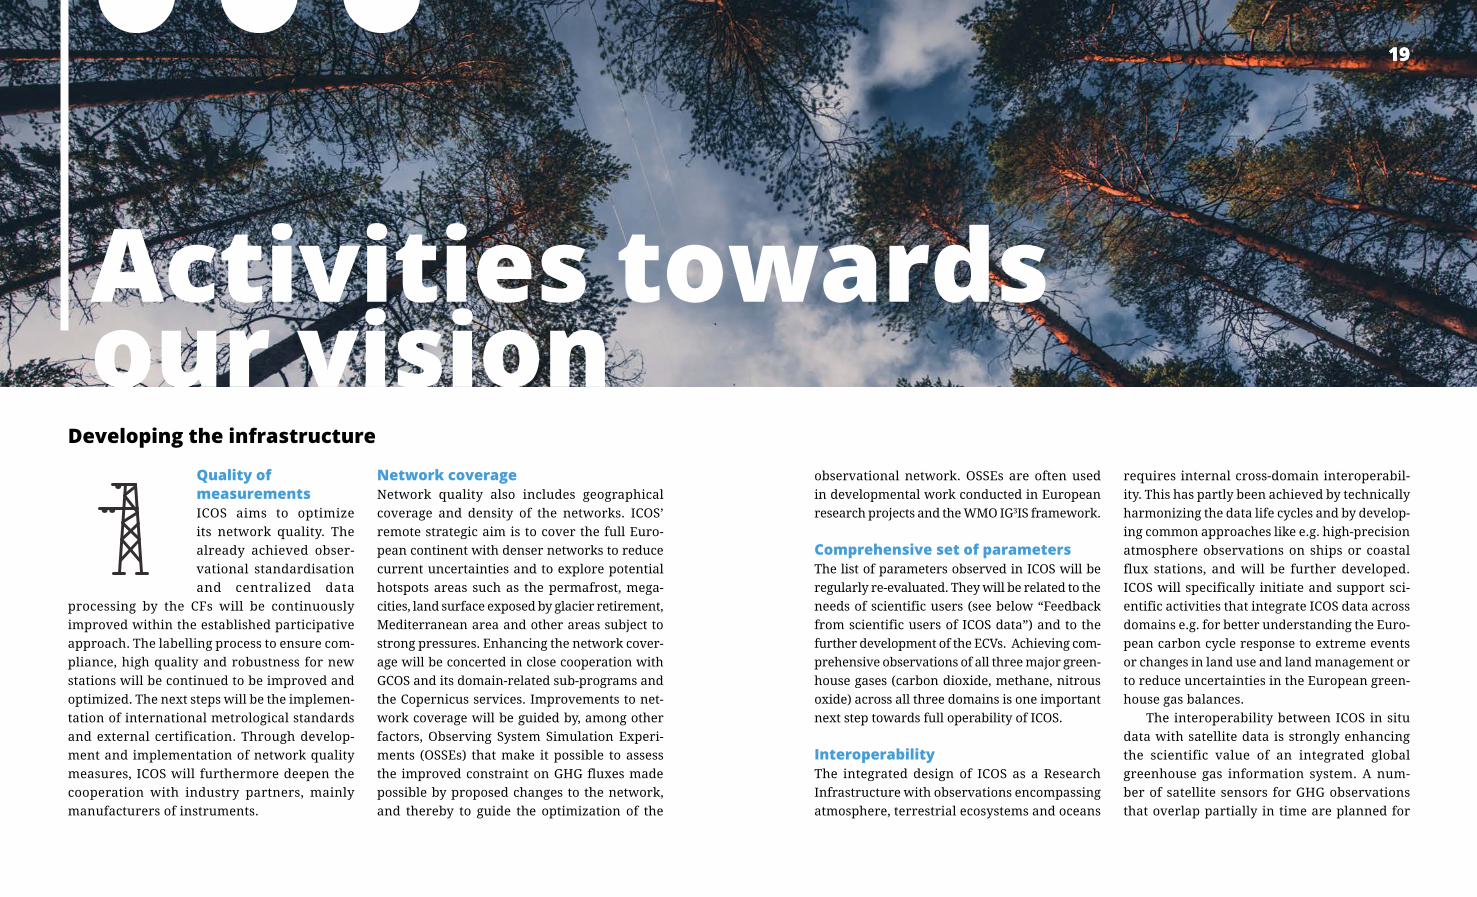
19Activities towards our vision – Developing the infrastructure
Activities towards our vision
Quality of measurements ICOS aims to optimize
its network quality. The
already achieved obser-
vational standardisation
and centralized data
processing by the CFs will be continuously
improved within the established participative
approach. The labelling process to ensure com-
pliance, high quality and robustness for new
stations will be continued to be improved and
optimized. The next steps will be the implemen-
tation of international metrological standards
and external certification. Through develop-
ment and implementation of network quality
measures, ICOS will furthermore deepen the
cooperation with industry partners, mainly
manufacturers of instruments.
Network coverageNetwork quality also includes geographical
coverage and density of the networks. ICOS’
remote strategic aim is to cover the full Euro-
pean continent with denser networks to reduce
current uncertainties and to explore potential
hotspots areas such as the permafrost, mega-
cities, land surface exposed by glacier retirement,
Mediterranean area and other areas subject to
strong pressures. Enhancing the network cover-
age will be concerted in close cooperation with
GCOS and its domain-related sub-programs and
the Copernicus services. Improvements to net-
work coverage will be guided by, among other
factors, Observing System Simulation Experi-
ments (OSSEs) that make it possible to assess
the improved constraint on GHG fluxes made
possible by proposed changes to the network,
and thereby to guide the optimization of the
Developing the infrastructure
observational network. OSSEs are often used
in developmental work conducted in European
research projects and the WMO IG3IS framework.
Comprehensive set of parametersThe list of parameters observed in ICOS will be
regularly re-evaluated. They will be related to the
needs of scientific users (see below “Feedback
from scientific users of ICOS data”) and to the
further development of the ECVs. Achieving com-
prehensive observations of all three major green-
house gases (carbon dioxide, methane, nitrous
oxide) across all three domains is one important
next step towards full operability of ICOS.
Interoperability The integrated design of ICOS as a Research
Infrastructure with observations encompassing
atmosphere, terrestrial ecosystems and oceans
requires internal cross-domain interoperabil-
ity. This has partly been achieved by technically
harmonizing the data life cycles and by develop-
ing common approaches like e.g. high-precision
atmosphere observations on ships or coastal
flux stations, and will be further developed.
ICOS will specifically initiate and support sci-
entific activities that integrate ICOS data across
domains e.g. for better understanding the Euro-
pean carbon cycle response to extreme events
or changes in land use and land management or
to reduce uncertainties in the European green-
house gas balances.
The interoperability between ICOS in situ
data with satellite data is strongly enhancing
the scientific value of an integrated global
greenhouse gas information system. A num-
ber of satellite sensors for GHG observations
that overlap partially in time are planned for
1919
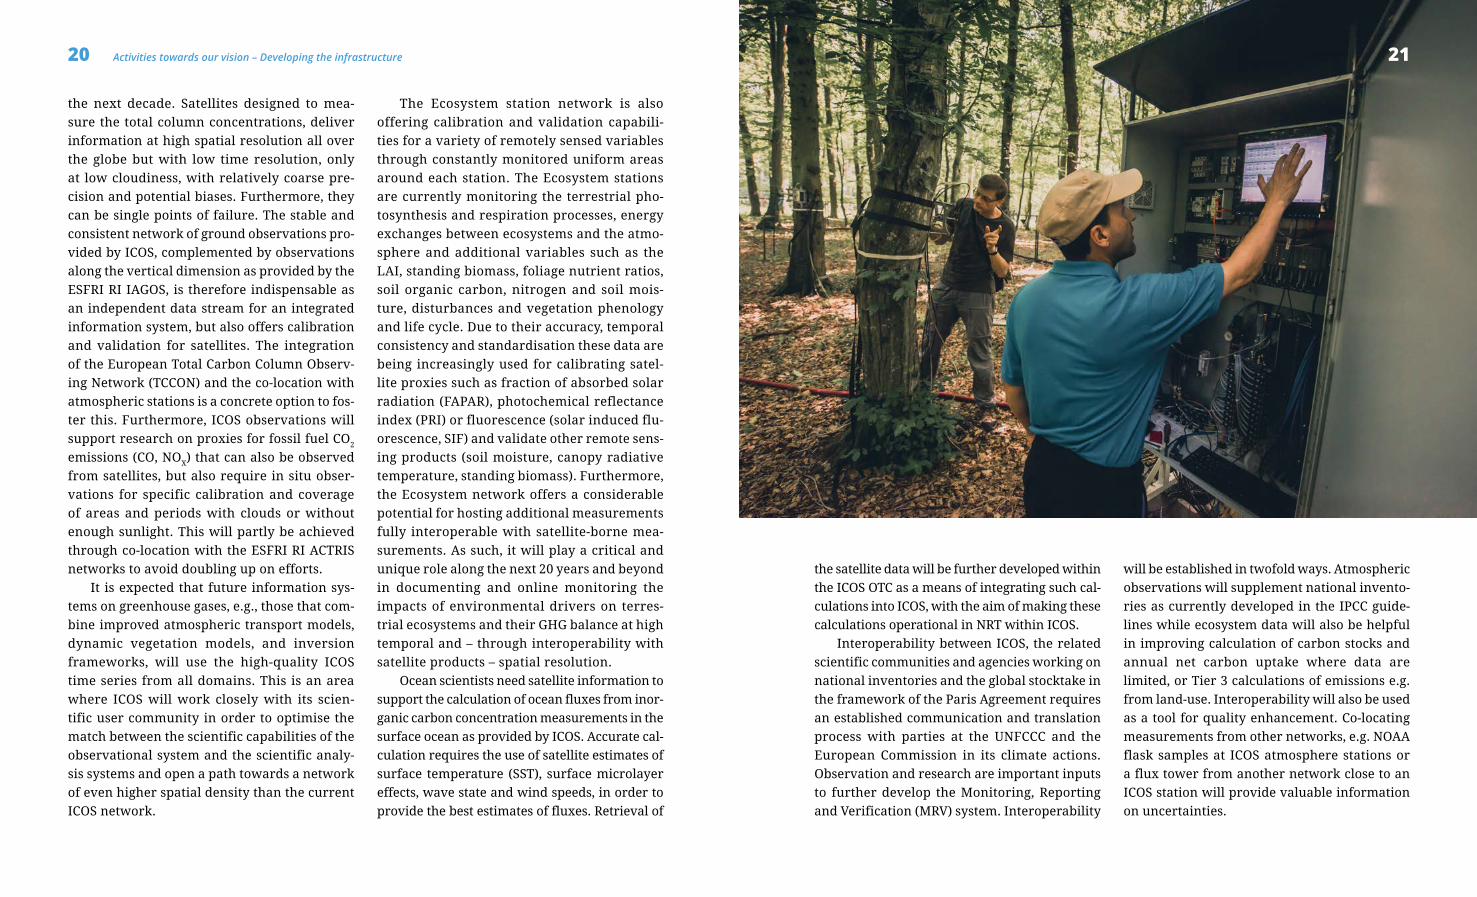
20 21Activities towards our vision – Developing the infrastructureActivities towards our vision – Developing the infrastructure
the next decade. Satellites designed to mea-
sure the total column concentrations, deliver
information at high spatial resolution all over
the globe but with low time resolution, only
at low cloudiness, with relatively coarse pre-
cision and potential biases. Furthermore, they
can be single points of failure. The stable and
consistent network of ground observations pro-
vided by ICOS, complemented by observations
along the vertical dimension as provided by the
ESFRI RI IAGOS, is therefore indispensable as
an independent data stream for an integrated
information system, but also offers calibration
and validation for satellites. The integration
of the European Total Carbon Column Observ-
ing Network (TCCON) and the co-location with
atmospheric stations is a concrete option to fos-
ter this. Furthermore, ICOS observations will
support research on proxies for fossil fuel CO2
emissions (CO, NOX) that can also be observed
from satellites, but also require in situ obser-
vations for specific calibration and coverage
of areas and periods with clouds or without
enough sunlight. This will partly be achieved
through co-location with the ESFRI RI ACTRIS
networks to avoid doubling up on efforts.
It is expected that future information sys-
tems on greenhouse gases, e.g., those that com-
bine improved atmospheric transport models,
dynamic vegetation models, and inversion
frameworks, will use the high-quality ICOS
time series from all domains. This is an area
where ICOS will work closely with its scien-
tific user community in order to optimise the
match between the scientific capabilities of the
observational system and the scientific analy-
sis systems and open a path towards a network
of even higher spatial density than the current
ICOS network.
The Ecosystem station network is also
offering calibration and validation capabili-
ties for a variety of remotely sensed variables
through constantly monitored uniform areas
around each station. The Ecosystem stations
are currently monitoring the terrestrial pho-
tosynthesis and respiration processes, energy
exchanges between ecosystems and the atmo-
sphere and additional variables such as the
LAI, standing biomass, foliage nutrient ratios,
soil organic carbon, nitrogen and soil mois-
ture, disturbances and vegetation phenology
and life cycle. Due to their accuracy, temporal
consistency and standardisation these data are
being increasingly used for calibrating satel-
lite proxies such as fraction of absorbed solar
radiation (FAPAR), photochemical reflectance
index (PRI) or fluorescence (solar induced flu-
orescence, SIF) and validate other remote sens-
ing products (soil moisture, canopy radiative
temperature, standing biomass). Furthermore,
the Ecosystem network offers a considerable
potential for hosting additional measurements
fully interoperable with satellite-borne mea-
surements. As such, it will play a critical and
unique role along the next 20 years and beyond
in documenting and online monitoring the
impacts of environmental drivers on terres-
trial ecosystems and their GHG balance at high
temporal and – through interoperability with
satellite products – spatial resolution.
Ocean scientists need satellite information to
support the calculation of ocean fluxes from inor-
ganic carbon concentration measurements in the
surface ocean as provided by ICOS. Accurate cal-
culation requires the use of satellite estimates of
surface temperature (SST), surface microlayer
effects, wave state and wind speeds, in order to
provide the best estimates of fluxes. Retrieval of
the satellite data will be further developed within
the ICOS OTC as a means of integrating such cal-
culations into ICOS, with the aim of making these
calculations operational in NRT within ICOS.
Interoperability between ICOS, the related
scientific communities and agencies working on
national inventories and the global stocktake in
the framework of the Paris Agreement requires
an established communication and translation
process with parties at the UNFCCC and the
European Commission in its climate actions.
Observation and research are important inputs
to further develop the Monitoring, Reporting
and Verification (MRV) system. Interoperability
will be established in twofold ways. Atmospheric
observations will supplement national invento-
ries as currently developed in the IPCC guide-
lines while ecosystem data will also be helpful
in improving calculation of carbon stocks and
annual net carbon uptake where data are
limited, or Tier 3 calculations of emissions e.g.
from land-use. Interoperability will also be used
as a tool for quality enhancement. Co-locating
measurements from other networks, e.g. NOAA
flask samples at ICOS atmosphere stations or
a flux tower from another network close to an
ICOS station will provide valuable information
on uncertainties.
21
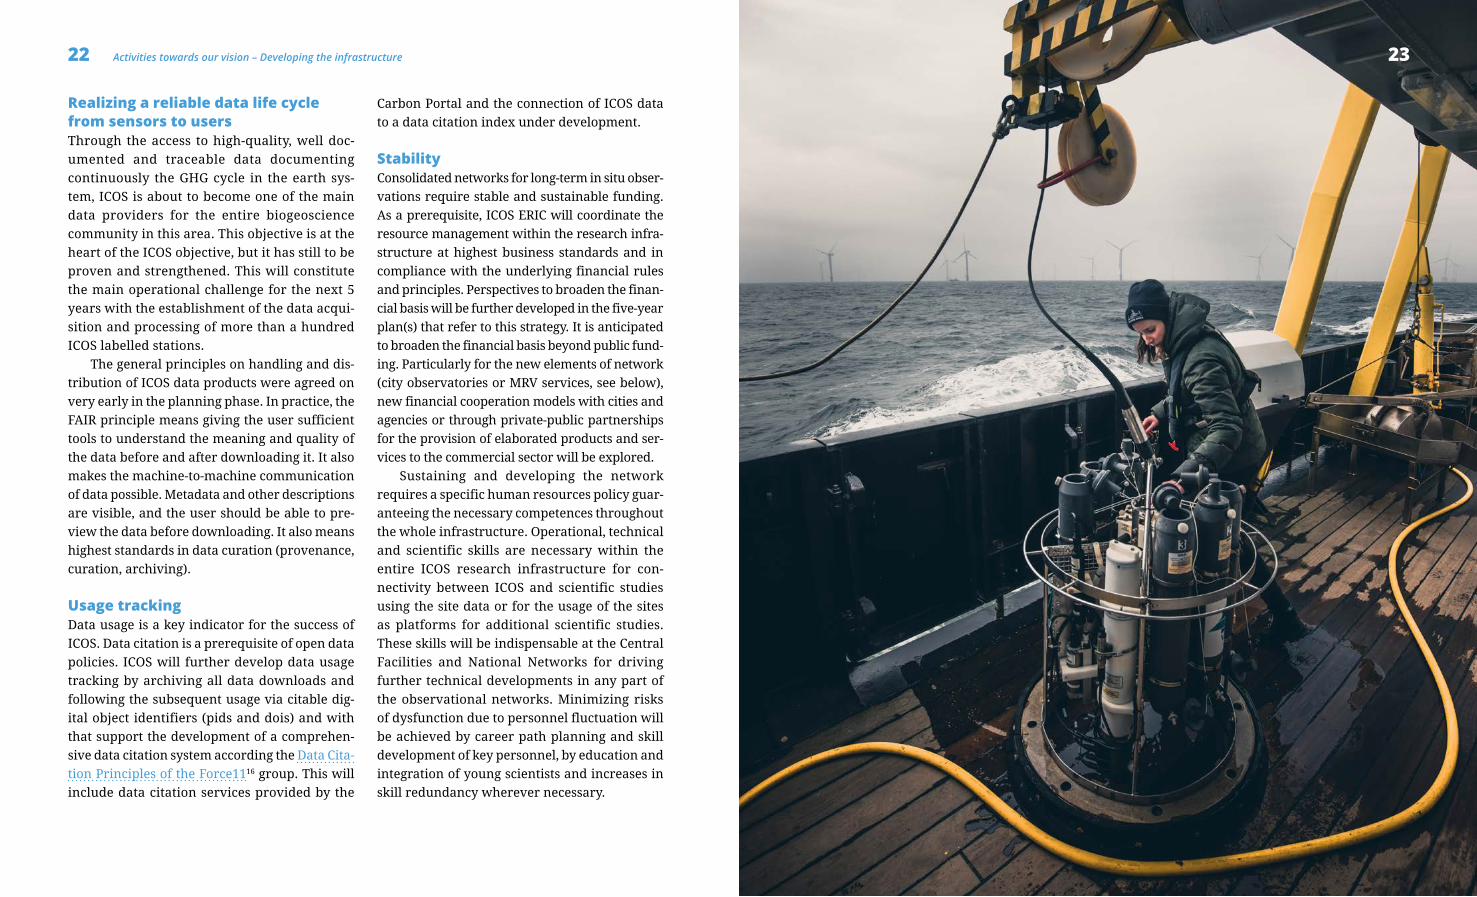
22 23Activities towards our vision – Developing the infrastructureActivities towards our vision – Developing the infrastructure
Realizing a reliable data life cycle from sensors to users Through the access to high-quality, well doc-
umented and traceable data documenting
continuously the GHG cycle in the earth sys-
tem, ICOS is about to become one of the main
data providers for the entire biogeoscience
community in this area. This objective is at the
heart of the ICOS objective, but it has still to be
proven and strengthened. This will constitute
the main operational challenge for the next 5
years with the establishment of the data acqui-
sition and processing of more than a hundred
ICOS labelled stations.
The general principles on handling and dis-
tribution of ICOS data products were agreed on
very early in the planning phase. In practice, the
FAIR principle means giving the user sufficient
tools to understand the meaning and quality of
the data before and after downloading it. It also
makes the machine-to-machine communication
of data possible. Metadata and other descriptions
are visible, and the user should be able to pre-
view the data before downloading. It also means
highest standards in data curation (provenance,
curation, archiving).
Usage trackingData usage is a key indicator for the success of
ICOS. Data citation is a prerequisite of open data
policies. ICOS will further develop data usage
tracking by archiving all data downloads and
following the subsequent usage via citable dig-
ital object identifiers (pids and dois) and with
that support the development of a comprehen-
sive data citation system according the Data Cita-
tion Principles of the Force1116 group. This will
include data citation services provided by the
Carbon Portal and the connection of ICOS data
to a data citation index under development.
StabilityConsolidated networks for long-term in situ obser-
vations require stable and sustainable funding.
As a prerequisite, ICOS ERIC will coordinate the
resource management within the research infra-
structure at highest business standards and in
compliance with the underlying financial rules
and principles. Perspectives to broaden the finan-
cial basis will be further developed in the five-year
plan(s) that refer to this strategy. It is anticipated
to broaden the financial basis beyond public fund-
ing. Particularly for the new elements of network
(city observatories or MRV services, see below),
new financial cooperation models with cities and
agencies or through private-public partnerships
for the provision of elaborated products and ser-
vices to the commercial sector will be explored.
Sustaining and developing the network
requires a specific human resources policy guar-
anteeing the necessary competences throughout
the whole infrastructure. Operational, technical
and scientific skills are necessary within the
entire ICOS research infrastructure for con-
nectivity between ICOS and scientific studies
using the site data or for the usage of the sites
as platforms for additional scientific studies.
These skills will be indispensable at the Central
Facilities and National Networks for driving
further technical developments in any part of
the observational networks. Minimizing risks
of dysfunction due to personnel fluctuation will
be achieved by career path planning and skill
development of key personnel, by education and
integration of young scientists and increases in
skill redundancy wherever necessary.
23
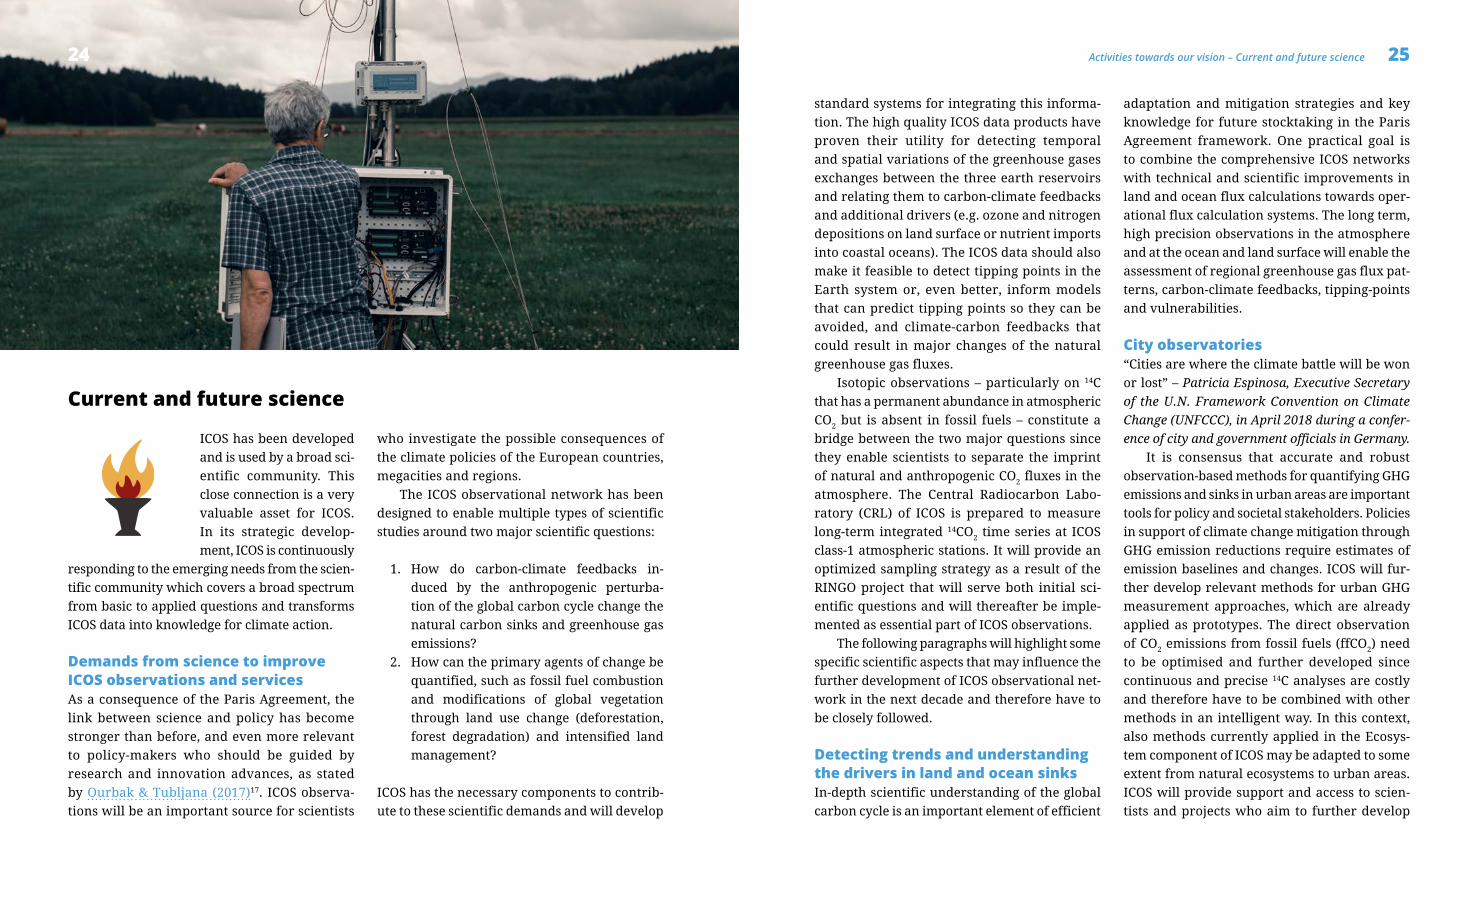
24 25Activities towards our vision – Current and future scienceActivities towards our vision – Current and future science
ICOS has been developed
and is used by a broad sci-
entific community. This
close connection is a very
valuable asset for ICOS.
In its strategic develop-
ment, ICOS is continuously
responding to the emerging needs from the scien-
tific community which covers a broad spectrum
from basic to applied questions and transforms
ICOS data into knowledge for climate action.
Demands from science to improve ICOS observations and services As a consequence of the Paris Agreement, the
link between science and policy has become
stronger than before, and even more relevant
to policy-makers who should be guided by
research and innovation advances, as stated
by Ourbak & Tubljana (2017)17. ICOS observa-
tions will be an important source for scientists
who investigate the possible consequences of
the climate policies of the European countries,
megacities and regions.
The ICOS observational network has been
designed to enable multiple types of scientific
studies around two major scientific questions:
1. How do carbon-climate feedbacks in-
duced by the anthropogenic perturba-
tion of the global carbon cycle change the
natural carbon sinks and greenhouse gas
emissions?
2. How can the primary agents of change be
quantified, such as fossil fuel combustion
and modifications of global vegetation
through land use change (deforestation,
forest degradation) and intensified land
management?
ICOS has the necessary components to contrib-
ute to these scientific demands and will develop
Current and future science
24
standard systems for integrating this informa-
tion. The high quality ICOS data products have
proven their utility for detecting temporal
and spatial variations of the greenhouse gases
exchanges between the three earth reservoirs
and relating them to carbon-climate feedbacks
and additional drivers (e.g. ozone and nitrogen
depositions on land surface or nutrient imports
into coastal oceans). The ICOS data should also
make it feasible to detect tipping points in the
Earth system or, even better, inform models
that can predict tipping points so they can be
avoided, and climate-carbon feedbacks that
could result in major changes of the natural
greenhouse gas fluxes.
Isotopic observations – particularly on 14C
that has a permanent abundance in atmospheric
CO2 but is absent in fossil fuels – constitute a
bridge between the two major questions since
they enable scientists to separate the imprint
of natural and anthropogenic CO2 fluxes in the
atmosphere. The Central Radiocarbon Labo-
ratory (CRL) of ICOS is prepared to measure
long-term integrated 14CO2 time series at ICOS
class-1 atmospheric stations. It will provide an
optimized sampling strategy as a result of the
RINGO project that will serve both initial sci-
entific questions and will thereafter be imple-
mented as essential part of ICOS observations.
The following paragraphs will highlight some
specific scientific aspects that may influence the
further development of ICOS observational net-
work in the next decade and therefore have to
be closely followed.
Detecting trends and understanding the drivers in land and ocean sinks In-depth scientific understanding of the global
carbon cycle is an important element of efficient
adaptation and mitigation strategies and key
knowledge for future stocktaking in the Paris
Agreement framework. One practical goal is
to combine the comprehensive ICOS networks
with technical and scientific improvements in
land and ocean flux calculations towards oper-
ational flux calculation systems. The long term,
high precision observations in the atmosphere
and at the ocean and land surface will enable the
assessment of regional greenhouse gas flux pat-
terns, carbon-climate feedbacks, tipping-points
and vulnerabilities.
City observatories “Cities are where the climate battle will be won
or lost” – Patricia Espinosa, Executive Secretary
of the U.N. Framework Convention on Climate
Change (UNFCCC), in April 2018 during a confer-
ence of city and government officials in Germany.
It is consensus that accurate and robust
observation-based methods for quantifying GHG
emissions and sinks in urban areas are important
tools for policy and societal stakeholders. Policies
in support of climate change mitigation through
GHG emission reductions require estimates of
emission baselines and changes. ICOS will fur-
ther develop relevant methods for urban GHG
measurement approaches, which are already
applied as prototypes. The direct observation
of CO2 emissions from fossil fuels (ffCO2) need
to be optimised and further developed since
continuous and precise 14C analyses are costly
and therefore have to be combined with other
methods in an intelligent way. In this context,
also methods currently applied in the Ecosys-
tem component of ICOS may be adapted to some
extent from natural ecosystems to urban areas.
ICOS will provide support and access to scien-
tists and projects who aim to further develop
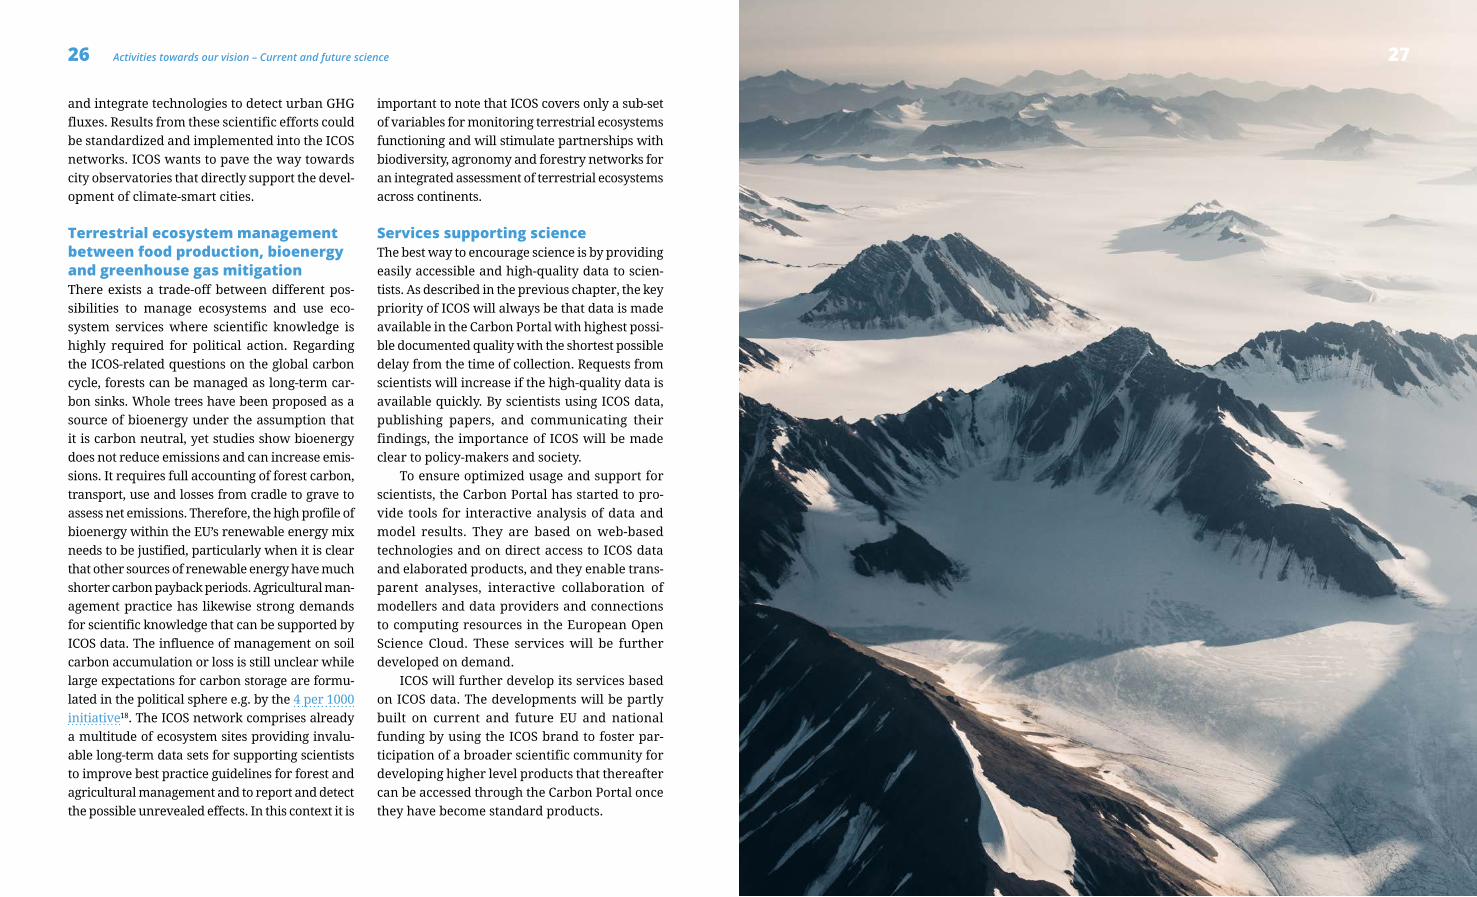
26 27Activities towards our vision – Current and future scienceActivities towards our vision – Current and future science
and integrate technologies to detect urban GHG
fluxes. Results from these scientific efforts could
be standardized and implemented into the ICOS
networks. ICOS wants to pave the way towards
city observatories that directly support the devel-
opment of climate-smart cities.
Terrestrial ecosystem management between food production, bioenergy and greenhouse gas mitigationThere exists a trade-off between different pos-
sibilities to manage ecosystems and use eco-
system services where scientific knowledge is
highly required for political action. Regarding
the ICOS-related questions on the global carbon
cycle, forests can be managed as long-term car-
bon sinks. Whole trees have been proposed as a
source of bioenergy under the assumption that
it is carbon neutral, yet studies show bioenergy
does not reduce emissions and can increase emis-
sions. It requires full accounting of forest carbon,
transport, use and losses from cradle to grave to
assess net emissions. Therefore, the high profile of
bioenergy within the EU’s renewable energy mix
needs to be justified, particularly when it is clear
that other sources of renewable energy have much
shorter carbon payback periods. Agricultural man-
agement practice has likewise strong demands
for scientific knowledge that can be supported by
ICOS data. The influence of management on soil
carbon accumulation or loss is still unclear while
large expectations for carbon storage are formu-
lated in the political sphere e.g. by the 4 per 1000
initiative18. The ICOS network comprises already
a multitude of ecosystem sites providing invalu-
able long-term data sets for supporting scientists
to improve best practice guidelines for forest and
agricultural management and to report and detect
the possible unrevealed effects. In this context it is
important to note that ICOS covers only a sub-set
of variables for monitoring terrestrial ecosystems
functioning and will stimulate partnerships with
biodiversity, agronomy and forestry networks for
an integrated assessment of terrestrial ecosystems
across continents.
Services supporting science The best way to encourage science is by providing
easily accessible and high-quality data to scien-
tists. As described in the previous chapter, the key
priority of ICOS will always be that data is made
available in the Carbon Portal with highest possi-
ble documented quality with the shortest possible
delay from the time of collection. Requests from
scientists will increase if the high-quality data is
available quickly. By scientists using ICOS data,
publishing papers, and communicating their
findings, the importance of ICOS will be made
clear to policy-makers and society.
To ensure optimized usage and support for
scientists, the Carbon Portal has started to pro-
vide tools for interactive analysis of data and
model results. They are based on web-based
technologies and on direct access to ICOS data
and elaborated products, and they enable trans-
parent analyses, interactive collaboration of
modellers and data providers and connections
to computing resources in the European Open
Science Cloud. These services will be further
developed on demand.
ICOS will further develop its services based
on ICOS data. The developments will be partly
built on current and future EU and national
funding by using the ICOS brand to foster par-
ticipation of a broader scientific community for
developing higher level products that thereafter
can be accessed through the Carbon Portal once
they have become standard products.
27
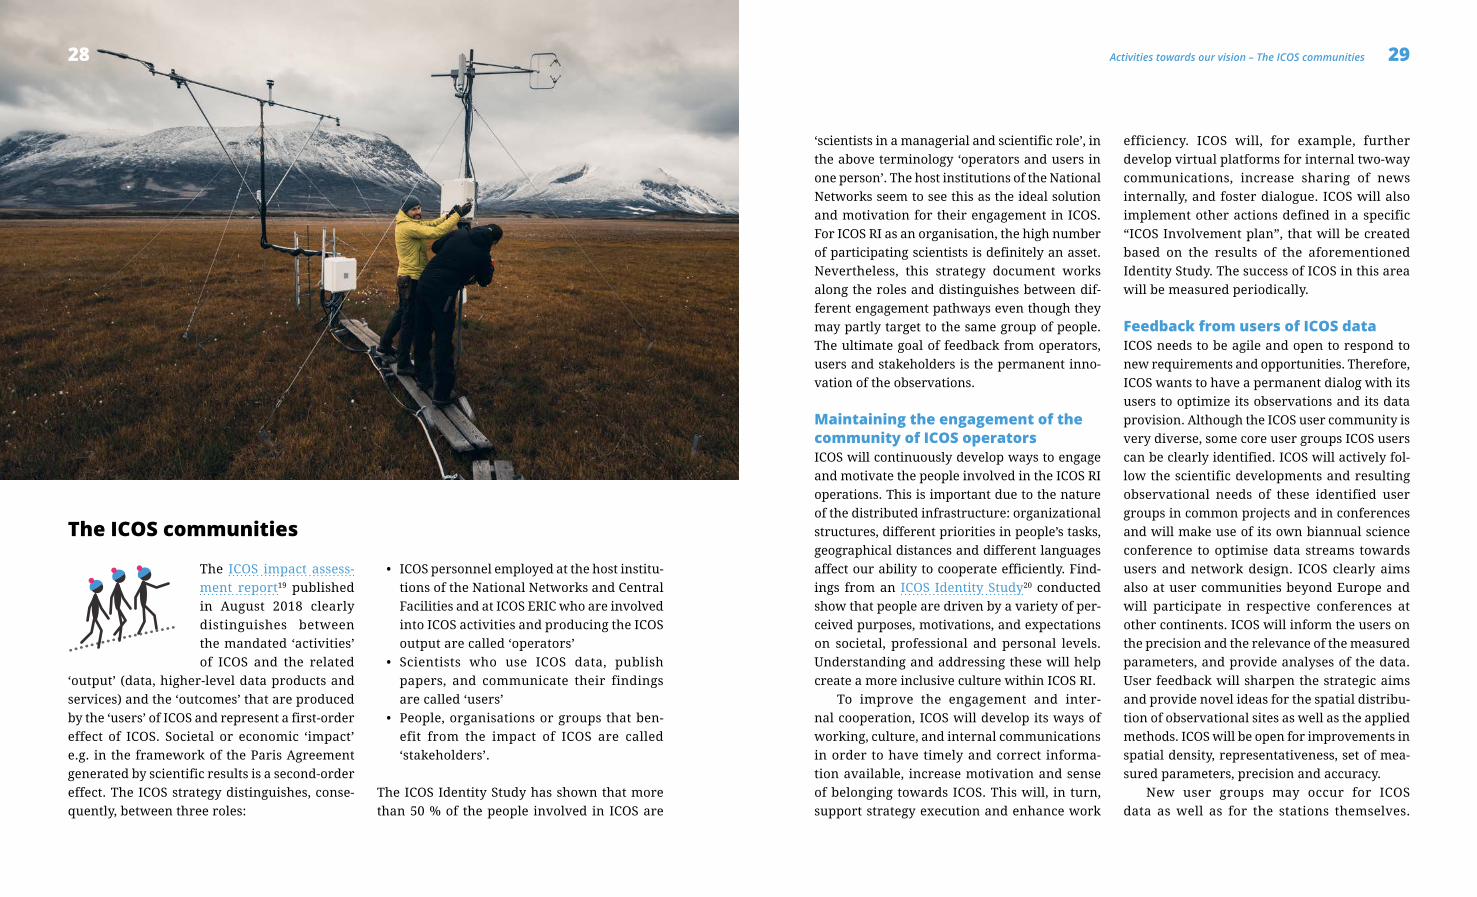
29Activities towards our vision – The ICOS communities
The ICOS impact assess-
ment report19 published
in August 2018 clearly
distinguishes between
the mandated ‘activities’
of ICOS and the related
‘output’ (data, higher-level data products and
services) and the ‘outcomes’ that are produced
by the ‘users’ of ICOS and represent a first -order
effect of ICOS. Societal or economic ‘impact’
e.g. in the framework of the Paris Agreement
generated by scientific results is a second-order
effect. The ICOS strategy distinguishes, conse-
quently, between three roles:
• ICOS personnel employed at the host institu-
tions of the National Networks and Central
Facilities and at ICOS ERIC who are involved
into ICOS activities and producing the ICOS
output are called ‘operators’
• Scientists who use ICOS data, publish
papers, and communicate their findings
are called ‘users’
• People, organisations or groups that ben-
efit from the impact of ICOS are called
‘stakeholders’.
The ICOS Identity Study has shown that more
than 50 % of the people involved in ICOS are
28
The ICOS communities
‘scientists in a managerial and scientific role’, in
the above terminology ‘operators and users in
one person’. The host institutions of the National
Networks seem to see this as the ideal solution
and motivation for their engagement in ICOS.
For ICOS RI as an organisation, the high number
of participating scientists is definitely an asset.
Never theless, this strategy document works
along the roles and distinguishes between dif-
ferent engagement pathways even though they
may partly target to the same group of people.
The ultimate goal of feedback from operators,
users and stakeholders is the permanent inno-
vation of the observations.
Maintaining the engagement of the community of ICOS operatorsICOS will continuously develop ways to engage
and motivate the people involved in the ICOS RI
operations. This is important due to the nature
of the distributed infrastructure: organizational
structures, different priorities in people’s tasks,
geographical distances and different languages
affect our ability to cooperate efficiently. Find-
ings from an ICOS Identity Study20 conducted
show that people are driven by a variety of per-
ceived purposes, motivations, and expectations
on societal, professional and personal levels.
Understanding and addressing these will help
create a more inclusive culture within ICOS RI.
To improve the engagement and inter-
nal cooperation, ICOS will develop its ways of
working, culture, and internal communications
in order to have timely and correct informa-
tion available, increase motivation and sense
of belonging towards ICOS. This will, in turn,
support strategy execution and enhance work
efficiency. ICOS will, for example, further
develop virtual platforms for internal two-way
communications, increase sharing of news
internally, and foster dialogue. ICOS will also
implement other actions defined in a specific
“ICOS Involvement plan”, that will be created
based on the results of the aforementioned
Identity Study. The success of ICOS in this area
will be measured periodically.
Feedback from users of ICOS dataICOS needs to be agile and open to respond to
new requirements and opportunities. Therefore,
ICOS wants to have a permanent dialog with its
users to optimize its observations and its data
provision. Although the ICOS user community is
very diverse, some core user groups ICOS users
can be clearly identified. ICOS will actively fol-
low the scientific developments and resulting
observational needs of these identified user
groups in common projects and in conferences
and will make use of its own biannual science
conference to optimise data streams towards
users and network design. ICOS clearly aims
also at user communities beyond Europe and
will participate in respective conferences at
other continents. ICOS will inform the users on
the precision and the relevance of the measured
parameters, and provide analyses of the data.
User feedback will sharpen the strategic aims
and provide novel ideas for the spatial distribu-
tion of observational sites as well as the applied
methods. ICOS will be open for improvements in
spatial density, representativeness, set of mea-
sured parameters, precision and accuracy.
New user groups may occur for ICOS
data as well as for the stations themselves.
30 31Activities towards our vision – International cooperationActivities towards our vision – The ICOS communities
Recommendations for services and physical
access for additional scientific projects and
for industrial partners (e.g. for sensor devel-
opment) will be developed in close cooperation
with the respective users.
Dialog with stakeholders: societal impact of greenhouse gas observations ICOS sets up a permanent dialogue process with
stakeholders. The general objective of the dia-
logue is to gather participants with an insight
in climate change related policies and identify
their needs in terms of GHG data or services.
The dialogue will be continuous. ICOS will,
for example, participate in the annual Science
Dialogue organized by the SBSTA of UNFCCC,
promote stakeholder activities within IG3IS and
the GEO-C Initiative and use the biennial ICOS
Science Conference to find new ways to inter-
act with decision-makers. ICOS will translate
questions from the policy sphere into further
development of observations and research, and
similarly transfer knowledge from observations
to policy-making.
International cooperation
Cooperation among European Environmental Research InfrastructuresICOS covers an import-
ant part of the European
Research Area and provides core compe tences
on the European GHG balance to the European
Environmental Research Infrastructures (ENVRI
community) which should not be made redun-
dant by upcoming research infrastructures.
Instead, ICOS strongly supports the consensus
among European Environmental Research Infra-
structures about synergies being a strategic goal
within the established ENVRI framework. ICOS
will continue to work on a consistent landscape
where duplication and operational conflict (mea-
suring the same variable with different methods
or standards) can be avoided. As formulated in
the ENVRIplus Whitepaper on “further integra-
tion of research infrastructures related to the ter-
restrial ecosystem research”, ICOS supports the
in-depth cooperation of structurally independent
entities under the subsidiarity principle. ICOS
will closely follow the development of other
ENVRIs in an open and cooperative manner and
seek innovative synergies where possible, e.g.
by seeking a common voice towards funding
organisations, by promoting integrated scientific
concepts, technical interoperability, co-location
of sites as well as common administrative struc-
tures or external representation of the ENVRI
community by one research infrastructure. This
ENVRI integration implies a considerable effort
in harmonisation, standardisation, inter-calibra-
tion, shared protocols and instructions, which is
currently supported by H2020 cluster projects
(ENVRI, ENVRIplus, ENVRIfair). ICOS will further
support and lobby this approach.
31
32 33Activities towards our vision – International cooperationActivities towards our vision – International cooperation
In the atmospheric domain, ICOS is endorsed
as contributing regional network in the Global
Atmosphere Watch (GAW) Program coordinated
by WMO and will steer further global cooperation
in this framework by strong coordination with
the respective European atmosphere research
infrastructures (IAGOS and ACTRIS).
In the terrestrial ecosystem and biodiversity
domain, ICOS will negotiate cooperation agree-
ments with the respective European research
infrastructures (namely eLTER RI and AnaEE).
The aim is to coordinate and to develop the Euro-
pean contribution to a global terrestrial observa-
tion system based on commonly agreed variables,
shared protocols, enhanced inter-operability and
open data access. With DANUBIUS RI, a common
protocol for GHG fluxes between lakes, rivers and
streams and the atmosphere and for lateral car-
bon transport to the oceans will be developed.
In the ocean domain ICOS will closely coop-
erate with EMSO ERIC and EUROARGO ERIC
to optimise the European contribution to the
GOOS Biogeochemistry data streams. Together,
the three research infrastructures cover the
inorganic carbon system from the seafloor to
the atmosphere, complementing each other and
providing data and knowledge base for climate
research, design of environmental policies, and
education. ICOS and EMSO share a variety of
observation platforms and mutually benefit by
sharing technology and knowledge. Closer coop-
eration in the further development of their data
life cycles namely in data quality assurance and
control is of strategic importance.
Further development of international data initiatives ICOS aims to continue and further develop the
support for FLUXNET, SOCAT, GLODAP and
GAW. These global data collation initiatives have
already proven to be a precious data source for
excellent and, at the same time, relevant sci-
ence. They are facing a transition from single
PI and project engagement to a global cooper-
ation of research infrastructures such as NEON
and Ameriflux (USA), CERN/Chinaflux (China),
TERN/Ozflux (Australia) and NIES/Japanflux in
(Japan) in the ecosystem domain. Each of these
infrastructures has developed its own data life
cycle, data license and data policy which will
have implications on future cooperation within
the global networks. ICOS will be a driving force
in developing perspectives for future coopera-
tion in the mentioned global data initiatives.
The activities will comprise standardisation,
common data policies, a common data citation
system including developing recommendations
for data citation of integrated data sets from dif-
ferent sources.
Involvement in international initiativesAs part of the stakeholder engagement (see above)
and in its role as mediator between the spheres,
ICOS is observing organisation to the UNFCCC
and part of the SBSTA dialogues on research and
systematic observation. ICOS will closely cooper-
ate with WMO and contribute to the Integrated
Global Greenhouse Gas Information System
(IG3IS) on the long-term goal of a more systematic
operational approach. Since IG3IS intends to build
upon existing observations, ICOS will contribute
to the further development of IG3IS once the
WMO has provided a clearer governance struc-
ture. ICOS is, furthermore, participating organi-
sation in the Group on Earth Observations (GEO)
and supports the GEO Carbon and GHG Initiative
(GEO-C). The rationale behind the participation in
international initiatives and programs is that the
precise observation of emissions as well as nat-
ural fluxes require global cooperation in organi-
sational frameworks. Only there, policy-relevant
information systems can be established and fur-
ther developed. The emerging partnership with
the US Carbon Cycle Science Program will be fur-
ther developed to increasingly advance carbon
cycle science.
Active support for the construction of networks in less developed regions ICOS will also support the construction of net-
works in less developed regions, where ICOS can
contribute to design studies and be mentors in
technical implementation and establishment of
knowledge centres. Based on recent and upcom-
ing design studies (e.g. in the H2020 project
SEACRIFOG), ICOS will strongly support the
implementation of a greenhouse gas monitoring
system adapted to the needs of African countries.
These activities will be further developed in an
established cooperation framework with WMO,
GCOS, European Union and African Union. The
aim is a stepwise development from a compre-
hensive design study that will be finalized during
2020 towards stepwise implementation in the
following years. ICOS National Networks and
Central Facilities will have a crucial role in trans-
lating the design study into detailed technical
requirements, contributing to capacity building
and supporting the construction of sites. There
are already success examples for these activities
very often supported by national grants. ICOS
ERIC can play an important role in connecting
the nationally funded activities with each other
and with globally coordination institutions such
as WMO. Furthermore, it will use established
international frameworks for fund raising.
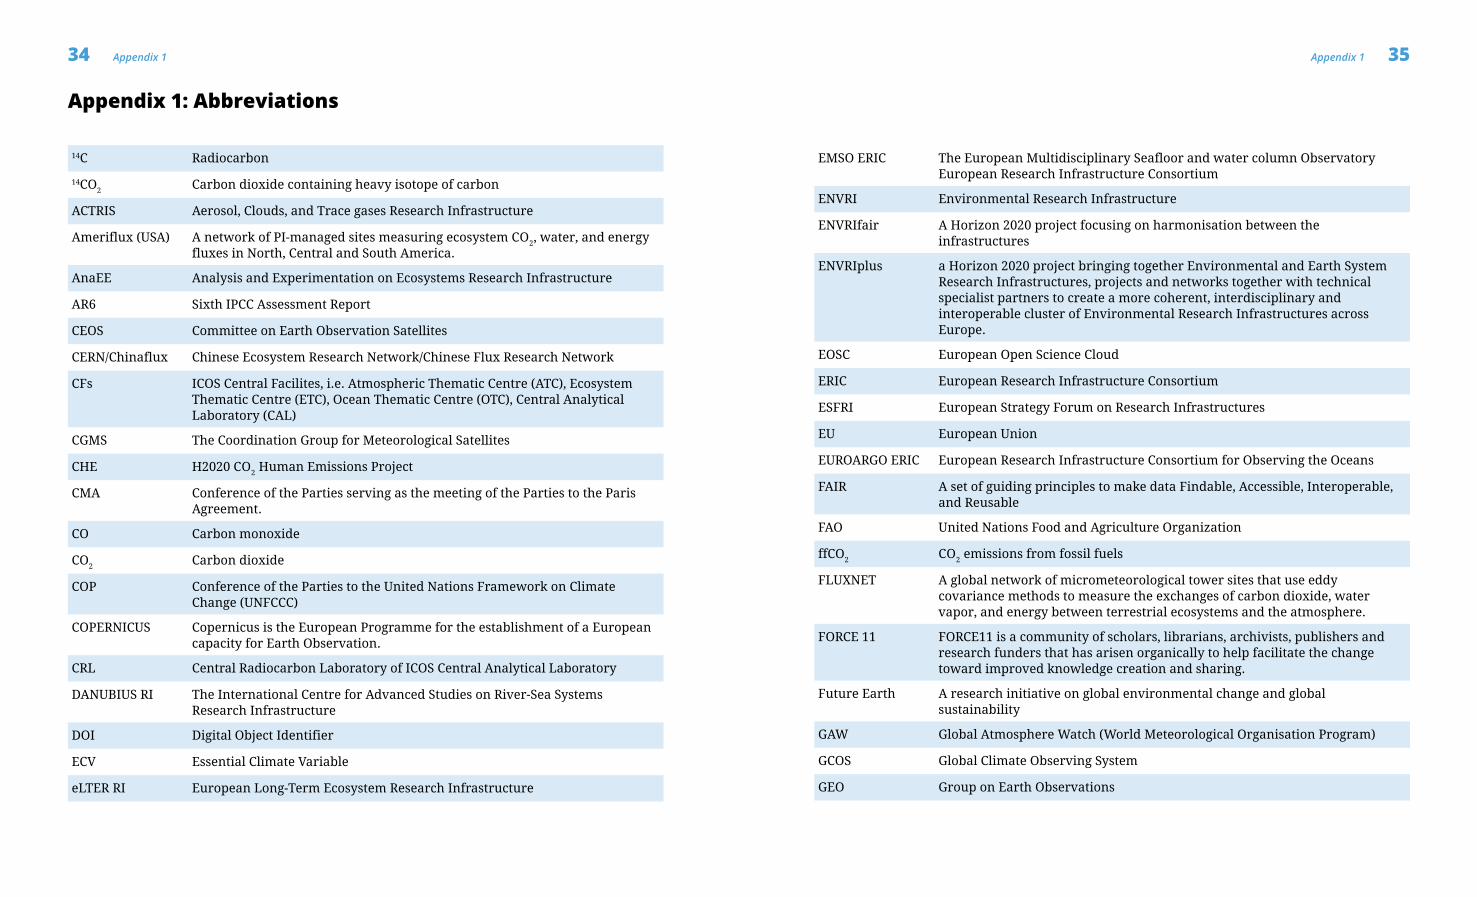
34 35Appendix 1Appendix 1
Appendix 1: Abbreviations
14C Radiocarbon
14CO2 Carbon dioxide containing heavy isotope of carbon
ACTRIS Aerosol, Clouds, and Trace gases Research Infrastructure
Ameriflux (USA) A network of PI-managed sites measuring ecosystem CO2, water, and energy fluxes in North, Central and South America.
AnaEE Analysis and Experimentation on Ecosystems Research Infrastructure
AR6 Sixth IPCC Assessment Report
CEOS Committee on Earth Observation Satellites
CERN/Chinaflux Chinese Ecosystem Research Network/Chinese Flux Research Network
CFs ICOS Central Facilites, i.e. Atmospheric Thematic Centre (ATC), Ecosystem Thematic Centre (ETC), Ocean Thematic Centre (OTC), Central Analytical Laboratory (CAL)
CGMS The Coordination Group for Meteorological Satellites
CHE H2020 CO2 Human Emissions Project
CMA Conference of the Parties serving as the meeting of the Parties to the Paris Agreement.
CO Carbon monoxide
CO2 Carbon dioxide
COP Conference of the Parties to the United Nations Framework on Climate Change (UNFCCC)
COPERNICUS Copernicus is the European Programme for the establishment of a European capacity for Earth Observation.
CRL Central Radiocarbon Laboratory of ICOS Central Analytical Laboratory
DANUBIUS RI The International Centre for Advanced Studies on River-Sea Systems Research Infrastructure
DOI Digital Object Identifier
ECV Essential Climate Variable
eLTER RI European Long-Term Ecosystem Research Infrastructure
EMSO ERIC The European Multidisciplinary Seafloor and water column Observatory European Research Infrastructure Consortium
ENVRI Environmental Research Infrastructure
ENVRIfair A Horizon 2020 project focusing on harmonisation between the infrastructures
ENVRIplus a Horizon 2020 project bringing together Environmental and Earth System Research Infrastructures, projects and networks together with technical specialist partners to create a more coherent, interdisciplinary and interoperable cluster of Environmental Research Infrastructures across Europe.
EOSC European Open Science Cloud
ERIC European Research Infrastructure Consortium
ESFRI European Strategy Forum on Research Infrastructures
EU European Union
EUROARGO ERIC European Research Infrastructure Consortium for Observing the Oceans
FAIR A set of guiding principles to make data Findable, Accessible, Interoperable, and Reusable
FAO United Nations Food and Agriculture Organization
ffCO2 CO2 emissions from fossil fuels
FLUXNET A global network of micrometeorological tower sites that use eddy covariance methods to measure the exchanges of carbon dioxide, water vapor, and energy between terrestrial ecosystems and the atmosphere.
FORCE 11 FORCE11 is a community of scholars, librarians, archivists, publishers and research funders that has arisen organically to help facilitate the change toward improved knowledge creation and sharing.
Future Earth A research initiative on global environmental change and global sustainability
GAW Global Atmosphere Watch (World Meteorological Organisation Program)
GCOS Global Climate Observing System
GEO Group on Earth Observations
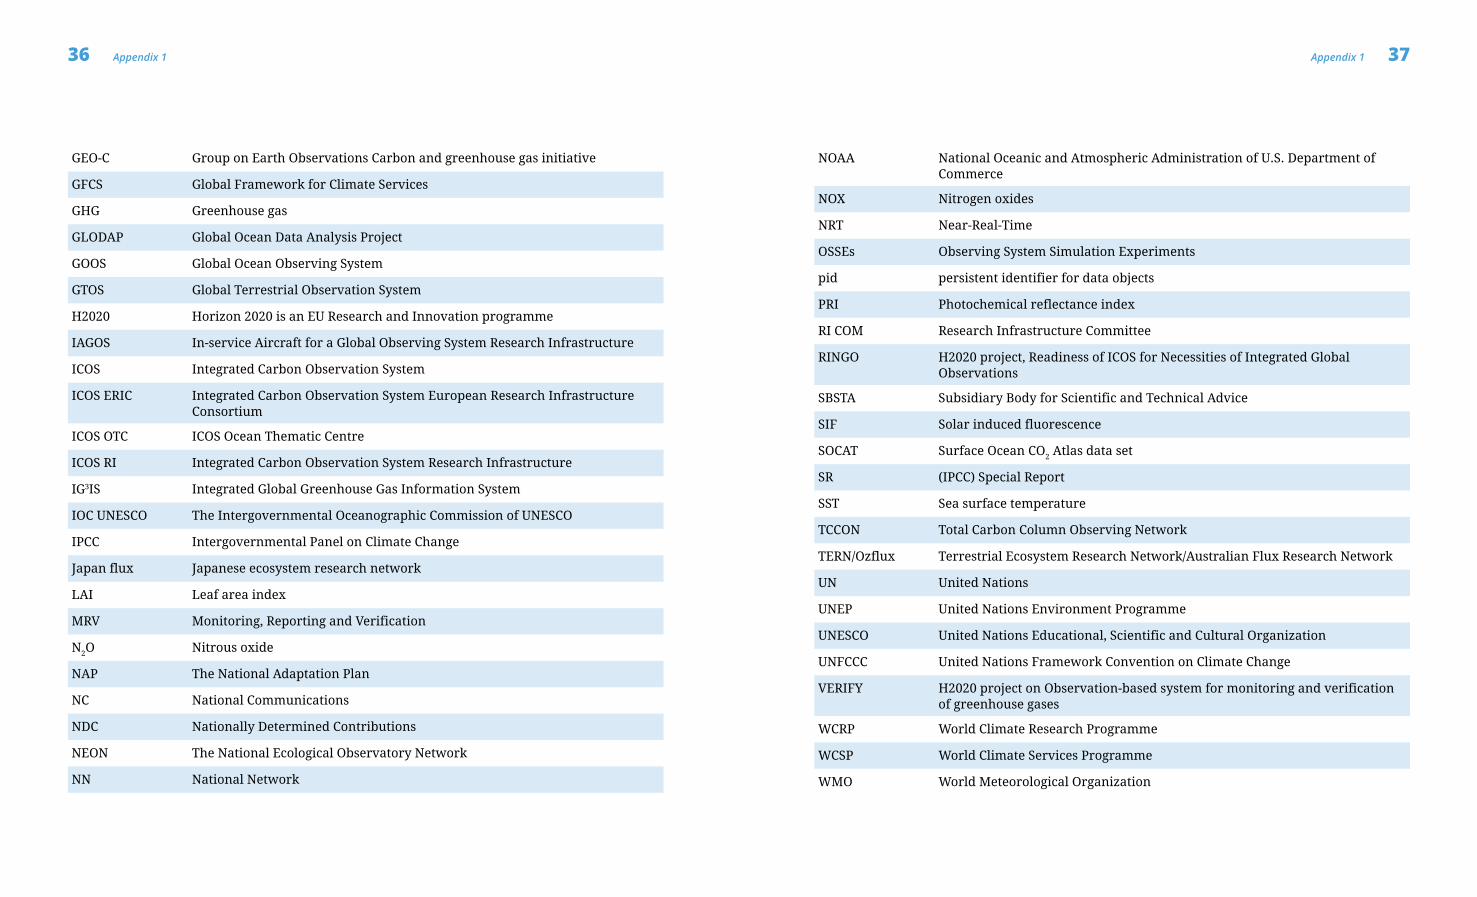
36 37Appendix 1Appendix 1
GEO-C Group on Earth Observations Carbon and greenhouse gas initiative
GFCS Global Framework for Climate Services
GHG Greenhouse gas
GLODAP Global Ocean Data Analysis Project
GOOS Global Ocean Observing System
GTOS Global Terrestrial Observation System
H2020 Horizon 2020 is an EU Research and Innovation programme
IAGOS In-service Aircraft for a Global Observing System Research Infrastructure
ICOS Integrated Carbon Observation System
ICOS ERIC Integrated Carbon Observation System European Research Infrastructure Consortium
ICOS OTC ICOS Ocean Thematic Centre
ICOS RI Integrated Carbon Observation System Research Infrastructure
IG3IS Integrated Global Greenhouse Gas Information System
IOC UNESCO The Intergovernmental Oceanographic Commission of UNESCO
IPCC Intergovernmental Panel on Climate Change
Japan flux Japanese ecosystem research network
LAI Leaf area index
MRV Monitoring, Reporting and Verification
N2O Nitrous oxide
NAP The National Adaptation Plan
NC National Communications
NDC Nationally Determined Contributions
NEON The National Ecological Observatory Network
NN National Network
NOAA National Oceanic and Atmospheric Administration of U.S. Department of Commerce
NOX Nitrogen oxides
NRT Near-Real-Time
OSSEs Observing System Simulation Experiments
pid persistent identifier for data objects
PRI Photochemical reflectance index
RI COM Research Infrastructure Committee
RINGO H2020 project, Readiness of ICOS for Necessities of Integrated Global Observations
SBSTA Subsidiary Body for Scientific and Technical Advice
SIF Solar induced fluorescence
SOCAT Surface Ocean CO2 Atlas data set
SR (IPCC) Special Report
SST Sea surface temperature
TCCON Total Carbon Column Observing Network
TERN/Ozflux Terrestrial Ecosystem Research Network/Australian Flux Research Network
UN United Nations
UNEP United Nations Environment Programme
UNESCO United Nations Educational, Scientific and Cultural Organization
UNFCCC United Nations Framework Convention on Climate Change
VERIFY H2020 project on Observation-based system for monitoring and verification of greenhouse gases
WCRP World Climate Research Programme
WCSP World Climate Services Programme
WMO World Meteorological Organization
38 39Appendix 3Appendix 2
Constitutional documents• ICOS ERIC Statutes:
www.icos-ri.eu/sites/default/files/cmis/ICOS ERIC Statutes.pdf• Technical and scientific description of ICOS RI:
www.icos-ri.eu/sites/default/files/cmis/Technical and Scientific Description of ICOS RI.pdf
Finances• ICOS RI Internal Financial Rules:
www.icos-ri.eu/sites/default/files/cmis/ICOS Internal Financial Rules_Approved2016.pdf• ICOS RI Financial Report 2017:
www.icos-ri.eu/sites/default/files/cmis/ICOS RI Financial Report 2017.pdf
Operations• ICOS Handbook:
www.icos-ri.eu/sites/default/files/cmis/ICOS Handbook 2019.pdf• ICOS RI Data policy:
www.icos-ri.eu/sites/default/files/cmis/ICOS RI Data Policy.pdf• ICOS RI Progress Report 2015-2017:
www.icos-ri.eu/sites/default/files/cmis/ICOS Progress Report 2015-2017.pdf• ICOS Impact Assessment Report 2018:
www.icos-ri.eu/sites/default/files/cmis/ICOS Impact Assessment Report 2018.pdf• ICOS RI Annual Report 2017:
www.icos-ri.eu/sites/default/files/cmis/ICOS RI Annual Report 2017.pdf
Documentation of station labelling process• ICOS ATC station labelling Step 2:
www.icos-ri.eu/sites/default/files/cmis/ICOS Atmospheric Station Labelling STEP 2.pdf• ICOS ATC station specifications:
www.icos-ri.eu/sites/default/files/cmis/ICOS Atmospheric Station specifications Version 1.3 - November 2017.pdf
• ICOS ETC station labelling Step 1: www.icos-ri.eu/sites/default/files/cmis/Ecosystem stations labelling process document Step 1.pdf
• ICOS ETC station labelling Step 2: www.icos-ri.eu/sites/default/files/cmis/Ecosystem stations labelling process document Step 2.pdf
• ICOS ETC station labelling Step 2 practical procedure: www.icos-ri.eu/sites/default/files/cmis/Ecosystem stations labelling Step 2 practical procedure.pdf
• Instructions for ICOS ETC Associated Stations: www.icos-ri.eu/sites/default/files/cmis/Instructions for ICOS Ecosystem Associated Stations.pdf
• ICOS ETC station specifications: www.icos-etc.eu/variables
• ICOS OTC station labelling Step 2: https://otc.icos-cp.eu/sites/default/files/2017-11/ICOS Marine Station Labelling Stage 2 v3_crb_0.pdf
Appendix 2: Relevant documents
1 https://en.oxforddictionaries.com/definition/strategy2 https://thefieldoffacilitation.wordpress.com/glossary-of-terms/3 https://www.icos-ri.eu/sites/default/files/cmis/ICOS Progress Report 2015-2017.pdf4 https://www.icos-ri.eu/sites/default/files/cmis/ICOS Impact Assessment Report 2018.pdf5 https://eur-lex.europa.eu/legal-content/EN/TXT/PDF/?uri=OJ:L:2015:303:FULL&from=EN6 https://www.force11.org/group/fairgroup/fairprinciples7 http://roadmap2018.esfri.eu/8 https://sustainabledevelopment.un.org/sdg139 https://sustainabledevelopment.un.org/sdg1410 https://unfccc.int/sites/default/files/english_paris_agreement.pdf11 https://unfccc.int/sites/default/files/gcos_ip_10oct2016.pdf12 https://www.copernicus.eu/sites/default/files/2018-10/CO2_Report_22Oct2015.pdf13 https://www.copernicus.eu/sites/default/files/2018-10/Report_Copernicus_CO2_Monitoring_
TaskForce_Nov2017_0.pdf14 https://ec.europa.eu/clima/citizens/eu_en15 https://www.wmo.int/pages/prog/www/OSY/Meetings/GCW-IM1/GCW_GCOS_principles.doc16 https://www.force11.org/datacitationprinciples17 https://doi.org/10.1080/14693062.2017.134833118 https://www.4p1000.org19 https://www.icos-ri.eu/sites/default/files/cmis/ICOS Impact Assessment Report 2018.pdf20 https://docs.icos-cp.eu/share/s/L4SaOo3HRZmEJLju1jFJMg (internal document)
Validity of the links checked on May 24, 2019
Appendix 3: References
https://www.icos-ri.eu/sites/default/files/cmis/ICOS%20Internal%20Financial%20Rules_Approved2016.pdf
40 Contacts
Contacts
ICOS Carbon PortalAlex VermeulenLund University, Geocentrum II, Sölvegatan 12 22362 [email protected]
Central Analytical Laboratories (CAL)Flask and Calibration LaboratoryArmin JordanMax Planck Institut, Hans-Knöll-Str. 10 07745 [email protected]
Central Radiocarbon LaboratorySamuel HammerHeidelberg UniversityInstitute of Environmental
PhysicsICOS – CRL Karl Otto Münnich 14C LaboratoryBerliner Straße 5369120 [email protected]
ICOS ERIC Head OfficeWerner Kutsch, Director GeneralErik Palménin aukio 100560 [email protected]
Atmosphere Thematic Centre (ATC)Leonard RivierLSCE-Orme, point courrier 129,
CEA-Orme des Merisiers 91191 Gif-sur-Yvette, [email protected]
Ecosystem Thematic Centre (ETC)Dario PapaleDIBAF University of Tuscia, Largo dell’Università
- Blocco D01100 – Viterbo Italy [email protected]
Ocean Thematic Centre (OTC)Benjamin PfeilAllégaten 70, Postboks 7810 5020 [email protected]
@icos_ri @icosri www.youtube.com/channel/UCutdSsds3zt7uYP4x7d7lRA
www.linkedin.com/company/ integrated-carbon-observation-system
www.icos-ri.eu
ICOS StrategyPublished by ICOS ERIC, Helsinki, FinlandApproved in ICOS General Assembly, May 22, 2019 Printed in May 2019
Citation: ICOS StrategyDOI https://doi.org/10.18160/TV1J-4XQY
Pictures © ICOS ERICPhotographer: Konsta PunkkaLayout and illustration: Sara Estlander / Co-op Bionautit
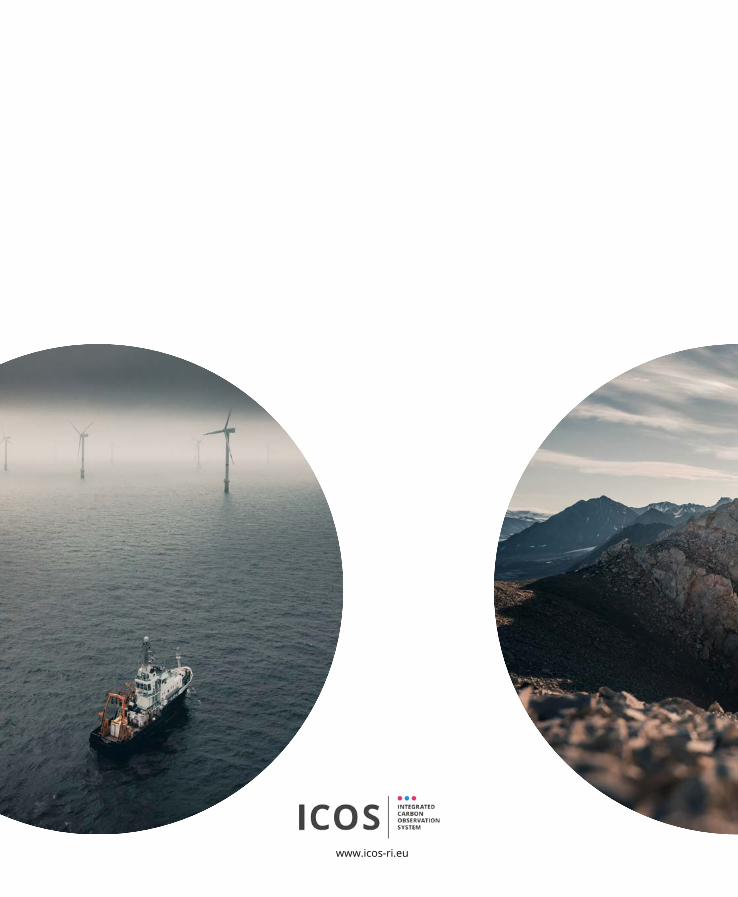
www.icos-ri.eu