Cuyahoga County and The Cleveland Police Force: The Correlation between Income and the Use of Deadly...
22
Cuyahoga County and the Cleveland Police Force: The Correlation between Income and Use of Deadly Force Cuyahoga County and The Cleveland Police Force: The Correlation between Income and the Use of Deadly Force 1
-
Upload
independent -
Category
Documents
-
view
0 -
download
0
Transcript of Cuyahoga County and The Cleveland Police Force: The Correlation between Income and the Use of Deadly...

Cuyahoga County and the Cleveland Police Force: The Correlation between Income and Use of Deadly Force
Cuyahoga County and The Cleveland Police Force: The Correlation between Income and the Use of Deadly Force
1

Cuyahoga County and the Cleveland Police Force: The Correlation between Income and Use of Deadly Force
Cleveland protestors block traffic demanding justice for Tamir Rice and other victims
Introduction
On November 22nd of 2014 12 year-old Tamir Brown was killed
by a Cleveland police officer for holding a BB gun at a local
park in Cleveland. The officer who fired the shots had been
previously let go from the suburban Independence Police Force for
“dangerous loss of composure during live range training and his
inability to manage this personal stress” (Barajas, 2014).
Cleveland City Councilman Jeffrey Johnson stated “there is
something fundamentally broken in our system when a young man can
have a legal BB gun, and by the end of that day be killed by a
Cleveland police officer” (Strochlic, 2014). A one-year
investigation by the Department of Justice into the Cleveland
Police Department concluded not too long after the Tamir Rice
incident. Attorney General Eric Holder explained at a press
conference “The thorough and independent review, which spanned
more than a year and a half, concluded that officers engaged in
unnecessary use of deadly force, including shootings and head
strikes, and used excessive force against people who were
2
Cuyahoga County and the Cleveland Police Force: The Correlation between Income and Use of Deadly Force
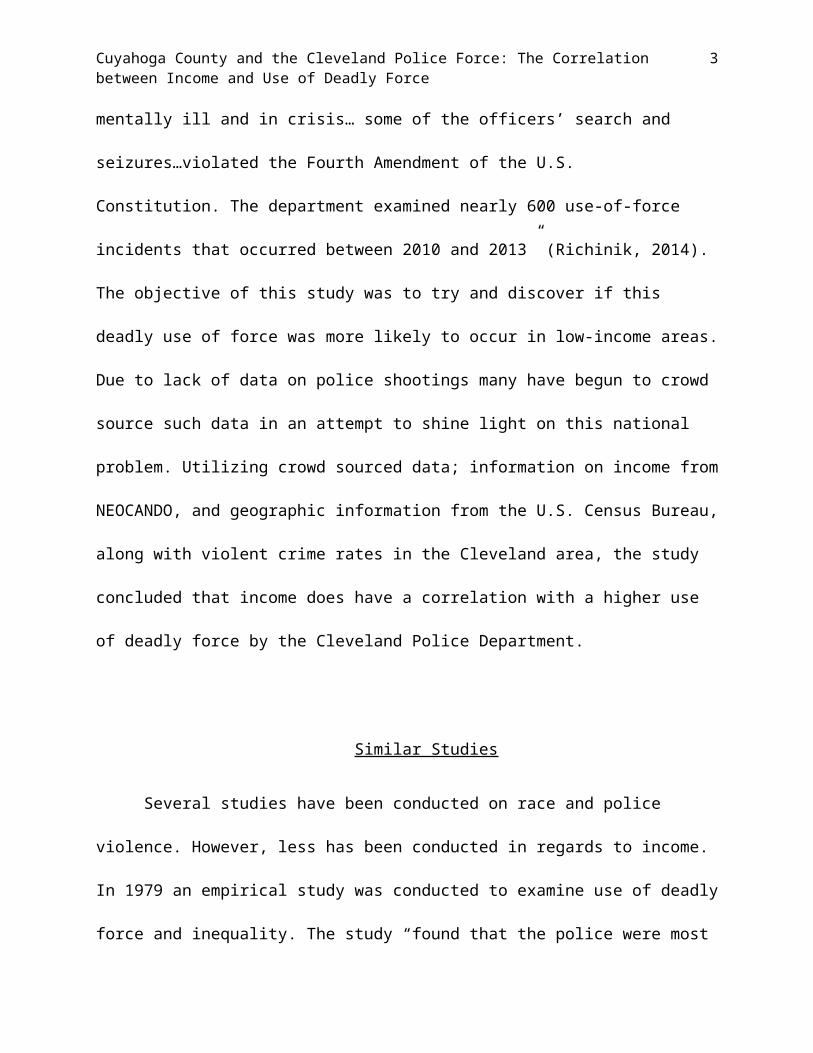
mentally ill and in crisis… some of the officers’ search and
seizures…violated the Fourth Amendment of the U.S.
Constitution. The department examined nearly 600 use-of-force
incidents that occurred between 2010 and 2013” (Richinik, 2014).
The objective of this study was to try and discover if this
deadly use of force was more likely to occur in low-income areas.
Due to lack of data on police shootings many have begun to crowd
source such data in an attempt to shine light on this national
problem. Utilizing crowd sourced data; information on income from
NEOCANDO, and geographic information from the U.S. Census Bureau,
along with violent crime rates in the Cleveland area, the study
concluded that income does have a correlation with a higher use
of deadly force by the Cleveland Police Department.
Similar Studies
Several studies have been conducted on race and police
violence. However, less has been conducted in regards to income.
In 1979 an empirical study was conducted to examine use of deadly
force and inequality. The study “found that the police were most
3

Cuyahoga County and the Cleveland Police Force: The Correlation between Income and Use of Deadly Force
likely to use deadly force in the most unequal states” (Britt &
Jacobs, 403). The large majority of other studies are focused on
race, such as Goldkamp’s study (1976) on minorities as victims of
police shootings. However, additional findings from Goldkamp’s
study did show “that the lowest income groups (regardless of
race) were the most highly victimized segments of society”
(Goldkamp, 169). Recent studies are hard to find suggesting that
much more research needs to be done on the subject. The location
from which the data was obtained, TheseAreWaters, did conduct a
study using the data. However, the majority of the study was
focused on demographics such as race and did not address income.
As the issue becomes more and more a national concern effective
solutions will require the insight offered by scientific
analysis. This study aims to analyze income as it relates to the
use of deadly force. The following map shows police shootings in
Cuyahoga County from 1999 to 2014.1
1 The recent use of deadly force on Tamir Rice on November 22nd isnot included in these maps or analysis.
4

Cuyahoga County and the Cleveland Police Force: The Correlation between Income and Use of Deadly Force
5

Cuyahoga County and the Cleveland Police Force: The Correlation between Income and Use of Deadly Force
6

Cuyahoga County and the Cleveland Police Force: The Correlation between Income and Use of Deadly Force
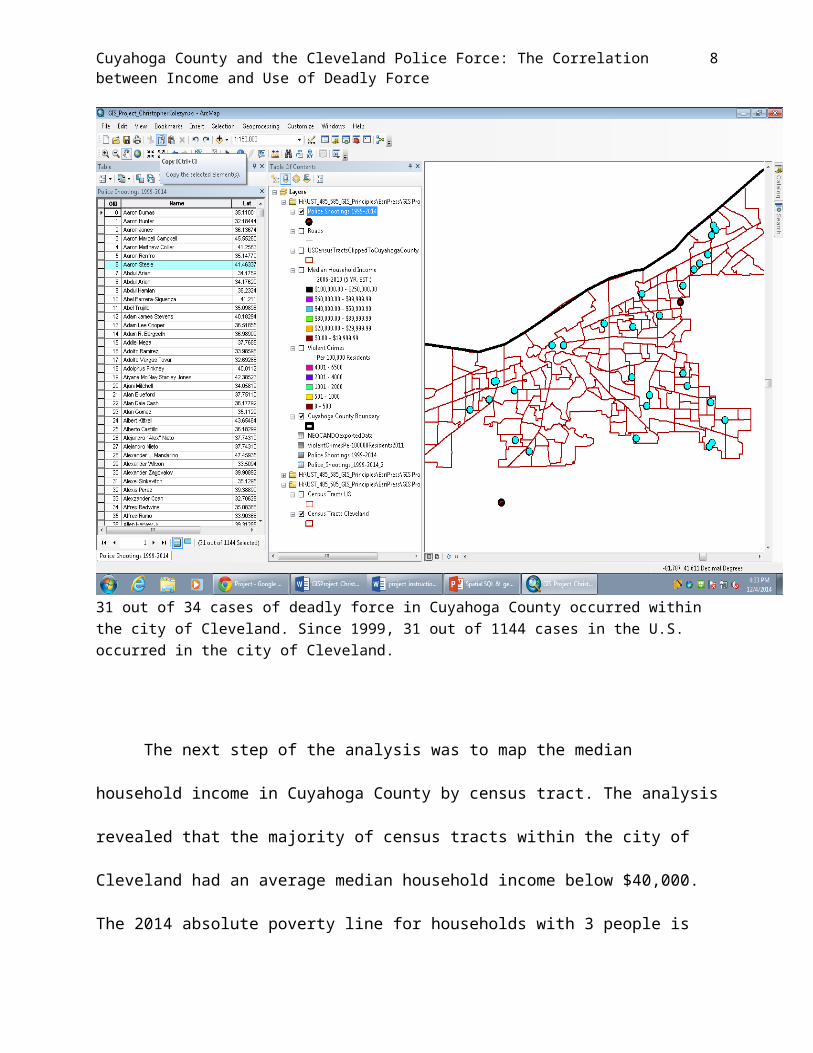
The geolocation of police shootings in Cuyahoga County
reveals a high concentration of shootings within the city of
Cleveland with few taking place in the outer suburbs. This
concentration was established further when selecting points
within the city of Cleveland. Analysis revealed that 31 out of 34
cases of deadly force that occurred within the county happened in
the city of Cleveland. In comparison to shootings across the
entire U.S. Cleveland comprised 2.7 percent of shootings.
7
Cuyahoga County and the Cleveland Police Force: The Correlation between Income and Use of Deadly Force
31 out of 34 cases of deadly force in Cuyahoga County occurred within the city of Cleveland. Since 1999, 31 out of 1144 cases in the U.S. occurred in the city of Cleveland.
The next step of the analysis was to map the median
household income in Cuyahoga County by census tract. The analysis
revealed that the majority of census tracts within the city of
Cleveland had an average median household income below $40,000.
The 2014 absolute poverty line for households with 3 people is
8

Cuyahoga County and the Cleveland Police Force: The Correlation between Income and Use of Deadly Force
$19,790. Areas below or near this income range are marked by the
dark red color on the map. The poverty line for households of 6
is $31,970. These areas are marked by yellow. The poverty line
for households of 8 is $ 40,090, areas below this income range
are marked by the bright green coloring on the map (Department of
Health and Human Services, 2014). Analysis of income ranges shows
that while the large majority of census tracts within the city of
Cleveland have median household incomes below $40,000 the outer
suburbs have majority income ranges between $40,000 to $100,000
dollars with approximately 16 census tracts with incomes above
$100,000.
9

Cuyahoga County and the Cleveland Police Force: The Correlation between Income and Use of Deadly Force
Dan Ficker protestors. Dan was shot and killed in Parma by a Clevelandpolice officer over accusations of petty theft.
10

Cuyahoga County and the Cleveland Police Force: The Correlation between Income and Use of Deadly Force
11

Cuyahoga County and the Cleveland Police Force: The Correlation between Income and Use of Deadly Force
The next step was to overlay the police shootings with median
household income.
12

Cuyahoga County and the Cleveland Police Force: The Correlation between Income and Use of Deadly Force
13

Cuyahoga County and the Cleveland Police Force: The Correlation between Income and Use of Deadly Force
Source: TheseAreWaters, 2014; NEOCANDO, 2006-2010
Analysis of the overlay and coinciding table above shows
significant correlations with income. Out of 34 cases more than half
(18) occurred in neighborhoods where the median household income was
below $30,000 a year. Less than one-third of all cases occurred in
neighborhoods with a median household income between $30,000 and
$40,000. The single case that occurred in the neighborhood with a
$50,000 plus annual household income was a high outlier. The incident
14

Cuyahoga County and the Cleveland Police Force: The Correlation between Income and Use of Deadly Force
occurred within a census tract with an annual household income of
approximately $111,000.
½ Mile buffer of shootings within the city of Cleveland selected.
31 total.
A ½ mile buffer around sites of deadly force reveals that
approximately 23 sites of deadly force occurred within at least a
½ mile of one other site. This could point to poor policing in
15
Cuyahoga County and the Cleveland Police Force: The Correlation between Income and Use of Deadly Force
certain communities or may occur as a result of increased crime
rates, assuming such shootings are justified. In consideration of
the commonly established causation of poverty to crime the
following map displays the number of cases of violent crimes per
100,000 residents by census tract. The following map displays
violent crime rates in the city of Cleveland.
16

Cuyahoga County and the Cleveland Police Force: The Correlation between Income and Use of Deadly Force
17

Cuyahoga County and the Cleveland Police Force: The Correlation between Income and Use of Deadly Force
The majority of census tracts near sites of deadly force
contained higher rates of violent crime than census tracts near
the boundaries of the city of Cleveland. Approximately 21 deaths
occurred in communities with 1,001 – 4,000 violent crimes per
100,000 residents. The remaining 13 sites within the county were
dispersed among the remaining ranges.
Conclusions
This study aimed to understand such violence from a conflict
perspective. The findings of this study are that there is a
significant correlation between income and use of deadly force by
police. Further studies should be undertaken to discover if there
may be causation between the two variables. The concentration of
incidences in areas with less than $30,000 median household
income could indicate poorer training, relaxed hiring standards,
lack of oversight and/or racial and economic bias. Several other
studies on police violence have found race to be a critical
component. The absence of deadly force in high income and
suburban communities of Cuyahoga County suggests further that use
of deadly force has a class component. Additional studies
exploring the violent crime rates around these sites and details
18

Cuyahoga County and the Cleveland Police Force: The Correlation between Income and Use of Deadly Force
of the individual cases will help reveal how strong of a
relationship there is between violent crime rates and use of
deadly force in Cuyahoga County.
References
Barajas, J. (2014, December 4). Cleveland police officer who shot
Tamir Rice was unfit for duty years ago, records show. PBS
Newshour. Retrieved from
http://www.pbs.org/newshour/rundown/cleveland-police-office-
shot-tamir-rice-unfit-duty-years-ago-police-reports-show/
Duncan, M. (Photographer). (2014). Tamir’s family urged
protestors to remain calm during the investigation.
Retrieved December 6, 2014 from:
19

Cuyahoga County and the Cleveland Police Force: The Correlation between Income and Use of Deadly Force
http://www.nydailynews.com/news/national/tamir-rice-family-
question-cops-training-shooting-article-1.2025828
Goldkamp, J. S. (1976). Minoroties as victims of police
shootings: Interpretations of racial disproportionality and
police us of deadly force. Justice System Journal, 2(2), 169-183.
Jacobs, D., & Britt, D. (1979). Inequality and police use of
deadly force: An empirical assessment of a conflict
hypothesis. Social Problems, (4). 403-412.
[Justice for Dan Ficker Protestors Photograph]. Retrieved
December 6, 2014 from:
http://media.cleveland.com/parma/photo/kl4430126cjpg-
32b6f5357fd266e7.jpg
Maxwell, D. (Photographer). (2014). A Cleveland protester holds a
sign with a picture of Tamir Rice during a rally Nov. 24,
2014, on the city's Public Square. Retrieved December 6,
2014 from:
www.usatoday.com/story/news/nation/2014/11/25/cleveland-
shot-boy/70081458/
20

Cuyahoga County and the Cleveland Police Force: The Correlation between Income and Use of Deadly Force
Richinick, M. (2014, December 4). Eric Holder: Cleveland police
engage in ‘excessive force’. MSNBC. Retrieved from
http://www.msnbc.com/msnbc/eric-holder-cleveland-police-
engage-excessive-force
Strochlic, N. (2014, November 25). The 14 teens killed by cops
since Michael Brown. The Daily Beast. Retrieved from
http://www.thedailybeast.com/articles/2014/11/25/the-14-
teens-killed-by-cops-since-michael-brown.html
U.S. Department of Health and Human Services. (2014). 2014
poverty guidelines. Office of The Assistant Secretary for
Planning and Evaluation. Retrieved from
http://aspe.hhs.gov/poverty/14poverty.cfm
Data References
Fatal Encounters & TheseAreWaters. (2014). Use of Deadly Force Latitude
and Longitude United States [Data file]. Retrieved from
http://drive.google.com/file/d/0B5p5Vo_V4WG_ekY5VGtORU1WQ00/
edit?pli=1
North East Ohio Community and Neighborhood Data for Organizing.
(2006-2010). Median Annual Household Income, 5 Year Estimate Cuyahoga
21

Cuyahoga County and the Cleveland Police Force: The Correlation between Income and Use of Deadly Force
County, Ohio [Data file]. Available from
http://neocando.case.edu/neocando/
North East Ohio Community and Neighborhood Data for Organizing.
(2011).
Violent Crime Rates per 100,000 residents Cleveland, Ohio [Data file].
Retrieved from http://neocando.case.edu/neocando/
United States Census Bureau. (2014). 2014 TIGER/Line Shapefiles: Census
Tracts, Ohio [Data file]. Available from
http://www.census.gov/cgi-bin/geo/shapefiles2014/layers.cgi
United States Census Bureau. (2014). Cuyahoga County, OH Roads
Shapefile [Data file]. Available from
http://www.census.gov/geo/maps-data/data/tiger-line.html
22