
Cu–TiO2 systems for the photocatalytic H2 production: Influence of structural and surface support...
11
Applied Catalysis B: Environmental 179 (2015) 468–478 Contents lists available at ScienceDirect Applied Catalysis B: Environmental journal homepage: www.elsevier.com/locate/apcatb Cu–TiO 2 systems for the photocatalytic H 2 production: Influence of structural and surface support features Sergio Obregón a , Mario J. Mu˜ noz-Batista b , Marcos Fernández-García b , Anna Kubacka b,∗ , Gerardo Colón a,∗∗ a Instituto de Ciencia de Materiales de Sevilla, Centro Mixto Universidad de Sevilla-CSIC, C/Américo Vespucio s/n, 41092 Sevilla, Spain b Instituto de Catálisis y Petroleoquímica, CSIC, C/Marie Curie, 2, Cantoblanco, 28049 Madrid, Spain a r t i c l e i n f o Article history: Received 18 March 2015 Received in revised form 18 May 2015 Accepted 21 May 2015 Keywords: Cu–TiO2 Photocatalysis Metal dispersion Oxidation state H2 evolution a b s t r a c t The influence of different TiO 2 supports on the Cu active species has been studied. It was found that the photocatalytic H 2 evolution is highly affected by the structural and electronic features of surface Cu species. Thus, metal dispersion and oxidation state appears strongly conditioned by the structural and surface properties of the TiO 2 support. We have examined three TiO 2 supports prepared by different synthetic methods; sol–gel, hydrothermal and microemulsion. In addition, we have induced structural and surface modifications by sulfate pretreatment over freshly prepared TiO 2 precursors and subsequent calcination. Notably different copper dispersion and oxidation state is obtained by using these different TiO 2 supports. From the wide structural and surface analysis of the catalysts we are able to propose that the occurrence of highly disperse Cu 2+ species, the sample surface area as well as the crystallinity of the TiO 2 support are directly related to the photocatalytic activity for H 2 production reaction. © 2015 Elsevier B.V. All rights reserved. 1. Introduction The improvement and optimisation of photocatalytic materi- als is an important task in order to achieve a real application of heterogeneous photocatalysis in the near-future. This handicap is especially crucial if we consider recent energy related applications such as H 2 production by photoreforming or CO 2 reduction towards valuable fuels [1–5]. The photocatalytic water splitting reaction to produce H 2 and O 2 using semiconducting catalysts has received much attention due to the potential of this technology, as well as the great economic and environmental interest for the produc- tion of the clean fuel H 2 from water using solar energy. However, when TiO 2 is exploited in hydrogen production using photoreform- ing reaction, some important difficulties arises. Thus, the rapid recombination process of the photogenerated charge pairs and the occurrence of the eventually backward reactions are considered critical points that still makes this process far from a practical appli- cation. Traditionally, highly active photocatalysts are based on TiO 2 doped with noble metal ions (Pt, Au, Pd) acting as co-catalysts for charge trapping sites and avoid the electron–hole recombination processes [6–10]. Due to the high cost of such co-catalysts, transi- ∗ Corresponding author. ∗∗ Corresponding author. Tel.: +34 954489500. E-mail addresses: [email protected] (A. Kubacka), [email protected] (G. Colón). tion metal doping with Cu, Fe, Co or Ni have recently turned as a promising option [11–18]. In spite of that obtained rates for these alternative transition metal based systems are still far from those obtained for noble met- als, copper based catalysts appear as a promising candidate [16–20]. It can be stated that the origin of the photoactivity for the H 2 pro- duction reaction of copper-based systems is strongly affected by the complex structural, morphological, and chemical features of copper species [21]. In a recent paper, we concluded the occur- rence of highly disperse Cu 2+ species is directly related to the higher performance of the system for the H 2 production reaction [22]. Now we try to present an exhaustive structural and surface characterization of Cu-doped systems using TiO 2 supports obtained from different methods; sol–gel, hydrothermal and microemulsion. The intrinsic surface and structural features of the TiO 2 support appear to be crucial and strongly affect the final features of cop- per deposits conditioning in great extent the photoactivity of the system. 2. Experimental 2.1. Catalysts preparation and characterisation 2.1.1. Synthesis by a sol–gel method TiO 2 system was prepared by a sol–gel method using tita- nium tetraisopropoxide (TTIP) as precursor (10 mL TTIP) in http://dx.doi.org/10.1016/j.apcatb.2015.05.043 0926-3373/© 2015 Elsevier B.V. All rights reserved.
Transcript of Cu–TiO2 systems for the photocatalytic H2 production: Influence of structural and surface support...

Cs
SGa
b
a
ARRA
KCPMOH
1
ahesvpmatwiroccdcp
h0
Applied Catalysis B: Environmental 179 (2015) 468–478
Contents lists available at ScienceDirect
Applied Catalysis B: Environmental
journa l homepage: www.e lsev ier .com/ locate /apcatb
u–TiO2 systems for the photocatalytic H2 production: Influence oftructural and surface support features
ergio Obregón a, Mario J. Munoz-Batista b, Marcos Fernández-García b, Anna Kubacka b,∗,erardo Colón a,∗∗
Instituto de Ciencia de Materiales de Sevilla, Centro Mixto Universidad de Sevilla-CSIC, C/Américo Vespucio s/n, 41092 Sevilla, SpainInstituto de Catálisis y Petroleoquímica, CSIC, C/Marie Curie, 2, Cantoblanco, 28049 Madrid, Spain
r t i c l e i n f o
rticle history:eceived 18 March 2015eceived in revised form 18 May 2015ccepted 21 May 2015
eywords:
a b s t r a c t
The influence of different TiO2 supports on the Cu active species has been studied. It was found thatthe photocatalytic H2 evolution is highly affected by the structural and electronic features of surface Cuspecies. Thus, metal dispersion and oxidation state appears strongly conditioned by the structural andsurface properties of the TiO2 support. We have examined three TiO2 supports prepared by differentsynthetic methods; sol–gel, hydrothermal and microemulsion. In addition, we have induced structural
u–TiO2
hotocatalysisetal dispersionxidation state2 evolution
and surface modifications by sulfate pretreatment over freshly prepared TiO2 precursors and subsequentcalcination. Notably different copper dispersion and oxidation state is obtained by using these differentTiO2 supports. From the wide structural and surface analysis of the catalysts we are able to propose thatthe occurrence of highly disperse Cu2+ species, the sample surface area as well as the crystallinity of theTiO2 support are directly related to the photocatalytic activity for H2 production reaction.
. Introduction
The improvement and optimisation of photocatalytic materi-ls is an important task in order to achieve a real application ofeterogeneous photocatalysis in the near-future. This handicap isspecially crucial if we consider recent energy related applicationsuch as H2 production by photoreforming or CO2 reduction towardsaluable fuels [1–5]. The photocatalytic water splitting reaction toroduce H2 and O2 using semiconducting catalysts has receiveduch attention due to the potential of this technology, as well
s the great economic and environmental interest for the produc-ion of the clean fuel H2 from water using solar energy. However,hen TiO2 is exploited in hydrogen production using photoreform-
ng reaction, some important difficulties arises. Thus, the rapidecombination process of the photogenerated charge pairs and theccurrence of the eventually backward reactions are consideredritical points that still makes this process far from a practical appli-ation. Traditionally, highly active photocatalysts are based on TiO2
oped with noble metal ions (Pt, Au, Pd) acting as co-catalysts forharge trapping sites and avoid the electron–hole recombinationrocesses [6–10]. Due to the high cost of such co-catalysts, transi-∗ Corresponding author.∗∗ Corresponding author. Tel.: +34 954489500.
E-mail addresses: [email protected] (A. Kubacka), [email protected] (G. Colón).
ttp://dx.doi.org/10.1016/j.apcatb.2015.05.043926-3373/© 2015 Elsevier B.V. All rights reserved.
© 2015 Elsevier B.V. All rights reserved.
tion metal doping with Cu, Fe, Co or Ni have recently turned as apromising option [11–18].
In spite of that obtained rates for these alternative transitionmetal based systems are still far from those obtained for noble met-als, copper based catalysts appear as a promising candidate [16–20].It can be stated that the origin of the photoactivity for the H2 pro-duction reaction of copper-based systems is strongly affected bythe complex structural, morphological, and chemical features ofcopper species [21]. In a recent paper, we concluded the occur-rence of highly disperse Cu2+ species is directly related to the higherperformance of the system for the H2 production reaction [22].
Now we try to present an exhaustive structural and surfacecharacterization of Cu-doped systems using TiO2 supports obtainedfrom different methods; sol–gel, hydrothermal and microemulsion.The intrinsic surface and structural features of the TiO2 supportappear to be crucial and strongly affect the final features of cop-per deposits conditioning in great extent the photoactivity of thesystem.
2. Experimental
2.1. Catalysts preparation and characterisation
2.1.1. Synthesis by a sol–gel methodTiO2 system was prepared by a sol–gel method using tita-
nium tetraisopropoxide (TTIP) as precursor (10 mL TTIP) in

s B: En
whub
2
fboTanaAptad
2
maawmrmp
ew2twiHhanst
ririTohp
2
t
DTom
sgp
S. Obregón et al. / Applied Catalysi
ater/isopropanol solution (200 mL iPrOH and 2 mL H2O). Forcedydrolysis of the TTIP solution was achieved by adding certain vol-me of bidistilled water (8.4 mL). Finally the pH was adjusted to 9y adding NH4OH.
.1.2. Synthesis by a hydrothermal methodThe hydrothermal method followed for TiO2 preparation can be
ound elsewhere [23]. Briefly, a TiO2 colloidal solution was obtainedy adding certain amount of Ti4+-isopropanol solution to 400 mLf distilled water at pH 2 achieved by means of acetic acid. AfterTiP addition a white precipitate is obtained that upon stirringt room temperature for one week evolves to a milky homoge-eous solution. A certain amount of triethylamine (TEA) was thendded dropwise to the Ti-solution aliquot till the pH value was 9.fterwards, the obtained white precipitate suspension was thenlaced in a Teflon recipient inside of stainless steel autoclave reac-or. The hydrothermal treatment was performed at 120 ◦C, 20 h. Thes obtained precipitate was then filtered, repeatedly washed andried overnight at 120 ◦C.
.1.3. Synthesis by a microemulsion methodThe titania precursor were obtained by means of a water in oil
icroemulsion preparation method utilising n-heptane (Scharlau)s organic media, Triton X-100 (Aldrich) as surfactant and hex-nol (Aldrich) as cosurfactant. Titanium tetraisopropoxide solutionith isopropanol (2:3) was added dropwise on the as-preparedicroemulsion. Water/Ti and water/surfactant molar ratios were,
espectively, 110 and 18 for all samples [24,25]. The resultingixture was stirred for 24 h, centrifuged, and the separated solid
recursors rinsed with methanol and dried at 110 ◦C for 12 h.Before copper doping, titania samples were subjected to differ-
nt calcination treatments. On one hand, the first series of supportsas obtained by calcination of as prepared precursor at 400 ◦C for
h. On the other, the second series was previously sulfuric acid pre-reated and then calcined at 650 ◦C for 2 h. This acid pretreatmentould stabilize anatase structure and surface area against sinter-
ng [26]. Different as prepared TiO2 samples were denoted as SG,T and ME referring the preparation method employed (sol–gel,ydrothermal and microemulsion). Moreover the sample labelslso indicate the calcination treatment submitted. Thus, i.e. ME650otation would correspond to TiO2 sample obtained by microemul-ion method and further calcined at 650 ◦C (calcination at suchemperature would imply sulfuric acid pre-treatment).
Then, copper doping has been performed by means chemicaleduction using Cu(NO3)2 as copper precursor and NaBH4 as reduc-ng agent. Thus, 1 g of TiO2 or STiO2 (calcined at 400 ◦C and 650 ◦C,espectively) was dispersed in 100 mL of water solution contain-ng the corresponding stoichiometric amount of copper precursor.hen an excess of NaBH4 was added and the dispersion was thor-ughly stirred for 1 h at room temperature. Finally, this solutionas been filtered and washed with distilled water and the obtainedowder dried at 110 ◦C overnight.
.2. Characterization techniques
BET surface area measurements were carried out by N2 adsorp-ion at 77 K using a Micromeritics 2000 instrument.
X-ray diffraction (XRD) patterns were obtained using a Siemens-501 diffractometer with Ni filter and graphite monochromator.he X-ray source was Cu K� radiation. From the line broadeningf corresponding X-ray diffraction peaks, we have calculated theean crystallite size according to Scherrer equation.
Diffuse reflectance spectra were obtained on a UV–vis scanningpectrophotometer Shimadzu AV2101, equipped with an inte-rating sphere, using BaSO4 as reference. UV–vis spectra wereerformed in the diffuse reflectance mode (R) and transformed to
vironmental 179 (2015) 468–478 469
a magnitude proportional to the extinction coefficient (K) throughthe Kubelka–Munk function, F(R∝). For the sake of comparison, allspectra were arbitrary normalised in intensity to 1. Band gap val-ues were obtained from the plot of the modified Kubelka–Munkfunction (F(R∝)E)1/2) versus the energy of the absorbed light E. Thisconsiders anatase an indirect gap semiconductor.
XPS data were recorded on 4·4 mm2 pellets, 0.5 mm thick, pre-pared by slightly pressing the powdered materials which wereoutgassed in the prechamber of the instrument at 150 ◦C up toa pressure <2·10−8 torr to remove chemisorbed water from theirsurfaces. Spectra were recorded using a Leybold–Heraeus LHS-10spectrometer, working with constant pass energy of 50 eV. Thespectrometer main chamber, working at a pressure <2·10−9 torr,is equipped with an EA-200 MCD hemispherical electron analyserwith a dual X-ray source working with Al K� (h� = 1486.6 eV) at120 W and 30 mA. C 1s signal (284.6 eV) was used as internal energyreference in all the experiments.
Transmission electron microscopy (TEM) electron microscopywas performed in a Philips CM200 microscope. The samples weredispersed in ethanol using an ultrasonicator and dropped on a car-bon grid.
Diffuse reflectance infrared Fourier transform spectra (DRIFTS)were taken in a Bruker Vertex 80 FTIR spectrometer using a MCTdetector and running under OPUS/IR software. The set-up consistsof a praying mantis DRIFTS accessory (Harrick Scientific) and areaction cell (HVC, Harrick Scientific). The reaction mixture wasprepared by injecting 8000 ppm of methanol (≥99%; Aldrich) intoa wet (1:10 methanol to water ratio) N2 flow before entering theDRIFTS cell. Higher quantities of methanol provide a strong gas-phase IR signal which does not allow to obtain any informationof the surface species. The DRIFTS spectra were collected in therange of 4000–600 cm−1with a resolution of 2 cm−1, by averag-ing 10 scans over a total of 1.2 s. In DRIFTS experiments, in-situlight excitation was carried out using 365 nm (20 nm half-width)radiation.
2.3. Photocatalytic runs
Photocatalytic H2 production tests were performed in a flow-reactor system. The powder photocatalysts were suspended ina methanol–water solution (300 mL, MeOH 10% v/v in water).The reaction media was continuously thermostated at 23 ± 2 ◦C toprevent any significant evaporation of the sacrificial agent. The cat-alyst suspension (0.5 g/L) was firstly degassed with an N2 stream(150 mL/min) for 30 min. After that the N2 flow was settled at15 mL/min and stabilised for 15 min. This nitrogen flow was used todisplace the hydrogen produced from the photoreactor headspacetowards the GC measuring system. Then, the lamp (125 W mediumpressure Hg lamp) was switched on and the effluent gases wereanalysed to quantify H2 production by gas chromatography (Agilent490 micro GC) using a thermal conductivity detector.
3. Results and discussions
The structural features of different samples obtained with TiO2and STiO2 series have been studied by X-ray diffraction. In Fig. 1, weshow the diffraction patterns obtained for both series, calcined at400 ◦C and 650 ◦C (TiO2 and STiO2). In all cases, anatase phase waspractically the unique crystalline structure detected. Only in thecase of the sample obtained from microemulsion method and fur-therly calcined at 400 ◦C a small amount (less than 5%) of brookite
phase was detected. Regarding to STiO2 series, in spite of the highcalcination temperature rutile phase is not present. Only ME showsa small residual amount that would point out the first step of ruti-lization process (Fig. 1b). This is due to the well-known stabilization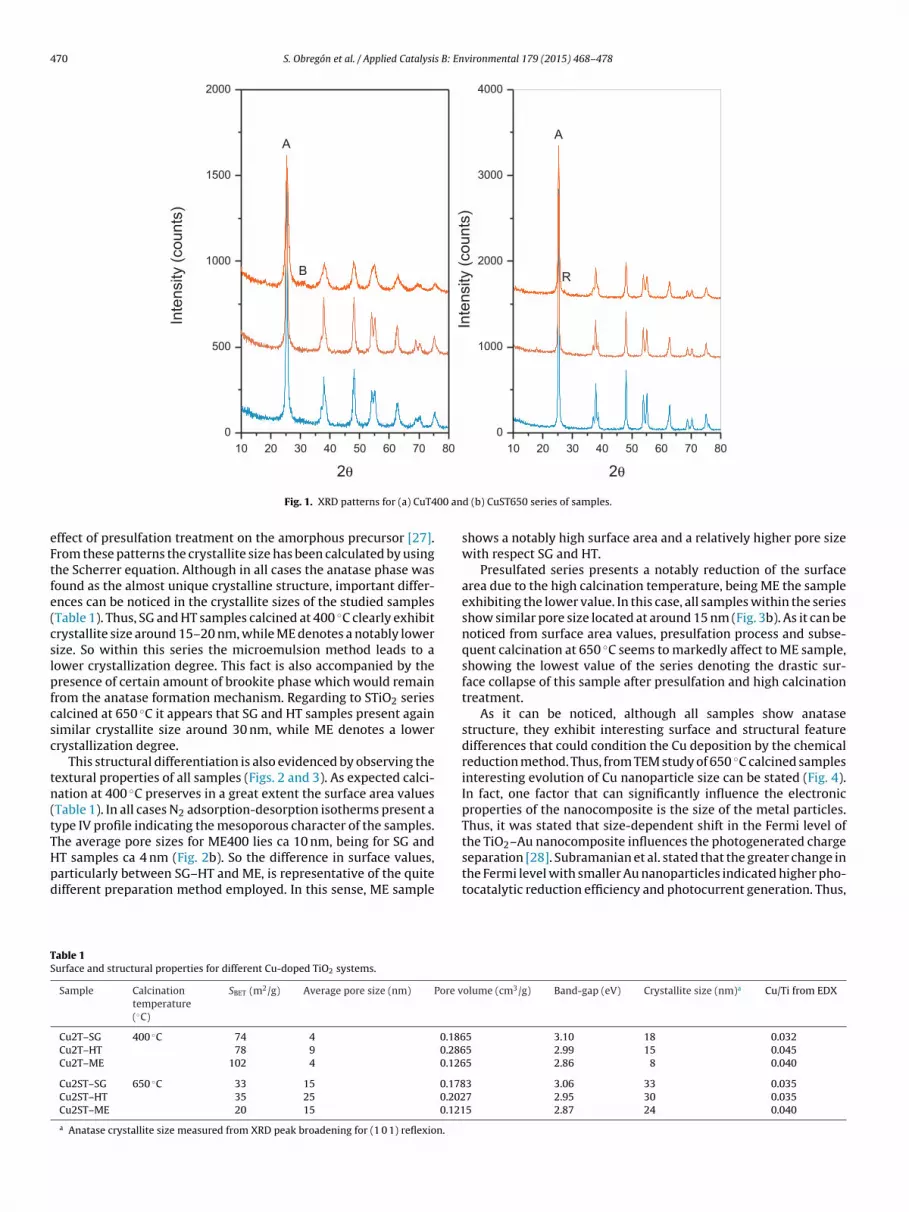
470 S. Obregón et al. / Applied Catalysis B: Environmental 179 (2015) 468–478
10 20 30 40 50 60 70 800
500
1000
1500
2000
A
Inte
nsity
(cou
nts)
A
10 20 30 40 50 60 70 800
1000
2000
3000
4000
B R
Inte
nsity
(cou
nts)
00 an
eFtfe(cslpfcsc
tn(tTHpd
TS
2θ
Fig. 1. XRD patterns for (a) CuT4
ffect of presulfation treatment on the amorphous precursor [27].rom these patterns the crystallite size has been calculated by usinghe Scherrer equation. Although in all cases the anatase phase wasound as the almost unique crystalline structure, important differ-nces can be noticed in the crystallite sizes of the studied samplesTable 1). Thus, SG and HT samples calcined at 400 ◦C clearly exhibitrystallite size around 15–20 nm, while ME denotes a notably lowerize. So within this series the microemulsion method leads to aower crystallization degree. This fact is also accompanied by theresence of certain amount of brookite phase which would remain
rom the anatase formation mechanism. Regarding to STiO2 seriesalcined at 650 ◦C it appears that SG and HT samples present againimilar crystallite size around 30 nm, while ME denotes a lowerrystallization degree.
This structural differentiation is also evidenced by observing theextural properties of all samples (Figs. 2 and 3). As expected calci-ation at 400 ◦C preserves in a great extent the surface area valuesTable 1). In all cases N2 adsorption-desorption isotherms present aype IV profile indicating the mesoporous character of the samples.he average pore sizes for ME400 lies ca 10 nm, being for SG andT samples ca 4 nm (Fig. 2b). So the difference in surface values,
articularly between SG–HT and ME, is representative of the quiteifferent preparation method employed. In this sense, ME sampleable 1urface and structural properties for different Cu-doped TiO2 systems.
Sample Calcinationtemperature(◦C)
SBET (m2/g) Average pore size (nm) Pore v
Cu2T–SG 400 ◦C 74 4 0.186Cu2T–HT 78 9 0.286Cu2T–ME 102 4 0.126
Cu2ST–SG 650 ◦C 33 15 0.178Cu2ST–HT 35 25 0.202Cu2ST–ME 20 15 0.121
a Anatase crystallite size measured from XRD peak broadening for (1 0 1) reflexion.
2θ
d (b) CuST650 series of samples.
shows a notably high surface area and a relatively higher pore sizewith respect SG and HT.
Presulfated series presents a notably reduction of the surfacearea due to the high calcination temperature, being ME the sampleexhibiting the lower value. In this case, all samples within the seriesshow similar pore size located at around 15 nm (Fig. 3b). As it can benoticed from surface area values, presulfation process and subse-quent calcination at 650 ◦C seems to markedly affect to ME sample,showing the lowest value of the series denoting the drastic sur-face collapse of this sample after presulfation and high calcinationtreatment.
As it can be noticed, although all samples show anatasestructure, they exhibit interesting surface and structural featuredifferences that could condition the Cu deposition by the chemicalreduction method. Thus, from TEM study of 650 ◦C calcined samplesinteresting evolution of Cu nanoparticle size can be stated (Fig. 4).In fact, one factor that can significantly influence the electronicproperties of the nanocomposite is the size of the metal particles.Thus, it was stated that size-dependent shift in the Fermi level ofthe TiO2–Au nanocomposite influences the photogenerated chargeseparation [28]. Subramanian et al. stated that the greater change in
the Fermi level with smaller Au nanoparticles indicated higher pho-tocatalytic reduction efficiency and photocurrent generation. Thus,olume (cm3/g) Band-gap (eV) Crystallite size (nm)a Cu/Ti from EDX
5 3.10 18 0.0325 2.99 15 0.0455 2.86 8 0.040
3 3.06 33 0.0357 2.95 30 0.0355 2.87 24 0.040

S. Obregón et al. / Applied Catalysis B: Environmental 179 (2015) 468–478 471
0,0 0,2 0,4 0,6 0,80
20
40
60
80
100
120
140
160
180
200
Vol
ume
adso
rbed
(cm
3 /g)
SG40 0
0,0 0,2 0,4 0,6 0,8
HT40 0
Relative pressure (P /P0)
0,0 0,2 0,4 0,6 0,8
ME40 0
1 100,00
0,02
0,04
0,06
0,08
0,10
0,12 SG400 HT40 0 ME40 0
Vol
ume
adso
rbed
(cm
3 /g)
ge po
nd (b
sa
poraMtTS
Cdcatfifa
Avera
Fig. 2. (a) N2 adsorption–desorption isotherms a
ize control is of great importance for optimising the photocatalyticctivity in nanocomposite photocatalysts.
Samples calcined at 400 ◦C do not show any evidence of theresence of Cu nanoparticle, probably due to the notably low sizef the Cu particles. It is worthy to note that SG650 shows a nar-ow distribution with the lowest Cu average particle size centeredt 1–2 nm. This particle size value is similar to that obtained byoon et al. by using polyacrylic acid modified TiO2 [29]. On the con-
rary, HT650 and ME650 exhibit average Cu particle size 3–4 nm.hus, it is possible to state that Cu size follows the following order:G650 < HT650 ≈ ME650.
In Fig. 5, we depict the hydrogen production rates for all theu-doped samples studied. As it can be noted the hydrogen pro-uction reaches a stable value after the first 45 min. (Fig. 5a). It islear that although a similar deposition method has been employednd a similar Cu content is present in all samples, the particular fea-
ures of both support and surface Cu species notably affect to thenal photocatalytic performance (Fig. 5c). Moreover, since the dif-erent TiO2 supports showed quite unlike surface area values welso included the specific production rate per surface area (Fig. 5d).
re diameter (Å)
) pore size distribution curves for CuT400 series.
In order to assess the situation of Cu species at the surface andelucidate how it could affect to the photoactivity, we have per-formed XPS analysis of all samples (Table 2). In all cases, the Cu 2pcurve is formed by two peaks located at ca. 932 and 953 eV whichcan be ascribed to Cu 2p3/2 and Cu 2p1/2, respectively (Fig. 6). More-over, the presence of the shakeup satellite peak at around 940 eVdenotes the occurrence of Cu2+ species [30]. From the deconvo-lution of Cu 2p spectra it is possible to draw information aboutthe composition of Cu1+ and Cu2+ species at the surface as wellthe chemical composition of the surface (Table 2). It is worthyto mention that although the Cu nominal contents in all samplesare similar (see EDX analysis in Table 1), the Cu/Ti ratio obtainedfrom XPS shows an interesting evolution. It is well-known thatX-ray photoelectron spectroscopy (XPS or ESCA), because of itshigh surface sensitivity (probing depth ca. 2 nm), has been con-sidered as one of the best techniques for studying the dispersion of
transition metal oxides on various supports. Thus, Cu-samples cal-cined at 400 ◦C clearly exhibit lower Cu/Ti ratios (between 0.14 and0.18) with respect to high temperature calcined samples (show-ing Cu/Ti ratios above 0.20). As widely reported in the literature, a
472 S. Obregón et al. / Applied Catalysis B: Environmental 179 (2015) 468–478
0,0 0,2 0,4 0,6 0,80
20
40
60
80
100
120
140
160
180
200
Vol
ume
adso
rbed
(cm
3 /g)
SG65 0
0,0 0,2 0,4 0,6 0,8
HT65 0
Relative pressure (P /P0)
0,0 0,2 0,4 0,6 0,8
ME65 0
1 100,000
0,005
0,010
0,015
0,020
0,025 SG650 HT65 0 ME65 0
Vol
ume
adso
rbed
(cm
3 /g)
e po
nd (b)
lpdtdtt
TX
Averag
Fig. 3. (a) N2 adsorption–desorption isotherms a
ower metal/support ratio could be related to a higher metal dis-ersion on the support [31–33]. In general, the different dispersionegree is associated to both the surface area of the support andhe metal/support interaction [34]. This clearly implies that the
ispersion of surface Cu species is quite different depending onhe thermal treatment of the support. It can be established thathe lower Cu/Ti ratio, the higher dispersion is. Indeed, from TEMable 2PS analysis for different Cu-doped TiO2 systems.
Sample Calcinationtemperature (◦C) SBET (m2/g) Ti 2p3/2 (eV)
Cu2T–SG 400 ◦C 74 458.0
Cu2T–HT 400 ◦C 78 458.4
Cu2T–ME 400 ◦C 102 458.2
Cu2ST–SG 650 ◦C 33 458.5
Cu2ST–HT 650 ◦C 35 458.2
Cu2ST–ME 650 ◦C 20 458.2
re diameter (Å)
pore size distribution curves for CuST650 series.
images it was not possible to detect the presence of Cu nanoparti-cles, denoting the highly disperse situation of Cu species. This factis quite reasonable by considering the different surface area valuesof each TiO2 support (Table 1). In this sense, ME400 sample showed
the highest BET surface area value and exhibits the lower Cu/Ti ratiodenoting a higher metal dispersion. On the contrary, ME650 sam-ple presents the highest Cu/Ti ratio indicating a high Cu surfaceCu 2p3/2 (eV) Im/Is % Cu2+ Cu/Ti O/Ti
Cu1+ Cu2+
932.1 934.1 4.24 41.2 0.183 2.43932.3 934.5 4.20 47.4 0.180 2.44932.2 934.3 3.48 52.0 0.138 2.49932.3 934.2 3.87 54.0 0.240 2.48932.0 934.1 3.24 58.0 0.285 2.65932.2 934.3 3.20 61.5 0.417 2.73

S. Obregón et al. / Applied Catalysis B: Environmental 179 (2015) 468–478 473
et: ea
cTCs
dttttssiBislspsps
Fig. 4. TEM images for SG650, HT650 and ME650 samples (ins
oncentration which can be associated to its lowest surface area.hus, the first consideration concerns to the surface aggregation ofu species, which clearly depends on the textural properties of theupport.
Moreover, the oxidation state of Cu seems also to be depen-ent on the surface features. As it can be noticed it appearshat the appearance of Cu1+ species is somehow related tohe Cu dispersion (Fig. 7a). Thus, as the Cu/Ti ratio increases,hat is Cu lower dispersion at the surface, the amount of Cu1+
rends to diminish. On the contrary, higher Cu species disper-ion leads to higher amount of Cu1+. This appears the oxidationtate stabilised at the titania–copper interface, as mentionedn previous works [35] and nicely shown in recent dates byaber et al. [36] On this basis, as the Cu dispersion increases
t is possible to stabilize larger quantities of the reduced Cu1+
pecies at the surface. As it has been discussed here and fol-ows from simple considerations, the dispersion of any surfacepecies is in turn correlated with the surface area of the sup-
ort. Therefore, upon the same doping method the differenturface features of the support would drive both the dis-ersion as well as the oxidation state of Cu species at theurface.ch TEM image includes the Cu-nanoparticle size distribution).
By observing the H2 production rates obtained the followingorder can be attained as a function of the support independentlyof the calcination treatment: SG > HT » ME. Moreover, except forSG650 sample, the calcination at 650 ◦C leads to lower reactionrates. It is worthy to note that ME400 and ME650 samples showedthe lowest values of each series. This could be related in principleto the occurrence of certain crystalline impurities (brookite andrutile, respectively). Although the three crystalline phases of TiO2are able to produce hydrogen, anatase appears as the most activephase amongst them [37,38]. In our case the presence of rutile andbrookite is residual showing a low crystallization degree. Such lowcrystallinity impurities would act as recombination center. Indeed,the synergy of mixed phase TiO2 is strongly dependent of themicrostructural situation of the present structures [39–41]. For thisreason, although it has been reported that TiO2 polymorph junc-tions (anatase–rutile and even anatase–brookite) [42,43] wouldshow improved photocatalytic performance for hydrogen produc-tion with respect to single anatase, in our case, it is expected that the
residual presence of other phases could be detrimental. In spite ofthese considerations, other parameters concerning to situation Cuspecies at the surface might be considered. As previously reported,the occurrence of highly disperse Cu2+ species is directly related to
474 S. Obregón et al. / Applied Catalysis B: Environmental 179 (2015) 468–478
SOLGEL HYDROT HERMAL MICROE MULSION0
5
10
15
20
25
CuT400CuST650
H2 p
rodu
ctio
n (m
mol
/h·g
)
SOLGEL HYDROT HERMAL MICROE MULSION0,0
0,2
0,4
0,6
0,8
1,0
H2 p
rodu
ctio
n (m
mol
/h·m
2 )
CuT400CuST650
0 60 12 0 18 0 24 0 30 00
2
4
6
8
10
12
14
16
18
20
Time (min)
H2 m
mol
/h·g
Time (min)0 60 12 0 18 0 24 0 30 0
0
20
40
60
80
100
SG65 0 HT650 ME65 0
SG40 0 HT400 ME40 0
H2 m
mol/g
Fig. 5. (a) Evolution of H2 production rates; (b) H2 production with time; (c) H2 production rates for different series; (d) Specific H2 production rates.
970 96 0 95 0 94 0 93 0 92 0 91 050000
60000
70000
80000
90000
100000
110000
120000
SG650 HT650 ME650
Inte
nsity
(cou
nts)
Binding ener gy (eV)970 96 0 95 0 94 0 93 0 92 0 91 0
60000
70000
80000
90000
100000
110000 SG400 HT400 ME400
Inte
nsity
(cou
nts)
Binding ener gy (eV)
Fig. 6. Cu 2p spectra for (a) T400 and (b) ST650 series (inset: shows the deconvolution of Cu 2p peaks).

S. Obregón et al. / Applied Catalysis B: Environmental 179 (2015) 468–478 475
0,00 0,05 0,10 0,15 0,20 0,25 0,30 0,35 0,40 0,45 0,50 0,55 0,600
10
20
30
40
50
60
70
80
90
100
higher C u agg rega tionlow BET
Cu+ (a
t% fr
om X
PS
)
Cu/Ti
high BEThigher C u dispe rsion
SG65 0
10 20 30 40 50 60 70 80 90 10 0 11 0
0,1
0,2
0,3
0,4
0,5
0,6
ME40 0Hyd
roge
n pr
oduc
tion
(mm
ol/h
·m2 )
BET surface area (m2/g)
SG65 0
ME65 0
HT65 0
SG40 0 HT40 0
b) Cor
ttdctaptaoiCia
nAtta
Fig. 7. Evolution of Cu1+ surface content with Cu/Ti ratio; (
he higher performance of the system for the H2 production reac-ion. Thus, highly disperse Cu2+ species would be easily reduceduring the reaction forming Cu0 sites that will act as an effectiveo-catalyst for a water reduction reaction [22]. Thus, if we considerhe effect of textural support features on the Cu species dispersionnd oxidation state (Fig. 7b) it is possible to correlate the optimumhotocatalytic performance with a specific value of surface area. Athis optimum point (SG650) the sample shows an adequate surfacerea to provide high dispersion as well as limited average reductionf the copper entities and as the same time a suitable crystallite size,
.e. high crystallinity degree. In this sense, it is clear that the largeruOx deposits, contributing to a loss in Cu dispersion with increas-
ng loading, has been correlated with the decreased H2 generationt higher Cu loadings [44,45].
As above mentioned, SG650 sample was the one showing aarrow Cu nanoparticle size distribution centered at ca 1–2 nm.lthough HT650 sample also shows similar surface area, the crys-
allite size is slightly lower and the Cu/Ti ratio appears rather higherhan SG650. Moreover, ME650 exhibits the lowest BET surface areand therefore the highest Cu aggregation. In addition, and as it was
relation between H2 production rate and BET surface area.
mentioned before, this sample also shows a small amount of rutilephase which could hinder at a certain extent the photocatalytic per-formance. Samples calcined at 400 ◦C are located at the minimum ofthe H2 production curve. In spite of the highest surface area valuesshowed by these set of samples, the photocatalytic performanceis lower probably due to lower aggregation of Cu species whichimplies relatively lower presence of Cu2+, as demonstrated here byXPS as well as previous studies of the titania–copper interface [36].
On the basis of this discussion, it is possible to conclude thatSG650 sample shows balanced structural, textural features thatcondition the particular situation of Cu species.
Till this point, we have discussed the effect of Cu species on thesurface and how the support features could affect to the photocat-alytic performance. In order to assess the effect of the differentsupport itself onto the photoactivity, we have also studied theadsorption and photo-reaction of methanol over selected samples.Fig. 8 shows the result of the in-situ following of the methanol fate
under light illumination in presence of water for the two samplesshowing largest photochemical differences. The figure presents dif-ference spectra (taking as background the previous spectra to t = 0 s,
476 S. Obregón et al. / Applied Catalysis B: Environmental 179 (2015) 468–478
Fig. 8. FTIR spectra for the in-situ analysis of the methanol photo-oxidation on (a) ME650 and (b) SG650 samples.

s B: En
t(to
sopiTCosabc
aM21pmbmctoshrw
tpcts
seao3stSaaaft
4
macrrdctp
[
[
[
[
[
[
[
[
[
[[[
[[
[[
[
[
[
[[
S. Obregón et al. / Applied Catalysi
hat is, 1.2 s before) considering; (i) in the upper panel of each plotsample) the adsorption process of methanol up to surface satura-ion and (ii) in the lower panel of each plot (sample) the evolutionf such species under reaction conditions.
In the upper panels we observed a complex line shape in the C Htretch region (2980–2800 cm−1) with at least four peaks, althoughne is not fully resolved and detected only as a shoulder of the maineak of the lower wavenumber region. The C H region would thus
ndicate the co-existence of methanol and methoxy species [46].he dissociate species, presenting the symmetric and asymmetric
H stretch at the lower wavenumber part of each spectral featuref the region, seems the most important in view of the peaks inten-ity. These modes are observed with other two at ca. 1575–1560nd 1440–1435 cm−1 which likely indicates the presence of car-oxylates although the lower wavenumber region must also haveontributions for methanol/methoxy species [47].
Under reaction the methanol-related species disappear slowlynd this seems to be produced by their chemical evolution. ForE650 the disappearance is rather slow and renders CO2,g (ca.
250 cm−1) and formate type species with bands at ca. 1570 and360 cm−1 [48]. At larger reaction times we can see the increasingresence of other carbonates and even other species with carbonyloieties (formaldehyde, formic acid) as evidenced by the broad
ump observed in the 1750–1600 cm−1 region [47,49]. Carbonyloieties are responsible of the intensity for wavenumbers above
a. 1680 cm−1. While it is not possible to ascribe this broad fea-ure to specific species, it is clear the presence of these two typesf adsorbates, and thus, the increasing heterogeneity of the surfacepecies with time on stream. Such species indicate, on the otherand, the stay of partially oxidised species at the surface (corrobo-ated by the spectrum obtained at dark conditions) of the materials,ithout easy progression to the total oxidation product.
In the SG650 case, we show the faster progress of the methanol-ype species disappearance and a larger increase in carbon dioxideroduction. We also observed the presence of formate and somearboxyalates but other species, particularly those indicating par-ial oxidation organic species containing carbonyl moieties, aretrongly diminished with respect to the other sample tested.
So, titania not only plays a role through shaping the copperpecies dispersion and oxidation state but seems to strongly influ-nce the chemical fate of the photo-hole attack to the sacrificialgent. According to Fig. 8 this could be related to the involvementf hydroxyl species. The evolution of species with O H stretch at740 cm−1 or corresponding to associated species (ca. 3400 cm−1)uggest a reordering of the surface which is stable at dark condi-ions, occurring to a deeper degree in the case of the most activeG650 sample. In any case, what it is clear is the point that the mostctive system not only handles electrons with the help of copper in
more efficient way but that hole handling is also favoured, prob-bly due to energetic reasons that allow to progress the reactionurther, up to the total oxidation product, and does not “poison”he titania surface with organic intermediates.
. Conclusions
We have prepared a set of Cu-doped TiO2 by chemical reductionethod and using different TiO2 supports. From the wide structural
nd surface characterization of the studied samples we can con-lude that the occurrence of highly disperse Cu2+ species is directlyelated to the higher performance of the system for H2 productioneaction. Thus, highly disperse Cu2+ species would be easily reduced
uring the reaction forming Cu0 sites that will act as an effective co-atalyst for water reduction reaction. The intrinsic structural andextural support features strongly affect to the Cu nanoparticle dis-ersion and subsequently to the Cu oxidation state. Indeed, high[
[
vironmental 179 (2015) 468–478 477
temperature anatase structure, with relatively high surface areawould induce an improved charge separation and the handling ofboth charge carrier species by surface (copper and titania) enti-ties to efficiently produce hydrogen. By a simple surface dopingmethod, we have obtained a notably photocatalytic activity. So, itis clear that the understanding of chemical and structural situationof the whole system, copper and titania, is crucial to design highlyactive systems.
Acknowledgments
We acknowledge the financial support by Junta de Andalucíaand MINECO-CICYT through FQM-4570, ENE2011-24412, andENE2013-46624-C4-1-R (the latter partially financed by FEDER)projects. S. Obregón thanks CSIC for the concession of a JAE-Pre grant. A. Kubacka and M.J. Munoz-Batista also thank SpanishMINECO for, respectively, Ramón y Cajal Post-doctoral and FIP Pre-doctoral fellowships
References
[1] A. Kubacka, M. Fernández-García, G. Colón, Chem. Rev. 112 (2012) 1555–1614.[2] E.L. Cates, S.L. Chinnapongse, J.H. Kim, Environ. Sci. Technol. 46 (2012)
12316–12328.[3] J.S. Hwang, J.S. Chang, S.E. Park, K. Ikeue, M. Anpo, Top. Catal. 35 (2005)
311–319.[4] R. Vinu, G. Madras, Curr. Org. Chem. 17 (2013) 2538–2558.[5] J.C. Colmenares, R. Luque, Chem. Soc. Rev. 43 (2014) 765–778.[6] M. Grätzel, R.F. Howe, J. Phys. Chem. 94 (1990) 2566–2572.[7] X. Li, P.L. Yue, C. Kutal, New J. Chem. 8 (2003) 1264–1269.[8] A. Naldoni, M. D’Arienzo, M. Altomare, M. Marelli, R. Scotti, F. Morazzoni, E.
Selli, V. Dal Santo, App. Catal. B: Environ. 130–131 (2013) 239–248.[9] A.V. Puga, A. Forneli, H. García, A. Corma, Adv. Funct. Mater. 24 (2014)
241–248.10] R. Su, R. Tiruvalam, A.J. Logsdail, Q. He, C.A. Downing, M.T. Jensen, N.
Dimitratos, L. Kesavan, P.P. Wells, R. Bechstein, H.H. Jensen, S. Wendt, C.R.A.Catlow, C.J. Kiely, G.J. Hutchings, F. Besenbacher, ACS Nano 8 (2014)3490–3497.
11] E. Pulido Melián, M. Nereida Suárez, T. Jardiel, J.M. Dona Rodríguez, A.C.Caballero, J. Arana, D.G. Calatayud, O. González Díaz, Appl. Catal. B: Environ.152–153 (2014) 192–201.
12] R. Dholam, N. Patel, M. Adami, A. Miotello, Int. J. Hydrogen Energy 34 (2009)5337–5346.
13] K. Lalitha, G. Sudanandam, V.D. Kumari, M. Subrahmanyan, B. Sreedhar, N.Y.Heblakar, J. Phys. Chem. C 114 (2010) 22181–22189.
14] C. Ampelli, R. Passalacqua, C. Genovese, S. Perathoner, G. Centi, T. Montini, V.Gombac, J.J. Delgado Jaen, P. Fornasiero, RSC Adv. 3 (2013) 21776–21788.
15] S. Oros-Ruiz, R. Zanella, S.E. Collins, A. Hernández-Gordillo, R. Gómez, Catal.Commun. 47 (2014) 1–6.
16] Z. Wang, Y. Liu, D.J. Martin, W. Wang, J. Tang, H. Huang, Phys. Chem. Chem.Phys. 15 (2013) 14956–14960.
17] D.P. Kumar, M.V. Sankar, M.M. Kumari, G. Sadanandam, B. Srinivas, V.Durgakumari, Chem. Commun. 49 (2013) 9443–9947.
18] L. Clarizia, D. Spasiano, I. Di Somma, R. Marotta, R. Andreozzi, D.D. Dionysiou,Int. J. Hydrogen Energy 39 (2014) 16812–16831.
19] L.S. Yoong, F.K. Chong, B.F. Dutta, Energy 34 (2009) 1652–1661.20] C. Wang, Q. Hu, J. huang, C. Zhu, Y. Cao, Appl. Surf. Sci. 292 (2014) 161–164.21] A. Kubacka, M.J. Munoz-Batista, M. Fernández-García, S. Obregón, G. Colón,
Appl. Catal. B: Environ. 163 (2015) 214–222.22] J.M. Valero, S. Obregón, G. Colón, ACS Catal. 4 (2014) 3320–3329.23] M.C. Hidalgo, M. Aguilar, M. Maicu, J.A. Navío, G. Colón, Catal. Today 129
(2007) 50.24] A. Kubacka, G. Colón, M. Fernández-García, Catal. Today 143 (2009) 286–292.25] A. Kubacka, A. Bachiller-Baeza, G. Colón, M. Fernández-García, Appl. Catal. B
93 (2010) 274–281.26] G. Colón, J.M. Sánchez-Espana, M.C. Hidalgo, J.A. Navío, J. Photochem.
Photobiol. A: Chem. 179 (2006) 20–27.27] G. Coloın, M.C. Hidalgo, G. Munuera, I. Ferino, M.G. Cutrufello, J.A. Navío, Appl.
Catal. B 63 (2006) 45–59.28] V. Subramanian, E.E. Wolf, P.V. Kamat, J. Am. Chem. Soc. 126 (2004)
4943–4950.29] G.D. Moon, J.B. Joo, I. Lee, Y. Yin, Nanoscale 6 (2014) 12002–12008.30] M. Zhu, M.L. Du, D.L. Yu, Y. Wang, N.L. Wang, M.L. Zou, M. Zhang, Y.Q. Fu, J.
Mater. Chem. A 1 (2013) 919–923.31] B.M. Reddy, B. Chowdhury, E.P. Reddy, A. Fernández, Appl. Catal. A: Gen. 213
(2001) 279–288.32] M. Ilie, B. Cojocaru, V.I. Parvulescu, H. Garcia, Int. J. Hydrogen Energy 36
(2011) 15509–15518.

4 s B: En
[
[
[
[
[
[
[
[[
[[
[
[
[
[47] A. Matson, L. Osterlund, J. Phys. Chem. C 114 (2010) 14121–14132.[48] C.E. Nanayakkara, J.K. Dillon, V.H. Grassian, J. Phys. Chem. C 118 (2014)
25487–25495.[49] M.J. Munoz-Batista, M.M. Ballari, A.E. Cassano, O.M. Alfano, A. Kubacka, M.
Fernández-García, Catal. Sci. Technol. 5 (2015) 1521–1531.
78 S. Obregón et al. / Applied Catalysi
33] A.M. Tarditi, N. Barroso, A.E. Galetti, L.A. Arrúa, L. Cornaglia, M.C. Abello, Surf.Interface Anal. 46 (2014) 521–529.
34] I. Rossetti, C. Biffi, C.L. Bianchi, V. Nichele, M. Signoretto, F. Menegazzo, E.Finocchio, G. Ramis, A. Di Michele, Appl. Catal. B: Environ. 150–151 (2014)12–20.
35] A. Kubacka, M. Munoz-Batista, M. Ferrer, M. Fernández-García, Appl. Catal. B140–141 (2013) 680–690.
36] A.E. Baber, X. Yang, H.Y. Kim, K. Mudiyanselage, M. Soldemo, J. Weissenrieder,S.D. Senanayake, A. Al-Mahboob, J.T. Sadowski, J. Evans, J.A. Rodríguez, P. Liu,F.M. Hoffmann, J.G. Chen, D.J. Stacchiola, Angew. Chem. Int. Ed. 53 (2014)5336–5340.
37] G.L. Chiarello, A. Di Paola, L. Palmisano, E. Selli, Photochem. Photobiol. Sci. 10(2011) 355–360.
38] M. Murdoch, G.I.N. Waterhouse, M.A. Nadeem, J.B. Metson, M.A. Keane, R.F.Howe1, J. Llorca, H. Idriss, Nat. Chem. 3 (2011) 489–492.
39] O. Rosseler, M.V. Shankar1, M.K. Le Du, L. Schmidlin, N. Keller, V. Keller, J.Catal. 269 (2010) 179–190.
40] S. Bashir, A.K. Wahab, H. Idriss, Catal. Today 240 (2015) 242–247.41] F. Cai, Y. Tang, H. Shen, C. Wang, A. Ren, L. Xiao, W. Gu, W. Shi, CrystEngComm
17 (2015) 1086–1091.
vironmental 179 (2015) 468–478
42] Q. Xua, Y. Ma, J. Zhang, X. Wang, Z. Feng, C. Li, J. Catal. 278 (2011) 329–335.43] I. Romero Ocana, A. Beltram, J.J. Delgado Jaen, G. Adami, T. Montini, P.
Fornasiero, Inorg. Chim. Acta 431 (2015) 197–205, http://dx.doi.org/10.1016/j.ica.2015.01.033
44] V. Gombac, L. Sordelli, T. Montini, J.J. Delgado, A. Adamski, G. Adami, M.Cargnello, S. Bernal, P. Fornasiero, J. Phys. Chem. A 114 (2010) 3916–3925.
45] M. Jung, J. Scott, Y.H. Ng, Y. Jiang, R. Amal, Int. J. Hydrogen Energy 39 (2014)12499–12506.
46] P.A. Panatoyov, S.T. Burrows, J.P. Morris, J. Phys. Chem. C 116 (2012)6623–6635.