
Customer Satisfaction on Banking Service: A Study on South East Bank

CUSTOMER CARE, SERVICE QUALITY AND CUSTOMER SATISFACTION IN POST
BANK, HOUSING FINANCE BANK; IN KAMPALA
BY:
TAMALE ABDUL KHARIM
&
TWINOMUGISHA FRANCIS

LIST OF ACRONYMS
ATM Automation Teller MachineBOU Bank of UgandaDFCU Development Finance Company
UgandaSPSS Statistical Package for
Social ScientistsUK United KingdomUSE Uganda Stock Exchange
ii

DEFINITION OF KEY TERMS
Customer Care; Customer care can be defined as any good/service
rendered to a customer in the process of selling a product or
service.
Service Quality; Refers to the effectively and efficiently
way of delivering a service so as to satisfaction and delight
customer.
Customer Perception; Is a marketing concept that encompasses
a customer's impression, awareness and/or consciousness about a
company or its offerings? Customer perception is typically
affected by advertising, reviews, public relations, social media,
personal experiences and other channels.
Customer Satisfaction; Customer satisfaction is a
general/overall judgment that a customer makes after consuming a
product or a service. Customer satisfaction is a psychological
state (feeling) appearing after buying and consuming a product or
service.
iii

iv

ABSTRACT
The study focused on Customer Care, Service Quality and Customer
Satisfaction in two Commercial banks in Uganda. The objectives of
the study aimed at establishing the relationship between Customer
Care and Customer Satisfaction, Customer Care and Service
Quality, Customer Perception and Customer Satisfaction, and
studying the factor structure of Customer Care, Service Quality,
Customer Perception and Customer Satisfaction in two commercial
banks in Uganda; Post Bank and Housing Finance Bank.
The research design was a cross sectional which comprised of both
qualitative and quantitative approaches conducted to collect
information from the targeted population totaling of 160
respondents. Proportionate stratified random sampling was used to
select the sample of 132 bank staff members and customers in two
commercial banks. Data was analyzed using descriptive analysis
option of SPSS version (11.0), and was then presented using
Pearson’s correlation, multiple regression and factor analysis
statistical techniques to determine the magnitude of the
relationship and prediction for Customer Care, Service Quality
Customer Perception and Customer Satisfaction respectively
The major findings of the study were as follows: there was a
significant positive correlation between Customer Care, Service
Quality, Customer Perception and Customer Satisfaction in
Commercial Banks in Uganda. The regression analysis indicated
v

that the variables accounted for 39.5% of the variance in of
customer satisfaction in commercial banks. The study report
finally gives some conclusions and recommendations. For instance,
Uganda, like any form of business organization, in today’s
dynamic financial landscape should focus on good service quality
and customer care in terms of the employees, physical evidence
and ambience to instill a higher reliability value among
customers to enhance customer satisfaction in commercial banks.
There is a need for the bank to make their services tangible
through physical facilities in order to improve on quality
services so as to satisfy their customer needs The customers need
to be closely monitored to limit gaps in service provision and
resulting falls in well-being within the bank. The banks need to
focus more on improving the infrastructure; the physical
evidence, internal environment and layout. This is due to the
fact that recently like in other services, in banking also the
internal ambience of the organization has a positive impact on
the customers.
TABLE OF CONTENTS
DECLARATION.........................................................ii
APPROVAL...........................................................iiiDEDICATION..........................................................iv
ACKNOWLEDGEMENT......................................................v
vi

LIST OF ACRONYMS....................................................viLIST OF TABLES....................................................xiii
LIST OF FIGURES....................................................xivCHAPTER ONE..........................................................1
INTRODUCTION AND BACK GROUND.........................................11.0 Introduction 1
1.1 Back ground 21.2 Statement of the Problem 3
1.3 Objectives of the study41.3.1 General Objective 4
1.3.2 Specific Objectives 41.4 Research Questions 4
1.5 Scope 51.5 Content Scope 5
1.5.1Geographical Scope 51.5.2 Time Scope 5
1.6 Significance of the Study 5CHAPTER TWO..........................................................7
LITERATURE REVIEW....................................................72.0 Introduction 7
2.1 The relationship between Customer Care and Customer Satisfaction7
2.1.1 Customer Care 72.2 The relationship between Customer Care and Service Quality 10
2.2.1 Service Quality 10
2.3 The Relationship between Customer Care, Customer Perception and Customer Satisfaction 14
2.3.1 Customer Perception 14
vii

2.3.2 Customer Satisfaction172.4 The Relationship between Customer Care, Service Quality, Customer Perception and Customer Satisfaction. 19CHAPER THREE........................................................21
METHODOLOGY.........................................................213.0 Introduction 21
3.1 Research Design 213.2 Study Population 21
3.3 Sample size and sampling design 223.4 Data Sources 22
3.4.1 Primary data collection 223.4.2 Secondary data collection 23
3.5.1 Questionnaire 233.5.2 Key Informative Interviews 23
3.6 Ethical Consideration 233.7 Validity and Reliability 23
3.7.1 Validity 233.7.2 Reliability 24
3.8 Data Analysis 243.9 Limitation of the Study25
CHAPTER FOUR........................................................26PRESENTATION OF STUDY FINDINGS......................................26
4.0 Introduction 264.1 Respondents’ Bio Data 26
4.1.1 Gender of respondents264.1.2 Age group of the respondents 26
4.1.3. Marital Status of the Respondents 274.1.4. Education levels of respondents. 28
4.1.5 Number of years worked in the bank by the respondents 28
viii

4.1.6. Number of respondent’s children294.1.7 Nature of bank account you have with the Bank 29
4.2.1The relationship between Customer Care and Customer Satisfaction30
4.2.1 The relationship between Customer Care and Service Quality 304.2.3 The relationship between Customer care, Customer Perception and Customer satisfaction 314.2.4 The relationship between Customer Care, Service Quality, Customer perception and Customer satisfaction 314.3 Regression analysis 32
4.4 Factor Loadings of Customer Care, Service Quality, Customer Perception and Customer Satisfactio 32
4.4.1 Factor analysis results: Customer Care 334.4.2 Factor Analysis Results of Service Quality 34
4.4.3 Factor Analysis Results of Customer Perception 354.4.4 Factor Analysis Results of Customer Satisfaction 36
4.5 Group discussion on the challenges customers face in the bank, relationships between independent variables and dependent variable
37CHAPTER FIVE........................................................41
INTERPRETATION OF THE FINDINGS......................................415.0 Introduction 41
5.1 Bio Data 415.1.1 Gender of the respondents 41
5.1.2 Age group of the respondents 415.1.3 Marital Status of the respondents 41
5.1.4 Education levels of respondents 425.1.5 Number of year’s respondents has worked in the bank 42
5.1.6 Number of children respondents had 424.1.7 Nature of account respondents have in the Bank 43
ix

5.2 The Relationship between Customer Care and Customer Satisfaction43
5.3 The Relationship between Customer Care and Service Quality 435.4 The Relationship between Customer Care, Customer Perception and Customer Satisfaction 445.5 The Relationship among Customer care, Service quality, Customer Perception and Customer satisfaction. 44CHAPTER SIX.........................................................45
CONCLUSION AND RECOMMENDATIONS......................................456.1 Introduction 45
6.1.1 Conclusion. 456.2 Recommendations 45
6.2.1 The relationship between Customer Care and Customer Satisfaction45
6.2.2 The relationship between Customer Care and Service Quality 466.2.3 The relationship between Customer Care, Customer Perception and Customer Satisfaction 476.2.4 The Relationship among Customer care, Service quality, Customer Perception and Customer satisfaction. 486.3 Suggested Areas of further research 49
REFERENCES..........................................................50APPENDICE...........................................................55
x

LIST OF TABLESTable 3.1: Population size..........................................21
Table 3.2: Proportionate Stratified Random Sampling.................22
Table 4.1: Gender by respondent distribution........................26
Table 4.2 Age of the respondents....................................26
Table 4.3 Below shows marital status of Respondents.................27
Table 4.4 Below shows educational level of Respondents..............27
Table 4.5 Below shows number of years worked in the Bank by
Respondents.........................................................28
Table 4.6 Below shows the respondent’s number of children...........28
Table 4.7 Below shows the nature of bank account with the bank......29
Table 4.8 Spearman’s zero order correlation matrix..................30
Table 4.9 Below shows the regression model for Customer Care, Service
Quality Customer Perception and Customer satisfaction...............32
Table 4.10 Factor Analysis Results of Customer Care.................33
Table 4.11 Factor Loadings of Service Quality.......................34
Table 4.12 Factor Loadings of Customer Perception...................35
Table 4.13 Factor Loadings of Customer Satisfaction.................36
xi

LIST OF FIGURESFigure 1: Conceptual Frame Work......................................6
xii

CHAPTER ONE
INTRODUCTION AND BACK GROUND
1.0 IntroductionThe Ugandan banking sector is characterized as a dynamic
environment that makes it difficult for banks to grow and to
maintain their market share. The growth in the number of banks
has on one hand increased competition and on the other hand
heightened the standards that need to be met in order to gain a
competitive advantage. In addition, the competition between banks
is a premise of customers’ ever growing expectations. Customers
are now more informed and they expect their banks to meet their
needs when, how and where they want. Otherwise, there is the risk
that a bank loses market share in favor of its competitors.
Considering the above mentioned issues, one major concern of
Ugandan banks should be customer retention. Long-term
relationships between a bank and its customers, is proof of the
financial institution’s efforts to offer high quality services
that satisfy customers’ demands. Moreover, customer retention is
a necessary input for improving business performance. If they
expect their banks to meet their needs, then when, how and where
do they them want from. Otherwise, there is the risk that a bank
loses market share in favor of its competitors (Karatepe et al.,
2005, p. 373).
1

The B.O.U (Bank of Uganda 2012) reveals that the number of bank
branches in Uganda has reached 400 networks and almost 600
automated teller machines, about 38 percent of the commercial
bank branches located in Kampala with the distribution about even
in the Central, Eastern and Western parts of the country. The
Northern part of the country has about 11 percent of commercial
bank branches, largely because of several years of conflict that
severely affected economic activities in the region. Banks’
territorial expansion is a proof of their desire to be closer to
their customers and to reduce the average time a customer has to
wait for a service to be performed. Besides, territorial
expansion helps banks to be “more present” in customers’ minds
and, as a result, to be perceived as powerful institutions.
Moreover, in Uganda, many persons still do not have access to
internet, or even if they do, very few perform banking operations
via Internet Banking. In addition, there still are persons that
are reluctant to using ATMs or to paying with their cards. Thus,
the number of territorial units, their location and the comfort
inside the bank unit may be important factors in appreciating a
bank’s services quality level as well as necessary inputs to
foster penetration and increase market share.
Customers perceive little difference between banking products
(Ravichandran et al., 2010; Neilson and Chadha, 2008) and hence
banks face the risk of losing customers in favour of competitors
who may copy an offer easily. Under these circumstances, the
competitive environment in which Ugandan banks act, force them to2

consider quality a critical aspect for their success. Services
quality results in customer satisfaction which ‘leads to market
share and profits’ (Burch, Rogers et al., 1995, p. 1) and to
loyalty which is a must for long-term relationships between
customers and banks. It is therefore necessary to continuously
define the determinants of customer satisfaction, which of them
have a greater impact, and then to decide whether improvements
need to be made in order to increase their quality level or not.
Bearing in mind for Uganda it is expected that bank customers
value interpersonal relationships with bank employees. Thus,
human aspects are probable to have a greater impact on customer
satisfaction than physical evidence elements and processes
(expressed in terms of convenience and efficiency).
1.1 Back groundCustomer care is a customer service that seeks to acquire new
customers, provide superior customer satisfaction and build
customer loyalty, Eihtamal (2000). Customer care services can
also be defined as a process that starts right from targeting
customers through market segmenting to ensure that a customer is
satisfied to undertake related purchase, Ballinne (2007).
Customer care services play an important role in an organization
ability to generate income and revenue and are one of the
elements of the product mix (Balerman, 2005).
Service quality is a concept that has aroused considerable
interest and debate in the research literature because of the
3

difficulties in both defining it and measuring it with no overall
consensus emerging on either (Wisniewski, 2001). Quality
standards are one of the measurement tools of service quality,
where quality is defined as the totality of features and
characteristics of a product, process or service (Islam & Ahmed,
2005). Firms with high service quality pose a challenge to other
firms. Many scholars and service marketers have explored
consumers’ cognitive and affective responses to the perception of
service attributes in order to benefit by providing what
consumers need in an effective and efficient manner.
Organizations can business excellence through quality control in
services (Shahin, 2010). The quality of services offered will
determine customer satisfaction and attitudinal loyalty
(Ravichandran et al. 2010).
Customer satisfaction is an evaluative process, it is defined as
“… a judgment that a product of service feature, or the product
or service itself, provided (or is providing) a pleasurable level
of consumption related fulfillment, including levels of under or
over fulfillment” (Swaid 2007; Hom 2002). Customer satisfaction
is “captured as positive feeling (satisfaction), indifference or
negative feelings (dissatisfaction)” (Bhattacherjee, 2001) cited
by (Swaid 2007). It is a short-term attitude that can readily
change given a constellation of circumstances. Therefore,
satisfaction is not a static idea and it changes as soon as a
client finds a better deal that meets his expectations. In this
perspective, firms must focus on customer satisfaction, studying
4

and determining as soon as possible the customer satisfaction
level, to adjust the product to customer needs. Indeed, customer
satisfaction has great significance for the future of an
institution and it is seen as a basis for securing market
position and achieving other objectives of the institution
(Koraus, 2002).
1.2 Statement of the ProblemCustomer care, service qualities are vital components for both
initial and ongoing development of customer satisfaction in the
banking sector in the world and Uganda in particular (Nanziri,
2011). Bangladesh especially Private Commercial Banks have tried
to ensure provision of customer cares service, giving special
facilities and ensuring customer satisfaction (Ataur, 2011). And
in Uganda, Banks like Stanbic bank, Bank of Africa, Post Bank,
House Finance Bank, Centenary Bank and DFCU are striving to
satisfy their customers and have put in place easier banking
services by introducing internet banking, electronic banking,
installed ATMs with Luganda instruction, front desks for
inquiries and issue bank statement at end of the month to update
customers about their monthly transaction so to promote accuracy,
flexibility.
Despite all the above, there is apparent decline in customer
satisfaction in banks being observed by the increasing number of
customer complaints as evidenced in sustainability and black
economic empowerment report 2005.The number of complaints in 2004
5
were (11,183) and (27,260) in 2005 as a result of poor customer
care services quality like break down of ATM machine, lack of
empathy, un reliability offered by the banks and standing in line
for a long time in the banks which is non-productive and a sheer
waste of time resulting in frustration, demoralization and
incredibly expensive, Satendra (2011). What is more, each of the
clients who recall such experiences, verify to the fact that the
waiting-line experience in a service facility significantly
affects their overall perceptions of the quality of service
provided in the banks, Maister (2005).
The purpose of this study was to investigate Customer Care,
Service Quality, Perception and customer satisfaction of
commercial bank in Uganda.
1.3 Objectives of the study
1.3.1 General ObjectiveTo examine the relationship between Customer Care, Service
Quality, Perception and Customer Satisfaction in the Banking
sector of Uganda.
1.3.2 Specific Objectives i) To examine the relationship between Customer Care and Customer
Satisfaction.
ii) To establish the relationship between Customer Care and
Service Quality.
iii) To assess the relationship between Customer Perception and
Customer Satisfaction.
6

iv) To study the factor structure of Customer Care, Service
Quality, Customer Perception and Customer Satisfaction.
1.4 Research Questions i) What is the relationship between Customer Care and Customer
Satisfaction?
ii) What is the relationship between Customer Care and Service
Quality?
iii) What is the relationship between Customer Perception and
Customer Satisfaction?
iv) What is the factor structure of Customer Care, Service
Quality, Customer Perception and Customer Satisfaction?
1.5 Scope
1.5 Content ScopeThe study focused on customer care, service quality as
independent variables, Customer Perception as the intervening
variable and customer satisfaction as the dependent variable in
the Ugandan banking industry.
1.5.1Geographical ScopeThe study was carried out from banks around Kampala in particular
Post Bank Uganda located along Jinja road in Kampala and Housing
finance located along Kampala road. The researcher chose these
banks because he is familiar with them and therefore, access to
the necessary information/ data was easy for the researcher.
7

1.5.2 Time ScopeThe study covered the period of review from 2008 – 2011 and
collection of data from commercial banks will run from July -
September 2012.
1.6 Significance of the Study i) The study has provided an understanding of customer care
service quality and customer satisfaction in commercial banks in
Uganda; and their implications to financial performance, which
information is required by researchers, consultants and
academicians.
ii) The study has benefited policy makers/Government as it will
expose the challenges of customer care service quality in
commercial banks in Uganda hence forming a basis for future
planning.
iii) The study has benefited the banking industry in coming up
with capacity building mechanisms to help practioneers overcome
the barriers that impede better service quality delivery to
customers in commercial banks in Uganda.
Figure 1: Conceptual Frame Work8

Description of the model
The conceptual framework explains the underlying process, which
is applied to guide this study. Parasuraman et al., (1988), used
the SERVQUAL model with five dimensions; Tangibles, Reliability,
Responsiveness, Assurance and empathy, representing service
quality and customer satisfaction. Mbonigaba (1995) used four
dimensions (communication, courtesy competence and credibility)
to measure customer care and customer satisfaction. Nanziri
Betty, (2011) Quality services and customer satisfaction
considered four dimensions (commitment, loyalty retention and
recommendation of service).
9
Customer Care
CommunicationCourtesyCompetenceCredibility
Service Quality
Tangibles
Reliability
Assurance
Empathy
Responsiveness
Customer Satisfaction
CommitmentLoyaltyRetentionRecommendation of service
Customer Perception
AttitudeBehaviourAwareness
Impression

CHAPTER TWO
LITERATURE REVIEW
2.0 Introduction This chapter reviews the existing literature put forward by
different scholars and personalities on customer care, service
quality and customer satisfaction as well as the relationship
among the three variables.
2.1 The relationship between Customer Care and Customer Satisfaction
2.1.1 Customer Care Kotler (1998) described customer care as a service in any
activity or benefit that one party can offer to another that is
essentially intangible and does not result in the ownership of
anything. According to Ngahu (2001), customer care can be defined
as any good service rendered to a customer in the process of
selling a product or service. Ngahu further explains customer
care as the “activities” which are offered to sale or are
provided in connection with the sale of goods.
According to Balunywa (1995), any service rendered to a customer
is the one referred to as customer care. Indeed so many scholars
have attempted to describe customer care but the gist of the
whole concept of customer care from such definition above is that
any one in business must not only concentrate on the product he
or she is offering, but must accompany it with great service to
10

the targeted customers. Balunywa observed that the concept of
customer care is still new and most managers are yet to embrace
it.
Mbonigaba (1995) wrote that there is need to make customers
satisfied since they help business earn. In most offices,
customer care starts with the front office clerks. The
secretaries at the front office should be made to appreciate the
importance of customer care because this is the best chance for
any business to create the first impression of good service to
its customers. Kotler (1998) observed that customer satisfaction
depends on the extent to which customer’s expectations about the
services are fulfilled and these expectations are not static.
Kotler further noted that good customer service among other
things entails keeping the promises made to customers, and not
guaranteeing things that cannot be possible given the nature of
the operating environment. To provide an excellent service to
customers, the organization should deliver beyond the
expectations of the customers.
Santon (1999) argues that, to provide good customer services, the
organization in designing must focus wholly on the customer. This
brings us to who actually is the customer. A customer is an
individual or organization that makes a purchase decision.
Drucker (1994) identifies customer creation as one of the major
objectives of the business. Without a customer, other components
of organization will not be viable for long. Organizations
11

therefore design customer care programs seeking to acquire new
customers, provide superior customer satisfaction and build
customer loyalty.
The determinants of Customer Care include Competence,
communication and credibility as explained below.
CompetenceThis was defined by Francis (1996) as the possession of the
required skill and knowledge performs a service. It involves
research capacity, knowledge and skills of operational support
staff. Competence is the skill, expertise and professionalism
with which the services are executed. According to Robert (1997),
competence includes the carrying out of correct procedures,
correct execution of customer instruction, degree of product and
service knowledge exhibited by contact staff, rendering of sound
advice and the general ability to do a good job.
CommunicationRobert (1997) described communication as the ability a service to
communicate with a customer in the away he/ she will understand.
It includes the clarity, completeness, and accuracy of both
verbal and written information to customer and the ability to
listen and understand the customer. According to Ntayi, (1999),
Communication means keeping customer informed in the language
they can understand and listen to them. It may mean the company
going that extra mile to adjust its language for different
customers, availability of inquiries desk, informing of account
12

changes, and clarity of staff answers and ease of understanding
letters are great consideration to effective communication
(Galloway, 1994). In Uganda, as far as retail banking is
concerned, banks like Stanbic bank, Bank of Africa, Centenary and
DFCU installed ATMs with Luganda instructions; they all have
front desks for inquiries and issue bank statements at end of the
month to update customers about their monthly transactions.
CredibilityCredibility involves trustworthiness, believability and honesty.
It’s about having the customers best interests at heart,
contributing to credibility is a company name, reputation and
privacy discussions (Francis 1996). Balunywa (1995) highlights
that credibility mean trust, assurance, integrity and security.
Say what you mean and mean what say. This is more important in
retail banking, an instruction that handles the payment system
keeps customer’s money.
The Justification for Customer Care and Customer Satisfaction is
as here render;
Customer Care as a means of Customer Satisfaction Growth of business in most service industries is built up on a
reputation for providing customer satisfaction through a good
standard of attention and case. This is closely associated with
exercising fiduciary responsibilities. Maintaining good standards
of customer care is as fundamental to marketing as the
development and launch of a new product or service. But
unfortunately, providing a high standard of customer care cannot13

be qualified vary basically. As a result, it is often regarded as
an operation rather than marketing function.
Fostering Customer opinions as a means of CustomerSatisfaction
Customers are the lifeblood of any business. Customer care
therefore is paramount. The ways in which services to publish can
be improved are numerous and organizations should incur
considerable expense researching then servicing image and
reputation. The public relations department at an organization
usually has the main task of ensuring that the mainstream
marketing efforts are fully supported through winning the esteem
of customers and the public at large. Without a good reputation
for understanding customer problems and requirements, an
organization will lose existing customers and fail to attract at
least its market share of new business. Customers who are not
given an opportunity to business can do damage to the
organization by the word of mouth, because of influence they have
on the existing potential customers. A complaints department is
essential for the success in any service business responsive to
complaints and diligent in finding out facts (Davidson, 1978).
Customer Care as a means of business survivalBusiness survival is the continued existence, sustenance and
growth of business entity. Organizational survival calls for
innovation managerial skills in the exertion of the various
business activities/ functions in a competitive environment. It’s
14

through such skills that an organization can adapt to its
competencies and eventually out rival its potential and actual
competitors. In the provision of products and services, it is
usual for both the seller and the buyer to come into contact.
It’s during this contact that clients form their impression of
the quality of services that the organization is delivering. This
may be termed as the “moment of truth” (could1984 and Zemke 1985)
the contact with the customer puts the organization to test its
performance, quality of the product and service and the results
of the test are positive to the organization which offers a high
standard customer care services.
2.2 The relationship between Customer Care and Service Quality
2.2.1 Service Quality Service quality is considered an important tool for a firm’s
struggle to differentiate itself from its competitors (Ladhari,
2008, p.172). The relevance of service quality to companies is
emphasized here especially the fact that it offers a competitive
advantage to companies that strive to improve it and hence bring
customer satisfaction.
Service quality has received a great deal of attention from both
academicians and practitioners (Negi, 2009) and services
marketing literature service quality is defined as the overall
assessment of a service by the customer (Eshghi et al., 2008,
p.121). Ghylin et al., (2008, p.76) points out that, by defining
service quality, companies will be able to deliver services with
15

higher quality level presumably resulting in increased customer
satisfaction. Understanding service quality must involve
acknowledging the characteristics of service which are
intangibility, heterogeneity and inseparability, (Parasuraman et
al., 2004, p.42); (Ladhari, 2008, p.172). In that way, service
quality would be easily measured.
According to Zeithaml and Parasuraman, (2004), the measurement of
service quality should be done with the purpose to identify the
gaps between expectations and perceptions or the shortfalls in
customers’ perceptions of services’ performance. In this respect
they developed the SERVQUAL model, an approach that supposes the
measurement of expectations and perceptions on five dimensions as
follows: Assurance, Empathy, Reliability, Responsiveness and
Tangibles. The SERVQUAL model is ‘probably the best-known,
universal scale designed to measure the perceived service
quality’ (Bahia and Nantel, 2000, p. 84). Another model that has
been proved valuable, although not applied at the same extent as
SERVQUAL, is Technical/Functional Quality model. According to
Grönroos, technical quality refers to the outcome, to what is
being offered while functional quality considers the way a
service is provided (Lassar, Manolis et al., 2000)
Douglas & Connor (2003, p.165-166), emphasis that the consumer
who has developed heightened perception of quality has become
more demanding and less tolerant of assumed shortfalls in service
quality and identify the intangible elements (inseparability,
16

heterogeneity and perishability) of a service as the critical
determinants of service quality perceived by a customer. It is
very vital to note here that, service quality is not only
assessed as the end results but also on how it is delivered
during service process and its ultimate effect on consumer’s
perceptions (Douglas & Connor, 2003, p.166).
To sum up, we must add that most of the quality dimensions in all
cases refer to personnel attributes and to interpersonal
interaction. This could be explained by the fact that most often
cannot be entirely separated from the provider and hence
customers find themselves in the same place with a firm’s
employees. Therefore, ‘the nature of the interaction between
service providers and customers (i.e. functional quality) are key
contributors to customers’ evaluations of the overall service
offering’ (Eisingerich and Bell, 2008, p. 257) and thus, bank
service quality (considering the customer-bank relation within
territorial units) can be assessed in terms of direct contact
with personnel, processes (expressed through convenience and
efficiency) and physical evidence.
Classification of service quality has been addressed by a number
of scholars. Lehtinen (1982), identified three (3) dimensions of
physical quality, corporate quality and interactive quality,
Perasuraman et al (1985) identified the following determinants;
reliability, tangibles, assurance, empathy and responsiveness
17

Responsiveness This is the willingness to provide help and prompt service to
customer (Parasuraman et al, 1999). Responsiveness concerns the
willingness or readiness of employees to provide a service in
such away as; mailing a transaction slip immediately, speed on
mortgage conformation, updating accounts promptly (Francis,
1996). Responsiveness has been shown to an important factor
Aukiran (1994), suggest that efforts to increase speed of
processing information and a customer is likely to a positive
effect on customer satisfaction in retail banking. Balunywa,
(1995) emphasizes that when a customer has a need, meet it, be
easy accessible available to customer.
Reliability of Service deliveryThis refers to the processes, procedures and systems that would
make service delivery a seamless experience (Sarashchandar et al,
2002). It highlighted whether the service delivery process wads
standardized, streamlined and simplified, so customers could
receive the service without any problem. The structured aspects
of service delivery processes have not ever been adequately
studied (Sarashchandar et al, 2002). In literature there were few
marketing scholars who have tried to focus on the importance of
the structural content of service delivery in service quality
evaluation ( Dauaher and Mattson, 1998).T his structural content
of the service delivery process is considered important in
service quality evaluation ( Dauaher and Mattson,1998).
18

Tangibles of ServicesThey are one of few dimensions that have been consistently used
by different researchers (Bahia and Nantel, 2000). However
tangibles refer to physical facets of service facility equipment,
machinery signage, communication material (Bahia and Nantel,
Parasuraman et al, 1985).It included the physical evidence of
service except the personal appearance of staff which was
included in human element dimension, employees and customers are
usually influenced by the tangible facets of service in
physiological, psychological, emotional and cognitive ways
( Bitner, 1992). The intangible aspects of the staff customer
interface have a considerable influence both negative and
positive in the service quality (Johnston, 1995). Tangibles are
associated with the impact on the customer’s inferences about
what service should be like and therefore will influence the
evaluation of service quality (Parasuraman et al, 1993).
Customer’s perception of tangibles was generally considered
important in the case of the banks than others.
Trying to justify Customer Care and Service Quality, Bara (2001)
says that the only reason for businesses to exist is to serve a
customer. A customer is a person who enables people to earn a
living and also enables government to exist and function.
Therefore, there is need to have quality customer service to
satisfy the customers. Quality customer care is associated with
an attitude; a way of thinking and a philosophy of doing business
that emphasize a strong commitment and sincere dedication to
19

satisfying customers. (Ngahu2001) advocates for making customer
satisfaction a priority of the company. It calls for the adoption
of a customer orientation Ngahu (2001) and Balunywa (1995) agree
that, the main reason customers choose one product over another
is probably because it better meets their need in such a way as
ease of use, service, or ability to do what it promises to do.
Ngahu (2001) further noted that another reason to become customer
driven is to build market share. Research shows that you cannot
maintain market share with unique features alone, as your
competitors will imitate you. Sustainable market share growth is
achieved through loyal customer and excellent service. To be
customer driven means to position customers at the heart of your
operations and to let their needs guide all your decisions,
policies and strategies.
According to Zike (2001), in his study of what makes a company
excellent, he interviewed 43 high performing companies. He wanted
to find out what makes them so successful in an increasingly
changing environment where many companies are facing closure. He
found out that all high performing companies share a set of basic
operating principles, some of which emphasized customer driven
service. He found out that excellent companies provide
unparalleled customer service, quality and reliability. Moreover,
they exhibit a strong commitment to customer satisfaction and
tend to stick to the business they know.
20

Customer orientation is reflected in the quality that customers
get at all levels of the company (Ekpei 2001).Customer care helps
to enhance the corporate image, customer relations, operational
efficiency, competitive advantage and profitability. Moreover, it
enables to cope with a rapidly changing environment and highly
demanding customers. These are realized because the company that
is customer oriented emphasizes the provision of what customers’
need that is quality and efficiency in service.
According to Mulwana (2002), in paper presentation at Uganda
manufacturer’s seminar, he noted that customer service is a major
tool for market penetration. Mulwana like Balunywa (1995) noted
that businesses always look forward to win, to increase their
turnover every other time and that this necessitates basic
strategies that can attract and retain customers and the major
tool is high quality customer services. Mulwana emphasized that
high quality customer care delights and satisfies customers and
the biggest benefit is that it creates loyal customers. Mulwana
therefore noted that the process of customer care means
delivering quality service that can satisfy the customer.
However, companies often fail to recognize the importance of
staff care, who are also company customers (Balunywa1995).
Balunywa identified two types of customers who enjoy the
organizations services that is, the external people who buy from
the business and those internal to the organization, who are the
employees, those that can make things happen in the organization
21

and deal with the external ones. Balunywa called the first type
“kings” and the second type as “royalty”. He said that the
winning organizations are characterized by a committed customer
base, healthy profits and happy people. Balunywa further noted
that customers are likely to receive good service if the staffs
delivering them are happy with their work. Employers who treat
their staff like kings are more likely to have a motivated and
committed workforce that is interested and willing to deliver
quality service.
2.3 The Relationship between Customer Care, Customer Perception and Customer Satisfaction
2.3.1 Customer PerceptionCustomers’ perceptions are formed subsequent to their experience
of the services received from an organization. Furthermore, the
level of previous customer experience with certain services that
serve by other firms can impact on customers’ perception of
service quality. Researchers believe that perception and
expectation are strong relative concepts (Mersha, 1992; Avkiran,
1994). Customers’ perceptions results from how customers
recognize service quality; customers’ expectations however can be
shaped through the influence of other people.
Perception as a dynamic variable occurs at different stages of
the purchasing process experienced before purchase, at the moment
of purchase, at the time of use, and after use. For each stage
the valuation made may be different (Gardial, Clemons, Woodruff,
22

Schumann, and Burns, 1994). Recently, perceived value has been of
growing interest among marketing researchers who have been
examining the relationships among perceived value, customer
satisfaction, and behavioral intentions, as one of the most
influential measures of customer satisfaction and behavioral
intentions, whereas it has not been given much attention in the
tourism literature (Patrick and Backman, 2002). Perceived value
not only affects customer choice behavior at the pre purchase
stage but also influences satisfaction and intentions to
recommend and repurchase at the post purchase stage (Parasuraman
and Grewal, 2000).
The definitions have similarities and differences which are
mainly seen in the linking of customer value to some service. The
perspective of customer value involves a tradeoff between what
the customer receives and what they give up to acquire the
product (Hellier et al., 2003). On the other hand, customer value
takes the perspective of an organization’s customers by
considering what they want and believe that they can get from
buying and using a product or service (Woodruff, 1997). Initial
conceptualizations of value in the marketing literature were
mainly price based. For example, Thaler (1985) argued that
consumers’ value perceptions are “the result of a comparison
between various price structures, including advertised selling
price, advertised reference price and internal reference price.”
Monroe (1990) proposed that perceived overall value is “a
weighted sum of acquisition (maximum price and actual selling23

price) and transaction value (gap between the reference price and
actual price of product).” Lovelock (2000) defined it as “a
trade-off between perceived benefits and perceived costs.” Recent
research studies suggest that perceived value may be a better
predictor of repurchase intentions than either satisfaction or
quality. As the market place offers a variety of products with
ranging quality and price levels, consumers are becoming more
careful in spending their money on high value products. Moreover,
perceived value seems to drive their future behaviors such as
repurchase intent and word of mouth referrals (Brandy and Cronin,
2001).
Understanding the behavioral intentions of customers after
experiencing services is important because they are seen as a
prime determinant of a firm’s long term financial. Behavioral
intention performance and is considered a major source of
competitive advantage (Lan et al., 2004). Thus, behavioral
intentions are important indicators of customers’ future
behaviors, trigger future behaviors (Ajzen and Fishbein, 1980)
and defined as “a deeply held commitment to repurchase or re-
patronize a preferred product or service in the future” (Oliver,
1997). Many studies have examined the antecedents of repeat
purchase intentions. Thus, understanding the determinants of
customer retention can facilitate management’s focus on the major
factors leading to customer intentions. Quality, perceived value,
and satisfaction all have been shown to be good predictor of
behavioral intentions (Patrick, 2004) 24

Boulding et al. (1993) used repurchase intention and word of
mouth to evaluate consumer’s post purchase intentions. Repurchase
intention is the process of an individual purchasing goods or
services from the same firm (Hellier, Geursen, Carr and Rickard,
2003) and the reason for repurchase is primarily based on past
purchase experience. Word of mouth is a process in which
consumers who have used a certain product or service pass their
experiences through word of mouth to consumers planning to
purchase the product or service (Westbrook, 1987). Favorable
behavioral intentions encompass three dimensions which are, word
of mouth, purchase intentions and price insensitivity, and they
combine to form customer loyalty (Olsen, 2007). Meanwhile, Ha and
Jang (2010) focused on revisit intentions (hedonic value and
utilitarian value), word of mouth, and willingness to recommend
as specific forms of behavioral in a Korean restaurant.
Behavioral intentions represent as customer’s loyalty which is an
important goal for a company’s long term sustainability.
Retaining existing customers usually has a much lower associated
cost than winning new ones. Furthermore, loyal customers are more
likely to recommend friends, relatives or other potential
customers to a service by acting as free word of mouth
advertising agents (Shormaker and Lewis, 1999).
Behavioral intentions can be defined and assessed by both
attitudinal and behavioral measure. The attitudinal measure
25

refers to a specific desire to continue a relationship with a
service provider while the behavioral perspective refers to the
concept of repeat patronage (Oliver, 1999). The author also
indicated that customers can develop an attitude based on prior
information without actual experience, so they frequently
increase biases for or against providers based on the provider’s
image in the marketplace. This attitude is strongly related to
the customers’ intentions to re-patronize the service and to be
engaged in word of mouth behaviors. Similarly, as the degree of
destination intention is frequently reflected in tourists’
intentions to revisit the destination, it impacts upon their
willingness to recommend it (Chen and Tsai, 2008).
2.3.2 Customer SatisfactionAccording to existing definitions and approaches, customer
satisfaction can be analyzed as a general/overall judgment that a
customer makes after consuming a product or a service. Customer
satisfaction is perceived as “psychological state (feeling)
appearing after buying and consuming a product or service …”
(Merouane 2008/2009). Thus, customer satisfaction reflects “a
pleasure resulting to product’s consumption, including under or
over fulfilment level” (Hom, 2002). According to Olivier’s
argument , customer satisfaction does not mean only positive
feeling, it could also lead to a negative or neutral feeling
withdrew from consuming a product or a service. Briefly,
“customer satisfaction is captured as positive feeling
(satisfaction), indifference (neutral), or negative feelings
26

(dissatisfaction)” (Bhattacherjee 2001) cited by (Swaid and
Wigand 2007, Hom 2002).
When approaching customer satisfaction as a feeling, it is
important to note that it is mostly influenced by the customer’s
experience with the firm and product. In this perspective,
customer satisfaction is conceived as “the emotional state that
occurs as a result of a customer’s interactions with the firm
over time” Verhoef (2003, 32). In fact, customers are usually
comparing the product received from the firm to their own
expectations over time. If the product fulfils and performs the
customer’s expectations, customer seems satisfied. Briefly,
customer’s satisfaction is analyzed as a confirmation or not of
customer expectations (Conchon et al. 2006).
Giese & Cote, (2000, p.15) clearly state that there is not
generic definition of customer satisfaction and after carrying a
study on various definitions on satisfaction they came up with
the following definition, “customer satisfaction is identified by a response
(cognitive or affective) that pertains to a particular focus (i.e. a purchase experience
and/or the associated product) and occurs at a certain time (i.e. post-purchase, post
consumption)”. From this definition, is it clear that the
consumer’s satisfaction is determined for his/her shopping
experience in the grocery store and this is supported by Cicerone
et al., (2009, p.28) and Sureshchander et al., (2002, p.364) who
believe customers’ level of satisfaction is determined by their
27

cumulative experiences at all of their points of contact with a
supplier organization.
According to Wicks & Roethlein, (2009, p.89), customer
satisfaction can be formed through an affective evaluation
process and this affective evaluation is done following the
purchase experience by the consumer. Organisations that
consistently satisfy their customers enjoy higher retention
levels and greater profitability due to increased customers’
loyalty, Wicks & Roethlein, (2009, p.83). This is why it is vital
to keep consumers satisfied and this can be done in different
ways and one way is by trying to know their expectations and
perceptions of services offered by service providers. In this
way, service quality could be assessed and thereby evaluating
customer satisfaction.
In our study, we use customers to evaluate service quality by
considering several important quality attributes in co and we
think firms must take improvement actions on the attributes that
have a lower satisfaction level. This means customer satisfaction
will be considered on specific dimensions of service quality and
customer cares in order to identify which aspects customers are
satisfied with.
The importance of Customer Satisfaction in firms: retention and
loyalty can be discussed below; Loyalty and retention are often
analyzed as direct consequences of customer satisfaction. The two
terms express “the attachment a customer feels for a company’s
28

people, products, and services. A loyal customer is someone who
makes regular purchases, purchases across product and service
lines, refers others, demonstrates an immunity to the pull of
the competition” Griffin (1995) cited by ( Churchill 2002) .
Financial and marketing studies have supposed that satisfied
customers constitute an important asset of firm. Even if there
is not much empirical evidence, it seems that customer
satisfaction will enhance both customer loyalty and retention
through repeated purchases, less price sensitivity and costs
reduction.
In fact, when customers are satisfied , they become more
loyal and will increase their level of purchasing from the firm
over time (Verhoef 2003, 33) directly, they will also
recommend other customers to consume the firm’s products and
services . Thus, “the positive word of mouth that satisfied
customers generate influences other consumers’ future purchases”
( Gruca and Lopo 2005, 116). Satisfied customers are also
expected to be “less likely to defect to competing products as a
result of lower prices” (Fornell et al. 1996). For this
reason, “greater customer satisfaction may enable firm to
charge higher prices or at least to better resist downward
pressure on prices” (Anderson 1996 , Narayandas 1998) . Briefly ,
“ a satisfied customer reacts less sensitively to price changes
and is prepared to pay a higher price for a service that
corresponds to their requirements and conceived ideas” ( Korauš
2002, Anderson et al .2004 , 172).
29

When discussing the determinants of Customer Satisfaction, Togo
through the transformation, Lévesque (1996), identified the
drivers of customer satisfaction in retail banking to be
performance, loyalty, location, skilled employees and competitive
interest to deliver these benefits on an ongoing basic to its
existing clientele will impact on customer satisfaction.
Location
Understanding location are the customer benefits of convenience
and accessibility which are enabling factors that make it easy
for the customers to do business with the bank.
Performance
Performance yields clean and convincing directions for designing
service offerings staff development programmers and customer
complaint management systems (Levesque and Gordon, 1996). Doing
it right the first time and ensuring successful problem recovery
results in to reliability, competitive and shows that employees
are willing and ready to provide a service.
Loyalty
Eugene et al; (2000) suggested that loyalty is a deeply held
commitment to rebuy or repatronise a preferred product or service
consistently in the future despite situational influences.
According to Bloemer (1998) intangible attributes such as
reliability, competence, credibility and efficiency place a major
role in building and maintaining loyalty thus a great intent to
repurchase and likelihood of recommending the bank to others.
30

2.4 The Relationship between Customer Care, Service Quality, Customer Perception and Customer Satisfaction.
Mbonigaba (1995) wrote that there is need to make customers
satisfied since they help business to earn. In most offices,
customer care starts with the front office clerks. The
secretaries at the front office should be made to appreciate the
importance of customer care because this is the best chance for
any business to create the first impression of good service to
its customers.
Poon (1993) contends that there is need for loyalty for
customers, quality labor and ensure services are consistently
good. Keeping customers satisfied and happen through quality will
keep them coming back rather than leaving. Whereas Medilk (1992)
argues that the customer assesses quality by his or her
perceptions of the way in which services or facilities are
provided. Thus means that quality concerns visitor expectation of
services and what is received and delivered. A bad customer
service experience is used as an example of common customer
service error hence customer turnover
Parasuraman et al., (1985) suggested that when perceived service
quality is high, then it will lead to increase in customer
satisfaction. He supports that fact that service quality leads to
customer satisfaction and this is in line with Saravana & Rao,
(2007, p.436) and Lee et al., (2000, p.226) who acknowledge that
31

customer satisfaction is based upon the level of service quality
provided by the service provider.
Fen & Lian, (2005, p.59-60) found that both service quality and
customer satisfaction have a positive effect on customer’s re-
patronage intentions showing that both service quality and
customer satisfaction have a crucial role to play in the success
and survival of any business in the competitive market. This
study proved a close link between service quality and customer
satisfaction.
A consumer will decide to purchase or use of a service if he/she
perceives that the service helps enhance his/her personal
values .The sequence of values – attitude – behavior is also
applied to post-purchase behavior, i.e. customer satisfaction. -
specific evaluation (Pham Ngoc Thuy and Le Nguyen Hau, 2010.)
Customer satisfaction towards a service is an emotional feeling
after using the service which is transaction
32

CHAPER THREE
METHODOLOGY
3.0 IntroductionThis chapter presents the methods employed in data collection and
analysis. It described the research design, study population,
sampling method, sample size, data collection tools, and data
processing and analysis.
3.1 Research DesignThe study design used cross- sectional research design both
qualitative and quantitative approaches were employed to gain an
in-depth understanding on the effect of customer care service
quality and customer satisfaction in the Ugandan banking
industry.
3.2 Study PopulationThe population comprised of staff members and clients of Post
Bank Uganda and Housing Finance bank. The target population
comprised of 40 operational staff and 25 managerial staff and 95
customers from the two different banks, all totaling to 160
people. The managerial staff was involved because it is the
planning body of the organizations and the operational staff
being the implementers. Then customers were involved because they
are the reasons as to why the businesses exist. Customer care
33

policies are basically established by the managerial body and
generally utilized by the operational staff.
Table: 3. 1: Population size
Post Bank
Uganda
Housing Financial
Bank
Total
Bank Staff 30 35 65
Bank
Customers
45 50 95
160
Source: primary data
3.3 Sample size and sampling designA sample size of 76 customers, 56 bank staff members were used as
determined from Krejcie and Morgan (1970) table. Proportionate
stratified random sampling was used to select the sample of 132
respondents in two commercial banks as shown in Table 2 below.
34

Table: 3. 2: Proportionate Stratified Random Sampling
Bank/ Stratum No. of staff
banks
Sample
Size
No. of
customers
Sam
ple
SizePost Bank Uganda
30 2
7
45
34
Housing Financial
bank
35 2
9
50
42
Total
65 5
6
95
76
Source: primary data
3.4 Data Sources
3.4.1 Primary data collection The primary data collection explored the originality of data
through gathering information relevant to the study. Primary data
was obtained from respondents from commercial in Uganda. By use
of the questionnaires and interview manuals, the research
gathered data from the respondents which in fact were the primary
concern of this survey design approach.
3.4.2 Secondary data collection Secondary data collection explored the supplementary to the above
method where data was obtained especially from Annual Reports
were sourced from Bank of Uganda’s Library. The Institute of
Banker’s Library, ICPAU- Library and Commercial Banks in Uganda
commercial, dissertations, text books, the internet and other
35

materials (such as journals, news papers,) was found useful to
the study.
3.5 Research instruments
3.5.1 Questionnaire Questionnaire was chosen because of its ability to reduce any
bias and the collection of authentic data important for data
analysis. The researcher used both closed ended and open-ended
questionnaires aiming at testing the effects of Customer Care,
Service Qaulity and Customer Perception and Customer Satisfaction
in commercial banks in Uganda. Observations and Beliefs also
sought to a five-point Likert Scale, five being the highest (Tull
and Hawkins, 1993).
3.5.2 Key Informative Interviews Structured questions and open ended statements were used by the
researcher in trying to interview key customers and bank staff of
commercial banks in Uganda.
3.6 Ethical ConsiderationBefore embarking on the data collection process, the researcher
obtained an introductory letter from Cavendish University. This
letter was then presented to the Banks of concern. After getting
the clearance from the Bank’s human resource managers, the
researcher obtained the knowledgeable consent from the
respondents and informed them about the purpose of the study. The
data was aggregated to avoid having data being related to an
individual and the questionnaires were destroyed after data
analysis.
36

3.7 Validity and Reliability
3.7.1 ValidityTo ensure the validity and reliability of the instrument, the
researcher employed expert judgment method. After constructing
the questionnaire, the researcher contacted experts in this area
to go through it to ensure that the instrument is clear,
relevant, specific and logically arranged. Also a pre-test was
conducted in order to test and improve on the reliability and
validity of the instrument.
A formula for Lawshe was used to measure the validity of
research, as indicated below:
CVR = (n - N/2)/ (N/2)
CVR= Content Validity Ratio, n= number of respondents indicating
“essential”, N total number of respondents
3.7.2 ReliabilityInter-rater reliability was employed. Here research assistants
used to do content analysis for the researcher. To calculate this
kind of reliability, the researcher reported the percentage of
agreement on the same subject between his raters and that of the
assistants. However, half of the test, instrument, or survey, was
used to analyze half as if it was the whole thing. Then
comparisons of these results were taken with the overall
analysis.
Cronbach method was used to measure the validity of research
using alpha option in a numerical coefficient of reliability.
37

Computation of alpha was based on the reliability of a test
relative to other tests with same number of items, and measuring
the same construct of interest. Alpha coefficient ranges in value
from 0 to 1 was used to describe the reliability of factors
extracted from the study (that is, questions with two possible
answers) and/or multi-point formatted questionnaires or scales
(that is, rating scale: I = strongly agree, 5 = strongly
disagree). The higher the score, the more reliable the generated
scale. 0.5 was used for acceptability of reliability coefficient.
3.8 Data AnalysisThe data was collected from the field coded, edited and analyzed
using descriptive analysis options of SPSS version 11.0. The data
was then presented using Pearson’s correlation’s statistical
techniques which were used to test and establish whether there
exists a relationship between Customer Care, Service Quality,
Customer Perception and Customer Satisfaction while multiple
regression analysis was used to test the potential predictors of
the dependent variable.
3.9 Limitation of the Study i) Confidentiality and data sensitivity: some respondents
declined to give information for fear of releasing personal and
confidential information.
38

ii) Time constraints: The problem arose from the respondents who
don’t have the researcher’s time to attend to interviews and
even fill in the questionnaires. This led to limited
information from the respondent.
iii) Some respondents were unable to complete the questionnaire
by themselves because of failure to interpret the questions.
The researcher mitigated this by appointing research
assistants who administered some questionnaires.
Despite the above challenges, information was gathered after
convincing the respondents that it would be purely used for
academic research for the Masters of Business Administration.
39

CHAPTER FOUR
PRESENTATION OF STUDY FINDINGS
4.0 IntroductionThis chapter of the research report presents the findings based
on the objectives of the study; relationship between customer
care and customer satisfaction; the relationship between service
quality and customer care; relationship between service quality
and customer satisfaction. The chapter contains bio data of the
samples, relationship between variables, and regression analysis
and factor structure of all variables.
4.1 Respondents’ Bio Data
4.1.1 Gender of respondentsThe results in the table below 4.1 show the gender distribution
of the respondents.
Table 4.1: Gender by respondent distribution
Gender Frequency Percent/% Male 69 52.27 Female 63 47.73 Total 132 100.0Source: primary data
40

Table above 4.1 shows the gender demographics of the study. Total
of 132 respondents, 52.27% of the participants were males and
47.73% of the respondents were females respectively.
4.1.2 Age group of the respondentsThe table below 4.2 shows the age of Respondents
Table 4.2 Age of the respondents
Age Frequency Percent/% 18-25 31 23.48 26-35 44 33.33 36-45 34 25 46+ 23 17.42 Total 132 100.0Source: primary data
Table above 4.2 shows the age group of respondents who
participated in the study. Total of 132 respondents, 33.33% of
the participants belonged in the age group between 26-30, 25% of
the participants belonged in the age group of 36-45, 23.48% of
the participants followed in the age group of 18-25% and 17.42%
of the participants followed in the age group of 46+.
4.1.3. Marital Status of the RespondentsThe table below 4.3 shows marital status of respondents
41

Table 4.3 below shows marital status of Respondents
Marital status Frequency Percent/%
Married 70 53.03 Single 62 46.97 Total 132 100.0
Source: primary data
Table above 4.3 shows the marital status of the respondents who
participated in the study. Total of 132 participants, 53.03% of
the participants were married and 46.97% of the respondents were
single.
4.1.4. Education levels of respondents.The table below 4.4 shows educational levels of the respondents.Table 4.4 below shows educational level of Respondents
Education levels Frequenc
y
Percent/%
Primary level 3 2.27 High school level 15 11.36 Diploma 39 29.55 Graduate 51 38.64 Post graduate 24 18.18 Total 132 100.0Source: primary data
42

The Table above 4.4 shows education levels of respondents who
participated in the study. Total 132 participants, 38.64% of the
respondents were degree holders, 29.55% of the respondents were
diploma grandaunts, 18.18% of the participants were post
graduate, 11.36% of the participants were high school graduates
and 2.27% of the participants were primary graduates
respectively.
4.1.5 Number of years worked in the bank by the respondentsThe table below 4.5 shows number of years worked in the bank byrespondentsTable 4.5 below shows number of years worked in the Bank by Respondents
Length of the
service
Frequency Percent/%
0-3 21 37.5 4-6 17 30.36
7-10 11 19.64
11+ 7 12.5 Total 56 100.0Source: primary data
Table above 4.5 shows the respondents’ number of years worked in
the bank who participated in the study. Total of 56 respondents,
37.5% of the participants have worked in the bank in the range of
0-3, 30.36% of the participants have worked in the bank in the
range of 4-6, 19.64% of the respondents have worked in the bank
in the range of 7-10 and 12.5% of the respondents have worked in
the bank in the period of 11+ respectively
43

4.1.6. Number of respondent’s childrenThe table below 4.6 shows possession of children group byrespondents.Table 4.6 below shows the respondent’s number of children
Number of respondents children Fre
quency
Percent%
None
27
20.45
1–3
45
34.09
4-7
39
29.55
8+
21
15.91
Total
132
100.0
Source: primary data
The table above 4.6 shows the number of children respondents have
who participated in the study. Total of 132 participants, 34.09%
of the respondents had children in the range of 1-3, 29.55% of
the participants had children in the range of 4-7, 20.45% of the
participants had none and 15.91% of the respondents had number of
children 8+.
4.1.7 Nature of bank account you have with the BankTable below shows 4.6 the nature of bank account respondents havewith the bank
44

Table 4.7 below shows the nature of bank account with the bank
Nature of Account Frequency Percent %Savings 33 43.42Current 21 27.63Fixed 13 17.11Current & Savings 9 11.84Total 76 100.0Source; primary data
The table above 4.7 shows the nature of accounts respondents have
in the bank who participated in the study. Total of 76
participants, 43.42% of the respondents had savings account,
27.63% of the participants had current account, 17.11% of the
participants had fixed account and 11.84% of the respondents had
current and savings account
4.2 Relationship between Study Variables
Spearman correlation coefficient was used to determine the degree
of relationship between the study variables as shown in the table
2 below.
Table 4.8 Spearman’s zero order correlation matrix
45
1 2 3 4
Customer Care(1) 1.000
Service Quality(2) .418** 1.000
Customer Perception(3) .572** .465** 1.000
Customer Satisfaction(4) .592** .459** .468** 1.000

**. Correlation is significant at the .01 level (2-tailed).
Source: primary data
4.2.1The relationship between Customer Care and Customer SatisfactionTable above 4.8 showed a significant positive relationship
between Customer Care and Customer Satisfaction (r= 0.592, P-
value < 0.01). This implied that Customer Care in terms of
Communication, Competence, and Credibility enhanced Customer
Satisfaction in Commercial Banks.
The qualitative findings showed that, “Customer satisfaction results from
customer care so the two variables are interlinked, as a satisfied customer will always
become a reference point to other about the existing customer care services in a
certain bank because he/ she is satisfied” a female respondent from post
bank.
4.2.1 The relationship between Customer Care and Service QualityResults in table 4.8 above indicated a significant positive
relationship between Customer Care and Service Quality (r =
0.418, P-value < 0.01). This implied that Customer Care in terms
of Communication, Competence, and Credibility improved on Service
Quality in Commercial Banks.
The qualitative findings showed that, “Actually customer care is the
foundation to service quality, and without good customer care then service quality
loose value, so banks should try to make the bank a home for their customers but not a
46

secret place for loosing money and property through” a male respondent from
Post Bank
4.2.3 The relationship between Customer care, Customer Perception and Customer satisfactionThe above table 4.8 shows a significant positive relationship
between Customer Care, Customer perception and customer
satisfaction (r = 0.592, 0.468, P-value < 0.01). This implies
that Customer Care in terms of Communication, Competence, and
Credibility and Customer Perception in terms Attitude, Behavior,
Awareness and Impression improved on Customer Satisfaction in
Commercial Banks.
The qualitative findings showed that, “Customer value is a more viable
element than customer satisfaction because it includes not only the usual benefits that
most banks focus on but also a consideration of the price that the customer pays.
Customer satisfaction is merely a response to the value proposition offered in specific
products/markets” a female respondent from Housing finance.
4.2.4 The relationship between Customer Care, Service Quality, Customer perception and Customer satisfactionThe results indicate a positive relationship between Customer
Care and Customer satisfaction, (0.592**, p<.01) .additionally a
positive relationship exists between Customer Care and Service
Quality (0.418**, p<.01) and a significant positive relationship
between Customer Perception and Customer Satisfaction (0.468**,
p<.01) in Commercial Banks.
The qualitative findings showed that, “Customer Satisfaction comes from
customer care, service quality and customer perception as an emotional state involving47

customer evaluation of a service he/she has received from providers and his response
to it” a male respondent from Post bank.
4.3 Regression analysisRegression analysis was used to examine the level, to which
Customer Care, Service Quality, and Customer perception determine
customer satisfaction.
Table 4.9 Below shows the regression model for Customer Care, Service QualityCustomer Perception and Customer satisfaction
Model Unstandardize
d
coefficients
Standardize
d
coefficient
s
B Std .
Error
Beta T Sig
Constant -0.225 0.044 -5.161 0.000
Customer Care 0.774 0.077 0.633 9.989 0.000
Service quality 0.332 0.077 0.280 4.299 0.000
Customer
Perception
0.111 0.055 0.088 2.032 0.000
R- Square =0.405, Adjusted R- square = 0.395, F= 72.524, Sig = 0.000
Source: primary Data
The table above 4.9 show a linear relationship between Customer
Care, Service Quality and Customer Perception with Customer
48

Satisfaction (F = 72.524, Sig = 0.000). Customer Care, Service
Quality and Customer Perception explained 95.2% of Customer
Satisfaction in Commercial Banks. Customer Care (Beta = 0.633)
explained more to Customer Satisfaction, followed by Service
Quality (Beta = 0.280) and Customer Perception (Beta = 0.088).
This implied that increase in Customer Care, Service Quality and
Customer Perception led to increase in Customer Satisfaction in
Commercial Banks.
4.4 Factor Loadings of Customer Care, Service Quality, Customer Perception and Customer SatisfactionThis research used factor loading in order to check that how much
a variable loads into its corresponding factor. To understand how
each item is loaded into its relevant principal component we use
table 4.4 for the factor loading of each item. Straub et al
(2004) suggest us that value of each item in factor loading
should at least 0.40 into its relative principal component.
4.4.1 Factor analysis results: Customer Care
Table 4.10 Factor Analysis Results of Customer Care
Variables Competenc
e
Credibili
ty
Communicatio
n
The bank’s employees have the
politeness, respect, consideration, and
friendship when doing their job.
0.
740
49

The employees possess required skills
and knowledge to perform the service.
0
.669
The bank arrange special care to special
customer
0
.481
Are you satisfied by the employee’s
behaviour of showing consistently
courteousness towards you?
0.41
5
The bank’s employees are trust worthy,
honesty, believable, that is, have
customers’ best interest at heart.
0.52
4
Are you satisfied by the service of
handling customer’s service problems?
0.54
3
Communication; keeping customers’
information in language they can
understand.
0.451
Eigen Value
7.15
0.3
38
0.230
Variance %
79.38
4.2
3
2.88
Cumulative
79.38
83.
60
96.48
Source; primary data
Table above 4.10, shows the factor analysis results of Customer
Care variables, three factors were extracted, component one
50

explains 79.38%, the second shows 4.23%, and the third 2.88% of
the variance of Customer Care. The important factors to address
under competence are; Bank has politeness, respect,
Consideration, and friendliness when doing their job (0.740),
Bank possess required skills and knowledge to perform the service
(0.669), and Bank arrange special care to special customer
(0.481). Results in the second credibility are explained by; Are
you satisfied by the employee’s behavior of showing consistently
courteousness towards you? (0.415), the bank’s employees are
trust worthy, honesty, and believable, that is, having customer’s
best interest at heart (0.524) and Are you satisfied by the
service of handling customer’s service problems? (0.543) and
communication is explained by; the bank keeps customers
information in language they can understand (0.451).
4.4.2 Factor Analysis Results of Service QualityTable 4.11 Factor Loadings of Service Quality
Variables Reliabil
ity
Tangibl
e
Responsivene
ss
Assuranc
e
The bank has operating hours
convenient to all their
customers.
0.62
1
The bank provides it services at
the time they promise to do so
with clients.
0.50
2
Employees are well dressed and
appear neat to do business.
0.6
88
51

Employees are willing/readiness
to provide service accessibility.
Approachability and ease of
contact.
0.44
1
Customers feel safe in
transactions with Banks
0.428
Eigen Value 5.31
2
0.2
90
0.1
77
0.108
Variance % 88.5
4
4.8
3
2.9
43
1.804
Cumulative 88.5
4
93.
38
96.
32
98.12
Source; primary data
Table above 4.11, shows the factor analysis results of Service
Quality variables, four factors were extracted component one
explains (88.54%), the second shows (4.83%) , the third shows
(2.94%) and last one (1.80%) of the variance of Service Quality.
The important factors to address under reliability are; the bank
has operating hours convenient to all their customers (0.621) and
the bank provides it services at the time they promise to do so
with clients (0.502). A result in the second one is tangible and
is explained by; Employees are well dressed and appear neat to do
business (0.688).Responsiveness explained by; Employees are
willing/readiness to provide service accessibility,
approachability and ease of contact (0.441). Assurance is
52

explained by; Customers feel safe in transactions with the Bank
with (0.428).
4.4.3 Factor Analysis Results of Customer PerceptionTable 4.12 Factor Loadings of Customer Perception
Variables Awareness Behavior Intenti
on
Employees of the bank try to know what
customer needs are.
0.65
01
The Bank respects gender diversity and
special care for special people (pregnant
women, sucking mothers and disabled
personnel)
0.61
5
Employees in the bank are sympathetic and
reassuring, when customers have problems.
0.546
The bank has a good reputation, well-
trained and presentable employees
0
.623
Eigen Value 2.73
2
1.79
1
0
.540
Variance % 63.
26
45.7
9.84
Cumulative 63.
26
85.5
3
9
3.45
Source; primary data
53

Table above 4.12, shows the factor analysis results of Customer
Perception, three factors were extracted component one explains
63.26%, the second shows 45.72% and last one 9.84% of the
variance of Customer Satisfaction. The important factors to
address under Awareness are; Employees of the bank try to know
what customer needs are (0.6501) and the Bank respects gender
diversity and special care for special people (pregnant women,
sucking mothers and disabled personnel) (0.615). A result in the
second is Behavior explained by; Employees in the bank are
sympathetic and reassuring, when customers have problems (0.546).
And Intention is explained by; the bank has a good reputation,
well- trained and presentable employees (0.623).
4.4.4 Factor Analysis Results of Customer SatisfactionTable 4.13 Factor Loadings of Customer Satisfaction
Variables Commitment Loyalty Retentio
n
Factors like communication, accessibility
and location have enabled customers to do
business with the bank.
0.543
Customer psychological commitment towards
the brand
0.514
Attention is put on the customer
complaints so as to retain the existing
customers and attract new ones and
consistent quality services
0.
642
54

Recommendation of the service; quality
controls are put in place in order to
avoid unsatisfactory performance and
reflect high value so as satisfy the
customers.
0.6
76
Eigen Value 5.645 0.
652
0.4
23
Variance% 77.65 8.
75
5.8
5
Cumulative 77.65 86
.6
94.
54
Source; primary data
Table above 4.13, shows the factor analysis results of Customer
Satisfaction variables, three factors were extracted component
one explains 77.65%, the second shows 8.75% and last one 5.85% of
the variance of Customer Satisfaction. The important factors to
address under Commitment are; Factors like communication,
accessibility and location have enabled customers to do business
with the bank (0.543) and Customer psychological commitment
towards the brand (0.514) Results in the second is Royalty
explained by; Attention is put on the customer complaints so as
to retain the existing customers and attract new ones and
consistent quality services (0.642). And Retention is explained
by; Recommendation of the service; quality controls are put in
place in order to avoid unsatisfactory performance and reflect
high value so as satisfy the customers. (0.676).55

4.5 Group discussion on the challenges customers face in the bank, relationships between independent variables and dependent variableThe respondent were asked to give they view on challenges faced in the bank and relationships among variables in the study in Table 4.7
The table4.14 below shows the challenges faced in the bank and relationships among variables. Items Number of
citations byrespondents
Percent
Queuing for long hours for
services in the bank.
23
60.8
Getting access to their accounts
information in the bank.
21
39.13
Welcoming, trustworthy,
assurance and communication
customer care practices could be
good to find in the bank
27
57.58
Customer satisfaction results
from Customer Care services.
31
68.04
Customer Care and Service
Quality are interlinked so one
leads to the other.
23
61.4156

Good Services will lead to
person value perception of the
bank’s outcome to person
satisfaction.
24
56.7
Customer Satisfaction is an
outcome of Customer Care,
Service Quality and a golden
factor that can influence on
Customers that is Perceived
value.
29
66.21
# Multiple response
A majority of the respondents (60.87%) attributed to standing for
long hours for services in the bank ` and (39.13) accessing to
their accounts information in the bank out of 115 respondents.
(57.58%) participants responded that welcoming, trustworthy,
assurance and communication customer care practices could be good
to find in the bank). Upon relationships, (68.04%) responded that
customer satisfaction results from Customer Care services,
(61.41) responded that Customer Care and Service Quality are
interlinked so one leads to the other, (56.7) responded Good
Services lead to person value perception of the bank’s outcome to
person satisfaction and (66.21%) Customer Satisfaction is an
outcome of Customer Care, Service Quality and a golden factor
that can influence on Customers that is Perceived value.
57

CHAPTER FIVE
INTERPRETATION OF THE FINDINGS
5.0 IntroductionThis chapter of the research report presents interpretation of
the study findings. It is comprised of two major sections which
include the respondents’ bio data and objectives of the study,
58

Customer Care and Customer Satisfaction, Customer Care and
Service Quality, Service Quality and Customer Satisfaction.
5.1 Bio Data
5.1.1 Gender of the respondentsThe totals of 132 respondents, 52.27% of the participants were
males and 47.73% of the respondents were females respectively.
The high percentage of male respondents was attributed to the
fact that male domination still persists in most African
countries and Uganda is not an exemption especially in commercial
banks, our study has shed some light in the improvement of women
emancipation the percentage gap is not so big as compared to the
20th century hence relative gender balance.
5.1.2 Age group of the respondentsThe totals of 132 respondents, 33.33% of the participants
belonged in the age group between 26-30, 25% of the participants
belonged in the age group of 36-45, 23.48% of the participants
followed in the age group of 18-25% and 17.42% of the
participants followed in the age group of 46+.
This distribution of respondents by age is an indication that
most of the respondents are mostly of young adult age,
independent and productive and this explains the reason as to why
the number of respondents was decreasing with the increasing age.
5.1.3 Marital Status of the respondentsThe totals of 132 respondents, 53.03% of the participants were
married and 46.97% of the participants were single. 59

This implied that most of the respondents in the study were
married who have gotten responsibility, it’s a sign of respect in
whatsoever they do and during our assignment showed high degree
of ownership.
5.1.4 Education levels of respondentsThe totals 132 respondents, 38.64% of the respondents were degree
holders, 29.55% of the were participants diploma grandaunts,
18.18% of the participants were post graduates, 11.36% of the
participants were high school graduates and 2.27% of the
participants were primary graduates respectively.
This research finding shows that most of the respondents were
educated and knowledgeable. Therefore they can read and
understand the questionnaire. This means that they were in
position to self administer the questionnaires. And this greatly
reduced the problem of ignorant respondents and language barrier
and valuable information with regards to quality service was
obtained and for bank staff, degree holders are preferred most
than those of other levels since they have basic of what it takes
and required in the banking institution.
5.1.5 Number of year’s respondents has worked in the bankThe totals of 56 respondents, 37.5% of the participants have
worked in the bank in the range of 0-3, 30% of the participants
have worked in the bank in the range of 4-6, 19.64% of the
participants have worked in the bank in the range of 7-10 and
12.5% of the participants have worked in the bank in the period
60

of 11+ respectively. This implied that participants had
experience with the banking institution.
5.1.6 Number of children respondents hadThe totals of 132respondents, 34.09% of the participants had
children in the range of 1-3, 29.55% of the participants had
children in the range of 4-7, 20.45% of the participants had none
and 15.91% of the respondents had number of children 8+.
This indicated that of the participants in the study, majority
had children in the range 1-3 followed by the range of 4-7, none
and 8+ were less implying most of the respondents feel safe
having few children which their can look after.
4.1.7 Nature of account respondents have in the BankThe totals of 76 respondents who participated in the study,
43.42% of the most of respondent hold saving account only and
27.63%, current account, 17.11% hold fixed account while 11.84%
hold both current and savings account. The 43.42% savings
accounts indicate that the holders frequently visit the bank to
transact thus understand the service quality. The low number of
fixed accounts can be associated to restricted period of time to
access money where customer cannot frequently access their money
for daily consumption.
5.2 The Relationship between Customer Care and Customer SatisfactionThere was a significant positive relationship between Customer
Care and Customer Satisfaction (r= 0.592, P-value < 0.01).
61

Customer Care results indicated a significant positive perception
across the two Commercial banks which implied that good Customer
Care in terms of Communication, Competence, and Credibility
enhance Customer Satisfaction. The findings are in line with
Jones & Suh, (2000) who found out that Customer satisfaction is
based on experience with service provider and also the outcome of
service.
5.3 The Relationship between Customer Care and Service QualityThere was a significant positive relationship between customer
care and service quality (r = 0.418, P-value < 0.01).
This implied that good customer care improved on service quality.
Customer care results indicated a significant positive relation
across the two commercial banks which implied that customer care
in terms of competence, credibility and communication enhances on
service quality. The findings are in line with Zike (2001), in
his study of what makes a company excellent, he interviewed 43
high performing companies. The study found out that all high
performing companies share a set of basic operating principles,
some of which emphasized customer driven service. It revealed
that excellent companies provide unparalleled customer service,
quality and reliability.
62

5.4 The Relationship between Customer Care, Customer Perception and Customer SatisfactionThere was a significant positive relationship between Customer
Care, Customer Perception and Customer Satisfaction (r = 0.592,
0.468, P-value < 0.01).
This implied that Customer Care in terms of Communication,
Competence, and Credibility enhance Customer Perception which
leads to Customer Satisfaction in terms of Loyalty, Retention,
Commitment and Recommendation in commercial banks. The finding is
in line with Parasuraman and Grewal, 2000) who found out that
Perceived value of customers not only affects customer choice
behavior at the pre purchase stage but also influences
satisfaction and intentions to recommend and repurchase at the
post purchase stage. Also the findings are in line with the
findings of Jones & Suh, (2000) which found out that Customer
satisfaction is based on experience with service provider and
also the outcome of service.
5.5 The Relationship among Customer care, Service quality, Customer Perception and Customer satisfaction.Customer satisfaction was significantly explained by Customer
Care, Service Quality and Customer Perception. The multiple
regression model indicated that 39.5% of customer Satisfaction of
commercial banks was contributed by Customer Care, Service
Quality and Customer Perception. Customer care (Beta = 0.633)
63

explained more to customer satisfaction, followed by service
quality (Beta = 0.280) and Customer perception (Beta = 0.088).
This implied that increase in Customer care, Service Quality and
Customer Perception led to increase in Customer Satisfaction.
Results are also consistent with Zike (2001), in his study of
what makes a company excellent, he interviewed 43 high performing
companies. The study found out that all high performing companies
share a set of basic operating principles, some of which
emphasized customer driven service. It also revealed that
excellent companies provide unparalleled customer service,
quality and reliability. And Parasuraman and Grewal, 2000, found
out that Perceived value of customers not only affects customer
choice behavior at the pre purchase stage but also influences
satisfaction and intentions to recommend and repurchase at the
post purchase stage.
5.6 Focused Group Discussions
A focus group was conducted to find out a comprehensive picture
of the customer care, service quality, customer perception and
customer satisfaction in commercial bank.
A majority of the respondents (60.87%) attributed to standing for
long hours for services in the bank ` and (39.13) accessing to
their accounts information in the bank out of 115 respondents.
The problem of standing for long hours in the bank is caused by
poor handling of customers because most of them don’t know what64

to do like proper filling of bank documents. Therefore according
to these findings, this shows that the issue goes along with
ignorance of customers of how to deal with the bank.
(57.58%) participants responded that welcoming, trustworthy,
assurance and communication customer care practices could be good
to find in the bank). Upon relationships, (68.04%) responded that
customer satisfaction results from Customer Care services,
today’s customers do not just buy core quality products or
services; they also buy a variety of added value or benefits.
This forces the service providers such as banks to adopt a market
orientation approach that identifies consumer needs and designs
new products and redesigns current ones
(61.41) responded that Customer Care and Service Quality are
interlinked so one leads to the other, the findings also show
that one of the more customers are attached to the bank and
recommends others simply because of good customer care and
service quality. (56.7) responded Good Services lead to person
value perception of the bank’s outcome to person satisfaction
thus; banks must be able to provide “up-close” personal service
for customers who come with high expectations. For customers who
value convenience most, banks must offer the latest product such
as electronic banking, touch-tone phone account access and
internet banking. Clearly, customer value can be a strong driver
of customer retention and (66.21%) Customer Satisfaction is an
65

outcome of Customer Care, Service Quality and a golden factor
that can influence on Customers that is Perceived value.
CHAPTER SIX
CONCLUSION AND RECOMMENDATIONS
6.1 IntroductionThis Chapter presents conclusion, recommendations and areas of
further research
6.1.1 Conclusion.The study on the relationship between Customer Care, Service
Quality and Customer satisfaction indicate that all the two
independent variables do contribute to customer satisfaction in
commercial banks. Therefore commercial banks operating in Uganda,
like any form of business organization, in today’s dynamic
financial landscape should focus on good service quality and
customer care in terms of the employees, physical evidence and
ambience to instill a higher reliability value among customers to
enhance customer satisfaction in commercial banks.
6.2 Recommendations.
The study on customer care, service quality and customer
satisfaction of commercial banks in Uganda was carried out. In
line with the findings and conclusions of the study the following
were recommended;
66

6.2.1 The relationship between Customer Care and Customer SatisfactionAs shown in table 4.8, there is a significant positive
relationship between customer care and customer satisfaction (r=
0.592, P-value < 0.01). This implies that Customer Care in terms
of Communication, Competence, and Credibility enhances on the
customer satisfaction.
Fen, (2005) in his study proved a close link between Customer
Care services and Customer Satisfaction.
Recommendations
From the findings on the effect of customer care on customer
satisfaction in commercial Banks which was positive.
Management need to support capacity building and
strengthening of business operations within the bank such
that customer problems are solved, service is delivery on
time, quick response to customer request, safe transactions,
personal attention and understanding the needs of the
customer.
The customers need to be closely monitored to limit gaps in
service provision and resulting falls in well-being within
the bank.
Motivation and equipping employees with enough resources
(adequate skills and knowledge) as a satisfied employee is a
satisfied customer.
Customer base in commercial banks is growing therefore it is
important to retain them with the banks. It becomes
imperative for the banks to train their employees to treat
67

the customers with empathy. This can give the required
leading edge and finally the competitive advantage over
other banks.
6.2.2 The relationship between Customer Care and Service Quality Results in table 4.8 above indicated a significant positive
relationship between customer care and service quality (r =
0.418, P-value < 0.01). This implies that service quality in
terms of Tangibles, Reliability, Assurance, Empathy, and
Responsiveness improved on customer care. Zike (2001), in his
study of what makes a company excellent; he interviewed 43 high
performing companies. He found out that all high performing
companies share a set of basic operating principles, some of
which emphasized customer driven service. He found out that
excellent companies provide unparalleled customer service,
quality and reliability
Recommendations
From the findings on the effect of customer care on service
quality which was positive, banks need to maintain customer
care practices so as to deliver quality services.
Strategically speaking, the banks should focus more on
improving the infrastructure. The infrastructure not only
involves the information technology input in the branches
but also the physical evidence, internal environment and
layout. This is due to the fact that recently like in other
68

services, in banking also the internal ambience of the
organization has a positive impact on the customers.
Respect customers by reducing on the queuing systems by
opening branches, ATMs, and introducing payments through
internet and phones.
6.2.3 The relationship between Customer Care, Customer Perception and Customer SatisfactionThe table above 4.8 shows a significant positive relationship
between service quality and customer satisfaction (r = 0.592,
0.468, P-value < 0.01). This implied that Customer Care in terms
of Communication, Competence, and Credibility enhance Customer
Perception which leads to Customer Satisfaction in terms of
Loyalty, Retention, Commitment and Recommendation in commercial
banks.
Parasuraman and Grewal, 2000) who found out that Perceived value
of customers not only affects customer choice behavior at the pre
purchase stage but also influences satisfaction and intentions to
recommend and repurchase at the post purchase stage.
Recommendations
From the findings on the effect of Customer Care and
Customer Perception on Customer satisfaction which was
positive, commercial banks need to adopt and strengthen the
communication between the management and customers in order
69

to improve on the quality service so as to satisfy their
customers’ needs.
The management needs to improve quality services so as to
satisfy customer’s needs. The bank needs to pay much
attention on the customer complaints in order satisfy the
customers’ expectation.
There is a need for the bank to make their services tangible
through physical facilities in order to improve on quality
services so as to satisfy their customer needs.
The bank should also pay attention to those customer
complaints as this would not only increase the reliability
of these banks in the minds of the customers but also the
assurance.
The growing needs of the customers are evident from the wide
array of services being offered by the banks like insurance,
mutual funds, depository services, this in turn points
towards the degree of readiness, which these banks are
demonstrating towards the customers and their needs. Besides
this, these banks should follow the strategy of
differentiation of service offers from one another.
6.2.4 The Relationship among Customer care, Service quality, Customer Perception and Customer satisfaction.Customer satisfaction was significantly explained by Customer
Care, Service Quality and Customer Perception. The multiple
regression model indicated that 39.5% of customer Satisfaction of
commercial banks was contributed by Customer Care, Service
70

Quality and Customer Perception. Customer care (Beta = 0.633)
explained more to customer satisfaction, followed by service
quality (Beta = 0.280) and Customer perception (Beta = 0.088).
This implied that increase in Customer Care, Service Quality and
Customer Perception led to increase in Customer Satisfaction.
Results are also consistent with Zike (2001), in his study of
what makes a company excellent, he interviewed 43 high performing
companies. He found out that all high performing companies share
a set of basic operating principles, some of which emphasized
customer driven service. He found out that excellent companies
provide unparalleled customer service, quality and reliability.
And Parasuraman and Grewal, 2000) who found out that Perceived
value of customers not only affects customer choice behavior at
the pre purchase stage but also influences satisfaction and
intentions to recommend and repurchase at the post purchase
stage.
Recommendations
The customers need to be closely monitored to limit gaps
in service provision and resulting falls in well-being
within the bank
The bank should pay attention to those features that
contribute to customer satisfaction such as loyalty,
retention, competitive interest rates which are rated
very little/weak.
71

Refresher training for employees in customer care, need
to put into consideration because employees are the
interface to customers service quality which influence
customer loyalty in retail banking.
6.3 Suggested Areas of further researchThe current study on customer care, service quality and customer
satisfaction was conducted on commercial banks in Uganda. The
study recommends further study on the Customer care and service
quality of commercial banks in Uganda identifying the gaps
between the customer expectations and perception of service bank.
72

REFERENCES
Anderson, E.W. and M.W. Sullivan (1993), “The Antecedents and
consequences of customer satisfaction for firms”, Marketing Science,
Vol. 12, No. 2, pp.125-143.
Akan, P. (1995). Dimensions of service quality: a study in
Istanbul, Managing service quality, MCB University Press, Vol.5, Number 6,
p.39-43.
Asubonteng, P., McCleary, K.J. & Swan, J.E. (1996). SERVQUAL
revisited: a critical review of service quality, The Journal of
Services Marketing, Vol.10, Number 6, p.62-81.
Badri, M. A., Abdulla, M. & Al-Madani, A. (2005). Service quality
assessment and application of SERVQUAL, Vol. 22, Number
8, p. 819-848.
73

Baileyt, J. E. & Pearson, S. W. (1983). Pearson development of a
tool for measuring and analyzing computer user satisfaction.
Management science, Vol. 25, Number 5.
Bearden, W.O. and J.E. Teel (1983), “Selected Determinants of
customer satisfaction and complaint reports”, Journal of Marketing
research, Vol. 20, pp.21-28.
Bolton, R.N. and J.H. drew (1991b), “A Multistage model of
customers Assessment of service quality and value”, Journal of
Consumer Research, Vol. 17, pp.375-384.
Bojanic, D. C. & Rosen, L. D. (1994). Measuring service quality
in restaurants: an application of the Servqual instrument, Journal
of Hospitality & amp; Tourism Research 1994; Vol.18, Number 3, p.4-14.
Bougoure, U. & Lee, B. (2009). Service quality in Hong Kong: wet
markets vs supermarkets, British Food Journal, Vol. 111, Number 1,
p.70-79.
Brady, M. K. & Cronin, J. Jr. (2001). Some new thoughts on
conceptualising perceived service quality. A hierarchical
approach, Journal of Marketing, Vol. 65, p.34- 49.
Buttle, F. (1996). SERVQUAL; review, critique, research agenda,
European Journal of Marketing, Vol. 30, Number 1, p.8-32.
Cardozo, R. N. (1965), “An Expwerimental study on Customer
effort, Expectation and Satisfaction”, Journal of Marketing Research,
Vol. 2, pp.244-249
Chowdhary, N. & Prakash, M. (2007). Prioritising service quality
dimensions. Management Service Quality, Vol. 17, Number 5, p.493-509.
74

Cronin, J. J., & Taylor, S. A. (1992) Measuring service quality;
a re-examination and extension. The Journal of Marketing, Vol. 56,
Number 3, p.55-68.
Curry, A. & Sinclair, E. (2002). Assessing the quality of
physiotherapy services using Servqual. International Journal of Health
Care Quality Assurance, Vol. 15, Number 5, p.197-205.
Douglas, L. & Connor, R. (2003). Attitudes to service quality-
the expectation gap, Nutrition & Food Science, Vol. 33 Number 4,
p.165-172.
Edvardsson, Bo (1998). Service quality improvement, Managing
Service Quality, Vol.8. Number 2, p. 142-149.
Einarsson, Agust (2008). The retail sector in the Nordic
countries: A description of the differences, similarities and
uniqueness in the global market, Journal of Retailing and Consumer
Services, Vol. 15, p.443-451.
Eshghi, A., Roy, S. K., & Ganguli, S. (2008). Service quality and
customer satisfaction: An empirical investigation in Indian
mobile Telecommunications services, Marketing Management Journal, Vol
18, Number 2, p. 119-144.
Fen, Y. S. & Meillian, K. (2005). Service quality and customer
satisfaction: Antecedents of customer’s re-patronage, Sunway
Academic Journal. Vol. 4, p.60-73.
Fornell, C. (1992). "A National Customer Satisfaction Barometer:
The Swedish Experience." Journal of Marketing, Vol. 56, p.6-21.
Garcıa, J. A. M. & Caro, L. M. (2010). Rethinking perceived
service quality: An alternative to hierarchical and
75

multidimensional models. Total Quality Management. Vol. 21, Number 1,
p.93 118.
Ghylin, K.M., Green, B. D., Drury, C. G., Chen, J.,
Schultz ,J.L., Uggirala, A., Abraham, J.K. & Lawson, T.A. (2006).
Clarifying the dimensions of four concepts of quality, Theoretical
Issues in Ergonomics Science, Vol. 9, Number 1, p.73-94.
Giese, J. L., & Cote, J. A. (2002). Defining Consumer
Satisfaction, Academy of Marketing Science, Vol. 2000, Number 1, p.1-
24.
Gronroos, C. (1982). A service quality model and its marketing
implications, European Journal of Marketing, Vol.18, Number 4, p.36-44.
Gummesson, E., (1994) Service Management: An Evaluation and the
Future, International Journal of service Industry management, Vol. 4, Number
1, p.77- 96.
Haider, S. (2001). ISO 9001:2000 Document Development Compliance Manual.
Boca Raton, Florida: St. Lucie Press.
Hardie N. & Walsh P. (1994). Towards a better understanding of
quality, International Journal of Quality & Reliability Management, Vol. 11,
p.53-63.
Huddleston, P., Whipple, J., Mattick R. N. & Lee S. J. (2008).
Customer satisfaction in food retailing: comparing specialty and
conventional grocery stores, International Journal of Retail &
Distribution Management, Vol.37, Number 1, p.63-80.
Johns, N. (1999). What is this thing called service?, European
Journal of Marketing, Vol. 33, Number 9/10, p.958-973.
76

Islam, N. & Ahmed, E. (2005), “A Measurement of Customer Service
Quality of Banks in Dhaka City of Bangladesh”, South Asian Journal of
Management
Kumar, M., Kee, F. T. & Manshor, A. T. (2009). Determining the
relative importance of critical factors in delivering service
quality of banks; An application of dominance analysis in
SERVQUAL model, Managing Service Quality, Vol. 19, Number 2, p.
211-228.
Ladhari, R. (2009). A review of twenty years of SERVQUAL
research, International Journal of Quality and Service Sciences,
Vol. 1, Number 2. P.172-198.
Lee, H., Lee, Y. & Yoo, D. (2000). The determinants of perceived
service quality and its relationship with satisfaction, Journal
of Service Marketing, Vol. 14, Number 3, p.217-231.
Long, R. G., White C. M., Friedman W. H. & Brazeal D.V. (2000).
The ‘Qualitative’ versus ‘Quantitative’ research debate: A
question of metaphorical assumptions, International Journal of
Value-based Management, Vol.13, p.189-197.
Oliver, R.L. and W. DeSarbo (1988), “Response determinants in
satisfaction judgments”, Journal of Consumer research, Vol.
14(March):495-507.
Magi, A. & Julander, C. R. (1996). Perceived service quality and
customer satisfaction in a store performance framework. An
empirical study of Swedish grocery retailers, Journal of
Retailing and consumer services, Vol. 3, Number 1 p.33-41.
77

Negi, R. (2009). Determining customer satisfaction through
perceived service quality: A study of Ethiopian mobile users,
International Journal of Mobile Marketing; Vol.4, Number 1; p.31-
38.
Parasuraman, A., Zeithaml, V. A., & Berry, L. L. (1985). A
conceptual model of service quality and its implications for
future research, Journal of Marketing, Vol. 49, p.41-50.
Parasuraman, A., Zeithaml, V. A., & Berry, L. L. (1988).
SERVQUAL: A multiple-item scale for measuring consumer
perceptions of service quality, Journal of Retailing, Vol. 64,
Number 1, p.12-40.
Powell, T C (1995), "Total Quality Management as Competitive
Advantage: A Review and Empirical Study", Strategic Management
Journal, Vol. 16, pp. 15-37.
Reimer, A. & Kuehn, R. (2005). The impact of servicescape on
quality perception, European Journal of Marketing, Vol. 39,
Number 7/8, p.785-808.
Ravichandran, K. Prabhakaran, S. and Kumar, S.A. (2010),
“Application of Servqual Model on Measuring Service Quality: A
Bayesian Approach”, Enterprise Risk Management, Vol. 1, No. 1, pp. E9
Ruyter, K D and Bloemer, J (1995), "Integrating Service Quality
and Satisfaction: Paying in the Neck, or Marketing Opportunity?"
Journal of Consumer Satisfaction, Dissatisfaction and Complaining Behavior, Vol.
8, pp. 44-52.
78

Sahin, B., Demir, C., Celik, Y., & Teke, A. K. (2006). Factors
affecting satisfaction level with the food services in a military
hospital, Journal of medical systems, Vol. 30, Issue 5.
Saravanan, R. & Rao, K. S. P. (2007). Measurement of service
quality from the customer’s perspective – An empirical study,
Total Quality Management, Vol. 18. No. 4, p.435-449.
Sebastianelli, R. & Tamimi, N. (2002), How product quality
dimensions relate to defining quality, International Journal of
Quaility and Reliability Management, Vol. 19, Number 4, p.442-
453.
Shahin, A. (2005). SERVQUAL and Model of Service Quailty Gaps: A
framework for determining and prioritizing critical factors in
delivering quality services, Department of Management, University of
Isfahan, Iran, p.1-10. Available on
http://www.proserv.nu/Docs/Servqual.
Sower, V., & Fair, F. (2005). There is more to quality than
continuous improvement: Listening to Plato, The Quality Management
Journal, Vol.12, No.1, p.8-20.
Swan, K. (2001) 'Virtual interaction: Design factors affecting
student satisfaction and perceived learning in asynchronous
online courses', Distance Education, Vol.22, No.2, p.306-331.
Tse, D.K. and P.C. Wilton (1988). Models of consumer satisfaction
formation: An Extension. Journal of Marketing Research, Vol. 25(May),
pp.204-212.
79

Teas, R. K. (1993). Expectations, performance evaluation, and
consumers’ perceptions of quality. Journal of Marketing, Vol.57,
No.4, p.18–34.
Tse, David K. & Peter, C. Wilton. (1988). Models of Consumer
Satisfaction: An Extension, Journal of Marketing Research, Vol. 25 p.
204-212.
Van der Wal, R. W. E., Pampallis, A. & Bond, C. (2002). Service
quality in a cellular telecommunications company: a South African
experience, Managing Service Quality, Vol. 12, Number 5, p.323-3335.
Wicks, A. M., & Roethlein, C. J. (2009). A Satisfaction-Based
Definition of Quality Journal of Business & Economic Studies, Vol. 15, No.
1, Spring 2009, 82-97.
Books
Beamish, K. & Ashford, R. (2007/2008). Marketing Planning. 1st
Edition. Oxford OX2 8DP, UK. Butterworth-Heinemann.
Bryman, A. & Bell, E. (2007). Business research methods. 2nd edition.
New York: Oxford University Press Inc.
Chow, S. L. (1997). Statistical significance: rational validity and utility
(Introducing statistical methods). Illustrated Edition. Sage Publications
Ltd.
Garvin, D. (1988). Managing quality. New York. Macmillan.
Hague, P. N. (2004). Market Research in Practice: A Guide to the Basics.
London, Great Britian: Kogan Page Ltd.
Salkind, N. J. (2003). Statistics for people who think they hate statistics. 2nd
Edition. Sage Publications, Inc.
80

Schneider, B. & White S. S. (2004). Service quality: Research perspectives.
USA. Sage Publication Ltd.
Websites
Statistiska Centralbryan, Statistics Sweden (2010). About
statistics Sweden website <
http://www.ssd.scb.se/databaser/makro/MainTable.asp?
yp=xldzv&xu=90465001&omradekod=HA&omradetext=Trade+in+goods+and+s
ervices&lang=2&langdb=2> [Retrieved 2010-04-15].
Center for the study of Social Policy (2007, Febraury). Customer
Satisfaction <http://www.cssp.org/uploadFiles/Customer
%20Satisfaction%20What%20Res earch%20Tells%20Us.pdf> [Retrieved
2010-04-28]
Umea University (2009, March). About Umea University. Umea
University website < http://www.umu.se/english/about-umu >
[Retrieved 2010-04-25]
APPENDICE
Appendix I: Questionnaire
CUSTOMER QUESTIONNAIRE
Dear respondent,
81

I am pleased to inform you that you have been selected to
participate in the study intended to examine the relationship
between Customer care, Service quality and Customer satisfaction
in the banking sector of Uganda.
Please assist me in answering the questionnaire by providing the
most appropriate answer in your opinion by ticking or writing in
the given space as the case may be. I would very much appreciate
your participation in this study. This information will serve for
academic purposes. Whatever information you provide will be kept
strictly confidential.
Signature of interviewer……………………………………Date……………………...............
Part A. Demographics
Tick the applicable option
1. Name of respondent (optional)...............................................
2. Gender
1. Male [ ] 2.Female [ ]
3. Age
1. 18-25 [ ] 2. 26-35 [ ] 3. 36-45 [
] 4. 46- above [ ]
4. Marital Status
1. Single [ ] 2. Married [ ]
5. How many children do you have?
82

1. None [ ] 2. Below 1-3 [ ] 3. 3-6
[ ] 4. 7- Above [ ]
6. Educational Attainment
1. Never attended School [ ] 2.
Primary Graduate [ ]
3. High School graduate [ ]
4. Diploma [ ] 5. Graduate [ ] 6.
Post Graduate [ ]
7. Nature of account with the bank.
1. Savings account [ ] 2.Current
account [ ] 3.Fixed account [ ]
4. Current/Fixed account [ ]
Part B. Section
Dear respondent, I would like you to answer the following
questions using figures of 1 to 5 as they are credited below
1= strongly Agree, 2= Agree, 3=Neutral, 4=Disagree, 5= strongly disagree.
Customer care 1 2 3 4 5Courtesy; employees have the politeness, respect,
consideration, and friendship when doing their jobCompetence; employees possess the required skills
and knowledge to perform the serviceCredibility; employees are trust worthy, honesty,
83

believable, that is, having customers best
interest at heartCommunication; employees keep customer's
information in language they can understandBankers should give individual attention to the
customers The bank should arrange special care to special
customers Service Quality 1 2
3
4
5Tangible: employees are well dressed and appear
neat to do businessReliability; Banks provide their services at the
time they promise to do so with clients.Responsiveness; willing or readiness of employees
to provide service Accessibility; approachability
and ease of contactAssurance; customers feel safe in transactions
with the banks.Empathy; the bank should have operating hours
convenient to all their customers. Customer SatisfactionCommitment: factors like communication,
accessibility and location have enabled customers
to do business with the bank.
Loyalty; there is customer psychological
commitment towards the brandRetention; attention is put on the customer
84

complaints so as to retain the existing customers
and attract new ones and consistent quality
servicesRecommendation of the service; quality controls
are put in place in order to avoid unsatisfactory
performance and reflect high value so as satisfy
the customers. Customer PerceptionEmployees of the bank try to know what customer
needs are.The Bank respects gender diversity and special
care for special people (pregnant women, sucking
mothers and disabled personnel)Employees in the bank are sympathetic and
reassuring, when customers have problems. The bank has a good reputation, well- trained and
presentable employees
85
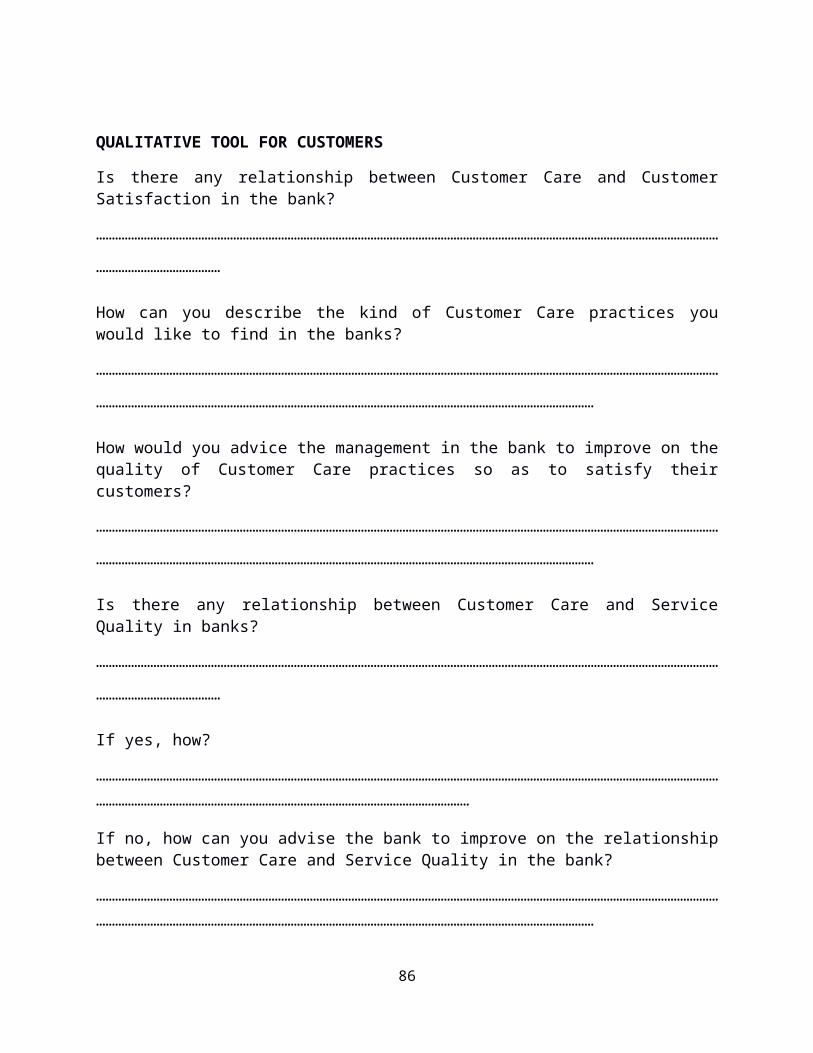
QUALITATIVE TOOL FOR CUSTOMERS
Is there any relationship between Customer Care and CustomerSatisfaction in the bank?
……………………………………………………………………………………………………………………………………………………………………………
…………………………………
How can you describe the kind of Customer Care practices youwould like to find in the banks?
……………………………………………………………………………………………………………………………………………………………………………
…………………………………………………………………………………………………………………………………………
How would you advice the management in the bank to improve on thequality of Customer Care practices so as to satisfy theircustomers?
……………………………………………………………………………………………………………………………………………………………………………
…………………………………………………………………………………………………………………………………………
Is there any relationship between Customer Care and ServiceQuality in banks?
……………………………………………………………………………………………………………………………………………………………………………
…………………………………
If yes, how?
……………………………………………………………………………………………………………………………………………………………………………………………………………………………………………………………………………………
If no, how can you advise the bank to improve on the relationshipbetween Customer Care and Service Quality in the bank?
………………………………………………………………………………………………………………………………………………………………………………………………………………………………………………………………………………………………………………………
86

Is there any relationship between Customer Care, CustomerPerception and Customer Satisfaction?
…………………………………………………………………………………………………………………....................................................................................................................................………………………………………………………………………………………………….
Is there any relationship between Customer Care, Service Quality,Customer Perception and Customer Satisfaction?
….................................................................................................................................................
….................................................................................................................................................
…................................................................................................................................................
87

STAFF QUESTIONNAIRE
Dear respondent,
I am pleased to inform you that you have been selected to
participate in the study intended to examine the relationship
between Customer care, Service quality and Customer satisfaction
in the banking sector of Uganda.
Please assist me in answering the questionnaire by providing the
most appropriate answer in your opinion by ticking or writing in
the given space as the case may be. I would very much appreciate
your participation in this study. This information will serve for
88

academic purposes. Whatever information you provide will be kept
strictly confidential.
Signature of interviewer……………………………………Date……………………...............
BACK GROUND INFORMATION
i) Level of education
a) Never attended School [ ] b) Primary Graduate
c) High School graduate [ ]
d) Diploma [ ] e) Graduate [ ]
f) Post Graduate [ ]
ii) Sex of the respondent
a) Male [ ]
b) Female [ ]
iii) Age
a) 18-25 [ ] b) 26-36 [ ] c) 37-
45 [ ] d) 46- Above [ ]
iv) Length of service (in years)…………………………………
a) 1- 3 [ ] b) 4-7 [ ] c) 8-10 [ ] d) 11+
[ ]
Dear respondent, I would like you to answer the following
questions using figures of 1 to 5 as they are credited below
1= strongly Agree, 2= Agree, 3=Neutral, 4=Disagree, 5= strongly disagree.
89

Customer Care
1
2
3
4 5
Courtesy; employees have the politeness,
respect, consideration, and friendship when
doing their job in the bank
Competence; employees possess the required
skills and knowledge to perform the service
Credibility; employees are trust worthy,
honesty, believable that is, having customers
best interest at heart
Communication; employees keep customer’s
information in language they can understand
Service Quality
1
2
3
4
5
Tangible; employees are well dressed and
appear neat to do business with customers
Reliability; Banks provide their services at
the time they promise to do so with clients.
Responsiveness; willing or readiness of
employees to provide service Accessibility;
approachability and ease of contact
Assurance; Customers feel safe in transactions
with Banks.
Empathy; Bank have operating hours convenient
90

to all their customers.
Customer satisfaction
Commitment: factors like communication,
accessibility and location have enabled
customers to do business with the bank.
Loyalty; there is customer psychological
commitment towards the brand
Retention; attention is put on the customer
complaints so as to retain the existing
customers and attract new ones and consistent
quality services
Recommendation of the service; quality controls
are put in place in order to avoid
unsatisfactory performance and reflect high
value so as satisfy the customers.
Customer Perception
Employees of the bank try to know what customer
needs are.
The Bank respects gender diversity and special
care for special people (pregnant women,
sucking mothers and disabled personnel)
Employees in the bank are sympathetic and
reassuring, when customers have problems.
The bank has a good reputation, well- trained
91

and presentable employees.
If customers are not satisfied please tick the reason why are not
satisfied
Lack of resources
Lack of knowledge to satisfy customers
There is no morale to satisfy them
It is not necessary to satisfy them
Any other reason (specify)
-----------------------------------------------------------
On average, how many customer complaints do you handle in a day?
0 – 10 b. 10 – 30
30 – 50 d. 50 and above
How long do you take to respond to your customers who present
complaints on ATM break down?
Less than 30 minutes c. 2 – 5 days
1 – 24 hrs d. 5 days and above
How do you communicate to your customer about the various
services offered by bank?
Use of radio and television
92

Through news paper
Through brochure and pamphlets/ leaflets
Through seminars
Are you concerned about the customer satisfaction to your clients
(i.e. do you consider whether they are good for your customers?
Most of the time b. sometimes c. never
93
Copyright © 2022 FDOKUMEN