Currents and transports of the Great Whirl-Socotra Gyre system during the summer monsoon, August...
15
JOURNAL OF GEOPHYSICAL RESEARCH, VOL. 101, NO. C2, PAGES 3573-3587, FEBRUARY 15, 1996 Currents and transports of the Great Whirl-Socotra Gyre systemduring the summer monsoon,August 1993 J. Fischer, F. Schott, and L. Stramma Institut ffir Meereskunde an der UniversitfitKiel, Kiel, Germany Abstract. From August11 to 22, 1993, a conductivity-temperature-depth/acoustic Doppler currentprofilersurvey wascarriedout in the Somali--Socotra regionto investigate currents and transports associated with the Great Whirl and Socotra Gyre circulation duringthe heightof the summer monsoon. The monsoon circulation was confined to the upper 300 rndepth, with intense surface currents upto 2.2rns -• in the Great Whirl and upto 1.4 rns -• in theSocotra Gyre. Deeper-reaching flow was found in the northwestern part of the Somali Basinand in the passage between the shelfof Somaliaand Abd al Kuri. The Great Whirl transport was58 Sv, of which nearly25% were due to ageostrophic flow components. The northern part of the Great Whirl thereby appeared asa closed circulation cell in which the offshore transport was balanced by a southward transport of the samemagnitude. Upwelledwater was advected from the cold wedgeof the upwelling regimeat the Somalicoast alongthe edgeof the gyre.The water in the centerof the gyrehad the characteristics of Indian EquatorialWater (IEW). The Socotra Gyre carried23 Sv of modified Arabian Sea Water (ASW). With the ttansports in the two anticyclonic gyres nearlybalanced, the exchange of water masses between the SomaliBasin, west of the Carlsberg Ridge, and the Arabian Sea occurred in two areas; about 16 Sv of warm and salinesurface water of southern offshore origin entered the northern Somali Basin within a 120-km-wide swift current between the Great Whirl and the Socotra Gyre. The other key regionfor the exchange of water masses was the passage between Somalia and Abd al Kuri. There, the total northward transport was 13 Sv,with contributions of IEW, of upwelled water close to the surface, and ASW underneath. 1. Introduction The westernboundary current off Somalia undergoes dra- maticchanges in response to the seasonal reversal of the mon- soonwinds. The development of the Somali Current system duringthe stages of the southwest monsoon was reviewed by $chott[1983] and by Swallow et al. [1983] from the results of the international Indian OceanExperiment (INDEX) for the individual summer monsoon of 1979. During April or the beginning of May, northwardwinds develop along the Somali coast and south of the equator a northward coastal currentexists. This coastal currentstrength- ens duringMay, crossing the equator,and retroflects offshore at about 2ø30'N [Swallow et al., 1983], carryinglow-salinity water of the South Equatorial Currentinto the northern hemi- sphere. This retroflection,known as the Southern Gyre, is bounded by a wedgeof cold upwelled water migrating north- ward up to 3ø-4øN. Farther north, the Somali Current flows alongshore with cold upwelled water at its western flank [$chott, 1983]. During the following months the southwest monsoon intensifies until July,with misan wind speeds of the order of 15 m s -•. A second anticyclonic gyreformsnorth of 5øNin June/July with the onset of the strongwind stress curl [$chott, 1983; $chott and Fieux, 1985]. According to Swallow and Fieux [1982], thisgyre was mentioned already 130 years ago byFind- lay [1866],who called it the Great Whirl. With the develop- Copyright1996 by the American Geophysical Union. Paper number95JC03617. 0148-0227/96/95JC-03617505.00 ment of the Great Whirl a second cold wedge forms at about 9øN south of Ras Hafun. The two-gyresystem remainsabout stationary to mid-August. During the late stages of the summer monsoon(end of August or September) the southern cold wedge migrates northward andthe two-gyre system breaks downrather rapidly. With the coalescence of the two gyresthe Somali Current appears asa continuous western boundary current from 4øS to about 10øN [Schott, 1983]. However, sometimes onlyone gyre (the GreatWhirl) exists or no coalescence occurs [Swallow and Fieux, 1982]. The near-surface water masses in the area are Arabian Sea Water (ASW) and low-salinity water from equatorial Indian Oceanor Indian EquatorialWater (IEW) [Wyrtki, 1971; Swal- low et al., 1983]. Owing to excess evaporation,the ASW is characterized by highsalinity (S > 36.0) anda strong halocline underneath [Wyrtki,1971]. At the surface the IEW could be tracedback to 10øS showing salinities around35.2 [Swallow et al., 1983]. Vertical salinity gradients in the depth range 100- 200 m are weak.Upwelling water from the Ekman regimenear the coast is characterized by temperatures which might be as low as 16øC [Swallow and Bruce,1966]. The intermediate depthrange(200-800 m) is characterized by water masses of differentorigin [Wyrtki, 1971].A shallow salinitymaximumnear fro - 26.5 (approximately at 300 m depth) which is due to the outflow of the PersianGulf can enter the Somali Basin from the north. Similarly,the shallow 02 minimum found in the northern Arabian Sea at depths around 200 m may enter the area. Farther down,in the depth range 300-400 m, an interme- 3573
-
Upload
independent -
Category
Documents
-
view
1 -
download
0
Transcript of Currents and transports of the Great Whirl-Socotra Gyre system during the summer monsoon, August...
JOURNAL OF GEOPHYSICAL RESEARCH, VOL. 101, NO. C2, PAGES 3573-3587, FEBRUARY 15, 1996
Currents and transports of the Great Whirl-Socotra Gyre system during the summer monsoon, August 1993
J. Fischer, F. Schott, and L. Stramma Institut ffir Meereskunde an der Universitfit Kiel, Kiel, Germany
Abstract. From August 11 to 22, 1993, a conductivity-temperature-depth/acoustic Doppler current profiler survey was carried out in the Somali--Socotra region to investigate currents and transports associated with the Great Whirl and Socotra Gyre circulation during the height of the summer monsoon. The monsoon circulation was confined to the upper 300 rn depth, with intense surface currents up to 2.2 rn s -• in the Great Whirl and up to 1.4 rn s -• in the Socotra Gyre. Deeper-reaching flow was found in the northwestern part of the Somali Basin and in the passage between the shelf of Somalia and Abd al Kuri. The Great Whirl transport was 58 Sv, of which nearly 25% were due to ageostrophic flow components. The northern part of the Great Whirl thereby appeared as a closed circulation cell in which the offshore transport was balanced by a southward transport of the same magnitude. Upwelled water was advected from the cold wedge of the upwelling regime at the Somali coast along the edge of the gyre. The water in the center of the gyre had the characteristics of Indian Equatorial Water (IEW). The Socotra Gyre carried 23 Sv of modified Arabian Sea Water (ASW). With the ttansports in the two anticyclonic gyres nearly balanced, the exchange of water masses between the Somali Basin, west of the Carlsberg Ridge, and the Arabian Sea occurred in two areas; about 16 Sv of warm and saline surface water of southern offshore origin entered the northern Somali Basin within a 120-km-wide swift current between the Great Whirl and
the Socotra Gyre. The other key region for the exchange of water masses was the passage between Somalia and Abd al Kuri. There, the total northward transport was 13 Sv, with contributions of IEW, of upwelled water close to the surface, and ASW underneath.
1. Introduction
The western boundary current off Somalia undergoes dra- matic changes in response to the seasonal reversal of the mon- soon winds. The development of the Somali Current system during the stages of the southwest monsoon was reviewed by $chott [1983] and by Swallow et al. [1983] from the results of the international Indian Ocean Experiment (INDEX) for the individual summer monsoon of 1979.
During April or the beginning of May, northward winds develop along the Somali coast and south of the equator a northward coastal current exists. This coastal current strength- ens during May, crossing the equator, and retroflects offshore at about 2ø30'N [Swallow et al., 1983], carrying low-salinity water of the South Equatorial Current into the northern hemi- sphere. This retroflection, known as the Southern Gyre, is bounded by a wedge of cold upwelled water migrating north- ward up to 3ø-4øN. Farther north, the Somali Current flows alongshore with cold upwelled water at its western flank [$chott, 1983]. During the following months the southwest monsoon intensifies until July, with misan wind speeds of the order of 15 m s -•.
A second anticyclonic gyre forms north of 5øN in June/July with the onset of the strong wind stress curl [$chott, 1983; $chott and Fieux, 1985]. According to Swallow and Fieux [1982], this gyre was mentioned already 130 years ago by Find- lay [1866], who called it the Great Whirl. With the develop-
Copyright 1996 by the American Geophysical Union.
Paper number 95JC03617. 0148-0227/96/95JC-03617505.00
ment of the Great Whirl a second cold wedge forms at about 9øN south of Ras Hafun. The two-gyre system remains about stationary to mid-August.
During the late stages of the summer monsoon (end of August or September) the southern cold wedge migrates northward and the two-gyre system breaks down rather rapidly. With the coalescence of the two gyres the Somali Current appears as a continuous western boundary current from 4øS to about 10øN [Schott, 1983]. However, sometimes only one gyre (the Great Whirl) exists or no coalescence occurs [Swallow and Fieux, 1982].
The near-surface water masses in the area are Arabian Sea
Water (ASW) and low-salinity water from equatorial Indian Ocean or Indian Equatorial Water (IEW) [Wyrtki, 1971; Swal- low et al., 1983]. Owing to excess evaporation, the ASW is characterized by high salinity (S > 36.0) and a strong halocline underneath [Wyrtki, 1971]. At the surface the IEW could be traced back to 10øS showing salinities around 35.2 [Swallow et al., 1983]. Vertical salinity gradients in the depth range 100- 200 m are weak. Upwelling water from the Ekman regime near the coast is characterized by temperatures which might be as low as 16øC [Swallow and Bruce, 1966].
The intermediate depth range (200-800 m) is characterized by water masses of different origin [Wyrtki, 1971]. A shallow salinity maximum near fro - 26.5 (approximately at 300 m depth) which is due to the outflow of the Persian Gulf can enter the Somali Basin from the north. Similarly, the shallow 02 minimum found in the northern Arabian Sea at depths around 200 m may enter the area.
Farther down, in the depth range 300-400 m, an interme-
3573
3574 FISCHER ET AL.: GREAT WHIRL CIRCULATION AND TRANSPORT
15 ø
N
10'
5 50 ø 55 ø E 60"
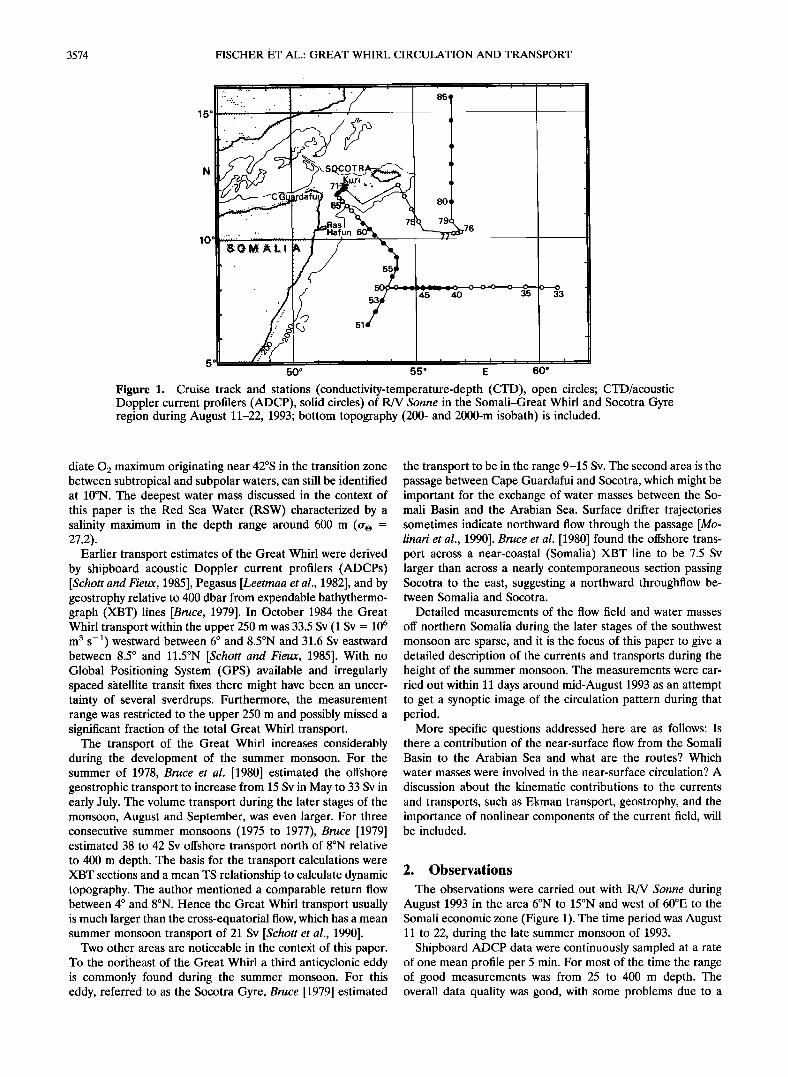
Figure 1. Cruise track and stations (conductivity-temperature-depth (CTD), open circles; CTD/acoustic Doppler current profilers (ADCP), solid circles) of R/V Sonne in the Somali-Great Whirl and Socotra Gyre region during August 11-22, 1993; bottom topography (200- and 2000-m isobath) is included.
diate 02 maximum originating near 42øS in the transition zone between subtropical and subpolar waters, can still be identified at 10øN. The deepest water mass discussed in the context of this paper is the Red Sea Water (RSW) characterized by a salinity maximum in the depth range around 600 m (•r o = 27.2).
Earlier transport estimates of the Great Whirl were derived by shipboard acoustic Doppler current profilers (ADCPs) [Schott and Fieux, 1985], Pegasus [Leetmaa et al., 1982], and by geostrophy relative to 400 dbar from expendable bathythermo- graph (XBT) lines [Bruce, 1979]. In October 1984 the Great Whirl transport within the upper 250 m was 33.5 Sv (1 Sv = 10 6 m 3 s -]) westward between 6 ø and 8.5øN and 31.6 Sv eastward between 8.5 ø and 11.5øN [Schott and Fieux, 1985]. With no Global Positioning System (GPS) available and irregularly spaced satellite transit fixes there might have been an uncer- tainty of several sverdrups. Furthermore, the measurement range was restricted to the upper 250 m and possibly missed a significant fraction of the total Great Whirl transport.
The transport of the Great Whirl increases considerably during the development of the summer monsoon. For the summer of 1978, Bruce et al. [1980] estimated the offshore geostrophic transport to increase from 15 Sv in May to 33 Sv in early July. The volume transport during the later stages of the monsoon, August and September, was even larger. For three consecutive summer monsoons (1975 to 1977), Bruce [1979] estimated 38 to 42 Sv offshore transport north of 8øN relative to 400 m depth. The basis for the transport calculations were XBT sections and a mean TS relationship to calculate dynamic topography. The author mentioned a comparable return flow between 4 ø and 8øN. Hence the Great Whirl transport usually is much larger than the cross-equatorial flow, which has a mean summer monsoon transport of 21 Sv [Schott et al., 1990].
Two other areas are noticeable in the context of this paper. To the northeast of the Great Whirl a third anticyclonic eddy is commonly found during the summer monsoon. For this eddy, referred to as the Socotra Gyre, Bruce [1979] estimated
the transport to be in the range 9-15 Sv. The second area is the passage between Cape Guardafui and Socotra, which might be important for the exchange of water masses between the So- mali Basin and the Arabian Sea. Surface drifter trajectories sometimes indicate northward flow through the passage [Mo- linari et al., 1990]. Bruce et al. [1980] found the offshore trans- port across a near-coastal (Somalia) XBT line to be 7.5 Sv larger than across a nearly contemporaneous section passing Socotra to the east, suggesting a northward throughflow be- tween Somalia and Socotra.
Detailed measurements of the flow field and water masses
off northern Somalia during the later stages of the southwest monsoon are sparse, and it is the focus of this paper to give a detailed description of the currents and transports during the height of the summer monsoon. The measurements were car- ried out within 11 days around mid-August 1993 as an attempt to get a synoptic image of the circulation pattern during that period.
More specific questions addressed here are as follows: Is there a contribution of the near-surface flow from the Somali
Basin to the Arabian Sea and what are the routes? Which
water masses were involved in the near-surface circulation? A
discussion about the kinematic contributions to the currents
and transports, such as Ekman transport, geostrophy, and the importance of nonlinear components of the current field, will be included.
2. Observations
The observations were carried out with R/V Sonne during August 1993 in the area 6øN to 15øN and west of 60øE to the Somali economic zone (Figure 1). The time period was August 11 to 22, during the late summer monsoon of 1993.
Shipboard ADCP data were continuously sampled at a rate of one mean profile per 5 min. For most of the time the range of good measurements was from 25 to 400 m depth. The overall data quality was good, with some problems due to a
FISCHER ET AL.: GREAT WHIRL CIRCULATION AND TRANSPORT 3575
•i•i•.•.,<•::•,.'.•" GW surface TIS :!::.•:::::!:[•:i.•:3"
14 ø • 30[ -røcl ,
I •-" .... -'"'"•'• •.•. 1' [ • ......
/ x\\- - -m"7• _•,,•-----•. • , -:... ...... .,i.•.•:i.',•:".' .'k.'"'x"x. , ., ß
........................ ...... .............. ",,, ,,,\ , :::::::::::::::::::::::::::::::::::::::::::::::::::::::::::::::::::::::::: I • -.a, I
'i:: .". •:• :•':-• .' •,w.•..•:..'..•.•'.,:...• • ß •---•-•" • I . . I , I , , 10 • ': ............. '"':*•"•'x•:• ........... • .............. • ............. • • '
::::::::::::::::::::::::::::::::::: (.•.',x:" ..-' •.*"' I I [ • '1
8 o •!51!i:.i"•..,'.•:!•i•.:?.C ...•"' ;" . •,•, ••tt•tty,•l/lll,,, -
,,,,,, ,, , , ' 50 ø 55 ø E 60 ø
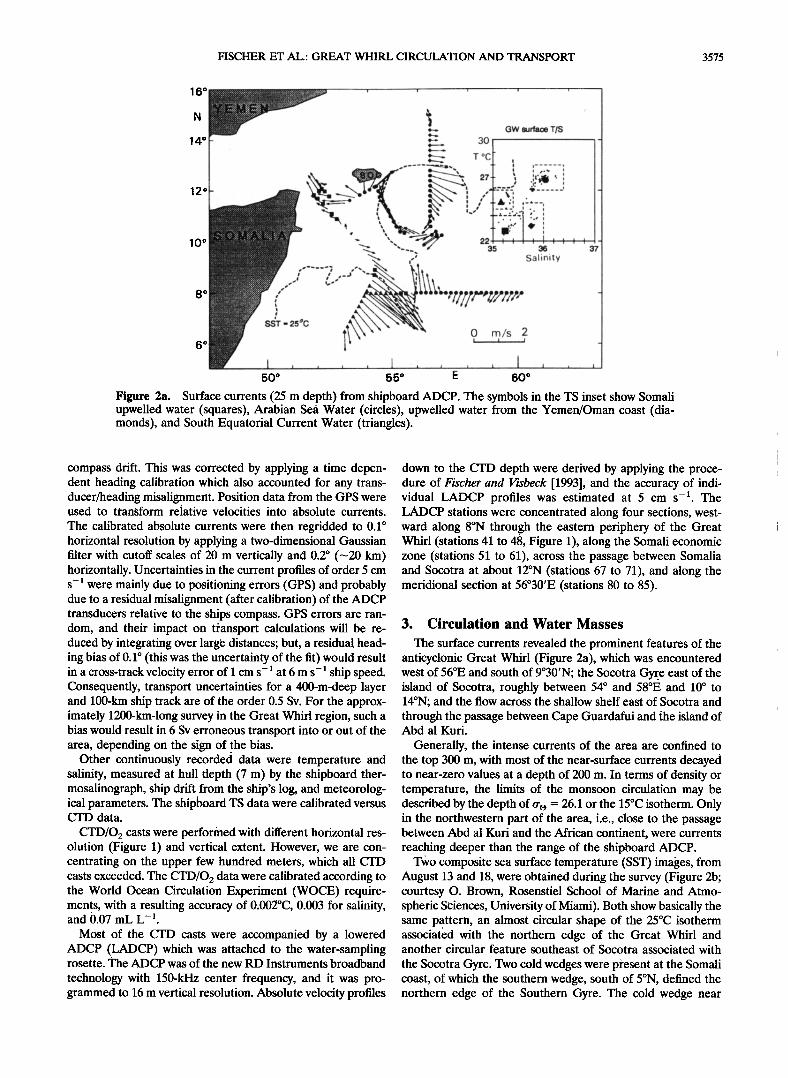
Figure 2a. Surface currents (25 m depth) from shipboard ADCP. The symbols in the TS inset show Somali Upwelled water (squares), Arabian Sea Water (circles), upwelled water from the Yemen/Oman coast (dia- monds), and South Equatorial Current Water (triangles).
compass drift. This was corrected by applying a time depen- dent heading calibration which also accounted for any trans- dUcer/heading misalignment. Position data from the GPS were used to transform relative velocities into absolute currents.
The-calibrated absolute currents were then regridded to 0.1 ø horizontal resolution by applying a two-dimensional Gaussian filter with cutoff scales of 20 m vertically and 0.2 ø (---20 km) horizontally. Uncertainties in the current profiles of order 5 cm s- • were mainly due to positioning errors (GPS) and probably due to a residual misalignment (after calibration) of the ADCP transducers relative to the ships compass. GPS errors are ran- dom, and their impact on fransport calculations will be re- duced by integrating over large distances; but, a residual head- ing bias of 0.1 ø (this was the uncertainty of the fit) would result in a cross-track velocity error of 1 cm s-• at 6 m s-• ship speed. Consequently, transport uncertainties for a 400-m-deep layer and 100-km ship track are of the order 0.5 Sv. For the approx- imately 1200•km-long suryey in the Great Whirl region, such a bias would result iri 6 Sv erroneous transport into or out of the area, depending on the sign of the bias. ß
Other continuously recorded data were temperature and salinity, measured at hull depth (7 m) by the shipboard ther- mosalinograph, ship drift from the ship's log, and meteorolog- ical parameters. The shipboard TS data were calibrated versus CTD data.
CTD/O 2 casts were performed with different horizontal res- olution (Figure 1) and vertical extent. However, we are con- centrating on the. upper few hundred meters, which all CTD casts exceeded. The CTD/O2 data were calibrated according to the World Ocean Circulation Experiment (WOCE) require- ments, with a resulting accuracy of 0.002øC, 0.003 for salinity, and 0.07 mL L-•.
Most of the CTD casts were accompanied by a lowered ADCP (LADCP) which was attached to the water-sampling rosette. The ADCP was of the new RD Instruments broadband
technology with 150-kHz center frequency, and it was pro- grammed to 16 m vertical resolution. Absolute velocity profiles
down to the CTD depth were derived by applying the proce- dure of Fischer and Visbeck [1993], and the accuracy of indi- vidual LADCP profiles was estimated at 5 cm s -•. The LADCP stations were concentrated along four sections, west- ward along 8øN through the eastern periphery of the Great Whirl (stations 41 to 48, Figure 1), along the Somali economic zone (stations 51 to 61), across the passage between Somalia and Socotra at about 12øN (stations 67 to 71), and along the meridional section at 56ø30'E (stations 80 to 85).
3. Circulation and Water Masses
The surface currents revealed the prominent features of the anticyclonic Great Whirl (Figure 2a), which was encountered west of 56øE and south of 9ø30'N; the Socotra Gyre east of the island of Socotra, roughly between 54 ø and 58øE and 10 ø to 14øN; and the flow across the shallow shelf east of Socotra and through the passage between Cape Guardafui and the island of Abd al Kuri.
Generally, the intense currents of the area are confined to the top 300 m, with most of the near-surface currents decayed to near-zero values at a depth of 200 m. In terms of density or temperature, the limits of the monsoon circulation may be described by the depth of fro = 26.1 or the 15øC isotherm. Only in the northwestern part of the area, i.e., close to the. passage between Abd al Kuri and the African continent, were currents reaching deeper than the range of the shipboard ADCP.
Two composite sea surface temperature (SST) images, from August i3 and 18, were obtained during the survey (Figure 2b; courtesy O. Brown, Rosenstiel School of Marine and Atmo- spheric Sciences, University of Miami). Both show basically the same pattern, an almost circular shape of the 25øC isotherm associated with the northern edge of the Great Whirl and another circular feature southeast of Socotra associated with
the Socotra Gyre. Two cold wedges were present at the Somali coast, of which the southern wedge, south of 5øN, defined the northern edge of the Southern Gyre. The cold wedge near
3576 FISCHER ET AL.: GREAT WHIRL CIRCULATION AND TRANSPORT
15 ø
N
10 ø
5
C 50 ø 55ø E 60 ø
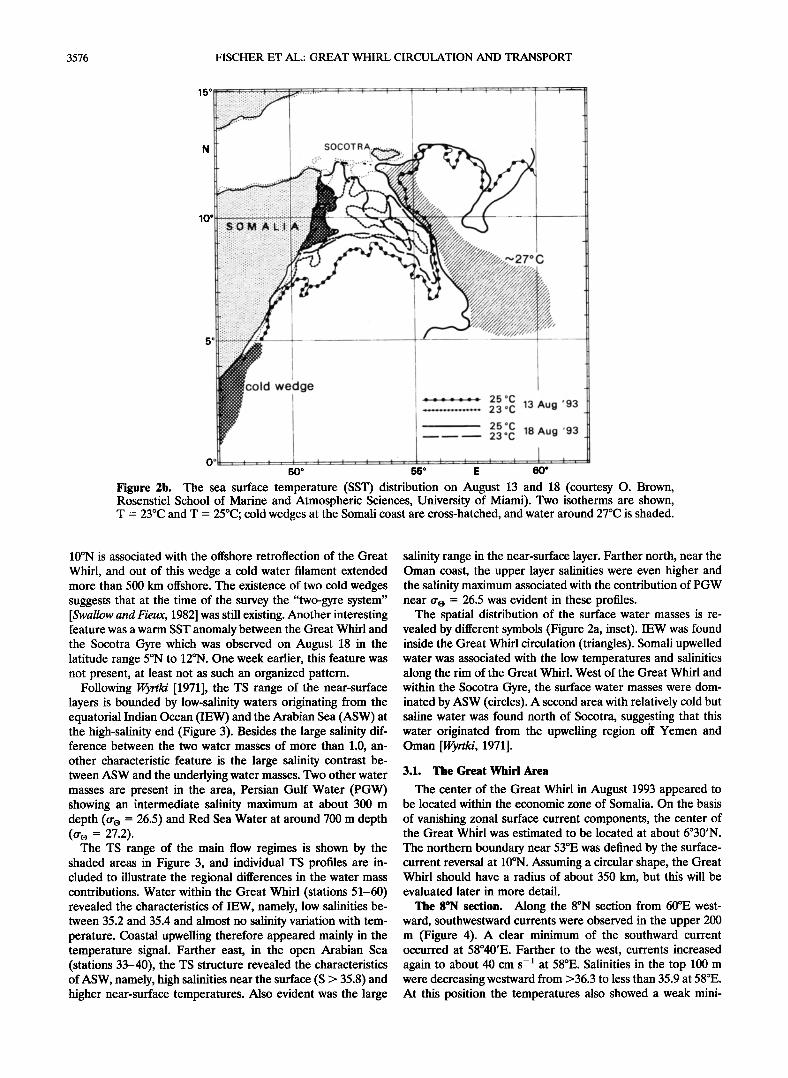
Figure 2b. The sea surface temperature (SST) distribution on August 13 and 18 (courtesy O. Brown, Rosenstiel School of Marine and Atmospheric Sciences, University of Miami). Two isotherms are shown, T = 23øC and T = 25øC; cold wedges at the Somali coast are cross-hatched, and water around 27øC is shaded.
10øN is associated with the offshore retroflection of the Great
Whirl, and out of this wedge a cold water filament extended more than 500 km offshore. The existence of two cold wedges suggests that at the time of the survey the "two-gyre system" [Swallow and Fieux, 1982] was still existing. Another interesting feature was a warm SST anomaly between the Great Whirl and the Socotra Gyre which was observed on August 18 in the latitude range 5øN to 12øN. One week earlier, this feature was not present, at least not as such an organized pattern.
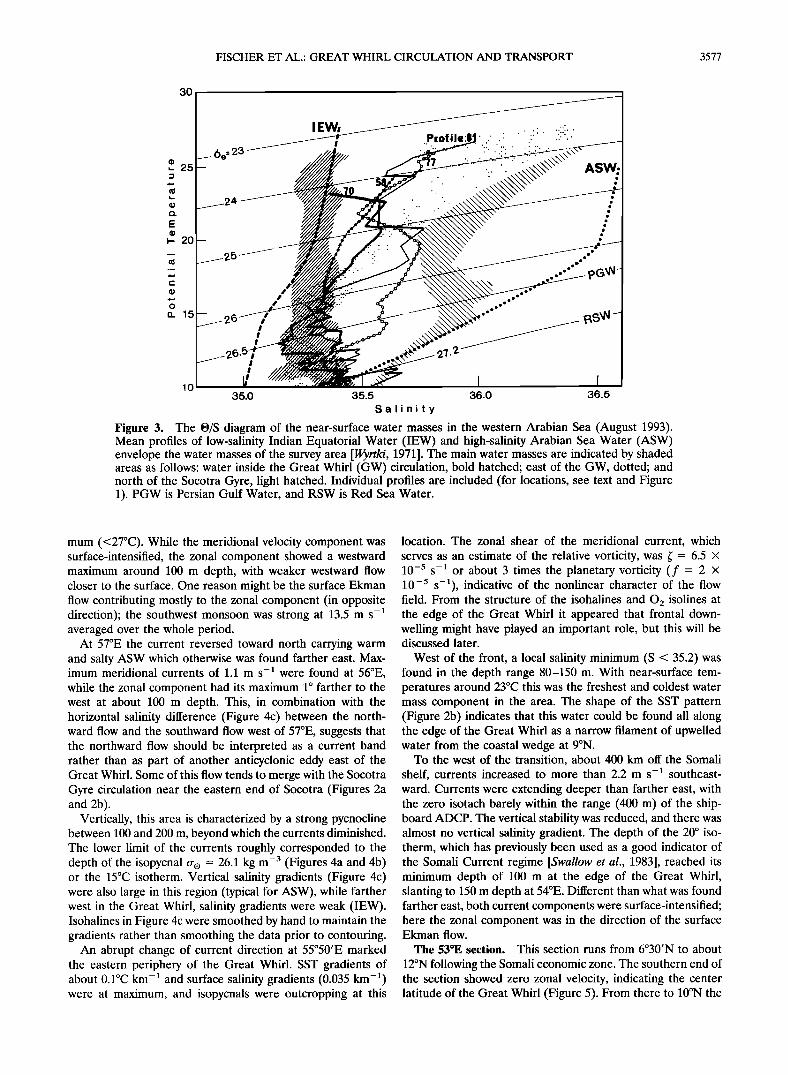
Following Wyrtki [1971], the TS range of the near-surface layers is bounded by low-salinity waters originating from the equatorial Indian Ocean (IEW) and the Arabian Sea (ASW) at the high-salinity end (Figure 3). Besides the large salinity dif- ference between the two water masses of more than 1.0, an- other characteristic feature is the large salinity contrast be- tween ASW and the underlying water masses. Two other water masses are present in the area, Persian Gulf Water (PGW) showing an intermediate salinity maximum at about 300 m depth (o'o = 26.5) and Red Sea Water at around 700 m depth (%o = 27.2).
The TS range of the main flow regimes is shown by the shaded areas in Figure 3, and individual TS profiles are in- cluded to illustrate the regional differences in the water mass contributions. Water within the Great Whirl (stations 51-60) revealed the characteristics of IEW, namely, low salinities be- tween 35.2 and 35.4 and almost no salinity variation with tem- perature. Coastal upwelling therefore appeared mainly in the temperature signal. Farther east, in the open Arabian Sea (stations 33-40), the TS structure revealed the characteristics of ASW, namely, high salinities near the surface (S > 35.8) and higher near-surface temperatures. Also evident was the large
salinity range in the near-surface layer. Farther north, near the Oman coast, the upper layer salinities were even higher and the salinity maximum associated with the contribution of PGW near o'o = 26.5 was evident in these profiles.
The spatial distribution of the surface water masses is re- vealed by different symbols (Figure 2a, inset). IEW was found inside the Great Whirl circulation (triangles). Somali upwelled water was associated with the low temperatures and salinities along the rim of the Great Whirl. West of the Great Whirl and within the Socotra Gyre, the surface water masses were dom- inated by ASW (circles). A second area with relatively cold but saline water was found north of Socotra, suggesting that this water originated from the upwelling region off Yemen and Oman [Wyrtki, 1971].
3.1. The Great Whirl Area
The center of the Great Whirl in August 1993 appeared to be located within the economic zone of Somalia. On the basis
of vanishing zonal surface current components, the center of the Great Whirl was estimated to be located at about 6ø30'N.
The northern boundary near 53øE was defined by the surface- current reversal at 10øN. Assuming a circular shape, the Great Whirl should have a radius of about 350 km, but this will be evaluated later in more detail.
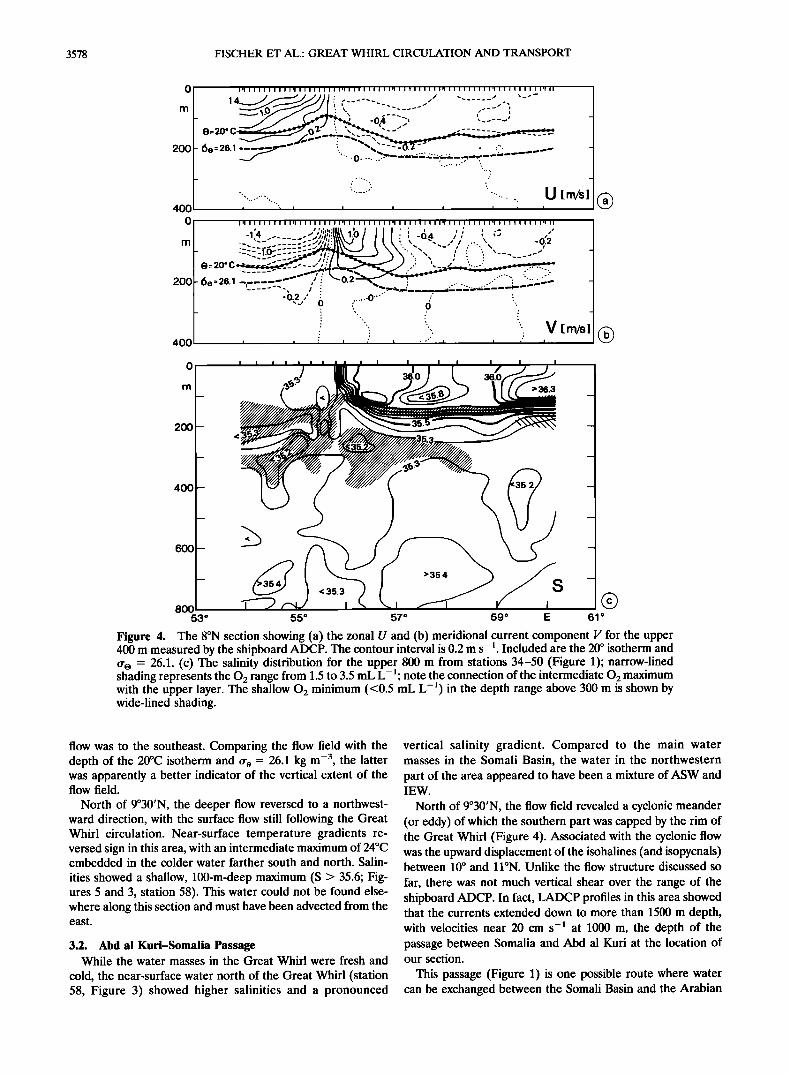
The 8øN section. Along the 8øN section from 60øE west- ward, southwestward currents were observed in the upper 200 m (Figure 4). A clear minimum of the southward current occurred at 58ø40'E. Farther to the west, currents increased again to about 40 cm s -] at 58øE. Salinities in the top 100 m were decreasing westward from >36.3 to less than 35.9 at 58øE. At this position the temperatures also showed a weak mini-
FISCHER ET AL.: GREAT WHIRL CIRCULATION AND TRANSPORT 3577
30
e 25
•. 20
n 15
10
23 •--•-•-•
24
35.0 35.5 36.0 36.5 Salinity
Figure 3. The ©/S diagram of the near-surface water masses in the western Arabian Sea (August 1993). Mean profiles of low-salinity Indian Equatorial Water (IEW) and high-salinity Arabian Sea Water (ASW) envelope the water masses of the survey area [Wyrtki, 1971]. The main water masses are indicated by shaded areas as follows: water inside the Great Whirl (GW) circulation, bold hatched; east of the GW, dotted; and north of the Socotra Gyre, light hatched. Individual profiles are included (for locations, see text and Figure 1). PGW is Persian Gulf Water, and RSW is Red Sea Water.
mum (<27øC). While the meridional velocity component was surface-intensified, the zonal component showed a westward maximum around 100 m depth, with weaker westward flow closer to the surface. One reason might be the surface Ekman flow contributing mostly to the zonal component (in opposite direction); the southwest monsoon was strong at 13.5 m s -• averaged over the whole period.
At 57øE the current reversed toward north carrying warm and salty ASW which otherwise was found farther east. Max- imum meridional currents of 1.1 m s -• were found at 56øE, while the zonal component had its maximum 1 ø farther to the west at about 100 m depth. This, in combination with the horizontal salinity difference (Figure 4c) between the north- ward flow and the southward flow west of 57øE, suggests that the northward flow should be interpreted as a current band rather than as part of another anticyclonic eddy east of the Great Whirl. Some of this flow tends to merge with the Socotra Gyre circulation near the eastern end of Socotra (Figures 2a and 2b).
Vertically, this area is characterized by a strong pycnocline between 100 and 200 m, beyond which the currents diminished. The lower limit of the currents roughly corresponded to the depth of the isopycnal o- o = 26.1 kg m -3 (Figures 4a and 4b) or the 15øC isotherm. Vertical salinity gradients (Figure 4c) were also large in this region (typical for ASW), while farther west in the Great Whirl, salinity gradients were weak (IEW). Isohalines in Figure 4c were smoothed by hand to maintain the gradients rather than smoothing the data prior to contouring.
An abrupt change of current direction at 55ø50'E marked the eastern periphery of the Great Whirl. SST gradients of about 0.1øC km -• and surface salinity gradients (0.035 km -•) were at maximum, and isopycnals were outcropping at this
location. The zonal shear of the meridional current, which serves as an estimate of the relative vorticity, was • = 6.5 x 10 -5 s -• or about 3 times the planetary vorticity (f = 2 x 10 -s s-•), indicative of the nonlinear character of the flow field. From the structure of the isohalines and 02 isolines at the edge of the Great Whirl it appeared that frontal down- welling might have played an important role, but this will be discussed later.
West of the front, a local salinity minimum (S < 35.2) was found in the depth range 80-150 m. With near-surface tem- peratures around 23øC this was the freshest and coldest water mass component in the area. The shape of the SST pattern (Figure 2b) indicates that this water could be found all along the edge of the Great Whirl as a narrow filament of upwelled water from the coastal wedge at 9øN.
To the west of the transition, about 400 km off the Somali shelf, currents increased to more than 2.2 m s -• southeast- ward. Currents were extending deeper than farther east, with the zero isotach barely within the range (400 m) of the ship- board ADCP. The vertical stability was reduced, and there was almost no vertical salinity gradient. The depth of the 20 ø iso- therm, which has previously been used as a good indicator of the Somali Current regime [Swallow et al., 1983], reached its minimum depth of 100 m at the edge of the Great Whirl, slanting to 150 m depth at 54øE. Different than what was found farther east, both current components were surface-intensified; here the zonal component was in the direction of the surface Ekman flow.
The 53øE section. This section runs from 6ø30'N to about
12øN following the Somali economic zone. The southern end of the section showed zero zonal velocity, indicating the center latitude of the Great Whirl (Figure 5). From there to 10øN the
3578 FISCHER ET AL.: GREAT WHIRL CIRCULATION AND TRANSPORT
2OO
400
0
2OO
400
I,I II I I I I I I I'1 I I I II I II Iq I II I II I I I'1 I I II I I I I1'1 II I I I I I I I'1 I I I I I I I I I'1 II
e_2ooc ':' ',,_- ,_ .............
6e = 26.1 ,. .... 0 ........ ß '•"--"•'=-- -- '--'."'•'-- ?"?. -----"
ß ... ..... .
...
_
................... . U [m/s] ß
i i i i
iqllll iIii i,i i iiiiiiiiq IIIIIIIIllll I IIIIIIIq III IIII IIq II III III Iqll
-1'4 .-';;;•l':tt•\ 1•3 ) / • I i ; A,, .;; ', •.• .. '-- _ ..... :-,/,}',: k• ,. • ', ,, / .... , -0.2 ..... ._,: .. ,, ,. .... ".. ,, / : --,
•:20 •C' ' •' .; ', • : ..... " ...
' . .. ...... . ........ -0.2 ,' ...... 0"'
--, o : 6 '" •. .
.. .
. ,. .. .. ß
• '. .i. i . i . i ..-' i i .'
V [m/s] i
rn
400 -
600 -
8OO 53 ø
Figure 4. The 8øN section showing (a) the zonal U and (b) meridional current component V for the upper 400 m measured by the shipboard ADCP. The contour interval is 0.2 m s-]. Included are the 20 ø isotherm and (r e = 26.1. (c) The salinity distribution for the upper 800 m from stations 34-50 (Figure 1); narrow-lined shading represents the 02 range from 1.5 to 3.5 mL L-I; note the connection of the intermediate 02 maximum with the upper layer. The shallow 02 minimum (<0.5 mL L -1) in the depth range above 300 m is shown by wide-lined shading.
flow was to the southeast. Comparing the flow field with the depth of the 20øC isotherm and (ro = 26.1 kg m -3, the latter was apparently a better indicator of the vertical extent of the flow field.
North of 9ø30'N, the deeper flow reversed to a northwest- ward direction, with the surface flow still following the Great Whirl circulation. Near-surface temperature gradients re- versed sign in this area, with an intermediate maximum of 24øC embedded in the colder water farther south and north. Salin-
ities showed a shallow, 100-m-deep maximum (S > 35.6; Fig- ures 5 and 3, station 58). This water could not be found else- where along this section and must have been advected from the east.
3.2. Abd al Kuri-Somalia Passage While the water masses in the Great Whirl were fresh and
cold, the near-surface water north of the Great Whirl (station 58, Figure 3) showed higher salinities and a pronounced
vertical salinity gradient. Compared to the main water masses in the Somali Basin, the water in the northwestern part of the area appeared to have been a mixture of ASW and IEW.
North of 9ø30'N, the flow field revealed a cyclonic meander (or eddy) of which the southern part was capped by the rim of the Great Whirl (Figure 4). Associated with the cyclonic flow was the upward displacement of the isohalines (and isopycnals) between 10 ø and 11øN. Unlike the flow structure discussed so
far, there was not much vertical shear over the range of the shipboard ADCP. In fact, LADCP profiles in this area showed that the currents extended down to more than 1500 m depth, with velocities near 20 cm s -• at 1000 m, the depth of the passage between Somalia and Abd al Kuri at the location of our section.
This passage (Figure 1) is one possible route where water can be exchanged between the Somali Basin and the Arabian
FISCHER ET AL.' GREAT WHIRL CIRCULATION AND TRANSPORT 3579
0
2OO ,
4OO
0
m
2OO
4OO
600 -
6"
I I I I I I I I I I I I I _1 _ Ii I I I I t
• _
35.5 > 35.• <3• L 7 •' 8 ø 9 ø 10 ø I N 12 ø
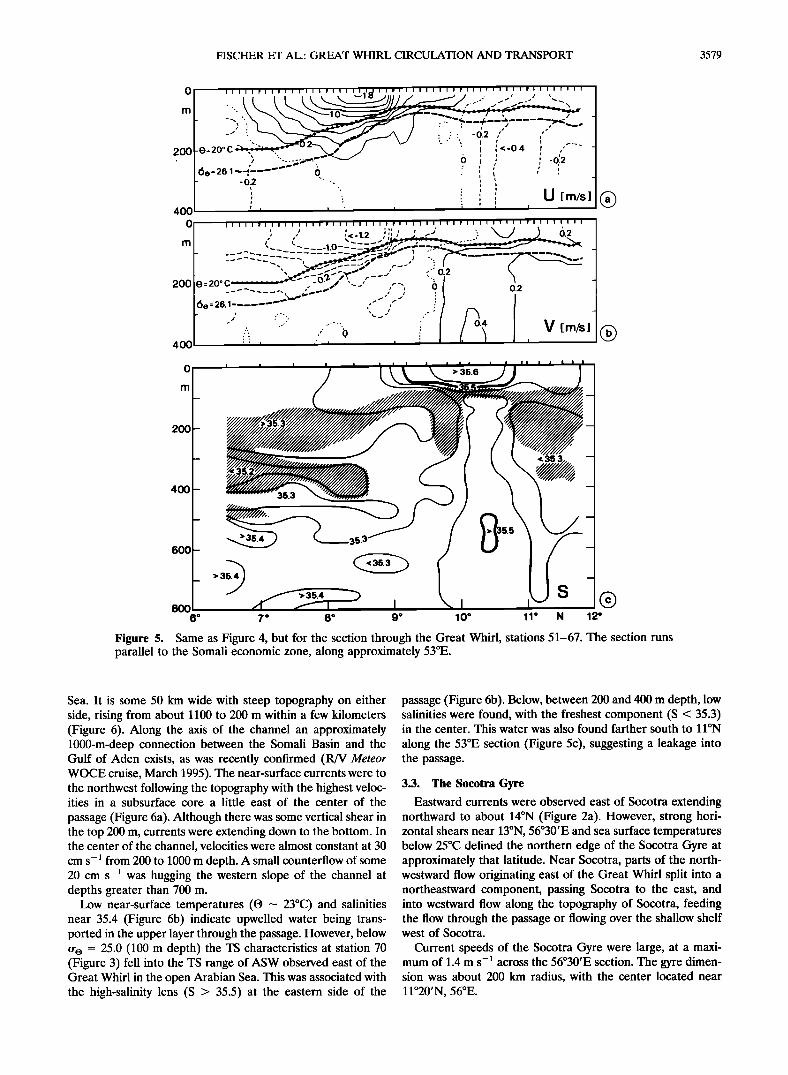
Figure 5. Same as Figure 4, but for the section through the Great Whirl, stations 51-67. The section runs parallel to the Somali economic zone, along approximately 53øE.
Sea. It is some 50 km wide with steep topography on either side, rising from about 1100 to 200 m within a few kilometers (Figure 6). Along the axis of the channel an approximately 1000-m-deep connection between the Somali Basin and the Gulf of Aden exists, as was recently confirmed (R/V Meteor WOCE cruise, March 1995). The near-surface currents were to the northwest following the topography with the highest veloc- ities in a subsurface core a little east of the center of the
passage (Figure 6a). Although there was some vertical shear in the top 200 m, currents were extending down to the bottom. In the center of the channel, velocities were almost constant at 30 cm s- • from 200 to 1000 m depth. A small counterflow of some 20 cm s -• was hugging the western slope of the channel at depths greater than 700 m.
Low near-surface temperatures (t9 --- 23øC) and salinities near 35.4 (Figure 6b) indicate upwelled water being trans- ported in the upper layer through the passage. However, below rro = 25.0 (100 m depth) the TS characteristics at station 70 (Figure 3) fell into the TS range of ASW observed east of the Great Whirl in the open Arabian Sea. This was associated with the high-salinity lens (S > 35.5) at the eastern side of the
passage (Figure 6b). Below, between 200 and 400 m depth, low salinities were found, with the freshest component (S < 35.3) in the center. This water was also found farther south to 1 iøN
along the 53øE section (Figure 5c), suggesting a leakage into the passage.
3.3. The Socotra Gyre
Eastward currents were observed east of Socotra extending northward to about 14øN (Figure 2a). However, strong hori- zontal shears near 13øN, 56ø30'E and sea surface temperatures below 25øC defined the northern edge of the Socotra Gyre at approximately that latitude. Near Socotra, parts of the north- westward flow originating east of the Great Whirl split into a northeastward component, passing Socotra to the east, and into westward flow along the topography of Socotra, feeding the flow through the passage or flowing over the shallow shelf west of Socotra.
Current speeds of the Socotra Gyre were large, at a maxi- mum of 1.4 m s-• across the 56ø30'E section. The gyre dimen- sion was about 200 km radius, with the center located near 1 lø20'N, 56øE.
3580 FISCHER ET AL.' GREAT WHIRL CIRCULATION AND TRANSPORT
•-- Somalia
Stat. No. 67
ø l ' (•e=25.0 ß 26
200 0.3
Abdal Kuri •
68 69 70 71 I I ! I
D. 4
400 0.3
6OO
x \
800 -0.2'• '• ..
........
....."
I000 :::::::::::::::::::::::::::::::::::::::::::::::::::::::: .-':
V [m/s] •/•' ' ' "•' ' '" ' ':••• I
51045 ' 50' 55' 52000 ' 05' E 10'
400 •:• •::. •
354
ooo I
51045' 50' 55' 52000 ' 05' E 10'
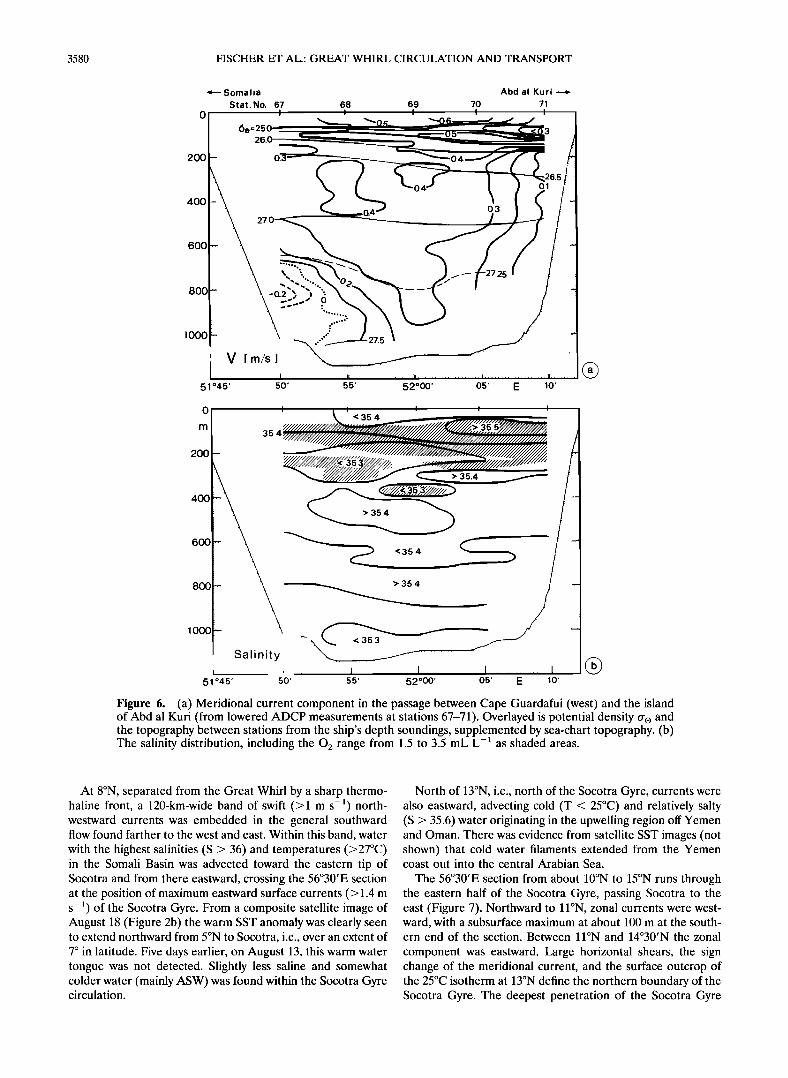
Figure 6. (a) Meridional current component in the passage between Cape Guardafui (west) and the island of Abd al Kuri (from lowered ADCP measurements at stations 67-71). Overlayed is potential density tro and the topography between stations from the ship's depth soundings, supplemented by sea-chart topography. (b) The salinity distribution, including the 02 range from 1.5 to 3.5 mL L-• as shaded areas.
At 8øN, separated from the Great Whirl by a sharp thermo- haline front, a 120-km-wide band of swift (>1 m s -I) north- westward currents was embedded in the general southward flow found farther to the west and east. Within this band, water with the highest salinities (S > 36) and temperatures (>27øC) in the Somali Basin was advected toward the eastern tip of Socotra and from there eastward, crossing the 56ø30'E section at the position of maximum eastward surface currents (> 1.4 m s-•) of the Socotra Gyre. From a composite satellite image of August 18 (Figure 2b) the warm SST anomaly was clearly seen to extend northward from 5øN to Socotra, i.e., over an extent of 7 ø in latitude. Five days earlier, on August 13, this warm water tongue was not detected. Slightly less saline and somewhat colder water (mainly ASW) was found within the Socotra Gyre circulation.
North of 13øN, i.e., north of the Socotra Gyre, currents were also eastward, advecting cold (T < 25øC) and relatively salty (S > 35.6) water originating in the upwelling region off Yemen and Oman. There was evidence from satellite SST images (not shown) that cold water filaments extended from the Yemen coast out into the central Arabian Sea.
The 56ø30'E section from about 10øN to 15øN runs through the eastern half of the Socotra Gyre, passing Socotra to the east (Figure 7). Northward to lløN, zonal currents were west- ward, with a subsurface maximum at about 100 m at the south- ern end of the section. Between lløN and 14ø30'N the zonal
component was eastward. Large horizontal shears, the sign change of the meridional current, and the surface outcrop of the 25øC isotherm at 13øN define the northern boundary of the Socotra Gyre. The deepest penetration of the Socotra Gyre
FISCHER ET AL.: GREAT WHIRL CIRCULATION AND TRANSPORT 3581
0
200
400
0
rn
2OO
400
I I I I • I I I I I • ,I I I I I t I I I I I • I I I I I • I I I I I' I I I I I T I I I I I I I I I I P I I I I
--- • . .•,..,• '
e:2o•c . ,-- .... 2•' ' 60 = 26 • -....•..._•,-' .' .... '. 6 .. - - .. -. ,,' '-... . '
'. . o ' U [m/s] -. .'" .. , . ß ... ß .. ,
i i i ,,i -'"' i ,• ,." i ' i i
I I [ p I I I i i • i i i I I' I I I i i' i i I i I, i i i i i , i i i i I • i i i i i' i i i i i • i i i i
•' ; , { , : ..... :: :' ', ,,', .......... ::,:::.":_:
,:.::.:::__ ' " ' 2'" :- , _-• -0. :. ' .............. 0 "•
o:;'o:c' _ 60 = 26.1 --• ..... • ..... 0"
o., -o.• ..... , ': V [m/s] .i i i • i i i t i ,'1 ß i
m!
400 < 600 '
__• 355 •• --355 8 O0 3,5.5
I i i
14 ø 15 ø 10 ø 11 ø 12 ø 13 ø N
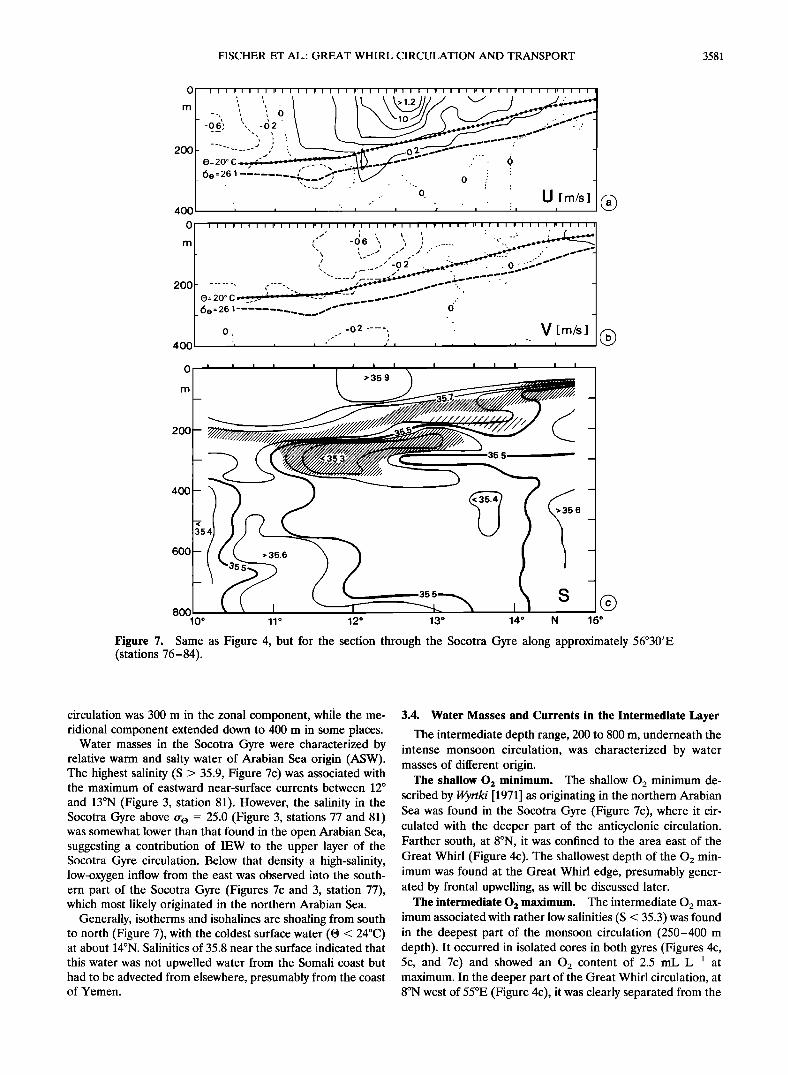
Figure 7. Same as Figure 4, but for the section through the Socotra Gyre along approximately 56ø30'E (stations 76-84).
circulation was 300 m in the zonal component, while the me- ridional component extended down to 400 m in some places.
Water masses in the Socotra Gyre were characterized by relative warm and salty water of Arabian Sea origin (ASW). The highest salinity (S > 35.9, Figure 7c) was associated with the maximum of eastward near-surface currents between 12 ø
and 13øN (Figure 3, station 81). However, the salinity in the Socotra Gyre above fro = 25.0 (Figure 3, stations 77 and 81) was somewhat lower than that found in the open Arabian Sea, suggesting a contribution of IEW to the upper layer of the Socotra Gyre circulation. Below that density a high-salinity, low-oxygen inflow from the east was observed into the south- ern part of the Socotra Gyre (Figures 7c and 3, station 77), which most likely originated in the northern Arabian Sea.
Generally, isotherms and isohalines are shoaling from south to north (Figure 7), with the coldest surface water (19 < 24øC) at about 14øN. Salinities of 35.8 near the surface indicated that
this water was not upwelled water from the Somali coast but had to be advected from elsewhere, presumably from the coast of Yemen.
3.4. Water Masses and Currents in the Intermediate Layer
The intermediate depth range, 200 to 800 m, underneath the intense monsoon circulation, was characterized by water masses of different origin.
The shallow O• minimum. The shallow 02 minimum de- scribed by Wyrtki [1971] as originating in the northern Arabian Sea was found in the Socotra Gyre (Figure 7c), where it cir- culated with the deeper part of the anticyclonic circulation. Farther south, at 8øN, it was confined to the area east of the
Great Whirl (Figure 4c). The shallowest depth of the 02 min- imum was found at the Great Whirl edge, presumably gener- ated by frontal upwelling, as will be discussed later.
The intermediate O• maximum. The intermediate 02 max- imum associated with rather low salinities (S < 35.3) was found in the deepest part of the monsoon circulation (250-400 m depth). It occurred in isolated cores in both gyres (Figures 4c, 5c, and 7c) and showed an 02 content of 2.5 mL L -• at maximum. In the deeper part of the Great Whirl circulation, at 8øN west of 55øE (Figure 4c), it was clearly separated from the
3582 FISCHER ET AL.: GREAT WHIRL CIRCULATION AND TRANSPORT
oxygen-rich upper layer by the shallow 0 2 minimum. However, 70 at the edge of the Great Whirl (8øN, 55ø10'E) the isohalines Sv and the intermediate 0 2 maximum were displaced upward, suggesting a connection of the intermediate 02 maximum with the mixed layer (Figure 4c). Besides the core of high-oxygen water underneath the Great Whirl (Figure 5c, south of 9øN), a 40 downward extension of oxygen-rich water was observed at 53øE, south of 10øN (Figure 5c) as part of the deep reaching cyclonic flow (Figures 5a and 5b) and was also found farther north in the onshore part of this flow pattern. From there a small portion was leaking into the passage between Somalia and Abd al Kuri (Figure 6). 10
The deep salinity maximum. The deep salinity maximum 0
(S > 35.5) was associated with the outflow of the Red Sea. Clear evidence of an RSW contribution was found south of -•0 11.5øN underneath the Socotra Gyre (Figure 7c). Geostrophic currents relative to 400 m (the LADCP did not work in that area) showed weak westward flow in this area, and in fact, a Sv small RSW core was found in the same latitude range at station e0 74, which was about 2 ø farther east. Remnants of the salinity maximum were also found in the northwestern part of the area at station 60 (Figure 5c; for location, see Figure 1). The some- what shallower depth range (500-600 m) could be explained 0 by the doming of isohalines due to the cyclonic circulation in this area. -10
There were weak indications of an RSW contribution in the
passage between Somalia and Abd al Kuri. A salinity maxi- mum, S > 35.4, was located in the depth range 600-800 m, slightly shallower near the topography than in the center of the -a0 passage. It was at this depth where the deep return flow was found in the western part of the passage. This might be an indication of a recirculation of the generally northward flow in
the passage. Sv Summarizing, we found that during our survey, RSW en-
40 tered the Somali Basin from the east rather than through the passage between Somalia and Abd al Kuri. On its way around Socotra it appears to have been mixed with the surrounding water, as indicated by decreasing salinities from east to west.
4. Transports Transports were mainly derived from shipboard ADCP data
and from LADCP data where intense currents were reaching deeper than 400 m. Near-surface transports for both data sets were estimated by upward shear extrapolation from the first reliable current measurement at 25 m depth (shipboard ADCP) and from about 40 m depth for the LADCP data set. Geostrophic transports were calculated for comparison with the directly measured currents and for closing transport boxes. Ekman transports were estimated from ship winds measured by the ship's meteorological station.
4.1. The Great Whirl
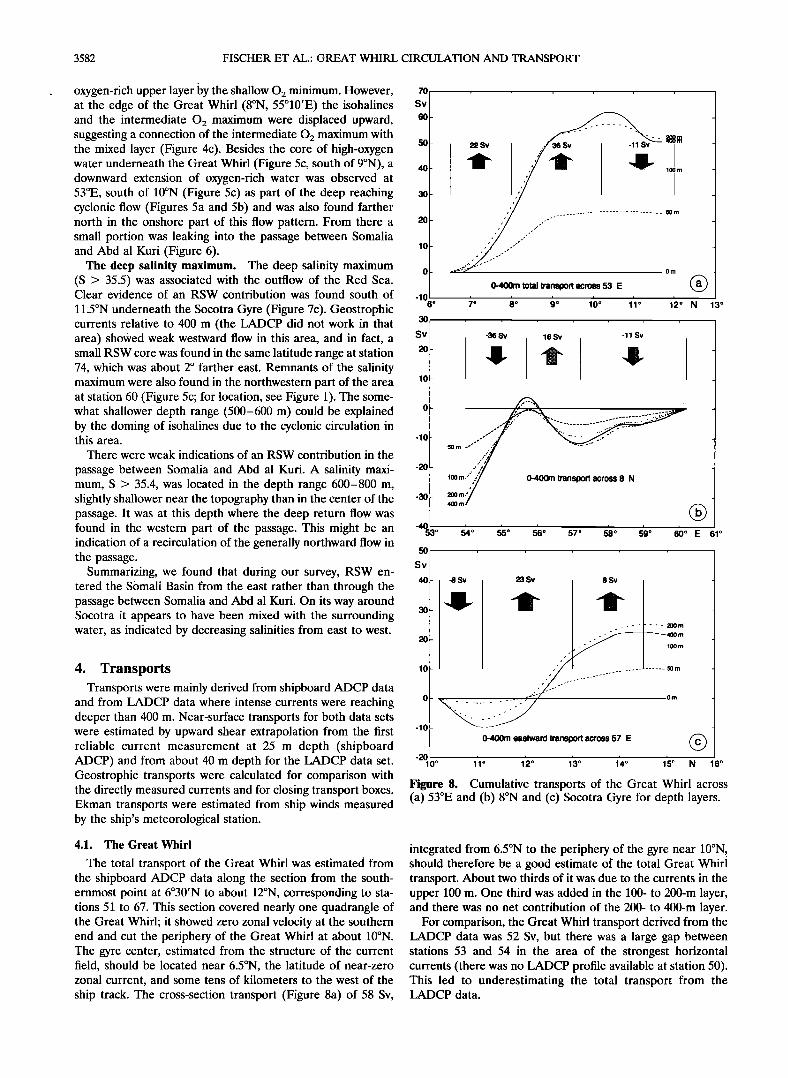
The total transport of the Great Whirl was estimated from the shipboard ADCP data along the section from the south- ernmost point at 6ø30'N to about 12øN, corresponding to sta- tions 51 to 67. This section covered nearly one quadrangle of the Great Whirl; it showed zero zonal velocity at the southern end and cut the periphery of the Great Whirl at about 10øN. The gyre center, estimated from the structure of the current field, should be located near 6.5øN, the latitude of near-zero zonal current, and some tens of kilometers to the west of the ship track. The cross-section transport (Figure 8a) of 58 Sv,
lOOm
I 50 m
-f" 0 m
0-400m total transport across 53 E
6 ø 7 ø 8 ø 9 ø 10 ø 11 ø 12 ø N 13 ø
30
-36 Sv 16 Sv -11 Sv
400m
-4O 53 ø •o 5•o 5'15o 57 ø 58 o 59 ø 60o E 61 ø
-8 Sv 23 Sv 8 Sv
.... 200m
20 • m lOOm
10 ' - ..... 50m
0 0m
0-400m eastward transport across 57 E (• -20 10 ø 1'1 ø 1'2 ø 1• ø 1'4 ø 1'5" N 16 ø
Figure 8. Cumulative transports of the Great Whirl across (a) 53øE and (b) 8øN and (c) Socotra Gyre for depth layers.
integrated from 6.5øN to the periphery of the gyre near 10øN, should therefore be a good estimate of the total Great Whirl transport. About two thirds of it was due to the currents in the upper 100 m. One third was added in the 100- to 200-m layer, and there was no net contribution of the 200- to 400-m layer.
For comparison, the Great Whirl transport derived from the LADCP data was 52 Sv, but there was a large gap between stations 53 and 54 in the area of the strongest horizontal currents (there was no LADCP profile available at station 50). This led to underestimating the total transport from the LADCP data.
FISCHER ET AL.: GREAT WHIRL CIRCULATION AND TRANSPORT 3583
_
..... • I . I I • I , I . I I I
15 ø
N
10 ø
5 ø
50ø 55 ø E 60*
==•> geostrophy rel. 400 dbar
box budgets shipboard ADCP
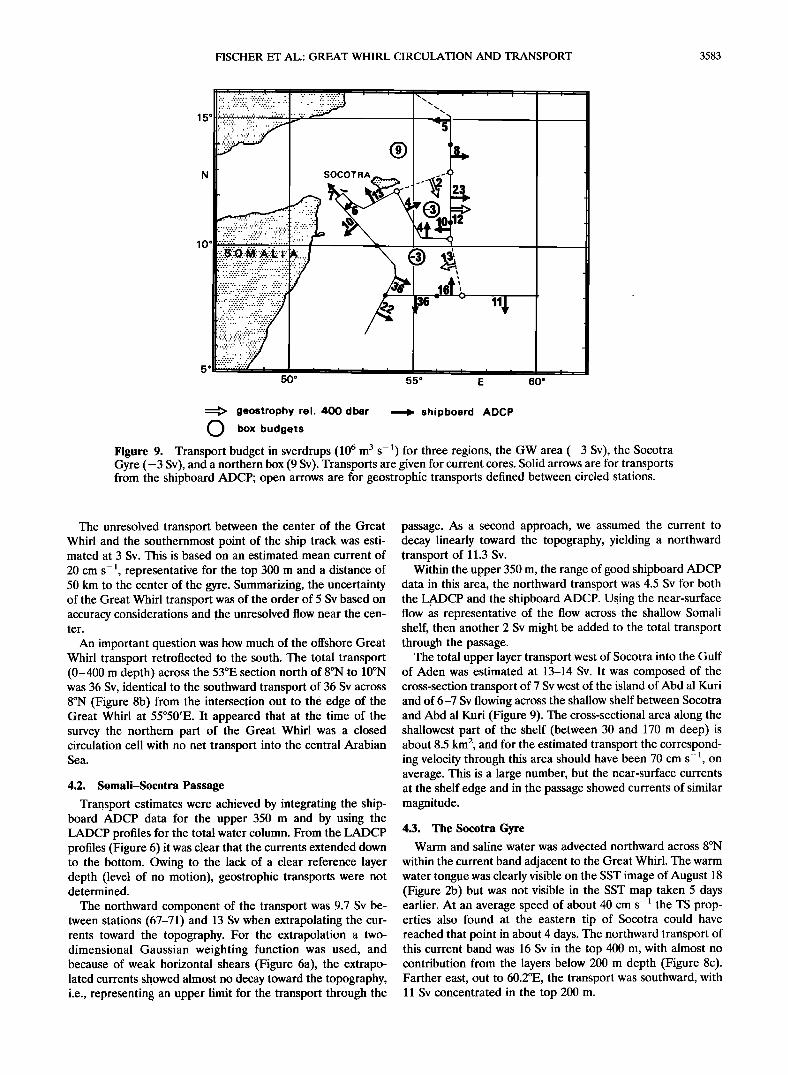
Figure 9. Transport budget in sverdrups (10 6 m 3 S -z) for three regions, the GW area (-3 Sv), the Socotra Gyre (-3 Sv), and a northern box (9 Sv). Transports are given for current cores. Solid arrows are for transports from the shipboard ADCP; open arrows are for geostrophic transports defined between circled stations.
The unresolved transport between the center of the Great Whirl and the southernmost point of the ship track was esti- mated at 3 Sv. This is based on an estimated mean current of
20 cm s-•, representative for the top 300 m and a distance of 50 km to the center of the gyre. Summarizing, the uncertainty of the Great Whirl transport was of the order of 5 Sv based on accuracy considerations and the unresolved flow near the cen- ter.
An important question was how much of the offshore Great Whirl transport retroflected to the south. The total transport (0-400'm depth) across the 53øE section north of 8øN to 10øN was 36 Sv, identical to the southward transport of 36 Sv across 8øN (Figure 8b) from the intersection out to the edge of the Great Whirl at 55ø50'E. It appeared that at the time of the survey the northern part of the Great Whirl was a closed circulation cell with no net transport into the central Arabian Sea.
4.2. Somali-Socotra Passage
Transport estimates were achieved by integrating the ship- board ADCP data for the upper 350 m and by using the LADCP profiles for the total water column. From the LADCP profiles (Figure 6) it was clear that the currents extended down to the bottom. Owing to the lack of a clear reference layer depth (level of no motion), geostrophic transports were not determined.
The northward component of the transport was 9.7 Sv be- tween stations (67-71) and 13 Sv when extrapolating the cur- rents toward the topography. For the extrapolation a two- dimensional Gaussian weighting function was used, and because of weak horizontal shears (Figure 6a), the extrapo- lated currents showed almost no decay toward the topography, i.e., representing an upper limit for the transport through the
passage. As a second approach, we assumed the current to decay linearly toward the topography, yielding a northward transport of 11.3 Sv.
Within the upper 350 m, the range of good shipboard ADCP data in this area, the northward transport was 4.5 Sv for both the LADCP and the shipboard ADCP. Using the near-surface flow as representative of the flow across the shallow Somali shelf, then another 2 Sv might be added to the total transport through the passage.
The total upper layer transport west of Socotra into the Gulf of Aden was estimated at 13-14 Sv. It was composed of the cross-section transport of 7 Sv west of the island of Abd al Kuri and of 6-7 Sv flowing across the shallow shelf between Socotra and Abd al Kuri (Figure 9). The cross-sectional area along the shallowest part of the shelf (between 30 and 170 m deep) is about 8.5 km 2, and for the estimated transport the correspond- ing velocity through this area should have been 70 cm s-•, on average. This is a large number, but the near-surface currents at the shelf edge and in the passage showed currents of similar magnitude.
4.3. The Socotra Gyre Warm and saline water was advected northward across 8øN
within the current band adjacent to the Great Whirl. The warm water tongue was clearly visible on the SST image of August 18 (Figure 2b) but was not visible in the SST map taken 5 days earlier. At an average speed of about 40 cm s-• the TS prop- erties also found at the eastern tip of Socotra could have reached that point in about 4 days. The northward transport of this current band was 16 Sv in the top 400 m, with almost no contribution from the layers below 200 m depth (Figure 8c). Farther east, out to 60.2øE, the transport was southward, with 11 Sv concentrated in the top 200 m.
3584 FISCHER ET AL.: GREAT WHIRL CIRCULATION AND TRANSPORT
The 56ø30'E section from 10ø10'N to 15øN was cutting through the eastern side of the Socotra Gyre and through eastward currents farther north. With 13øN as the northern
boundary the eastward transport associated with the Socotra Gyre was 23 Sv. North of the flow reversal at 10ø10'N (Figure 7), 9.5 Sv entered the Socotra Gyre from the east, leaving a deficit of 13.5 Sv. As an estimate of additional eastward inflow
into the Socotra Gyre, the geostrophic transport determined between stations 40 and 77 yielded 13 Sv.
The uncertainty of this transport could be estimated by con- sideration of the ADCP errors and by comparison with geostrophic transports. Geostrophic transports relative to 400 m for the entire section from 10ø10'N to 13øN were 12 Sv
eastward, thereby about 10% less than the ADCP transport over the same latitude range. This difference could be either explained by the missing Ekman contribution in the geostro- phic estimate or by inaccuracies of the ADCP data, both of which had the same magnitude. Therefore 23 _+ 2 Sv should serve as a good estimate for the total transport of the Socotra Gyre. Between 13 ø and 14ø10'N, currents were to the east, advecting 8 Sv of cold but relatively saline water across 56ø30'E into the central Arabian Sea.
4.4. Transport Budgets
Transport budgets for the upper 400 m (Figure 9) were calculated for three boxes, assuming that the measurements were synoptic. Transports by depth layers (Figure 8) showed that there was no net contribution from the 200- 400-m depth range, indicating that no significant fraction of the monsoon circulation has been neclected by limiting the budgets to the upper 400 m. Further, at some sections there were no CTD measurements, e.g., along the shelf of Socotra, preventing us from calculating budgets for isopycnic layers. Some gaps in the ship track were closed by geostrophic transports relative to 400 dbar, and for some sections, geostrophic transports are shown for comparison.
The western (boundary current) box was defined from 57øE along 8øN to the 53øE section, then northward to 12øN, across the passage and along the Socotra shell then southeastward to the southern end of the 56ø30'E section. This left a 250-km-
wide gap along 57øE through which the transport from the shipboard ADCP was unknown but was determined to be 13 Sv by geostrophic calculations. Accumulating the inflow across all sections, a total of 71 Sv entered the box compared to an outflow of 73.5 Sv. The deficit was only -2.5 Sv, and with an uncertainty of about 6 Sv for the whole box, as discussed earlier, this imbalance was not significantly different from zero.
Another important aspect was the balance of the warm wa- ter inflow and outflow. With the assumption that ASW entered the area through the gap north of 8øN the total ASW inflow was about 29 Sv. Only 13 Sv were found to leave the box eastward with the Socotra Gyre circulation. With the Great Whirl circulation in close balance the remaining 16 Sv of warm water could only have left the box through the northwestern boundary. Some evidence of an ASW contribution was found north of the Great Whirl, where the near-surface salinities were high (S > 35.6) and showed a pronounced vertical gra- dient in about 100 m depth. There was also evidence of some ASW contribution at the eastern side of the passage and to the flow across the Socotra shelf (Figures 2a and 6b).
For the Socotra Gyre a separate balance was calculated (Figure 9). The eastern part of this box was already discussed, with 12-13.5 Sv eastward transport across 56ø30'E. To balance
this, 3.5 Sv entered the box from the south; the geostrophic transport across this section was twice as large (7 Sv). From the west the inflow was 4 Sv (4.5 Sv from geostrophy). The north- ern boundary was closed by the geostrophic transport of 2 Sv between stations 72 and 82. Such a small inflow was supported by the SST pattern showing colder SSTs to the north and no disturbances at the northern periphery of the Socotra Gyre. The deficit for this box was -3 Sv, which could be reduced to almost zero when using only geostrophic transports, but this would enhance the deficit of the western box by the same amount.
The boundaries of the northern box were eastward from
Cape Guardafui along the Socotra shelf to station 82 (13øN, 56ø30'E) and northward to the shelf edge off Oman. Between Socotra and the African continent, 13-14 Sv were entering the box; 2 Sv left the box east of Socotra to feed the Socotra Gyre. With the current band between 13øN and 14ø10'N, 8 Sv left the box in an eastward direction. Farther north, to the shelf edge off Oman, currents with alternating directions resulted in 5 Sv inflow. The imbalance for this box was 9 Sv inflow, but using only shipboard ADCP data, i.e., including the Socotra Gyre circulation, the imbalance would be reduced to 6 Sv excess inflow. Again, this was in the range of the transport uncertain- ties.
5. Discussion
At the time of the experiment, mid-August 1993, the flow field of the northern Somali Basin was dominated by two large anticyclonic eddies, the Great Whirl and the Socotra Gyre. Currents associated with the monsoon circulation were sur-
face-intensified and not reaching deeper than 400 m, with most of the transports confined to the top 200 m. The total Great Whirl transport of 58 Sv was considerably larger than found in geostrophic calculations of earlier experiments for a similar period. Transports of the Socotra Gyre were also large com- pared to earlier findings.
An area average (5ø-15øN, 50ø-60øE) of the monthly FSU pseudo wind stresses [e.g., Legler et al., 1989] showed that the intensity of the summer monsoon 1993 (June-August) was similar to the long-term mean (averaged over the years 1970- 1993). The summer monsoon 1993 has therefore to be consid- ered as typical. Further, by comparing the 1993 monsoon with the monsoon intensity of the years 1975-1977, i.e., during the period of the observations described by Bruce [1979], it ap- peared that the winds were somewhat weaker in 1975, about similar in 1976, and more intense in 1977. The large transport differences reported here compared with those reported by Bruce [1979] could therefore not be explained by differences in the monsoon intensity, but there must be other reasons.
Water masses inside the Great Whirl showed the character-
istics of IEW (Figure 3). The inshore boundary of the Great Whirl was marked by a wedge of cold upwelled water near 9øN (Figure 2b), and a filament of this water was found more than 500 km offshore along the edge of the Great Whirl. However, owing to the complete retroflection of the Great Whirl north of 8øN, the direct exchange of water masses involved in the Great Whirl circulation with the central Arabian Sea was small (Fig- ure 9).
An important region for the water mass exchange was the shallow shelf west of Socotra and the trench between Abd al
Kuri and the shelf of Somalia. Through this area about 13 Sv of upper layer (0-400 m) water left the Somali Basin. The TS
FISCHER ET AL.: GREAT WHIRL CIRCULATION AND TRANSPORT 3585
structure showed that this water was a mixture between ASW
and IEW (probably modified due to coastal upwelling). Water masses within the Socotra Gyre were mainly ASW,
including the band of high-salinity and high-temperature water entering the eddy from the west. It appeared that some of the ASW left the Socotra Gyre circulation and was found near 53øE, 10øN. North of the Socotra Gyre, a different water mass, presumably upwelling water from the coast of Yemen/Oman, was advected eastward with a volume transport of 8 Sv, while closer to the Oman coast, the currents were weak, with alter- nating directions, and the transport was small (about 5 Sv eastward).
5.1. Eklnan Transport
The monsoon was quite stable over the time period of the --1
observations, with a mean wind speed of 13.5 _ 2.8 m s toward 45øT. Accordingly, the surface Ekman flow should be toward the east and the Ekman transport to the southeast.
Inspection of the near-surface currents in the area revealed subsurface maxima of westward currents and surface intensi- fication for the other directions. From this it seemed likely that a superposition of the eastward Ekman flow led to the ob- served current structure. Estimating the contribution of the Ekman transport to the total transport of the Great Whirl across 8øN (2 ø of longitude) yielded 1.5 Sv southward, using the mean wind speed of the period and a drag coefficient of cD = 1.3 x 10 -3. The total Ekman transport across the section through the Great Whirl (53øE section) was about 3 Sv, with half of it attributed to the north of the intersection.
5.2. Geostrophy and Curvature
The observed magnitude of the near-surface velocities and the associated horizontal shears of the Great Whirl suggested that the flow field might not have been in geostrophic balance. Curvature might have played an important role, and relative vorticity might not have been small compared to the planetary vorticity f. The latter was small due to the close proximity to the equator, and the former was large, at least close to the front separating the Great Whirl from the northward flow east of 56øE (there, the relative vorticity was as large as 3f).
The relative vorticity of an eddy with strong curvature
0U U - •- On R
is composed of the radial shear (O/On) of the azimuthal velocity U plus the curvature term; R is the radius of the eddy. The curvature Rossby number U/fR is a measure of the relative importance of the nonlinear (cyclostrophic) term U2R - • in the momentum equation.
From the structure of the Great Whirl circulation (Figure 5a) the largest deviation from geostrophy occurred in the top tOO m, accounting for about 60% of the total Great Whirl transport. The discussion below of the nonlinear contributions therefore concentrates on this layer. Only the baroclinic part of the flow field was taken into account; that is, both the geostro- phic and the ADCP currents relative to 350 m depth were used. This had the following two advantages: first, differences due to the barotropic currents were eliminated; and second, systematic errors in the ADCP data (heading misalignment) were strongly reduced.
In order to achieve an estimate of the curvature term and the contribution of the radial shear, we assumed that the
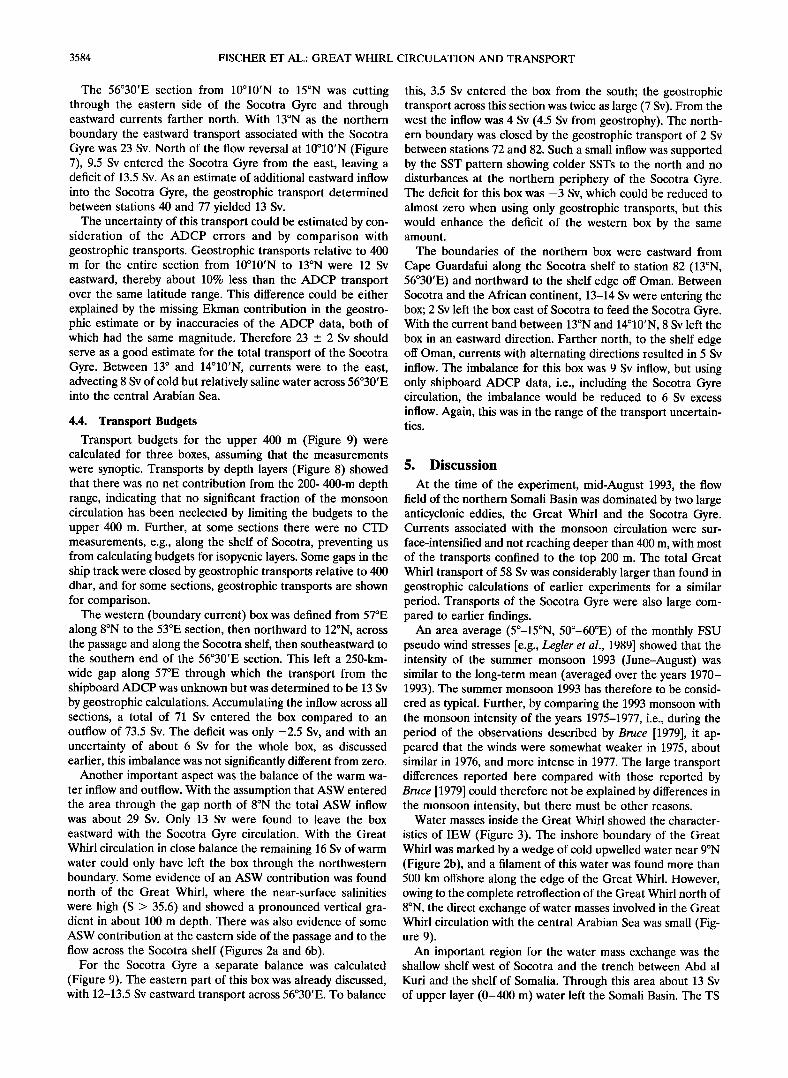
50
Sv t"'.... ' 40-- ..
30
20
10
u
f.R
0.4
0.3
0.2
0.1
Figure 10. Cumulative transports (upper tOO m) of the Great Whirl along the section of Figure 5 from shipboard ADCP (solid line), without the curvature contribution (dashed line), without curvature and Ekman (dash-dotted line), and compared with geostrophic transports (solid circles); all cur- rents are relative to 350 m depth. The curvature Rossby num- ber, U/fR, is shown as a dotted line.
northern part of the Great Whirl circulation was approximately concentric, which is supported by the structure of the 25øC isotherm (Figure 2b). The center of the Great Whirl was de- termined as the crossing point of all vectors perpendicular to the measured current vectors. It was located near 6øN, 53ø40'E
with an uncertainty of _+20 km. The curvature term was then calculated by dividing the amplitude of the current vector, averaged over the top tOO m, by its distance to the center of the eddy and normalized by the planetary vorticity. From the gyre center out to a distance of about 200 km (Figure t0) the cyclostrophic contribution was large (Ro > 0.25) and the upper layer geostrophic transports, accumulated from the southern end of the 53øE section, were substantially lower (24 Sv) than those from the shipboard ADCP (41 Sv). Scaling the ADCP currents according to V a = VAOCP X (t -- U/fR) reduced the cumulative transports significantly, and the re- maining difference between V a and geostrophy is of the order of 5 Sv. Most of the residual difference could be explained by the Ekman transport (see above), which was part of the direct observations and was absent in the geostrophic component (Figure t0).
The conclusion is that nonlinear contributions have to be considered in the determination of the Great Whirl transport and the much smaller geostrophic estimates [e.g., Bruce, 1979] compared with those reported here could be explained by the neglected nonlinearity of the flow field.
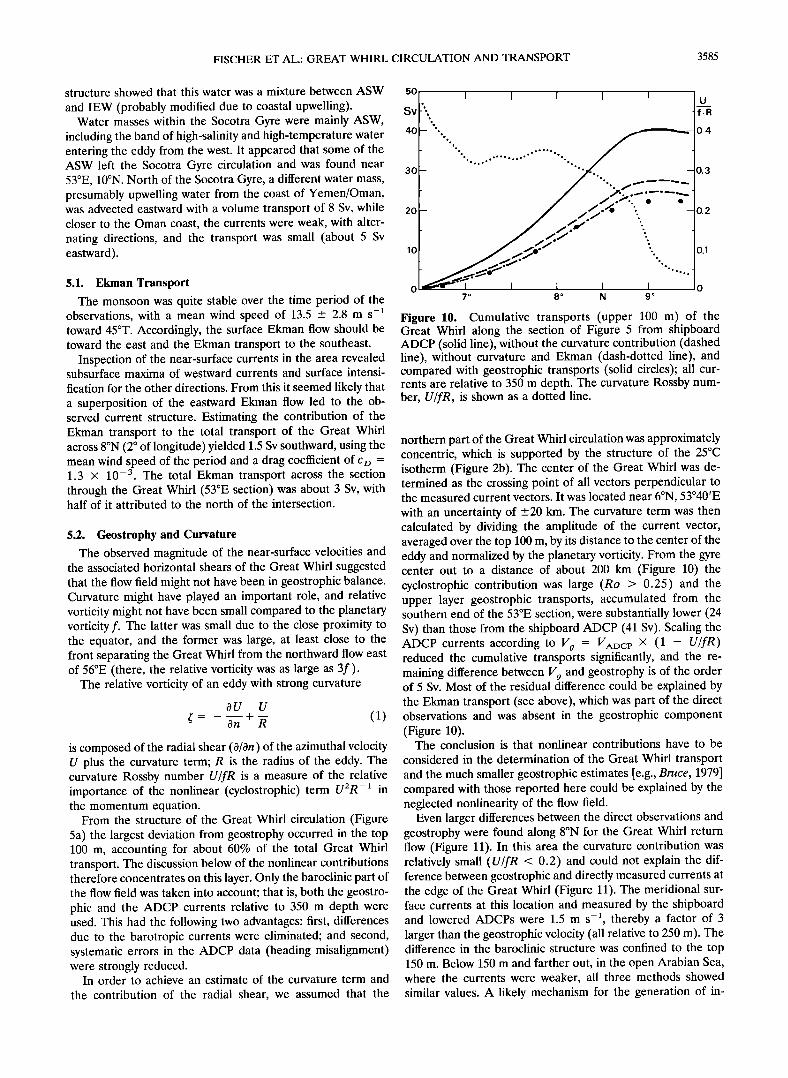
Even larger differences between the direct observations and geostrophy were found along 8øN for the Great Whirl return flow (Figure t t). In this area the curvature contribution was relatively small (U/fR < 0.2) and could not explain the dif- ference between geostrophic and directly measured currents at the edge of the Great Whirl (Figure t 1). The meridional sur- face currents at this location and measured by the shipboard and lowered ADCPs were 1.5 m s -•, thereby a factor of 3 larger than the geostrophic velocity (all relative to 250 m). The difference in the baroclinic structure was confined to the top 150 m. Below 150 m and farther out, in the open Arabian Sea, where the currents were weaker, all three methods showed similar values. A likely mechanism for the generation of in-
3586 FISCHER ET AL.: GREAT WHIRL CIRCULATION AND TRANSPORT
m
100
200
--
300 -
400 -1.5
I I
-1.0 -O.5 0
m/s-1 Figure 11. G½ostrophic (dashed line), shipboard ADCP (dotted line), and lowered ADCP (solid lines) current profiles at the GW edge (near 8øN, 55øE); all relative to 250 m depth.
tense ageostrophic motion was upper ocean frontogenesis [e.g., MacVean and Woods, 1980] due to a confluence in the flow field near 8øN, 55ø50'E (Figure 2a) acting on the ba- roclinic zone at the edge of the Great Whirl. As a consequence,
the slope of isopycnals would have increased and the along- frontal jet would have been accelerated. The relative vorticity would have increased, which was consistent with the observed maximum of cross-frontal shear (0U/0n .-- 3f). Ageostrophic motion across the front in combination with mass conservation
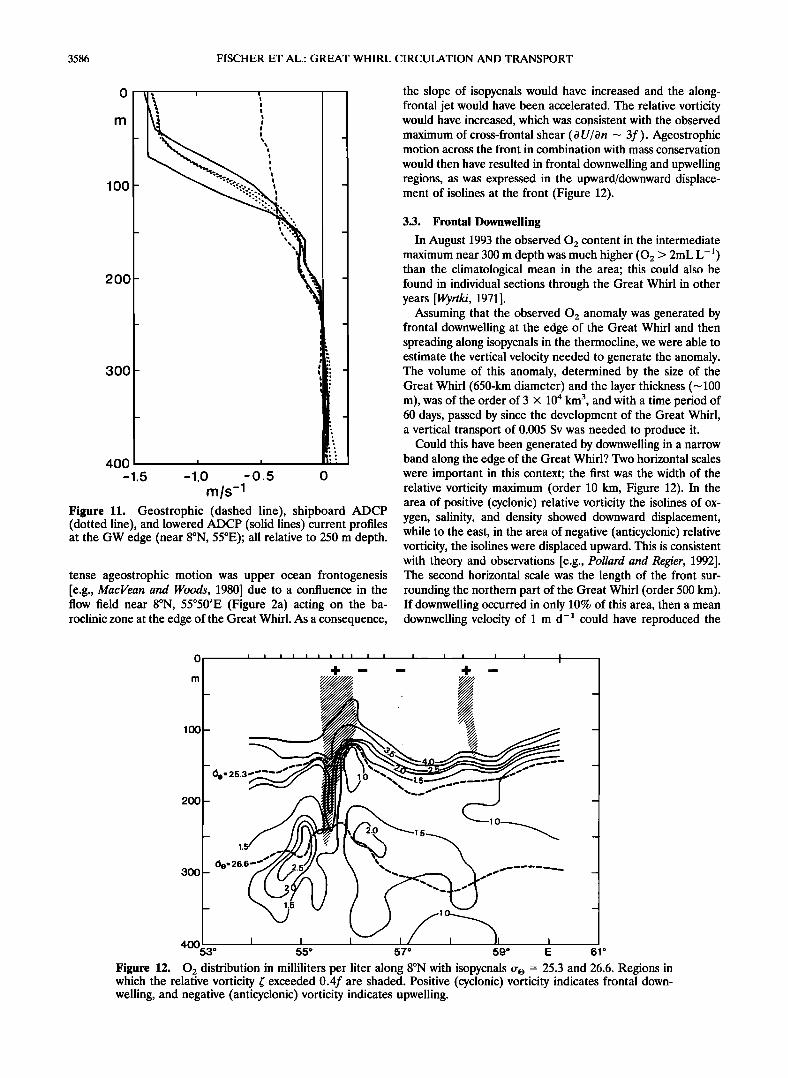
would then have resulted in frontal downwelling and upwelling regions, as was expressed in the upward/downward displace- ment of isolines at the front (Figure 12).
3.3. Frontal Downwelling
In August 1993 the observed 0 2 content in the intermediate maximum near 300 m depth was much higher (02 > 2mL L -q) than the climatological mean in the area; this could also be found in individual sections through the Great Whirl in other years [Wyrtki, 1971].
Assuming that the observed 02 anomaly was generated by frontal downwelling at the edge of the Great Whirl and then spreading along isopycnals in the thermocline, we were able to estimate the vertical velocity needed to generate the anomaly. The volume of this anomaly, determined by the size of the Great Whirl (650-km diameter) and the layer thickness (--• 100 m), was of the order of 3 x 10 4 km 3, and with a time period of 60 days, passed by since the development of the Great Whirl, a vertical transport of 0.005 Sv was needed to produce it.
Could this have been generated by downwelling in a narrow band along the edge of the Great Whirl? Two horizontal scales were important in this context; the first was the width of the relative vorticity maximum (order 10 km, Figure 12). In the area of positive (cyclonic) relative vorticity the isolines of ox- ygen, salinity, and density showed downward displacement, while to the east, in the area of negative (anticyclonic) relative vorticity, the isolines were displaced upward. This is consistent with theory and observations [e.g., Pollard and Regier, 1992]. The second horizontal scale was the length of the front sur- rounding the northern part of the Great Whirl (order 500 km). If downwelling occurred in only 10% of this area, then a mean downwelling velocity of 1 m d -• could have reproduced the
100
200
300
(•e= 25.3
26.6'"• •
i i i i
4- -- -- 4- --
v...v ':-:'X-:-:-:.:.:-:-:-:-:-Z.:.:.:.:.' v.v.-.
'-"Z-:' ::::::::::::::::::::::::::::::::::::: ::;::::: :':'Z'Z-:-:'X.:.:.Z.Z.' :.v:
ß ":'Z' Z.Z.Z-:.Z-:.:.:.:-:.; .;.:.:.: ß . :::::::::::::::::::::::::::
..... v.v.
.........
....
40053" 55" 57 ø 59 ø E 61 ø Figure 12. 02 distribution in milliliters per liter along 8øN with isopycnals o- o = 25.3 and 26.6. Regions in which the relative vorticity • exceeded 0.4f are shaded. Positive (cyclonic) vorticity indicates frontal down- welling, and negative (anticyclonic) vorticity indicates upwelling.
FISCHER ET AL.: GREAT WHIRL CIRCULATION AND TRANSPORT 3587
observed anomaly. Vertical velocities of this magnitude are not unrealistic; Pollard and Regier [1992] diagnosed vertical veloc- ities up to 40 m d -• at a much weaker front (Uf +- 0.3).
On the basis of the observations, we could neither prove nor disprove that the intermediate 02 maximum was due to advec- tion by the Somali Current and subsequent offshore retroflec- tion by the Great Whirl. However, based on the above consid- erations, we think that frontal downwelling might have been important in replenishing the 02 content in the deeper part of the Great Whirl circulation.
Acknowledgments. We would like to thank Otis Brown of the University of Miami (RSMAS) for his support with real-time SST images sent aboard. These maps were of invaluable help during the survey and the data analysis. We further appreciate the help of the captain and crew of the R/V Sonne. Funding was obtained by Bundesministerium fiir Forschung und Technologie (BMFT), grant 03R430.
References
Bruce, J. G., Eddies off the Somali coast during the southwest mon- soon, J. Geophys. Res., 84, 7742-7748, 1979.
Bruce, J. G., D. R. Quadfasel, and J. C. Swallow, Somali eddy forma- tion during the commencement of the southwest monsoon, 1978, J. Geophys. Res., 85, 6654-6660, 1980.
Findlay, A. G., A Directory for the Navigation of the Indian Ocean, 1062 pp., Richard Holmes Laurie, London, 1866.
Fischer, J., and M. Visbeck, Deep velocity profiling with self-contained ADCPs, J. Atrnos. Oceanic Technol., 10(5), 764-773, 1993.
Leetmaa, A., D. R. Quadfasel, and D. Wilson, Development of the flow field during the onset of the Somali Current, 1979, J. Phys. Oceanogr., 12, 1325-1342, 1982.
Legler, D. M., I. M. Navon, and J. J. O'Brien, Objective analysis of
pseudostress over the Indian Ocean using a direct-minimization approach, Mon. Weather Rev., 117, 709-720, 1989.
MacVean, M. K., and J. D. Woods, Redistribution of scalars during upper ocean frontogenesis, Q. J. R. Meteorol. Soc., 106, 293-311, 1980.
Molinari, R. L., D. Olson, and G. Reverdin, Surface current distribu- tions in the tropical Indian Ocean derived from compilations of surface buoy trajectories, J. Geophys. Res., 95, 7217-7238, 1990.
Pollard, R. T., and L. A. Regier, Vorticity and vertical circulation at an ocean front, J. Phys. Oceanogr., 22, 609-625, 1992.
Schott, F., Monsoon response of the Somali Current and associated upwelling, Prog. Oceanogr., 12, 357-381, 1983.
Schott, F., and M. Fieux, The Somali current in autumn 1984, before the onset of the north-east monsoon, Nature, 315, 50-52, 1985.
Schott, F., J. C. Swallow, and M. Fieux, The Somali Current at the equator: Annual cycle of currents and transports in the upper 1000 m and connection to neighbouring latitudes, Deep Sea Res., Part A, 37, 1825-1848, 1990.
Swallow, J. C., and J. G. Bruce, Current measurements off the Somali coast during the southwest monsoon of 1964, Deep Sea Res., 13, 861-888, 1966.
Swallow, J. C., and M. Fieux, Historical evidence for two gyres in the Somali Current, J. Mar. Res., 40 (suppl.), 747-755, 1982.
Swallow, J. C., R. L. Molinari, J. G. Bruce, O. B. Brown, and R. H. Evans, Development of near-surface flow pattern and water mass distribution in the Somali Basin in response to the southwest mon- soon of 1979, J. Phys. Oceanogr., 13, 1398-1415, 1983.
Wyrtki, K., Oceanographic Atlas of the International Indian Ocean Expedition, Publ. NSF-IDOE-1,531 pp., Natl. Sci. Found. Washing- ton, D.C., 1971.
J. Fischer, F. Schott, and L. Stramma, Institut fiir Meereskunde an der Universitfit Kiel, Diisternbrooker Weg 20, D-24105 Kiel, Germany. (e-mail: [email protected])
(Received February 22, 1995; revised October 17, 1995; accepted October 31, 1995.)