Cure kinetics, dynamic mechanical and morphological properties of epoxy resin–Im 6NiBr 2 system
11
Cure kinetics, dynamic mechanical and morphological properties of epoxy resin–Im 6 NiBr 2 system Abdollah Omrani a,b, * , Leonardo C. Simon a , Abbas A. Rostami b , Mousa Ghaemy b a Institute for Polymer Research, Department of Chemical Engineering, University of Waterloo, 200 University Avenue West, Waterloo, ON, Canada N2L 3G1 b Faculty of Chemistry, University of Mazandaran, P.O. Box 453, Babolsar, Mazandaran, Iran Received 21 August 2007; received in revised form 3 December 2007; accepted 14 December 2007 Available online 31 December 2007 Abstract The aim of this study was to examine effects of a catalyst of Nickel–imidazole, i.e. Im 6 NiBr 2 on the cure reaction and network properties of diglycidyl ether of bisphenol A. DSC and FT-IR measurements are carried out on the epoxy resin loaded with 5, 15, and 30 phr of nickel salt to get some insights into the storage stability. It has been concluded that the storage stability has mainly depended on the epoxy composition and was the lowest for the highest level of curing agent. Kinetics of the cure has been described by applying iso-conversional method of Ozawa to scanning DSC data demonstrat- ing that the studied cure reaction is autocatalytic in nature. The Kamal phenomenological approach has been utilized to fit the experimental isothermal DSC data. The model showed a satisfactory fitting of the experimental results at either early stages or at the final steps of the studied cure reaction. Further, the model did not provide a reasonable fitting in the prop- agation step of polymerization, 0.3 < a < 0.5, possibly due to existence of the additional reaction/s which did not consider in the used model. DMTA is used to find the optimum cure schedule. It has been shown that the sample with a postcure treatment offers the highest value of glass transition temperature (T g ) in the tan d peak. SEM and X-ray analyses are employed to investigate the fracture surface morphology and to understand the distribution of nickel in the cured samples exhibiting that the nickel is scattered in the continuous phase homogenously. Flexural properties of the sample cured at optimum conditions are also determined. Ó 2007 Elsevier Ltd. All rights reserved. Keywords: Epoxy; Calorimetry; Morphology; Dynamic mechanical properties; Kinetics 1. Introduction This work, which is a continuation of our previous studies [1,2] focuses on the isothermal and non-iso- thermal cure kinetics, dynamic mechanical behavior, mechanical and morphology of Im 6 NiBr 2 -cured epoxy resin. Understanding the cure of thermosetting 0014-3057/$ - see front matter Ó 2007 Elsevier Ltd. All rights reserved. doi:10.1016/j.eurpolymj.2007.12.021 * Corresponding author. Address: Faculty of Chemistry, Uni- versity of Mazandaran, P.O. Box 453, Babolsar, Mazandaran, Iran. Tel.: +98 11252 42025; fax: +98 11252 42002. E-mail addresses: [email protected], [email protected] (A. Omrani). Available online at www.sciencedirect.com European Polymer Journal 44 (2008) 769–779 www.elsevier.com/locate/europolj EUROPEAN POLYMER JOURNAL
Transcript of Cure kinetics, dynamic mechanical and morphological properties of epoxy resin–Im 6NiBr 2 system

Available online at www.sciencedirect.comEUROPEAN
European Polymer Journal 44 (2008) 769–779
www.elsevier.com/locate/europolj
POLYMERJOURNAL
Cure kinetics, dynamic mechanical and morphologicalproperties of epoxy resin–Im6NiBr2 system
Abdollah Omrani a,b,*, Leonardo C. Simon a, Abbas A. Rostami b, Mousa Ghaemy b
a Institute for Polymer Research, Department of Chemical Engineering, University of Waterloo, 200 University Avenue West,
Waterloo, ON, Canada N2L 3G1b Faculty of Chemistry, University of Mazandaran, P.O. Box 453, Babolsar, Mazandaran, Iran
Received 21 August 2007; received in revised form 3 December 2007; accepted 14 December 2007Available online 31 December 2007
Abstract
The aim of this study was to examine effects of a catalyst of Nickel–imidazole, i.e. Im6NiBr2 on the cure reaction andnetwork properties of diglycidyl ether of bisphenol A. DSC and FT-IR measurements are carried out on the epoxy resinloaded with 5, 15, and 30 phr of nickel salt to get some insights into the storage stability. It has been concluded that thestorage stability has mainly depended on the epoxy composition and was the lowest for the highest level of curing agent.Kinetics of the cure has been described by applying iso-conversional method of Ozawa to scanning DSC data demonstrat-ing that the studied cure reaction is autocatalytic in nature. The Kamal phenomenological approach has been utilized to fitthe experimental isothermal DSC data. The model showed a satisfactory fitting of the experimental results at either earlystages or at the final steps of the studied cure reaction. Further, the model did not provide a reasonable fitting in the prop-agation step of polymerization, 0.3 < a < 0.5, possibly due to existence of the additional reaction/s which did not considerin the used model. DMTA is used to find the optimum cure schedule. It has been shown that the sample with a postcuretreatment offers the highest value of glass transition temperature (Tg) in the tand peak. SEM and X-ray analyses areemployed to investigate the fracture surface morphology and to understand the distribution of nickel in the cured samplesexhibiting that the nickel is scattered in the continuous phase homogenously. Flexural properties of the sample cured atoptimum conditions are also determined.� 2007 Elsevier Ltd. All rights reserved.
Keywords: Epoxy; Calorimetry; Morphology; Dynamic mechanical properties; Kinetics
0014-3057/$ - see front matter � 2007 Elsevier Ltd. All rights reserved
doi:10.1016/j.eurpolymj.2007.12.021
* Corresponding author. Address: Faculty of Chemistry, Uni-versity of Mazandaran, P.O. Box 453, Babolsar, Mazandaran,Iran. Tel.: +98 11252 42025; fax: +98 11252 42002.
E-mail addresses: [email protected], [email protected] (A.Omrani).
1. Introduction
This work, which is a continuation of our previousstudies [1,2] focuses on the isothermal and non-iso-thermal cure kinetics, dynamic mechanical behavior,mechanical and morphology of Im6NiBr2-curedepoxy resin. Understanding the cure of thermosetting
.

770 A. Omrani et al. / European Polymer Journal 44 (2008) 769–779
system is important to their use in structural compos-ites, adhesives, coating industries, reaction injectionmodeling, and electronic applications. For over sev-eral decades, organotransition-metal complexes havebeen used as catalysts for epoxy resins cured withamine [3], anhydride [4,5], and phenolic curing agents[6]. Numerous studies of curing kinetics of thermo-sets have been appeared in the literature [7–9]. Theuse of imidazoles as catalysts in the cross-linking pro-cess of epoxy resins is well established [10,11] andthey are known to produce materials with good phys-ico-mechanical properties. At elevated temperaturesthey will show a fast catalytic action upon the processof epoxide homopolymerization. Imidazoles areknown to exhibit poor storage stability too. Someworks have been addressed at overcoming this prob-lem through the formation of imidazole-metal com-plexes [12–14]. The final properties of cured epoxyare intensively dependent on the chemical structureand degree of cross-linking within the polymer net-work. So, it is necessary for having knowledge ofthe kinetics of resin cure. It is also well known thatthe use of transition metal complexes can impartlatent cure properties in the imidazole initiators whenthey used in the cure process of epoxy resins [15,16].Curing kinetic parameters are generally evaluatedby analyzing experimental results obtained by differ-ent thermal analysis techniques. DSC, both in thescanning and isothermal modes, has been used exten-sively in this due [17–21]. Kinetic analysis of scanningDSC data is carried out using model-free iso-conver-sional method of Ozawa [22] to evaluate the depen-dence of effective activation energy on degree ofconversion. A phenomenological kinetic model pro-posed by Kamal [23] has been used to fit the experi-mental cure data recorded under isothermalconditions.
2. Experimental
2.1. Material
Diglycidyl ether of bisphenol A, average molecu-lar number of 483, from Sigma-Aldrich Canada wasused as supplied. The nickel complex, Im6NiBr2, issynthesized and characterized in our lab [1]. Theepoxy equivalent weight of the resin is about185 gr/eq based on the data provided by the sup-plier. All chemicals were used without further puri-fication. Our previous observations showed that theoptimum ratio of epoxy/hardener is 100/15 i.e.15 phr (parts per hundred).
2.2. Sample preparation
Epoxy resin and imidazole complex were care-fully and homogenously mixed at the optimumratio. Samples with size of 3–4 mg were separatedfrom the fresh prepared compositions for calorime-try measurements. Scanning DSC measurements arecarried out at four heating rates of 5, 10, 15, and20 �C/min from �30 to 300 �C. A second DSC scanis done to determine the residual heat and the glasstransition temperature of the cured materials. Iso-thermal DSC measurements are programmed atfour temperatures of 125, 130, 135, and 140 �C.Samples for the DMTA and mechanical tests areprepared by molding of the epoxy mixtures in Tef-lon molds. The samples were cured in a vacuumoven under defined cure program. For the infraredexperiments a thin film of epoxy blends are placedbetween two KBr discs.
2.3. Methods
DSC experiments were run on a TA DSC Q100calorimeter well equipped with TA software to anal-ysis the data and refrigerator cooling system. Sam-ples were placed in the aluminum pan and thencovered by an aluminum lid prior to undergoes aspecific cure program depend on the mode of mea-surement. The raw data are converted to excel filesand then kinetic analysis is applied.
Dynamic mechanical analyses are done in aRheometric Scientific DMTA V instrument on sam-ples of approximately 15 mm in length, 4 mm widthand 1 mm thickness. These samples were testedunder a three-point bending mode called, Singlecantilever, and a static force of 5 gr (60 mN). Theruns are conducted at an initial temperature of35 �C to above the Tg at a heating rate of 5 �C/min. The strain was 1% and the oscillating fre-quency 1 Hz. DMTA instrument was calibratedusing indium as a standard prior to the tests. Initialwork has been done to ensure that the response wasin the linear viscoelastic region.
A LEO scanning electron microscope is used forSEM micrographs. The fracture surface of the sam-ples was analyzed typically at different magnifica-tions. Before being introduced in the SEM, thesamples were covered with 10 lm thickness of agold coat, under argon at 0.05 mbar. To understandthe distribution of the nickel into the polymer struc-ture X-ray mapping analysis is performed using an

250
280
310
340
370
400
430
460
490
520
550
580
0 200 400 600 800 1000 1200Time (hour)
Hea
t of r
eact
ion
(J/g
)-epo
xy
5 phr
15 phr
30 phr
Fig. 1. Changes in the reaction heat with time of the differentepoxy compositions.
0
0.1
0.2
0.3
0.4
0.5
0.6
0.7
0.8
0.9
0 150 300 450 600 750 900 1050 1200Time (h)
Norm
aliz
ed p
eak
area
5 phr 15 phr
30 phr
Fig. 2. Changes in the area under peak of epoxy group vibrationat 915 cm�1 with time at room temperature.
A. Omrani et al. / European Polymer Journal 44 (2008) 769–779 771
electron dispersive (EDS) collector provided byEDAX.
Flexural properties of the cured materials areexamined in a three-point bending mode using amechanical testing machine, MiniMat 2000 fromRheometric Scientific, following ASTM D-790.The sample dimensions were 25 mm � 5 mm �1 mm. A compression speed of 5 mm/min is usedin the tests. Five specimens of the each epoxy com-position at the best cure schedule are examined andthe average value of data is presented.
FT-IR measurements are carried out on a verythin film of the epoxy compositions inside the Bru-ker Tensor 27 Fourier transform-infrared (FT-IR)spectrometer. Spectra are monitored and analyzedby OPUS software at room temperatures for aperiod of six weeks.
3. Results and discussion
3.1. Storage stability assessment
The most important disadvantage of the imidaz-ole-based curing agents is their poor storage stabil-ity. The use of transition metal complexes of theimidazole permits to induce imparting latent cureproperties. This is due to the formation of a dativecovalent bond between the imidazole nitrogen andthe metal ion, preventing the cure reaction to allowstorage as well. During cure, the ligands dissociatewhen a particular temperature is achieved, permit-ting the ion pairs of electrons on the nitrogen atomsof the free imidazole to start polymerization. DSCand FT-IR techniques were employed to examinethe effectiveness of complexation with nickel onthe storage stability. It should be noted that the imi-dazoles are usually capable of to polymerize ofepoxy resins at low temperatures. The methods werebased on the changes in the total heat of reactionand area under peak of the normalized epoxy vibra-tion bond at 915 cm�1 at different time intervals forthe DSC and FT-IR measurements, respectively.The vibration bond at 1184 cm�1 has been consid-ered as internal standard. Three different levels ofnickel salt, 5, 15, and 30 phr, are loaded into theresin to clarify the contribution of Im6NiBr2 con-centration on storage stability. The mixtures werestored at room temperatures and at specific timessamples were withdrawn and then tested. Fig. 1 dis-plays the change of reaction enthalpy versus time.
For the IR measurements the results are shownin the form of peak area against time plots in
Fig. 2. The changes in the reaction enthalpy andthe area under peak of epoxy group vibrations areuseful criteria of storage stability. A decrease inthe two mentioned criterion indicates some reac-tions leading to solidification of the stored mixtures.As it can be seen in the Figs. 1 and 2, the storagestability is mainly depending on the compositionof initial mixture.
At low (5 phr) and at optimum (15 phr) concen-trations of the nickel complex, systems showed goodstorage stability. Even after one month the bothmixtures did not represent considerable changes inthe respected criteria of the two methods of analy-ses. Also, the both methods are shown poor storagestability for the epoxy composition having 30 phrIm6NiBr2. It is clear that at this high level of

Table 1Data from the analysis of dynamic DSC measurements
Heating rate(�C/min)
Tmax
(�C)DrH0
total
(J/g-sample)DrH0
total
(J/g-epoxy)Tg
(�C)
5 143.9 419.3 482.2 12210 157.4 433.4 498.4 12115 165.2 435.3 500.6 11620 171.2 440.6 506.8 115
-0.5
0
0.5
1
1.5
2
2.5
3
3.5
4
0 2 4 6 8 10 12 14 16 18 20 22 24 26 28 30Time (min)
Hea
t flo
w (W
/g) 140oC
135oC
130oC
125oC
772 A. Omrani et al. / European Polymer Journal 44 (2008) 769–779
loading, there is/are some interaction/s between theepoxy groups and the other species which are avail-able more at this level than those concentrations. Itcould be related to the interaction of free imidazoleligand with epoxy monomers [1].
Fig. 4. Isothermal DSC curves of DGEBA epoxy resin curedwith the nickel salt at various temperatures.
Table 2Data from the analysis of isothermal DSC measurements
Temperature(�C)
Tmax
(min)DrH0
total
(J/g-sample)DrH0
reu
(J/g-sample)DrH0
total
(J/g-epoxy)
125 13.8 445.4 12.2 526.2130 11.3 466.6 9 546.9135 9.8 469 3.8 543.9140 9.1 470.2 2.8 544
3.2. Curing behavior
Dynamic DSC curves of the epoxy cured with15 phr of curing agent at various heating rates aredisplayed in Fig. 3. In Table 1 some data fromdynamic DSC measurements are shown.
Fig. 4 exhibits DSC thermograms of the isother-mally cured samples at various temperatures. Thecorresponding data obtained by the analysis of iso-thermal DSC curves are presented in Table 2. It hasbeen recognized that thermal history has majoreffect on the nature of the network architectureand final properties of thermosetting resins. DSChas been utilized to gain some insights into the rela-tion between the heat of reaction, Tg and curingprogram.
As it can be seen from the data appeared inTables 1 and 2, the value of reaction enthalpy forthe isothermally cured samples is higher than those
Fig. 3. DSC curves of DGEBA epoxy resin cured with the nickelsalt at various heating rates.
values obtained for the dynamically cured materials.It is noteworthy that the maximum change in thereaction enthalpies shown in Table 1 is about 5%which could be attributed to the selected integralbounds and the contribution of side reactions likeetherification. Further, the reaction heat is alsoincreased when the heating rate increased. All theTg’s are recorded in the second scan at a standardscan rate of 20 �C/min. However, high Tg is attainedas a result of a slow cure process. This is well docu-mented in the literature [15] for the imidazoles curedepoxy resin. In the slow scans the total time is con-siderably becomes longer, at 5 �C/min it is fourtimes that at 20 �C over the same range of tempera-ture, allowing more reaction and the production ofa higher Tg. This behavior could be alternativelyviewed by inspection of the contribution of residualheats are shown in Table 2 since there is a directrelationship between the time and temperature ofcuring. As it is seen in the Table, the value of resid-ual heat is decreased when the isothermal tempera-ture increased indicating that there are nounreacted epoxy groups with ongoing to the hightemperatures in both isothermal and dynamiccuring. However, this is not a general rule since
A. Omrani et al. / European Polymer Journal 44 (2008) 769–779 773
the value of Tg is not always proportional to conver-sion degree due to structural (architectural and con-formational) restrictions.
3.3. Dynamic cure kinetics
It is well known that epoxy cure involves severalsteps with different activation energies indicatingthat model-fitting approaches producing a singlevalue of Arrhenius parameters are not appropriatechoice to describe the epoxy cure [24–26]. The origi-nal non-isothermal DSC data are transformed intothe form conversion against temperature plots foreach heating rate. The kinetics of cure is describedby applying Ozawa’s iso-conversional method tothe experimental data in the following form:
log b ¼ �0:4567Ea=RT p þ ðlog AEa=R
� log f ðaÞ � 2:315Þ ð1Þ
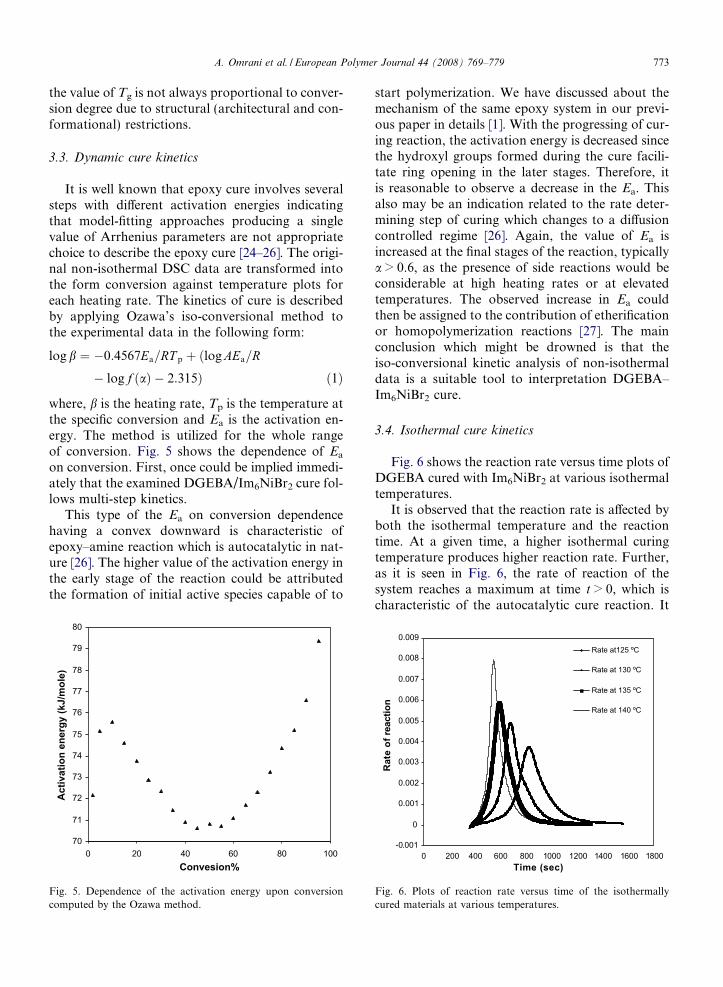
where, b is the heating rate, Tp is the temperature atthe specific conversion and Ea is the activation en-ergy. The method is utilized for the whole rangeof conversion. Fig. 5 shows the dependence of Ea
on conversion. First, once could be implied immedi-ately that the examined DGEBA/Im6NiBr2 cure fol-lows multi-step kinetics.
This type of the Ea on conversion dependencehaving a convex downward is characteristic ofepoxy–amine reaction which is autocatalytic in nat-ure [26]. The higher value of the activation energy inthe early stage of the reaction could be attributedthe formation of initial active species capable of to
70
71
72
73
74
75
76
77
78
79
80
0 20 40 60 80 100Convesion%
Act
ivat
ion
ener
gy (k
J/m
ole)
Fig. 5. Dependence of the activation energy upon conversioncomputed by the Ozawa method.
start polymerization. We have discussed about themechanism of the same epoxy system in our previ-ous paper in details [1]. With the progressing of cur-ing reaction, the activation energy is decreased sincethe hydroxyl groups formed during the cure facili-tate ring opening in the later stages. Therefore, itis reasonable to observe a decrease in the Ea. Thisalso may be an indication related to the rate deter-mining step of curing which changes to a diffusioncontrolled regime [26]. Again, the value of Ea isincreased at the final stages of the reaction, typicallya > 0.6, as the presence of side reactions would beconsiderable at high heating rates or at elevatedtemperatures. The observed increase in Ea couldthen be assigned to the contribution of etherificationor homopolymerization reactions [27]. The mainconclusion which might be drowned is that theiso-conversional kinetic analysis of non-isothermaldata is a suitable tool to interpretation DGEBA–Im6NiBr2 cure.
3.4. Isothermal cure kinetics
Fig. 6 shows the reaction rate versus time plots ofDGEBA cured with Im6NiBr2 at various isothermaltemperatures.
It is observed that the reaction rate is affected byboth the isothermal temperature and the reactiontime. At a given time, a higher isothermal curingtemperature produces higher reaction rate. Further,as it is seen in Fig. 6, the rate of reaction of thesystem reaches a maximum at time t > 0, which ischaracteristic of the autocatalytic cure reaction. It
-0.001
0
0.001
0.002
0.003
0.004
0.005
0.006
0.007
0.008
0.009
0 200 400 600 800 1000 1200 1400 1600 1800Time (sec)
Rat
e of
reac
tion
Rate at125 ºC
Rate at 130 ºC
Rate at 135 ºC
Rate at 140 ºC
Fig. 6. Plots of reaction rate versus time of the isothermallycured materials at various temperatures.

Table 3Values of K1, K2, and reaction orders evaluated using the Kamalmodel
Temperature (�C) K1 K2 m n m + n
125 0.00000037 0.1042 1.01 1.02 2.03130 0.00000049 0.0142 1.02 1.04 2.06135 0.00000089 0.023 0.984 1.13 2.11140 0.0000011 0.037 1.23 1.47 2.7
0
0.0005
0.001
0.0015
0.002
0.0025
0.003
0.0035
0.004
0 200 400 600 800 1000
1200
1400
1600
1800
Time (sec)
Rat
e of
reac
tion
Rate at 125 ºC
Kamal model
0.009
774 A. Omrani et al. / European Polymer Journal 44 (2008) 769–779
should be noted that the reaction rate, da/dt, is cal-culated from the DSC measurements as follows:
da=dt ¼ ðdH=dtÞ=DrH 0T ð2Þ
where, DrH 0T ¼ DrH 0
rxn þ DrH 0res (see Table 2).
According to the above observations, kinetics ofthe studied isothermal cure reaction is evaluatedusing the Kamal model. The model can be describedby the following equation:
da=dt ¼ ðK1 þ K2amÞð1� aÞn ð3Þ
where, a is the conversion, K1 and K2 are the rateconstants, and m and n are the kinetic exponentsof the autocatalytic and n-order reactions, respec-tively. Several methods have been used to computeKamal’s equation parameters [28–30]. In the presentstudy, we applied the graphical method [29] to theexperimental DSC data. The constant K1 in theEq. (3) can be evaluated from the initial reactionrate at a = 0. It should be noted that the value ofK1 at these relatively high isothermal temperaturesis only an estimation since its amount is dependon the reaction rate and the employed temperature.Further, Eq. (3) is rewritten in the following form:
lnðda=dtÞ ¼ lnðK1 þ K2amÞ þ n lnð1� aÞ ð4Þ
Except the early stage of cure (a < 0.1), a plot ofln(da/dt) against ln(1�a) is expected to be linearwith a slope n. Eq. (4) can then be further rear-ranged to produce following equation:
lnf½ðda=dtÞ=ð1� aÞn� � K1g ¼ ln K2 þ m ln a ð5Þ
A graph of the left side term of Eq. (5) against lnapermits to calculate m and K2 from the slope andintercept, respectively. Preliminary kinetic parame-
-10
-9
-8
-7
-6
-5
-4
-3
-4 -3.5 -3 -2.5 -2 -1.5 -1 -0.5 0Ln(a)
ln[(d
a/dt
)/(1-
a)^n
-K1)
]
125 ºC
130 ºC
135 ºC
140 ºC
Fig. 7. Plots of the left term in Eq. (5) versus lna at varioustemperatures.
ters can be obtained on the first trial. To obtainmore accurate values of the parameters, an iterativeprocedure has been used. The Kamal equation canbe also rearranged to convert the following form:
lnðda=dtÞ � lnðK1 þ K2amÞ ¼ n lnð1� aÞ ð6Þ
Again, a plot o f the left term of Eq. (6) versusln(1 � a) allows to obtain a new value of the reac-
-0.001
0
0.001
0.002
0.003
0.004
0.005
0.006
0.007
0.008
0 200 400 600 800 1000 1200Time (sec)
Rat
e of
reac
tion
Rate at 140 ºC
Kamal model
Fig. 8. Plots of reaction rate versus time where the experimentaldata are compared with the Kamal model at 125 and 140 �C.
0
0.05
0.1
0.15
0.2
0.25
0.3
0.35
0.4
0.45
0.5
0 50 100 150 200Temperature (ºC)
Tan-
delta
Cure 1Cure 2Cure 3
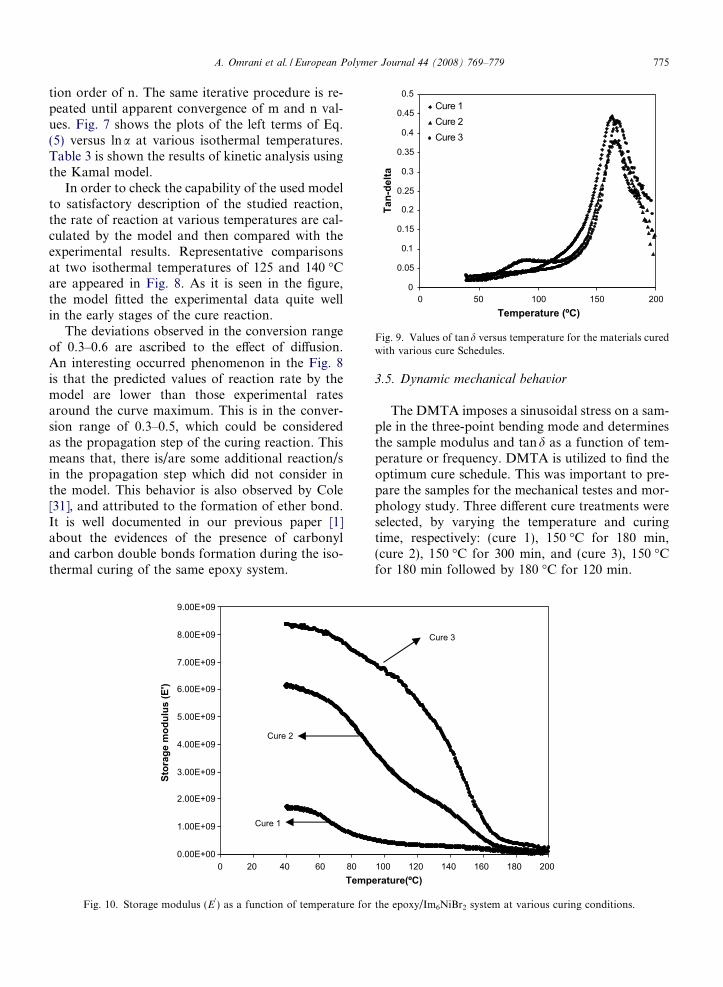
Fig. 9. Values of tand versus temperature for the materials curedwith various cure Schedules.
A. Omrani et al. / European Polymer Journal 44 (2008) 769–779 775
tion order of n. The same iterative procedure is re-peated until apparent convergence of m and n val-ues. Fig. 7 shows the plots of the left terms of Eq.(5) versus lna at various isothermal temperatures.Table 3 is shown the results of kinetic analysis usingthe Kamal model.
In order to check the capability of the used modelto satisfactory description of the studied reaction,the rate of reaction at various temperatures are cal-culated by the model and then compared with theexperimental results. Representative comparisonsat two isothermal temperatures of 125 and 140 �Care appeared in Fig. 8. As it is seen in the figure,the model fitted the experimental data quite wellin the early stages of the cure reaction.
The deviations observed in the conversion rangeof 0.3–0.6 are ascribed to the effect of diffusion.An interesting occurred phenomenon in the Fig. 8is that the predicted values of reaction rate by themodel are lower than those experimental ratesaround the curve maximum. This is in the conver-sion range of 0.3–0.5, which could be consideredas the propagation step of the curing reaction. Thismeans that, there is/are some additional reaction/sin the propagation step which did not consider inthe model. This behavior is also observed by Cole[31], and attributed to the formation of ether bond.It is well documented in our previous paper [1]about the evidences of the presence of carbonyland carbon double bonds formation during the iso-thermal curing of the same epoxy system.
0.00E+00
1.00E+09
2.00E+09
3.00E+09
4.00E+09
5.00E+09
6.00E+09
7.00E+09
8.00E+09
9.00E+09
0 20 40 60 80Temp
Stor
age
mod
ulus
(E')
Cure 2
Cure 1
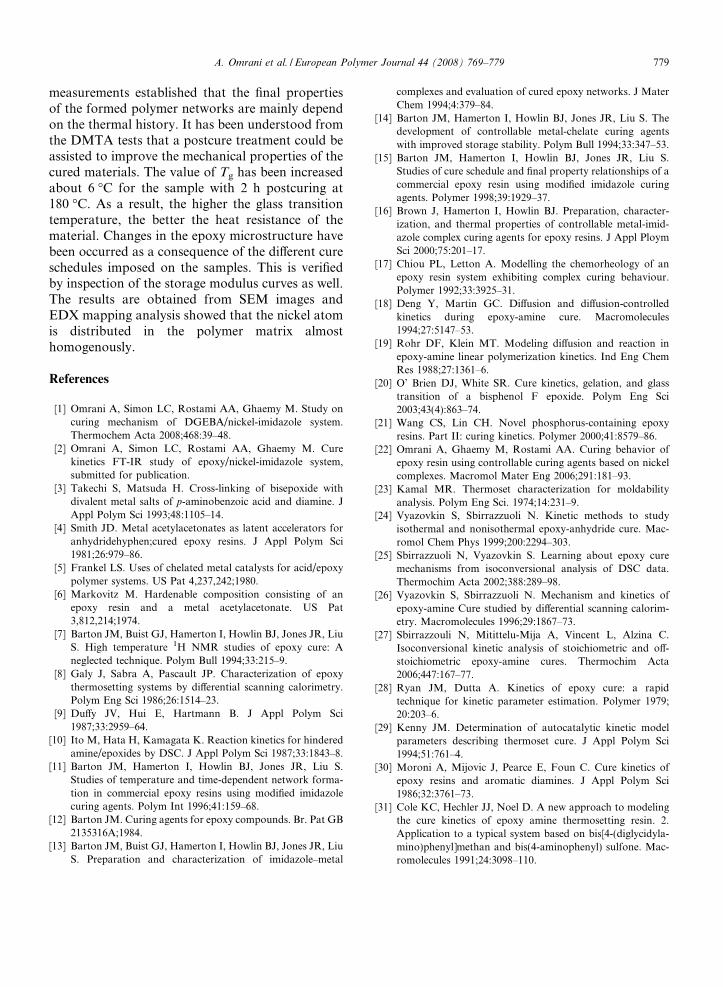
Fig. 10. Storage modulus (E0) as a function of temperature for
3.5. Dynamic mechanical behavior
The DMTA imposes a sinusoidal stress on a sam-ple in the three-point bending mode and determinesthe sample modulus and tand as a function of tem-perature or frequency. DMTA is utilized to find theoptimum cure schedule. This was important to pre-pare the samples for the mechanical testes and mor-phology study. Three different cure treatments wereselected, by varying the temperature and curingtime, respectively: (cure 1), 150 �C for 180 min,(cure 2), 150 �C for 300 min, and (cure 3), 150 �Cfor 180 min followed by 180 �C for 120 min.
100 120 140 160 180 200erature(ºC)
Cure 3
the epoxy/Im6NiBr2 system at various curing conditions.

776 A. Omrani et al. / European Polymer Journal 44 (2008) 769–779
For DMTA study, Tg can be taken (1) as thatcorresponding to the apex of the tand versus tem-perature peak, (2) as the midpoint correspondingto the logE
0transition, and (3) as the intersect of
the tangents to the logE0curve before the transition
and the decrease characterizing the transition. How-ever, criterion 1 is commonly accepted by the inves-tigators, and it then considered determining theglass transition temperature of the cured samples.
Fig. 11. SEM images on the fracture surface of Im6NiBr2 curedepoxy.
Fig. 9 exhibits the plots of tand versus temperatureof the cured materials with different cure schedules.
As it is seen in the curves, there is some increasein the Tg with increasing the curing time and tem-perature. The glass transition temperatures of thecured samples under cure one, two, and three sched-ules are determined to be 163.1, 165.8, and 169.5 �C,respectively. However, an increase about 6 �C in theTg has been attained when the sample was under-goes a postcure procedure at 180 �C for 2 h. Thiscould be explained by the contribution of etherifica-
Fig. 12. X-ray map on the fracture surface of Im6NiBr2 curedepoxy showing Ni, Br, and C distribution.

Fig. 13. EDAX spectra on the facture surface of Im6NiBr2 cured epoxy in the continuous phase and aggregated nickel region.
A. Omrani et al. / European Polymer Journal 44 (2008) 769–779 777

-20-10
0102030405060708090
0.00 0.01 0.01 0.02 0.02 0.03 0.03 0.04Strain (%)
Stre
ss (M
Pa)
Fig. 14. Stress–strain curve of the cured sample at optimumconditions.
778 A. Omrani et al. / European Polymer Journal 44 (2008) 769–779
tion reactions which became more important at hightemperature procedure, cure three, capable of toinfluence the final properties of the cured materials.The DMTA is also a sensitive method in detectingchanges in the internal molecular mobility. Thestructure and solid viscoelastic characteristics canthus be determined from the dynamic and dampingmodules. Fig. 10 shows the storage modulus of thecured samples as a function of temperature. Themodulus of the cured sample with schedule threewas greatest at whole range of temperature. It isnoteworthy that the flexural storage modulus ofthe samples without postcure treatment almost line-arly decreased with increase in the temperature,which proposed that there is a higher uniform ednetwork in these cases that consisted only onehomogeneous phase. It is clear that applying post-curing treatment at high temperature of 180 �C willhave a major effect on the cross-link density of theproduced materials through being importance ofthe contribution of polyetherification reaction atelevated temperatures. So, the high value of storagemodulus for cure three program could be attributedto the contribution of etherification reactions.
3.6. Morphology characterization
Scanning electron microscopy (SEM) data couldbe used to detect phase separation occurred in thefinally cured materials. SEM micrographs of frac-ture surfaces of the epoxy cured with 15 phr ofIm6NiBr2 under optimum cure schedule are shownin Fig. 11. The smooth, glass fracture surface forthe system with cracks in different planes shows brit-tle fracture with parallel ripples. The fracture sur-face of the cured epoxy has a rigid continuousphase with a dispersed phase of isolated sphericalparticles. Further, the fracture surface in Fig. 11bshows massive shear deformation. This indicatesthat the mechanical stress concentrated on the par-ticles encourages shear yielding of the epoxy.Energy is absorbed by such shear yielding leads tothe increase in mechanical properties.
We assigned these particles to the nickel or otherspecies involving nickel atom such as NiBr2. Thesize of the pixels is different in the continuous phase.This could be due to aggregation of nickel salt withincreasing the temperature during the cure (seeFig. 12) and/or increase in the viscosity of the epoxyresin which hinder the uniform dispersion.
The diameter of the spots lies between 1.5 and7 lm. Further, EDX micrographs in Fig. 13 show
the presence and atomic percentage of Ni in thecured sample. In Fig. 13b and c the fracture surfaceof the cured samples exhibits massive spherocrystalwhich are oriented toward the center of each grain.
3.7. Flexural properties
Attempts have made to investigate stress–strainbehavior of the cured sample at optimum cure pro-gram. The load versus the deflection of the specimenwas recorded and then flexural properties are calcu-lated. Fig. 14 shows stress–strain curve of the testedsample. The slope of the stress curve is less steep andthe cured samples showed high toughness. Thismeans that the adhesion between the componentswas strong as it could be verified by inspection ofthe values of flexural modulus and strength.
The average values of flexural modulus and flex-ural strength are found to be 2386 Mpa and17.2 Mpa, respectively.
4. Conclusions
A nickel salt of imidazole, Im6NiBr2, is examinedas the curing agent in the cure process of epoxyresin. The current work has demonstrated that com-plexation with nickel induces a latent cure propertyand caused pot life enhancement for the imidazolewhich usually used as cool curing agents of epoxyresins. The storage stability of the optimumepoxy–nickel salt composition has been found tobe about 1 month. DSC is used both in dynamicand isothermal modes to describe cure behaviorand to evaluate the kinetic parameters. It has beenshown that the iso-conversional approach is a suit-able tool to describe the cure behavior of the exam-ined epoxy system. The results from calorimetry
A. Omrani et al. / European Polymer Journal 44 (2008) 769–779 779
measurements established that the final propertiesof the formed polymer networks are mainly dependon the thermal history. It has been understood fromthe DMTA tests that a postcure treatment could beassisted to improve the mechanical properties of thecured materials. The value of Tg has been increasedabout 6 �C for the sample with 2 h postcuring at180 �C. As a result, the higher the glass transitiontemperature, the better the heat resistance of thematerial. Changes in the epoxy microstructure havebeen occurred as a consequence of the different cureschedules imposed on the samples. This is verifiedby inspection of the storage modulus curves as well.The results are obtained from SEM images andEDX mapping analysis showed that the nickel atomis distributed in the polymer matrix almosthomogenously.
References
[1] Omrani A, Simon LC, Rostami AA, Ghaemy M. Study oncuring mechanism of DGEBA/nickel-imidazole system.Thermochem Acta 2008;468:39–48.
[2] Omrani A, Simon LC, Rostami AA, Ghaemy M. Curekinetics FT-IR study of epoxy/nickel-imidazole system,submitted for publication.
[3] Takechi S, Matsuda H. Cross-linking of bisepoxide withdivalent metal salts of p-aminobenzoic acid and diamine. JAppl Polym Sci 1993;48:1105–14.
[4] Smith JD. Metal acetylacetonates as latent accelerators foranhydridehyphen;cured epoxy resins. J Appl Polym Sci1981;26:979–86.
[5] Frankel LS. Uses of chelated metal catalysts for acid/epoxypolymer systems. US Pat 4,237,242;1980.
[6] Markovitz M. Hardenable composition consisting of anepoxy resin and a metal acetylacetonate. US Pat3,812,214;1974.
[7] Barton JM, Buist GJ, Hamerton I, Howlin BJ, Jones JR, LiuS. High temperature 1H NMR studies of epoxy cure: Aneglected technique. Polym Bull 1994;33:215–9.
[8] Galy J, Sabra A, Pascault JP. Characterization of epoxythermosetting systems by differential scanning calorimetry.Polym Eng Sci 1986;26:1514–23.
[9] Duffy JV, Hui E, Hartmann B. J Appl Polym Sci1987;33:2959–64.
[10] Ito M, Hata H, Kamagata K. Reaction kinetics for hinderedamine/epoxides by DSC. J Appl Polym Sci 1987;33:1843–8.
[11] Barton JM, Hamerton I, Howlin BJ, Jones JR, Liu S.Studies of temperature and time-dependent network forma-tion in commercial epoxy resins using modified imidazolecuring agents. Polym Int 1996;41:159–68.
[12] Barton JM. Curing agents for epoxy compounds. Br. Pat GB2135316A;1984.
[13] Barton JM, Buist GJ, Hamerton I, Howlin BJ, Jones JR, LiuS. Preparation and characterization of imidazole–metal
complexes and evaluation of cured epoxy networks. J MaterChem 1994;4:379–84.
[14] Barton JM, Hamerton I, Howlin BJ, Jones JR, Liu S. Thedevelopment of controllable metal-chelate curing agentswith improved storage stability. Polym Bull 1994;33:347–53.
[15] Barton JM, Hamerton I, Howlin BJ, Jones JR, Liu S.Studies of cure schedule and final property relationships of acommercial epoxy resin using modified imidazole curingagents. Polymer 1998;39:1929–37.
[16] Brown J, Hamerton I, Howlin BJ. Preparation, character-ization, and thermal properties of controllable metal-imid-azole complex curing agents for epoxy resins. J Appl PloymSci 2000;75:201–17.
[17] Chiou PL, Letton A. Modelling the chemorheology of anepoxy resin system exhibiting complex curing behaviour.Polymer 1992;33:3925–31.
[18] Deng Y, Martin GC. Diffusion and diffusion-controlledkinetics during epoxy-amine cure. Macromolecules1994;27:5147–53.
[19] Rohr DF, Klein MT. Modeling diffusion and reaction inepoxy-amine linear polymerization kinetics. Ind Eng ChemRes 1988;27:1361–6.
[20] O’ Brien DJ, White SR. Cure kinetics, gelation, and glasstransition of a bisphenol F epoxide. Polym Eng Sci2003;43(4):863–74.
[21] Wang CS, Lin CH. Novel phosphorus-containing epoxyresins. Part II: curing kinetics. Polymer 2000;41:8579–86.
[22] Omrani A, Ghaemy M, Rostami AA. Curing behavior ofepoxy resin using controllable curing agents based on nickelcomplexes. Macromol Mater Eng 2006;291:181–93.
[23] Kamal MR. Thermoset characterization for moldabilityanalysis. Polym Eng Sci. 1974;14:231–9.
[24] Vyazovkin S, Sbirrazzuoli N. Kinetic methods to studyisothermal and nonisothermal epoxy-anhydride cure. Mac-romol Chem Phys 1999;200:2294–303.
[25] Sbirrazzuoli N, Vyazovkin S. Learning about epoxy curemechanisms from isoconversional analysis of DSC data.Thermochim Acta 2002;388:289–98.
[26] Vyazovkin S, Sbirrazzuoli N. Mechanism and kinetics ofepoxy-amine Cure studied by differential scanning calorim-etry. Macromolecules 1996;29:1867–73.
[27] Sbirrazzouli N, Mitittelu-Mija A, Vincent L, Alzina C.Isoconversional kinetic analysis of stoichiometric and off-stoichiometric epoxy-amine cures. Thermochim Acta2006;447:167–77.
[28] Ryan JM, Dutta A. Kinetics of epoxy cure: a rapidtechnique for kinetic parameter estimation. Polymer 1979;20:203–6.
[29] Kenny JM. Determination of autocatalytic kinetic modelparameters describing thermoset cure. J Appl Polym Sci1994;51:761–4.
[30] Moroni A, Mijovic J, Pearce E, Foun C. Cure kinetics ofepoxy resins and aromatic diamines. J Appl Polym Sci1986;32:3761–73.
[31] Cole KC, Hechler JJ, Noel D. A new approach to modelingthe cure kinetics of epoxy amine thermosetting resin. 2.Application to a typical system based on bis[4-(diglycidyla-mino)phenyl]methan and bis(4-aminophenyl) sulfone. Mac-romolecules 1991;24:3098–110.