Cumulative impact mapping: Advances, relevance and limitations to marine management and...
12
This article appeared in a journal published by Elsevier. The attached copy is furnished to the author for internal non-commercial research and education use, including for instruction at the authors institution and sharing with colleagues. Other uses, including reproduction and distribution, or selling or licensing copies, or posting to personal, institutional or third party websites are prohibited. In most cases authors are permitted to post their version of the article (e.g. in Word or Tex form) to their personal website or institutional repository. Authors requiring further information regarding Elsevier’s archiving and manuscript policies are encouraged to visit: http://www.elsevier.com/copyright
-
Upload
iass-potsdam -
Category
Documents
-
view
0 -
download
0
Transcript of Cumulative impact mapping: Advances, relevance and limitations to marine management and...
This article appeared in a journal published by Elsevier. The attachedcopy is furnished to the author for internal non-commercial researchand education use, including for instruction at the authors institution
and sharing with colleagues.
Other uses, including reproduction and distribution, or selling orlicensing copies, or posting to personal, institutional or third party
websites are prohibited.
In most cases authors are permitted to post their version of thearticle (e.g. in Word or Tex form) to their personal website orinstitutional repository. Authors requiring further information
regarding Elsevier’s archiving and manuscript policies areencouraged to visit:
http://www.elsevier.com/copyright
Author's personal copy
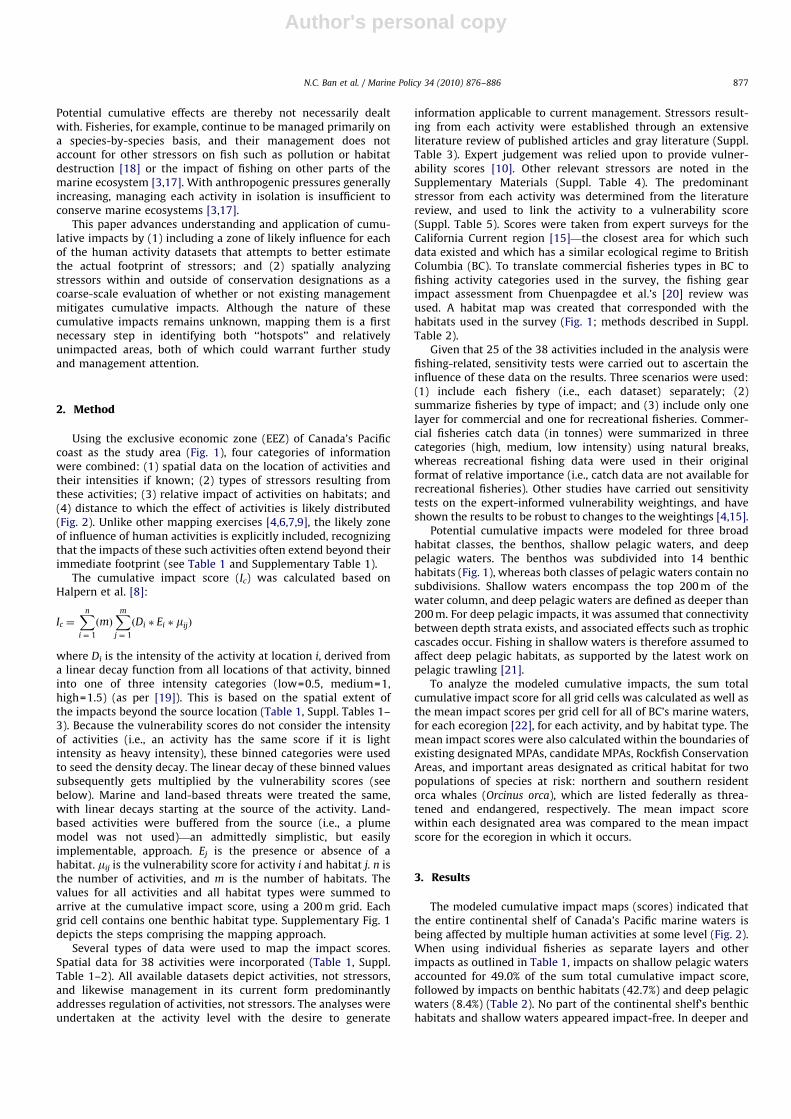
Cumulative impact mapping: Advances, relevance and limitations to marinemanagement and conservation, using Canada’s Pacific waters as a case study
Natalie C. Ban a,b,�, Hussein M. Alidina c, Jeff A. Ardron d
a UBC Fisheries Centre, Project Seahorse, 2202 Main Mall, Vancouver, BC, V6T 1Z4, Canadab Australian Research Council Centre of Excellence for Coral Reef Studies, James Cook University, Queensland 4810, Australiac WWF-Canada, Pacific Region, Suite 1588, 409 Granville St, Vancouver, BC, V6C 1T2, Canadad Pacific Marine Analysis and Research Association, Sussex Place Suite G7, 1001 Douglas Street, Victoria, BC, V8W 2C5, Canada
a r t i c l e i n f o
Article history:
Received 23 November 2009
Received in revised form
8 January 2010
Accepted 8 January 2010
Keywords:
Anthropogenic stressors
Cumulative effects
Ecosystem-based management
Marine protected area
Multiple stressors
Marine spatial planning
a b s t r a c t
Analysis of cumulative human impacts in the marine environment is still in its infancy but developing
rapidly. In this study, existing approaches were expanded upon, aiming for a realistic consideration of
cumulative impacts at a regional scale. Thirty-eight human activities were considered, with each
broken down according to stressor types and a range of spatial influences. To add to the policy
relevance, existing stressors within and outside of conservation areas were compared. Results indicate
the entire continental shelf of Canada’s Pacific marine waters is affected by multiple human activities at
some level. Commercial fishing, land-based activities and marine transportation accounted for 57.0%,
19.1%, and 17.7% of total cumulative impacts, respectively. Surprisingly, most areas with conservation
designations contained higher impact scores than the mean values of their corresponding ecoregions.
Despite recent advances in mapping cumulative impacts, many limitations remain. Nonetheless,
preliminary analyses such as these can provide information relevant to precautionary management and
conservation efforts.
& 2010 Elsevier Ltd. All rights reserved.
1. Introduction
Knowing the location and impacts of human activities on themarine ecosystems is critical to effective marine management[1–3]. Identifying, mapping and quantifying the cumulativeimpact of human activities on ecosystems are essential elementsof operationalizing the practice of ecosystem-based management(EBM) [3]. Recent studies have paved the way for analyses ofhuman impacts globally [4], and regionally [5–9]. Mappingpotential cumulative effects is relevant to conservation andmarine spatial planning in that reducing the stressors resultingfrom human activities can become an explicit goal. In this paper,regional human use data for Canada’s Pacific marine waters wereused to map and analyze cumulative impacts and to assess theefficacy of existing spatial conservation designations. The applic-ability and limitations of this approach is discussed.
The oceans are affected by many marine and terrestrial humanactivities, yet there is much unknown about the effect of stressors[4,10,11]. Two recent meta-analyses show that stressor interac-
tions are variable and hard to predict [12,13]. The majority ofstudies on anthropogenic stressors focus on impacts of singlestressors [14]. While the understanding of interactive effects maybe limited, studies of individual stressors can be used tohypothesize where cumulative effects might occur [4,5], andbegin identifying appropriate management measures. Similarly,marine environments differ in their resilience to externalstressors, and the cumulative interactions of multiple stressorsare poorly understood. While detailed information of theresilience of various habitat types to stressors is lacking, expertopinion can be used as a preliminary basis by which to evaluateand rank the vulnerability of habitats to different anthropogenicstressors [10].
Mapping human impacts in the marine environment is arecent scientific endeavor. Key studies include a simple approachto mapping impacts in British Columbia [5], a global study [4], andsubsequent regional approaches [8,9]. These studies use or buildupon estimated measures of sensitivity and vulnerability ofecosystems or species to stressors [10,15,16], and rely on spatialdata of human activities and resulting stressors. Given the recentemergence of this area of enquiry, opportunities for refinementand application exist, such as this study.
Even though multiple human activities affect most areas andmultiple parts of an ecosystem, ocean management has beencarried out primarily through a sector-by-sector approach [3,17].
ARTICLE IN PRESS
Contents lists available at ScienceDirect
journal homepage: www.elsevier.com/locate/marpol
Marine Policy
0308-597X/$ - see front matter & 2010 Elsevier Ltd. All rights reserved.
doi:10.1016/j.marpol.2010.01.010
� Corresponding author at: Australian Research Council Centre of Excellence for
Coral Reef Studies, James Cook University, Queensland 4810, Australia.
Tel.: +61 7 4781 6067; fax: +61 7 4781 6722.
E-mail addresses: [email protected] (N.C. Ban), [email protected]
(H.M. Alidina), [email protected] (J.A. Ardron).
Marine Policy 34 (2010) 876–886
Author's personal copyARTICLE IN PRESS
Potential cumulative effects are thereby not necessarily dealtwith. Fisheries, for example, continue to be managed primarily ona species-by-species basis, and their management does notaccount for other stressors on fish such as pollution or habitatdestruction [18] or the impact of fishing on other parts of themarine ecosystem [3,17]. With anthropogenic pressures generallyincreasing, managing each activity in isolation is insufficient toconserve marine ecosystems [3,17].
This paper advances understanding and application of cumu-lative impacts by (1) including a zone of likely influence for eachof the human activity datasets that attempts to better estimatethe actual footprint of stressors; and (2) spatially analyzingstressors within and outside of conservation designations as acoarse-scale evaluation of whether or not existing managementmitigates cumulative impacts. Although the nature of thesecumulative impacts remains unknown, mapping them is a firstnecessary step in identifying both ‘‘hotspots’’ and relativelyunimpacted areas, both of which could warrant further studyand management attention.
2. Method
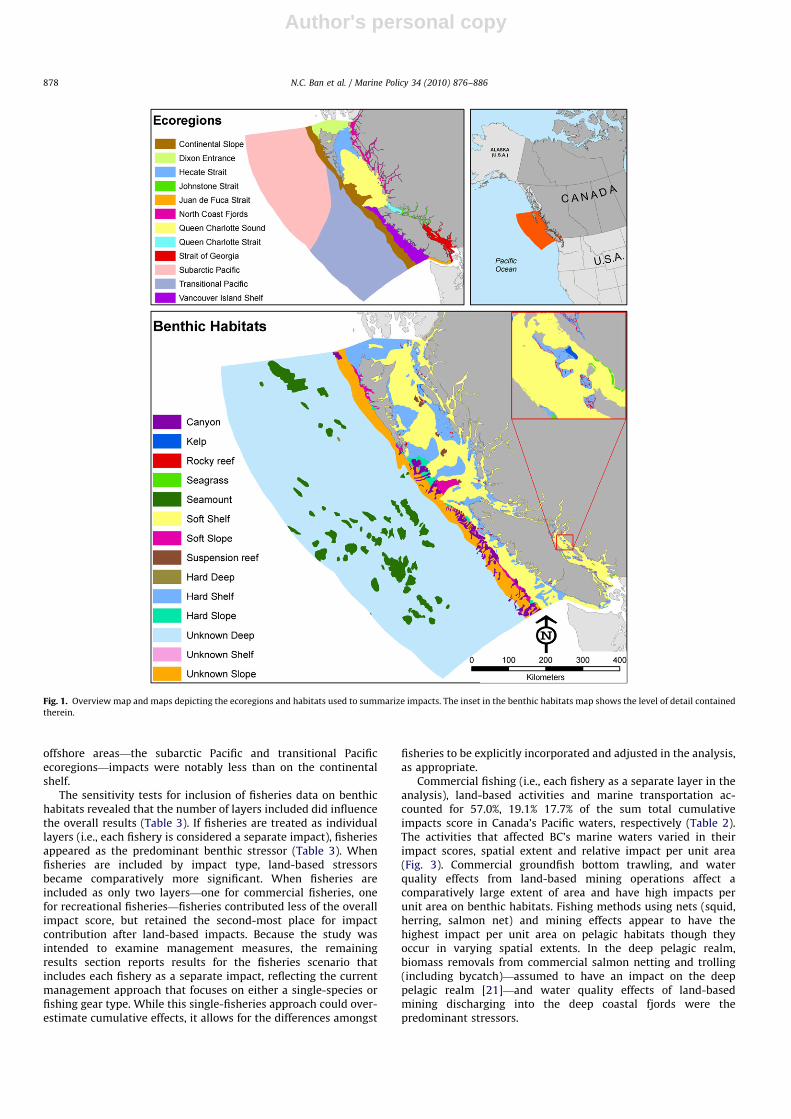
Using the exclusive economic zone (EEZ) of Canada’s Pacificcoast as the study area (Fig. 1), four categories of informationwere combined: (1) spatial data on the location of activities andtheir intensities if known; (2) types of stressors resulting fromthese activities; (3) relative impact of activities on habitats; and(4) distance to which the effect of activities is likely distributed(Fig. 2). Unlike other mapping exercises [4,6,7,9], the likely zoneof influence of human activities is explicitly included, recognizingthat the impacts of these such activities often extend beyond theirimmediate footprint (see Table 1 and Supplementary Table 1).
The cumulative impact score (Ic) was calculated based onHalpern et al. [8]:
Ic ¼Xn
i ¼ 1
ðmÞXm
j ¼ 1
ðDi � Ei � mijÞ
where Di is the intensity of the activity at location i, derived froma linear decay function from all locations of that activity, binnedinto one of three intensity categories (low=0.5, medium=1,high=1.5) (as per [19]). This is based on the spatial extent ofthe impacts beyond the source location (Table 1, Suppl. Tables 1–3). Because the vulnerability scores do not consider the intensityof activities (i.e., an activity has the same score if it is lightintensity as heavy intensity), these binned categories were usedto seed the density decay. The linear decay of these binned valuessubsequently gets multiplied by the vulnerability scores (seebelow). Marine and land-based threats were treated the same,with linear decays starting at the source of the activity. Land-based activities were buffered from the source (i.e., a plumemodel was not used)—an admittedly simplistic, but easilyimplementable, approach. Ej is the presence or absence of ahabitat. mij is the vulnerability score for activity i and habitat j. n isthe number of activities, and m is the number of habitats. Thevalues for all activities and all habitat types were summed toarrive at the cumulative impact score, using a 200 m grid. Eachgrid cell contains one benthic habitat type. Supplementary Fig. 1depicts the steps comprising the mapping approach.
Several types of data were used to map the impact scores.Spatial data for 38 activities were incorporated (Table 1, Suppl.Table 1–2). All available datasets depict activities, not stressors,and likewise management in its current form predominantlyaddresses regulation of activities, not stressors. The analyses wereundertaken at the activity level with the desire to generate
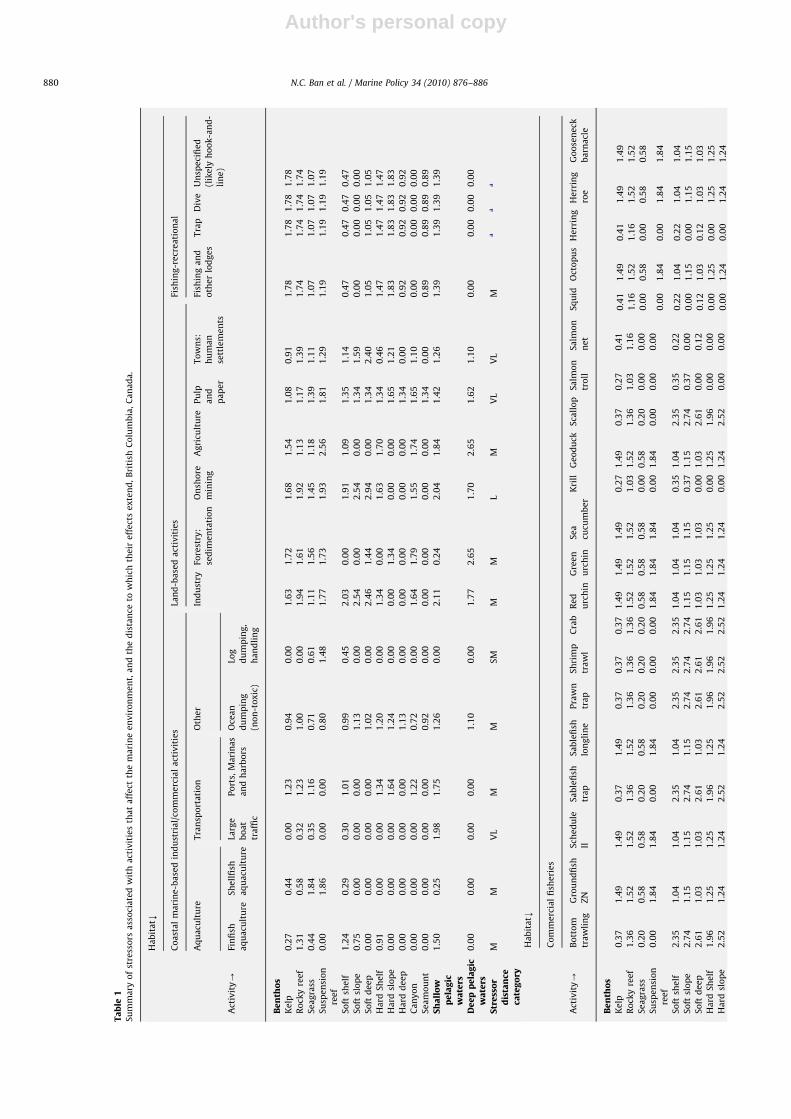
information applicable to current management. Stressors result-ing from each activity were established through an extensiveliterature review of published articles and gray literature (Suppl.Table 3). Expert judgement was relied upon to provide vulner-ability scores [10]. Other relevant stressors are noted in theSupplementary Materials (Suppl. Table 4). The predominantstressor from each activity was determined from the literaturereview, and used to link the activity to a vulnerability score(Suppl. Table 5). Scores were taken from expert surveys for theCalifornia Current region [15]—the closest area for which suchdata existed and which has a similar ecological regime to BritishColumbia (BC). To translate commercial fisheries types in BC tofishing activity categories used in the survey, the fishing gearimpact assessment from Chuenpagdee et al.’s [20] review wasused. A habitat map was created that corresponded with thehabitats used in the survey (Fig. 1; methods described in Suppl.Table 2).
Given that 25 of the 38 activities included in the analysis werefishing-related, sensitivity tests were carried out to ascertain theinfluence of these data on the results. Three scenarios were used:(1) include each fishery (i.e., each dataset) separately; (2)summarize fisheries by type of impact; and (3) include only onelayer for commercial and one for recreational fisheries. Commer-cial fisheries catch data (in tonnes) were summarized in threecategories (high, medium, low intensity) using natural breaks,whereas recreational fishing data were used in their originalformat of relative importance (i.e., catch data are not available forrecreational fisheries). Other studies have carried out sensitivitytests on the expert-informed vulnerability weightings, and haveshown the results to be robust to changes to the weightings [4,15].
Potential cumulative impacts were modeled for three broadhabitat classes, the benthos, shallow pelagic waters, and deeppelagic waters. The benthos was subdivided into 14 benthichabitats (Fig. 1), whereas both classes of pelagic waters contain nosubdivisions. Shallow waters encompass the top 200 m of thewater column, and deep pelagic waters are defined as deeper than200 m. For deep pelagic impacts, it was assumed that connectivitybetween depth strata exists, and associated effects such as trophiccascades occur. Fishing in shallow waters is therefore assumed toaffect deep pelagic habitats, as supported by the latest work onpelagic trawling [21].
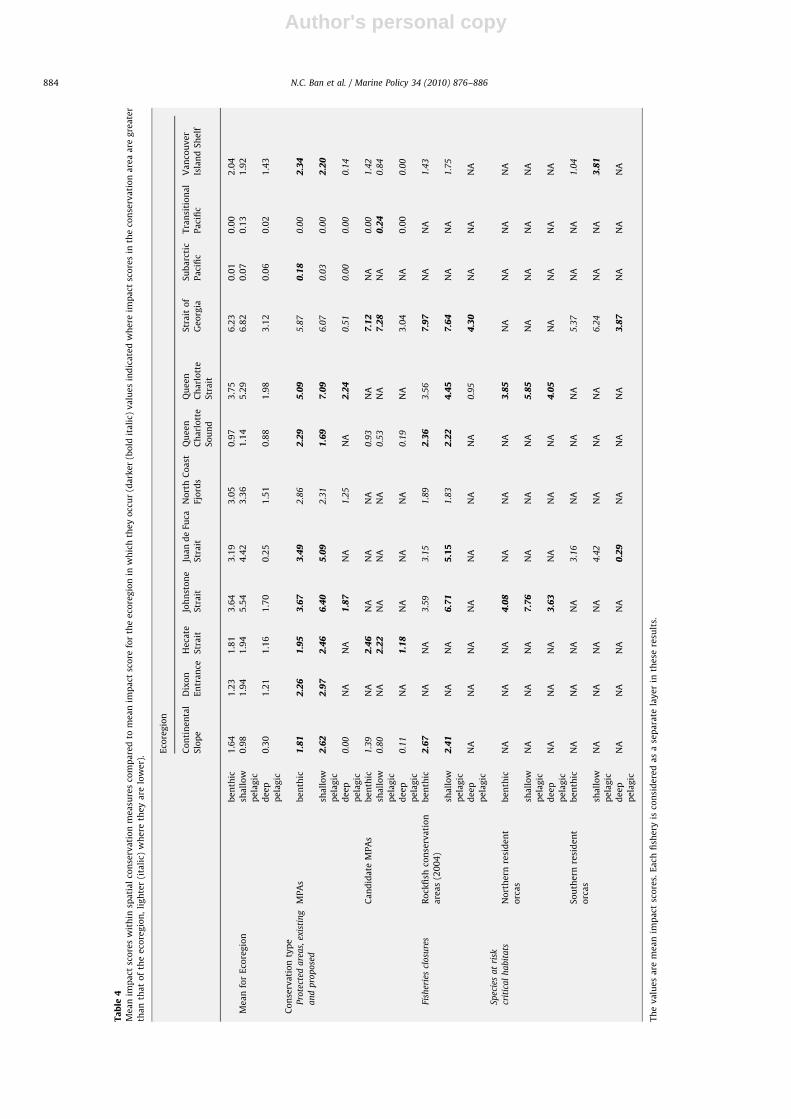
To analyze the modeled cumulative impacts, the sum totalcumulative impact score for all grid cells was calculated as well asthe mean impact scores per grid cell for all of BC’s marine waters,for each ecoregion [22], for each activity, and by habitat type. Themean impact scores were also calculated within the boundaries ofexisting designated MPAs, candidate MPAs, Rockfish ConservationAreas, and important areas designated as critical habitat for twopopulations of species at risk: northern and southern residentorca whales (Orcinus orca), which are listed federally as threa-tened and endangered, respectively. The mean impact scorewithin each designated area was compared to the mean impactscore for the ecoregion in which it occurs.
3. Results
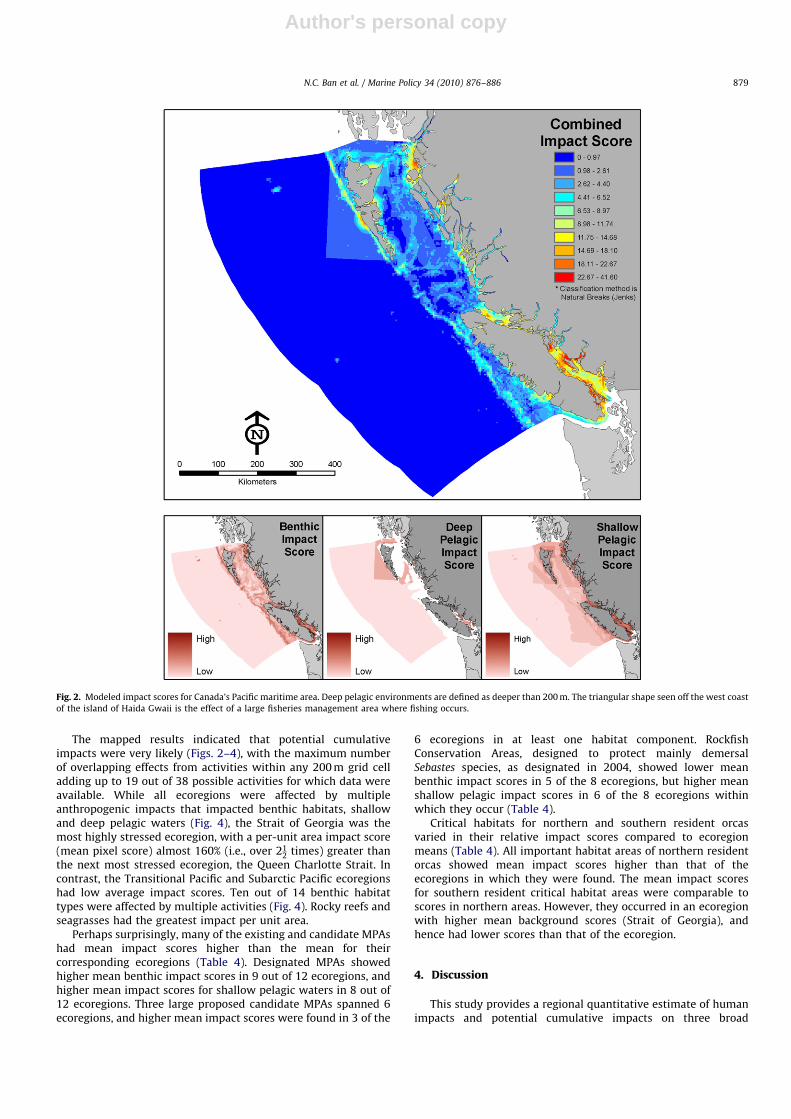
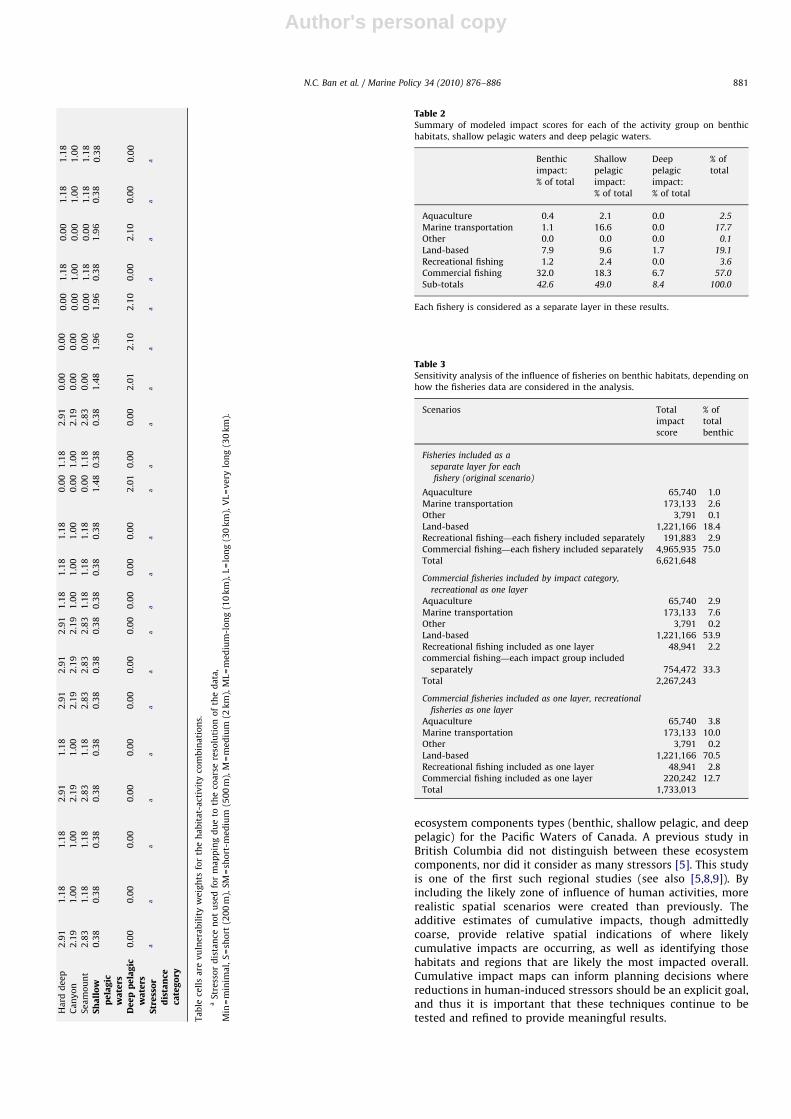
The modeled cumulative impact maps (scores) indicated thatthe entire continental shelf of Canada’s Pacific marine waters isbeing affected by multiple human activities at some level (Fig. 2).When using individual fisheries as separate layers and otherimpacts as outlined in Table 1, impacts on shallow pelagic watersaccounted for 49.0% of the sum total cumulative impact score,followed by impacts on benthic habitats (42.7%) and deep pelagicwaters (8.4%) (Table 2). No part of the continental shelf’s benthichabitats and shallow waters appeared impact-free. In deeper and
N.C. Ban et al. / Marine Policy 34 (2010) 876–886 877
Author's personal copyARTICLE IN PRESS
offshore areas—the subarctic Pacific and transitional Pacificecoregions—impacts were notably less than on the continentalshelf.
The sensitivity tests for inclusion of fisheries data on benthichabitats revealed that the number of layers included did influencethe overall results (Table 3). If fisheries are treated as individuallayers (i.e., each fishery is considered a separate impact), fisheriesappeared as the predominant benthic stressor (Table 3). Whenfisheries are included by impact type, land-based stressorsbecame comparatively more significant. When fisheries areincluded as only two layers—one for commercial fisheries, onefor recreational fisheries—fisheries contributed less of the overallimpact score, but retained the second-most place for impactcontribution after land-based impacts. Because the study wasintended to examine management measures, the remainingresults section reports results for the fisheries scenario thatincludes each fishery as a separate impact, reflecting the currentmanagement approach that focuses on either a single-species orfishing gear type. While this single-fisheries approach could over-estimate cumulative effects, it allows for the differences amongst
fisheries to be explicitly incorporated and adjusted in the analysis,as appropriate.
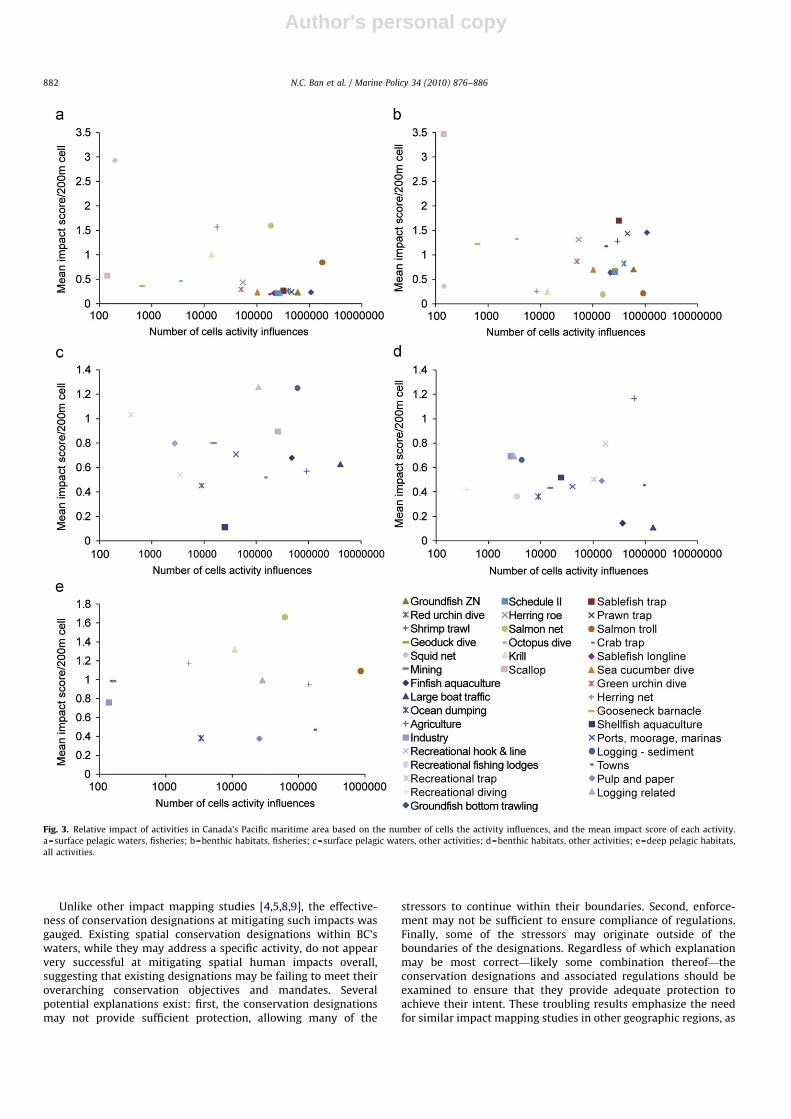
Commercial fishing (i.e., each fishery as a separate layer in theanalysis), land-based activities and marine transportation ac-counted for 57.0%, 19.1% 17.7% of the sum total cumulativeimpacts score in Canada’s Pacific waters, respectively (Table 2).The activities that affected BC’s marine waters varied in theirimpact scores, spatial extent and relative impact per unit area(Fig. 3). Commercial groundfish bottom trawling, and waterquality effects from land-based mining operations affect acomparatively large extent of area and have high impacts perunit area on benthic habitats. Fishing methods using nets (squid,herring, salmon net) and mining effects appear to have thehighest impact per unit area on pelagic habitats though theyoccur in varying spatial extents. In the deep pelagic realm,biomass removals from commercial salmon netting and trolling(including bycatch)—assumed to have an impact on the deeppelagic realm [21]—and water quality effects of land-basedmining discharging into the deep coastal fjords were thepredominant stressors.
Fig. 1. Overview map and maps depicting the ecoregions and habitats used to summarize impacts. The inset in the benthic habitats map shows the level of detail contained
therein.
N.C. Ban et al. / Marine Policy 34 (2010) 876–886878
Author's personal copyARTICLE IN PRESS
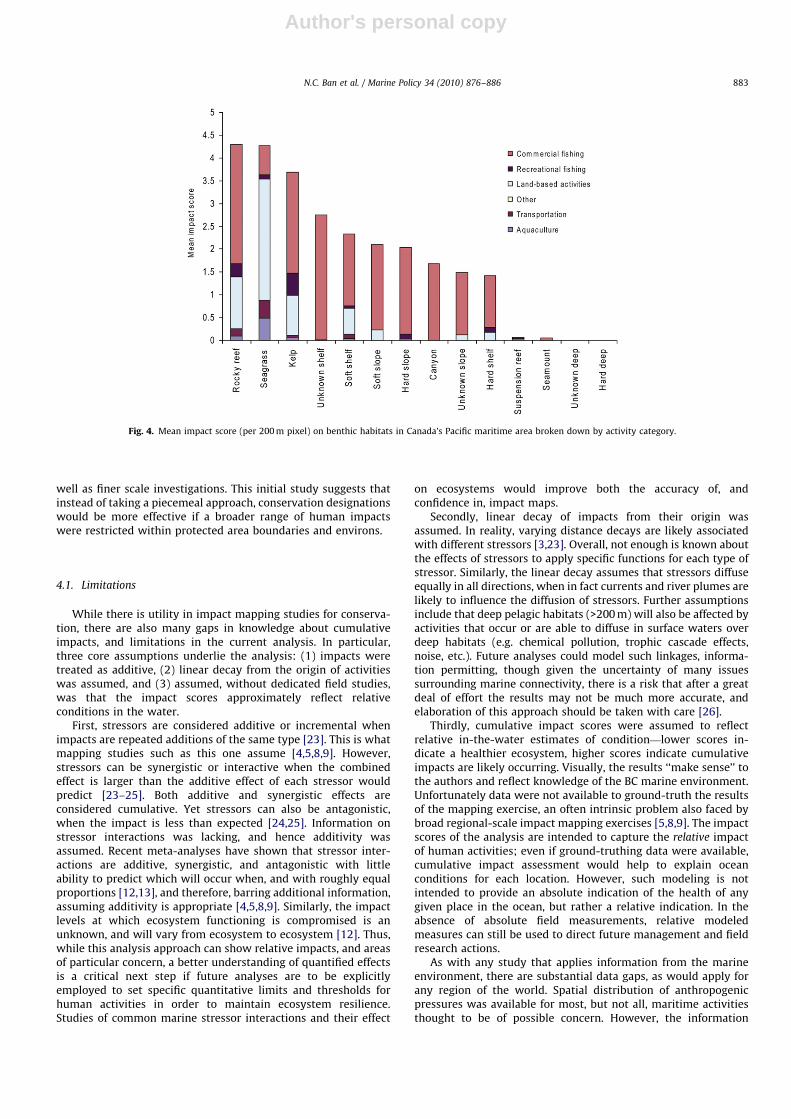
The mapped results indicated that potential cumulativeimpacts were very likely (Figs. 2–4), with the maximum numberof overlapping effects from activities within any 200 m grid celladding up to 19 out of 38 possible activities for which data wereavailable. While all ecoregions were affected by multipleanthropogenic impacts that impacted benthic habitats, shallowand deep pelagic waters (Fig. 4), the Strait of Georgia was themost highly stressed ecoregion, with a per-unit area impact score(mean pixel score) almost 160% (i.e., over 21
2 times) greater thanthe next most stressed ecoregion, the Queen Charlotte Strait. Incontrast, the Transitional Pacific and Subarctic Pacific ecoregionshad low average impact scores. Ten out of 14 benthic habitattypes were affected by multiple activities (Fig. 4). Rocky reefs andseagrasses had the greatest impact per unit area.
Perhaps surprisingly, many of the existing and candidate MPAshad mean impact scores higher than the mean for theircorresponding ecoregions (Table 4). Designated MPAs showedhigher mean benthic impact scores in 9 out of 12 ecoregions, andhigher mean impact scores for shallow pelagic waters in 8 out of12 ecoregions. Three large proposed candidate MPAs spanned 6ecoregions, and higher mean impact scores were found in 3 of the
6 ecoregions in at least one habitat component. RockfishConservation Areas, designed to protect mainly demersalSebastes species, as designated in 2004, showed lower meanbenthic impact scores in 5 of the 8 ecoregions, but higher meanshallow pelagic impact scores in 6 of the 8 ecoregions withinwhich they occur (Table 4).
Critical habitats for northern and southern resident orcasvaried in their relative impact scores compared to ecoregionmeans (Table 4). All important habitat areas of northern residentorcas showed mean impact scores higher than that of theecoregions in which they were found. The mean impact scoresfor southern resident critical habitat areas were comparable toscores in northern areas. However, they occurred in an ecoregionwith higher mean background scores (Strait of Georgia), andhence had lower scores than that of the ecoregion.
4. Discussion
This study provides a regional quantitative estimate of humanimpacts and potential cumulative impacts on three broad
Fig. 2. Modeled impact scores for Canada’s Pacific maritime area. Deep pelagic environments are defined as deeper than 200 m. The triangular shape seen off the west coast
of the island of Haida Gwaii is the effect of a large fisheries management area where fishing occurs.
N.C. Ban et al. / Marine Policy 34 (2010) 876–886 879
Author's personal copyARTICLE IN PRESS
Ta
ble
1S
um
ma
ryo
fst
ress
ors
ass
oci
ate
dw
ith
act
ivit
ies
tha
ta
ffe
ctth
em
ari
ne
en
vir
on
me
nt,
an
dth
ed
ista
nce
tow
hic
hth
eir
eff
ect
se
xte
nd
,B
riti
shC
olu
mb
ia,
Ca
na
da
.
Ha
bit
atk
Co
ast
al
ma
rin
e-b
ase
din
du
stri
al/
com
me
rcia
la
ctiv
itie
sLa
nd
-ba
sed
act
ivit
ies
Fish
ing
-re
cre
ati
on
al
Aq
ua
cult
ure
Tra
nsp
ort
ati
on
Oth
er
Ind
ust
ryFo
rest
ry:
sed
ime
nta
tio
n
On
sho
re
min
ing
Ag
ricu
ltu
reP
ulp
an
d
pa
pe
r
To
wn
s:
hu
ma
n
sett
lem
en
ts
Fish
ing
an
d
oth
er
lod
ge
s
Tra
pD
ive
Un
spe
cifi
ed
(lik
ely
ho
ok
-an
d-
lin
e)
Act
ivit
y-
Fin
fish
aq
ua
cult
ure
Sh
ell
fish
aq
ua
cult
ure
Larg
e
bo
at
tra
ffic
Po
rts,
Ma
rin
as
an
dh
arb
ors
Oce
an
du
mp
ing
(no
n-t
ox
ic)
Log
du
mp
ing
,
ha
nd
lin
g
Be
nth
os
Ke
lp0
.27
0.4
40
.00
1.2
30
.94
0.0
01
.63
1.7
21
.68
1.5
41
.08
0.9
11
.78
1.7
81
.78
1.7
8
Ro
cky
ree
f1
.31
0.5
80
.32
1.2
31
.00
0.0
01
.94
1.6
11
.92
1.1
31
.17
1.3
91
.74
1.7
41
.74
1.7
4
Se
ag
rass
0.4
41
.84
0.3
51
.16
0.7
10
.61
1.1
11
.56
1.4
51
.18
1.3
91
.11
1.0
71
.07
1.0
71
.07
Su
spe
nsi
on
ree
f
0.0
01
.86
0.0
00
.00
0.8
01
.48
1.7
71
.73
1.9
32
.56
1.8
11
.29
1.1
91
.19
1.1
91
.19
So
ftsh
elf
1.2
40
.29
0.3
01
.01
0.9
90
.45
2.0
30
.00
1.9
11
.09
1.3
51
.14
0.4
70
.47
0.4
70
.47
So
ftsl
op
e0
.75
0.0
00
.00
0.0
01
.13
0.0
02
.54
0.0
02
.54
0.0
01
.34
1.5
90
.00
0.0
00
.00
0.0
0
So
ftd
ee
p0
.00
0.0
00
.00
0.0
01
.02
0.0
02
.46
1.4
42
.94
0.0
01
.34
2.4
01
.05
1.0
51
.05
1.0
5
Ha
rdS
he
lf0
.91
0.0
00
.00
1.3
41
.20
0.0
01
.34
0.0
01
.63
1.7
01
.34
0.4
61
.47
1.4
71
.47
1.4
7
Ha
rdsl
op
e0
.00
0.0
00
.00
1.6
41
.24
0.0
00
.00
1.3
40
.00
0.0
01
.65
1.2
11
.83
1.8
31
.83
1.8
3
Ha
rdd
ee
p0
.00
0.0
00
.00
0.0
01
.13
0.0
00
.00
0.0
00
.00
0.0
01
.34
0.0
00
.92
0.9
20
.92
0.9
2
Ca
ny
on
0.0
00
.00
0.0
01
.22
0.7
20
.00
1.6
41
.79
1.5
51
.74
1.6
51
.10
0.0
00
.00
0.0
00
.00
Se
am
ou
nt
0.0
00
.00
0.0
00
.00
0.9
20
.00
0.0
00
.00
0.0
00
.00
1.3
40
.00
0.8
90
.89
0.8
90
.89
Sh
all
ow
pe
lag
icw
ate
rs
1.5
00
.25
1.9
81
.75
1.2
60
.00
2.1
10
.24
2.0
41
.84
1.4
21
.26
1.3
91
.39
1.3
91
.39
De
ep
pe
lag
icw
ate
rs0
.00
0.0
00
.00
0.0
01
.10
0.0
01
.77
2.6
51
.70
2.6
51
.62
1.1
00
.00
0.0
00
.00
0.0
0
Str
ess
or
dis
tan
ceca
teg
ory
MM
VL
MM
SM
MM
LM
VL
VL
Ma
aa
Ha
bit
atk
Co
mm
erc
ial
fish
eri
es
Act
ivit
y-
Bo
tto
m
tra
wli
ng
Gro
un
dfi
sh
ZN
Sch
ed
ule
II
Sa
ble
fish
tra
p
Sa
ble
fish
lon
gli
ne
Pra
wn
tra
p
Sh
rim
p
tra
wl
Cra
bR
ed
urc
hin
Gre
en
urc
hin
Se
a
cucu
mb
er
Kri
llG
eo
du
ckS
call
op
Sa
lmo
n
tro
ll
Sa
lmo
n
ne
t
Sq
uid
Oct
op
us
He
rrin
gH
err
ing
roe
Go
ose
ne
ck
ba
rna
cle
Be
nth
os
Ke
lp0
.37
1.4
91
.49
0.3
71
.49
0.3
70
.37
0.3
71
.49
1.4
91
.49
0.2
71
.49
0.3
70
.27
0.4
10
.41
1.4
90
.41
1.4
91
.49
Ro
cky
ree
f1
.36
1.5
21
.52
1.3
61
.52
1.3
61
.36
1.3
61
.52
1.5
21
.52
1.0
31
.52
1.3
61
.03
1.1
61
.16
1.5
21
.16
1.5
21
.52
Se
ag
rass
0.2
00
.58
0.5
80
.20
0.5
80
.20
0.2
00
.20
0.5
80
.58
0.5
80
.00
0.5
80
.20
0.0
00
.00
0.0
00
.58
0.0
00
.58
0.5
8S
usp
en
sio
n
ree
f
0.0
01
.84
1.8
40
.00
1.8
40
.00
0.0
00
.00
1.8
41
.84
1.8
40
.00
1.8
40
.00
0.0
00
.00
0.0
01
.84
0.0
01
.84
1.8
4
So
ftsh
elf
2.3
51
.04
1.0
42
.35
1.0
42
.35
2.3
52
.35
1.0
41
.04
1.0
40
.35
1.0
42
.35
0.3
50
.22
0.2
21
.04
0.2
21
.04
1.0
4S
oft
slo
pe
2.7
41
.15
1.1
52
.74
1.1
52
.74
2.7
42
.74
1.1
51
.15
1.1
50
.37
1.1
52
.74
0.3
70
.00
0.0
01
.15
0.0
01
.15
1.1
5S
oft
de
ep
2.6
11
.03
1.0
32
.61
1.0
32
.61
2.6
12
.61
1.0
31
.03
1.0
30
.00
1.0
32
.61
0.0
00
.12
0.1
21
.03
0.1
21
.03
1.0
3H
ard
Sh
elf
1.9
61
.25
1.2
51
.96
1.2
51
.96
1.9
61
.96
1.2
51
.25
1.2
50
.00
1.2
51
.96
0.0
00
.00
0.0
01
.25
0.0
01
.25
1.2
5H
ard
slo
pe
2.5
21
.24
1.2
42
.52
1.2
42
.52
2.5
22
.52
1.2
41
.24
1.2
40
.00
1.2
42
.52
0.0
00
.00
0.0
01
.24
0.0
01
.24
1.2
4
N.C. Ban et al. / Marine Policy 34 (2010) 876–886880
Author's personal copyARTICLE IN PRESS
ecosystem components types (benthic, shallow pelagic, and deeppelagic) for the Pacific Waters of Canada. A previous study inBritish Columbia did not distinguish between these ecosystemcomponents, nor did it consider as many stressors [5]. This studyis one of the first such regional studies (see also [5,8,9]). Byincluding the likely zone of influence of human activities, morerealistic spatial scenarios were created than previously. Theadditive estimates of cumulative impacts, though admittedlycoarse, provide relative spatial indications of where likelycumulative impacts are occurring, as well as identifying thosehabitats and regions that are likely the most impacted overall.Cumulative impact maps can inform planning decisions wherereductions in human-induced stressors should be an explicit goal,and thus it is important that these techniques continue to betested and refined to provide meaningful results.
Ha
rdd
ee
p2
.91
1.1
81
.18
2.9
11
.18
2.9
12
.91
2.9
11
.18
1.1
81
.18
0.0
01
.18
2.9
10
.00
0.0
00
.00
1.1
80
.00
1.1
81
.18
Ca
ny
on
2.1
91
.00
1.0
02
.19
1.0
02
.19
2.1
92
.19
1.0
01
.00
1.0
00
.00
1.0
02
.19
0.0
00
.00
0.0
01
.00
0.0
01
.00
1.0
0S
ea
mo
un
t2
.83
1.1
81
.18
2.8
31
.18
2.8
32
.83
2.8
31
.18
1.1
81
.18
0.0
01
.18
2.8
30
.00
0.0
00
.00
1.1
80
.00
1.1
81
.18
Sh
all
ow
pe
lag
icw
ate
rs
0.3
80
.38
0.3
80
.38
0.3
80
.38
0.3
80
.38
0.3
80
.38
0.3
81
.48
0.3
80
.38
1.4
81
.96
1.9
60
.38
1.9
60
.38
0.3
8
De
ep
pe
lag
icw
ate
rs0
.00
0.0
00
.00
0.0
00
.00
0.0
00
.00
0.0
00
.00
0.0
00
.00
2.0
10
.00
0.0
02
.01
2.1
02
.10
0.0
02
.10
0.0
00
.00
Str
ess
or
dis
tan
ceca
teg
ory
aa
aa
aa
aa
aa
aa
aa
aa
aa
aa
a
Ta
ble
cell
sa
rev
uln
era
bil
ity
we
igh
tsfo
rth
eh
ab
ita
t-a
ctiv
ity
com
bin
ati
on
s.
aS
tre
sso
rd
ista
nce
no
tu
sed
for
ma
pp
ing
du
eto
the
coa
rse
reso
luti
on
of
the
da
ta,
Min
=m
inim
al,
S=
sho
rt(2
00
m),
SM
=sh
ort
-me
diu
m(5
00
m),
M=
me
diu
m(2
km
),M
L=
me
diu
m-l
on
g(1
0k
m),
L=
lon
g(3
0k
m),
VL
=v
ery
lon
g(3
0k
m).
Table 2Summary of modeled impact scores for each of the activity group on benthic
habitats, shallow pelagic waters and deep pelagic waters.
Benthic
impact:
% of total
Shallow
pelagic
impact:
% of total
Deep
pelagic
impact:
% of total
% of
total
Aquaculture 0.4 2.1 0.0 2.5
Marine transportation 1.1 16.6 0.0 17.7
Other 0.0 0.0 0.0 0.1
Land-based 7.9 9.6 1.7 19.1
Recreational fishing 1.2 2.4 0.0 3.6
Commercial fishing 32.0 18.3 6.7 57.0
Sub-totals 42.6 49.0 8.4 100.0
Each fishery is considered as a separate layer in these results.
Table 3Sensitivity analysis of the influence of fisheries on benthic habitats, depending on
how the fisheries data are considered in the analysis.
Scenarios Total
impact
score
% of
total
benthic
Fisheries included as a
separate layer for each
fishery (original scenario)
Aquaculture 65,740 1.0
Marine transportation 173,133 2.6
Other 3,791 0.1
Land-based 1,221,166 18.4
Recreational fishing—each fishery included separately 191,883 2.9
Commercial fishing—each fishery included separately 4,965,935 75.0
Total 6,621,648
Commercial fisheries included by impact category,
recreational as one layer
Aquaculture 65,740 2.9
Marine transportation 173,133 7.6
Other 3,791 0.2
Land-based 1,221,166 53.9
Recreational fishing included as one layer 48,941 2.2
commercial fishing—each impact group included
separately 754,472 33.3
Total 2,267,243
Commercial fisheries included as one layer, recreational
fisheries as one layer
Aquaculture 65,740 3.8
Marine transportation 173,133 10.0
Other 3,791 0.2
Land-based 1,221,166 70.5
Recreational fishing included as one layer 48,941 2.8
Commercial fishing included as one layer 220,242 12.7
Total 1,733,013
N.C. Ban et al. / Marine Policy 34 (2010) 876–886 881
Author's personal copyARTICLE IN PRESS
Unlike other impact mapping studies [4,5,8,9], the effective-ness of conservation designations at mitigating such impacts wasgauged. Existing spatial conservation designations within BC’swaters, while they may address a specific activity, do not appearvery successful at mitigating spatial human impacts overall,suggesting that existing designations may be failing to meet theiroverarching conservation objectives and mandates. Severalpotential explanations exist: first, the conservation designationsmay not provide sufficient protection, allowing many of the
stressors to continue within their boundaries. Second, enforce-ment may not be sufficient to ensure compliance of regulations.Finally, some of the stressors may originate outside of theboundaries of the designations. Regardless of which explanationmay be most correct—likely some combination thereof—theconservation designations and associated regulations should beexamined to ensure that they provide adequate protection toachieve their intent. These troubling results emphasize the needfor similar impact mapping studies in other geographic regions, as
Fig. 3. Relative impact of activities in Canada’s Pacific maritime area based on the number of cells the activity influences, and the mean impact score of each activity.
a=surface pelagic waters, fisheries; b=benthic habitats, fisheries; c=surface pelagic waters, other activities; d=benthic habitats, other activities; e=deep pelagic habitats,
all activities.
N.C. Ban et al. / Marine Policy 34 (2010) 876–886882
Author's personal copyARTICLE IN PRESS
well as finer scale investigations. This initial study suggests thatinstead of taking a piecemeal approach, conservation designationswould be more effective if a broader range of human impactswere restricted within protected area boundaries and environs.
4.1. Limitations
While there is utility in impact mapping studies for conserva-tion, there are also many gaps in knowledge about cumulativeimpacts, and limitations in the current analysis. In particular,three core assumptions underlie the analysis: (1) impacts weretreated as additive, (2) linear decay from the origin of activitieswas assumed, and (3) assumed, without dedicated field studies,was that the impact scores approximately reflect relativeconditions in the water.
First, stressors are considered additive or incremental whenimpacts are repeated additions of the same type [23]. This is whatmapping studies such as this one assume [4,5,8,9]. However,stressors can be synergistic or interactive when the combinedeffect is larger than the additive effect of each stressor wouldpredict [23–25]. Both additive and synergistic effects areconsidered cumulative. Yet stressors can also be antagonistic,when the impact is less than expected [24,25]. Information onstressor interactions was lacking, and hence additivity wasassumed. Recent meta-analyses have shown that stressor inter-actions are additive, synergistic, and antagonistic with littleability to predict which will occur when, and with roughly equalproportions [12,13], and therefore, barring additional information,assuming additivity is appropriate [4,5,8,9]. Similarly, the impactlevels at which ecosystem functioning is compromised is anunknown, and will vary from ecosystem to ecosystem [12]. Thus,while this analysis approach can show relative impacts, and areasof particular concern, a better understanding of quantified effectsis a critical next step if future analyses are to be explicitlyemployed to set specific quantitative limits and thresholds forhuman activities in order to maintain ecosystem resilience.Studies of common marine stressor interactions and their effect
on ecosystems would improve both the accuracy of, andconfidence in, impact maps.
Secondly, linear decay of impacts from their origin wasassumed. In reality, varying distance decays are likely associatedwith different stressors [3,23]. Overall, not enough is known aboutthe effects of stressors to apply specific functions for each type ofstressor. Similarly, the linear decay assumes that stressors diffuseequally in all directions, when in fact currents and river plumes arelikely to influence the diffusion of stressors. Further assumptionsinclude that deep pelagic habitats (>200 m) will also be affected byactivities that occur or are able to diffuse in surface waters overdeep habitats (e.g. chemical pollution, trophic cascade effects,noise, etc.). Future analyses could model such linkages, informa-tion permitting, though given the uncertainty of many issuessurrounding marine connectivity, there is a risk that after a greatdeal of effort the results may not be much more accurate, andelaboration of this approach should be taken with care [26].
Thirdly, cumulative impact scores were assumed to reflectrelative in-the-water estimates of condition—lower scores in-dicate a healthier ecosystem, higher scores indicate cumulativeimpacts are likely occurring. Visually, the results ‘‘make sense’’ tothe authors and reflect knowledge of the BC marine environment.Unfortunately data were not available to ground-truth the resultsof the mapping exercise, an often intrinsic problem also faced bybroad regional-scale impact mapping exercises [5,8,9]. The impactscores of the analysis are intended to capture the relative impactof human activities; even if ground-truthing data were available,cumulative impact assessment would help to explain oceanconditions for each location. However, such modeling is notintended to provide an absolute indication of the health of anygiven place in the ocean, but rather a relative indication. In theabsence of absolute field measurements, relative modeledmeasures can still be used to direct future management and fieldresearch actions.
As with any study that applies information from the marineenvironment, there are substantial data gaps, as would apply forany region of the world. Spatial distribution of anthropogenicpressures was available for most, but not all, maritime activitiesthought to be of possible concern. However, the information
Fig. 4. Mean impact score (per 200 m pixel) on benthic habitats in Canada’s Pacific maritime area broken down by activity category.
N.C. Ban et al. / Marine Policy 34 (2010) 876–886 883
Author's personal copyARTICLE IN PRESS
Ta
ble
4M
ea
nim
pa
ctsc
ore
sw
ith
insp
ati
al
con
serv
ati
on
me
asu
res
com
pa
red
tom
ea
nim
pa
ctsc
ore
for
the
eco
reg
ion
inw
hic
hth
ey
occ
ur
(da
rke
r(b
old
ita
lic)
va
lue
sin
dic
ate
dw
he
reim
pa
ctsc
ore
sin
the
con
serv
ati
on
are
aa
reg
rea
ter
tha
nth
at
of
the
eco
reg
ion
,li
gh
ter
(ita
lic)
wh
ere
the
ya
relo
we
r). E
core
gio
n
Co
nti
ne
nta
l
Slo
pe
Dix
on
En
tra
nce
He
cate
Str
ait
Joh
nst
on
e
Str
ait
Jua
nd
eFu
ca
Str
ait
No
rth
Co
ast
Fjo
rds
Qu
ee
n
Ch
arl
ott
e
So
un
d
Qu
ee
n
Ch
arl
ott
e
Str
ait
Str
ait
of
Ge
org
ia
Su
ba
rcti
c
Pa
cifi
c
Tra
nsi
tio
na
l
Pa
cifi
c
Va
nco
uv
er
Isla
nd
Sh
elf
be
nth
ic1
.64
1.2
31
.81
3.6
43
.19
3.0
50
.97
3.7
56
.23
0.0
10
.00
2.0
4
Me
an
for
Eco
reg
ion
sha
llo
w
pe
lag
ic
0.9
81
.94
1.9
45
.54
4.4
23
.36
1.1
45
.29
6.8
20
.07
0.1
31
.92
de
ep
pe
lag
ic
0.3
01
.21
1.1
61
.70
0.2
51
.51
0.8
81
.98
3.1
20
.06
0.0
21
.43
Co
nse
rva
tio
nty
pe
Pro
tect
eda
rea
s,ex
isti
ng
an
dp
rop
ose
d
MP
As
be
nth
ic1
.81
2.2
61
.95
3.6
73
.49
2.8
62
.29
5.0
95
.87
0.1
80
.00
2.3
4
sha
llo
w
pe
lag
ic
2.6
22
.97
2.4
66
.40
5.0
92
.31
1.6
97
.09
6.0
70
.03
0.0
02
.20
de
ep
pe
lag
ic
0.0
0N
AN
A1
.87
NA
1.2
5N
A2
.24
0.5
10
.00
0.0
00
.14
Ca
nd
ida
teM
PA
sb
en
thic
1.3
9N
A2
.46
NA
NA
NA
0.9
3N
A7
.12
NA
0.0
01
.42
sha
llo
w
pe
lag
ic
0.8
0N
A2
.22
NA
NA
NA
0.5
3N
A7
.28
NA
0.2
40
.84
de
ep
pe
lag
ic
0.1
1N
A1
.18
NA
NA
NA
0.1
9N
A3
.04
NA
0.0
00
.00
Fish
erie
scl
osu
res
Ro
ckfi
shco
nse
rva
tio
n
are
as
(20
04
)
be
nth
ic2
.67
NA
NA
3.5
93
.15
1.8
92
.36
3.5
67
.97
NA
NA
1.4
3
sha
llo
w
pe
lag
ic
2.4
1N
AN
A6
.71
5.1
51
.83
2.2
24
.45
7.6
4N
AN
A1
.75
de
ep
pe
lag
ic
NA
NA
NA
NA
NA
NA
NA
0.9
54
.30
NA
NA
NA
Spec
ies
at
risk
crit
ica
lh
ab
ita
tsN
ort
he
rnre
sid
en
t
orc
as
be
nth
icN
AN
AN
A4
.08
NA
NA
NA
3.8
5N
AN
AN
AN
A
sha
llo
w
pe
lag
ic
NA
NA
NA
7.7
6N
AN
AN
A5
.85
NA
NA
NA
NA
de
ep
pe
lag
ic
NA
NA
NA
3.6
3N
AN
AN
A4
.05
NA
NA
NA
NA
So
uth
ern
resi
de
nt
orc
as
be
nth
icN
AN
AN
AN
A3
.16
NA
NA
NA
5.3
7N
AN
A1
.04
sha
llo
w
pe
lag
ic
NA
NA
NA
NA
4.4
2N
AN
AN
A6
.24
NA
NA
3.8
1
de
ep
pe
lag
ic
NA
NA
NA
NA
0.2
9N
AN
AN
A3
.87
NA
NA
NA
Th
ev
alu
es
are
me
an
imp
act
sco
res.
Ea
chfi
she
ryis
con
sid
ere
da
sa
sep
ara
tela
ye
rin
the
sere
sult
s.
N.C. Ban et al. / Marine Policy 34 (2010) 876–886884
Author's personal copyARTICLE IN PRESS
necessary to incorporate climate change related stressors was notavailable, which have been shown to be significant factors inother studies [8,9]. Other activities for which data did notexist—tourism activities such as whale watching, kayaking anddiving, and research activities—have low vulnerability scores andwould be unlikely to change the results. Historical data orpotential future activities were likewise unavailable, and there-fore the analysis presents only a snapshot in time. The mappingwas limited to the main stressor type for each activity. If betterinformation about the zone of influence of different stressors foreach activity becomes available, it would be possible to focus onmapping multiple stressor types for each activity. Another gap isthat the analysis, and others like it [4,5,8,9], has not attempted toincorporate spatial-temporal dynamics such as changing habitattypes (e.g., kelp, seagrass). These gaps represent opportunities forfurther refinement of the approach.
Many uncertainties are associated with inputs into cumulativeimpact maps. The analysis of the effect of summarizing fisheriesin different ways showed the sensitivity of the results to thenumber of layers included in the analysis. At present there is nocorrect way of deciding how many layers to include, but thecontext of a study and knowledge about the stressors andactivities can help inform the choice of layers. In this case, therewas interest in relating the study to management actions, andhence focused on mapping the main stressor for each managedactivity. The sensitivity of results to impact weighting schemeshas been analyzed and shown to be robust [4,15], but there maybe sensitivities to the stressor distance, accuracy of the habitatmap, and the number of categories used for the intensity ofactivities. When better field data become available, future studiescould test the effect of these components.
4.2. Conservation and management applicability
While the modeled cumulative impact maps from this projectare constrained by data and methodology, as discussed above,they remain the best approximation available in the study region.Therefore such maps should be useful in developing integratedmanagement plans, and in helping to identify strategies forexamining, and if required, reducing, anthropogenic impacts inareas of high scores. Such maps can assist in prioritizing bothareas for protection (‘‘naturalness’’ based on low impacts) [6,27],and areas to focus on for recovery/restoration (known ecologicalvalues existing in areas of high impacts). In addition, such mapscan inform precautionary management measures to reduce andmanage impacts from existing human activities and thoseplanned for the future. This work may help initiate discussionsamong management agencies and interested stakeholders withregard to quantifying and managing cumulative impacts in thePacific waters of Canada and its other oceans.
Human impacts are pervasive on the continental shelf,particularly near populated areas, and hence associated impactswill need to be taken into account in management of the marineenvironment. While there is much room to improve knowledge ofimpacts, there is sufficient information available to begin tomodel and identify vulnerable areas where cumulative impactslikely occur. Further research should seek to help improveunderstanding of interactions between various stressors and helpinform management thresholds (triggers) and limits for impactsfrom individual activities and cumulative impacts from multipleactivities in a given area. Nonetheless, a precautionary approachwould suggest that additional management measures shouldalready be considered for those areas of high relative cumulativeimpacts, even though absolute limit values cannot yet beassigned.
Acknowledgments
We would like to thank Michele Patterson for initiating thisproject after discussions with JAA. We gratefully acknowledge BenHalpern for sharing his vulnerability scores with us and forfeedback on earlier versions of the manuscript, the Province of BC,Fisheries and Oceans Canada and others for providing data. Wewould also like to thank Chris McDougall and Elaine Leung fortechnical assistance with spatial summaries, Genevieve Layton-Cartier for assistance with the literature searches, and anonymousreviewers for helpful comments. This work was funded in part bythe R.H.Webster Foundation and Gordon and Betty MooreFoundation.
Appendix A. Supplementary material
Supplementary data associated with this article can be foundin the online version at 10.1016/j.marpol.2010.01.010.
References
[1] Margules CR, Pressey RL. Systematic conservation planning. Nature2000;405:243–53.
[2] Pressey RL, Cabeza M, Watts MEJ, Cowling RM, Wilson KA. Conservationplanning in a changing world. Trends in Ecology and Evolution 2007(22):583–92.
[3] Halpern BS, McLeod KL, Rosenberg AA, Crowder LB. Managing for cumulativeimpacts in ecosystem-based management through ocean zoning. Ocean andCoastal Management 2008(51):203–11.
[4] Halpern BS, Walbridge S, Selkoe KA, Kappel CV, Micheli F, D’Agrosa C, et al. Aglobal map of human impact on marine ecosystems. Science 2008;319:948–52, doi:10.1126/science1149345.
[5] Ban N, Alder J. How wild is the ocean? Assessing the intensity ofanthropogenic marine activities in British Columbia, Canada DOI:10.1002/aqc.816. Aquatic conservation: marine and freshwater ecosystems. 2008;(18): 55–85.
[6] Tallis H, Ferdana Z, Gray E. Linking terrestrial and marine conservationplanning and threats analysis. Conserv Biol 2008;22:120–30.
[7] Eastwood PD, Mills CM, Aldridge JN, Houghton CA, Rogers SI. Humanactivities in UK offshore waters: an assessment of direct, physical pressure onthe seabed. ICES Journal of Marine Science: Journal du Conseil 2007;64:453.
[8] Halpern BS, Kappel CV, Selkoe KA, Micheli F, Ebert C, Kontgis C, et al.Mapping cumulative human impacts to California current marine ecosys-tems. Conserv Lett 2009(2):138–48.
[9] Selkoe K, Halpern B, Ebert C, Franklin E, Selig E, Casey K, et al. A map ofhuman impacts to a ‘‘pristine’’ coral reef ecosystem, the papah naumoku keamarine national monument. Coral Reefs 2009;28:635–50.
[10] Halpern BS, Selkoe KA, Micheli F, Kappel CV. Evaluating and ranking thevulnerability of global marine ecosystems to anthropogenic threats. ConservBiol 2007;21:1301–15.
[11] Adams SM. Assessing cause and effect of multiple stressors on marinesystems. Mar Pollut Bull 2005(51):649–57.
[12] Crain CM, Kroeker K, Halpern BS. Interactive and cumulative effects ofmultiple human stressors in marine systems. Ecol Lett 2008;11:1304–15.
[13] Darling ES, Cote IM. Quantifying the evidence for ecological synergies. EcolLett 2008;11:1278–86.
[14] Breitburg DL, Riedel GF. Multiple stressors in marine systems. In: Norse EA,Crowder LB, editors. Marine conservation biology. Washington D.C.: IslandPress; 2005. p. 167–82.
[15] Teck SJ, Halpern BS, Kappel CV, Micheli F, Selkoe KA, Crain CM, et al. Usingexpert judgment to estimate marine ecosystem vulnerability in the CaliforniaCurrent. Ecol Appl 2010, in press, doi:10.1890/09-1173.
[16] Jamieson GS, Levings CO. Marine protected areas in Canada—implications forboth conservation and fisheries management. Can J Fish Aquat Sci2001;58:138–57.
[17] Crowder LB, Norse EA. Essential ecological insights for marine ecosystem-based management and marine spatial planning. Mar Policy 2008;32:772–8.
[18] Pauly D, Alder J, Bennett E, Christensen V, Tyedmers P, Watson R. The futurefor fisheries. Science 2003;302:1359–61.
[19] Schill S, Raber G. Protected area gap decision-support system for ArcGIS 9.1user manual and tutorial: The Nature Conservancy; 2006–2007.
[20] Chuenpagdee R, Morgan LE, Maxwell SM, Norse EA, Pauly D. Shifting gears:assessing collateral impacts of fishing methods in US waters. Front EcolEnviron 2003;1:517–24.
N.C. Ban et al. / Marine Policy 34 (2010) 876–886 885

Author's personal copyARTICLE IN PRESS
[21] Bailey DM, Collins MA, Gordon JDM, Zuur AF, Priede IG. Long-term changes indeep-water fish populations in the northeast atlantic: a deeper reachingeffect of fisheries? Proc R Soc B Biol Sci 2009;276:1965–9.
[22] Zacharias MA, Howes DE, Harper JR, Wainwright P. The British Columbiamarine ecosystem classification: rationale, development, and verification.Coastal Manage 1998;26:105–24.
[23] Cooper LM. Guidelines for cumulative effects assessment in SEA of plans.London: Imperial College of London; 2004.
[24] Vinebrooke RD, Cottingham KL, Norberg J, Scheffer M, Dodson SI, Maberly SC,et al. Impacts of multiple stressors on biodiversity and ecosystem function-
ing: the role of species co-tolerance, Oikos 2004; 104: 451–7. doi:10.1111/j.0030-1299.2004.13255.x.
[25] Folt CL, Chen CY, Moore MV, Burnaford J. Synergism and antagonism amongmultiple stressors. Limnol Oceanogr 1999;44:864–77.
[26] Williams JC, ReVelle CS, Levin SA. Spatial attributes and reservedesign models: a review. Environ Modeling and Assessment 2005;10:163–81.
[27] Ban NC, Picard CR, Vincent ACJ. Comparing and integrating community-basedand science-based approaches in prioritizing marine areas for protection.Conserv Biol 2009;23:899-910, doi: 10.1111/j.1523-1739.2009.01185.x.
N.C. Ban et al. / Marine Policy 34 (2010) 876–886886