Cultural Diversity and Its Impact on Governance - arXiv
20
Cultural Diversity and Its Impact on Governance Tomáš Evan Czech Technical University in Prague Thákurova 2077/7, 160 00 Prague 6, Czechia tomas.evan@fit.cvut.cz Vladimír Holý Prague University of Economics and Business Winston Churchill Square 4, 130 67 Prague 3, Czechia [email protected] Abstract: Hofstede’s six cultural dimensions make it possible to measure the culture of countries but are criticized for assuming the homogeneity of each country. In this paper, we propose two mea- sures based on Hofstede’s cultural dimensions which take into account the heterogeneous structure of citizens with respect to their countries of origin. Using these improved measures, we study the influence of heterogeneous culture and cultural diversity on the quality of institutions measured by the six worldwide governance indicators. We use a linear regression model allowing for dependence in spatial and temporal dimensions as well as high correlation between the governance indicators. Our results show that the effect of cultural diversity improves some of the governance indicators while worsening others depending on the individual Hofstede cultural dimension. Keywords: Good Governance, Cultural Diversity, Migration, Worldwide Governance Indicators, Hofstede’s Cultural Dimensions. JEL Codes: C33, O15, O43. 1 Introduction The importance of institutions in the development of countries has been accepted for some time now. Countries’ institutions and policies do not come out of nowhere but are based on the convictions and reasoning of the holders of the culture as it is passed along from one generation to the next. Therefore, it is as important as it is interesting to put culture into the picture and to find the mechanisms through which culture influences both the institutions and well-being of its holders. Even the terms culture and institutions are intertwined. As we want to describe the influence of one on the other, we need to distinguish between the two. Thus, we will define both relatively narrowly. Culture is defined as personal or informal while institutions refer to formalized behaviour in line with North (1990) and Olson (1996), i.a. This allows us to use Hofstede’s cultural dimensions (Hofstede et al., 2010) as a proxy for personal culture and the worldwide governance indicators of Kaufmann et al. (2011) as a proxy for the quality of institutions. Our paper has the following two goals: First, we propose two cultural measures based on Hofstede’s cultural dimensions which take into account the heterogeneity of the culture within a country. By incorporating the culture of the mi- grating populations into these measures, we mitigate some of the criticism of Hofstede’s cultural dimensions. For each of Hofstede’s cultural dimensions, we define the cultural level indicator as the average of the cultural dimensions assigned to each citizen based on the country of origin. The inter- actions of cultural minorities with the prevalent culture might have a distinct effect on governance beyond the change in the average of the country’s cultural dimensions. Therefore, for each of Hofst- ede’s cultural dimensions, we also determine the cultural diversity indicator defined as the standard deviation of the cultural dimension over all citizens of a country with respect to their different origins. Second, using the proposed indicators, we investigate the influence of culture and cultural diversity on the quality of governance of countries. In this, we follow our previous research Holý and Evan (2021) in which we study the dependence of the six worldwide governance indicators on Hofstede’s 1 arXiv:2112.11563v1 [econ.GN] 15 Dec 2021
-
Upload
khangminh22 -
Category
Documents
-
view
3 -
download
0
Transcript of Cultural Diversity and Its Impact on Governance - arXiv

Cultural Diversity and Its Impact on Governance
Tomáš EvanCzech Technical University in Prague
Thákurova 2077/7, 160 00 Prague 6, [email protected]
Vladimír HolýPrague University of Economics and Business
Winston Churchill Square 4, 130 67 Prague 3, [email protected]
Abstract: Hofstede’s six cultural dimensions make it possible to measure the culture of countriesbut are criticized for assuming the homogeneity of each country. In this paper, we propose two mea-sures based on Hofstede’s cultural dimensions which take into account the heterogeneous structureof citizens with respect to their countries of origin. Using these improved measures, we study theinfluence of heterogeneous culture and cultural diversity on the quality of institutions measured bythe six worldwide governance indicators. We use a linear regression model allowing for dependence inspatial and temporal dimensions as well as high correlation between the governance indicators. Ourresults show that the effect of cultural diversity improves some of the governance indicators whileworsening others depending on the individual Hofstede cultural dimension.
Keywords: Good Governance, Cultural Diversity, Migration, Worldwide Governance Indicators,Hofstede’s Cultural Dimensions.
JEL Codes: C33, O15, O43.
1 Introduction
The importance of institutions in the development of countries has been accepted for some time now.Countries’ institutions and policies do not come out of nowhere but are based on the convictions andreasoning of the holders of the culture as it is passed along from one generation to the next. Therefore,it is as important as it is interesting to put culture into the picture and to find the mechanisms throughwhich culture influences both the institutions and well-being of its holders. Even the terms cultureand institutions are intertwined. As we want to describe the influence of one on the other, we needto distinguish between the two. Thus, we will define both relatively narrowly. Culture is defined aspersonal or informal while institutions refer to formalized behaviour in line with North (1990) andOlson (1996), i.a. This allows us to use Hofstede’s cultural dimensions (Hofstede et al., 2010) as aproxy for personal culture and the worldwide governance indicators of Kaufmann et al. (2011) as aproxy for the quality of institutions. Our paper has the following two goals:
First, we propose two cultural measures based on Hofstede’s cultural dimensions which take intoaccount the heterogeneity of the culture within a country. By incorporating the culture of the mi-grating populations into these measures, we mitigate some of the criticism of Hofstede’s culturaldimensions. For each of Hofstede’s cultural dimensions, we define the cultural level indicator as theaverage of the cultural dimensions assigned to each citizen based on the country of origin. The inter-actions of cultural minorities with the prevalent culture might have a distinct effect on governancebeyond the change in the average of the country’s cultural dimensions. Therefore, for each of Hofst-ede’s cultural dimensions, we also determine the cultural diversity indicator defined as the standarddeviation of the cultural dimension over all citizens of a country with respect to their different origins.
Second, using the proposed indicators, we investigate the influence of culture and cultural diversityon the quality of governance of countries. In this, we follow our previous research Holý and Evan(2021) in which we study the dependence of the six worldwide governance indicators on Hofstede’s
1
arX
iv:2
112.
1156
3v1
[ec
on.G
N]
15
Dec
202
1
six cultural dimensions. In the current paper, we improve the regression model by relaxing the strongassumption of homogeneity of culture in each country. We let the culture be heterogonous withrespect to the different countries of origin of the migrating populations. This allows us to betterdescribe the complex relationship between culture and the quality of institutions and fill the gap inthe literature on this difficult to measure subject.
The rest of the paper is structured as follows. In Section 2, we review the theoretical backgroundof the influence of migration, culture, and cultural diversity on quality of governance. In Section 3,we describe the worldwide governance indicators and Hofstede’s cultural dimensions and propose ournovel measures of heterogeneous culture and cultural diversity. In Section 4, we use the proposedmeasures to assess the impact of culture and cultural diversity on governance using a regression model.We conclude the paper in Section 5.
2 Theoretical Background
2.1 Migration as a Source of Cultural Diversity
Since time immemorial large migrations were considered cataclysmic events. Neolithic tribes beforethe discovery and proliferation of the institution of private property and thus agriculture (North andThomas, 1977) operated under common ownership, which led to the exhaustion of local resources.This routine and arguably inevitable overhunting and overfishing was caused by the principle de-scribed by William Forster Lloyd already in 1833 as the tragedy of the commons (Lloyd, 1980). Thetribe was forced to move in order to survive, which led to violent clashes with other tribes in itspath and very often with the annihilation or mass enslavement of the weaker side. There is only ahandful of examples in history where a quasi-peaceful solution was found between different “cultures”sharing the same land. Eventually, migrations of entire tribes were replaced by migrations of specificgroups or individuals usually too aggressive or otherwise ill-fitting so as to be exiled or motivatedto leave. Instead of endangering entire domestic populations these smaller groups either expanded“civilisation” on the frontiers or lost their lives in an attempt to do so. Anything from AthenianOstracism through the Crusades to the Spanish Conquistadores fit this usually very violent category.An exceptional window of opportunity opened during the age of liberalism of the 19th century, whichcreated the first wave of globalisation with radically decreasing transportation costs, and an increas-ing need for primary products and staple foods. This development allowed for relatively peacefulbut immense labour migration and large capital inflows into the near empty frontier lands of the“areas of new settlement” in the USA, Canada, Australia, Argentina, Brazil and New Zealand. Fordecadal migration from 1880 to 1914, please see Table 2 in Green and Urquhart (1976) or Table 16in Baldwin and Martin (1999). The incredible increases in the number of people of European originin these countries very much changed the entire cultural, institutional, and socio-economic make upof those countries in just a few decades. This window of opportunity resolutely shut during the FirstWorld War symbolized by the (first) Red Scare in the USA after which the entire developed worldclosed its borders and allowed in only small numbers of immigrants under “Skilled Immigration PointsRequirements” or similar systems. Nevertheless, this rather uniquely peaceful change of populationand culture of the 19th century imprinted on the minds of both sender and receiver countries theidea of large migrations as something benign, even desirable, or worse, a sort of universal right. Thisis unfortunate as there is hardly any empty frontier today, and the situation has changed radically,including the possible motivation for migration (Borjas, 1999; Boeri, 2010), which suggests any largemigration will lead to cultural diversity.
As some form of assimilation, albeit very slow, is continuously taking place, in order for culturaldiversity to exist, the level of immigration to a country must be over a long period and significant innumbers. Therefore, it is a deliberate policy decision.
Culture is a very persistent phenomenon rarely changes dramatically in the lifetime of a humanbeing (Hofstede et al., 2010; Matei and Abrudan, 2018). In contrast, the creation of institutions,while a lengthy process, which can be blocked or reversed in adverse conditions, is a much morerapid development (North, 1992, 1994; Olson, 1996). As such, it is reasonable to hypothesize that
2

the culture of newcomers will change the institutions of the host country rather than the other wayaround, provided the newcomers have the possibility to do so. This seems to be particularly the casein democratic societies, which do not promote but limit the assimilation process (cultural pluralism,or multiculturalism).
As culture does not change easily, so even migrants do not change their culture irrespective ofwhere they are. This means that the overall culture of the host country will change. Our paper aimsto find out how much and what impact this change will have on the environment surrounding peoplein host countries. We focus on arguably the most important part of the environment, which is thequality of surrounding governance.
The impact of those changes is larger than what the size of the foreign-born population wouldsuggest. Clearly the whole population reacts to newcomers in a way which causes interaction andcreates significant changes in the culture of the host country. We cannot, however, specify to whatextent the changes are due to the presence of the foreign-born population directly and to what extentthe changes in the host country’s culture come about due to the majority population’s, or ratherboth cultures’, interaction. The nature of the data suggests the reaction by the majority populationsupersedes the change stemming from the mere presence of the foreign-born population.
There are three routes to decreasing cultural diversity. Cultural assimilation is the one naturallypreferred by the majority culture creating a society where all important values and institutions areunified and people of different race, ethnicity, even religion, culturally distinct at first are ultimatelyholders of the same culture. The second option is cultural divergence where to the extent of theirnumbers and abilities in particular fields, each distinct cultural group contributes some values oftheir own to the constantly changing culture. These blended institutions have been called a meltingpot. Finally, there is the theoretical concept of cultural pluralism, or a cultural salad, where eachculture lives in its own space next to another one, both remaining clearly identifiable. While somelevel of economic integration is likely to exist (common language, rudimentary social norms), culturaldiversity diminishes very slowly, if at all. Even from the point of view of a large vocal minority thisis not a good solution to the cultural diversity problem. Many of the negative issues (see below) suchas the poor distribution of public goods are problematic in this case. The former two options meansurrendering much of cultural identity while the latter does not remove any of the struggles, indeed,it would lead to the Balkanization of society (Brooks, 2012).
2.2 Impact of Cultural Diversity on Governance
The debate on cultural diversity is very old, indeed, recorded at least from the time of classicalliberalism. John Stuart Mill declared the following in 1862 regarding the need of nationalism andliberalism for democracy: ‘Free institutions are next to impossible in a country made up of differentnationalities. Among a people without fellow-feeling, especially if they read and speak differentlanguages, the united public opinion necessary to the working of representative government cannotexist. The influences which form opinions and decide political acts are different in the differentsections of the country’ (Mill, 1862, p. 310). And further, Mill declares the reasoning why underduress such society will not hold on to their free institutions: ‘Even if all are aggrieved, none feelthat they can rely on the others for fidelity in a joint resistance; the strength of none is sufficient toresist alone, and each may reasonably think that it consults its own advantage most by binding forthe favour of the government against the rest’ (Mill, 1862, p. 311). After one and a half centuries,researchers empowered by statistical analysis seem to consider Mill right. He correctly identified thatcultural diversity causes political instability and internal conflict (Fearon and Laitin, 1996; Easterlyand Levine, 1997; Easterly, 2001; Nettle et al., 2007, i.a.), diminishes trust among different groupsand the formation of social capital (Montgomery, 1991; Taylor, 2000; Zak and Knack, 2001; Greveand Salaff, 2003; Putnam, 2007, i.a.) while increasing the role of government at the same time asit decreases the provision of public goods (Alesina et al., 1999; Miguel et al., 2004). As for Mill’sconcern about free institutions and what we call citizens’ rights today, it is safe to say that variousdiversities make maintaining those institutions and rights significantly more difficult (Krain, 1998;Walker and Poe, 2002).
3

More to the point, some cultures are better at productive enterprises and economic creativity,than others (Williams and McGuire, 2010), or as Landes (1998, p. 276) put it: ‘institutions andculture first; money next’. An especially debilitating result can be met across cultures with ananti-capitalist cultural bias (Chakraborty et al., 2015). Mixing cultures does not seem to be goodfor business either, as there is also proven negative correlation between cultural heterogeneity andeconomic performance measured by either GDP, growth or productivity (Pool, 1972; Lian and Oneal,1997; Nettle, 2000; Grafton et al., 2002; Alesina et al., 2003, i.a.). Finally, international investmentcan be significantly affected when actors from several countries meet, as culture seems to definemuch of these encounters. Rejchrt and Higgs (2015) suggest that with high power distance in theirhome countries, non-domestic companies will likely not be compliant with host countries’ corporategovernance codes. Barkema and Vermeulen (1997) claim differences in cultural dimensions do leadto untimely dissolutions of international joint ventures. Governance, and property protection inparticular, seems to be a decisive factor for direct or portfolio foreign investment (FDI versus FPI)with the former dominating in countries with low protection and vice versa (Wu et al., 2012).
However, the literature also defines two areas where cultural diversity might be helpful to society.Both cases fit the economic concept of increased consumer choice where even countries producing thesame product, say motorcycles, can trade profitably, so that American consumers can enjoy varietyenhanced by German brands of motorcycles and vice versa. One of these areas where cultural diversitycan be helpful is innovation. It has been accepted that highly individualistic cultures with low powerdistance as well as low uncertainty avoidance and long-term orientation are better in innovation(Gorodnichenko and Roland, 2011; Taylor and Wilson, 2012, i.a.). As there are many other factorsthat play a part in the process of innovation such as educational levels, levels of infrastructure orspatial concentration and social milieus (Grözinger et al., 2017), it is not easy to separate out theeffects of diversity. Moreover, studies on the relationship between innovation and diversity are notcommon. Different cognitive models and the experience of a diverse pool of researchers can bring aboutbetter creative outcomes (Niebuhr, 2010; Stahl et al., 2010) while it can also lead to disagreementsand a lack of organization (Østergaard et al., 2011; Harvey and Kou, 2013). Zhan et al. (2015)suggest that those opposing results are because of researchers using race, ethnicity, nationality andculture interchangeably in their specifications. They claim that ethnic diversity dampens innovationinput thus impairing innovation output but if ethnic diversity is sufficiently low, cultural diversitycan increase innovation output. If the results of this paper can be replicated on a larger sample sizeit might change HR and admission policies for universities and research facilities alike.
The second area where the impact of cultural diversity is not clearly negative and has thus beenthe subject of hundreds of studies, is the functioning of work groups and labour market workingsin general. The ways in which diversity influences the workplace are well described. On one hand,higher diversity increases the effectiveness of tasks that call for a variety of viewpoints and experiences,which has been the main finding of many lab and academic setting type studies (Buller and Bell, 1986;Cox and Blake, 1991; Watson et al., 1993). However, after years of glorification of diversity pennedparticularly by American researchers advising that managers should increase workforce diversity toenhance work group effectiveness, a more balanced and critical approach has been chosen by themajority of authors. The field studies which were not based on value-in-diversity but rather social-identity perspectives suggested that increased cultural diversity caused a lack of trust and morebarriers to social interaction, which in turn instigated low organization and the inhibited productivityof diverse groups (Williams and O’Reilly III, 1998; Pelled et al., 1999; Earley and Mosakowski, 2000;Richard et al., 2004). Some authors (Ely and Thomas, 2001) try to resolve the issue by settingconditions under which cultural diversity would enhance work group functioning and productivity,but the issue remains unresolved with researchers being mostly sceptical about the prospects of somegeneral recommendations.
Based on the economic rule noted above, the fractionalization of some western societies does nothave the same impact on every area or group of those societies. Awaworyi Churchill (2017) for exampleclaims that despite the fact that ‘the very fundamentals of building of good institutions are impairedby diversity’ (p. 593) and ‘ethnic and linguistic fractionalization negatively influences entrepreneurship(new business density), and the institutional environment affecting entrepreneurship’ (p. 590), there
4

might be groups to benefit; as they might be accustomed to it. These are ethnic groups where businessownership and self-employment are more pronounced as some entrepreneurs and investors choose to dobusiness in highly fractionalized areas Khayesi et al. (2014). Also, Ottaviano and Peri (2006) suggeststhere is a silver lining to the increased levels of diversity in the United States. While immigrationcaused lower wages particularly for the low-skilled workforce, labour market fractionalization andpossibly endangered cultural values for the “natives”, US metropolitan areas with an increased culturaldiversity experienced higher wages and rental prices of their housing, as well as an increased varietyof consumption.
3 Measuring Governance, Culture, and Cultural Diversity
3.1 Worldwide Governance Indicators
Governance, or the way authority in a country is exercised, is among the most important institutionsfor one’s well-being. The way how governments are selected and monitored and how efficientlyand transparently they formulate and implement their policies is crucial for much of the country’sdevelopment.
In order to allow for cross-country comparisons, Kaufmann et al. (2011) propose six governanceindicators defined in the following way:
• Voice and Accountability (VA) captures perceptions of the extent to which a country’s citizensare able to participate in selecting their government, as well as freedom of expression, freedomof association, and a free media.
• Political Stability and Absence of Violence/Terrorism (PV) captures perceptions of the like-lihood that the government will be destabilized or overthrown by unconstitutional or violentmeans, including politically-motivated violence and terrorism.
• Government Effectiveness (GE) captures perceptions of the quality of public services, the qualityof the civil service and the degree of its independence from political pressures, the quality ofpolicy formulation and implementation, and the credibility of the government’s commitment tosuch policies.
• Regulatory Quality (RQ) captures perceptions of the ability of the government to formulate andimplement sound policies and regulations that permit and promote private sector development.
• Rule of Law (RL) captures perceptions of the extent to which agents have confidence in andabide by the rules of society, and in particular the quality of contract enforcement, propertyrights, the police, and the courts, as well as the likelihood of crime and violence.
• Control of Corruption (CC) captures perceptions of the extent to which public power is exercisedfor private gain, including both petty and grand forms of corruption, as well as “capture” of thestate by elites and private interests.
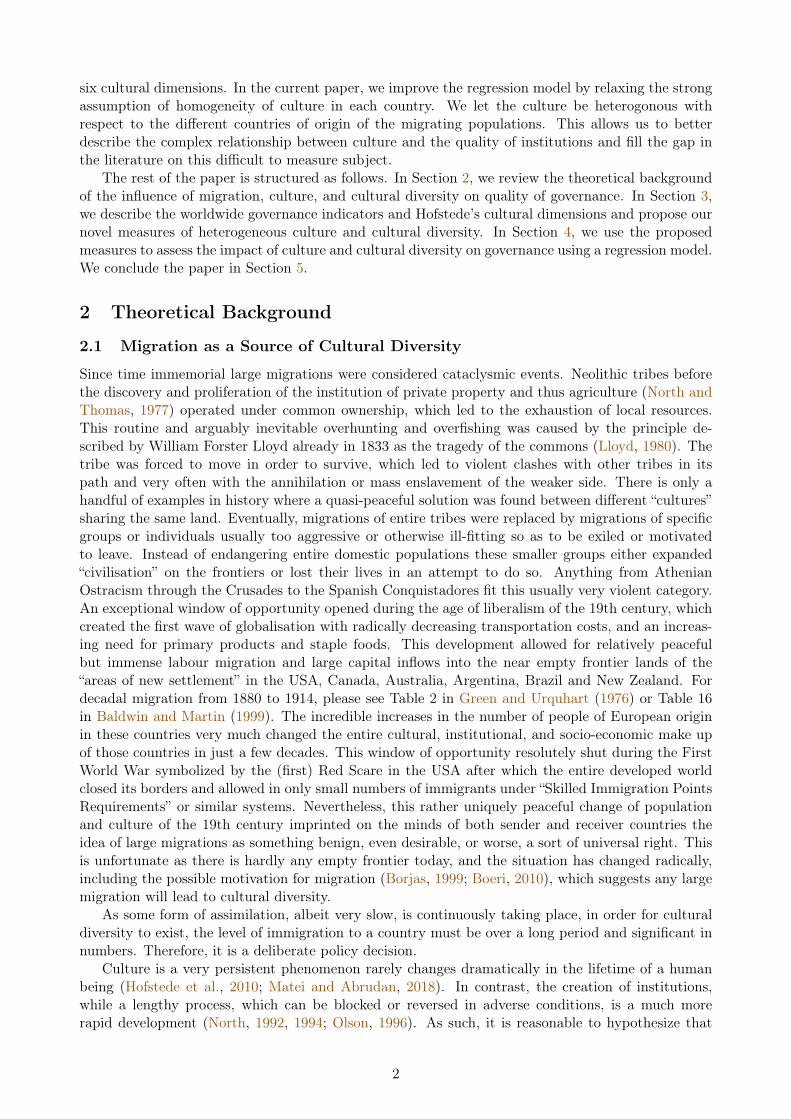
There is a strong correlation among the six governance indicators suggesting they measure thesame broad concept (Langbein and Knack, 2010). Consequently, some studies average the six indica-tors into a single index (Al-Marhubi, 2004; Bjørnskov, 2006). Figure 1 shows the average worldwidegovernance indicator in 2019. In our study, we distinguish between the six indicators but analysethem within a single model which takes into account a correlation between them.
3.2 Hofstede’s Cultural Dimensions
Culture has a profound impact on a great variety of institutions and realities around us starting fromdiverse political and socio-economic development to particularities such as homicide levels (Lappi-Seppälä and Lehti, 2014), economic systems (Pryor, 2007), tax structures (Koenig et al., 2012),proclivity to insurance coverage (Outreville, 2018), or level of terrorist activity (Meierrieks and Gries,
5

−2
−1
0
1
2
Indicator
Average World Governance Indicator in 2019
Figure 1: The average world governance indicator in the analysed countries in 2019.
2013); please see Evan and Bolotov (2021); Holý and Evan (2021) for more references. Personalculture as defined by Hofstede et al. (2010) has an important advantage of being a rather generalphenomenon, espousing quite a lot of salient divisions, and is thus a meaningful tool to measure thevariety of socio-economic differentiation as its popularity attests.
Hofstede et al. (2010) define the six cultural dimensions in the following way:
• Power Distance (PDI) is the extent to which the less powerful members of institutions andorganizations within a country expect and accept that power is distributed unequally.
• Individualism (IDV) pertains to societies in which the ties between individuals are loose: ev-eryone is expected to look after him- or herself and his or her immediate family. Collectivism asits opposite pertains to societies in which people from birth onward are integrated into strong,cohesive in-groups, which throughout people’s lifetime continue to protect them in exchange forunquestioning loyalty.
• Masculinity (MAS) refers to society where emotional gender roles are clearly distinct: men aresupposed to be assertive, tough, and focused on material success, whereas women are supposedto be more modest, tender, and concerned with the quality of life. A society is called femininewhen emotional gender roles overlap: both men and women are supposed to be modest, tender,and concerned with the quality of life.
• Uncertainty Avoidance (UAI) is the extent to which the members of a culture feel threatenedby ambiguous or unknown situations.
• Long-Term Orientation (LTO) stands for the fostering of virtues oriented toward future rewards– in particular, perseverance and thrift. Its opposite pole, short-term orientation, stands forthe fostering of virtues related to the past and present – in particular, respect for tradition,preservation of “face”, and fulfilling social obligations.
• Indulgence (IVR) stands for a tendency to allow relatively free gratification of basic and naturalhuman desires related to enjoying life and having fun. Its opposite pole, restraint, reflects aconviction that such gratification needs to be curbed and regulated by strict social norms.
Hofstede’s cultural dimensions have attracted criticism (Dorfman and Howell, 1988; Schwartz,1999; McSweeney, 2002; Jones, 2007; Taras et al., 2016, i.a.) as among other things they suppose
6

that within a state, there is a uniform national culture. This is rather paradoxical as Hofstede himselfstarted his research about cultural differences not only within one country but within one corporation.Many of his well-known quotes are painfully aware of the dangers of the close proximity of differentcultures: ‘Culture is more often a source of conflict than of synergy. Cultural differences are a nuisanceat best and often a disaster’1. This nuisance or disaster is clearly present within countries, as fewof them are completely culturally uniform. There are several ways how to deal with the problem.House et al. (2004) and Taras et al. (2016) suggest doing away with countries, as their borders arenot good boundaries of culture, in favour of professions or socio-economic classes. Others think theboundaries of states are useful when measuring culture: ‘Moreover, nations matter because they havegovernments who establish policies on trade, factor mobility, and the like (which policies, it can beargued, are shaped by the national culture)’ (Williams and McGuire, 2010, p. 408).
3.3 Various Cultural Diversity Measures
The existing body of literature on cultural diversity is also large but it is less compact, given the varietyof different approaches. Firstly, different diversities were used in terms of (i) race and ethnicity, (ii)religion, (iii) language, (iv) or their combinations, and (v) culture. In order to distinguish the impactof culture on institutions using secondary data, researchers used comparison of the diversities namedabove largely with major socio-economic variables. However, geographic variables (Laitin et al., 2012),changes in institutions stemming from changed migration patterns or levels of assimilation (Alganand Cahuc, 2010; Luttmer and Singhal, 2011), or new epidemiological approaches (Fernández, 2010;Maseland, 2013) were also used.
There are two measurements of cultural diversity used most often. Both have attracted significantcriticism. The cultural polarisation concept has been criticised for being vague as Bramson et al.(2017) summarizes: ‘A range of very different social configurations and very different social dynamicshave been lumped together under the term “polarization”.’ (p. 117). And the Ethno-LinguisticFractionalisation index, or ELF – the likelihood that two people chosen at random will be fromdifferent ethnic groups – has been criticized for having at least four major problems (Laitin andPosner, 2001). While we accept and cite from findings based on those methods in the theoreticalpart, we have chosen a different approach in our empirical study. We define our cultural diversitymeasure based on Hofstede’s cultural dimensions and the international migrant stock with the toolsof basic statistical analysis.
3.4 Cultural Level and Diversity Indicators
A disadvantage of Hofstede’s cultural dimensions theory is that it assumes that the culture is homoge-neous in each country. We relax this assumption and let the culture be heterogenous with respect tothe different countries of origin of the citizens. We define two measures to capture the heterogeneityof the culture.
First, we assign each citizen of a country Hofstede’s cultural dimensions of the country he or shewas born in. Let POPi,t denote the population of country i as of year t and BICi,t,o the numberof citizens in country i born in country o as of year t. Furthermore, let HCDi,k denote the k-thHofstede’s cultural dimension of country i. The k-th cultural level indicator CLIi,t,k of country i asof year t is defined as the average of the k-th Hofstede’s cultural dimension over all citizens of thecountry, i.e.
CLIi,t,k =N∑o=1
BICi,t,o
POPi,tHCDo,k. (1)
Note that Hofstede’s cultural dimensions are constant over time while our proposed indicators aredynamic due to the changing structure of citizens.
1As quoted by Vance and Paik (2014, p. 37).
7

0.00
0.05
0.10
0.15
Indicator
Average Cultural Diversity in 2019
Figure 2: The average cultural diversity measure in the analysed countries in 2019.
The k-th cultural diversity indicator CDIi,t,k of country i as of year t is defined as the standarddeviation of the k-th Hofstede’s cultural dimension over all citizens of the country, i.e.
CDIi,t,k =
√√√√ N∑o=1
BICi,t,o
POPi,t(HCDo,k − CLIi,t,k)2. (2)
Values close to zero indicate that all citizens have similar Hofstede’s cultural dimensions (given bythe cultural level indicator) while larger values indicate that Hofstede’s cultural dimensions of citizensare dispersed (some are lower and some higher than the cultural level indicator). Figure 2 shows thecultural diversity indicator averaged over the six dimensions in 2019.
Naturally, there are limitations mainly due to a lack of data, allowing us only to study migrationpatterns over the last few decades. An admixture of earlier migrations or even centuries-old minoritiesin the countries of our sample are taken simply as part of the original culture of the host country.Thus, the heterogeneity relates only to recent migrations. We are also unable to identify holders ofwhat culture migrated from one country to another, due to a lack of data. In another words, if aFrench citizen of German ethnicity from Alsace managed to hold to German culture and has migratedto the Netherlands, our model will nevertheless consider him a Frenchman in the Netherlands.
4 Estimating Dependence of Governance on Cultural Diversity
4.1 Analysed Data Sample
As noted above, the construction of the proposed cultural level and diversity indicators is limiteddue to data availability. Our source of Hofstede’s six cultural dimensions is Hofstede Insights (2021),which offers data for 118 countries. The data on international migrant stock are obtained from theUnited Nations (2019) and are available for 232 countries and regions in 1990, 1995, 2000, 2005, 2010,2015, and 20192. The data also include some immigrants with unspecified countries of origin.
2The United Nations (2019) source of our data uses the following explanatory note (p. 3): ‘International migrantshave been equated with the foreign-born population whenever this information is available, which is the case in mostcountries or areas. In most countries lacking data on place of birth, information on the country of citizenship of thoseenumerated was available and was used as the basis for the identification of international migrants, thus effectivelyequating, in these cases, international migrants with foreign citizens.’
8

To construct the proposed cultural level and diversity indicators, we would need to know Hofst-ede’s cultural dimensions of all the countries of origin of all immigrants. Unfortunately, not all areavailable. For the purposes of our indicators, we resort to the spatial imputations of Hofstede’s cul-tural dimensions. Each unknown value is interpolated as the average of the five nearest neighbours3.We stress that we use this approach only for the construction of the proposed indicators with foreigncountries of origin. When a country has unknown Hofstede’s cultural dimensions, we do not computethe proposed indicators for it and exclude it from the regression model. Concerning the portion ofimmigrants with an unknown country of origin, we assign them individual countries proportionallyto the total number of emigrants from the individual countries. These two data imputation steps arenot ideal, but are necessary.
The source of the worldwide governance indicators is the World Bank (2021). The governanceindicators are compiled biannually from 1996 to 2002 and annually since 2002. They are available for214 countries and territories, with some missing values.
As we merge data from various sources with different samples of countries and time frames, someobservations are lost. Our final data sample consists of K = 6 cultural dimensions and M = 6 worldgovernance indicators observed for N = 116 countries in T = 5 time periods covering the years 2000,2005, 2010, 2015, and 2019.
4.2 Regression Model
Our aim is to model dependence of the worldwide governance indicators on the proposed culturallevel and diversity indicators. We let each governance indicator have its own equation, but we use asingle model as we allow for correlations between the governance indicators.
Let WGIi,t,j denote the j-th worldwide governance indicator of country i as of year t. Theregression equations are then given by
WGIi,t,j = αj +K∑k=1
βj,kCLIi,t,k +K∑k=1
γj,kCDIi,t,k + ui,t,j , (3)
where αi are intercepts, βj,k are coefficients for the cultural level indicators, γj,k are coefficients forthe cultural diversity indicators, and ui,t,j is the error term. We let the error term have quite a richdependence structure allowing for correlations in all three dimensions. First, we assume a spatialdependence in the form of a spatial error model (SEM) with the weight matrix given by the portionsof immigrants from the individual countries. Second, we assume a temporal dependence in the formof an autoregressive process (AR) of the first order. Third, we assume a dependence between theequations in the form of seemingly unrelated regressions (SUR). All put together, the error term hasthe structure
ui,t,j = λj∑o 6=i
BICi,t,o
POPi,t −BICi,t,iuo,t,j + ϕjui,t−1,j + ei,t,j , (4)
where λj are spatial coefficients, ϕj are serial coefficients, and ei,t,j is a normally distributed randomvariable with zero mean and covariance given by
E [ei1,t1,j1ei2,t2,j2 ] =
0 for i1 6= i2 or t1 6= t2,
σj1,j2 for i1 = i2 and t1 = t2.(5)
We estimate the model by the maximum likelihood method. Note that modelling the governanceindicators together in the SUR fashion increases the efficiency of the estimator in contrast to modellingeach equation separately.
3Other methods, such as those using weights based on inverse distance, inverse square distance, or different numbersof neighbours, lead to very similar results suggesting the robustness of our approach.
9

Table 1: The log-likelihood for various explanatory variables (in rows) and error structures (incolumns).
Indep. Spatial Serial SUR All
Hofstede’s Cultural Dimensions -3311.34 -3281.95 -1323.93 -1583.42 -319.28Heterogeneous Level -3239.00 -3215.67 -1282.34 -1553.37 -303.50Heterogeneous Level and Diversity -2729.37 -2703.67 -1020.44 -1333.74 -183.07
Table 2: The coefficient of determination for various explanatory variables (in rows) and equations(in columns).
VA PV GE RQ RL CC Pooled
Hofstede’s Cultural Dimensions 0.61 0.35 0.59 0.53 0.60 0.60 0.55Heterogeneous Level 0.61 0.37 0.61 0.55 0.62 0.62 0.57Heterogeneous Level and Diversity 0.62 0.47 0.73 0.66 0.75 0.75 0.67
4.3 Results and Implications
As the first step, we check whether the assumed error structure in our model is reasonable. Table1 reports the log-likelihood of the model with uncorrelated errors, the model with only spatiallycorrelated errors, the model with only serially correlated errors, the model with only SUR errors, andthe model described in Section 4.2 with all three error structures. According to Table 3, the spatialparameter λj is positive for all six governance indicators and significant for five. Table 1 shows asmall increase of log-likelihood when assuming spatially correlated errors rather than uncorrelatederrors. Spatial dependence is therefore present in the error term but appears to be rather weak. Serialcorrelation, on the other hand, is quite strong. According to Table 3, the serial parameter ϕj rangesbetween 0.77 and 0.87 for the individual governance indicators and is significant in all cases. Theincrease of log-likelihood in Table 1 is quite substantial when assuming serially correlated errors ratherthan uncorrelated errors. A similarly high increase is observed when assuming correlation betweenthe individual indicators rather than uncorrelated errors. According to Table 4, the correlations ofinter-equation residuals range between 0.31 and 0.72. We therefore proceed with the model thatassumes all three error structures, as described in Section 4.2.
Next, we consider Hofstede’s cultural dimensions to be the explanatory variables in our model,similarly to our previous work in Holý and Evan (2021)4. We compare the fit of this base modelwith the model in which Hofstede’s cultural dimensions are replaced by the proposed cultural levelindicators and the model in which cultural diversity indicators are further added. Table 1 shows thelog-likelihood while Table 2 shows the coefficient of determination (i.e. the R2 statistic) for the modelas a whole but also for the individual governance indicators. The proposed heterogeneous indicatorsare superior in all these aspects. Namely, using Hofstede’s cultural dimensions results in R2 of 0.55while the cultural level indicators result in slightly higher R2 of 0.57. By adding cultural diversityindicators, R2 is further increased to 0.67. In the sequel, we work only with the model containingboth the cultural level and diversity indicators.
The estimated coefficients of the final model are presented in Table 3, and, for better readability,also in Figures 3 and 4.
Concerning the cultural level indicators, Power Distance has a strong negative impact on thequality of institutions across the board. Individualism has the opposite effect. Masculinity has amild negative effect with low significance levels apart from Rule of Law and Control of Corruption.We found Uncertainty Avoidance to have a significantly positive effect on Voice and Accountability,significantly negative effect on Control of Corruption, and an insignificant effect on other governance
4Note that the model of Holý and Evan (2021) is different as it contains an additional error term representinginefficiency of the individual countries in the sense of the stochastic frontier analysis and, on the other hand, assumesthat the errors are uncorrelated.
10

Table 3: The estimated coefficients and their standard errors (in parentheses) in the model withheterogeneous level and diversity.
VA PV GE RQ RL CC
Constant αj −0.62∗ −0.22 −0.23 −0.06 0.16 0.09(0.27) (0.35) (0.24) (0.27) (0.24) (0.25)
PDI Level βj,1 −1.78∗∗∗ −1.36∗∗∗ −1.63∗∗∗ −1.91∗∗∗ −1.97∗∗∗ −1.88∗∗∗
(0.23) (0.31) (0.21) (0.24) (0.21) (0.22)
IDV Level βj,2 1.41∗∗∗ 1.00∗∗ 1.52∗∗∗ 0.76∗∗ 1.46∗∗∗ 1.62∗∗∗
(0.23) (0.31) (0.21) (0.24) (0.21) (0.22)
MAS Level βj,3 −0.27 −0.31 −0.26 −0.02 −0.45∗∗ −0.67∗∗∗
(0.18) (0.24) (0.16) (0.19) (0.16) (0.17)
UAI Level βj,4 0.72∗∗∗ 0.07 −0.23 0.03 0.05 −0.33∗
(0.15) (0.21) (0.14) (0.16) (0.14) (0.15)
LTO Level βj,5 0.81∗∗∗ 0.85∗∗∗ 1.16∗∗∗ 1.13∗∗∗ 0.75∗∗∗ 1.07∗∗∗
(0.17) (0.24) (0.16) (0.18) (0.16) (0.17)
IND Level βj,6 1.39∗∗∗ 0.55∗ 1.03∗∗∗ 1.03∗∗∗ 0.59∗∗∗ 1.04∗∗∗
(0.17) (0.24) (0.16) (0.18) (0.16) (0.17)
PDI Diversity γj,1 −1.20 −7.08∗∗∗ −1.43 −0.39 −2.43∗ −2.26∗
(1.17) (1.55) (1.05) (1.19) (1.04) (1.11)
IDV Diversity γj,2 1.50 −0.65 −2.72∗ 0.11 −2.47 −3.31∗
(1.47) (1.96) (1.33) (1.51) (1.32) (1.40)
MAS Diversity γj,3 0.47 3.86 0.15 −1.72 1.21 0.79(1.72) (2.24) (1.52) (1.73) (1.52) (1.61)
UAI Diversity γj,4 0.13 8.20∗∗∗ 3.05∗ 3.32∗ 2.91∗ 2.35(1.45) (1.91) (1.30) (1.47) (1.29) (1.37)
LTO Diversity γj,5 0.97 1.90 7.55∗∗∗ 5.45∗∗∗ 6.30∗∗∗ 8.04∗∗∗
(1.55) (2.07) (1.41) (1.59) (1.39) (1.48)
IND Diversity γj,6 1.06 3.14 0.65 0.20 3.16 3.05(1.93) (2.60) (1.77) (1.99) (1.73) (1.86)
Spatial Parameter λj 0.06 0.15∗∗∗ 0.15∗∗∗ 0.14∗∗∗ 0.16∗∗∗ 0.13∗∗∗
(0.03) (0.03) (0.04) (0.04) (0.03) (0.04)
Serial Parameter ϕj 0.87∗∗∗ 0.77∗∗∗ 0.78∗∗∗ 0.80∗∗∗ 0.82∗∗∗ 0.79∗∗∗
(0.02) (0.03) (0.02) (0.02) (0.02) (0.02)
Note: ∗∗∗p < 0.001; ∗∗p < 0.01; ∗p < 0.05
Table 4: The variance (diagonal), covariance (lower triangle), and correlation (upper triangle) ofinter-equation residuals in the model with heterogeneous level and diversity.
VA PV GE RQ RL CC
VA 0.10 0.31 0.44 0.48 0.55 0.46PV 0.04 0.19 0.44 0.37 0.50 0.44GE 0.04 0.06 0.09 0.69 0.72 0.67RQ 0.05 0.05 0.07 0.11 0.64 0.55RL 0.05 0.06 0.06 0.06 0.08 0.69CC 0.05 0.06 0.06 0.06 0.06 0.10
11

−1.78*** −1.36*** −1.63*** −1.91*** −1.97*** −1.88***
1.41*** 1.00** 1.52*** 0.76** 1.46*** 1.62***
−0.27 −0.31 −0.26 −0.02 −0.45** −0.67***
0.72*** 0.07 −0.23 0.03 0.05 −0.33*
0.81*** 0.85*** 1.16*** 1.13*** 0.75*** 1.07***
1.39*** 0.55* 1.03*** 1.03*** 0.59*** 1.04***Indulgence
Long−Term Orientation
Uncertainty Avoidance
Masculinity
Individualism
Power Distance
Voice
and
Acc
ount
abilit
y
Politic
al Sta
bility
Gover
nmen
t Effe
ctive
ness
Regula
tory
Qua
lity
Rule o
f Law
Contro
l of C
orru
ption
−2
−1
0
1
2
Coefficient
The Effect of Cultural Level
Figure 3: The estimated coefficients for cultural level variables in the model with heterogeneous leveland diversity.
−1.20 −7.08*** −1.43 −0.39 −2.43* −2.26*
1.50 −0.65 −2.72* 0.11 −2.47 −3.31*
0.47 3.86 0.15 −1.72 1.21 0.79
0.13 8.20*** 3.05* 3.32* 2.91* 2.35
0.97 1.90 7.55*** 5.45*** 6.30*** 8.04***
1.06 3.14 0.65 0.20 3.16 3.05Indulgence
Long−Term Orientation
Uncertainty Avoidance
Masculinity
Individualism
Power Distance
Voice
and
Acc
ount
abilit
y
Politic
al Sta
bility
Gover
nmen
t Effe
ctive
ness
Regula
tory
Qua
lity
Rule o
f Law
Contro
l of C
orru
ption
−10
−5
0
5
10
Coefficient
The Effect of Cultural Diversity
Figure 4: The estimated coefficients for cultural diversity variables in the model with heterogeneouslevel and diversity.
12

indicators. Both Long-Term Orientation and Indulgence have statistically significant positive effectson all the governance indicators.
When comparing the previous model of Holý and Evan (2021) with our newly proposed modelallowing for admixing of the foreign born population and a more general correlation structure, we cansay that the direction of the effects remains the same but significance differs. Notably, the previousmodel finds Masculinity and Uncertainty Avoidance mostly significant while the proposed model doesnot. We believe the proposed model to be more reliable due to the better handling of correlations inthe error term.
The proposed model also has a better fit as it takes into account the effects of cultural hetero-geneity. Typical migration patterns involve people moving from less developed countries to moredeveloped ones. The less developed countries tend to have governance of considerably inferior qualityconnected to particular cultural roadblocks as identified in Holý and Evan (2021) and confirmed here.Namely, the positive effect of Individualism, and to some extent Long-Term Orientation and Indul-gence with the negative effect of Power Distance, and to a lesser extent Masculinity and UncertaintyAvoidance.
Therefore, the admixture of holders of cultures from less developed countries should cause thedeterioration of governance even in developed countries across the board. Surprisingly enough, it doesnot. In any case by incorporating information on migration patterns, the cultural level indicators area more faithful measure of culture in comparison to Hofstede’s cultural dimensions.
Heterogeneity of culture is also captured by the cultural diversity indicators. Overall, the effectsof diversity are not as pronounced as in the case of the cultural level indicators. Nevertheless, thereare some interesting results. Power Distance and Individualism have a partly significant negativeeffect on governance and a partly insignificant effect. Specifically, a large variation in Power Distanceamong the citizens leads to low Political Stability, Rule of Law, and Control of Corruption. Similarly,a large variation in Individualism leads to low Government Effectiveness and Control of Corruption.The positive effects of diversity, on the other hand, can be found for Uncertainty Avoidance and Long-Term Orientation. Specifically, a large variation in Uncertainty Avoidance among citizens leads tohigh Political Stability, Government Effectiveness, Regulatory Quality, and Rule of Law. Similarly, alarge variation in Long-Term Orientation leads to high Government Effectiveness, Regulatory Quality,Rule of Law, and Control of Corruption. Finally, the effects of diversity on Masculinity and Indulgenceare statistically insignificant for each governance indicator.
Tang and Koveos (2008) argue that dramatic changes in economic conditions can be the sourceof cultural dynamics even within tens of years. They have found that some of Hofstede’s culturaldimensions are less permanent than others. These are Individualism, Long-Term Orientation, andPower Distance, while Uncertainty Avoidance and Masculinity are more stable as they seem to rep-resent traditional institutions such as language, religion, or surrounding conditions. Their resultswere confirmed over a longer timeframe by Zhao et al. (2016) while the connection of cultural changeto (socio-) economic development has also been verified by Matei and Abrudan (2018). These find-ings can be relevant for both our results of cultural influence and cultural diversity. Notably, thenegative effects of cultural diversity are mainly in “changeable” Power Distance and Individualism.This means that given favourable economic conditions and significant time, the impact of those twocultural roadblocks to good governance should ease.
We summarize our findings in Table 5.
5 Conclusion
Hofstede’s cultural dimensions are open to criticism by defining and measuring culture as a “nationalculture” and thus not reflecting cultural diversity within a country. We have improved on this nationalculture concept by measuring the culture of immigrants into every country and defined the culturalchange and the current cultural diversity. However, as we use migratory data of only the last fewdecades, we are unable to define the pre-existing minorities.
We have determined the influence of culture and cultural diversity on the quality of governanceof countries by admixing the foreign-born populations into Hofstede’s cultural dimensions as these
13

Table 5: Summary of the effects in the model with heterogeneous level and diversity.Effect of Level Effect of Diversity
Power Distance Negative Partly NegativeIndividualism Positive Partly NegativeMasculinity Partly Negative InsignificantUncertainty Avoidance Mixed Partly PositiveLong-Term Orientation Positive Partly PositiveIndulgence Positive Insignificant
citizens are also part of the “national culture”. These amended cultural dimensions significantlyimproved our model measuring the impact of culture on governance – the coefficient of determinationincreased from 0.55 to 0.67. We have found Power Distance to have a significant negative impactwhile Individualism, Long-Term Orientation, and Indulgence have a significant positive impact onthe quality of institutions across the board.
Contrary to expectations, increased cultural diversity, which we defined as the standard deviationof the individual Hofstede’s cultural dimensions over all citizens of the country, did not have anoverarching negative impact on governance, but split by pairs. Cultural diversity in Power Distanceand Individualism has a partly negative effect on world governance indicators, Uncertainty Avoidanceand Long-Term Orientation have a partly positive effect while Masculinity and Indulgence have nosignificant effect.
Funding
The work of Vladimír Holý was supported by the Internal Grant Agency of the Prague University ofEconomics and Business under project F4/27/2020.
References
Al-Marhubi, F. 2004. The Determinants of Governance: A Cross-Country Analysis. ContemporaryEconomic Policy. Volume 22. Issue 3. Pages 394–406. ISSN 1074-3529. https://doi.org/10.1093/cep/byh029.
Alesina, A., Baqir, R., Easterly, W. 1999. Public Goods and Ethnic Divisions. QuarterlyJournal of Economics. Volume 114. Issue 4. Pages 1243–1284. ISSN 0033-5533. https://doi.org/10.1162/003355399556269.
Alesina, A., Devleeschauwer, A., Easterly, W., Kurlat, S., Wacziarg, R. 2003. Fraction-alization. Journal of Economic Growth. Volume 8. Issue 2. Pages 155–194. ISSN 1381-4338.https://doi.org/10.1023/a:1024471506938.
Algan, Y., Cahuc, P. 2010. Inherited Trust and Growth. American Economic Review. Volume100. Issue 5. Pages 2060–2092. ISSN 0002-8282. https://doi.org/10.1257/aer.100.5.2060.
Awaworyi Churchill, S. 2017. Fractionalization, Entrepreneurship, and the Institutional Environ-ment for Entrepreneurship. Small Business Economics. Volume 48. Issue 3. Pages 577–597. ISSN0921-898X. https://doi.org/10.1007/s11187-016-9796-8.
Baldwin, R. E., Martin, P. 1999. Two Waves of Globalisation: Superficial Similarities, Funda-mental Differences. Working Paper. http://www.nber.org/papers/w6904.
Barkema, H. G., Vermeulen, F. 1997. What Differences in the Cultural Backgrounds of PartnersAre Detrimental for International Joint Ventures? Journal of International Business Studies.Volume 28. Issue 4. Pages 845–864. ISSN 0047-2506. https://doi.org/10.1057/palgrave.jibs.8490122. http://link.springer.com/10.1057/palgrave.jibs.8490122.
14

Bjørnskov, C. 2006. The Multiple Facets of Social Capital. European Journal of Political Economy.Volume 22. Issue 1. Pages 22–40. ISSN 0176-2680. https://doi.org/10.1016/j.ejpoleco.2005.05.006.
Boeri, T. 2010. Immigration to the Land of Redistribution. Economica. Volume 77. Issue 308.Pages 651–687. ISSN 0013-0427. https://doi.org/10.1111/j.1468-0335.2010.00859.x.
Borjas, G. J. 1999. Immigration and Welfare Magnets. Journal of Labor Economics. Volume 17.Issue 4. Pages 607–637. ISSN 0734-306X. https://doi.org/10.1086/209933.
Bramson, A., Grim, P., Singer, D. J., Berger, W. J., Sack, G., Fisher, S., Flocken, C.,Holman, B. 2017. Understanding Polarization: Meanings, Measures, and Model Evaluation.Philosophy of Science. Volume 84. Issue 1. Pages 115–159. ISSN 0031-8248. https://doi.org/10.1086/688938.
Brooks, R. L. 2012. Cultural Diversity: It’s All About the Mainstream. The Monist. Volume 95.Issue 1. Pages 17–32. ISSN 0026-9662. https://doi.org/10.5840/monist20129513.
Buller, P. F., Bell, C. H. 1986. Effects of Team Building and Goal Setting on Productivity: AField Experiment. Academy of Management Journal. Volume 29. Issue 2. Pages 305–328. ISSN0001-4273. https://doi.org/10.5465/256190.
Chakraborty, S., Thompson, J. C., Yehoue, E. B. 2015. Culture in Development. The WorldBank Economic Review. Volume 29. Issue Supplement 1. Pages S238–S246. ISSN 0258-6770.https://doi.org/10.1093/wber/lhv018.
Cox, T. H., Blake, S. 1991. Managing Cultural Diversity: Implications for Organizational Compet-itiveness. Academy of Management Executive. Volume 5. Issue 3. Pages 45–56. ISSN 1938-9779.https://doi.org/10.5465/ame.1991.4274465.
Dorfman, P. W., Howell, J. P. 1988. Dimension of National Culture and Effective LeadershipPatterns: Hofstede Revisited. In Advances in International Comparative Management. Volume 3.Greenwich. JAI Press. Pages 127–150. ISBN 978-0-89232-501-6. https://books.google.com/books/about/Advances_in_International_Comparative_Ma.html?id=ELDZAAAAMAAJ.
Earley, P. C., Mosakowski, E. 2000. Creating Hybrid Team Cultures: An Empirical Test ofTransnational Team Functioning. Academy of Management Journal. Volume 43. Issue 1. Pages26–49. ISSN 0001-4273. https://doi.org/10.2307/1556384.
Easterly, W. 2001. The Middle Class Consensus and Economic Development. Journal of EconomicGrowth. Volume 6. Issue 4. Pages 317–335. ISSN 1381-4338. https://doi.org/10.1023/a:1012786330095.
Easterly, W., Levine, R. 1997. Africa’s Growth Tragedy: Policies and Ethnic Divisions. TheQuarterly Journal of Economics. Volume 112. Issue 4. Pages 1203–1250. ISSN 0033-5533. https://doi.org/10.1162/003355300555466.
Ely, R. J., Thomas, D. A. 2001. Cultural Diversity at Work: The Effects of Diversity Perspectiveson Work Group Processes and Outcomes. Administrative Science Quarterly. Volume 46. Issue 2.Pages 229–273. ISSN 0001-8392. https://doi.org/10.2307/2667087.
Evan, T., Bolotov, I. 2021. Measuring Mancur Olson: What is the Influence of Culture, Institutionsand Policies on Economic Development? Prague Economic Papers. Volume 30. Issue 3. Pages290–315. ISSN 1210-0455. https://doi.org/10.18267/j.pep.770.
Fearon, J. D., Laitin, D. D. 1996. Explaining Interethnic Cooperation. American Political ScienceReview. Volume 90. Issue 4. Pages 715–735. ISSN 0003-0554. https://doi.org/10.2307/2945838.
15

Fernández, R. 2010. Does Culture Matter? Working Paper. http://www.nber.org/papers/w16277.
Gorodnichenko, Y., Roland, G. 2011. Individualism, Innovation, and Long-Run Growth. Proceed-ings of the National Academy of Sciences of the United States of America. Volume 108. Issue Sup-plement 4. Pages 21316–21319. ISSN 0027-8424. https://doi.org/10.1073/pnas.1101933108.
Grafton, R. Q., Knowles, S., Owen, P. D. 2002. Social Divergence and Productivity: Makinga Connection. In The Review of Economic Performance and Social Progress: Towards a SocialUnderstanding of Productivity. Institute for Research on Public Policy. Pages 203–224. ISBN978-0-88645-198-1. https://books.google.com/books?id=9GyuAAAAIAAJ.
Green, A., Urquhart, M. C. 1976. Factor and Commodity Flows in the International Economy of1870-1914: A Multi-Country View. The Journal of Economic History. Volume 36. Issue 1. Pages217–252. ISSN 0022-0507. https://doi.org/10.1017/S0022050700094651.
Greve, A., Salaff, J. W. 2003. Social Networks and Entrepreneurship. Entrepreneurship: Theoryand Practice. Volume 28. Issue 1. Pages 1–22. ISSN 1042-2587. https://doi.org/10.1111/1540-8520.00029.
Grözinger, G., Langholz-Kaiser, M., Richter, D. 2017. Regional Innovation and Di-versity: Effects of Cultural Diversity, Milieu Affiliation and Qualification Levels on RegionalPatent Outputs. Management Revue. Volume 28. Issue 2. Pages 149–174. ISSN 0935-9915.https://doi.org/10.5771/0935-9915-2017-2-149.
Harvey, S., Kou, C.-Y. 2013. Collective Engagement in Creative Tasks: The Role of Evaluationin the Creative Process in Groups. Administrative Science Quarterly. Volume 58. Issue 3. Pages346–386. ISSN 0001-8392. https://doi.org/10.1177/0001839213498591.
Hofstede, G., Hofstede, G. J., Minkov, M. 2010. Cultures andOrganizations: Software of the Mind. Volume 10. Third Edition.McGraw-Hill. ISBN 978-0-07-177015-6. https://www.mhprofessional.com/9780071664189-usa-cultures-and-organizations-software-of-the-mind-third-edition-group.
Hofstede Insights. 2021. National Culture. Online. https://www.hofstede-insights.com/models/national-culture/.
Holý, V., Evan, T. 2021. The Role of a Nation’s Culture in the Country’s Governance: StochasticFrontier Analysis. Central European Journal of Operations Research. ISSN 1435-246X. https://doi.org/10.1007/s10100-021-00754-5.
House, R. J., Hanges, P. J., Javidan, M., Dorfman, P. W., Gupta, V. 2004.Culture, Leadership, and Organizations: The GLOBE Study of 62 Societies. ThousandOaks. Sage Publications. ISBN 978-0-7619-2401-2. https://us.sagepub.com/en-us/nam/culture-leadership-and-organizations/book226013.
Jones, W. 2007. Personal Information Management. Annual Review of Information Science andTechnology. Volume 41. Issue 1. Pages 453–504. ISSN 0066-4200. https://doi.org/10.1002/aris.2007.1440410117.
Kaufmann, D., Kraay, A., Mastruzzi, M. 2011. The Worldwide Governance Indicators: Method-ology and Analytical Issues. Hague Journal on the Rule of Law. Volume 3. Issue 2. Pages 220–246.ISSN 1876-4045. https://doi.org/10.1017/s1876404511200046.
Khayesi, J. N. O., George, G., Antonakis, J. 2014. Kinship in Entrepreneur Networks: Perfor-mance Effects of Resource Assembly in Africa. Entrepreneurship: Theory and Practice. Volume38. Issue 6. Pages 1323–1342. ISSN 1042-2587. https://doi.org/10.1111/etap.12127.
16

Koenig, T., Wagener, A., Ifo, C. E. S., Aper, W. O. P., Inance, C. A. P. U. F. 2012. Cultureand Tax Structures. Working Paper. https://ssrn.com/abstract=2016072.
Krain, M. 1998. Contemporary Democracies Revisited: Democracy, Political Violence, and EventCount Models. Comparative Political Studies. Volume 31. Issue 2. Pages 139–164. ISSN 0010-4140.https://doi.org/10.1177/0010414098031002001.
Laitin, D., Posner, D. 2001. The Implications of Constructivism for Constructing Ethnic Fraction-alization Indices. Comparative Politics Newsletter. Volume 12. Issue 1. Pages 13–17. https://www.comparativepoliticsnewsletter.org/wp-content/uploads/2021/04/2001_winter.pdf.
Laitin, D. D., Moortgat, J., Robinson, A. L. 2012. Geographic Axes and the Persistenceof Cultural Diversity. Proceedings of the National Academy of Sciences of the United States ofAmerica. Volume 109. Issue 26. Pages 10263–10268. ISSN 0027-8424. https://doi.org/10.1073/pnas.1205338109.
Landes, D. S. 1998. The Wealth and Poverty of Nations: Why Some Are So Rich and Some SoPoor. First Edition. New York. W. W. Norton & Company. ISBN 978-0-393-04017-3. https://wwnorton.com/books/The-Wealth-and-Poverty-of-Nations/.
Langbein, L., Knack, S. 2010. The Worldwide Governance Indicators: Six, One, or None? Journalof Development Studies. Volume 46. Issue 2. Pages 350–370. ISSN 0022-0388. https://doi.org/10.1080/00220380902952399.
Lappi-Seppälä, T., Lehti, M. 2014. Cross-Comparative Perspectives on Global Homicide Trends.Crime and Justice. Volume 43. Issue 1. Pages 135–230. ISSN 0192-3234. https://doi.org/10.1086/677979.
Lian, B., Oneal, J. R. 1997. Cultural Diversity and Economic Development: A Cross-NationalStudy of 98 Countries, 1960-1985. Economic Development and Cultural Change. Volume 46. Issue1. Pages 61–77. ISSN 0013-0079v. https://doi.org/10.1086/452321.
Lloyd, W. F. 1980. W. F. Lloyd on the Checks to Population. Population and Development Review.Volume 6. Issue 3. Pages 473–496. ISSN 0098-7921. https://doi.org/10.2307/1972412.
Luttmer, E. F. P., Singhal, M. 2011. Culture, Context, and the Taste for Redistribution. AmericanEconomic Journal: Economic Policy. Volume 3. Issue 1. Pages 157–179. ISSN 1945-774X.https://doi.org/10.1257/pol.3.1.157.
Maseland, R. 2013. Parasitical Cultures? The Cultural Origins of Institutions and Development.Journal of Economic Growth. Volume 18. Issue 2. Pages 109–136. ISSN 1381-4338. https://doi.org/10.1007/s10887-013-9089-x.
Matei, M.-C., Abrudan, M.-M. 2018. Are National Cultures Changing? Evidence from the WorldValues Survey. Procedia - Social and Behavioral Sciences. Volume 238. Pages 657–664. ISSN1877-0428. https://doi.org/10.1016/j.sbspro.2018.04.047.
McSweeney, B. 2002. Hofstede’s Model of National Cultural Differences and Their Consequences:A Triumph of Faith - A Failure of Analysis. Human Relations. Volume 55. Issue 1. Pages 89–118.ISSN 0018-7267. https://doi.org/10.1177/0018726702551004.
Meierrieks, D., Gries, T. 2013. Causality Between Terrorism and Economic Growth. Journal ofPeace Research. Volume 50. Issue 1. Pages 91–104. ISSN 0022-3433. https://doi.org/10.1177/0022343312445650.
Miguel, E., Satyanath, S., Sergenti, E. 2004. Economic Shocks and Civil Conflict: An Instru-mental Variables Approach. Journal of Political Economy. Volume 112. Issue 4. Pages 725–753.ISSN 0022-3808. https://doi.org/10.1086/421174.
17

Mill, J. S. 1862. Principles of Political Economy. Fifth Edition. London. Parker, Son, and Bourn,West Strand.
Montgomery, J. D. 1991. Social Networks and Labor-Market Outcomes: Toward an EconomicAnalysis. American Economic Review. Volume 81. Issue 5. Pages 1408–1418. ISSN 0002-8282.https://doi.org/10.2307/2006929.
Nettle, D. 2000. Linguistic Fragmentation and the Wealth of Nations: The Fishman-Pool Hy-pothesis Reexamined. Economic Development and Cultural Change. Volume 48. Issue 2. Pages335–348. ISSN 0013-0079. https://doi.org/10.1086/452461.
Nettle, D., Grace, J. B., Choisy, M., Cornell, H. V., Guégan, J.-F., Hochberg, M. E. 2007.Cultural Diversity, Economic Development and Societal Instability. PLoS ONE. Volume 2. Issue9. Pages e929/1–e929/5. ISSN 1932-6203. https://doi.org/10.1371/journal.pone.0000929.
Niebuhr, A. 2010. Migration and Innovation: Does Cultural Diversity Matter for Regional R&DActivity? Papers in Regional Science. Volume 89. Issue 3. Pages 563–585. ISSN 1056-8190.https://doi.org/10.1111/j.1435-5957.2009.00271.x.
North, D. C. 1990. Institutions, Institutional Change and Economic Performance. Cambridge. Cam-bridge University Press. ISBN 978-0-511-80867-8. https://doi.org/10.1017/cbo9780511808678.
North, D. C. 1992. Institutions and Economic Theory. The American Economist. Volume 36. Issue1. Pages 3–6. ISSN 0569-4345. https://doi.org/10.1177/056943459203600101.
North, D. C. 1994. Economic Performance Through Time. American Economic Review. Volume84. Issue 3. Pages 359–368. ISSN 0002-8282. https://doi.org/10.2307/2118057.
North, D. C., Thomas, R. P. 1977. The First Economic Revolution. The Economic History Review.Volume 30. Issue 2. Pages 229–241. ISSN 0013-0117. https://doi.org/10.2307/2595144.
Olson, M. 1996. Distinguished Lecture on Economics in Government: Big Bills Left on the Sidewalk:Why Some Nations are Rich, and Others Poor. Journal of Economic Perspectives. Volume 10. Issue2. Pages 3–24. ISSN 0895-3309. https://doi.org/10.1257/jep.10.2.3.
Østergaard, C. R., Timmermans, B., Kristinsson, K. 2011. Does a Different View CreateSomething New? The Effect of Employee Diversity on Innovation. Research Policy. Volume 40.Issue 3. Pages 500–509. ISSN 0048-7333. https://doi.org/10.1016/j.respol.2010.11.004.
Ottaviano, G. I. P., Peri, G. 2006. The Economic Value of Cultural Diversity: Evidence fromUS Cities. Journal of Economic Geography. Volume 6. Issue 1. Pages 9–44. ISSN 1468-2702.https://doi.org/10.1093/jeg/lbi002.
Outreville, J. F. 2018. Culture and Life Insurance Ownership: Is It an Issue? Journal of InsuranceIssues. Volume 41. Issue 2. Pages 168–192. ISSN 1531-6076. https://www.jstor.org/stable/26505753.
Pelled, L. H., Ledford, G. E., Mohrman, S. A. 1999. Demographic Dissimilarity and WorkplaceInclusion. Journal of Management Studies. Volume 36. Issue 7. Pages 1013–1031. ISSN 0022-2380.https://doi.org/10.1111/1467-6486.00168.
Pool, J. 1972. National Development and Language Diversity. In Advances in the Sociology ofLanguage. Volume 2. The Hague. De Gruyter. Pages 213–230. ISBN 978-90-279-2302-8. https://doi.org/10.1515/9783110880434-011.
Pryor, F. L. 2007. Culture and Economic Systems. American Journal of Economics and Sociology.Volume 66. Issue 4. Pages 817–855. ISSN 0002-9246. https://doi.org/10.1111/j.1536-7150.2007.00541.x.
18

Putnam, R. D. 2007. E Pluribus Unum: Diversity and Community in the Twenty-First Century:The 2006 Johan Skytte Prize Lecture. Scandinavian Political Studies. Volume 30. Issue 2. Pages137–174. ISSN 0080-6757. https://doi.org/10.1111/j.1467-9477.2007.00176.x.
Rejchrt, P., Higgs, M. 2015. When in Rome: How Non-Domestic Companies Listed in the UKMay Not Comply with Accepted Norms and Principles of Good Corporate Governance. Does HomeMarket Culture Explain These Corporate Behaviours and Attitudes to Compliance? Journal ofBusiness Ethics. Volume 129. Issue 1. Pages 131–159. ISSN 0167-4544. https://doi.org/10.1007/s10551-014-2151-6.
Richard, O. C., Barnett, T., Dwyer, S., Chadwick, K. 2004. Cultural Diversity in Management,Firm Performance, and the Moderating Role of Entrepreneurial Orientation Dimensions. Academyof Management Journal. Volume 47. Issue 2. Pages 255–266. ISSN 0001-4273. https://doi.org/10.5465/20159576.
Schwartz, S. H. 1999. A Theory of Cultural Values and Some Implications for Work. AppliedPsychology. Volume 48. Issue 1. Pages 23–47. ISSN 0269-994X. https://doi.org/10.1080/026999499377655.
Stahl, G. K., Maznevski, M. L., Voigt, A., Jonsen, K. 2010. Unraveling the Effects of CulturalDiversity in Teams: A Meta-Analysis of Research on Multicultural Work Groups. Journal ofInternational Business Studies. Volume 41. Issue 4. Pages 690–709. ISSN 0047-2506. https://doi.org/10.1057/jibs.2009.85.
Tang, L., Koveos, P. E. 2008. A Framework to Update Hofstede’s Cultural Value Indices: EconomicDynamics and Institutional Stability. Journal of International Business Studies. Volume 39. Issue6. Pages 1045–1063. ISSN 0047-2506. https://doi.org/10.1057/palgrave.jibs.8400399.
Taras, V., Steel, P., Kirkman, B. L. 2016. Does Country Equate with Culture? Beyond Geographyin the Search for Cultural Boundaries. Management International Review. Volume 56. Issue 4.Pages 455–487. ISSN 0938-8249. https://doi.org/10.1007/s11575-016-0283-x.
Taylor, J. B. 2000. Low Inflation, Pass-Through, and the Pricing Power of Firms. EuropeanEconomic Review. Volume 44. Issue 7. Pages 1389–1408. ISSN 0014-2921. https://doi.org/10.1016/s0014-2921(00)00037-4.
Taylor, M. Z., Wilson, S. 2012. Does Culture Still Matter?: The Effects of Individualism onNational Innovation Rates. Journal of Business Venturing. Volume 27. Issue 2. Pages 234–247.ISSN 0883-9026. https://doi.org/10.1016/j.jbusvent.2010.10.001.
United Nations. 2019. International Migrant Stock 2019. Online. https://www.migrationdataportal.org/themes/international-migrant-stocks.
Vance, C. M., Paik, Y. 2014. Managing a Global Workforce: Challenges and Opportunities inInternational Human Resource Management. Third Edition. New York. Routledge. ISBN 978-1-315-71964-1. https://doi.org/10.4324/9781315719641.
Walker, S., Poe, S. C. 2002. Does Cultural Diversity Affect Countries’ Respect for Human Rights?Human Rights Quarterly. Volume 24. Issue 1. Pages 237–263. ISSN 0275-0392. https://doi.org/10.1353/hrq.2002.0016.
Watson, W. E., Kumar, K., Michaelsen, L. K. 1993. Cultural Diversity’s Impact on Interac-tion Process and Performance: Comparing Homogeneous and Diverse Task Groups. Academyof Management Journal. Volume 36. Issue 3. Pages 590–602. ISSN 0001-4273. https://doi.org/10.5465/256593.
Williams, K. Y., O’Reilly III, C. a. 1998. Demography and Diversity in Organizations: A Reviewof 40 Years of Research. Research in Organizational Behavior. Volume 20. Pages 77–140. ISSN0191-3085. https://www.researchgate.net/publication/234022034.
19

Williams, L. K., McGuire, S. J. 2010. Economic Creativity and Innovation Implementation:The Entrepreneurial Drivers of Growth? Evidence from 63 Countries. Small Business Eco-nomics. Volume 34. Issue 4. Pages 391–412. ISSN 0921-898X. https://doi.org/10.1007/s11187-008-9145-7.
World Bank. 2021. Worldwide Governance Indicators. Online. https://info.worldbank.org/governance/wgi/.
Wu, J., Li, S., Selover, D. D. 2012. Foreign Direct Investment vs. Foreign Portfolio Investment:The Effect of the Governance Environment. Management International Review. Volume 52. Issue5. Pages 643–670. ISSN 0938-8249. https://doi.org/10.1007/s11575-011-0121-0.
Zak, P. J., Knack, S. 2001. Trust and Growth. The Economic Journal. Volume 111. Issue 470.Pages 295–321. ISSN 0013-0133. https://doi.org/10.1111/1468-0297.00609.
Zhan, S., Bendapudi, N., Hong, Y.-Y. 2015. Re-Examining Diversity as a Double-Edged Swordfor Innovation Process. Journal of Organizational Behavior. Volume 36. Issue 7. Pages 1026–1049.ISSN 0894-3796. https://doi.org/10.1002/job.2027.
Zhao, H.-Y., Kwon, J.-W., Yang, O.-S. 2016. Updating Hofstede’s Cultural Model and TrackingChanges in Cultural Indices. Journal of International Trade & Commerce. Volume 12. Issue 5.Pages 85–106. ISSN 1738-8112. https://doi.org/10.16980/jitc.12.5.201610.85.
20