CSHE.5.2021 DOES CONFLICT OF INTEREST DISTORT ...
13
Research & Occasional Paper Series: CSHE.5.2021 DOES CONFLICT OF INTEREST DISTORT GLOBAL UNIVERSITY RANKINGS? April 2021 * Igor Chirikov University of California Berkeley Copyright 2021 Igor Chirikov, all rights reserved. ABSTRACT Global university rankings influence students’ choices and higher education policies throughout the world. When rankers not only evaluate universities but also provide them with consulting, analytics, or advertising services rankers are vulnerable to conflicts of interest that may potentially distort their rankings. The paper assesses the impact of contracting with rankers on university ranking outcomes using difference-in-difference research design. The study matches data on the positions of 28 Russian universities in QS World University Rankings between 2016 and 2021 with information on contracts these universities had for services from QS – a company that produces these rankings. The study estimates the effects of the conflicts of interest with two difference-in-difference models. The first model compares the difference in five-year change in rankings between QS rankings and Times Higher Education (THE) rankings across two groups of universities – those that frequently (five times or more) contracted for QS services, and those that never or seldomly contracted for QS services. The second model compares the difference in five-year change in faculty-student ratios – between scores in QS rankings, THE rankings, and scores recorded by national statistics – across the same two groups of universities. The results suggest universities with frequent QS-related contracts had an increase of 0.75 standard deviations (~140 positions) in QS World University Rankings and an increase of 0.9 standard deviations in reported QS faculty-student ratio scores over five years, regardless of changes in the institutional quality. The study calls for universities, governments, and prospective students to reconsider their use of global rankings where conflicts of interest may be generated by the ranker’s business activities. Keywords: University Rankings, Conflict of Interest, Ranking Entrepreneurship University rankings aspire to maintain a high level of credibility and influence within the higher education sector (Altbach, 2012; Hazelkorn, 2015; Lim, 2018). The credibility of rankings is based on a belief that rankers provide impartial information for prospective students, university administrators, and policy makers. It is implied that all universities are evaluated equitably or at least according to a uniform set of criteria. However, rankers face conflicts of interest when, in addition to objectively evaluating universities’ performance, they offer these universities fee-based analytical, consulting, and advertising services. The conflicts of interest potentially interfere with the objectivity of measures used in rankings and may provide some universities advantages that are not related to their institutional quality. Biased measures could misinform prospective students, universities, governments, and funders about global standings of universities and countries. There is a robust evidence from other sectors of the economy that conflicts of interest distort evaluations. In the financial sector, the business model of issuer-paid credit rating agencies was found to lead to biased evaluations that contributed to the financial crisis of 2008-2009 (Kashyap & Kovrijnykh, 2016). In the environmental monitoring industry, third-party auditors who are chosen and paid by the firms that they audit were found to systematically underreport plant emissions (Duflo et al., 2013). In sports, football coaches participating in the USA Today Coaches Poll distort their rankings to reflect their own team's reputation and financial interests (Kotchen & Potoski, 2011). In the medical sector, incentives or gifts provided to physicians by pharmaceutical companies lead to biases in prescribing and professional behavior (Wazana, 2000). Is the industry of university rankings different? University rankers claim that conflicts of interest do not affect the rankings process and that internal procedures are in place to prevent consulting/advertising services from influencing ranking outcomes (Bailey, 2015; Redden, 2013). Most rankers claim to conduct external audits and establish advisory boards to make sure that their processes are transparent and unbiased. * Igor Chirikov is a Senior Researcher and SERU Consortium Director at the Center for Studies in Higher Education, Goldman School of Public Policy at UC Berkeley. Email: [email protected]. Thanks to Philip Altbach, Zachary Bleemer, George Blumenthal, Jelena Brankovic, Bridget Costello, John Douglass, Miguel Lim, Joshua Lin, Sergey Malinovskiy, Daria Platonova, Jake Soloff, and seminar participants at UC Berkeley and HSE University Moscow for helpful comments and suggestions. All errors that remain are my own.
-
Upload
khangminh22 -
Category
Documents
-
view
0 -
download
0
Transcript of CSHE.5.2021 DOES CONFLICT OF INTEREST DISTORT ...
Research & Occasional Paper Series: CSHE.5.2021
DOES CONFLICT OF INTEREST DISTORT GLOBAL UNIVERSITY RANKINGS?
April 2021*
Igor Chirikov University of California Berkeley
Copyright 2021 Igor Chirikov, all rights reserved.
ABSTRACT Global university rankings influence students’ choices and higher education policies throughout the world. When rankers not only evaluate universities but also provide them with consulting, analytics, or advertising services rankers are vulnerable to conflicts of interest that may potentially distort their rankings. The paper assesses the impact of contracting with rankers on university ranking outcomes using difference-in-difference research design. The study matches data on the positions of 28 Russian universities in QS World University Rankings between 2016 and 2021 with information on contracts these universities had for services from QS – a company that produces these rankings. The study estimates the effects of the conflicts of interest with two difference-in-difference models. The first model compares the difference in five-year change in rankings between QS rankings and Times Higher Education (THE) rankings across two groups of universities – those that frequently (five times or more) contracted for QS services, and those that never or seldomly contracted for QS services. The second model compares the difference in five-year change in faculty-student ratios – between scores in QS rankings, THE rankings, and scores recorded by national statistics – across the same two groups of universities. The results suggest universities with frequent QS-related contracts had an increase of 0.75 standard deviations (~140 positions) in QS World University Rankings and an increase of 0.9 standard deviations in reported QS faculty-student ratio scores over five years, regardless of changes in the institutional quality. The study calls for universities, governments, and prospective students to reconsider their use of global rankings where conflicts of interest may be generated by the ranker’s business activities. Keywords: University Rankings, Conflict of Interest, Ranking Entrepreneurship University rankings aspire to maintain a high level of credibility and influence within the higher education sector (Altbach, 2012;
Hazelkorn, 2015; Lim, 2018). The credibility of rankings is based on a belief that rankers provide impartial information for
prospective students, university administrators, and policy makers. It is implied that all universities are evaluated equitably or
at least according to a uniform set of criteria. However, rankers face conflicts of interest when, in addition to objectively
evaluating universities’ performance, they offer these universities fee-based analytical, consulting, and advertising services.
The conflicts of interest potentially interfere with the objectivity of measures used in rankings and may provide some
universities advantages that are not related to their institutional quality. Biased measures could misinform prospective
students, universities, governments, and funders about global standings of universities and countries.
There is a robust evidence from other sectors of the economy that conflicts of interest distort evaluations. In the financial
sector, the business model of issuer-paid credit rating agencies was found to lead to biased evaluations that contributed to
the financial crisis of 2008-2009 (Kashyap & Kovrijnykh, 2016). In the environmental monitoring industry, third-party auditors
who are chosen and paid by the firms that they audit were found to systematically underreport plant emissions (Duflo et al.,
2013). In sports, football coaches participating in the USA Today Coaches Poll distort their rankings to reflect their own team's
reputation and financial interests (Kotchen & Potoski, 2011). In the medical sector, incentives or gifts provided to physicians
by pharmaceutical companies lead to biases in prescribing and professional behavior (Wazana, 2000). Is the industry of
university rankings different?
University rankers claim that conflicts of interest do not affect the rankings process and that internal procedures are in place
to prevent consulting/advertising services from influencing ranking outcomes (Bailey, 2015; Redden, 2013). Most rankers
claim to conduct external audits and establish advisory boards to make sure that their processes are transparent and unbiased.
*Igor Chirikov is a Senior Researcher and SERU Consortium Director at the Center for Studies in Higher Education, Goldman School of Public Policy at UC Berkeley. Email: [email protected]. Thanks to Philip Altbach, Zachary Bleemer, George Blumenthal, Jelena Brankovic, Bridget Costello, John Douglass, Miguel Lim, Joshua Lin, Sergey Malinovskiy, Daria Platonova, Jake Soloff, and seminar participants at UC Berkeley and HSE University Moscow for helpful comments and suggestions. All errors that remain are my own.
CHIRIKOV: Does Conflict of Interest Distort Global University Rankings? 2
But rankers fail to provide any systematic evidence to the public that university rankings are unaffected by conflicts of interest.
Rankers do not disclose which universities bought advertising, analytics, or consulting services from them and how much they
paid for these services.
The lack of evidence on whether conflicts of interest bias university rankings is a major omission, considering that rankings
influence students’ choices and divert considerable resources (both financial and managerial) from universities and
governments (Sauder & Espeland, 2009). Unlike other sources of biases in global university rankings (see Bowman & Bastedo,
2011; Ioannidis et al., 2007; Marginson, 2014; Selten et al., 2020), the conflicts of interest seemingly built into the university
ranking system have rarely been discussed in the academic literature.
The current study is the first attempt to empirically assess the impact of contracting with rankers on university outcomes in
global university rankings. This study uses unique matched data on the progress of 28 Russian universities in QS World
University Rankings from 2016 to 2021 and contracts these universities had for services from QS between 2013 and 2020.
Russian universities are required by law to publicly report all large procurement contracts at the Russian portal of government
procurements.
QS World University Rankings was chosen for this study over other global rankings for three reasons. First, Quacquarelli
Symonds (QS) offers universities a wider array of services than other rankers. For example, it offers a fee-based rating system,
QS Stars, that evaluates universities and awards them from 0 to 5+ “gold stars”. The stars indicate “quality” of the university
and appear on the website next to the university name, including in the main QS World University Rankings table. Second,
Russian universities had a much larger number of contracts with QS than with any other ranker. Third, QS has been frequently
called out by media outlets and higher education experts for having and not reporting conflicts of interest (Bailey, 2015;
Redden, 2013; Stack, 2016).
Following the literature on conflicts of interest in corporate audits, which suggests that strong relationships between auditors
and firms are more likely to lead to biased reports (Bazerman et al., 2002; Moore et al., 2006), this paper compares QS
rankings outcomes (five-year change in QS rankings and in QS faculty-student ratio scores) in two groups of universities:
those that had frequent (five and more) QS-related contracts and those that never or seldomly contracted for QS services. It
estimates two difference-in-difference models: The first model compares difference in 5-year ranking progress between Times
Higher Education rankings and QS rankings in these two groups of universities. The second model compares difference in 5-
year change in faculty-student ratio scores as reported by universities to the Russian Ministry of Higher Education and
Science/Times Higher Education and in QS rankings in the same two groups of universities. The campus reported student-to-
faculty ratios are a highly weighted (20%) variable in determining a university’s overall QS ranking.
The study finds that frequent contracts for services from QS contribute to a substantial increase in the rankings of universities.
Positions of Russian universities that had frequent QS-related contracts increased on 0.75 standard deviations (approximately
140 positions) more than they would have increased without frequent QS-related contracts. In a similar way, QS faculty-
student ratio scores of Russian universities that had frequent QS-related contracts increased on 0.9 standard deviations more
than they would have increased without frequent QS-related contracts.
Taken together, these findings suggest that conflicts of interest may produce significant distortions in global university
rankings. When rankers evaluate data submitted by universities, they are likely vulnerable to an unconscious self-serving bias
also reported by the studies of the conflict of interest among auditors (Bazerman et al., 2002; Ishaque, 2021; Moore et al.,
2006). Self-serving bias may lead to a more favorable consideration of the data coming from universities that are also frequent
clients as compared to other types of institutions.
The study contributes to the literature on university rankings by suggesting that rankers’ business models and resource
dependencies affect rankings outcomes. It also provides a descriptive account of the range of services provided by rankers
to universities and discusses strategic actions that universities take to influence rankings outcomes. The study calls for
universities, governments, and prospective students to reconsider their use of global rankings where conflicts of interest may
be generated by the ranker’s business activities.
University Rankings and Conflicts of Interest Major global university rankings – QS, Times Higher Education, U.S. News & World Report, and the Academic Ranking of
World Universities (“Shanghai”) rankings – are produced by profit-seeking organizations. Considering that over the years
rankings have become both more diverse and resource-intensive to produce, ranking companies face greater pressures to
generate profits in an increasingly competitive field (Brankovic et al., 2018; Lim, 2018). In the prevailing business model for
this industry, lists of rankings are publicly available and usually “sold” at a loss in order to generate revenue from other business
activities, which generally involve the sale of additional data and services to both the public and to ranked universities (Lim,
2021). For instance, Times Higher Education and U.S. News offer a substantial amount of subscription-based content for the
CHIRIKOV: Does Conflict of Interest Distort Global University Rankings? 3
public, consisting of news and reports on higher education and, in case of U.S. News, additional rankings data and information
about universities for prospective students. Additionally, all four rankers mentioned above offer services to universities that
include advertising, access to additional ranking data and analytics, consulting (typically for branding, quality-improvement,
and reporting strategies), and access to events and workshops. As such, a state of mutual resource dependency exists
between universities, which rely upon favorable rankings to generate tuition and other types of revenues, and rankers, which
depend on the additional revenues generated by selling consulting, premium data, and analytics to universities.
How do resource dependencies of university rankers affect the way rankings are produced? An emerging stream of literature
on “ranking entrepreneurship” – a perspective that focuses on the production side of rankings (Rindova et al., 2018) – suggests
that rankers employ a variety of strategies to promote a sense of constant and intense global competition in higher education
in order to position their analytics, consultancy or advertising services as part of the “solution” that helps universities to be
more competitive (Brankovic et al., 2018; Lim, 2018; Shahjahan et al., 2020; Stack, 2016). For example, rankings are published
on a regular basis every year to create the perception that higher education is a dynamic competitive field (Brankovic et al.,
2018). Rankers further support that perception by framing higher education policy problems in terms of the precarity of global
prestige, and then mobilize the resulting anxiety and fear of low ranking to sell their services and analytical tools to university
administrators (Shahjahan et al., 2020).
However, current academic literature on university rankings rarely discusses a more direct implication of the fact that rankers
depend on resources generated from selling services to ranked universities – namely, potential biases resulting from conflicts
of interest. When firms or individuals both evaluate (or, in this case, rank) other organizations and receive payments from
them it creates a conflict of interest between the objective evaluation and evaluation that is beneficial to the client (Duflo et al.,
2013). In a review of the scholarship on rankings there appears to be only descriptive accounts that conflicts of interest may
undermine the work of university rankers (e.g., Stack, 2016). They do not include empirical evidence to demonstrate the impact
of conflicts of interest on rankings outcomes.
The literature on corporate audit could provide useful guidance for empirical studies of conflicts of interest in university
rankings. Auditors are paid by firms and tasked to independently examine firms’ financial statements, so that external users
(e.g., investors) can make sure that these statements are valid, reliable, and accurate (Bazerman et al., 1997). Findings from
audit industry are relevant because university rankings are considered to be a part of the general “audit culture” in higher
education, where principles and techniques of financial accounting shape university governance (Shore & Wright, 2015). On
a more operational level, the work of university rankers includes an important auditing component: one of their core activities
is to ensure that the data that comes from universities or third-party data providers is accurate and aligns with the established
methodology of the rankings.
There are at least two major takeaways from the literature on the impact of the conflicts of interest on the work of auditors.
First, most studies agree that conflicts of interest distort auditors’ evaluations (Clements et al., 2012; Ishaque, 2021; Moore et
al., 2006; Bazerman et al., 2002). The negative impact of conflicts of interest on the quality of audit reports is pervasive: for
example, the business model of issuer-paid credit ratings agencies (where corporations or governments who seek funds pay
for credit ratings) has been identified as a critical factor that led to inaccurate ratings and eventually the financial crisis of 2008-
2009 (Kashyap & Kovrijnykh, 2016). If a university ranking has a conflict of interest that results in a biased ranking, it may
negatively impact student educational choices, immigration procedures (for countries which rely on rankings in determining
eligibility points for work visas), and even the hiring decisions by universities and other employers.
Second, distortions in corporate audits are mainly rooted in the unconscious self-serving bias and structural aspects of
accounting profession, rather than in corruption and fraud. As Bazerman, Loewenstein and Moore explain in a paper titled,
“Why Good Accountants Do Bad Audits,” (2002) cases of deliberate corruption and unethical behavior exist among auditors,
but these cases do not explain errors in audit at scale. Rather, it is “because of the often subjective nature of accounting and
the tight relationships between accounting firms and their clients, even the most honest and meticulous of auditors can
unintentionally distort the numbers in ways that mask a company’s true financial status” (p. 3). Researchers argue that self-
serving bias – when individual perceptions of a situation are altered by one’s role in that situation – is the main factor behind
distorted audit reports. Self-serving biases thrive in accounting because this type of work is characterized by ambiguity (the
possibility of interpreting information in different ways), attachment (auditors are interested in developing long-term
relationships with clients that allow them to sell additional consulting services) and approval (auditors do not produce their
own accounting but instead merely endorse or reject the client’s accounting) (Bazerman et al., 2002).
In the context of university rankings, ambiguity, attachment, and approval are also important characteristics of a rankers’ work.
Universities worldwide operate in different institutional environments, and establishing equivalency between seemingly
identical categories (e.g., faculty full-time equivalent) leaves ample room for interpretation. As shown by Lim (2018), rankers

CHIRIKOV: Does Conflict of Interest Distort Global University Rankings? 4
also invest substantial resources to establish and maintain relationship with university leaders to strengthen their credibil ity in
the field.
The remainder of the paper first describes the setting of the study and the range of services provided by QS to universities,
and then builds upon insights from the corporate audit literature to analyze the impact of conflicts of interest on the rankings
of Russian universities in QS World University Rankings.
Setting: QS World University Rankings QS was founded in 1990 as a business connecting university admissions offices with prospective international students
(Shahjahan et al., 2020). QS clients included major business schools and universities around the world. In 2004, while
continuing with its core business, QS joined forces with the Times Higher Education (THE) Supplement to publish the QS-
THES global university rankings, for which QS curated data collection for the rankings while THE was responsible for the
structure and commentary of the rankings (Stack, 2016). In 2009, the two companies split up and created their own separate
rankings. QS describes its World University Rankings on its website as “the world’s most popular source of comparative data
about university performance” and reports that its website was viewed 149 million times in 2019 (About QS, 2021).
QS World University Rankings methodology evaluates universities across six domains (QS World University Rankings –
Methodology, 2021): Academic Reputation (40% of the overall score), Employer Reputation (10%), Faculty-Student Ratio
(20%), Citations per faculty (20%), International Faculty Ratio (5%), and International Student Ratio (5%); see detailed
description of each ranking component in Appendix A. In addition to its main product, World University Rankings, QS publishes
ten additional rankings that include those by academic department, region, and graduates’ employability.
QS is a successful “edu-business” that generated €19.8 million (~$22 m) in revenue and €432 thousand (~$480 k) in operating
profit in 2015 and approximately €46 m (~$51.5 m) in revenue in 2019 (Shahjahan et al., 2020). QS provides universities an
array of analytics, consulting, marketing, and advertising services (QS Intelligence Unit | Services, 2021) as well as software
solutions (QS Unisolution | About Us, 2021). Analytics services include access to extended data points about the performance
of university in QS rankings (with an option to benchmark against the competitors), academic reputation tracking, and employer
reputation tracking. Consulting services offer advice on performance improvement of universities and higher education
systems. Market insights services provide direct feedback from prospective students by conducting focus groups in various
regions.
QS Stars is one of the QS’s most controversial products, due to its high potential for creating a conflict of interest. QS Stars is
an assessment product that evaluates the client university across at least eight categories (e.g., teaching, research, and
internationalization). Depending on the number of points achieved in this evaluation, each university is then awarded with a
certain number of “gold stars,” ranging from 0 to 5+. The star result is then displayed at the university profile at QS website
and in the ranking tables. Universities are required to pay for the initial audit as well as an annual fee that allows them to use
QS Stars graphics in their promotional materials.
Although the relative resource dependence of various rankers is difficult to quantify, given the lack of publicly available
disaggregated financial reporting, the structure of QS business activity suggests a greater dependence upon universities
relative to other rankers. Compared to other commercial rankers like Times Higher Education and U.S. News & World Report,
QS does not seem to offer substantial subscription-based content for the general public, so revenues are more heavily derived
from universities and governments. ARWU revenue mainly comes from universities as well but unlike QS, ARWU creates its
rankings using publicly available data and therefore does not rely upon universities to collect or supply ranking data. The
resource dependence of QS, coupled with the ambiguities in rankings methodology, potentially increases its risk of exhibiting
self-serving bias towards client universities.
Data and Methods
Sample and Data Sources
The sample consists of the 28 Russian universities that appear in the 2021 QS World University Rankings (QS World
University Rankings, 2021). Russia was selected as the sampling frame due to the ready availability of data on university
contracts with rankers and additional measures of institutional quality. The data for this study were compiled from multiple
publicly available sources. Global university ranking data and scores for 2016 to 2021, including those for 28 Russian
universities, were collected from QS World University Rankings and THE World University Rankings (THE World University
Rankings, 2021).1 Self-reported institutional data (including the number of students and faculty and university income), which
all Russian universities are required to report, were obtained from the Russian Ministry of Higher Education and Science
(MHES) (Monitoring of Universities’ Effectiveness, 2021). Finally, information about QS-related contracts of Russian
universities from 2013 to June 2020, including the monetary value of each contract, was obtained from the Russian portal of
government procurements (Russian Portal of Government Procurements, 2021).
CHIRIKOV: Does Conflict of Interest Distort Global University Rankings? 5
Contracts were identified as QS-related contracts only if they explicitly mention services provided by QS (advertising, license
fees, consulting, access to ranking databases, and participation in QS-sponsored events). The contracts included spending
for advertising on the QS website www.topuniversities.com, participation/co-sponsorship of events organized by QS, access
to extended analytics, consultancy services, and license fees to participate in QS Stars. This sampling procedure was used
to identify 128 contracts initiated by 38 universities. It is possible, however, that this procedure may undercount the number
of contracts that financially benefit QS, as some universities may have additionally contracted with individual consultants
associated with QS or used private firms or non-profits serving as agents without mentioning QS explicitly in the contract
language. Also, the dataset does not include contracts between QS and the subsidiaries of the Russian Ministry of Higher
Education and Science.
According to 128 QS-related contracts initiated between 2013 and 2020, Russian universities spent $3,871,378 on QS
services during this period. It is challenging to estimate how much of $3,871,378 went directly to QS. Some contracts were
complex and included, for instance, travel and accommodations of participants in addition to registration fees that were
collected by QS. More than 90% of the contracts (116 out of 128) were initiated between 2015 and 2020; the median contract
value was slightly over $12,000. Of the 38 universities contracting for QS services, 28 are represented in the main QS World
University Rankings in 2021, while the remaining 10 universities only participate in other QS rankings, for instance, in BRICS
(Brazil, Russia, India, China and South Africa) rankings, EECA (Emerging Europe & Central Asia) rankings or rankings by
subject.
The analysis is limited to 28 universities that participate in the main QS World University Rankings. In total, 22 of these 28
universities (78%) spent $2,857,880 on QS-related services over the last eight years. Following the literature on conflicts of
interest in corporate audits, which suggests that strong relationships between auditors and firms are more likely to lead to
biased reports, I analyze differences in average five-year change in rankings between two groups: “frequent clients,” meaning
universities that used QS consulting and advertising services on five or more occasions, and “occasional or non-clients,”
meaning universities that used these services four times or fewer.
Key Variables
The study has two outcome variables of interest: (1) change in the position (ranking) of Russian universities in QS World
University Rankings from 2016 to 2021, and (2) change in QS faculty-student ratio score from 2016 to 2021 for the same
universities. As noted in the previous section, faculty-student ratio is a major component of QS World University Rankings that
accounts for 20% of the overall rank. Russian universities report very high faculty-student ratios: there are currently 12 Russian
universities in the world’s top-100 universities in the 2021 QS rankings list sorted by faculty-student ratio scores (and only one
Russian university in the overall top-100). The average score for the faculty-student ratio component for Russian universities
is also higher than their average scores for any other component (e.g., academic reputation or citations per faculty).
Eight universities out of 28 in the sample were not included in the 2016 rankings but were included in 2021 rankings. For five
of those eight universities that were first ranked in 2017-19, I assigned the first available score for that university. For the
remaining three universities that were first ranked after 2019, I imputed the average 2016 scores of universities that had the
same 2021 range of ranks (from the global dataset of 1,003 universities). If university was ranked in a range of institutions
(e.g., 501-550) I assigned the middle rank for such university (525). All student-faculty ratio scores provided by QS were
recorded as numbers and did not include intervals.
Research Design
The research design includes two parts: (1) descriptive analysis of the QS-related contracts and their association with the
ranking progress and (2) difference-in-difference analysis to estimate the impact of QS-related contracts on the progress in
QS World University Rankings.
For the descriptive analysis, I first explore differences in the ranking progress in two groups of universities: QS “frequent
clients” and “occasional or non-clients.” I use nonparametric Mann–Whitney U test to compare if progress ranking scores was
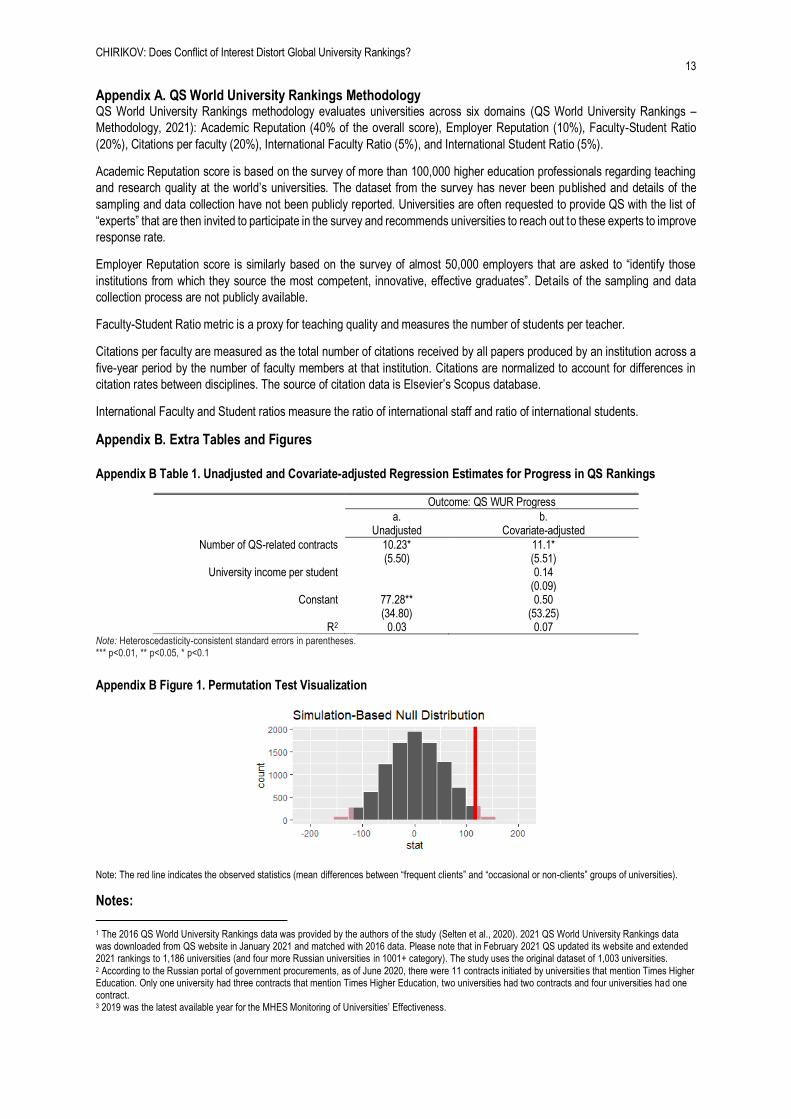
equal in two groups, and a permutation test to examine if the observed differences between two groups were due to chance
(a permutation test was implemented using infer package in R). For the permutation test, I calculated mean differences
between “frequent clients” and “occasional or non-clients” groups of universities. I then contrasted it against a probability
density function generated from mean differences of 10,000 permutations within the same sample. In each permutation the
label of the group was randomly reassigned for each university.
As a robustness check, I also use two unadjusted and covariate-adjusted OLS regression models to determine correlation
between the actual number of QS-related contracts each university had and ranking progress. The adjusted model includes
university income per student as a covariate to account for the differences in resources available to universities.
CHIRIKOV: Does Conflict of Interest Distort Global University Rankings? 6
For the difference-in-difference analysis, I investigate whether the number of QS-related contracts impacts universities’
progress in QS rankings. To do so, I estimate two difference-in-difference models. The first model compares outcome
differences (change in ranks) between QS “frequent clients” and “occasional or non-clients” in both QS World University
Rankings and THE World University Rankings (which was selected for comparison due to the relative infrequency of THE
contracts with Russian universities).2
The first model assumes that THE rankings and QS rankings reflect institutional and reputational changes in a similar way in
their scores. The methodology of THE World University Rankings published by Times Higher Education is similar to QS and
includes 13 indicators measuring teaching excellence, research output, citations, international outlook, and industry income
(Times Higher Education Rankings Methodology, 2021). Five out of six metrics that QS uses to construct its rankings are
shared with THE rankings: academic reputation (THE conducts its own survey), faculty-student ratio, citations per faculty,
international faculty ratio, and international student ratio. Longitudinal analysis of both rankings by Selten et al. (2020) indicates
that top-400 results by QS and THE are highly correlated over the years (Spearman’s correlation coefficient > 0.8). Twenty-
five universities out of 28 participate in both QS and Times Higher Education rankings.
The second model examines changes in faculty-student ratio scores of QS “frequent clients” and “occasional or non-clients,”
by comparing QS rankings for 2016-2021 to both THE rankings from the same time period (specification 2a) and the faculty-
student ratios computed using data reported to the Russian Ministry of Higher Education and Science from 2015 to 2019
(specification 2b).3 The second model assumes that the change in faculty-student ratios is reflected in a similar way in QS
faculty-student ratio scores and in faculty-student ratios reported by universities to THE rankings and the Russian MHES. QS
calculates faculty student ratio score by dividing the number of full-time equivalent (FTE) faculty by the number of full-time
equivalent students (QS Intelligence Unit Faculty Student Ratio, 2021). In the 2021 rankings, QS assigned universities a score
from 2.2 to 100 relative to other universities. THE calculates academic staff-to-student ratio (which I have converted into
academic staff-student ratios) in a similar way, by dividing total FTE number of academic staff by FTE number of students.
Faculty-student ratios based on the MHES data are calculated by dividing the number of full-time and part-time permanent
faculty (regardless of time worked) by the number of FTE students. Although calculation methods are slightly different, these
three metrics should be highly correlated.
The impact of QS-related contracts on changes in university ranking can be estimated by comparing the magnitude of changes
(to overall rankings by THE and QS and to faculty-student ratios indicated by MHES, THE, and QS) in “frequent clients”
universities (treatment group) to that in “occasional or non-clients” universities (control group). As such, changes in both
groups in THE/MHES data is considered as the baseline against which changes in QS are compared. The parallel trends
assumption is justified given that QS/THE rankings (and QS/THE/MHES measures of faculty-student ratios) reflect institutional
change in a similar way (see above). Similar difference-in-difference research design was previously used by Hanushek and
Woessmann (2005) to investigate the effects of school tracking on student achievement across countries.
Both difference-in-difference models are estimated with the following equation:
Yir = Ai + Br + β*Iir + ei (1)
where Yir is a change of university i in rankings/faculty-student ratio r; Ai is a dummy for a control group (“occasional or non-
clients”); Br is a dummy for the type of rankings/faculty-student ratio scores (QS = 1); Iir is a dummy for treatment observations
(“frequent clients”) in QS rankings. The difference-in-difference coefficient β indicates the treatment effect.
Results Universities that had frequent QS-related contracts improved their standings in QS rankings, on average, by 191 rank positions
from 2016 to 2021, while universities that never or seldomly contracted for QS services improved their standings by 74
positions (Table 1 and corresponding Figure 1 (left)). The difference in rankings progress is statistically significant between
two groups (W = 39, p-value = 0.0236). Excluding the three universities with imputed 2016 QS ranking scores (which were
not ranked until 2019), the difference is statistically significant. Such difference in rankings progress between two randomly
created groups of universities is very unlikely to be observed in the sample of Russian universities (permutation test p = 0.035;
95% CI = 6.5 to 227; for permutation test visualization see Appendix B Figure 1).
On average, QS “frequent clients” universities also improved their faculty-student ratio scores by 14 points during the same
period while QS “occasional or non-clients” did not (Table 1 and corresponding Figure 2 (left)). As shown in Table 1, there is
no statistically significant difference between “frequent clients” and “occasional or non-clients” universities in the change in
THE rankings from 2016 to 2021 (also see Figure 1 (right)), the change in THE faculty-student ratios (also see Figure 2
(center)), and the change in MHES faculty-student ratios (also see Figure 2 (right)). “Frequent clients” paid, on average, more
than three times more money under their QS-related contracts than “occasional or non-clients.”

CHIRIKOV: Does Conflict of Interest Distort Global University Rankings? 7
Table 1. Descriptive Statistics by Group: QS Frequent Clients and QS Occasional or Non-Clients
Characteristic QS Frequent Clients QS Occasional or Non-Clients
N Mean St. Dev. N Mean St. Dev.
QS WUR 2016 Rank 9 609.33 173.26 19 582.42 211.49
QS WUR 2021 Rank 9 418.33 143.34 19 508.42 267.52
Δ QS WUR 16-21, Ranks** 9 191.00 99.90 19 74.00 143.56
THE WUR 2016 Rank 8 706.25 222.71 17 757.71 333.37
THE WUR 2021 Rank 8 858.00 376.89 17 860.47 427.82
Δ THE WUR 16-21, Ranks 8 -151.75 260.96 17 -102.76 207.16
QS Faculty-Student Ratio Score 2016 9 70.77 18.41 19 76.87 20.20
QS Faculty-Student Ratio Score 2021 9 85.08 8.96 19 76.67 23.48
Δ QS Faculty-Student Ratio Score 21-16** 9 14.31 13.60 19 -0.20 12.67
MHES Faculty-Student Ratio 2015 9 77.81 13.39 19 94.56 40.31
MHES Faculty-Student Ratio 2019 9 70.14 22.11 19 86.03 37.00
Δ MHES Faculty-Student Ratio 19-15 9 -7.67 17.11 19 -8.53 14.03
THE Faculty-Student Ratio Score 2016 8 116.88 26.83 17 106.53 60.22
THE Faculty-Student Ratio Score 2021 8 107.26 29.18 17 98.90 29.29
Δ THE Faculty-Student Ratio Score 21-16 8 -9.62 27.65 17 -7.63 42.25
University income per student, 2015-19 average, USD 9 6,233.30 3,234.49 19 7,544.78 3,696.77
Average total payments for QS-related contracts, USD*** 9 193,166 59,325 19 58,915 83,774
Average number of QS-related contracts*** 9 8.11 2.47 19 1.11 1.10 Notes: Mann–Whitney U test p-value: *** p<0.01, ** p<0.05, * p<0.1 MHES Faculty-Student Ratio is per 1000 students
Figure 1. Change in QS Rankings (Left) and THE Rankings (Right) 2016-2021, QS Frequent Clients and QS
Occasional or Non-Clients
Note: The solid horizontal line shows the median, the box shows the interquartile range, and the whiskers show the upper and lower bounds (the most
extreme value less than 1.5 times the interquartile range beyond the first or third quartile). The red dot shows the mean.
Figure 2. Change in QS Faculty-Student Ratio Scores, 2016-21 (Left), Change in THE Faculty-Student Ratio Scores,
2016-21 (Center) and Change in Faculty-Student Ratio 2015-19 (MHES Monitoring data; Right)
Note: The solid horizontal line shows the median, the box shows the interquartile range, and the whiskers show the upper and lower bounds (the most
extreme value less than 1.5 times the interquartile range beyond the first or third quartile). The red dot shows the mean.
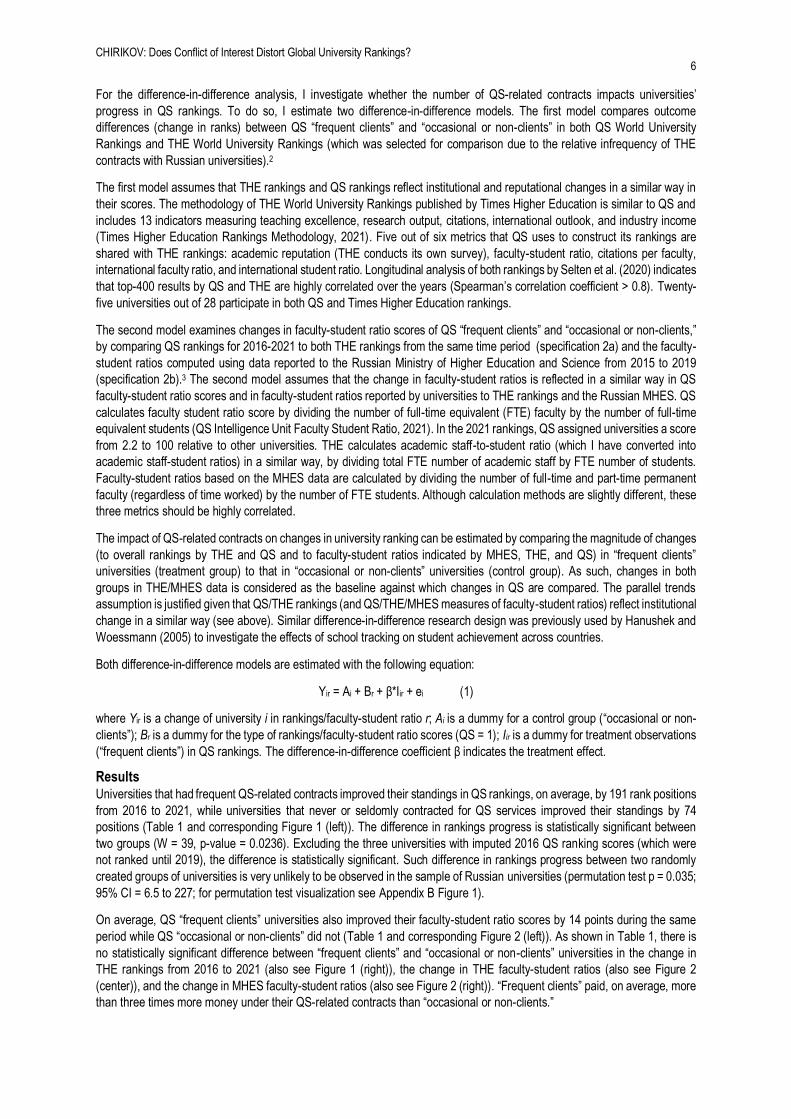
As shown in Figure 3, the number of QS-related contracts is positively correlated with the progress in QS rankings. For
every additional QS-related contract, the progress of Russian universities in QS rankings improves by approximately 10
positions. This association is statistically significant in both unadjusted and covariate-adjusted regression models (Appendix
B Table 1).
CHIRIKOV: Does Conflict of Interest Distort Global University Rankings? 8
Figure 3. The Number of QS-related Contracts and Progress in QS World University Rankings from 2016 to 2021
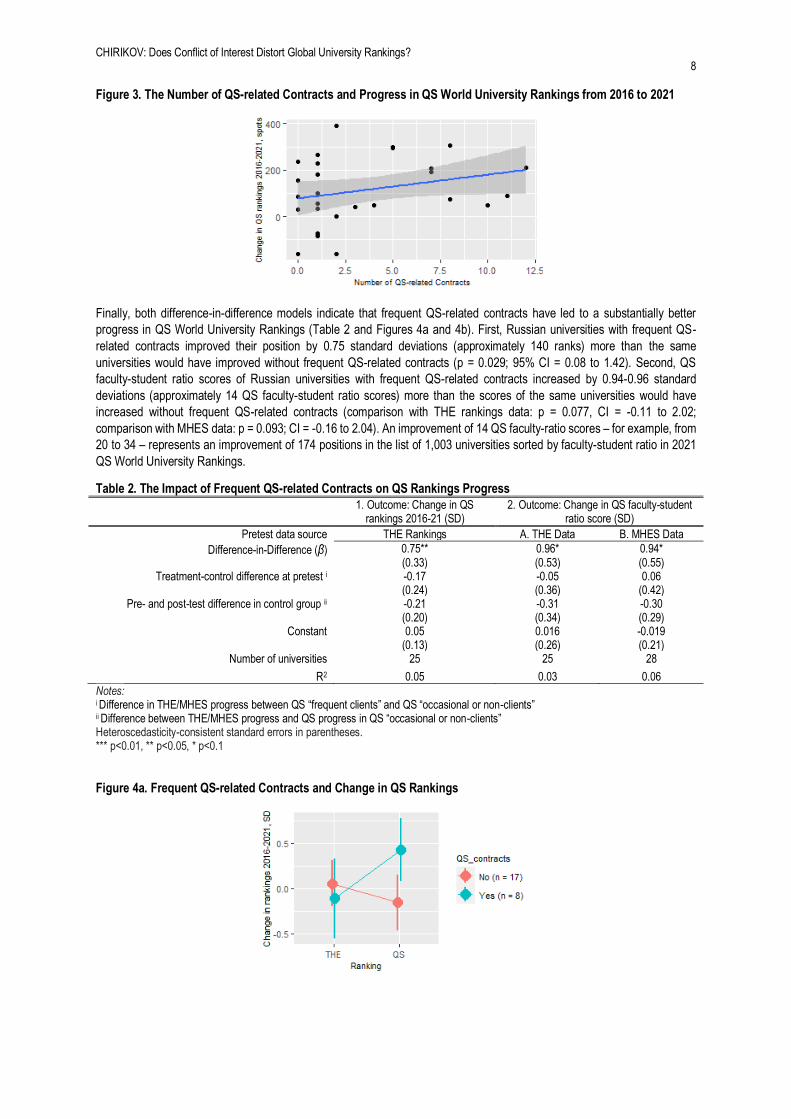
Finally, both difference-in-difference models indicate that frequent QS-related contracts have led to a substantially better
progress in QS World University Rankings (Table 2 and Figures 4a and 4b). First, Russian universities with frequent QS-
related contracts improved their position by 0.75 standard deviations (approximately 140 ranks) more than the same
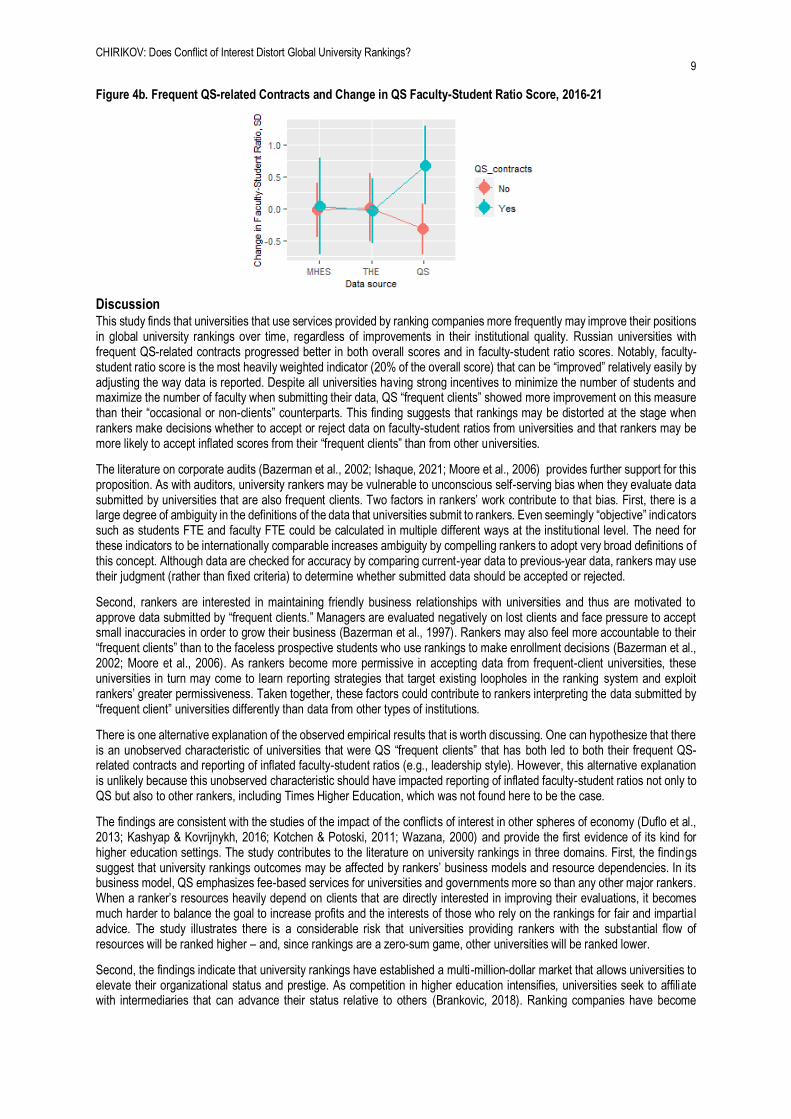
universities would have improved without frequent QS-related contracts (p = 0.029; 95% CI = 0.08 to 1.42). Second, QS
faculty-student ratio scores of Russian universities with frequent QS-related contracts increased by 0.94-0.96 standard
deviations (approximately 14 QS faculty-student ratio scores) more than the scores of the same universities would have
increased without frequent QS-related contracts (comparison with THE rankings data: p = 0.077, CI = -0.11 to 2.02;
comparison with MHES data: p = 0.093; CI = -0.16 to 2.04). An improvement of 14 QS faculty-ratio scores – for example, from
20 to 34 – represents an improvement of 174 positions in the list of 1,003 universities sorted by faculty-student ratio in 2021
QS World University Rankings.
Table 2. The Impact of Frequent QS-related Contracts on QS Rankings Progress
1. Outcome: Change in QS rankings 2016-21 (SD)
2. Outcome: Change in QS faculty-student ratio score (SD)
Pretest data source THE Rankings A. THE Data B. MHES Data
Difference-in-Difference (β) 0.75** (0.33)
0.96* (0.53)
0.94* (0.55)
Treatment-control difference at pretest i -0.17 (0.24)
-0.05 (0.36)
0.06 (0.42)
Pre- and post-test difference in control group ii -0.21 (0.20)
-0.31 (0.34)
-0.30 (0.29)
Constant 0.05 (0.13)
0.016 (0.26)
-0.019 (0.21)
Number of universities 25 25 28
R2 0.05 0.03 0.06
Notes: i Difference in THE/MHES progress between QS “frequent clients” and QS “occasional or non-clients” ii Difference between THE/MHES progress and QS progress in QS “occasional or non-clients” Heteroscedasticity-consistent standard errors in parentheses. *** p<0.01, ** p<0.05, * p<0.1
Figure 4a. Frequent QS-related Contracts and Change in QS Rankings
CHIRIKOV: Does Conflict of Interest Distort Global University Rankings? 9
Figure 4b. Frequent QS-related Contracts and Change in QS Faculty-Student Ratio Score, 2016-21
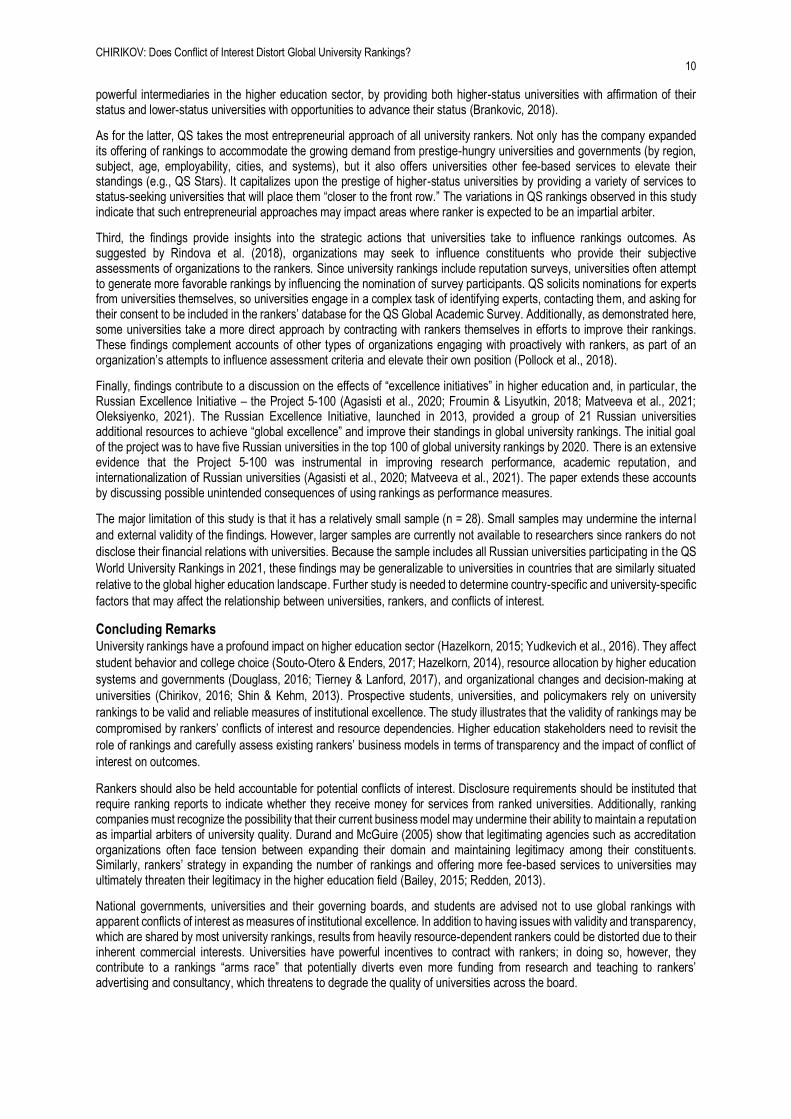
Discussion This study finds that universities that use services provided by ranking companies more frequently may improve their positions in global university rankings over time, regardless of improvements in their institutional quality. Russian universities with frequent QS-related contracts progressed better in both overall scores and in faculty-student ratio scores. Notably, faculty-student ratio score is the most heavily weighted indicator (20% of the overall score) that can be “improved” relatively easily by adjusting the way data is reported. Despite all universities having strong incentives to minimize the number of students and maximize the number of faculty when submitting their data, QS “frequent clients” showed more improvement on this measure than their “occasional or non-clients” counterparts. This finding suggests that rankings may be distorted at the stage when rankers make decisions whether to accept or reject data on faculty-student ratios from universities and that rankers may be more likely to accept inflated scores from their “frequent clients” than from other universities.
The literature on corporate audits (Bazerman et al., 2002; Ishaque, 2021; Moore et al., 2006) provides further support for this proposition. As with auditors, university rankers may be vulnerable to unconscious self-serving bias when they evaluate data submitted by universities that are also frequent clients. Two factors in rankers’ work contribute to that bias. First, there is a large degree of ambiguity in the definitions of the data that universities submit to rankers. Even seemingly “objective” indicators such as students FTE and faculty FTE could be calculated in multiple different ways at the institutional level. The need for these indicators to be internationally comparable increases ambiguity by compelling rankers to adopt very broad definitions of this concept. Although data are checked for accuracy by comparing current-year data to previous-year data, rankers may use their judgment (rather than fixed criteria) to determine whether submitted data should be accepted or rejected.
Second, rankers are interested in maintaining friendly business relationships with universities and thus are motivated to approve data submitted by “frequent clients.” Managers are evaluated negatively on lost clients and face pressure to accept small inaccuracies in order to grow their business (Bazerman et al., 1997). Rankers may also feel more accountable to their “frequent clients” than to the faceless prospective students who use rankings to make enrollment decisions (Bazerman et al., 2002; Moore et al., 2006). As rankers become more permissive in accepting data from frequent-client universities, these universities in turn may come to learn reporting strategies that target existing loopholes in the ranking system and exploit rankers’ greater permissiveness. Taken together, these factors could contribute to rankers interpreting the data submitted by “frequent client” universities differently than data from other types of institutions.
There is one alternative explanation of the observed empirical results that is worth discussing. One can hypothesize that there is an unobserved characteristic of universities that were QS “frequent clients” that has both led to both their frequent QS-related contracts and reporting of inflated faculty-student ratios (e.g., leadership style). However, this alternative explanation is unlikely because this unobserved characteristic should have impacted reporting of inflated faculty-student ratios not only to QS but also to other rankers, including Times Higher Education, which was not found here to be the case.
The findings are consistent with the studies of the impact of the conflicts of interest in other spheres of economy (Duflo et al., 2013; Kashyap & Kovrijnykh, 2016; Kotchen & Potoski, 2011; Wazana, 2000) and provide the first evidence of its kind for higher education settings. The study contributes to the literature on university rankings in three domains. First, the findings suggest that university rankings outcomes may be affected by rankers’ business models and resource dependencies. In its business model, QS emphasizes fee-based services for universities and governments more so than any other major rankers. When a ranker’s resources heavily depend on clients that are directly interested in improving their evaluations, it becomes much harder to balance the goal to increase profits and the interests of those who rely on the rankings for fair and impartial advice. The study illustrates there is a considerable risk that universities providing rankers with the substantial flow of resources will be ranked higher – and, since rankings are a zero-sum game, other universities will be ranked lower.
Second, the findings indicate that university rankings have established a multi-million-dollar market that allows universities to elevate their organizational status and prestige. As competition in higher education intensifies, universities seek to affiliate with intermediaries that can advance their status relative to others (Brankovic, 2018). Ranking companies have become
CHIRIKOV: Does Conflict of Interest Distort Global University Rankings? 10
powerful intermediaries in the higher education sector, by providing both higher-status universities with affirmation of their status and lower-status universities with opportunities to advance their status (Brankovic, 2018).
As for the latter, QS takes the most entrepreneurial approach of all university rankers. Not only has the company expanded its offering of rankings to accommodate the growing demand from prestige-hungry universities and governments (by region, subject, age, employability, cities, and systems), but it also offers universities other fee-based services to elevate their standings (e.g., QS Stars). It capitalizes upon the prestige of higher-status universities by providing a variety of services to status-seeking universities that will place them “closer to the front row.” The variations in QS rankings observed in this study indicate that such entrepreneurial approaches may impact areas where ranker is expected to be an impartial arbiter.
Third, the findings provide insights into the strategic actions that universities take to influence rankings outcomes. As suggested by Rindova et al. (2018), organizations may seek to influence constituents who provide their subjective assessments of organizations to the rankers. Since university rankings include reputation surveys, universities often attempt to generate more favorable rankings by influencing the nomination of survey participants. QS solicits nominations for experts from universities themselves, so universities engage in a complex task of identifying experts, contacting them, and asking for their consent to be included in the rankers’ database for the QS Global Academic Survey. Additionally, as demonstrated here, some universities take a more direct approach by contracting with rankers themselves in efforts to improve their rankings. These findings complement accounts of other types of organizations engaging with proactively with rankers, as part of an organization’s attempts to influence assessment criteria and elevate their own position (Pollock et al., 2018).
Finally, findings contribute to a discussion on the effects of “excellence initiatives” in higher education and, in particular, the Russian Excellence Initiative – the Project 5-100 (Agasisti et al., 2020; Froumin & Lisyutkin, 2018; Matveeva et al., 2021; Oleksiyenko, 2021). The Russian Excellence Initiative, launched in 2013, provided a group of 21 Russian universities additional resources to achieve “global excellence” and improve their standings in global university rankings. The initial goal of the project was to have five Russian universities in the top 100 of global university rankings by 2020. There is an extensive evidence that the Project 5-100 was instrumental in improving research performance, academic reputation, and internationalization of Russian universities (Agasisti et al., 2020; Matveeva et al., 2021). The paper extends these accounts by discussing possible unintended consequences of using rankings as performance measures.
The major limitation of this study is that it has a relatively small sample (n = 28). Small samples may undermine the internal
and external validity of the findings. However, larger samples are currently not available to researchers since rankers do not
disclose their financial relations with universities. Because the sample includes all Russian universities participating in the QS
World University Rankings in 2021, these findings may be generalizable to universities in countries that are similarly situated
relative to the global higher education landscape. Further study is needed to determine country-specific and university-specific
factors that may affect the relationship between universities, rankers, and conflicts of interest.
Concluding Remarks University rankings have a profound impact on higher education sector (Hazelkorn, 2015; Yudkevich et al., 2016). They affect
student behavior and college choice (Souto-Otero & Enders, 2017; Hazelkorn, 2014), resource allocation by higher education
systems and governments (Douglass, 2016; Tierney & Lanford, 2017), and organizational changes and decision-making at
universities (Chirikov, 2016; Shin & Kehm, 2013). Prospective students, universities, and policymakers rely on university
rankings to be valid and reliable measures of institutional excellence. The study illustrates that the validity of rankings may be
compromised by rankers’ conflicts of interest and resource dependencies. Higher education stakeholders need to revisit the
role of rankings and carefully assess existing rankers’ business models in terms of transparency and the impact of conflict of
interest on outcomes.
Rankers should also be held accountable for potential conflicts of interest. Disclosure requirements should be instituted that require ranking reports to indicate whether they receive money for services from ranked universities. Additionally, ranking companies must recognize the possibility that their current business model may undermine their ability to maintain a reputation as impartial arbiters of university quality. Durand and McGuire (2005) show that legitimating agencies such as accreditation organizations often face tension between expanding their domain and maintaining legitimacy among their constituents. Similarly, rankers’ strategy in expanding the number of rankings and offering more fee-based services to universities may ultimately threaten their legitimacy in the higher education field (Bailey, 2015; Redden, 2013).
National governments, universities and their governing boards, and students are advised not to use global rankings with apparent conflicts of interest as measures of institutional excellence. In addition to having issues with validity and transparency, which are shared by most university rankings, results from heavily resource-dependent rankers could be distorted due to their inherent commercial interests. Universities have powerful incentives to contract with rankers; in doing so, however, they contribute to a rankings “arms race” that potentially diverts even more funding from research and teaching to rankers’ advertising and consultancy, which threatens to degrade the quality of universities across the board.
CHIRIKOV: Does Conflict of Interest Distort Global University Rankings? 11
Universities in the top part of such rankings could play a major role in making biased ranking models obsolete. The current
“top” universities contribute to the legitimacy of such rankings in exchange for recognition of their higher status. They celebrate
the results on their websites, participate in rankings events and provide institutional data without seriously questioning the
intentions and processes of rankers. In the long run, both prestigious and the less so are harmed since there are reputational
risks of being associated with rankings distorted by commercial interests. Universities and their associations have sufficient
resources and prestige to put pressures on university rankers to be more transparent with their business models.
Competing interests: The author declares no competing interests. Well, maybe one but it doesn’t really count. Since 2016, every April Fools’ Day
the author publishes his own global rankings “The Fortunate 500 University Rankings”
(https://www.fortunate500universities.com/). Because of their superior accuracy (assigned ranks are purely random),
Fortunate 500 University Rankings may be seen as a competitor to other rankings discussed in the paper. Author states that
he does not receive any financial benefits from publishing of these rankings (in fact, he receives pure losses!).
References About QS. (2021). Top Universities. https://www.topuniversities.com/about-qs Agasisti, T., Shibanova, E., Platonova, D., & Lisyutkin, M. (2020). The Russian Excellence Initiative for higher education: A
nonparametric evaluation of short-term results. International Transactions in Operational Research, 27(4), 1911–1929. https://doi.org/10.1111/itor.12742
Altbach, P. G. (2012). The Globalization of College and University Rankings. Change: The Magazine of Higher Learning, 44(1), 26–31. https://doi.org/10.1080/00091383.2012.636001
Bailey, T. (2015). University rankings: The institutions that are paying to be good. The New Economy. https://www.theneweconomy.com/business/university-rankings-the-institutions-that-are-paying-to-be-good
Bazerman, M., Loewenstein, G., & Moore, D. A. (2002, November 1). Why Good Accountants Do Bad Audits. Harvard Business Review. https://hbr.org/2002/11/why-good-accountants-do-bad-audits
Bazerman, M., Morgan, K., & Loewenstein, G. (1997). The Impossibility of Auditor Independence. MIT Sloan Management Review, 38.
Bowman, N. A., & Bastedo, M. N. (2011). Anchoring effects in world university rankings: Exploring biases in reputation scores. Higher Education, 61(4), 431–444. https://doi.org/10.1007/s10734-010-9339-1
Brankovic, J. (2018). The status games they play: Unpacking the dynamics of organisational status competition in higher education. Higher Education, 75(4), 695–709. https://doi.org/10.1007/s10734-017-0169-2
Brankovic, J., Ringel, L., & Werron, T. (2018). How Rankings Produce Competition: The Case of Global University Rankings. Zeitschrift für Soziologie, 47(4), 270–288. https://doi.org/10.1515/zfsoz-2018-0118
Chirikov, I. (2016). How global competition is changing universities: Three theoretical perspectives. Clements, C. E., Neill, J. D., & Stovall, O. S. (2012). Inherent Conflicts Of Interest In The Accounting Profession. Journal of
Applied Business Research (JABR), 28(2), 269–276. https://doi.org/10.19030/jabr.v28i2.6848 Douglass, J. A. (Ed.). (2016). The New Flagship University: Changing the Paradigm from Global Ranking to National
Relevancy. Palgrave Macmillan US. https://doi.org/10.1057/9781137500496 Duflo, E., Greenstone, M., Pande, R., & Ryan, N. (2013). Truth-telling by Third-party Auditors and the Response of Polluting
Firms: Experimental Evidence from India*. The Quarterly Journal of Economics, 128(4), 1499–1545. https://doi.org/10.1093/qje/qjt024
Durand, R., & McGuire, J. (2005). Legitimating Agencies in the Face of Selection: The Case of AACSB. Organization Studies, 26(2), 165–196. https://doi.org/10.1177/0170840605049465
Froumin, I., & Lisyutkin, M. (2018). State and World-Class Universities: Seeking a Balance between International Competitiveness, Local and National Relevance. World-Class Universities, 243–260. https://doi.org/10.1163/9789004389632_013
Hanushek, E. A., & Woessmann, L. (2005). Does Educational Tracking Affect Performance and Inequality? Differences-in-Differences Evidence across Countries (No. w11124). National Bureau of Economic Research. https://doi.org/10.3386/w11124
Hazelkorn, E. (2014). The Effects of Rankings on Student Choices and Institutional Selection. In B. Jongbloed & H. Vossensteyn (eds)Access and Expansion Post-Massification: Opportunities and Barriers to Further Growth in Higher Education Participation (p. 21).
Hazelkorn, E. (2015). Rankings and the Reshaping of Higher Education: The Battle for World-Class Excellence. Springer. Ioannidis, J. P., Patsopoulos, N. A., Kavvoura, F. K., Tatsioni, A., Evangelou, E., Kouri, I., Contopoulos-Ioannidis, D. G., &
Liberopoulos, G. (2007). International ranking systems for universities and institutions: A critical appraisal. BMC Medicine, 5(1), 30. https://doi.org/10.1186/1741-7015-5-30
Ishaque, M. (2021). Managing Conflict of Interests in Professional Accounting Firms: A Research Synthesis. Journal of Business Ethics, 169(3), 537–555. https://doi.org/10.1007/s10551-019-04284-8
Kashyap, A. K., & Kovrijnykh, N. (2016). Who Should Pay for Credit Ratings and How? The Review of Financial Studies, 29(2), 420–456. https://doi.org/10.1093/rfs/hhv127
CHIRIKOV: Does Conflict of Interest Distort Global University Rankings? 12
Kotchen, M., & Potoski, M. (2011). Conflicts of Interest Distort Public Evaluations: Evidence from the Top 25 Ballots of NCAA Football Coaches (No. w17628). National Bureau of Economic Research. https://doi.org/10.3386/w17628
Lim, M. A. (2018). The building of weak expertise: The work of global university rankers. Higher Education, 75(3), 415–430. https://doi.org/10.1007/s10734-017-0147-8
Lim, M. A. (2021). The Business of University Rankings: The Case of the Times Higher Education. In E. Hazelkorn (ed.) Research Handbook on University Rankings: History, Methodology, Influence and Impact. Edward Elgar Publishers.
Marginson, S. (2014). University Rankings and Social Science. European Journal of Education, 49(1), 45–59. https://doi.org/10.1111/ejed.12061
Matveeva, N., Sterligov, I., & Yudkevich, M. (2021). The effect of Russian University Excellence Initiative on publications and collaboration patterns. Journal of Informetrics, 15(1), 101110. https://doi.org/10.1016/j.joi.2020.101110
Monitoring of universities’ effectiveness. (2021). http://indicators.miccedu.ru/monitoring/ Moore, D. A., Tetlock, P. E., Tanlu, L., & Bazerman, M. H. (2006). Conflicts Of Interest And The Case Of Auditor
Independence: Moral Seduction And Strategic Issue Cycling. Academy of Management Review, 31(1), 10–29. https://doi.org/10.5465/amr.2006.19379621
Oleksiyenko, A. V. (2021). World-class universities and the Soviet legacies of administration: Integrity dilemmas in Russian higher education. Higher Education Quarterly, n/a(n/a). https://doi.org/10.1111/hequ.12306
Pollock, N., D’Adderio, L., Williams, R., & Leforestier, L. (2018). Conforming or transforming? How organizations respond to multiple rankings. Accounting, Organizations and Society, 64, 55–68. https://doi.org/10.1016/j.aos.2017.11.003
QS Intelligence Unit | Faculty Student Ratio. (2021). http://www.iu.qs.com/university-rankings/indicator-faculty-student/ QS Intelligence Unit | Services. (2021). http://www.iu.qs.com/services/ QS Unisolution | About Us. (2021). https://www.qs-unisolution.com/about-us/ QS World University Rankings. (2021). Top Universities. https://www.topuniversities.com/university-rankings/world-
university-rankings/2021 QS World University Rankings – Methodology. (2021). Top Universities. https://www.topuniversities.com/qs-world-university-
rankings/methodology Redden, E. (2013). Scrutiny of QS Rankings. Inside Higher Ed.
https://www.insidehighered.com/news/2013/05/29/methodology-qs-rankings-comes-under-scrutiny Rindova, V. P., Martins, L. L., Srinivas, S. B., & Chandler, D. (2018). The Good, the Bad, and the Ugly of Organizational
Rankings: A Multidisciplinary Review of the Literature and Directions for Future Research. Journal of Management, 44(6), 2175–2208. https://doi.org/10.1177/0149206317741962
Russian portal of government procurements. (2021). https://zakupki.gov.ru/ Sauder, M., & Espeland, W. N. (2009). The Discipline of Rankings: Tight Coupling and Organizational Change. American
Sociological Review, 74(1), 63–82. https://doi.org/10.1177/000312240907400104 Selten, F., Neylon, C., Huang, C.-K., & Groth, P. (2020). A longitudinal analysis of university rankings. Quantitative Science
Studies, 1(3), 1109–1135. https://doi.org/10.1162/qss_a_00052 Shahjahan, R. A., Sonneveldt, E. L., Estera, A. L., & Bae, S. (2020). Emoscapes and commercial university rankers: The
role of affect in global higher education policy. Critical Studies in Education, 1–16. https://doi.org/10.1080/17508487.2020.1748078
Shin, J. C., & Kehm, B. M. (2013). The World-Class University Across Higher Education Systems: Similarities, Differences, and Challenges. In J. C. Shin & B. M. Kehm (Eds.), Institutionalization of World-Class University in Global Competition (pp. 275–286). Springer Netherlands. http://link.springer.com/chapter/10.1007/978-94-007-4975-7_16
Shore, C., & Wright, S. (2015). Audit Culture Revisited: Rankings, Ratings, and the Reassembling of Society. Current Anthropology, 56(3), 421–444. https://doi.org/10.1086/681534
Souto-Otero, M., & Enders, J. (2017). International students’ and employers’ use of rankings: A cross-national analysis. Studies in Higher Education, 42(4), 783–810. https://doi.org/10.1080/03075079.2015.1074672
Stack, M. (2016). Global University Rankings and the Mediatization of Higher Education. Palgrave Macmillan UK. https://doi.org/10.1057/9781137475954
THE World University Rankings. (2021). Times Higher Education (THE). https://www.timeshighereducation.com/world-university-rankings/2021/world-ranking
Tierney, W. G., & Lanford, M. (2017). Between massification and globalisation: Is there a role for global university rankings? Global Rankings and the Geopolitics of Higher Education. Understanding the Influence and Impact of Rankings on Higher Education, Policy and Society.
Times Higher Education Rankings Methodology. (2021). Times Higher Education Rankings Methodology. https://www.timeshighereducation.com/world-university-rankings/world-university-rankings-2021-methodology
Wazana, A. (2000). Physicians and the pharmaceutical industry: Is a gift ever just a gift? JAMA, 283(3), 373–380. https://doi.org/10.1001/jama.283.3.373
Yudkevich, M., Altbach, P. G., & Rumbley, L. E. (2016). The Global Academic Rankings Game: Changing Institutional Policy, Practice, and Academic Life. Routledge.
CHIRIKOV: Does Conflict of Interest Distort Global University Rankings? 13
Appendix A. QS World University Rankings Methodology QS World University Rankings methodology evaluates universities across six domains (QS World University Rankings –
Methodology, 2021): Academic Reputation (40% of the overall score), Employer Reputation (10%), Faculty-Student Ratio
(20%), Citations per faculty (20%), International Faculty Ratio (5%), and International Student Ratio (5%).
Academic Reputation score is based on the survey of more than 100,000 higher education professionals regarding teaching
and research quality at the world’s universities. The dataset from the survey has never been published and details of the
sampling and data collection have not been publicly reported. Universities are often requested to provide QS with the list of
“experts” that are then invited to participate in the survey and recommends universities to reach out to these experts to improve
response rate.
Employer Reputation score is similarly based on the survey of almost 50,000 employers that are asked to “identify those
institutions from which they source the most competent, innovative, effective graduates”. Details of the sampling and data
collection process are not publicly available.
Faculty-Student Ratio metric is a proxy for teaching quality and measures the number of students per teacher.
Citations per faculty are measured as the total number of citations received by all papers produced by an institution across a
five-year period by the number of faculty members at that institution. Citations are normalized to account for differences in
citation rates between disciplines. The source of citation data is Elsevier’s Scopus database.
International Faculty and Student ratios measure the ratio of international staff and ratio of international students.
Appendix B. Extra Tables and Figures
Appendix B Table 1. Unadjusted and Covariate-adjusted Regression Estimates for Progress in QS Rankings
Outcome: QS WUR Progress
a. Unadjusted
b. Covariate-adjusted
Number of QS-related contracts 10.23* (5.50)
11.1* (5.51)
University income per student 0.14 (0.09)
Constant 77.28** (34.80)
0.50 (53.25)
R2 0.03 0.07 Note: Heteroscedasticity-consistent standard errors in parentheses. *** p<0.01, ** p<0.05, * p<0.1
Appendix B Figure 1. Permutation Test Visualization
Note: The red line indicates the observed statistics (mean differences between “frequent clients” and “occasional or non-clients” groups of universities).
Notes:
1 The 2016 QS World University Rankings data was provided by the authors of the study (Selten et al., 2020). 2021 QS World University Rankings data was downloaded from QS website in January 2021 and matched with 2016 data. Please note that in February 2021 QS updated its website and extended 2021 rankings to 1,186 universities (and four more Russian universities in 1001+ category). The study uses the original dataset of 1,003 universities. 2 According to the Russian portal of government procurements, as of June 2020, there were 11 contracts initiated by universities that mention Times Higher Education. Only one university had three contracts that mention Times Higher Education, two universities had two contracts and four universities had one contract. 3 2019 was the latest available year for the MHES Monitoring of Universities’ Effectiveness.