Lunar de cultură * Serie veche nouă* Anul XI, nr. 2 (122 ...
Upload
khangminh22Category
view
0download
0
II
:~,iftkf-t!-j:;~ ~i, -, ' ii": " II' , I ' I
I ' II .
Ii !I
I
I
. . Technical Report 1221 .
MECHANICS OF PENETRATIII~N F . I
" If
PILES INT PERMAFROS~ I
by I
Jacques Charest, Philippe Dull~r and
. John So Rinehart
SEPTEMBER, 1965
I
I I
I
i I'
I
u.s. ARMY MATERIEL COMMAND II
COLD REGIONS RESEARCH & ~NGINEERING l~~BORATORY , HANOVER, NEW HAMPSHIRE I·
Co~orado Sciho@1 of MhuUi Research foundation, Inc.
Contract DA",H",190",IENG .. 92 II .
, . !I , I
I I I
II '
II ,I 11
\
Errata - Technical Report 122
Page 47, para. 2,. line 1
"100°" should read "110°"
Page 58, para. 4, line 2
"normal" should read "nominal"
Technical Report 122 .
MECHANICS OF PENETRATION· OF
PILES INTO PERMAFROST
by
Ja c que s C h ares t, Phi lip p e D u Ie r and
John S. Rinehart
SEPTEMBER, 1965
u.s. ARMY MATERIEL COMMAND COLD REGIONS RESEARCH & ~NGINEERING LABORATORY
HANOVER, NEW HAMPSHIRE
Colorado School of Mines Research Foundation, Inc.
Contract DA-11-190 ... ENG-92
ii
PREFACE
This investigation was carried out for U. S. Army'Snow, Ice and Permafrost Research Establishment>~ by the Colorado School of Mines
- Research Foundation, Inc. under Contract DA-11-190-ENG-92, "Mechanics of penetration of piles into permafrost." The purpose of this investigation was twofold: to study the mechanics of piles penetrating permafrost under the influence of their impact kinetic energies alone and to investigate the feasibility of driving full-size piles into natural permafrost, using a rocket as the driving agent.
The investigation was initiated by W. K. Boyd, then chief of USA SIPRE's Applied Research Branch. The report was prepared for the Applied Research Branch (Dr. A. Assur, then chit:~f), Experimental ~ngineering Division (K. A. Linell, chief).
Dr. J. S. Rinehart was principal investigator of this project. The laboratory work was done at the Mining Research Laboratory, Colorado School of Mines, Golden, Colorado, by J. Charest and P. F. Duler. The field work was conducted near Fairbanks, Alaska, by J. F. Whalen, under the direction of Fre d L. Smith.
Buckling of piles when shot into the ground is one of the problems in practical application. Appendix H, by Sp/4 C. Goetze, USA CRREL, gives a theoretical treatment of this problem.
USA CRREL is an Army Material Command laboratory.
Manuscript received 15 July 1962
>:~Redesignated U. S. Army Cold Regions Research and Engineering Laboratory, Feb 1962.
iii
. CONTENTS
Page Preface ------------------------------------------------ ii Summary - - - - - - - - - - - - -...:;' - - - - - - - - - -.- - - - -- - - - - - - - - - - - - - - - - - vi Introduction--------------------------------------------~ 1 Experimental -----...;.------------------------.,.------------ 1
A rtific ial pe rmafros t - - -- - - - - - - - - - - - - - - ~ - - - - - - - - -.,. ..., - - - - 1 Piles-------------~---------------------~------------ 2
Guns ----~--------~------------~------------~-------- 3 Impact velocity measurement technique -----------....,----- 7 Firing procedure --------------------~---------------- 7
Phase 1---------------------,.;.--------------------------- 7 Impact velocity dependence -.,.------------------------.,.- 8 Mass dependence ------------------------------------- 8 Shape factor dependence- - - - - - - - - - - -- - -.,.:- - - - - - .. - - - - - - - - 12
Theoretical considerations --------------------------.----- 12 Constant force model--------------:--.-----.,.-.,.---------- 17 Variable force model--------------------------....,------- 18 Combined force model-----------------·---------------- 18
Fir s tin v est i g a ti 0 n , ph as e II - - - - .,. - - - - - - - - - - - - .,. - - - - - - - - - ':" - - 1 9 Penetration-time measurement technique--:-:------------- 19 Determination of penetration-time curves --;-----------,--19 Study of penetration-time curves ---------:-------------- 21 Ph Y sic a I mod e 1 - "";v~ -- - - - - - - - - - - - - - - - - - - - - - - - - - - - - - - - - - '- 23 Discussion of the physical.model ---------------------:-- 29
Second in v est i gat ion , phase II - - - - - - - - - - - - - - - - - .., - --' - - - - - - - - 3 4 Piles of the same projected area -----------::------------ 34 Effective projected area-.,.---------------:--------------- 34 Thick piles - - - - - - - - - - - - - - - - - - - - - - - - - - - -.'" - -.- - - -.- - -'- - - - . 35 Thin piles ----,--------------------------------------- 46 Solid circular piles with conicaland' ogival tips --..;--:----- 46 Discussion-----~------~-.------------------.,.-------~-- 47
Fie 1 d t est s - - - - - - .,. - - - .- - - - - - - - - - - ..,. - - - -- .,. - ;.. - - - - - - - - - - -. - - - - 5 5 Expe~imental----------------------------------------- 55
Resuits --------------.,.-------:-~---------------------- 58 Proposal for an integrated pile-rocket ------------------ 60
Conclusions and recommendations.,.-.,.---------------------- 61 Literature cited ---------------------------------.,.------ 61 Appendix A: Data on artific·ialpermafrost -----.,.-.--.,.-----.,.- 63 Appendix B: Characteristics of piles used in laboratory and
field work ----~-:---_------...;.----------.,.-------~-- 64 AppendixC:.Firing data of phase 1----.,.-------------------- .66 Appendix D: Firing data of the: first investigation of phase II - 73 Appendix E:· Firing data of the second investigation 'of phase II 79 Appendix F: Determination of the shape factor Q - - -.- - ... - - -..., - 89 Appendix G: Firing record of Alaskan tests------:..----...,---- 92 Appendix H:Bucklin-g,of piles under deceleration ---~--.;.---- 94
ILLUSTRA TrONS
Figure 1. Aluminum'container assembly ---------------------- 2 2. Pile assenlbly used in laboratory --.,.----------.,.----- 3 3. Pilp-rocket assembly used for field tests ------------ 4
. 4. 50-caliber gun asse,moly -.,.--. .;.----..--..,.---.,.----:-------- 4 5. 50'-caliber gun as a conventional gun-----.,.----------- 5

iv
CONTENTS (Cont1d)
ILLUSTRATIONS (Cont'd)
Figure Page 6. 50-caiiber gun as an air gun-----:-------------------- 5 7. Ii-in. gun as a conventional gun -'"'------------------- 6 8. Breaking-wire system ------------------------------ 6 9. Electrical diagram of the breaking-wire system ------- 7
10. Penetration of a 7/16 in. diam pile vs impact velocity- - 9 11. Penetration of a 1. 0 in. diam pile vs impact velocity-:-- 10 12. Penetration of6/16 in. diam piles vs impact velocity -- 10 13. Penetration of 6/16 in. diam piles vs mass ----------
Reduced penetration of 6/16 in.dlam piles vs impac;:t 14.
15.
16.
17. 18.
19.
20. 21.
22.
23. 24. 25. 26. 27. 28. 29. 30. 31. 32. 33.
34.
35-39. 40-42.
43.
44.
45.
46.
47.
48. 49. 50. 51. 52.
velocity --------------------------------------~-Reduced penetration of 1. 0 in. diam piles vs impact
velocity ----------------------------------------Penetration vs impact velocity, piles with'various
shape factors-~------~----------------------·---Penetration vs shape factor'at 200 ft/sec -------------Reduced penetration vs impact velocity, piles with.,
various shape fa c tor s- - - -- - - - - - - - - - - - - - - - - - - - - - - - . Reduced penetration vs impact velocity, piles with
various masses and shape factors ----------------Principle of the penetration-time measurement technique Electric-aI-diagram of the penetration-time measurement
technique ---------------------------------------Trace of an oscilloscope recor<;l of the penetration-time
measurement technique--------...,-----------------Determination of a penetration - time curve - - - - - - - - - - - -Instantaneous deceleration vs instantaneous penetration Impact deceleration vs impact velocity - - - - - - - - - - - - - - -To ta 1 dec e 1 era t ion - - - - - - - - - - - - - - - - - - - - - - - - - - - - - - - - - - -Frictional deceleration regiori- - - - - - - - - - - - - - - - - - - - - - -Frictional deceleration vs instantanp.ous penetration - - -Friction factor :vs instantaneous velocity --------------Experimental and calculated val ues of penetration - - - - -Penetrationvs impact velocity, piles of different materials Normal pile and wall-reduced pile -- ,---------------Penetration vs impact ve locity, piles v. ith different wall
characteris tic s - - - - - - - - - - - - - - - - - - - - - - - - - - - - - - - - -Reduced penetration ys impact velocity, piles with
various masses --------------------------------Penetration vs impact velocity for various pile shapes -Penetration vs impact velocity, various projected areas Reduced penetration vs impact velocity for thick piles
with the same projected areas ------------------Reduced penetration vs impact velocity for thick piles
with various projected areas----'.----------------Penetration vs impact velocity, 1. 0 in. diam cross
shaped pile ------------------------~----------Penetration vs impact velocity, 7/16 in. diam cros s-
shaped pile ---------~-------------------------Penetration vs projected area, thick piles with same
shape ---------------------------------~--~----Penetration vs projected area, various piles ---------Penetration vs impact velocity, piles with various tips -Penetration ratio vs cos f3 (linear scales )- - - - - - - - - - - - -Penetration ratio vs cos f3 (log-log scales) -----------Penetration vs impact velocity for piles having conical
and ogival tips----------------------------------
1 1
11
13
13 16
16
17 20
21
22 22 25 25 26 28 28 30 30 31 31
32
33 36 41
,44
48
49
49
50 50 51 53 53
54
/' /

CONTENTS (Cont'd)
ILLUSTRA TIONS (Cont'd)
Figure 53. Arrangement of the launching stand-----"-------------54. Reinforcement shoes-------------------------------55. Reduced penetration vs impact velocity, field test
results----------------------------------------56. Integrated pile-rocket assembly---------------------
Table I.
II. III. IV. V.
VI. VII.
VIII. IX. X.
TABLES
Val ue s of A, B, C - - - - - - - - - - - - - - - - - - - - - - - - - - - - - - - - -Values of Pi, v, a, t------------------------------C ale ulated pene tratwns - - - - - - - - - - - - - - - - - - - - - - - - - - - - -Characteristics of thick piles ----------------------Penetration of circular piles at 100 ft/sec -----------Penetration ratios of conical-tipped piles------------Comparison bet",;,veen two relationships for thick piles -Description of drill hole 1---------------.,..---------Description of drill hole 2 -------------------------Analyses of permafrost samples from drill holes 1 and 2
Page 57 58
59 60
23 24 32 45 47 47 48 56 56 57
v
vi
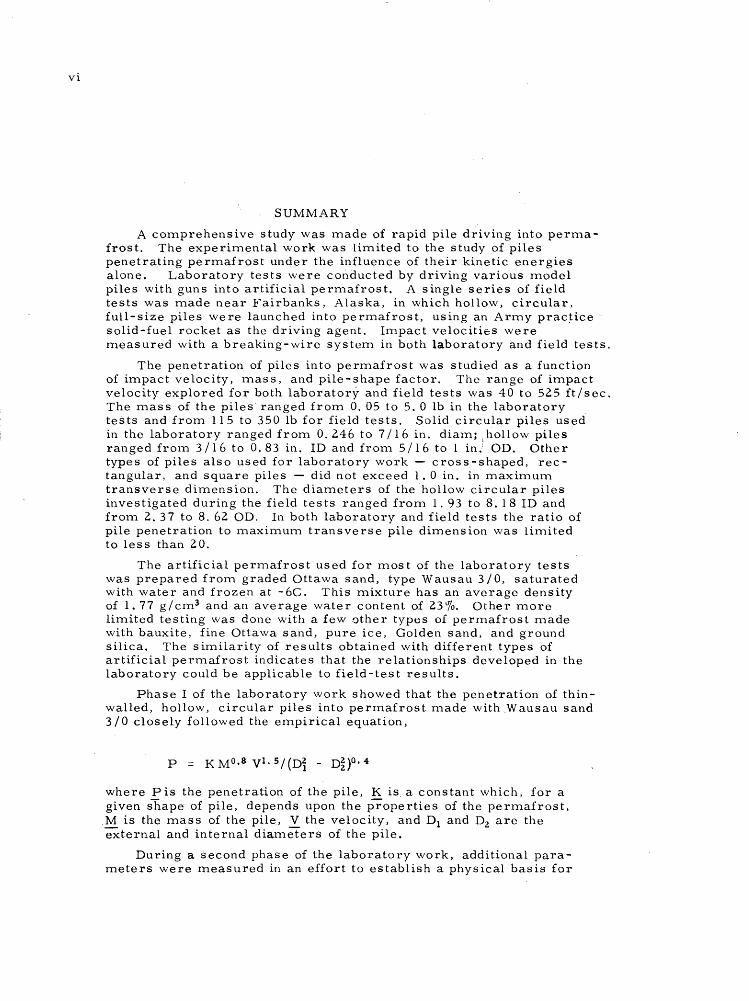
SUMMARY
A comprehensive study was made of rapid pile driving into permafrost. The experimental work was limited to the study of piles penetrating permafrost under the influence of their kinetic energies alone. Laboratory tests were conducted by driving various model piles with guns into artificial permafrost. A single series of field tests was made near Fairbanks, Alaska, in which hollow, circular, full-size piles were launched into permafrost, using an Army prac~ice solid-fuel rocket as the driving agent. Impact velocities were measured with a breaking-wire system in both la.boratory and field tests.
The penetration of piles into permafrost was studied as a function of impact velocity, mass, and pile-shape factor. The range of impact velocity explored for both laboratory and field tests was 40 to 525 ft/sec. The mass of the piles' ranged from 0.05 to 5.0 lb in the laboratory tests and from 115 to 350 lb for field tests. Solid circular piles used in the laboratory ranged from 0.246 to 7/16 in. diam;. hollow piles ranged from 3/16 to 0.83 in. ID and from 5/16 to 1 in.! ODe Other types of piles also used for laboratory work - cross-shaped, rectangular, and square piles - did not exceed 1.0 in. in maximum transverse dimension. The diameters of the hollow circular piles investigated during the field tests ranged from 1.93 to 8.18 ID and from 2.37 to 8. 62 OD. In both laboratory and field tests the ratio of pile penetration to maximum transverse pile dimension was limited to less than 20.
The artificial permafrost used for mos t of the laboratory tests was prepared from graded Ottawa sand, type Wausau 3/0, saturated with water and frozen at -6e. This mixture has an average density of 1. 77 g / cm3 and an average water content of 23 %. Other more limited testing was done with a few other types of permafrost made with bauxite, fine Ottawa sand, pure ice, Golden sand, and ground silica. The similarity of results obtained with different types of artificial permafrost indicates that the relationships developed in the laboratory could be applicable to field-test results.
Phase I of the laboratory work showed that the penetration of thinwalled, hollow, circular piles into permafrost made with .Wausau sand 3/0 closely followed the empirical equation,
P = K MO' S VI. 5/{Dj - D~)O' 4
where P is the penetration of the pile, K is a constant which, for a given shape of pile, depends upon the properties of the permafrost, M is the mass of the pile, V the velocity, and Dl and D2 are the external and internal diameters of the pile.
During a second phase of the laboratory work, additional parameters were measured in an effort to establish a physical basis for

SUMMARY (Cont'd)
eq 1. This phase consisted of two separate investigations: the first. to detennine the displacement of a thin, hollow, circular pile during its penetration, and the second to determine the influence of pile shape on pile penetration.
An optical technique was developed which made it pos sible to measure pile penetration at any instant and obtain penetration-time curves, from which pile velocity and deceleration at any instant of penetration could be calculated ..
A study of penetration-time curves showed that the total force. resisting pile penetration could be resolved into three types: crushing and drag forces acting at the tip of the pile and friction forces acting along the walls of the pile.
The crushing force can be considered the minimum force required to destroy the structure of the permafrost and allow the pile to penetrate. The drag force is the force necessary to displace particles of permafrost, and could also include a possible increase of the crushing force with velocity. .
The friction forces acting along the walls of the pile would be . similar to friction forces common to fluid flow. On the basis of a few assumptions and from the analysis of a series of tests, a differential equation was found to provide a good model of penetration. This differential equation, based on c~:mstant crushing forces, drag forces varying with velocity, and friction forces varying with penetration and velocity can be written,
-kv -d(Mvz/2) = M(C I + Czvz + C 3 P.e ) dP.
1 1
or I -kv
-vdv = (C I + C z yZ + C 3 P.e ) dP. 1 1
where M. is the mass of the pile, ~ its instantaneous velocity,C I a
constant crushing force, C z . vZ a drag force, C 3 ' Pi' e -kv a friction force, Pi the instantaneous penetration, and C I , C z , C 3 and ~ are empirical cons tan ts. . .
vii
When this equation is numerically integrated using the experitnentally obtained values of C I , C z , C 3 , and ~ it closely approximate-s the experimental results within the range of the tests: it closely approximates the 1. 5 velocity power dependence and the 0.8 mass power dependence of the penetration given by the empirical equation: it predicts the penetration, wit/hin the range explored during the experiments, when the mass' of the pile is changed: and it predicts a mass power dependence of penetration close to unity at low penetration, which was observed experimentally.
During the second investigation of phase II, model cross-shaped, I
solid-circular, rectangular. and square piles were tested. The study of flat-tipped piles showed that, for a constant,projected area, the shape of a pile affected its penetration. This observation led to the definition of a parameter, effective pile thickness T J defined as twice the average sum (with respect to the projected area of the pile) of the respective displacements of the individual particles of permafrost. This parameter provided a means of comparing flat-tipped piles of various shapes, using the following equatlons:
viii
SUMMARY (Cont1d)
P K1/{pT)o .. 6 (piT <50, thick piles)
P = K z /{PT)o.4 (pIT>70, thin piles)
where P penetration, p = perimeter of pile cross section, and Kl and Kz are constants, for piles having identical masses and impact velocities. For piles having identical shapes, mass'es, and impact velocities:
where K3 and K4 are defined as above and S is the projected area of the piles. The dependence of the penetratlon as the invex:se of the 0.4 power of the projected area of the piles is in very good agreement with the empirical equation.
For solid, circular, conically tipped piles, the penetration was found to vary as the cube of cos 13 (2f3 = apex angle of the conical tip). The penetration of ogival-tipped piles was found to be 20 to 40% greater than that of conical-tipped piles having the same apex angle.
The empirical equation derived during the first phase of the laboratory work provided a good relationship for reducing field-tes~ results. The M-17-AL Army practice rocket used during the field tests had insufficient thrust to achieve a 6 to 8 ft penetration of natural permafrost with 6. 0 in. diam piles. To achieve that penetration with a 10 ft long pile weighing approximately 400 lb, a rocket must, in view of the Alaskan tests, have 100, OOO-ib thrust and a burning duration of 80 msec.
A design of an integrated pile-rocket assembly having the above characteristics and capabilities was proposed. The estimated cost of this integrated pile-rocket assembly is $1200 per unit in small lots. While this technique of rapid pile driving appears technically feasible, the rocket design must be perfected and fully tested and evaluated in the field.
MECHANICS OF PENETRATION
OF PILES INTO PERMAFROST
by
Jacques Charest, Philippe Duler and John S. Rinehart
INTRODUC TION
As a re sult of recent ITlilitary and re search developITlents in Alaska and Northern Canada, probleITls of building construction have been encountered. The annual freezing and thawing of the ground surface is a serious handicap to the use of conventional construction techniques. However, this difficulty can be overCOITle by driving piles into the perITlanently frozen layer of the ground, the perITlafrost layer, and using theITl as foundation supports.
An unusual pile-driving technique has been proposed for rapid pile driving into perITlafrost. A fast-burning rocket could be fixed to the end of a pile, a steel tube for exaITlple, and launched vertically in the direction of the ground, letting the pile penetrate under the influence of its kinetic energy alone. This technique could be valuable in reITlote areas where conventional pile-driving equipITlent is not available. A literature survey indicated that a study on this subj.ect has never been done before, although ITluch work has been done in connection with the conventional technique of pile driving. This study was approached experiITlentally by conducting laboratory and field tests.
The first part of the laboratory work, Phase I~ consisted of driving hollow circular ITlodel piles with guns into artificial perITlafrost. The ITleasured paraITleters were the penetrations and the iITlpact velocities of piles having various ITlasses and various· external and internal diaITleter s.
The ITlain purpose of Phase II was the ITleasureITlent of paraITleters in order to find a physical ITleaning of the eITlpirical equation developed in Phase I. I t consisted of two investigations. The first investigation was devoted to ITleasuring the instantaneous penetrations of thin (walled), hollow, circular, ITlodel piles as a function of their tiITles of penetration. The experiITlents were conducted with piles having various external .and internal diaITleters but the saITle ITlass. The artificial perITlafrost used was the saITle as the one used during Phase 1. The second investigation consisted of ITleasuring the penetrations and the iITlpact velocities of ITlodel piles having various shapes but the saITle ITlasses.
The field test prograITl consisted of driving thin, hollow, full-size piles into natural perITlafrost using a rocket as the driving agent. The ITleasured parameters were the penetrations and the iITlpact velocities of piles having various ITlasses and various external and internal diaITleters. The purpose of these tests was to collect data and to obtain technical inforITlation necessary for the developITlent of this technique of rapid pile driving.
EXPERIMENTAL
Artificial perITlafrost
The artificial perITlafrost used in the laboratory experiITlents had to be hOITlogeneous and easy to reproduce. To obtain those qualities, a standard ITlethod of preparation was adopted. This ITlethod, which is described below, proved very satisfactory and constant physical properties of the perITlafrost were obtained.
Sands. Graded Ottawa sand, type Wausau 3/0, was used for ITlost of the experiITlental work.· This very fine sand, being ITlostly pure silica, exhibits a great ability to flow and to absorb water when dry. These characteristics of the sand are very iITlportant to avoid trapped air and to obtain hOITlogeneous perITlafrost. Two shipITlents, de signated Sand I and .Sand 2, were used for the laboratory experiITlents. Although Sands I and 2 had practically the saITle screen analysis, the penetrations into Sand 2

l MECHANICS OF PENETRATION OF PILES INTO PERMAFROST
Figure 1. Aluminum container assembly.
permafrost were approximately 15% higher than the penetrations into Sand 1 permafrost. Sand 1 was used for most of Phase I and the first part of Phase II. Sand l was used for most of the second part of Phase II. In addition, a few penetration tests were conducted with permafrost prepared from other materials. The description of all-materials is given in Appendix A. .
Container. It was found during preliminary experiments that a minimum- size permafrost sample had to be used for easy manipulation of the samples and to avoid crack formation. These factors were. considered when choosing the container to be used for preparing the samples. The container used .(Fig. 1) was 'made of aluminum, and arranged so that it could be easily taken apart, permitting rapid removal of samples for water content and specific gravity determina'tion.· The' perforated bottom permitted water absorption during sam.ple preparation.. .
Sample preparation. A layer of porous paper was placed in the bottom of the container, to prevent the dry sarid frOIn. escaping through the perforated bottom; sand was poured in and shaken until n~ appreciable settling was observed. The container was put into. a large pan of water for about 15 hours at room temperature to allow complete saturation of the sand. The saturation was accomplished only by capillary action.- The container of saturated sand was then put into a freezing unit at - 6C for· at least 2 d~ys. Thermocouples in the samples indicated that a uniform temperature was obtained after this period of time.·
Water-contents and .densities of the artificial perm.afrost are given in Table AV. The precision of water-content and density measurements were of the same order of magnitude. Due to the high rate of flow of the artificia1 permafrost, tests to determine its compressive strength were abandoned.
Piles
A penetration 6f 6 to 8 ft into natural' permafrost with full- size piles was desired, and It was believed that hollow circular piles would have good mechanical qualities· for field operations.' The model piles for tllE~'lal?qratory tests were designed to permit easy changes in ~heir physical characteristics and to establish a. scale factor with full-size piles.. Figure 2 shows the·.arrangerrient .of the model pile. It consists . essentially of-three parts: a hollow steel cylinder, an adapter, and a driving head~
Hollow cyllnder ~ .. The hollow cylirid~r 'was made of cold-drawn seamless steel tubing. The cYlinder·was 12 in. long forplle diameters smaller than 7/16 in. ,anti
MECHANICS'OF PENETRATION OF PILES INTO PERMAFROST
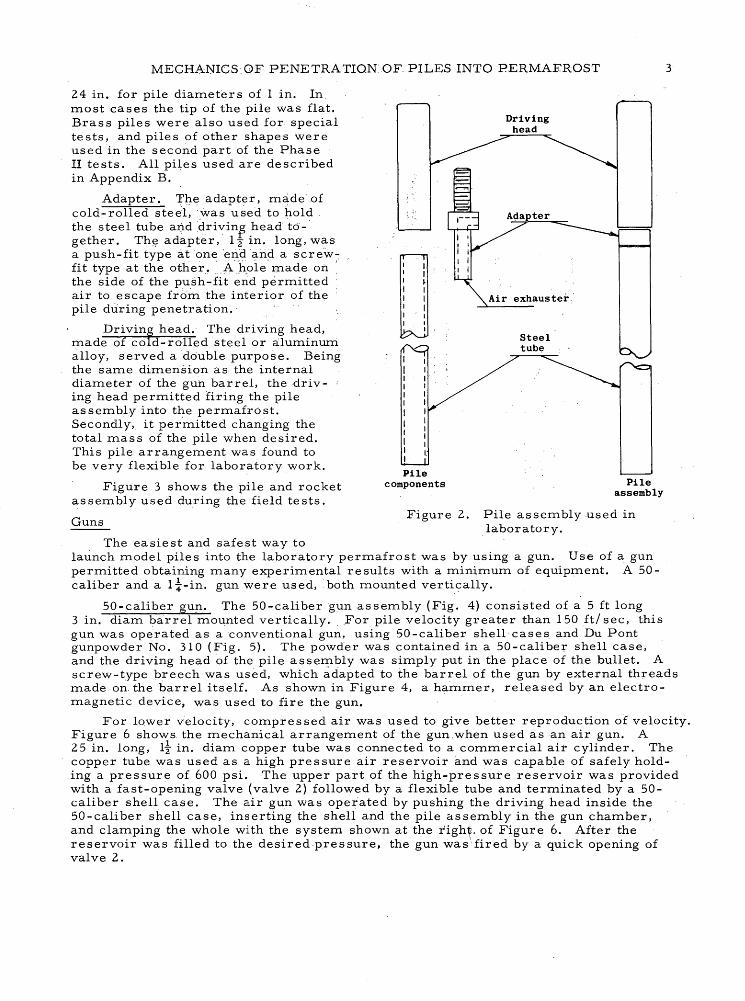
24 in. for pile diameters of 1 in. In most cases the tip of the pile was flat. Brass piles were also used for special tests, and piles of other shapes were used in the second part of the Phase II tests. All piles used are described in Appendix B.
Adapter. T4e adapter, made ,of cold-rolled steel, was used to hold the steel tube aI).d,driVinp head 'together. Th~ adapter, 12" in. long, was a push-fit type atone 'eridarid a screw-: fit type at the other! ',A'}lple' made oil ' the side of the push-fit end permitted air to escape frdrn the interior of the pile during penetration.·
Dri vin~ head. ' The driving head, made of co d-rolled steel or aluminum alloy, served a :ddubie purpose. Being the same dimension as the internal diameter of the gUh barrel, thedriving head permitted firing the pile assembly into the permafrost. Secondly, it permitted changing the total mass of the pile when desired. This pile arrangement was found to be very flexible for laboratory work.
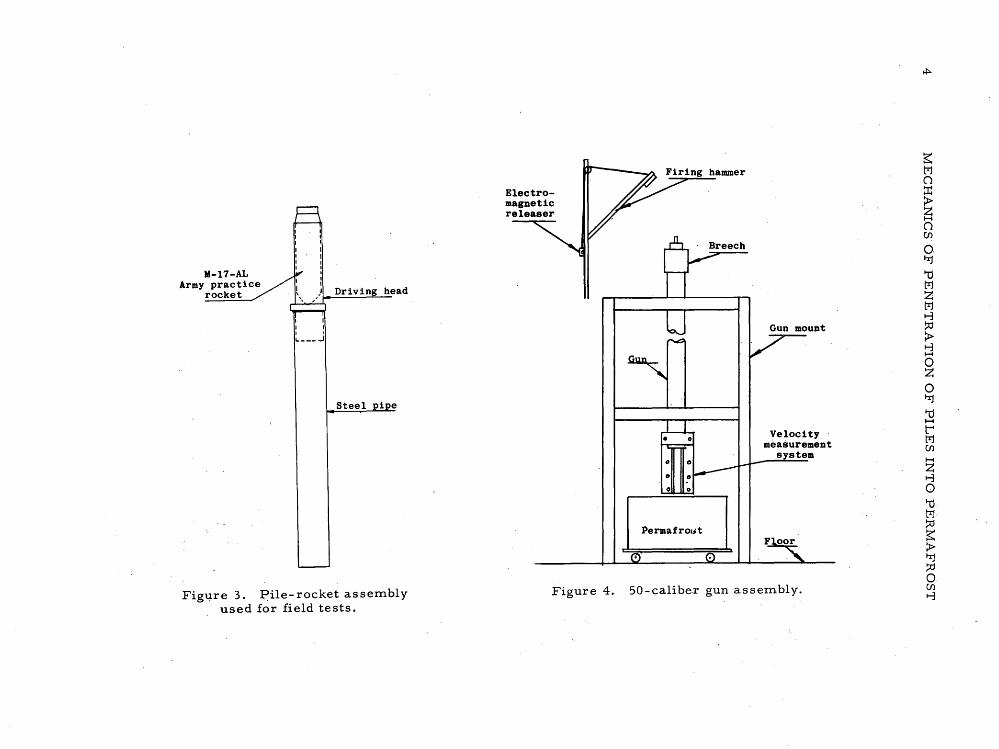
Figure 3 shows the pile and rocket assembly used during the field tests.
Guns
The easiest and safest way to
I I I I I I I I I I I , Pile
components
Figure 2.
Driving head
Pile assembly
Pile assembly used in laboratory.
launch model piles into the laboratory permafrost was by using a gun. Use of a gun permitted obtaining many experimental results with a minimum of equipment. A 50-caliber and a It-in. gun were used, both mounted vertically.
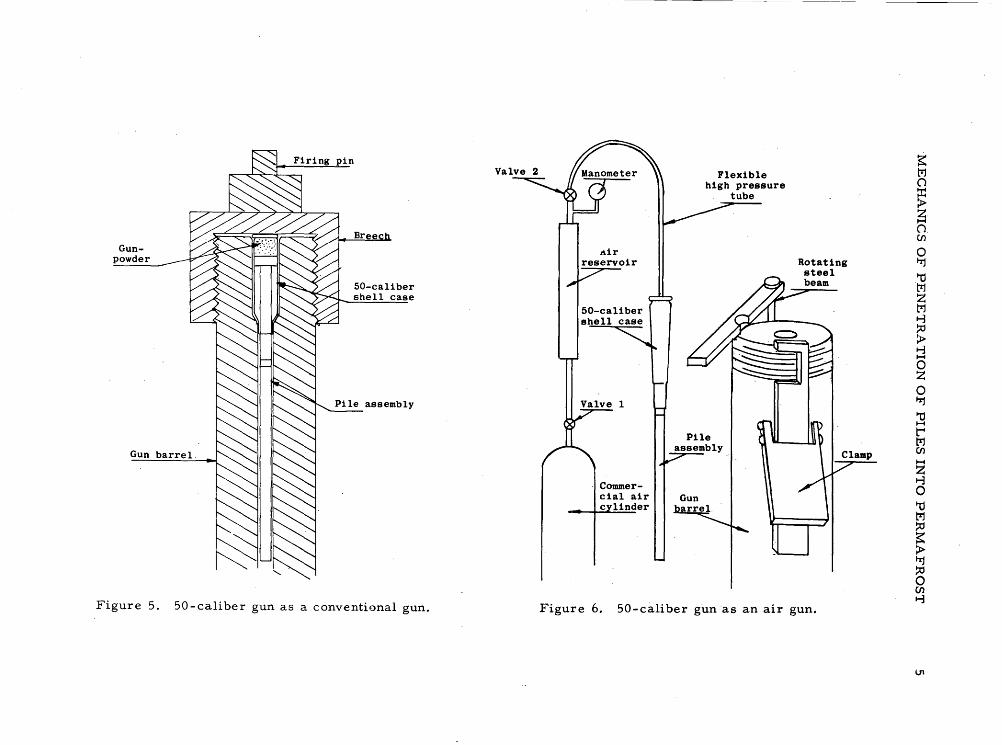
50-caliber gun. The 50-caliber gun assembly (Fig. 4) consisted of a 5 ft long 3 in. diam barrel mounted vertically. For pile velocity greater than 150 ft/ sec, this gun was operated as a conventional gun, using 50-caliber shell cases and Du Pont gunpowder No. 310 (Fig. 5). The powder was contained in a 50-caliber shell case,
3
and the driving head of the pile asse:o:-1;>ly was simply put in the place of the bullet. A screw-type breech was used, which adapted to the barrel of the gun by external threads made on, the barrel itself. As shown in Figure 4, a hammer, released by an electromagnetic device, was used to fire the gun.
For lower velocity, compres sed air was used to give better reproduction of velocity. Figure 6 shows the mechanical arrangement of the gun ,when used as an air gun. A 25 in. long, li in. diam copper tube was connected to a commercial air cylinder. The copper tube was used as a high pressure air reservoir and was capable of safely holding a pressur~ of 600 psi. The upper part of the high-pressure reservoir was provided with a fast-opening valve (valve 2) followed by a flexible tube and terminated by a 50-caliber shell case. The air gun was operated by pushing the driving head inside the 50-caliber shell case, inserting the shell and the pile assembly in the gun chamber, and clamping the whole with the system shown at the right. of Figure 6. After the reservoir was filled to the desired pressure, the gun was\fired by a quick opening of valve 2.
M-l7-AL Army practice
rocket
I I
I ' L. ___ .J
Driving head
Steel i e
Figure 3. ~ile-rocket assembly used for field tests.
Electromagnetic releaser
o 0
PermafrolSt
Gun mount
Velocity measurement
system
Figure 4. 50-calibe.r gun assembly.
Gunpowder
Gun barrel.
50-caliber shell case
Pile assembly
Figure 5. 50-caliber gun as a conventional gun.
Flexible high pressure
tube
Rotating steel beam
Figure 6. 50-caliber gun as an air gun.
Breech
Insert
Cardboard 50-caliber shear shell case disk
. Driving head
Pile
Figure 7. Ii-in. gun as a conventional gun.
Gun muzzle
Electrical
Guides
1st wire
4"
2nd wire
4"
3rd wire
Figure 8. Breaking-wire system.
MECHANICS OF PENETRATION ,OF PILES INTO PERMAFROST
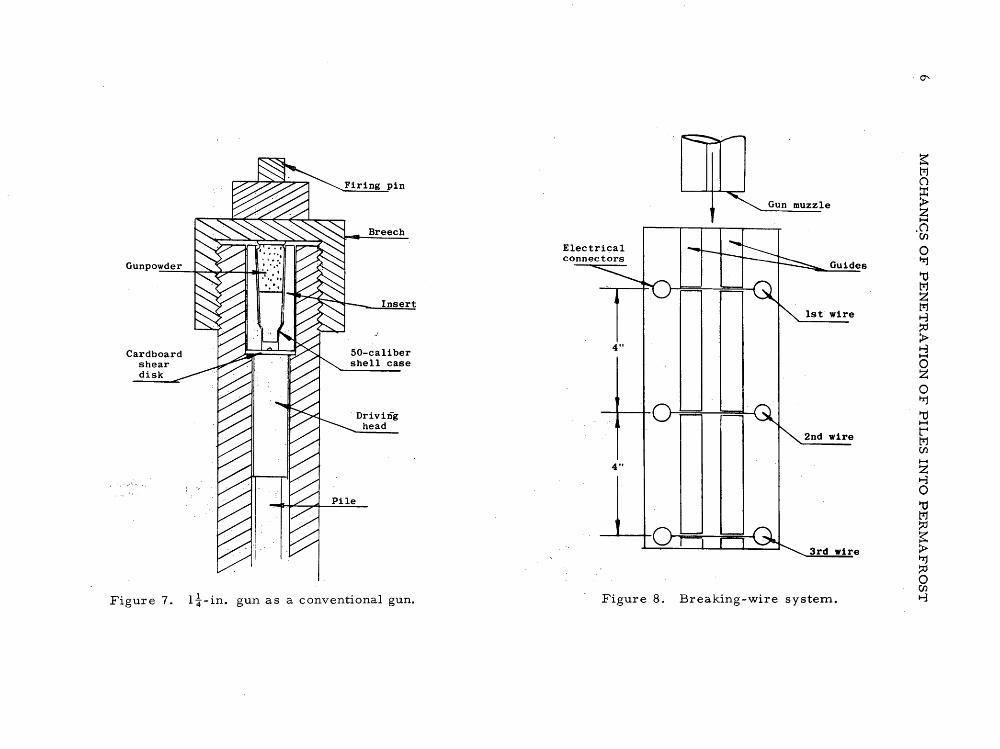
1 1 . 1 ' 4:-1n. gun. The l4-in. gun was used to launch
the 1 in. diam piles. Used as a conventional gun, it was mounted exactly as was the 50-caliber gun. It was designed to permit the use of 50-caliber shell cases which contained the powder charge. Figure 7 shows the adaption of the 50-caliber shell case to the l~-in. gun and the use of a shear, disk to prevent the pile assembly from falling due to gravity.
Impact velocity measurement technique
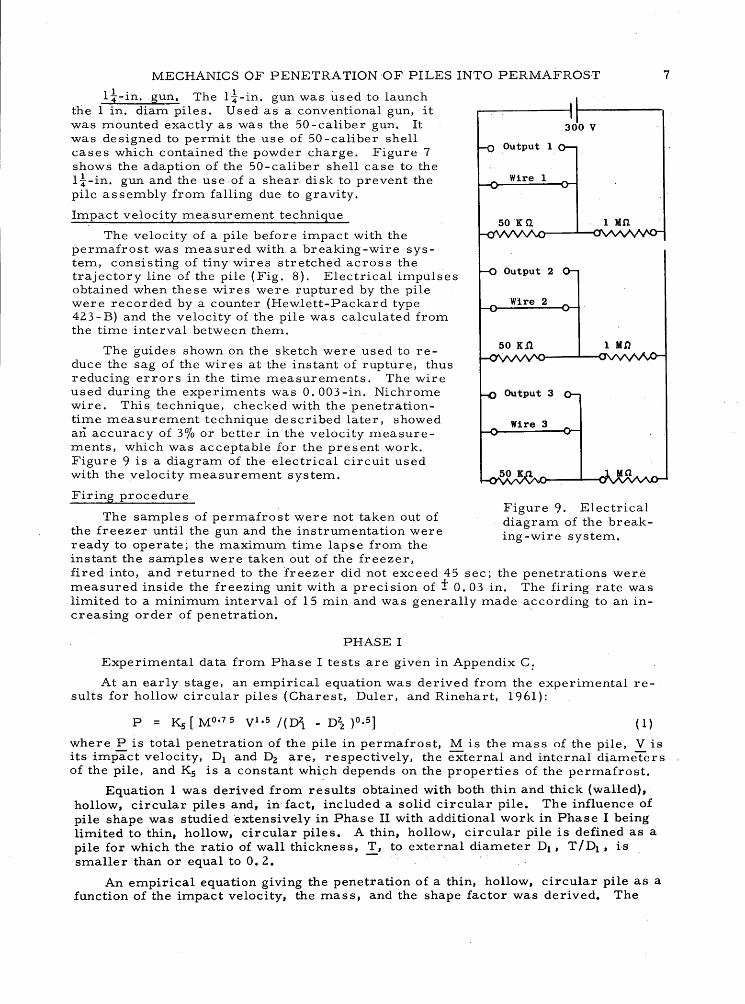
The velocity of a pile before impact with the permafrost was measured with a breaking-wire system, consisting of tiny wires stretched across the trajectory line of the pile (Fig. 8). Electrical impulses obtained when these wires were ruptured by the pile were recorded by a counter (Hewlett-Packard type 423 - B) and the velocity of the pile was calculated from the time interval between them.
The guides shown on the sketch were used to reduce the sag of the wires at the instant of rupture, thus reducing errors in the time measurements. The wire used during the experiments was O. 003 -in. Nichrome wire. This technique, checked with the penetrationtime measurement technique described later, showed an accuracy of 3% or better in the velocity measurements, which was acceptable for the present work. Figure 9 is a diagram of the electrical circuit used with the velocity measurement system.
Firing procedure
The samples of permafrost were not taken out of the freezer until the gun and the instrumentation were ready to operate; the maximum time lapse from the instant the samples were taken out of the freezer,
300 V
Output 1
Wire 1
50Kn 1 M!l
Wire 2
50 K.fl 1 MD
Wire 3
Figure 9. Electrical diagram of the breaking-wire system.
fired into, and returned to the 'freezer did not exceed 45 sec; the penetrations wer.e measured inside the freezing unit with a precision of t 0.03 in. The firing rate was limited to a minimum interval of 15 min and was generally made according to an in-creasing order of penetration.
PHASE I
Experimental data from Phase I tests are given in Appendix C:
At an early stage, an empirical equation was derived from the experimental results for hollow circular piles (Charest, Duler, and Rinehart, 1961):
( I)
7
where P is total penetration of the pile in permafrost, M is the mass of the pile, V is its impact velocity, Dl and Dz are, respectively, the external and internal diameters of the pile, and Ks is a constant which depends on the properties of the permafrost.
Equation 1 was derived from results obtained with both thin and thick (walled), hollow, circular piles and, in fact, included a solid circular pile. The -influence of pile shape was studied extensively in Phase II with additional work in Phase I being limited to thin, hollow, circular piles. A thin, hollow, circular pile is defined as a pile for which the ratio of wall thickness, T, to external diameter D1 , TIDI' is smaller than or equal to O. 2. ' '
An empirical equation giving the penetration of a thin, hollow, circular pile as a function of the impact velocity, the mass, and the shape factor was derived. The
8 MECHANICS OF PENETRATION OF PILES INTO PERMAFROST
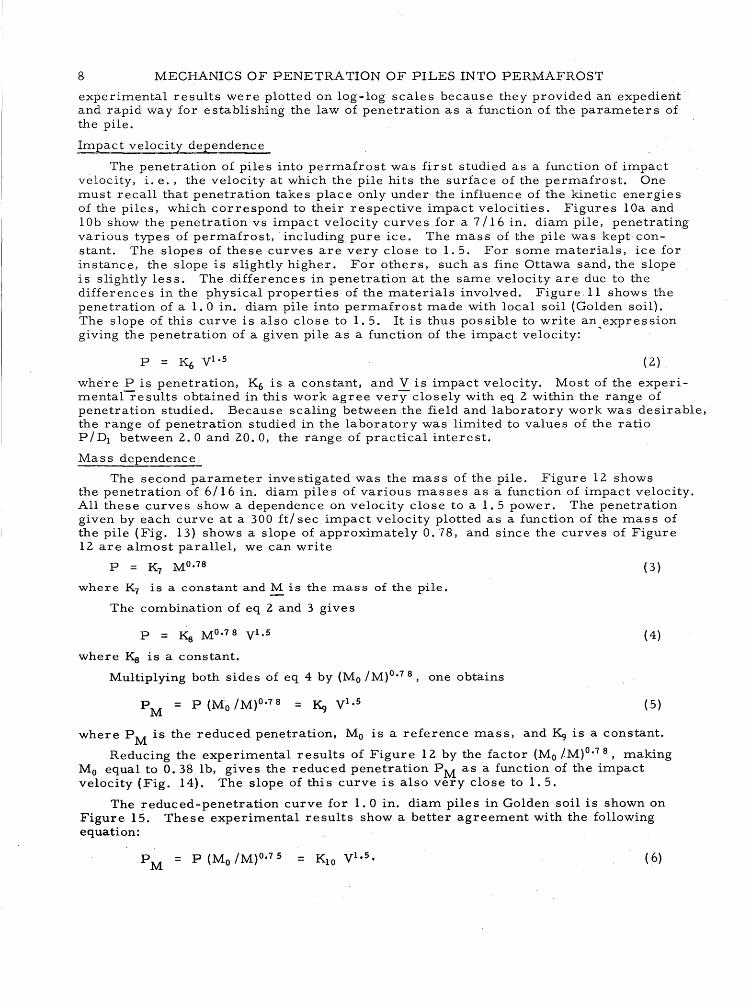
experimental results were plotted on log-log scales because they provided an expedierit and rapid way for establishing the law of penetration as a function of the parameters of the pile.
Impact velocity dependence
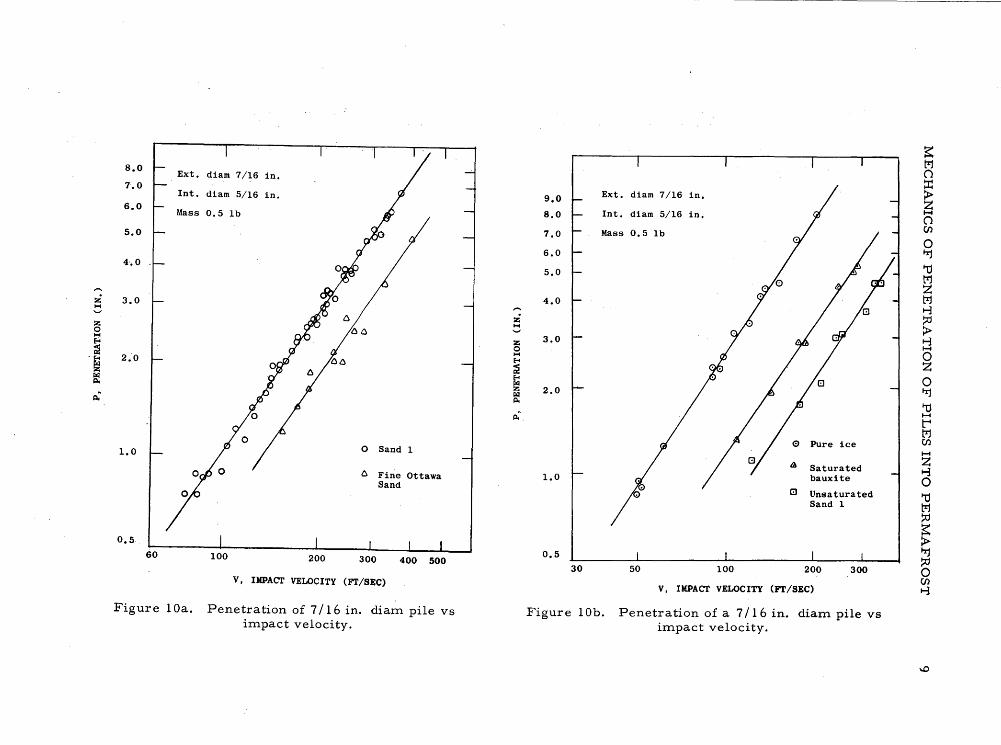
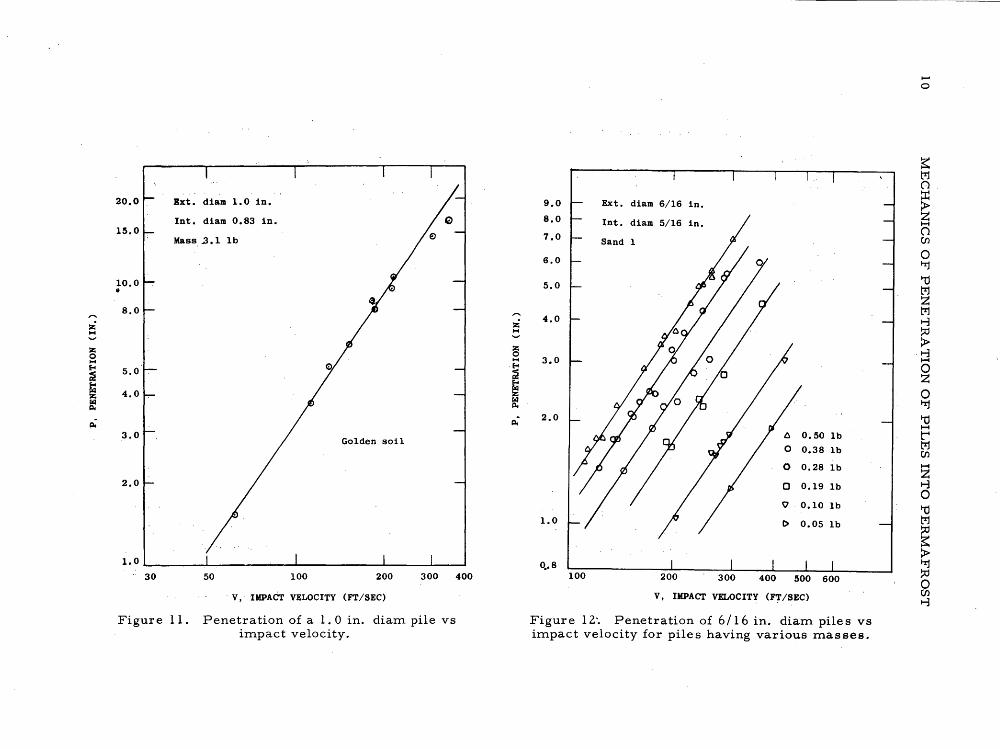
The penetration of piles into permafrost was first studied as a function of impact velocity, i. e., the velocity at which the pile hits the surface of the permafrost. One must recall that penetration takes place only under the influence of the kinetic energies of the piles, which correspond to their respective impact velocities. Figures lOa and lOb show the penetration vs impact velocity curves for a 7 I 16 in. diam pile, penetrating various types of permafrost, . including pure ice. The mass of the pile was kept constant. The slopes of these curves are very close to 1.5. For some materials, ice for instance, the slope is slightly higher. For others, such as fine Ottawa sand, the slope is slightly less. The differences in penetration at the same velocity are due to the differences in the physical properties of the materials involved. Figure .11 shows the penetration of a 1.0 in. diam pile into permafrost made with local soil (Golden soil). The slope of this curve is also close to 1. 5. It is thus possible to write an expression giving the penetration of a given pile as a function of the impact velocity: ~
(2)
where P is penetration, K6 is a constant, and V is impact velocity. Most of the experimentairesults obtained in this work agree very closely with eq 2 within the range of penetration studied. Because scaling between the field and laboratory work was desirable, the range of penetration studied in the laboratory was limited to values of the ratio P/DI between 2.0 and 20.0, the range of practical interest.
Mass dependence
The second parameter inve stigated was the mas s of the pile. Figure 12 shows the penetration of 6/16 in. diam piles of various masses as a function of impact velocity. All these curves show a dependence on velocity close to a 1. 5 power. The penetration given by each curve at a 300 ftl sec impact velocity plotted as a function of the mass of the pile (Fig. 13) shows a slope of approximately 0.78, and since the curves of Figure 12 are almost parallel, we can write
P = K7 MO. 78 (3)
where K7 is a constant and M is the mass of the pile.
The combination of eq 2 and 3 gives
P = Ks MO.7 8 V I •S
where Ks is a constant.
Multiplying both sides of eq 4 by (Mo /M)o.7 8, one obtains
( 4)
(5)
where PM is the reduced penetration, M o is a reference mass, and ~ is a constant.
Reducing the experimental results of Figure 12 by the factor (Mo /M)o.7 8, making M o equal to 0.38 lb, gives the reduced penetration PM as a function of the impact velocity (Fig. 14). The slope of this curve is also very close to 1. 5.
The reduced-penetration curve for 1.0 in. diarn piles in Golden soil is shown on Figure 15. These experirnental results show a better agreement with the following equation:
( 6)
Z I-t '-'
Z 0 I-t Eo<
~ .~
~ p.~
8.0 Ext.
7.0 Int.
6.0 Mass
5.0
4'.0
3.0
2.0
1.0
0.5
60
diam 7/16
diam 5/16
0.5 Ib
100
in.
in.
o Sand 1
Co Fine Ottawa Sand
200 300 400 500
V, IMPACT VELOCITY (FT/SEC)
Figure 10a. Penetration of 7/16 in. diaITl pile vs iITlpact velocity.
Z I-t
9.0 Ext. diam 7/16 in.
8.0 Int. diam 5/16 in.
7.0 Mass 0.5 Ib
6.0
5.0
4.0
3.0
2.0
0 Pure ice
~ Saturated 1.0 bauxite
8 Unsaturated Sand 1
0.5
30 50 100 200 300
V, IMPACT VELOCITY (FT/SEC)
Figure lOb. Penetration of a 7/16 in. diaITl pile vs iITlpact velocity.
:z: M ...., :z; 0 M E-4 ~
~ re ~
20.0 Ext. diam 1.0 in.
Int. diam 0.83 in. 15.0
Mass, .3.1 1b
10.0 • 8.0
5.0
4.0
,3.0 Golden soil
2.0
1.0~ ______ ~ ______ ~~ __ ~ __________ ~ ______ ~ __ __
30 50 100 200 300
. V, IMPACT VELOCITY (FT/SEC)
Figure 11. Penetration of a 1. 0 in. diam pile vs impact velocity.
400
9.0
8.0
7.0
6.0
5.0
4.0
3.0
2.0
1.0
0 •• 8 100
Ext. diam 6/16 in.
0.50 1b
0.38 1b
0.28 1b
0.19 1b
1b
1b
300 400 500 600
V, IMPACT VELOCITY (FT/SEC)
Figure 12'. Penetration of 6/16 in. diam piles vs impact velocity for piles having various masses.
I-'
o

~ M
I 10.0
() ~
9.0 Ext. diam 6/16 in. > 8.0
Z Ext. diam 6/16 in.
I Int. diam 5/16 in. H
()
Int. diam 5/16 7.0 Mo= 0.38 1b (f}
in.
~ 0
8.0 Sand 1 :i 6.0
Sand 1 I7j ... 1:1 7.0 M z 6.0 0 5.0 . Z ... M E-c
:i 5.0 ~ .,
... ~ 4.0 ~ 4.0 > z rf .,
0 ... H E-c 3.0
l ~ 0
~ Co) Z ::J 3.0 ~ ~
(:) 0.50 Ib 0 rf I
0 0.38 1b I7j 2.0 co " rt: to- O 0.28 Ib H
0 t-t il 0 0.19 1b M " 2.0 (f}
~ 'i1 0.10 Ib H
Ii. L'> Z
0.05 1b ., 1.0
0 ~ 1:1
M ~ ~
0.5 > 1.0
I7j ~
0.03 0.05 0.1 0.2 0.3 0.4 0.5 100 200 500 0 IMPACT VELOCITY, (FT/SEq
(f} M, MASS (LB) V, .,
Figure 13. Penetration of 6/16 in. diam piles vs Figure 14. Reduced penetration of 6/16 in. diarn mass at 300 ft/ sec. piles vs impact velocity for piles having various
masses. ......

12 MECHANICS OF PENETRATION OF PILES INTO PERMAFROST
The mass of the pile has been expressed in pound mass to conform to the four-unit engineering system F = Mal gc' where F is lb-force, M is lb-mass, ~ is ftl secz and gc is 32.12 lb-mass x ft/lb-force x secT (See Comings, 1940, for extended discussion).
Shape factor dependence
The shape factor is defined by (Df - D~ ), where Dl is the external diameter and Dz the 'internal diameter of the pile. This shape factor, which is directly proportional to the projected area of the pile. is very significant for studying bodies moving rapidly through'deformable media.
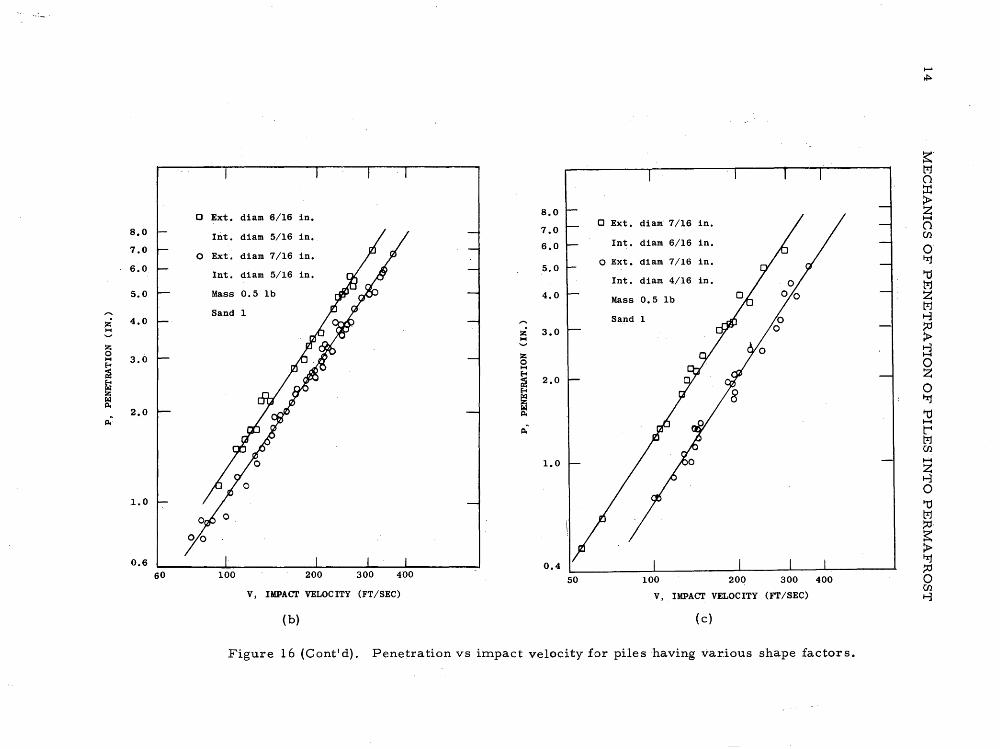
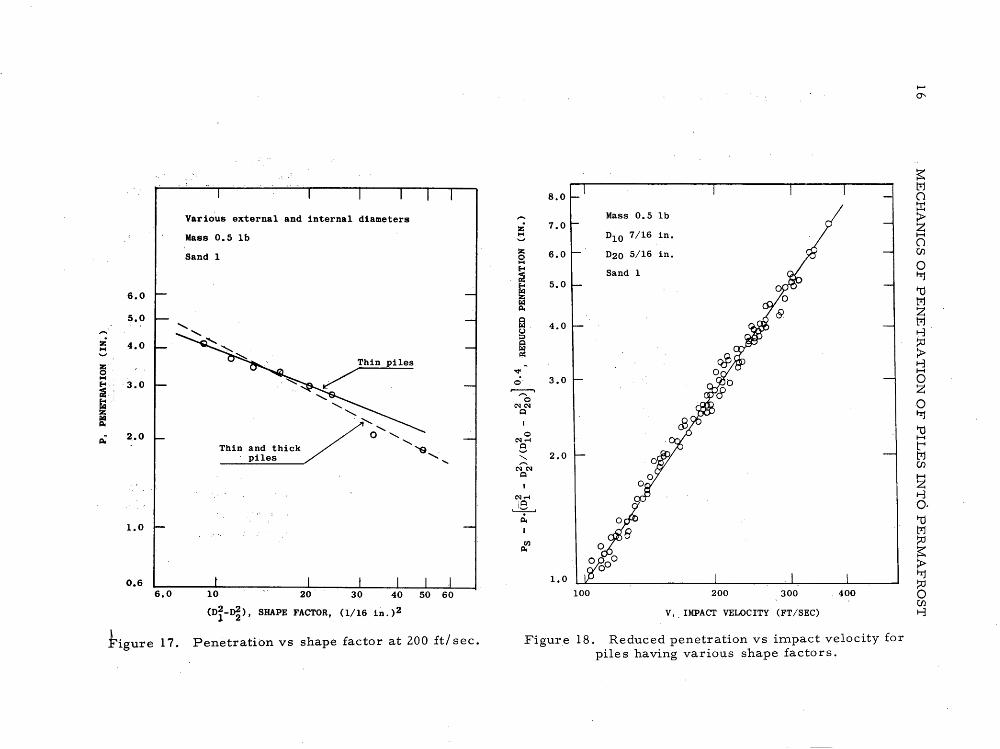
The curves showing the penetration of o. 5-lb piles having different shape factors (Fig.' l6a-e) are in good agreement with the 1. 5-power velocity dependence of penetration. All the curves are shown in Figure l6e, and the penetration at 200 ftl sec is plotted versus the shape factor (Df - D~ ) in Figure 17. The dotted curve of Figure 17, showing an approximate slope of -0.5, represents the average effect of the shape factor 'Considering both thin-walled and thick-walled piles througholJt. This gives the factor (Df -D~ )0.5 appearing in eq 1.
The solid curve represents experimental data obtained with piles for which the ratio T / DI is equal to or smaller than O. 2. The change in mode of dependence on the shape factor from thin to thick pile s is discussed later. The slope of the solid curve of Figure 17 being approximately -0.4, one may write:
P = Ku (Df - D~ ) - o. 4 • ( 7)
The curves of Figure l6e being parallel, one may write
P = K12 [VI •S I(Dy - D~ ) 0.4]. (8)
Multip1ying both sides of eq 8 by [(DI - D~ )/(Dyo - D~o )]0.4 one obtains
(9)
where Ps is the reduced penetration, (DIo - ~o) is a reference shape factor, and K13 is a constant. '
Figure 18 shows the reduced penetration as a function of impact velocity, using the 7 116 OD, 5/16 ID pile for the reference'shape factor, (DIo - D~ 0) = 24. The slope of this curve is close to 1.5.
Letting Mo = 0.5 lb and (DIo - D~ 0) = 24, the experimental data used in this chapter are represented with reasonable scatter by the following equation:
(10)
where P~~ is the reduced penetration and K14 is a constant. Figure 19 gives the curve of the experimental data reduced by eq 10. The data for thick-walled piles, lower curves of Figures 16c and 16d, are not used in Figure 19. The curve through the experimental points is almost the same as the curve for the reference pile (upper part of Fig. lOa). 'Thus
( 11 )
represents a possible empirical equation giving the penetration of thin, hollow, circular piles into artificial permafrost, under the present experimental conditions.
THEORETICAL CONSIDERATIONS
It is the purpose of this section to establish a sound and reasonable physical basis for empirically derive9 equations 1 and 11. They may have a physical meaning in the same sense as the simple equation
EK = i MVz (12)
giving the kinetic energy, EK
, of a m~vingb~dy as a function of its mass, M, and its ve.1ocity, V.

:z; M 20.0
~ 15.0
M f-4 gi f-4 10.0 roll
! .8.0
fa t,) :::;I
= 5.0 It)
4.0 to-
o i' 3.0 "-~ ~ 2.0
r;:,.':IS
1.0
0.7
E~. diam 1.0 in.
Int. diam 0.83 in.
M = 0 3.11b
Golden soil
30
o 5.22 1b
o 4.25 1b
o 3.10
Q 3.05
A 1.65
Figure 15. Reduced penetration of 1. 0 in. diam piles vs impact velocity for piles having various masses.
0 Ext. diam 5/16 in.
8.0 Int. diam 4/16 in. 7.0
0 Ext. diam 6/16 in. 6.0
Int. diam 4/16 in.
5.0 Mass 0.5 1b
4.0 Sand 1
3.0
2.0
1.0
0.5 50 100 200 300 400
V, IMPACT VELOCITY (FT/SEC)
Figure 16a. Penetration vs impact velocity for pile s having various shape factors.
0 Ext. diam 6/16 in. 8.0 0 Ext. diam 7/16 in.
8.0 lIlt. diam 5/16 in. 7.0
6.0 Int. diam 6/16 in. 7.0
0 Ext. diam 7/16 in. o Ext. diam 7/16 in. 6.0
Int. diam 5/16 in. 5.0
Int. diam 4/16 in.
5.0 Mass 0.5 1b 4.0 Mass 0.5 1b Sand 1
Sand 1 Z 4.0 .... Z 3.0 .... :z; 0
3.0 :z; .... 0 E-< .... ~ E-<
~ ~ 2.0 E-<
r:a::I ~ Po. ~ 2.0
Po.~ Po.~
1.0
1.0
0.6 0.4 60 100 200 300 400
50 100 200 300 400
V, IMPACT VELOCITY (FT/SEC) V, IMPACT VELOCITY (FT/SEC)
(b) (c)
Figure 16 (Cont'd). Penetration vs impact velocity for piles having various shape factors.

8.0
7.0
6.0
5.0
:i 1-1 4.0 :z; 0 1-1 Eo<
~ 3.0
~ ff (l.,~
2.0
1.0
0.7
80
Mass 0.5 1b
o Ext. diam 5/16 in.
Int. diam 3/16 in.
o Ext. diam 7/16 in.
Int. diam 0 in. 5.0
Mass 0.5 1b 4.0
Sand 1
:i 3.0 1-1 Int. diam
:z; in. 0 1-1 4/16 Eo<
~ 2.0 5/16 ~ rf 6/16
~ 3/16
4/16 "-
5/16 1.0
4/16
0
0.5 100 200 300 400 500 100 200 300 400 500
V, IMPACT VELOCITY (FT/SEC) V, IMPACT VELOCITY (FT/SEC)
( d) (e)
Figure 16 (Cont'd). Penetration vs iInpact velocity for piles having various shap~ factors.
~ M ()
~ > Z I-t () r:n 0 I"Ij
I-tj M Z M t-3 ~ > t-3 I-t
0 Z 0 I"Ij
':d I-t
~ M r:n .... z. t-3 0 I-tj M ~ ~ > I"Ij ~ 0 r:n t-3
..... U1
~ M
8.0 () ::r:
Various external Mass 0.5 lb and internal diameters > i 7.0 Z
Mass 0.5 1b :. 0 10 7/16 in. H ()
Sand 1 :z; 6.0 020 5/16 in. C/l 0 M 0 ~ Sand 1 ~ ITj
~ 5.0
6.0 '"d ~ M flo
5.0 ~ Z
,..., 4.0 M u ~
i ;J
4.0 ~ ~ ... ~ a:: > ~ ..,. ~ M
H
~" 3.0 0 3.0 0 ~ ........
r-----1 Z
E .....0
........ C'lC'l 0 ........ ~
~ /" I ITj
~ 2.0 o ........ 0 '"d and thick ......... "9 '
C'l ..... H
Thin e ~ piles ........ "- 2.0 M ....
C'l ..... C'l C/l ~ H
Z C'l ..... ~ I~
01 o· ~
1.0 ~ '"d
M fI.I ~
flo ~ o 00 > 0
0.6 1.0 ITj ~
6.0 10 20 30 40 50 60 100 200 300 400 0
(Of-~) , SHAPE FACTOR, 0/16 in. )2 C/l
V, . IMPACT VELOCITY (FT/SEC) ~
tigure 17. Penetration vs shape factor at 200 ftl sec. Figure 18. Reduced penetration vs impact velocity for piles having various shape factors.

MECHANICS OF PENETRATION OF PILES INTO PERMA~ROST
9.0
8.0
~.O
6.0
5.0
4.0
3.0
2.0
MO 0.5 Ib
DlO 7/~6 in.
D20 5/16 in.
Sand 1
1.0~~ ______________ ~~ ________ L-____ ~ ____ ~ ____ ___
100 200 300 400 500
v., IMPACT VELOCITY (FT/SEC)
Figure 19. Reduced penetration vs impact velocity for piles having various masses and shape factors.
To make a comparison, the following hypothetical models are discussed.
Constant force model
17
A pile is launched in the direction of a visco-solid material, such as permafrost, and the penetration takes place solely under the influence of the pile I s kinetic energy. For simplicity, it is assumed that the only strength acting against the pile during penetration is a constant crushing strength at the tip of the pile; this force is also assumed to be proportional to the projected area of the pile. Other possible forces are neglected. Under these conditions, the differential equation for movement of the pile, based on the principle of the equivalence of the loss of kinetic energy and the work done, can be written:
Cl S dP. = -d( iMv2 )
1 (13)
where cl is a proportionality constant, S is the area of the pile projected on a plane perpendicular to its trajectory, Pi is the instantaneous penetration, M is the mass, and ~ the instantaneous velocity. Equation 3 becomes:
Cl S dP. = -Mvdv 1
which after integration becomes
p = iMy2 /(CI S)
where P is total penetration and Y is impact" velocity.
( 14)
(15)
18 MECHANICS OF PENETRATION OF PILES INTO PERMAFROST
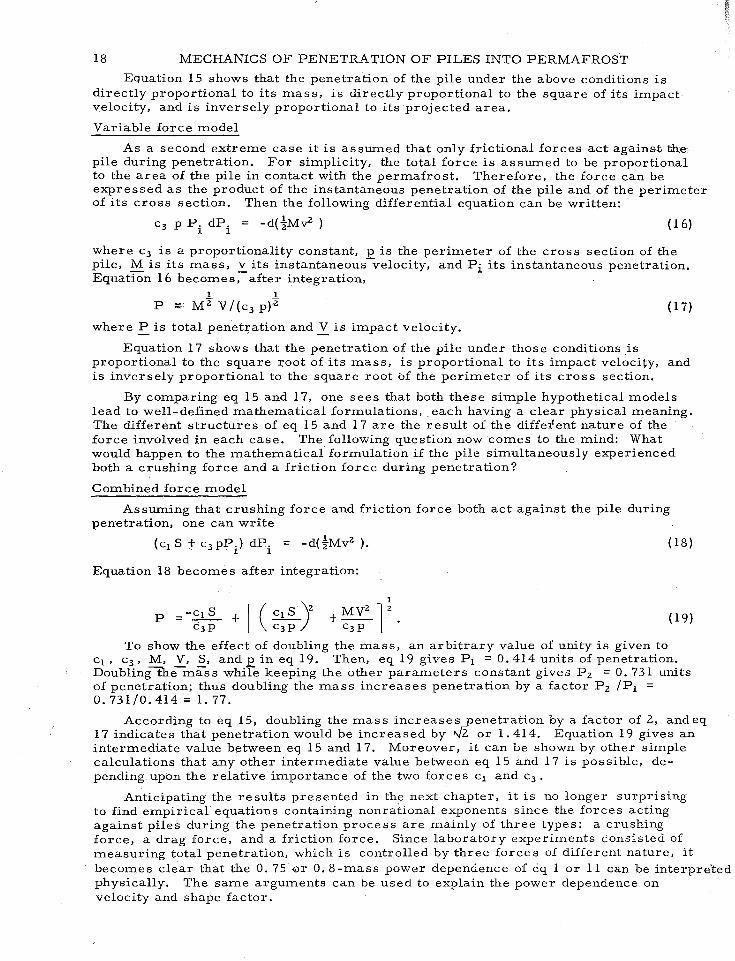
Equation 15 shows that the penetration of the pile under the above conditions is directly proportional to its mass, is directly proportional to the square of its impact velocity, and is inversely proportional to its projected area.
Variable force model
As a second extreme case it is assumed that only frictional forces act against the, pile during penetration. For simplicity, the total force is assumed to be proportional to the area of the pile in contact with the permafrost. Therefore, the force can be expressed as the product of the instantaneous penetration of the pile and of the perimeter of its cross section. Then the following differential equation can be written:
c 3 p P. dP. = -d(iMr ) (16) 1 1
where c 3 is a proportionality constant, p is the perimeter of the cross section of the pile, M is its mass, v its instantaneous-velocity, and Pi its instantaneous penetration. Equation 16 becomes:-after integration,
1 1
P ::;;; M 2 V/(c3 p)2 (17)
where P is total penetration and V is impact velocity.
Equation 17 shows that the penetration of the pile under those conditions is proportional to the square root of its mass, is proportional to its impact velocity, and is inversely proportional to the square root bf the perimeter of its cross section.
By comparing eq 15 and 17, one sees that both these simple hypothetical models lead to well-defined mathematical formulations, . each having a clear physical meaning. The different structures of eq 15 and 17 are the result of the diffetent nature of the force involved in each case. The following question now comes to the mind: What would happen to the mathematical formulation if the pile simultaneously experienced both a crushing force and a friction force during penetration?
Combined force model
Assuming that crushing force and friction force both act against the pile during penetration, one can write
(c1 S + c 3 pPi) dPi = -d(iMv2 ). (18)
Equation 18 becomes after integration:
( 19)
To show the effect of doubling the mass, an arbitrary value of unity is given to c 1 , c 3 , M, V, S, and pin eq 19. Then, eq 19 gives P 1 = 0. 414 units of penetration. Doubling-the-mass while keeping the other parameters constant gives P 2 = 0. 731 units of penetration; thus doubling the mass increases penetration by a factor P 2 /P1 = 0. 731/0.414 = l. 77.
According to eq 15, doubling the mass increasesyenetration by a factor of 2, and eq 17 indicates that penetration would be increased by '-J2 or 1. 414. Equation 19 gives an intermediate value between eq 15 and 17. Moreover, it can be shown by other simple calculations that any other intermediate value between eq 15 and 17 is possible, depending upon the relative importance of the two forces c1 and c 3 •
Anticipating the results presented in the next chapter, it is no longer surprising to find empirical equations containing nonrai:ional exponents since the forces acting against piles during the penetration process are mainly of three types: a crushing force, a drag force, and a friction force. Since laboratory experiments consisted of measuring total penetration, which is controlled by three forces of different nature, it becomes clear that the 0. 75 ·Or 0.8-mass power dependence of eq 1 or 11 can be interpreted physically. The same arguments can be used to explain the power dependence on velocity and shape factor.
MECHANICS OF PENETRATION OF PILES INTO PERMAFROST 19
FIRST INVESTIGATION, PHASE II
Penetration-time measurement technique
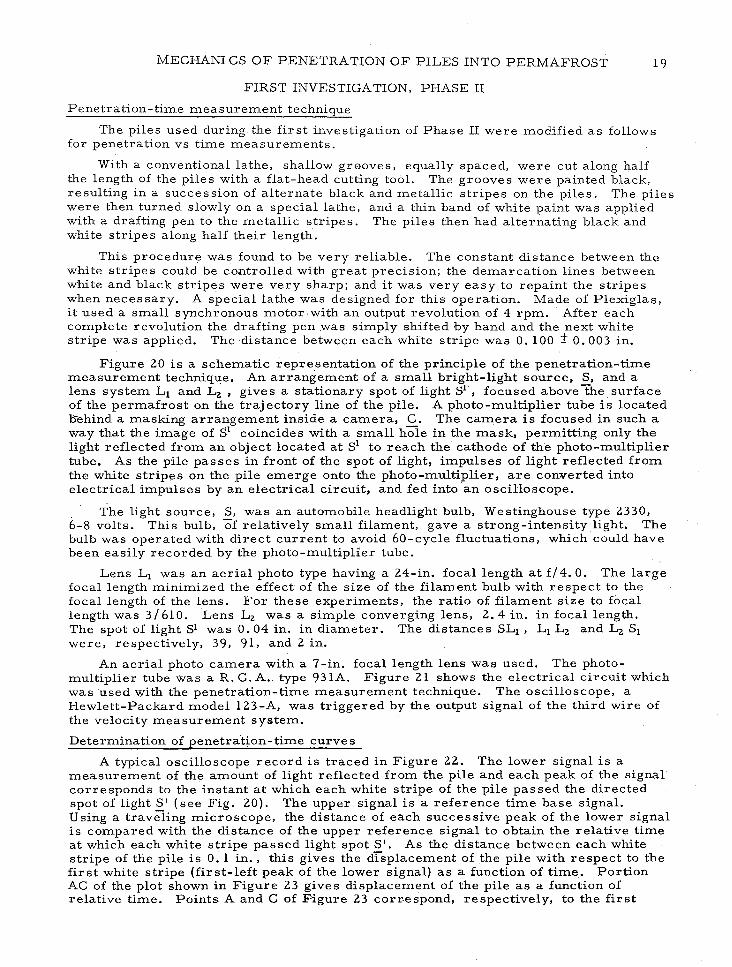
The piles used during the first investigation of Phase II were modified as follows for penetration vs time measurements.
With a conventional lathe, shallow gr0oves, equally spaced, were cut along half the length of the piles with a flat-head cutting tool. The grooves were painted black, resulting in a succession of alternate black and metallic stripes on the piles. The piles were then turned slowly on a special lathe, and a. thin band of white paint was applied with a drafting pen to the metallic stripes. The piles then had alternating black and white stripes along half their length.
This procedure was found to be very reliable. The constant distance between the white stripes could be controlled with great precision; the demarcation lines between white and black stripes were very sharp; and it was very easy to repaint the stripes when necessary. A special lathe was designed for this operation. Made of Plexiglas, it used a small synchronous motor .with an output revolution of 4 rpm. After each complete revolution the drafting pen was simply shifted by hand and the next white stripe was applied. The distance between each white stripe was 0. 100 ± 0. 003 in.
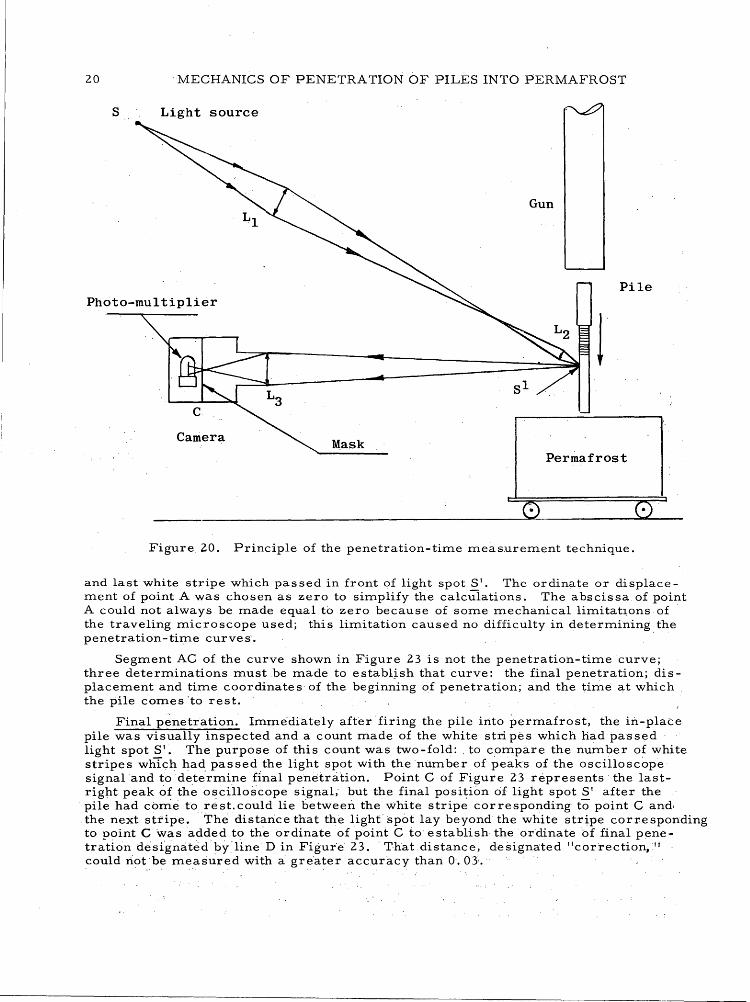
Figure 20 is a schematic representation of the principle of the penetration-time measurement techniqu,e. An arrangement of a small bright-light source, ~· and a lens system L 1 and L 2 , gives a stationary spot of light S1 , focused above the surface of the permafrost on the trajectory line of the pile. A photo-multiplier tube is located l5ehind a masking arrangement inside a camera, C. The camera is focused in such a way that the image of S1 coincides with a small hole in the mask, permitting only the light reflected from an object located at S1 to reach the cathode of the photo-multiplier tube, As the pile passes in front of the spot of light, impulses of light reflected from the white stripes on the pile emerge onto the photo-multiplier, are converted into electrical impulses by an electrical circuit, and fed into an oscilloscope.
The light source, S, was an automobile headlight bulb, Westinghouse type 2330, 6-8 volts. This bulb, of relatively small filament, gave a strong-intensity light. The bulb was operated with direct current to avoid 60-cycle fluctuations, which could have been easily recorded by the photo-multiplier tube.
Lens L 1 was an aerial photo type having a 24-in. focal length at f/ 4. 0. The large focal length minimized the effect of the size of the filament bulb with respect to the focal length of the lens. For these experiments, the ratio of filament size to focal length was 3/610. Lens L 2 was a simple converging lens, 2.4 in. in focal length. The spot of light Sl was 0. 04 in. in diameter. The distances SL1 , L 1 L 2 and L 2 St were, respectively, 39, 91, and 2 in.
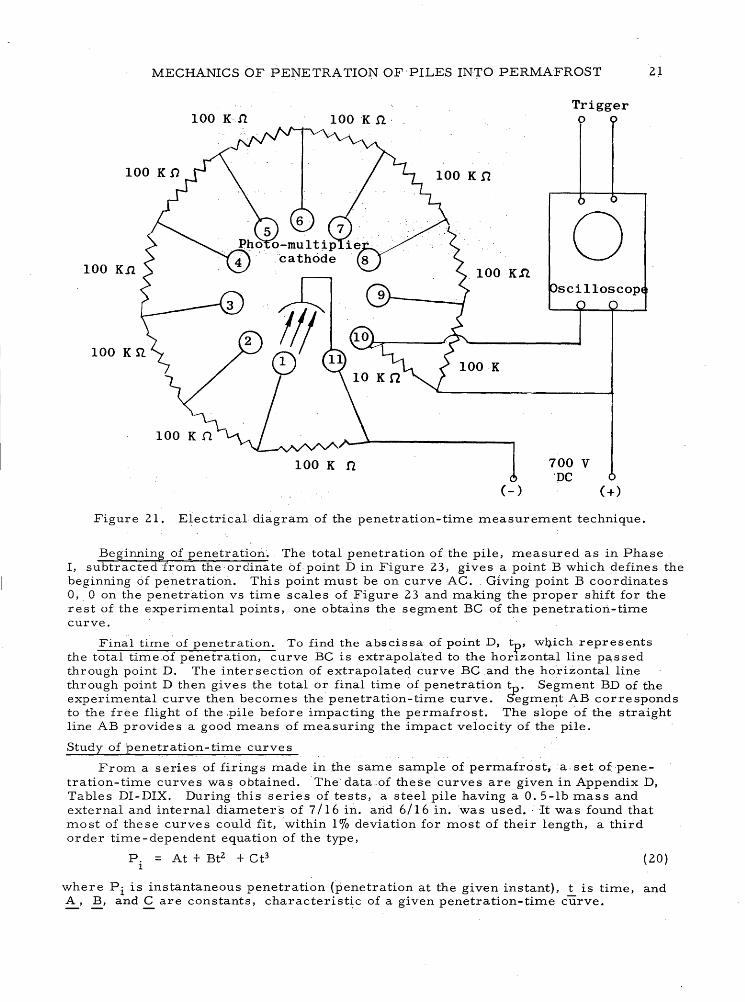
An aerial photo camera with a 7 -in. focal length lens was used. The photomultiplier tube was a R. C. A. type 931A. Figure 21 shows the electrical circuit which was used with the penetration-time measurement technique. The oscilloscope, a Hewlett-Packard model 123-A, was triggered by the output signal of the third wire of the velocity measurement system.
Determination of penetration-time curves
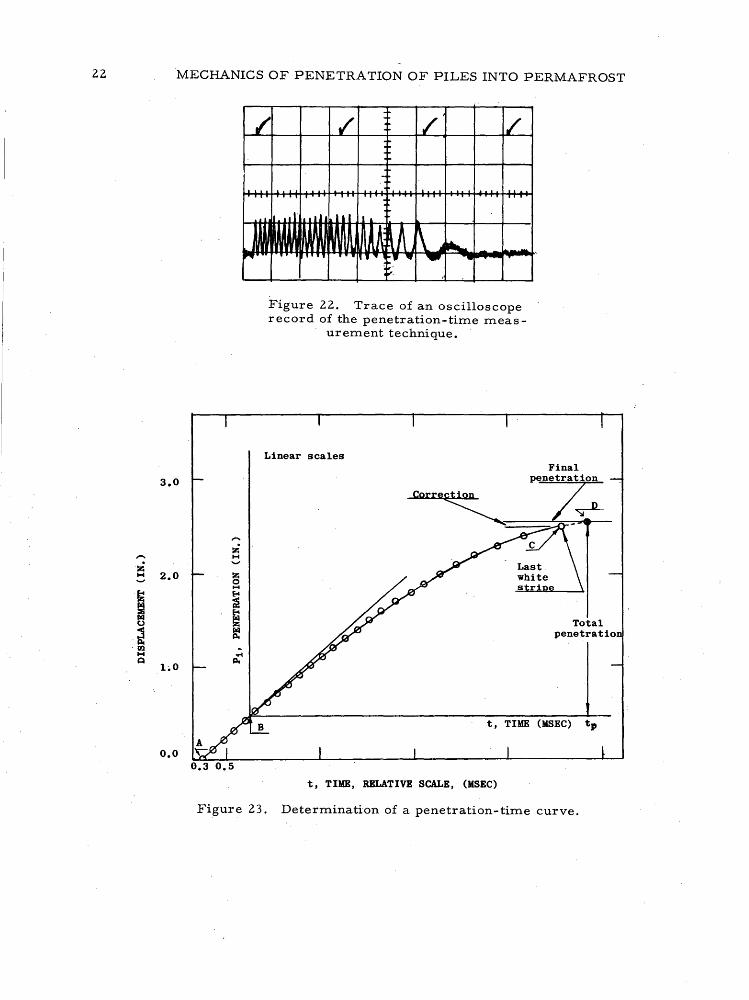
A typical oscilloscope record is traced in Figure 22. The lower signal is a measurement of the amount of light reflected from the pile and each peak of the signal corresponds to the instant at which each white stripe of the pile passed the directed spot of lightS' (see Fig. 20). The upper signal is a reference time base signal. Using a travcling microscope, the distance of each successive peak of the lower signal is compared with the distance of the upper reference signal to obtain the relative time at which each white stripe passed light spotS'. As the distance between each white stripe of the pile is 0. 1 in., this gives the displacement of the pile with respect to the first white stripe (first-left peak of the lower signal) as a function of time. Portion AC of the plot shown in Figure 23 gives displacement of the pile as a function of relative time. Points A and C of Figure 23 correspond, respectively, to the first
20 . MECHANICS OF PENETRATION OF PILES INTO PERMAFROST
s Light source
Pile Photo-multiplier
! Camera Mask
Permafrost
Figure 20. Principle of the penetration-time measurement technique.
and last white stripe which pas sed in front of light spot S'. The ordin~te or displacement of point A was chosen as zero to simplify the calcUlations. The abscissa of point A could not always be made equal to zero because of some mechanical limitatIons of . the traveling microscope used; this limitation caused no difficulty in determining the penetration-time curves. .
Segment AC of the curve shown in Figure 23 is not the penetratioh-timecurve; three determinations must be made to establ~sh that curve: the final penetration; displacement and time coordinate s of the beginning of penetration; and the time at which the pile comes to rest.
Final p~netration. Imme'diately after' firing the pile into permafrost, the in-place pile was visually inspected and a count made of the white stri pes which had passed light spot S'. The purpose of this count was two-fold: . to compare the number of white stripes whlch had passed the light spot with the number of peaks of the oscilloscope signal and to . d e.te'r mine fInal penetr,ition. Point C of Figure 23 represents' the lastright peak of the oscilloscope signal; but the final posi~ion of light spot S' after the pile had corne torest.could lie between the white stripe corresponding to point C and; the next stripe. The distance that the light" 'spot lay beyond the white stripe corresponding to point C was added to the ordinate of point C to establish- the ordinate of final penetration desi'gnatedby'1ine D in Figur'e 23. 'That distance, designated "correction," ,could not,.be measured with a gr~'ater accuracy than 0-.03'.
MECHANICS OF PENETRATION OF 'PILES INTO PERMAFROST 21
100 Kn 100 Kn·
100 K rz
100 Kn. 100 Kn
100 K n (- )
Trigger o
o sci11oscop
700 V 'DC
Figure 21. Eiectrical diagram of the penetration-time measurement technique.
Beginning of penetration'. The total penetration of the pile, measured as in Phase 1, subtracted from the ordinate of point D in Figure 23, gives a point B which defines the beginning of penetration. This point must be on curve AC. Giving point B coordinates 0,.0 on the penetration vs time scales of Figure 23 and making the proper shift for the rest of the experimental points, one obtains the segment BC of the penetration-time curve.
Final time of penetration. To find the abscissa of point D, t p ' wl).ich represents the total time of penetration, curve BC is extrapolated to the horizontal line pas sed through point D. The intersection of extrapolated curve BC .and the horizontal line through point D then gives the total or final time of penetration t. Segment BD of the experimental curve then becomes the penetration-time curve. ?egmerit AB corresponds to the free flight of the .pile before impacting the permafrost. The slope of the straight line AB provides a good means of measuring the impact velocity of the pile.
Study of 'penetration-time curves
From a series of firings made in,the same sample of permafrost,a.set ofpenetration-time curves was obtained. The' data:6f these curves are given in Appendix D, Tables DI-DIX. During this series of tests, a steel pile having a O. 5-lb mass and external and internal diameters of 7/16 in. arid 6/16 in. was used. " It was found that most of these curves could fit, within 1 % deviation for most of their length, a third order time-dependent equation of the type,
p, = At + Btl + Ct3 (20) 1
where Pi is instantaneous penetration (penetration at the given instant), t is time, and A, B, and C are constants, characteristic of a given penetration-time curve.
22
-:z; 1-1
~ r= !iii tJ
~ -Ill
1-1 ~
MECHANICS OF PENETRATION OF PILES INTO PERMAFROST
3.0
2.0
1.0
0.0
i 1-1
:z; 0 1-1 E-4 ~
E !iii Ilt
:c Ilt
Figure 22. Trace of an oscilloscope record of the penetration-time meas
urement technique.
Linear scales
t, TIME (MSEC) tp
t, TIME, RELATIVE SCALE, (MSEC)
Figure 23. Determination of a penetration-time curve.
MECHANICS OF PENETRATION OF PILES INTO PERMAFROST 23
No time-dependent term appears in eq 20, since by definition the penetration is zero at time zero. Knowing the values of coefficients A, B, and C of a given penetrationtime curve, it is pos sible to calculate the velocity and {le cele ration of the pile at any instant of penetration by evaluating the first and the second time derivatives of eq 20.
Determination of A, B, C. Coefficient A corresponds to impact velocity V, which is measuredexperimentally~, This is seen by evaluating the first derivativeoTeq 20 at time zero,
( dP / d t) t = 0 = A = V.
Two points are chosen along the experimental penetration-time curve, and a pair of simultaneous linear equations in Band C are solved:
P. = Vt1 + BtZl + Ct~
11
P. = Vtz + Bt~ + cd 1Z
where tl and tz are the measured times of penetration corresponding to measured penetration Pil and Piz, Calculated values of A, B, and C for the data given in Tables DI-DIX are given in Table 1.
Deceleration-penetration curves. An 'example of the determination of a deceleration-penetration curve follows. The A, B, C values for the Table DIV data give:,
P. = 2.21 t - 0.327tz - O. 022t3 ., 1
(21 )
The penetration-time data of Table' DIV and the calculated values of the first and second derivatives of eq 21, give Table II and the deceleration-penetration curve corresponding to eq 21. The numerical values of Table II will be used 'later for the evaluation of experimental constants. These, data were used because the tota~ pene-:tration in these tests closely represents the middle range of penetrations covered by this series of tests. Moreover, eq 21 shows a very good fit with the penetration-time data from which it was derived.
Table 1. Values of the coefficients A, B, C of eq 20 after the ' penetration-ti~e data given in Appendix D.
Data of table
DI Dll DIll DIV DV DVI DVII. DVIII DIX
'A (in. Irrisec)
2.87 2.37 2.26 2.21 2.00, 1. 54 1. 51 1. 47 1.18 0.80 0.68 .
~~Data not given in Appendix D.
Physical rhodel
B (in. Imsec~)
-0.360 -0.330 -0~3l0 -0.327 -0.282 -0.245 -0.260 -0.260 -0.270 -0.255
. , -0.235
C (in~' Imsec 3 )
-0.016, -0.008 -0.0,33 -0.022
,-0,. 018 -0.025 -0.027 -0.020 -0.010 -0.000 -0.000
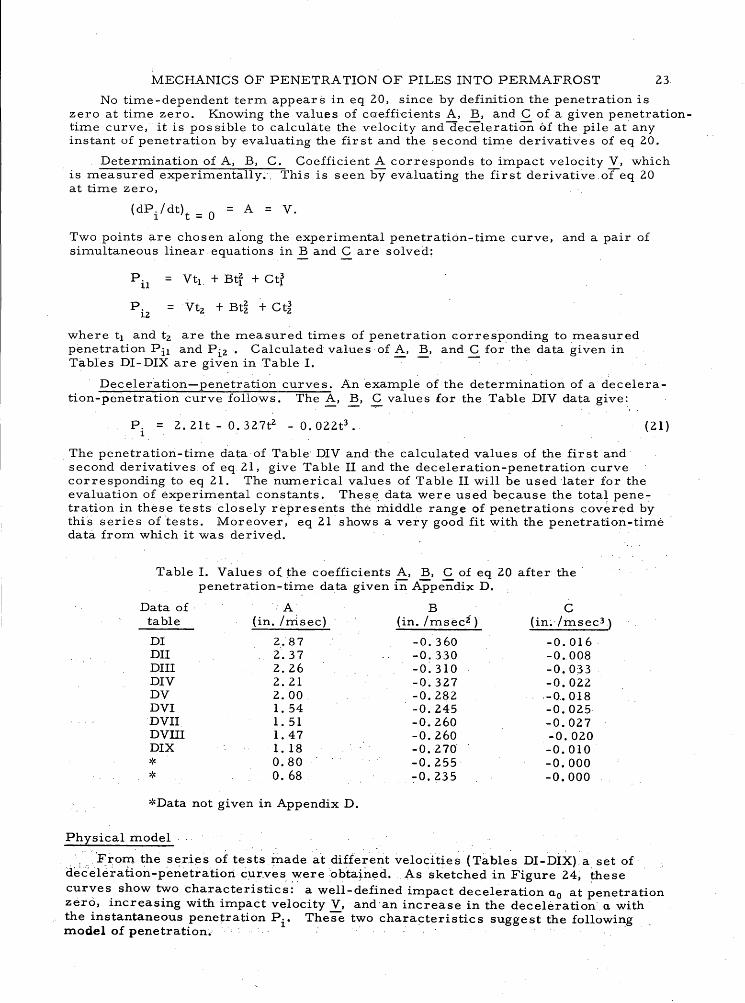
, 'From the ser,i~s of test~inadeat different velocities (Tables DI-DiX) a set of dec\:~le~aiion-penetratioIi c:ur.v~s. wereobtatned. ,A.s sketched in Figure 24:, these curves show two characteristics:' a well-defined impact deceleration ao at ~enetration zero, increasing with impact velocity V, and 'an increase in the deceleration' a with the instantaneous penetration P.. These two chara~teristics suggest the following model of penetration. 1 " '

24 MECHANICS OF PENETRATION OF PILES INTO PERMAFROST
Table II. Values of Pi' ~, a =2BtZ and t after eq 21 and after Table DIVof Appendix D.
Penetration Velocity Deceleration Time Pi v a t (in. ) (in. /msec) (in. /msecz ) (msec)
0.000 2.210 0.654 0.0 0.820 1.948 0.710 0.4 1.540 1.645 0.760 0.8 2. 140 1.330 0.812 1.2 2. 600 0.995 0.865 1.6 2.936 0.638 0.918 2.0 3.040 0.450 0.944 2.2 3. 11.5 0.260 0.971 2.4 3.150 0.000 1.000 2.6
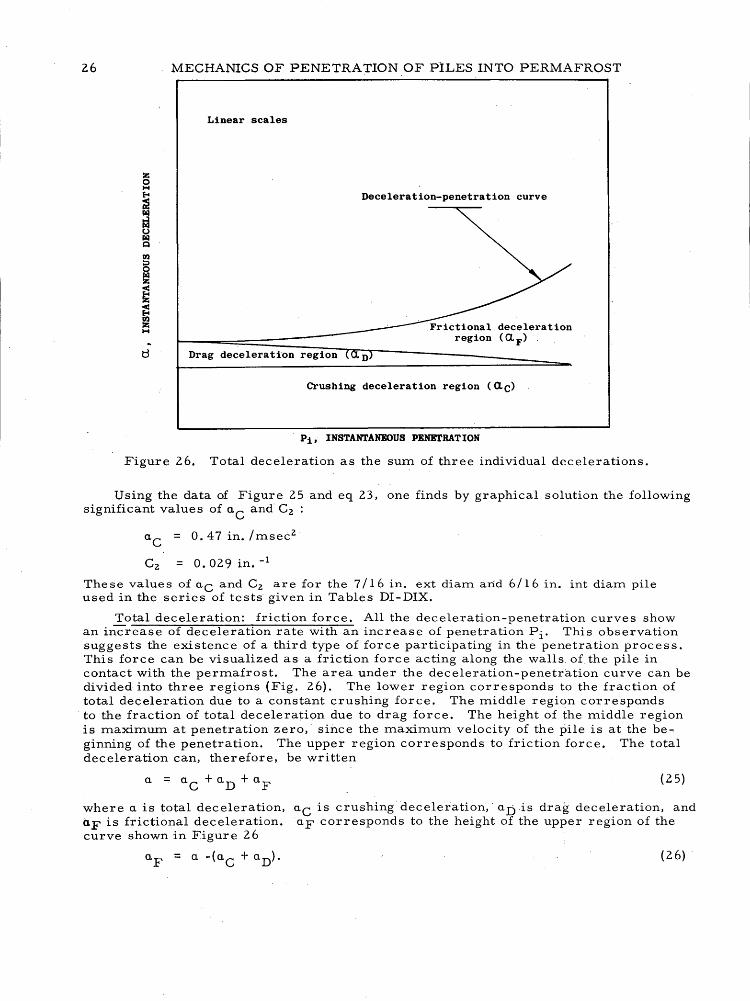
Impact deceleration. Figure 25 shows the absolute values of impact deceleration ao plotted as a fU'nction of impact velocity V. In other words, this graph is the plot of the absolute numerical value 2B as a function of the corresponding numerical value A given in Table 1. One recalls from eq 20 that (dPi/dt)t=O =A = V and _(dZ Pi/dtZ )t=O= -2B = ao.
An examination of the curve shown in Figure 25 indicates a non-linear increase of impact deceleration ao with an increase of impact velocity V~ Moreover, a curve passed through the experimental values definitely crosses the 0.0 axis at a positive value aC. These two observations of the impact deceleration-impact velocity curve suggest that the two following phenomena occur at the beginning of penetration and, by extension, during the penetration proce s s.
Crushing force. For the pile to penetrate permafrost, a minimum force is required. This force is necessary to destroy the structure of the permafrost and permit the pile to penetrate. Since this crushing force acts at the tip of the pile, it must be present for the duration of the penetration process. As deceleration of the pile is di .... rectly proportional to the resisting force, the value of a C in Figure 25 would correspond to this crushing force. '
Drag ,force. The increase of impact deceleration ao with increase of impact velocity V suggests that, besides a crushing force, a dynamic force must also be present during the penetration process. By analogy with fluid dynamics, this second force would be similar to the drag force experienced by a solid body moving through a fluid medium. It might be regarded as the force necessary to displace the particles of
. crushed permafrost. This drag force might also include an increase of crushing force with increased velocity. On the basis of theoretical considerations and of the nonlinear increase of the observed impact deceleration, one can pass through the experimental data of Figur e 25 a curve of the following ty pe:
(22)
where ao is impact deceleration, a C is crushing deceleration, and aD is an impact drag deceleration which is a function of impact velocity. 0
Assuming the drag force to be proportional to the square of velocity, one obtains:
(23 )
where C z is a drag coefficient and V is impact velocity. Drag deceleration aD or C z VZ would then correspond to the drag force acting at the tip of the pile. Sin~e drag deceleration is a. function of ,velocity, it must be present during the complete penetration process. Itsvaluea.t ariy'instan~, of penetration then becomes: '
aD =Cz vZ (24)
where' aD is instantaneou,s drag deceleration and ~ the instantaneous velocity.
MECHANICS OF PENETRATION OF PILES INTO PERMAFROST
Linear scaleS
d
Pi' INSTANTANEOUS PENETRATION
Figure 24. instantaneous deceleration vs instantaneous penetration for various impact velocities.
o 0.5 lj
0.0 0.0
Ext. diam 7/16 in.
Int. diam 6/16 in.
Mass 0.5 1b
Sand 1
Linear scales
0. 0 = 0.47 + 0.029 v2
V, IMPACT VELOCITY (IN. /MSEC)
Fig-ure 25. Impact deceleration vs impact velocity.
25
26 MECHANICS OF PENETRATION OF PILES INTO PERMAFROST
Linear scales
Deceleration-penetration curve
deceleration ( a.
F)
Drag deceleration region D
Crushing deceleration region (o.C)
Pi, INSTANTANEOUS PENETRATION
Figure 26. Total deceleration as the sum of three individual decelerations.
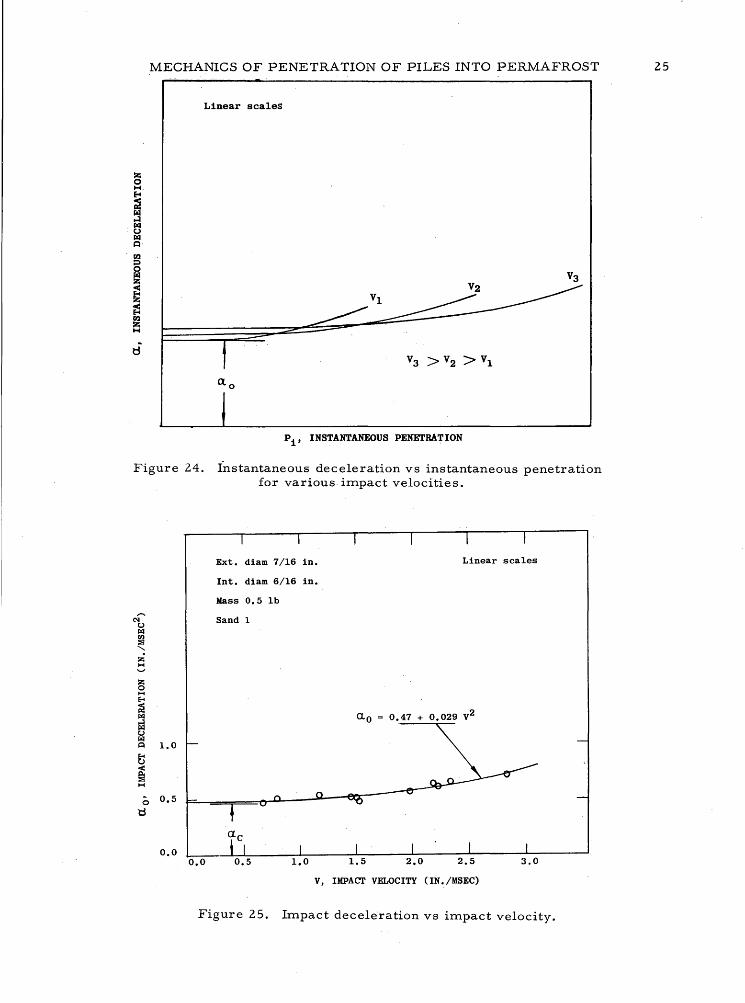
Using the data of Figure 25 and eq 23, one finds by graphical solution the following significant values of a
C and C z :
aC
= 0.47 in. /msecz
C z = 0.029 in. -1
These values of aC and C z are for the 7/16 in. ext diam arid 6/16 in. int diarn pile used in the series of tests given in Tables DI-DIX.
Total deceleration: friction force. All the deceleration-penetration curves show an increase of deceleration rate with an increase of penetration Pi' This observation suggests the existence of a third type of force participating in the penetration process. This force can be visualized as a friction force acting along the walls. of the pile in contact with the permafrost. The area under the deceleration-penetration curve can be divided into three regions (Fig. 26). The lower region corresponds to the fraction of total deceleration due to a constant crushing force. The middle region corresponds to the fraction of total deceleration due to drag force. The height of the middle region is maximum at penetration zero,· since the maximum velocity of the pile is at the beginning of the penetration. The upper region corresponds to friction force. The total deceleration can, therefore, be written
(25)
where a is total deceleration, aC is crushing'deceleration,' aJj.is drag deceleration, and aF is frictional deceleration. aF corresponds to the height of the upper region of the curve shown in Figur e 26
(26)
MECHANICS OF PENETRA TIONOF"PILES INTO PERMAFROST " 27
It is seen that frictional deceleration increases non-linearly with ,penetration. One may then write:
a F = fl (Pi'~) (27)
where fl (Pi' v) is a function of instantaneous penetration and instantaneous velocity.
Since, by the nature of the experiments, there were no particular' indications of the behavior of the friction force, the following assumption was made. Usingagain the analogy of fluid dynamics (Rouse, 1946), the friction force' was assumed to be proportional to the surface of the pile in contact with permafrost, thetefore proportional to instantaneous penetration. Equation 27 may be written as follows: '
aF
= p, fz (P.,v) 1 1
(28)
fz (P., v) is a friction factor which is a function of instantaneous penetration Pi and instintaneous velocity v. As suming the friction factor to be independent of penetration, eq 28 reduced to: -
(29)
where f3 (v) is a friction-factor function of instantaneous velocity.
Figure 2 7, from the data of Table II, shows the numerical value's of the frictional deceleration region. "The upper curve of Figure 2 7 is the deceleration-penetration curve and the lower curve is calculated from (aC + Cz.vz ) where aC = O. 512 in. /msecz
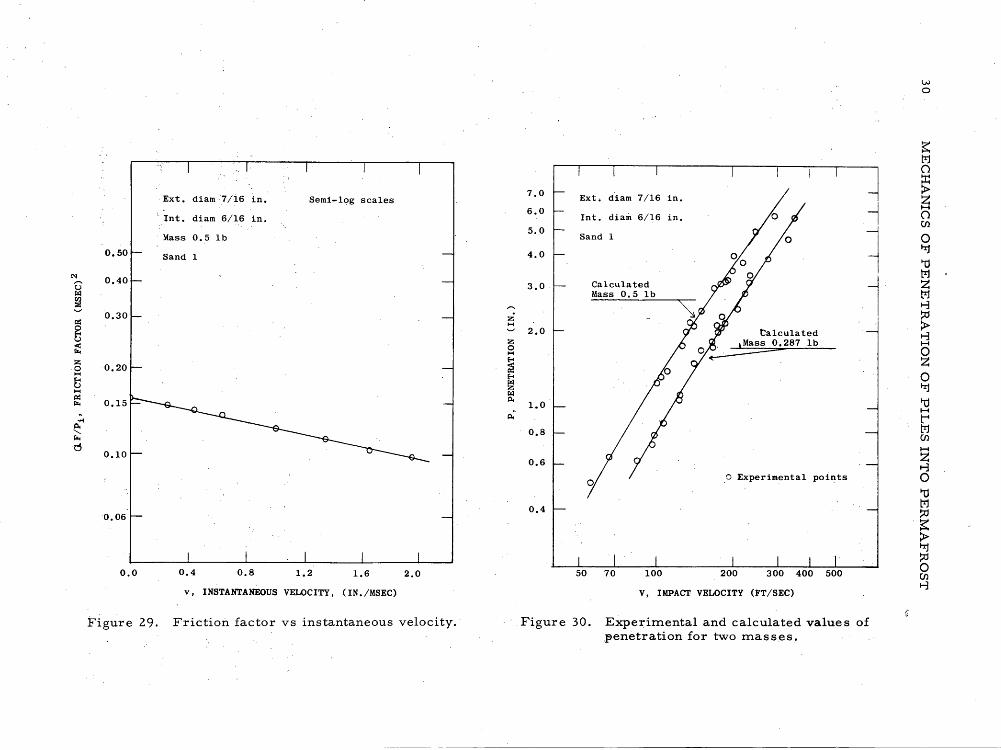
and C z = 0.029 in. -1. The numerical difference of the two curves gives frictional deceleration aF as a function of penetration Pi (Fig. 28). The numerical values aFfPi plotted on a semi-log scale as a function of the velocity of the pile give Figure 29. Since a straight line of negative slope fits the points very well, one can write:
(30)
or
(31 )
where C 3 is a friction constant and.!s is a constant.
From Figure 29,
Equation 31 means that frictional deceleration, or friction force, is proportional to instantaneous penetration and proportional to a friction factor decreasing exponentially with velocity. The decrease of friction force with velocity is a comr:,non phenomenon (Palmer, 1949).
Semi-empirical equation. Combining eq 25, 24 and 31,
-kv a = a C + C z vZ + C 3 Pi e (32)
where a is total instantaneous deceleration, a is deceleration due to crushing force, C z is a drag coefficient, v is i~stantaneous v~ocity, Pi is instantaneous penetration, and C 3 a constant of frictwn.
Inserting the experimental values derived from the series of tests used in this chapter, one obtains
a = O. 47 + O. 029 v 2 + O. 1 56 P. e - 0 .24 v 1
(33)
where a is in in. /msec 2 , ,v is in in. /msec, and P.· . " 1 IS In in. Multiplying both sides of
eq 33 by M, one 0 btains :

28 MECHANICS OF PENETRATION OF PILES INTO PERMAFROST
1.0
0.5
0.0 0.0
1.0
0.5
Ext. diam 7/16 in.
Int. diam 6/16 in.
Mass 0.5 Ib
Sand 1
Crushing and drag decelerations
Total deceleration
Linear scales
~ Frictional deceleration region
Pi' INSTANTANEOUS PENETRATION (IN.)
Figure 27. Frictional deceleration region.
Ext. diam 7/16 in.
Int. diam 6/16 in.
Mass 0.5 lb
Sand 1
Linear scales
0.0 a--=~----------------
-0.5L-________ L-______ ~~-----~~--~~------~~------~~-----0.5 1.0 0.0
Pi. INSTANTANEOUS PENETRATION (IN.)
. Figure 28. Frictional deceleration vs instantaneous penetration.
MECHANICS OF PENETRATION OF PILES INTO PERMAFROST
Ma = M{0.47 + 0.029 v2 + O. 156 P. e-O•Z4V) 1
29
(34)
where M is the Inass of the pile. Since eq 34 has the diInensions of force, using the principle of equivalence of lost kinetic energy and work done, one can write:
-d{i MyZ) = (Ma) dP. 1
(35)
or
-d{iMvZ ) = M{0.47 + 0.029 v Z + 0.156 P. e- O•Z4V ) dP.
. 1 1 (36)
Equation 36 becoInes, after siInplifications,
-vdv = (0.47 + 0.029 v Z + 0.156 p, e- O•Z4V ) dP .. 1 1
(37)
NUInericall y integrating eq 37 by using steps of penetration of O. 1 in. and cOInparing the calculated results with the experiInental results, one obtains the graph of Figure 30 .
The upper curve is the c.alculated curve for a 7/16 in. ext diaIn and 6/16 in. int diaIn pile having a Inass of 0.5 lb. The lower calculated curve is for the saIne type of pile having a Inass of O. 2871b. Both calculated curves show a good agreement with experimental data obtained during laboratory work. Table III gives the calculated penetrations. .
Discus sion of the physical model
The physical model mathematically represented by eq 37 is in very good agreement with experimental results. Within the range of penetration studied, it closely reproduces an average 1. 5-velocity power dependence of the penetration given by eq 11. lt is not surprising to obtain the 1. 5-velocity power dependence, since three different forces participate in the penetration proces s. Any other value of velocity power dependence would also have a physical meaning, since the velocity power dependence is affected by the relative importance of each force present in the process. It can be shown 'that an increase of the friction force, keeping the crushing and drag forces constant, will decrease the value of the exponent of the velocity power dependence of the penetration. By the same argument, a decrease in friction will increase the velocity power dependence. This fact was confirmed by special experiments.
The first set of experiments consisted of firing a brass and a steel pile of the same mass and projected area into the same sample of permafrost. Figure 31 shows that the penetration-velocity curve has. a greater slope for the brass pile, as expected since the coefficient of friction between brass and permafrost is less than that between steel and permafrost. Moreover, it was much easier to withdraw the brass pile from the permafrost than the steel pile.
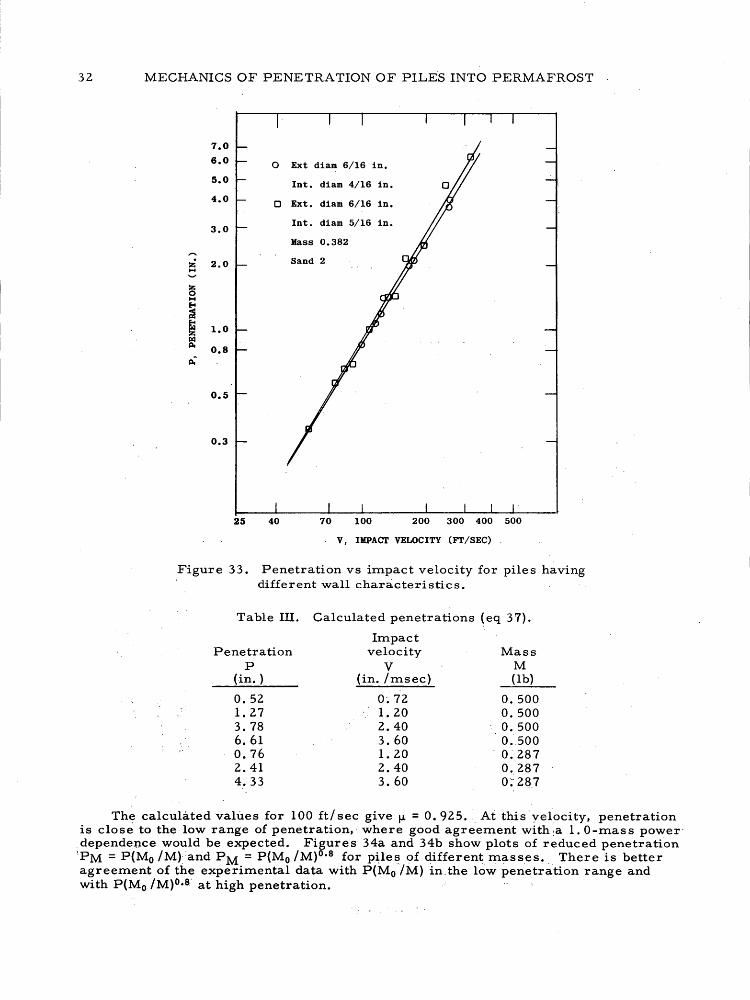
The second set of experiments consisted of firing two steel piles having the same mass but different wall thicknesses (Fig. 32). Th~ reduction. of one pile wall reduced the friction between the pile and the permafrost. As expected, the penetration curve for the thinner-walled pile shows a greater slope (Fig. 33).
The calculated penetration at 200 ft/ sec is 3.78 in. for a pile having a O. 5-lb mass and 2. 4i in. for a pile having a O. 287-lb mass (Table III). Those values of penetration repre sent the range covered by the experiments. The mas s power dependence of penetration at 200 ft/ sec is obtained from
where fJ. is the mass power dependence of penetration, by inserting the numerical values:
(3.78/2.4l) = (0.500/0. 287)fJ.
fJ. = 0.812. This calculated value is close to the average mass power dependence given by 'eq 11.
(38 )
0.50
0.40
'0.30
0.20
0.15
0.10
0.06
0.0
Ext. diam 7/i6 in.
" Int. diam 6/16 in.
Mass 0.5 Ib
Sand 1
0.4 0.8
Semi-log scales
1.2 1.6
v, INSTANTANEOUS VELOCITY, (IN./MSEC)
2.0
Figure 29. Friction factor vs instantaneous velocity.
7.0
6.0
5.0
4.0
3.0
2.0
1.0 '
0.8
0.6
0.4
Ext. diam 7/16 in.
Int. diam 6/16 in.
Sand 1
Calculated Mass 0.5 Ib
talculated ,Mass 0.287 Ib
.a Experimental points
70 300 400 500
V, IMPACT VELOCITY (FT/SEC)
'Figure 30. Experim.ental and calculated values of .1genetration for two m.as ses ~
w o

6.0 o Brass pile
5.0 o Steel pile
4.0 Ext. diam 7/16 in.
Int. diam 5/16 in. 3.0
Mass 0.375 1b
Sand 2 2.0
:i M
Z 0 M E-<
1.0 ~.
~ ~ Ilc~
0.5
0.3
0.13 ~ ______ ~~ ____ ~ __ ~~ ______ ~~~~ __ ~~ ___ , 20 200 300 400
V, IMPACT VELOCITY (FT/SEC)
Figure 3~. Penetration vs impact velocity for piles made of different materials.
Normal
.~
Figure 32.
6/16"
Wall-reduced pile
4/16" I+-J--
5/16"
6/16"
Normal pile and wall-reduced pile.
32 MECHANICS OF PENETRATION OF PILES INTO PERMAFROST
7.0
6.0 0 Ext diam 6/16 in.
5.0 Int. diam 4/16 in.
4.0 0 Ext. diam 6/16 in.
3.0 Int. diam 5/16 in.
Mass 0.382
:;; 2.0 Sand 2 1-1
:z; 0 1-1 ~
~
~ 1.0
ff 0.8 ~-
0.5
0.3
25 40 70 100 200 300 400 500
V, IMPACT VELOCITY (FT/SEC)
Figure 33. Penetration vs impact velocity for piles having different wall characteristics.
Table III. Calculated penetrations ~eq 37).
Penetration P
(in. )
0.52 1. 27 3.78 6.61 0.76 2.41 4.33
Impact velocity
V (in. /msec)
O~ 72 1. 20 2.40 3.60 1. 20 2.40 3.60
Mass_ M (lb)
0.500 0.500
- 0.500 0 . .500 0~287
0.287 0;- 2~}
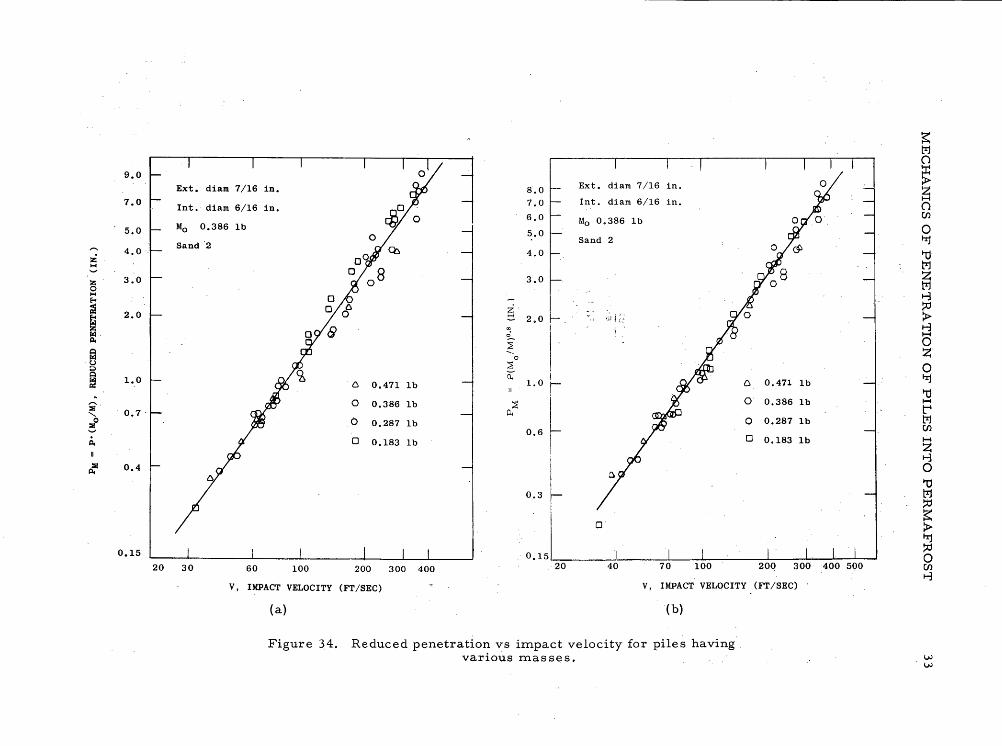
The calculated 'values for 100 ft/ sec give fJ. = 0.925. -_ At thisyelocity, penetration is close to the low range of penetration, - where good agreement with ,a 1. O-mas s powerdependence would be expected. Figures 34a and 34b show plots of reduced penetration
'PM = P{Mo /M)and PM = P{Mo /M)o.s for piles. of different masses. _ There is better agreement of the experimental data with P{Mo /M) in. the low penetration range and with P(Mo /M)o.s- at high penetration.
~ M ()
9.0 ::r: Ext. diam 7/16 in. 8.0 Ext. diam 7/16 in. >
Z 7.0 7.0 Int. diam 6/16 in. H
Int. diam 6/16 in. () 6.0 Mo 0.386 1b
U>. Mo 0.386 1b 5.0 5.0 0 Sand '2 Sand 2 ~
Z 4.0, 4.0 1j
1-4 M ...."
Z 3.0 3.0 Z 0 M 1-4 1-3 Eo< ;i
2.0 ~. ~ Eo< 2.0 r- ~ r~! ~ (;: > ~ <Xl , 1-3 [&1. 0
I H
Ilc
~ 0 fa 0 z
·U ~ :;:J 0 ~ (( i ~ 1.0 C 0.471 1b 1.0 r C 0.471 1b ~
1j ,-.., 0 0.386 1b ~
~ 0 0.386 1b H
::a 0.7 ' ~ "- 11.
! b 0.287 1b 0 0.287 1b M 0.6 (J)
~ 0 0.183 1b 0 0.183 1b H I Z
~ 0.4
~ 1-3 0 1j
0.3 M ! ~
~ 0 >
~ 0.15 0.15,
~ 0
20 30 60 100 200 300 400 20 400 500 (J)' I-,j
V, IMPACT VELOCITY (FT/SEC) V, IMPACT VELOCITY (FT/SEC)
(a) (b)
Figure 34. Reduced penetration vs impact velocity for piles having various masses. VJ
VJ
34 MECHANICS OF PENETRATION OF PILES INTO PERMAFROST
SECOND INVESTIGATION, PHASE II
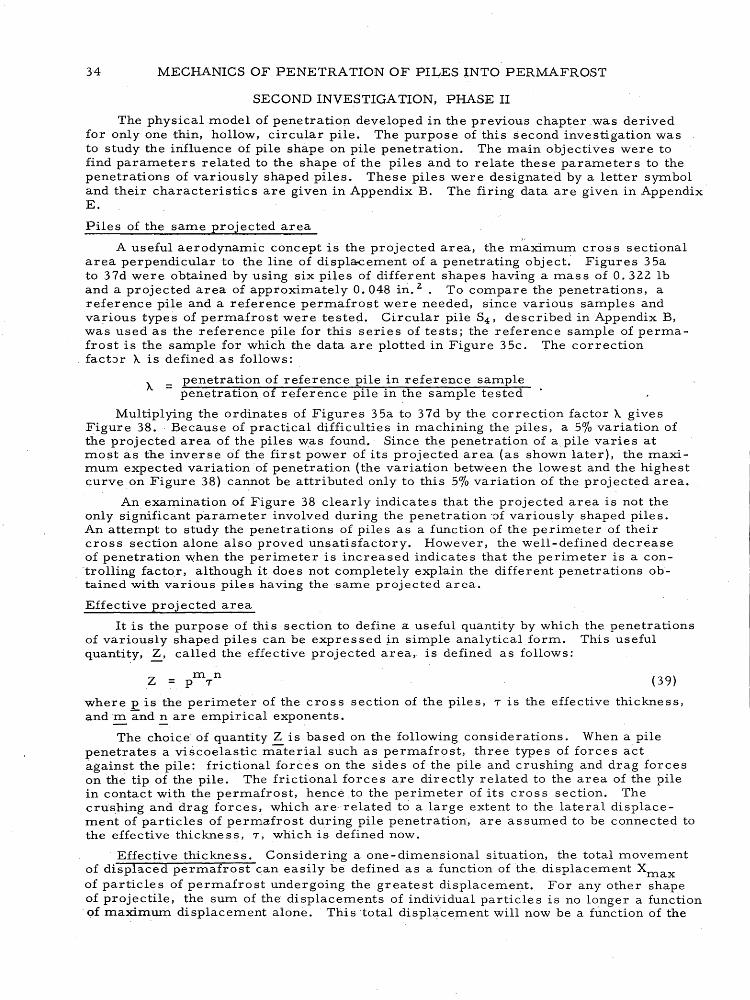
The physical model of penetration developed in the previous chapter was derived for only one thin, hollow, circular pile. The purpose of this second investigation was to study the irifluence of pile shape on pile penetration. The main objectives were to find parameters related to the shape of the piles and to relate these parameters to the penetrations of variously shaped piles. These piles were designated by a letter symbol and their characteristics are given in Appendix B. The firing data are given in Appendix E.
Piles of the same projected area
A useful aerodynamic concept is the projected area, the maximum cros s sectional area perpendicular to the line of displa.cement of a penetrating object" Figures 35a to 37d were obtained by using six piles of different shapes having a mas s of O. 322 lb and a projected area of approximately 0.048 in. 2 • To compare the penetrations, a reference pile and a reference permafrost were needed, since various samples and various types of permafrost were testecl. Circular pile S4' described in Appendix B, was used as the reference pile for this series of tests; the reference sample of permafrost is the sample for which the data are plotted in Figure 35c. The correction fact:::>r A. is defined as follows:
A. = penetration of reference pile in reference sample penetration of reference pile in the sample tested
Multiplying the ordinates of Figures 35a to 37d by the correction factor X. gives Figure 38. Because of practical difficulties in machining the piles, a 5% variation of the projected area of the piles was found. Since the penetration of a, pile varies at rriost as the inverse of the first power of its projected area (as shown later), the maximum expected variation of penetration (the variation between the lowest and the highest curve on Figure 38) cannot be attributed only to this 5% variation of the projected area.
An examination of Figure 38 clearly indicates that the projected area is not the only significant parameter involved during the penetration 'Jf variously shaped piles. An attempt to study the penetrations of piles as a function of the perimeter of their cross section alone also proved unsatisfactory. However, the well-defined decrease of penetration when the perimeter is increased indicates that the perimeter is a controlling factor, although it does not completely explain the different penetrations ohtained with various piles having the same projected area.
Effective projected area
It is the purpose of this section to define a useful quantity by which the penetrations of variously shaped piles can be expressed ~n simple analytical form. This useful quantity, . Z, called the effective projected area, is defined as follows:
m n Z = P 'T ( 39)
where p is the perimeter of the cross section of the piles, 'T is the effective thickness, and -:::: and E. are empirical exponents.
The choice of quantity Z is based on the following considerations. When a pile penetrates a ~iscoelastic material such as permafrost, three types of forces act against the pile: frictional forces on the sides of the pile and crushing and drag forces on the tip of the pile. The frictional force s are directly related to the area of the pile in contact with the permafrost, hence _to the perimeter of its cross section. The crushing and drag forces, which are related to a large extent to the lateral displacement of particles of permafrost during pile penetration, are assumed to be connected to the effective thickness, 'T, which is defined now. .
Effective thickness. Considering a one-dimensional situation, the total movement of displaced permafrost can easily be defined as a function of the displacement Xmax of particles of permafrost undergoing the greatest displacement. For any other shape of projectile, the sum of the displacements of individual particles is no longer a function
. of maximum displacement alone. This total displc~.cement will now be a function of the
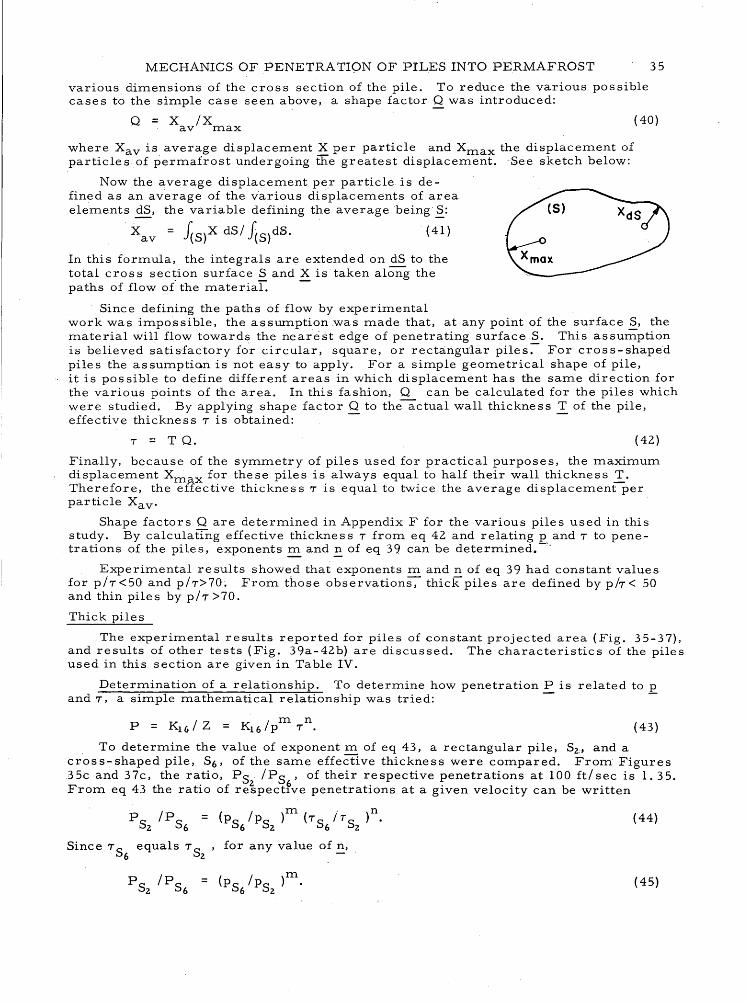
MECHANICS OF PENETRATION OF PILES INTO PERMAFROST
various dimensions of the cross section of the pile. To reduce the various possible cases to the simple case seen above, a shape factor Q was introduced:
35
Q = X Ix av max ( 40)
where Xav is average displacement X per particle and Xmax the displacement of particles of permafrost undergoing the greatest displacement. ~See sketch below:
Now the average displacement per particle is defined as an average of the various displacements of area elements dS, the variable defining the average being' §.:
X a v = ~ S) X dS I f( S) dS. (41 )
In this formula, the integrals are extended on dS to the total cross section surface S and X is taken along the paths of flow ot" the material. -
Since defining the paths of flow by experimental work was impossible, the assumption was made that, at any point of the surface S, the material will flow towards the nearest edge of penetrating surfaceS. This assumption is believed satisfactory for circular, square, or rectangular piles:- For cross-shaped piles the assumptiQn is not easy to apply. For a simple geometrical shape of pile, it is pos sible to define different areas in which displacement has the same direction for the various points of the area. In this fashion, Q can be calculated for the piles which were studied. By applying shape factor Q to theactual wall thickness T of the pile, effective thickness T is obtained: - -
T = T Q. (42)
Finally, because of the symmetry of piles used for practical purposes, the maximum displacement Xmax for these piles is always equal to half their wall thickness T. Therefore, the effective thicknes s T is equal to twice the average displacement per particle Xav '
Shape factors Q are deterTIlined in Appendix F for the various piles used in this study. By calculating effective thickness T from eq 42 and relating p and T to penetrations of the pile s, exponents.::: and ~ of eq 39 can be determined.~'
Experimental re sults showed that exponents m and n of eq 39 had constant values for p/T<50 and p/T>70~ From those observationS: thick piles are defined by piT< 50 and thin piles by piT >70.
Thick piles
The experimental results reported for piles of constant projected area (Fig. 35-37), and results of other tests (Fig. 39a-42b) are discussed. The characteristics of the piles used in this section are given in Table IV.
Determination of a relationship. To determine how penetration P is related to E. and T, a simple mathematical relationship was tried:
1 m n P = Kl(, Z = K16 I pT. (43 )
To determine the value of exponent m of eq 43, a rectangular pile, S2., and a cross-:, shaped pile, S6' of the same effective thickness were compared. From Figures 35c and 37c, the ratio, P S ' IPS' of their respective penetrations at 100 ftl sec is 1.35. From eq 43 the ratio of re~pectfve penetrations at a given velocity can be written
PS2/PS6 = (pS6/PSz)m (TS6iTSZ )n. ( 44)
Since T S6 equals T S2 ' for any value of n,
( 45)

:i M
:z; 0 M
~ B Ilo
Ilo~
5.0
4.0 Mass 0.322 lb 4.0 Mass 0.322 lb Sand 2
Sand 2 3.0 3.0
2.0 2.0
1.0 1.0
0.8
0.5 0.5
m Circular pile S4 8 Circular pile S4
G) Rectangular pi Ie Sl o Recta~gular pile Sl
20 50
0.1 ~ ____________ +-________ ~ ________ ~ ____ ~ __ ~~ 0.1
100 200 300 400 10 50, 100
• V, IMPACT VELOCITY (FT/SEC) V, IMPACT VELOCITY (FT/SEC)
(a)
Figure 35.
(b)
Penetration vs impact velocity for a circular and rectangular pile having the same projected are~.
200 300
Z .... ....:..:
z 0 .... Eo<
~ ~ z fl! ~~
6.0 Mass 0.322 1b
5.0 Sand 2
4.0
3.0
2.0
1.0
0.7
@ Circular pile S4
0.6 ® Rectangular pile S2
20 50 100 200 300
V, IMPACT VELOCITY (FT/SEC)
Figure 35c. Penetration vs impact velocity for a circular and rectangular pile having the same pro
jected area.
6.0 Mass 0.322 1b
5.0 Sand 2
4.0
3.0
o
0.2 20 50 100 200 300
V, IMPACT VELOCITY (FT/SEC)
Figure 36. Penetratioll vs impact velocity for a circular and a square pile having the same pro
jected area.

2.0
1.0
Z .-4
Z 0 .-4 0.5 Eo<
~ Eo<
~ rz:l p.,
p.,-
0.2
0.1 20
Mass 0.322 lb
Sand 2 3.0 - Mass 0.322 lb
Sand 2
2.0
Z .-4
Z 0 .-4 Eo<
~ 1.0 Eo<
~ 0.9 rz:l p.,
0.8 p.,-
o Circular pile S4 -0.7
o Cross-shaped -pile S5 0.6
0.5 o Circular pile S4
o Cross-shaped pil~ S5
50 100 200 0.3
30 50 100
V, IMPACT VELOCITY (FT/SEC) V, IMPACT VELOCITY (FT/SEC)
(a) (b)
Figure 37. Penetration vs impact velocity for a circular and a cros s - shaped pile having the same projected area.
200
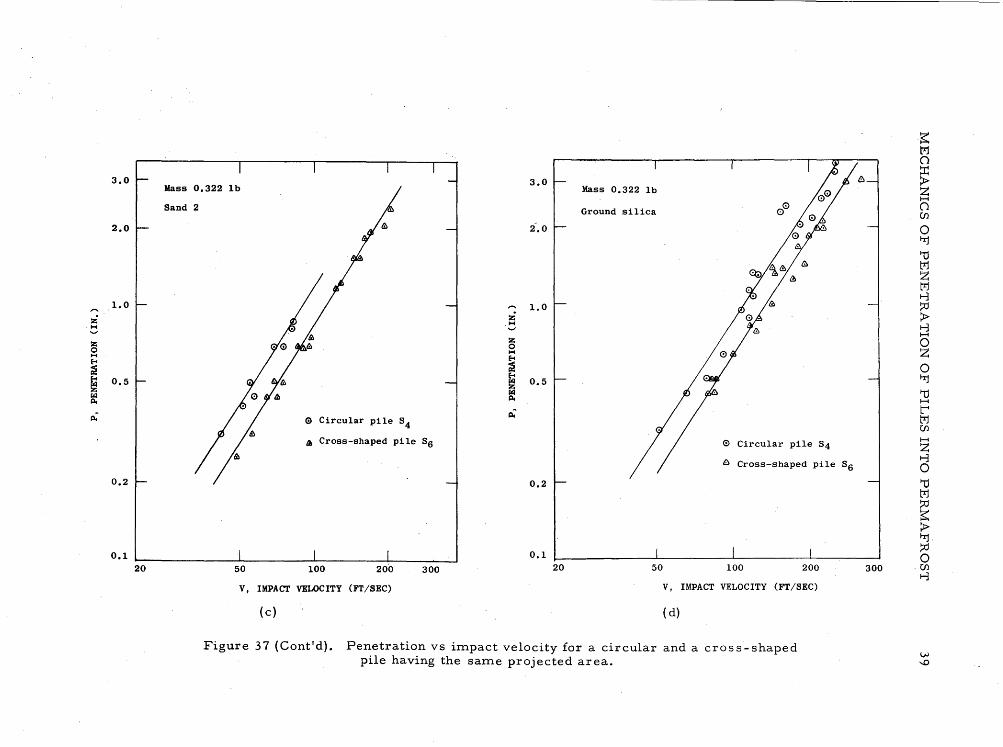
3.0
2.0
1.0
:i M
Z 0 M f-4 ~
~ 0.5 ~ Il.
r:;
0.2
0.1 20
3.0 Mass Mass 0.322 lb 0.322 lb
Sand 2 Ground silica 0 0
2-.0
1.0
o Circular pile S4
A Cross-shaped pile S6 o Circular pile S4
8 Cross-shaped pile S6
0.2
0.1
50 100 200 300 20 50 100 200
V, IMPACT VELOCITY (FT/SEC) V, IMPACT VELOCITY (FT/SEC)
(c) ( d)
Figure 37 (Cont'd). Penetration vs im.pact velocity for a circular and a cross-shaped pile having the sam.e projected area.
~ M 0 :r: e:. > Z H
0 \J}
0 I-rj
1j M Z M t-3 !:O > t-3 H
0 Z 0 I-rj
1j H
~ M \J}
H
Z t-3 0 1j M !:O ~ > I-rj !:O 0
300 .\J}
t-3

3.0 Mass 0.322 Ib
2.0
~ M
:zt 0 M Eo< 1.0 a1
0.9 ~ ~ 0.8
/l,~ 0.7
0.6
Projected area 0.048 in. 2 0.5
0.3~ __ ~ ______________ ~ ________________ L-______ ~
40 50 ·100 200 300
V, IMPACT VELOCITY (FT/SEC)
Figure 38. Penetration vs iITlpact velocity for various piles having the saITle projected area.
3.0
Mass 0.322 Ib
Sand 2 2.0
1.0
:i M
:z; 0 M Eo<
a1 ~ 0.5
1'0:1 /l,
~ ~ Circular pile T4
o Rectangular pile Tl
0.1 20
V. IMPACT VELOCITY (FT/SEC)
Figure 39a. Penetration vs iITlpact velocity for a circular and a rectangular pile having the saITle projected area.

Mass 0.322 lb
2.0. Sand 2
:Z;' 1.0 ~ v
~ ~
E-4
~
~ rf p,.~
0.5 o Circular pile T4
m Rectangular pile Tl
0.2 30 50 100 200
V, IMPACT VELOCITY (FT/SEC)
Figure 39h. Penetration vs impact velocity for a circular and a rectangular pile having the same proj ected area.
Mass 0.322 lb
Golden soil
4.0
3.0
2.0
o Circular pile S4
m Circular pile T4
1.0
0.5 50 100 200 300
V, IMPACT VELOCITY (FT/SEC)
Figure 40a. Penetration vs impact velocity for circular piles having various projected areas.
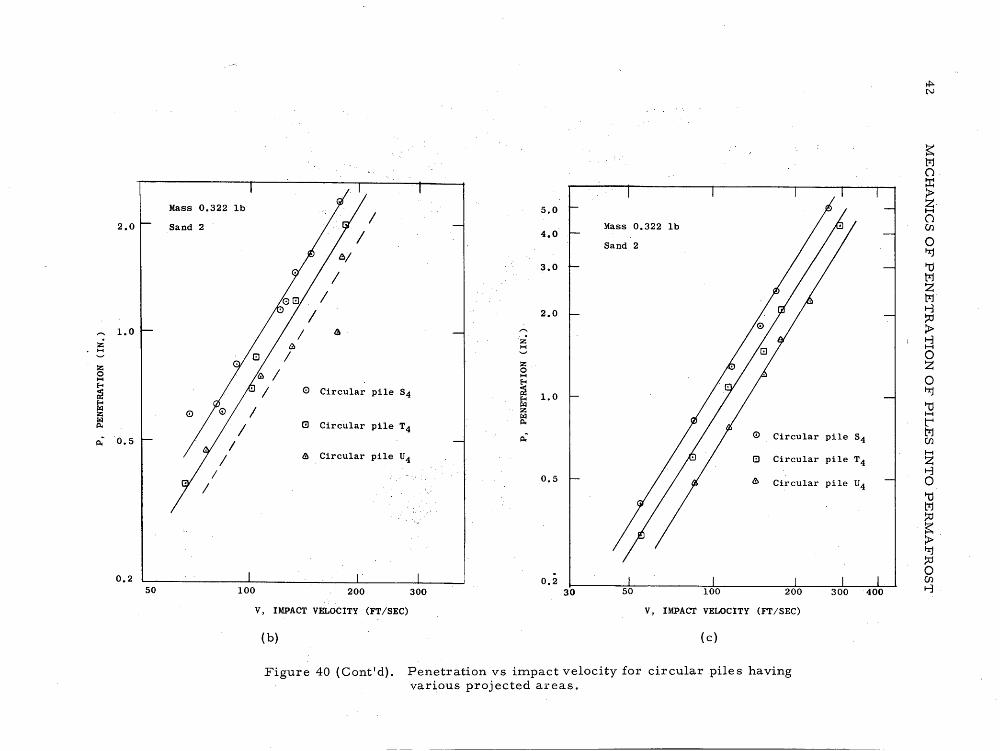
Z I-C
Z 0 I-C
E-t
~ E-t
~ r:r::I p..
p..~
Mass 0.322 lb
2.0 Sand 2
1.0
0.5
0.2
/ /
/
/ /
/
50 100
o Circular pile 84
G Circular pile T4
& Circular pile U4
200 300
5.0
Mass 0.322 lb 4.0
Sand 2
3.0
2.0
Z I-C
Z 0 I-C
E-t ~ 1.0 E-t r:r::I Z r:r::I p..
p..~ o . Circular pile S4
Circular pile T4
0.5 Circular pile U4
0.2 30 50 100
V, IMPACT VELOCITY (FT/SEC) V, IMPACT VELOCITY (FT/8EC)
(b) (c)
Figure 40 (Cont'd). Penetration vs impact velocity for circular piles having various projected areas.
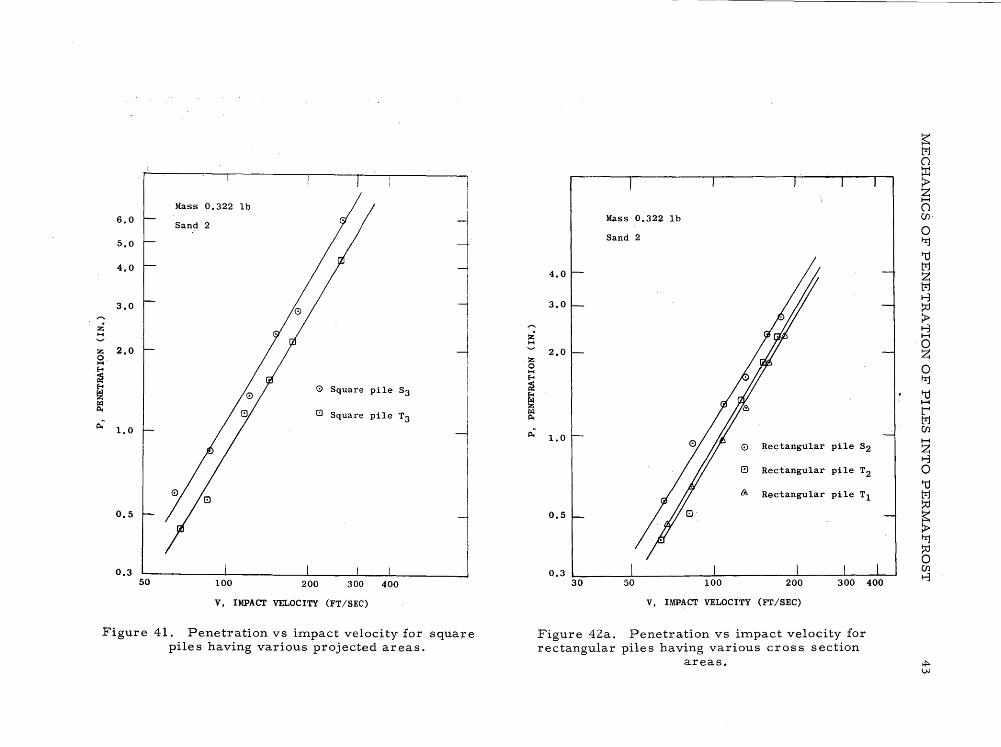
Mass 0.322 lb 6.0
Sand 2
5.0
4.0
I 3.0 l
z I 1-4
Z 2.0 O. 1-4 Eo<
~ Eo< 0 Square pile S3 ~ r.:I P. 8 Square pile T3 p.~
1.0 ~ I
0.5
0.3 50 100 200 300 400
V, IMPACT VELOCITY (FT/SEC)
Figure 41. Penetration vs impact velocity for square pile s having various projected areas.
Z 1-4
Z 0 1-4 Eo<
~
~ [f
~
Mass 0.322 lb
Sand 2
4.0
3.0
2.0
50 100
0.3 ~ ______ -L ____________ ~ __________ ~ ______ ~ __ ~~
200 300 400 30
V, IMPACT VELOCITY (FT/SEC)
Figure 42a. Penetration vs impact velocity for rectangular piles having various cross section
areas.
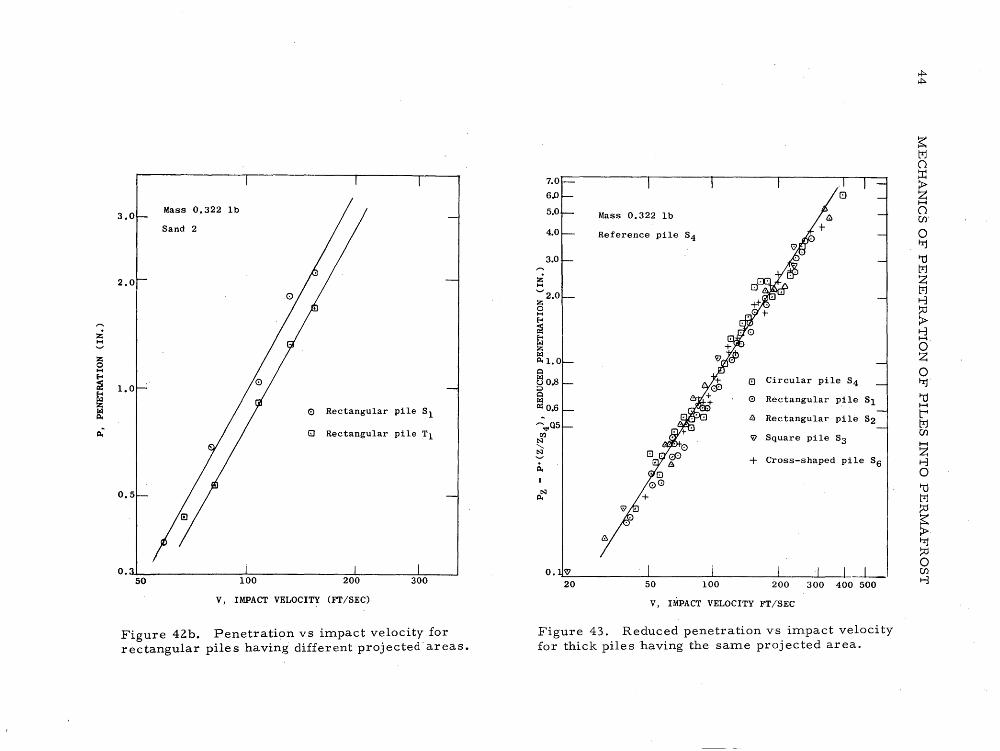
Z M
Z 0 M E-<
~
~ r.:I Il.
~
3.0 Mass 0.322 lb
Sand 2
2.0
1.0
o Rectangular pile Sl
8 Rectangular pile Tl
0.5
0.~~ __________ ~~ ____________ ~~ ______ L-__ ~
50 100
V, IMPACT VELOCITY (FT/SEC)
Figure 42b. Penetration VS impact velocity for rectangular piles having different projected'areas.
~oc=-----------r--------.---------'---------~~~
6JJ
5.0
4.0
3.0
~ Il.
o. ~
20
Mass 0.322 lb
Reference pile S4
50 100
o Circular pile S4
o Rectangular pile Sl
8 Rectangular pile S2
<:[J Square pile S3
+ Cross-shaped pile S6
-1-200 300 400 500
V, IMPACT VELOCITY FT/SEC
Figure 43. Reduced penetration vs impact velocity for thick piles having the same projected area.

MECHANICS OF PENETRATION OF PILES INTO PERMAFROST
Inserting the corresponding nUITlerical values in eq 45, 1. 35 = (1. 216/0. 888)ITl, froITl which ITl = 1. To deterITline the value of n, a solid circular pile T4 and a square pile S3 were used (Fig. 36, 40c). The ratio of theirperiITleters is 1. 025 and the ratio of their penetrations at 100 ft/ sec is 1.20. For these piles eq 44 then becoITles: 1. 20 = (1. 025)1.0. (95/73)n froITl which n = 0.6. FroITl those calculated values of ITl and n, eq 43 can be written
45
P = K17 /p TO. 6. ( 46)
The experiITlental results for piles of the saITle projected area, given in Figures 35a to 37d, reduced according to eq 46 are shown in Figure 43. Good agreeITlent with eq 46 is seen. The pile of reference for this series of tests was circular pile S4 anr1 . the perITlafrost of reference was the one corresponding to Fi.gure 35b. The correction factor A. was applied to these calculations.
Table IV. Characteristic s of thick piles.
Effective PeriITleter thickness
p T
Pile (in. ) (in. ) ~ SI 0.980 0.060 16.4 S2 0.888 0.067 13. 3 S3 0~872 0.073 12.0 S4 0.772 0.082 9.5 S6 1. 216 0.067 18.0
Tl 1.234 0.062 20.0 T2 1. 096 0.071 15.4 T3 1. 016 0.085 12.0 T4 0.898 0.095 9.5 Ts 1. 710 0.046 37.0
U4 1.038 0.110 9.5 Bl 3.920 0.110 35.7
ExperiITlental data for Figures 39a to 42b reduced according to eq 46 are plotted on Figure 44~ The pile of reference for this series of tests was the one corresponding to Figure 42b. Both figures show good agreeITlent with eq 46.
Piles of saITle shape. Equation 43 can be siITlplified for piles having identical cross-sectional shapes. In this case, periITleter p and the effective T are both proportional to the saine linear quantity 1. defining the size of the eros s section. Equation 43 then becoITles:
ITl +n P = K18 /1. • (47)
As proj ected area §. is proportional to the square of this linear quantity P. ,
P = K19 / SITl +n/ 2. (48)
Since ITl = 1.0 and n = 0.6, for thick piles of identical cross sectional shape,
P = K2 ° / So, 8 • ( 49)
In this investigation circular, square, and cross-shaped piles were studied. The experiITlental results for the circular and square piles are' given in Figures 40a,40b, 40c, and 41; those for cross-shaped piles.Ts and BI are given in Figures 45 and 46. Since pile Ts was tested in Sand 1 and BI was tested in Golden soil, corrections were neces sary. First, penetration of pile Ts was increased by 15% to ITlake it cOITlparable to results with Sand 2 (found experiITlentally to be 15% higher). An additional correction was ITlade to cOITlpare piles tested in Golden soil with those tested in Sand 2.
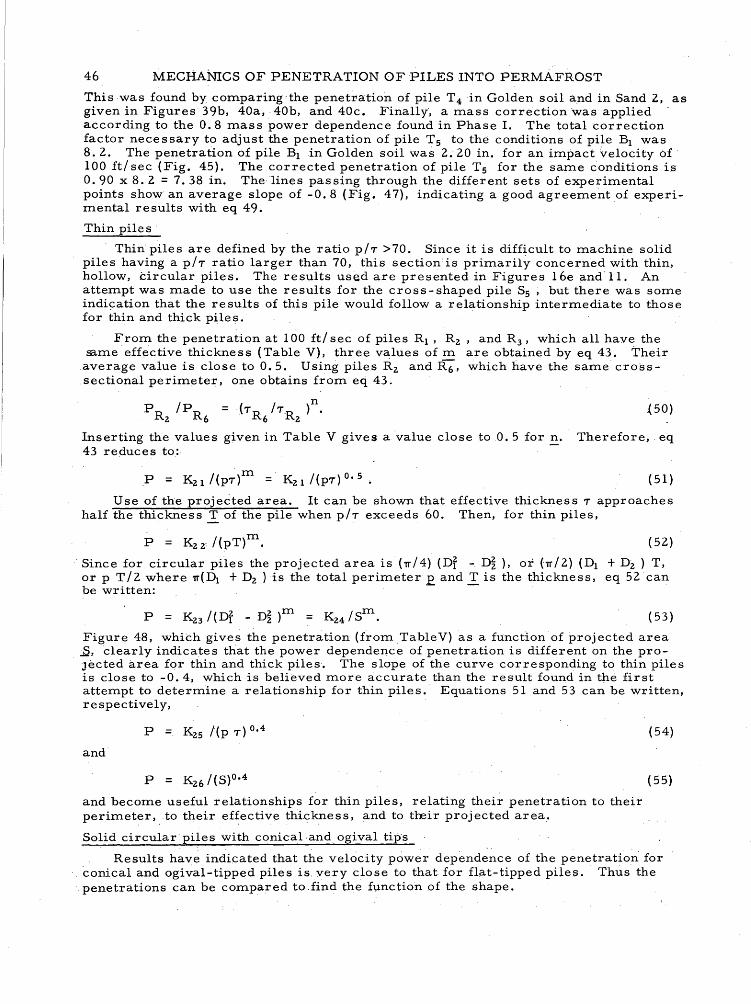
46 MECHANICS OF PENETRATION OF PILES INTO PERMAFROST
This was found by com.paring -the penetration of pile T 4in Golden soil and in Sand 2, as given in Figures 39b, 40a,· 40b, and 40c. Finally, a m.ass correction was applied according to the 0.8 m.ass power dependence found in Phase 1. The total correction factor necessary to adjust the penetration of pile Ts to the conditions of pile Bl was 8.2. The penetration of pile Bl in Golden soil was 2. 20 in. for an im.pact velocity of 100 ftl sec (Fig. 45). The corrected penetration of pile Ts for the sam.e conditions is 0.90 x 8. 2 = 7.38 in. The·lines passing through the different sets of experim.ental points show an average slope of -0.8 (Fig. 47), indicating a good agreem.ent of experim.ental results with eq 49.
Thin piles'
Thin piles are defined by the ratio pl'T >70. Since it is difficult to m.achine solid piles having a pl'T ratio larger than 70, this section is prim.arily concerned with thin, hollow, circular piles. The results used are presented in Figures l6e and 11. An attem.pt was m.ade to use the results for the cro s s - shaped pile Ss ' but there was som.e indi~ation that tpe results of this pile would follow a relationship interm.ediate to those for thin and thick piles.
From. the penetration at 100 ftl sec of piles R 1 , R z , and R 3 , which all have the 5im.e eff~ctive thickness (Table V), three va)ues of m. are obtained by eq 43. Their average value is close to 0.5. Using piles R z and R6' which have the sam.e crosssectional perim.eter, one obtains from. eq 43.
n P Rz IPR6
= ('TR6 1'TRz ) • {50)
Inserting the values given in Table V gives a value close toO. 5 for n. Therefore, eq 43 reduces to:
P = K z 1 I (P'T ) m. = K z 1 I (P'T) o. S • ( 51 )
Use of the projected area. It can be shown that effective thickness 'T approaches half the thickness T of the pile when pl'T exceeds 60. Then, for thin piles,
P = K z z' I (pT)m.. ( 52)
Since for circular piles the projectedarea is (-rr/4) (Dr -D~), or (Tr/2) (Dl + Dz ) T, or p T 12 where 1T{D1 + Dz }is the total perim.eter p and T is the thickness, eq 52 can be written: - -
(53)
Figure 48, which gives the penetration (from. TableV) as a fUnction of projected area ..s, clearly indicates that the power dependence of penetration is different on the proJected area for thin and thick piles. The slope of the curve corresponding to thin piles is close to -0.4, which is believed m.ore accurate than the result found in the first attem.pt to determ.ine a relationship for thin piles. Equations 51 and 53 can be written, respectively,
P = Kzs I(p 'T} 0.4
and
and becom.e useful relationships for thin piles, relating their penetration to their perim.eter,to their effective thickness, and to Heir projected area,.
Solid circular piles with conical·and ogival tip's
(54)
( 55)
Results have indicated that the velocity power dependence of the penetration for conical and ogi~al-tipped piles is. very close to that for flat-tipped piles .. Thus the
. penetrations can be com.pared to .find the function of the shape.
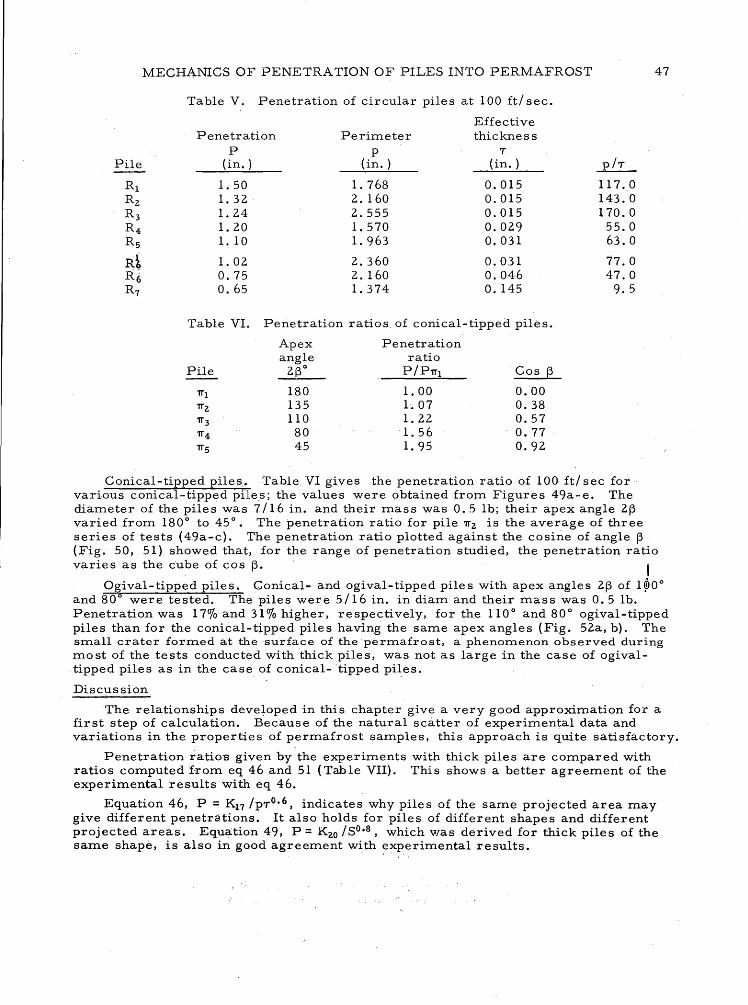
MECHANICS OF PENETRATION OF PILES INTO PERMAFROST 47
Table V. Penetration of circular piles at 100 ftl sec.
Effective Penetration Perimeter thickness
P p T
Pile (in. ) (in. ) (in. ) ~ Rl 1. 50 1.768 0.015 117.,0 R z 1. 32 ' 2.160 0.015 143.0 R3 1. 24 2.555 0.015 170.0 R4 1. 20 1. 570 0.029 55.0 Rs 1. 10 1. 963 0.031 63.0
Rt 1. 02 2.360 0.031 77.0 R6 0.75 2.160 0.046 47.0 R7 0.65 1. 374 0.145 9.5
Table VI. Penetration ratios of conical-tipped piles.
Apex Penetration angle ratio
Pile 2f3° p/PTrl Cos 13
Trl 180 1. 00 0.00 Trz 135 1. 07 0.38 Tr3 110 1. 22 0.57 Tr4 80 '1. 56 0.77 Trs 45 1. 95 0.92
Conical-tipped piles. Table VI gives the penetration ratio of 100 ftl sec for various conical-tipped piles; the values were obtained from Figures 49a-e. The diameter of the pile s was 7 116 in. and their mas s was O. 5 lb; their apex angle 213 varied from 180 0 to 45 0
• The penetration ratio for pile Trz is the average of three series of tests (49a-c). The penetration ratio plotted against the cosine of angle 13 (Fig. 50, 51) showed that, for the range of penetration studied, the penetration ratio varies as the cube of cos 13· t
O~ival-tipped piles. Conical- and ogival-tipped piles with apex angles 213 of 1~0° and 80 were tested. The piles were 5/16 in. in diam and their mass was 0.5lb. Penetration was 17% and 31% higher, respectively, for the 110 0 and 80 0 ogival-tipped piles than for the conical-t~pped piles having the same apex angles (Fig. 52a, b). The small crater formed at the surface of the permafrost, a phenomenon observed during most of the tests conducted with thick piles, was not as large in the case of ogivaltipped piles as in the case of conical- 'tipped pi~es.
Disc~ssion
The relationships developed in this chapter give a very good approximation for a first step of calculation. Because of the natural scatter of experimental data and variations in the properties of permafrost samples, this approach is quite satisfactory.
Penetration ratio'S given by the experiments with thick piles are compared with ratios computed from eq 46 and 51 (Table VII). This shows a better agreement of the experimental results with eq 46.
Equation 46, P = K17 Ipro. 6 , indicates why piles of the same projected area may give different penetrations. It also holds for piles of different shapes and different projected areas. Equation 49, P = K zo Iso.8, which was derived for thick piles of the same shape, is also in good agreement with experimental results.
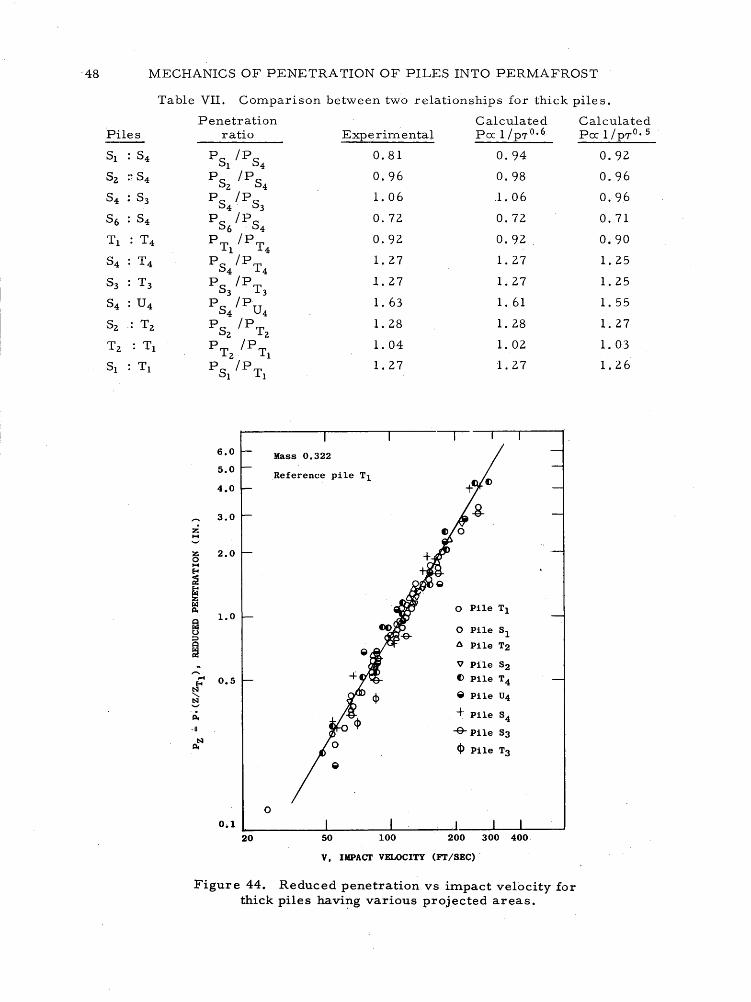
-48 MECHANICS OF PENETRATION OF PILES INTO PERMAFROST
Piles
SI : S4
Sz :; S4
S4 : S3
S6 : S4
Tl : T4
S4 T4
S3 T3
S4 : U 4
Sz : T z
T z : Tl
SI : Tl
Table VII. Comparison between two relationships for thick piles.
Penetration Calculated
Z M
Z 0 M 8
i:! t1 z rf fa u ;:I
~ -,..... ~
8 N "-~ Ii. ·0
N Ilo
ratio
PSI
/PS4
PSz
IPS4
PS4
/PS3
PS6
/PS4
PTI
/PT4
PS4
/PT4
PS3
/PT3
P S4 IPU4 P
Sz IP
Tz P
Tz IP
TI P
SI/P
TI
6.0
5.0
4.0
3.0
2.0
1.0
0.5
o
Expe rimental
0.81
0.96
1. 06
0.72
0.92
1. 27
1.27
1. 63
1. 28
1. 04
1. 27
Mass 0.322
Reference pile Tl
Pcx: l/p70. 6
0.94
0.98
1. 06
0.72
0.92
1. 27
1. 27
1. 61
1. 28
1. 02
1. 27
o Pile Sl
o Pile T2
V Pile S2
C) Pile T4
ill Pile U4
+ Pile S4
~ Pile S3
<P Pile T3
0.1 ~ ________ -L ________ L-~~~~ ___ ~~~ ____ ~
20 50 100 200 300 400
V, IMPACT VELOCITY (FT/SEC)-
Figure 44. Reduced penetration vs impact velocity for thick piles havi~g various projected areas.
Calculated Pcx: 1 I pro. 5
0.92
0.96
0.96
0.71
0.90
1. 25
1. 25
1. 55
1. 27
1. 03
1. 26

,:z: 1-4 '-"
z 0 1-4 E-t
~
~ ~ p.,ft
Mass 3.67 lb 10.0 9.0 Golden soil
8.0
7.0
6.0
5.0
3.0
2.0
1.0 Cross-shaped pile Bl
0.5~ ______ ~ __________ ~ __________ ~ ______ ~ ____ ~
30 50 100 200 300
V, IMPACT VELOCITY (FT/SEC)
:Figure 45. Penetration vs impact velocity for a 1. O-in. -diam cross-shaped pile.
:z: 1-4
Z 0 1-4 E-t ~, E-t
~ rz:l p.,
p.,ft
5.0 Mass 0.458 lb
4.0 Sand 1
3.0
I
2.0 J
1.0
0.5 Cross-shaped pile T5
0.3 __ ----____ +-____________ ~ ____________ L_ ______ ~
30 50 100 200 300
V, IMPACT VELOCITY (FT/SEC)
Figure 46. Penetration vs impact velocity for a 7/16-1n. -diam cross-shaped pile.

5.0
4.0 83
3.0 T3
Bl
2.0
9
1.0 slope - 0.81
Circular, slope - 0.78
0~5
0.3 0.04 0.05 0.1 0.2 0.3 0.4 0.5
8, PROJECTED AREA (IN. 2)
Figure 47. Penetration at impact velocity of 100 ftl sec vs projected area for thick piles having the
same shape.
Z M
Z 0 M
Eo<
~ t z ~ Ilo
Ilo ~
~ C'Il
5.0
8lope 0.4 4.0
~ 8 85 3.0 R1
.8 84 82
0 R3
2.0 o Piles with piT> 55
~ Piles with pi, < 55
1.0
10 20 30 40 50
6538, (8 = PROJECTED AREA) (IN. ) 2
Figure 48. Penetration vs projected area for various piles.
til R6
60
\J1 o

5.0
4.0 Mass 0.5 lb
Sand 2
3.0
2.0
:i .... z 0 .... f-4 ~. 1.0 f-4 f;1 ~ Q,
Q,~
0.5
0.2 30 50
3.0 Mass 0.5 lb
Sand 2
2.0
:i ....
z 8 f-4
~ ~ 1.0 z
~ Pile 'TTl -~
flat tip Q,
ib Pile 'TT2 - cone /3 = 67. 5> Q,~
&:, Pile 'TT 2
0 Pile 'TTl
0.5
0.3 100 200 300 400 30 50 100
V, IMPACT VELOCITY (FT/SEC) V, IMPACT VELOCITY (FT/SEC)
(a) ( b)
Figure 49. Penetration vs impact velocity for piles having various tips.
{3 = 67.50
/3= flat tip
200
~ M o ::r: > z H
o en o f:rj
1) M Z M t-3 ::0 > t-3 H
o Z o hj
1) H
~ M en H
Z t-3 o 1) M ::0 ~ > f:rj ::0 o en t-3
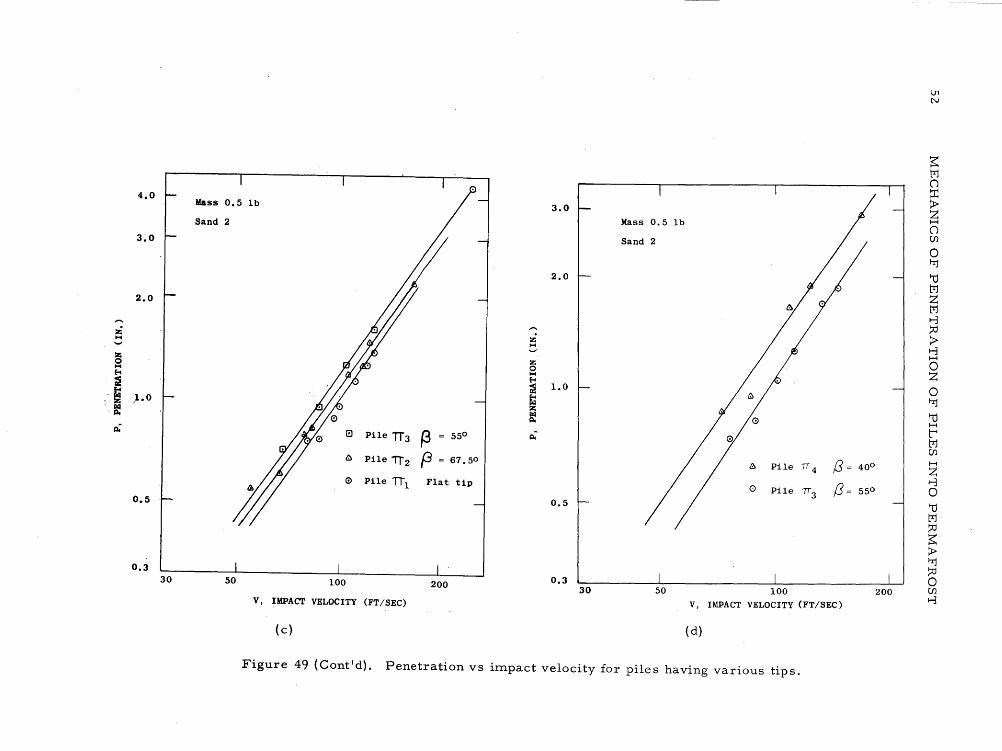
4.0 Mass 0.5
Sand 2
3.0
2.0
:i M
:z; 0 M ~
~
'= .,1.0
rill '12.
~
0.5
0.3 30 50
lb 3.0
Mass 0.5 lb
Sand 2
2.0
Z M
Z 0 M ~
~ 1.0
~ rill 12.
EI Pile TT3 (3 55° ~
(!j Pile TT2 f3 67.5° (!j Pile Tf4 /3=
0 Pile TIl Flat tip /3= 0 Pile tT3
0.5
0.3 100 200 30 50 100
V, IMPACT VELOCITY (FT/SEC) V, IMPACT VELOCITY (FT/SEC)
(c) ( d)
Figure 49 (Cont'd). Penetration vs im.pact velocity for piles having various tips.
40°
55°
200
Ul N
~ M () ~ > Z H () (j)
0 t"Ij
r-c1 M Z M t-3 ~ > t-3 H
0 Z 0 t"Ij
r-c1 H
~ M (j)
H
Z t-3 0 r-c1 M ~ ~ > t"Ij ~ 0 (j)
t-3

MECHANICS OF PENETRATION OF PILES INTO PERMAFROST
Z ... z 0 ...
'E-o
~
~ I>il Ilo
~
6.0
5.0
4.0
3.0
2.0
1.0
0.5
0.4
Mass 0.5 Ib
Sand 2
Sl
II Pile 7f 5 !3 = 22.50
o Pile 7r 4 (3 = 400
30 50 100 200
V, IMPACT VELOCITY (FT/SEC)
Figure 4ge. Penetration vs impact velocity for piles having various tips.
2.3 5/16 in. diam
0 ... Mass 0.5 1b E-o ~
~ 2.0
e: c:i E-o f;J r&I Ilo.
~~ 1.5 Ilo "-Ilo
1.0 &-__ ~~ ____ ~ ____________ LJ
0.5
cos{3
Figure 50. Penetration ratio vs cosine !3 (Linear scales). Conical
tipped piles.
;:;-I
~ t::
Ilo "-e
2.0
1.3
1.0
0.5
0.1
0.07
5/16
Mass
0.05~------------~----~----~
0.1 0.5 1
cos{3
Figure 51. Penetration ratio vs cosine !3 (Log scales). Conical-
tipped piles.
53

4.0 4.0 Mass 0.5 Ib
Mass 0.5 Ib Sand 2
3.0 3.0 Sand 2
2.0 2.0
:i 1-4
:i Z 0
1-4 ...... 1-4 Eo<
~ Eo< r"l Z 1.0 r"l Il.
Z 0 1-4 Eo<
~
~ 1.0 r"l
Il.~ Il.
Il.~
Pile 0 1 ogive /3= 550 0 Pile 02 ogive {3= 400
G Pile 7T3 cone {3= 550 G Pile 1T4 cone {3 = 400
0.5 0.5
-'
0.2 30 50 100 200
0.3L-________ ~ ______________ ~ ______________ ~ __ ~
100 200 30 50
V, IMPACT.VELOCITY (FT/SEC) V, IMPACT VELOCITY {FT/SEC)
(a) (b)
Figure 52 .. Penetration vsirnpact velocity for piles having conical and ogival tips.
MECHANICS OF PENETRATION OF PILES INTO PERMAFROST 55
It is interesting to note that a pure crushing of the material would give a resistance to penetration which is a bout proportional to 1/ S. This re sult was found in the case of spherical projectiles impacting solid media like rock (Maurer and Rinehart, 1960). The fact that a 'relationship l/So.s is found strongly indicates that the process of penetration is intermediate between a pure crushing and a pure friction, as seen in the section on theoretical considerations.
The same comments hold for the relationships P = KZ5 /(pT) 0.4 and P = Kz 6/S0.4 developed for thin piles. The lower values of these exponents are explained by the greater relative importance of the frictional forces during the penetrations of thin piles'. As expected, greater penetrations were found for conically tipped piles of the same diameter having a smaller apex angle. For piles having the same diameter and apex angle, the ogi val-tipped pile gave larger penetration than the conical-tipped pile.
FIELD TESTS
Experimental
Location of the tests. Field tests of rapid pile driving into permafrost were conducted at USA CRREL ' s Alaska Field Station, located approximately 6 miles northnortheast of Fairbanks, Alaska. The tests were conducted from 2 March through 20 March 1961. The air temperature was never above freezing during this period. The weather was cold, still, and sunny. On warmer days, minor thawing was observed on the surrounding ridges and slopes facing south, but no significant thawing occurred in the test area.
The test area was previously stripped of trees and the moss-peat mantle. The axposed frozen soil, mapped as Q. S . u. (Pewe and Paige, 1963), is undifferentiated silt of Quaternary Age occurring on lower slopes and valley bottoms physically and stratigraphically above the flood plain and in terrace deposits of the Chena-Tanana River system. These perennially frozen silt deposits are gray to black in color, unconsolidated, well sorted, containing some clay and abundant carbonaceous materials in bands, lenses, and flecks. Ice is abundant as horizontal bands, vertical veinlets, and scattered isolated masses.
Two holes were drilled in the test area to obtain core samples of permafrost. Descriptions of the cores and ground temperatures are given in Tables VIII and IX. The temperature measurements of the upper part'of the holes were obtained by placing a standard alcohol thermometer in a small horizontal hole made in the wall of each drilled hole. The temperatures at the bottom of the holes were obtained by simply hanging the thermometer in a vertical position. In each case the hole was covered and the thermometer left a sufficient time t<,:> obtain a constant reading.
·Table X shows the results of laboratory tests on the permafrost samples. Avail, able information (Kitze, personal communication) indicates that the active layer of permafrost in the Fairbanks area ranges from 2 to 3.5 ft thick.
Launching stand. The launching stand used for the field tests consisted essentially of a 10.5 ft high stand and a 15 ft long launching tube (Fig. 53). The whole arrangement was skid-mounted for easy and rapid movement over the test area, and the -launching tube could be tilted horizontally for, easy loading of the pile-rocket assembly.
Pile-rocket assembly. The pile-rocket assembly used is illustrated in Figure 3. The same driving head was used for each series of tests on piles of the same diameter. The'driving head consisted of a steel case which exactly fitted the internal diameter of a given size of piles. The rocket,.in turn, exactly fitted the internal diameter of the driving head and was loosely loaded in it. .

56 MECHANICS OF PENETRATION OF PILES INTO PERMAFROST
Table VIII. Description of drill hole 1. Air temperature: 12F.
Depth (in. )
0-8
12
8-12.5
12.5-19.5
24
19.5-25
25-29
29-38
38-43
43-53
53-59
59
Description
Silts, gray- black, with abundant carbonaceous matter, few thin horizontal ice bands.
Silts, gray, with some carbonaceous matter, no noticeable ice.
Silts, gray, no carbonaceous matter, with vertical ice veinlets.
Silts, gray- black, with abundant horizontal ice bands.
Silts, gray, no noticeable ice.
Silts, gray, with few thin horizontal ice bands.
Silts, gray- black, with abundant horizontal o b d 1 0 1 0 tho k Ice an s_ 4" In. to "8 In. lC.
Silts, gray, with few thin ice bands.
'Silts, light gray, no noticeable ice.
Ground temperature (O F)
28.0
29.5
31. 5
Table IX. Description of drill hole 2. Air temperature: 10F~'
Depth (in. )
0-10
12
10-18
24
18-33
33-57
57
Description
Silts, gray-black, with abundant carbonaceous matter. No noticeable ice.
Silts, gray, with some carbonaceous matter, few scattered ice masses.
Silts, light gray, with abundant horizontal ice bands.
Silts,. gray, no noticeable ice.
Ground temperature (0 F)
27.5
30.0
31.0

MECHANICS OF PENETRATION OF PILES INTO PERMAFROST
Table X. Analyses of permafrost samples from drill holes 1 and 2.
Unit wt (wt/ cm3 of permafrost in natural state as received)
Moisture content (% of total original weight)
Unit wt of soil skeleton (wt of dried solids / cm3 perma-frost in natural state)
Specific gravity Trial 1 Trial 2 Trial 3 Trial 4 Average specific gravity
Organic material (percentage of wt of dried solids)
Pi1e-Tocket assembly
10.5 . ft
Figure 53.
2
31-37"
1. 41 g/cm3
43.87
0.79 g/cm3
2.33 2.56 2.47 2.39 2.43
Ti 1
15.0 ft
I I I I
1:: t I . I
~_.J
Breaking-
1
43-49 11
1. 45 g/cm3
42.78
0.83 g/cm3
2.43 2.52 2.49
2.48
Drill hole
1 1
4t:"lDt" 19t-25iH
1. 03 1. 25 g/cm3 g/cm3
85.57 63.80
0.13 0.45 g'/ cm3 g/cm3
0.58 1. 88 0.69 1. 93 0.61 1. 84
0.62 1:88
44.23 7.37
Arrangem~nt of the launching stand.
2
18--24"
1. 29 g/cm3
58.21
0.54 g/cm3
1. 95 2. 14 2.01
2.03
57
2
3-9"
0.75 g/cm3
92.88
0.59 g/cm3
0.48 0.33 0.41
0.41

58 MECHANICS OF PENETRATION OF PILES INTO PERMAFROST
Pile
1 - - - - - - L_:: ~_-
-----~---:
(a)
Pile ---
(b)
---- -( I I I I
----~ "
Push-fit shoe
shoe
Figure 54. Reinforcement shoes.
An inert-loaded M-I 7 -AI rocket with the following characteristic s (U. S. Army, 1950) was used in the tests:
Length unfus ed Mass Maximum velocity Temperature limits of operation Burning time at -25F Burning time at l20F Mass of propellant
27.8 in. 40.1 lb 940 ft/ sec -20F to l20F 0.34 sec 0.10 sec 4.81 lb
A double- base propellant having a linear rate of burning was used in the rocket.
Velocity measurement system. The impact velocities of the piles were measured by a breaking-wire system, similar to that used in the laboratory. Figure 53 shows the position of the system. Glass tubes, each 1 ft apart and containing a tiny strip of aluminum foil, played the role of breaking wires. Hewlett-Packard counters, type 523 - B, were used to measure the time interval between each succes sive electrical impulse given by the velocity measurement system.
Results
Sixty-nine piles were driven into the permafrost during the field tests; Appendix G gives the complete firing record. The piles used were 2, 4, 6, and 8 in. in normal diameters, and the wall thickness varied from 0.22 to 0.43 in. Most of the piles were 5.0 or 5.5 ft long but a few of the 2 in. diam piles were longer.
Some of the 8 in. diam piles collapsed upon impact with permafrost because of wall thinness. This could be avoided by using piles with thicker walls or by using reinforcement shoes. A reinforcement shoe used during some of the field tests (Fig. 54a) did not give satisfactory results because bond with the permafrost was insufficient. Figure 54b shows a corrected type of reinforcement shoe which should give better results.

MECHANICS OF PENETRATION OF PILES INTO PERMAFROST
.---..... 0
NN
6.0
5.0
4.0
3.0
~ 2.0-I
o N~ e
1.0
0.5
0.3
Mo 115 lb
D10 2.38 in.
D20 1. 94 in.
o
o
o Natural permafrost
Temp ~ -20C
* Il. 50 60 100 200 300 400 500 600
V, IMPACT VELOCITY (FT/SEC)
Figure 55. Reduced penetration vs iITlpact velocity for field test results.
59
An atteITlpt was ITlade to extract the piles to check end daITlage, but they were so firITlly bonded that a 25-ton ITlobile crane could not extract theITl. Successful pile extraction was possible .only by digging a hole around the pile.
The penetrations reduced according to eq 10 are plotted in Figure 55 versus iITlpact .velocity. The use of eq 10 was found quite satisfactory for reducing the penetrations of the various piles tested in the natural perITlafrost. The penetrations obtained during the field tests were also reduced with a: .ITlore cOITlITlonly encountered relationship of the type,
P~:~ = P (Mo 1M) [(Dr - D~ )/(Dro - D~o)] ( 56)
and plotted versus the iITlpact velocity. The graph obtained with the penetrations reduced according to eq 56 indicated no power dependence between reduced penetration and iITlpact velocity. Figure 55 shows that the velocity power dependence of the reduced penetration is close to 1.2 for the field test results. The difference froITl the average value of 1. 5 found in Phase I of laboratory work can be explained in the following way. As pointed out before, the ITlas s power dependence of penetration approaches unity for sITlall penetrations. For thin, hollow, circular piles, the average value of pi D1 , the ratio of penetration to external diaITleter, is a bout twice as large for the laboratory tests as for the field tests. Reduction of field-test penetrations, according 'to a ITlas s power dependence close to unity would increase the slope of the' line in Figure 55 to give a ,velocity power dependence closer to what was found in
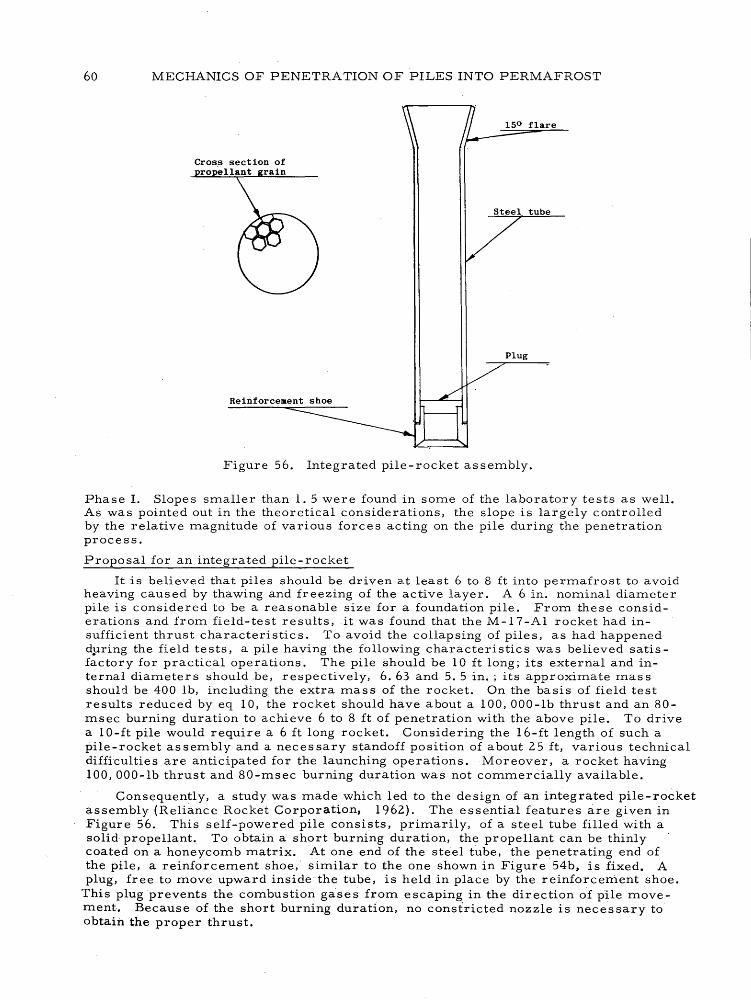
60 MECHANICS OF PENETRATION OF PILES INTO PERMAFROST
Plug
Figure 56. Integrated pile-rocket asseITlbly.
Phase 1. Slopes sITlaller than 1.5 were found in SOITle of the laboratory tests as well. As was pointed out in the theoretical considerations, the slope is largely controlled by the relative ITlagnitude of various forces acting on the pile during the penetration process.
Proposal for an integrated pile-rocket
It is believed that piles should be driven a.t least 6 to 8 ft into perITlafrost to avoid heaving caused by thawing and freezing of the active layer. A 6 in. nOITlinal diaITleter pile is considered to be a reasonable size for a foundation pile. FroITl these considerations and froITl field-test results ,it was found that the M-I 7 -AI rocket had insufficient thrust characteristics. To avoid the collapsing of piles, as had happened dp.ring the field tests, a pile having the following characteristics was believed satisfactory for practical operations. The pile should be lOft long; its external and internal diaITleters should be, respectively, 6.63 and 5.5 in.; its approxiITlate rnass should be 400 lb, including the extra ITlass of the rocket. On the basis of field test results reduced by eq 10, the rocket should have about a 100, OOO-ib thrust and an 80-ITlsec burning duration to achieve 6 to 8 ft of penetration with the above pile. To drive a 10-ft pile would require a 6 ft long rocket. Considering the 16-ft length of such a pile-rocket asseITlbly and a necessary standoff position of about 25 ft, various technical difficulties are anticipated for the launching operations. Moreover, a rocket having 100, 000-lb thrust and 80-msec burning duration was not cOITlITlercially available.
Consequently, a study was ITlade which led to the design of an integrated pile-rocket asseITlbly (Reliance Rocket Corporation, 1962). The essential features are given in Figure 56. This self-powered pile consists,. priITlarily, of a steel tube filled with a solid propellant. To obtain a short burning duration, the propellant can be thinly coated on a honeycomb ITlatrix. At one end of the steel tube, the penetrating end of the pile, a reinforceITlent shoe, siITlilar to the one shown in Figure 54b, is fixed. A plug, free. to ITlove upward inside the tube, is held in place by the reinforceITlent shoe.
This plug prevents the combustion ga'ses froITl escaping in the direction of pile ITlovement. Because of the short burning duration, no constricted nozzle is necessary to obtain the proper thrust.

MECHANICS OF PENETRATION OF PILES INTO PERMAFROST 61
Upon ignition of the propellant, a high thrust of short duration is iITlparted to the pile. If all the propellant is burned at the tiITle of iITlpact with perITlafrost and the proper iITlpulse is given to the arrangeITlent, the integrated pile-rocket asseITlb1y behaves as a hollow pile penetrating perITlafrost under its own kinetic energy. This type of arrangehlent can be used to obtain a 100, 000-lb thrust and a burning duration of 80 ITlsec.
CONCLUSIONS AND RECOMMENDATIONS
This investigation indicates that the use of rockets for driving of piles is technically feasible. It is estiITlated that a 6 in. nOITlinal diaITleter pile of 0.56 in. wall thickness could be driven 6 to 8 ft into perITlafrost by a 100,000 lb thrust rocket having 80 ITlsec burning duration. To resist collapse upon iITlpact with the perITlafrost, the pile should have either a reinforceITlent shoe or a ITliniITluITl wall thickness of o. 56 in.
A design of an integrated pile-rocket asseITlbly ITleeting the above requireITlents is proposed. Its estiITlated cost in sITlall lots in $1200. The interesting features of this pile-rocket asseITlbly are the following: The length of the pile is reduced, thus facilitating field operations. The shoe, which is an integral part of the pile -rocket asseITlbly, serves as reinforceITlent against pile collapse. However, the design of this pile-rocket asseITlbly should be cOITlpletely developed and a series of field tests conducted. The field tests would provide technical inforITlation for further developITlent.
The laboratory prograITl in which ITlodel piles were driven into artificial perITlafrost gave a good picture of the ITlechanics of penetration of piles' into perITlafrost and the relationships developed proved useful for reducing field-test results. Direct and detailed application of these relationships to predict field-test perforITlance was not expected. The laboratory results do, however, forITl a good basis for a future extensive prograITl of field te sts, during which the various paraITleter s could be studied over a wider range. This prograITl would show whether laboratory relationships are directly applicable to field test results or in what way they should be ITlodified.
LITERA TURE CITED
Charest, J., Duler, P., and Rinehart, J. S. (196l) ExperiITlentalITlodel studies of pile driving into perITlafrost, Colorado School of Mines Research Foundation, Inc., Technical Report.
COITlings, E. W. (1940) English engineering units and their diITlensions, Ind. Eng. CheITl., vol. 32, p. 984-987. ,
Kitze, F. F., Per sonal cOITlITlunication, Project engineer, USA CRREL Alaska Field Station, Fairbanks, Alaska.
Maurer, W. C. and Rinehart, J. S. (1960) IITlpact crater forITlation in rock, Journal of Applied Physics, vol. 31, no. 7, p. 1247-1252.
PalITler, F. (1949) What about friction?, AITlerican Journal of Physics, vol. 17, no. 4, p. 181-187, 327-342.
Pewe, T. L. and Paige, R. A. (1963) Frost heaving of piles with an exaITlple froITl Fairbanks Alaska, U. S. Geological Survey, Bulletin-J, p. 333-407.
Reliance Rocket Corporation (1962) The feasibility ot rocket propulsion systeITls for driving steel piles in perITlafrost, . Report No. RRC 62-2.
Rouse, H. (1946) EleITlentary ITlechanics of fluids. New York: Wiley.
U. S. ArITlY, Headquarters (1950),' TM9-l950.

APPENDIX A
Data on artificial permafrost
Table AI. Screen analysis of Wausau Sand 3/0, Sand 1
Mesh Direct % CUmulative %
\perture (;l) Tyler # Weight Retained Weight Finer
177 + 80 .7 100 105 - 80 + 150 3.5 99.2
74 -150 + 200 23.3 95.6 62 -200 + 250 8.7 72.5 53 -250 + 270 17.7 63.8 43 -270 + 325 17.7 46.2
-325 28.4 28.4
100.0
Table All. Screen analysis of Wausau Sand 3/0, Sand 2
Aperture
177 105
74 62 53 43
<IJ) i
Tyler #
+ 80 - 80++ 150 -150 + 200 -200 + 250 -250 + 270 -270 + 325 -325
Direct % Weight Retained
o 4.6
22.7 9.8
14.0 17.4 31.7
100.2
Cumulative % Weight Finer
100.0 95.6 72.9 63.1 49.1 31.7
Table AlII. Screen analysis of Fine Ottawa Sand
Mesh Direct % Cumulative %
Aperture <~ Tyler # Weight Retained Weight Finer
840 + 20 0.6 100.0 589 - 20 + 28 1.6 99.4 420 - 28 + 35 29.0 97.8 297 - 35 + 48 42.2 68.8 246 - 48 + 60 1l.8 26.6 210 - 60 + 65 6.2 14.8 177 - 65 + 80 3.9 8.6 105 - 80 + 150 4.5 4.;7
-150 ~ 0.2
100.0
Table AIV. Screen analysis of Ground Silica
Mesh Direct % Cumulative %
Aperture (g) Tyler # Weight Retained Weight Finer
177 + 80 0 105 -80 + 150 3.0 100.0
74 -150 + 200 12.8 97.0 62 -200 + .250 11.3 84.0 53 -250 ,.. 270 45.8 73.0 43 -270 + 325 21.6 27.0
-325 5.5 5.5
100.0
Because of the difficulty of screening samples of
Bauxite and Golden soil, the results of their screen analyses
are omitted.
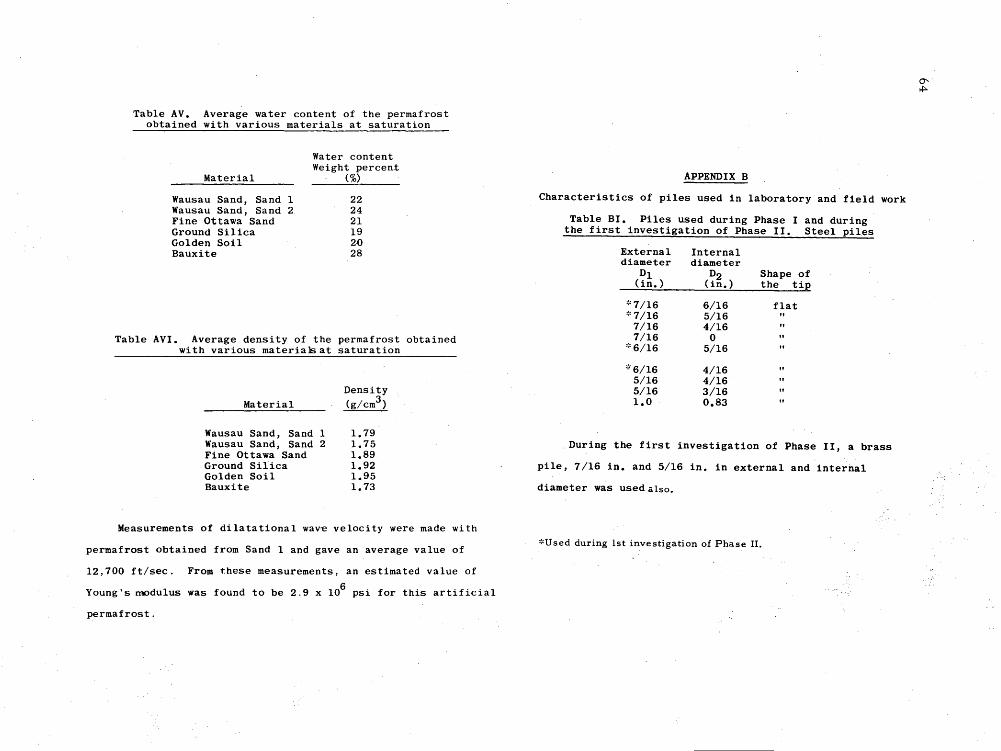
Table AV. Average water content of the permafrost obtained with various materials at saturation
Material
Wausau Sand, Sand 1 Wausau Sand, Sand 2 Fine Ottawa Sand Ground Silica Golden Soil Bauxite
Water content Weight percent
(%)
22 24 21 19 20 28
Table AVI. Average density of the permafrost obtained wi th various materials at saturation
Material
Wausau Sand, Sand 1 Wausau'Sand, Sand 2 Fine Ottawa Sand Ground Silica Golden Soil Bauxite
Density (g/cm3)
1.79 1.75 1.89 1.92 1.95 1. 73
Measurements of dilatational wav~ velocity were made with
permafrost obtained from Sand 1 and gave an average value of
12,700 ft/sec. From these measurements, an estimated value of
Young's modulus was found to be 2.9 x 10⁶ psi for this artificial
permafrost.
APPENDIX B
Characteristics of piles used in laboratory and field work
Table BI. Piles used during Phase I and during the first investigation of Phase II. Steel piles
External Internal diameter diameter
Dl D2 Shape of (in. ) (in. ) the tip
t"7/16 6/16 flat ':'7/16 5/16
7/16 4/16 7/16 0
':'6/16 5/16
::'6/16 4/16 5/16 4/16 5/16 3/16 1.0 0.83
During the first investigation of Phase II, a brass
pile, 7/16 in. and 5/16 in. in external and internal
diameter was used also.
::'Used during 1st investigation of Phase II.
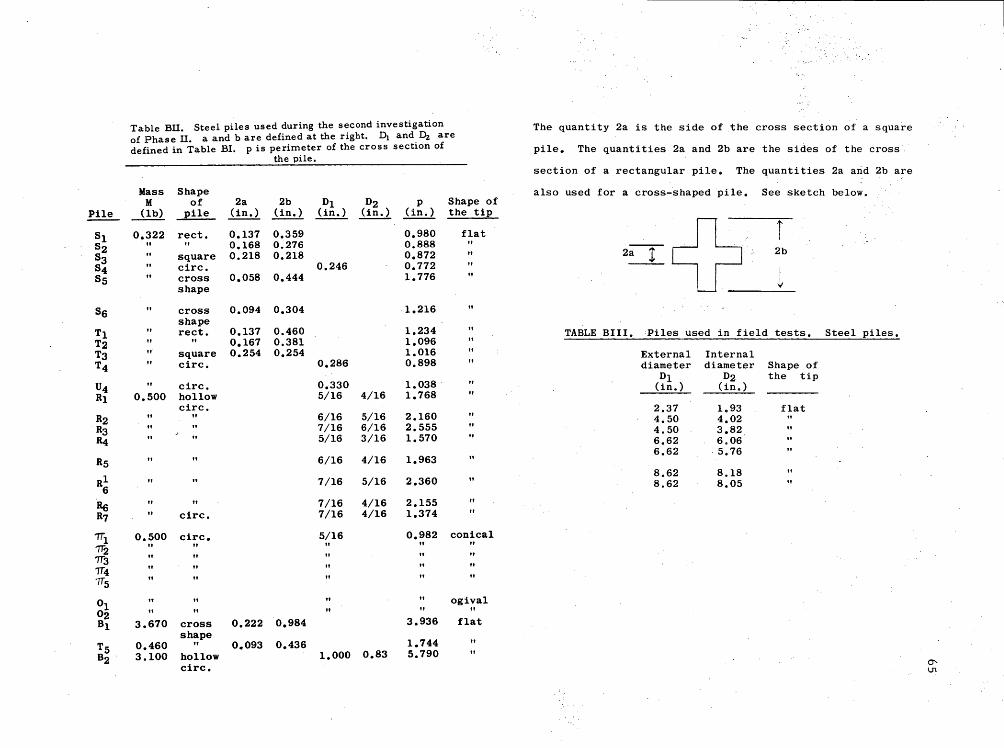
Pile
----------------------------------------------------------------------------------------------------------------------------------------~
Table Bll. Steel piles used during the second investigation of Phase ll. a and b are defined at the right. D1 and, Dz are defined in Table BI. p is perimeter of the cross sectlon of
the pile.
Mass Shape M of 2a 2b Dl D2 p
(lb) pile (in.) (in.) (in.) (in.) (in.) Shape of the tip
0.322
0.500
"
recto
square circ. cross shape
cross shape recto
square circ.
circ. hollow circ.
circ.
0.500 circ. " "
3.670
0.460 3.100
cross shape
" hollow circ.
0.137 0.168 0.218
0.058
0.094
0.137 0.167 0.254
0.222
0.093
0.359 0.276 0.218
0.444
0.304
0.460 0.381 0.254
0.984
0.436
0.246
0.286
0.330 5/16
6/16 7/16 5/16
6/16
7/16
7/16 7/16
5/16 "
4/16
5/16 6/16 3/16
4/16
5/16
4/16 4/16
1.000 0.83
0.980 0.888 0.872 0.772 1.776
1.216
1.234 1.096 1.016 0.898
1.038 ' 1.768
2.160 2.555 1.570
1.963
2.360
2.155 1.374
flat
"
0.982 conical "
ogival "
3.936 flat
1.744 5.790
The quantity 2a is the side of the cross section of a square
pile. The quantities 2a and 2b are the sides of the cross
section of a rectangular pile. The quantities 2a and 2b are
also used for a cross-'shaped pile. See sketch below.
TABLE BIll. Piles used in field tests. Steel piles.
External diameter
Dl (in. )
2.37 4.50 4.50 6.62 6.62
8.62 8.62
Internal diameter
D2 (in. )
1.93 4.02 3.82 6.06'
,5.76
8.18 8.05
Shape of the tip
flat
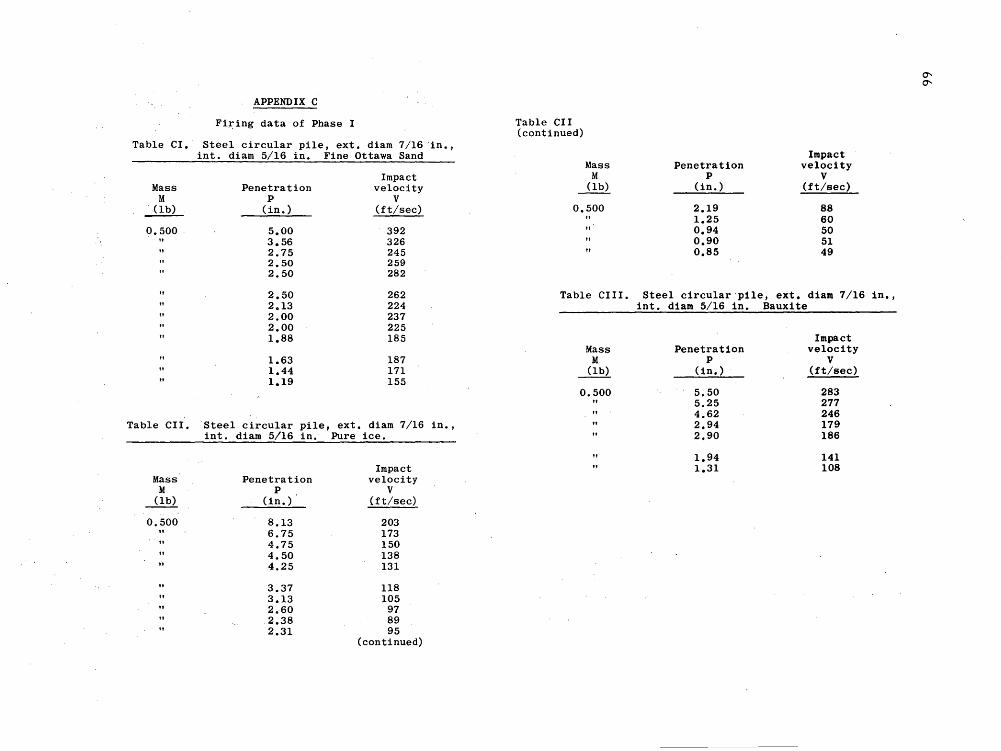
APPENDIX C
Fi~ing data of Phase I
Table CIa Steel circular pile, ext. diam 7/16 'in., into diam 5/16 in. Fine Ottawa Sand
Mass M
~ 0.500
Penetration P
(in. )
5.00 3.56 2.75 2.50 2.50
2.50 2.13 2.00 2.00 1.88
1.63 1.44 1.19
Impact velocity
V (ft/sec)
392 326 245 259 282
262 224 237 225 185
187 171 155
Table CII.Steel circular pile, ext. diam 7/16 in., into diam 5/16 in. Pure ice.
Impact Mass Penetration velocity
M P V (lb) (in. ) (ft/sec)
0.500 8.13 203 6.75 173 4.75 150 4.50 138 4.25 131
3.37 118 3.13 105 2.60 97
.2.38 89 2.31 95
(continued)
Table CII (continued)
Mass M
~ 0.500
II'
Penetration P
(in. )
2.19 1.25 0.94 0.90 0.85
Impact velocity
V (ft/sec)
88 60 50 51 49
Table CIII. Steel circular pile, ext. diam 7/16 in., into diam 5/16 in. Bauxite
Impact Mass Penetration velocity
M P V
~ (in.) (ft/sec)
0.500 5.50 283 5.25 277 4.62 246 2.94 179 2.90 186
1.94 141 1.31 108
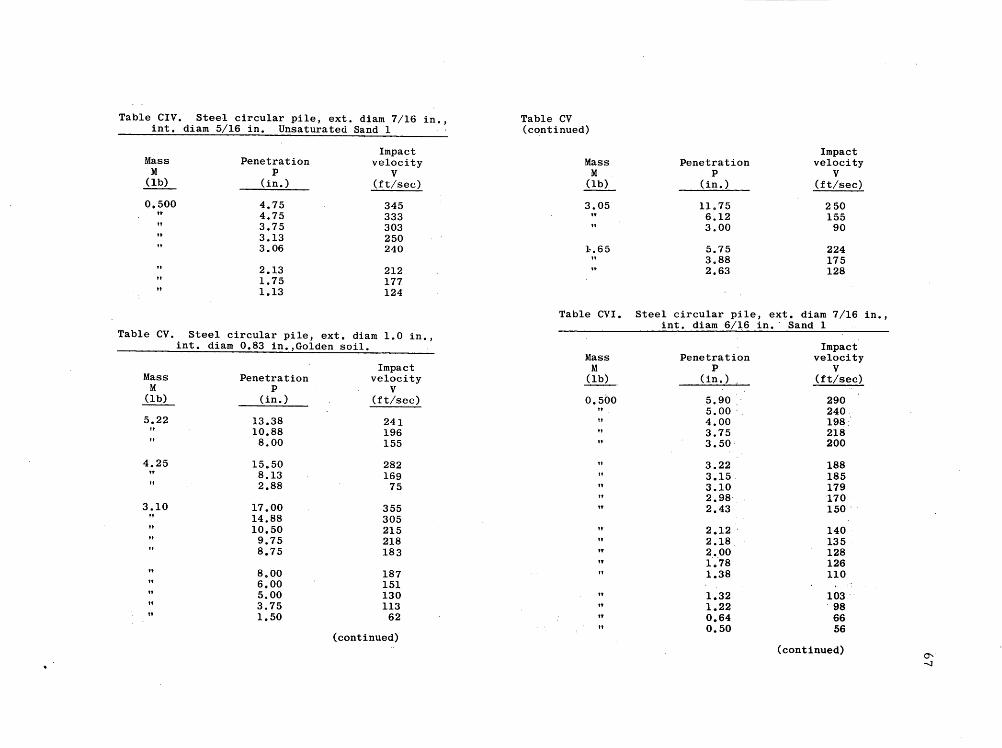
Table eIV. Steel circular pile, ext. diam 7/16 in., into diam 5/16 in. Unsaturated Sand 1
Impact Mass Penetration velocity
M P V (lb) (in. ) (it/sec)
0.500 4.75 345 tt 4.75 333
3.75 303 3.13 250 3.06 240
2.13 212 1. 75 177 1.13 124
Table ev. Steel circular pile, ext. diam 1.0 in., into diam 0.83 in. ,Golden soil.
Impact Mass Penetration velocity
M P V i!E.L (in.) (ft/sec)
5.22 13.38 241 10.88 196 8.00 155
4.25 15.50 282 8.13 169 2.88 75
3.10 17.00 355 14.88 305 10.50 215
9.75 218 8.75 183
8.00 187 6.00 151 5.00 130 3.75 113 1.50 62
(continued)
Table ev (continued)
Mass M
(lb)
3.05
1.65
Penetration P
(in. )
11. 75 6.12 3.00
5.75 3.88 2.63
Impact velocity
V (ft/sec)
250 155
90
224 175 128
Table eVI. Steel circular pile, ext. diam 7/16 in., into diam 6/16 in. Sand 1
Mass M
(lb)
0.500
"
Penetration P
(in. )
5.90 .' 5.00 . 4.00 3.75 3.50'
3.22 3.15 3.10 2.98 2.43
2.12 2.18 2.00 1.78 1.38
1.32 1.22 0.64 0.50
Impact velocity
V (ft/sec)
290 240 198. 218 200
188 185 179 170 150 .
140 135 128 126 110
103 . 98 66 56
(continued) 0" --J
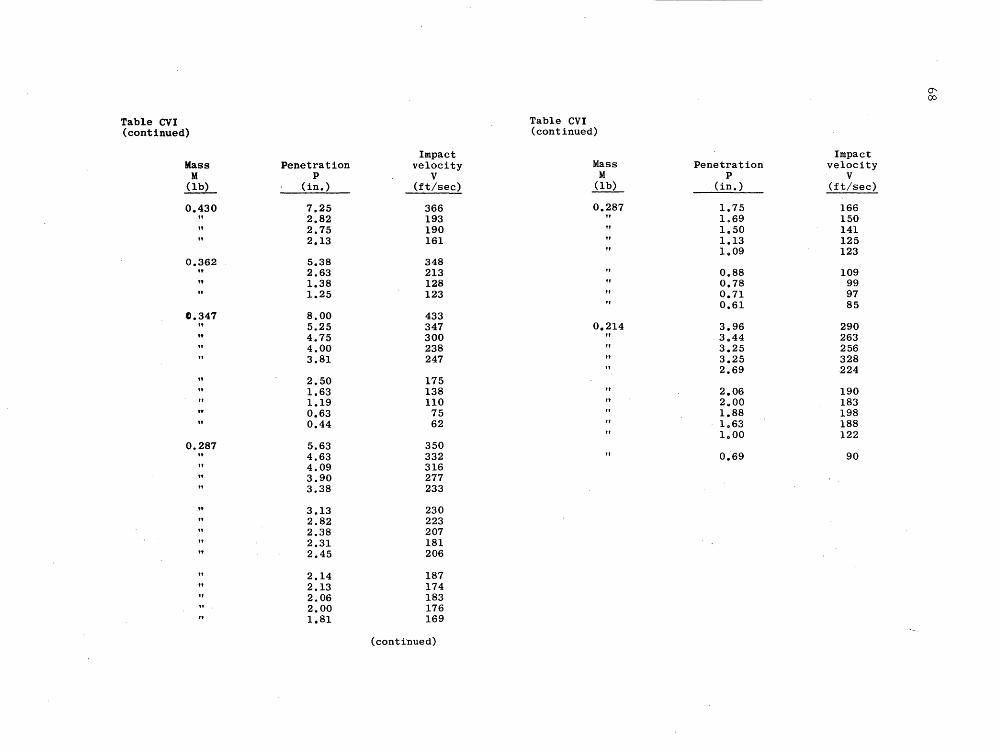
0' 00
Table CVI Table CVI (continued) (continued)
Impact Impact Mass Penetration velocity Mass Penetration velocity
M P V M P V (lb) (in. ) (ft/sec) (lb) (in. ) (ft/sec)
0.430 7.25 366 0.287 1.75 166 2.82 193 1.69 150 2.75 190 1.50 141 2.13 161 1.13 125
1.09 123 0.362 5.38 348
to 2.63 213 0.88 109 1.38 128 0.78 99 1.25 123 0.71 97
0.61 85 &».347 8.00 433
5.25 347 0.214 3.96 290 4.75 300 3.44 263 4.00 238 3.25 256 3.81 247 3.25 328
2.69 224 2.50 175 1.63 138 2.06 190 1.19 110 2.00 183 0.63 75 1.88 198 0.44 62 1.63 188
1.00 122 0.287 5.63 350
4.63 332 0.69 90 4.09 316 3.90 277 3.38 233
3.13 230 2.82 223 2.38 207 2.31 181 2.45 206
2.14 187 2.13 174 2.06 183 2.00 176 1.81 169
(continued)

Table CVII. Steel circular pile, ext. diam 7/16., Table CVIl into diam 5/16 in. Sand 1 (continued)
Impact Impact Mass Penetration velocity Mass Penetration velocity
M P V M P V (lb) (in. ) (ft/sec) Q!?L (in. ) (It/sec)
0.597 4.78 260 0.500 3.05 210
" 4.03 236 2.96 205 3.97 212 2.80 209 3.57 217 2.75 195' 2.78 166 2.72 190
" 0.32 46 2.63 188 2.60 197
0.550 4.34 240 2.57 183 3.27 191 2.52 188 0.40 46 2.51 198
0.500 6.90 368 2.39 184 6.00 340 2.36 170 5.95 332 2.31 169
" 5.85 330 2.13 164 5.25 300 2.00 156
5.05 315 1.95 150 5.00 300 1.97 152 4'.89 305 1.92 143 4.87 280 1.87 150 4.45 268 1.75 141
4.16 282 1.67 140 4.00 260 1.56 136 4.00 256 1.57 133
" 3.97 241 1.50 130 4.00 237 1.43 129
4.00 229 II 1.32 126 3.95 258 1.21 109 3.85 252 1.13 117 3.75 255 1.12 108 3.75 239 1.13 103
3.68 240 1.07 102 3.63 247 0.89 100 3.50 230 0.86 90 3.38 212 0.85 86 3.32 215 0.87 82
3.25 207 0.75 76 3.19 226 (continued) 0.74 84
0' 0.60 69 (continued) -.0

-J
Table eVIl 0
(continued)
Impact Mass Penetration velocity Table eVIl!. Steel circular pile, ext. diam 7/16 in. , M P V into diam 4/16 in. Sand 1. (lb) (in. ) '(ft/sec)
Mass Impact
0.460 4.37 307 Penetration velocity It 3.23 220 M P V
2.15 168 (lb) (in. ) (ft/sec) 2.34 202 1.84 160 0.500 5.00 350
4.35 305 ,It 1.49 147 4.00 290
1.03 103 3.90 320 0.96 115 3.20 282 0.78 78
3.00 270 0.370 5.75 350 2.50 242
4.70 325 2.50 220 4.50 307 2.08 200
It 3.96 313 2.08 192 3.41 296
1.95 183 " 2.25 220 1.88 190
2.16 202 1.77 191 2.13 197 1.67 189 2.06 184 1.38 145
" 1.84 183 It 1.37 138
1. 71 179 1.31 141 1.49 158 1.20 142 1.25 135 1.14 138 1.21 144 1.07 127 1.19 143
1.00 133 0.96 118 It 1.00 128, 0.60 87 0.89 116
It 0.41 70 0.75 100 0.41 61 " 0.76 99
0.205 2.94 327 It 2.97 340 Steel pile, ext. diam 7/16 in. , into diam 0 in.
1.57 204 1.38 196 1.33 151 1.34 20,0 2.25 250
3.70 310 1.13 172
" 0.88 139 0.60 120
" 0.50 100
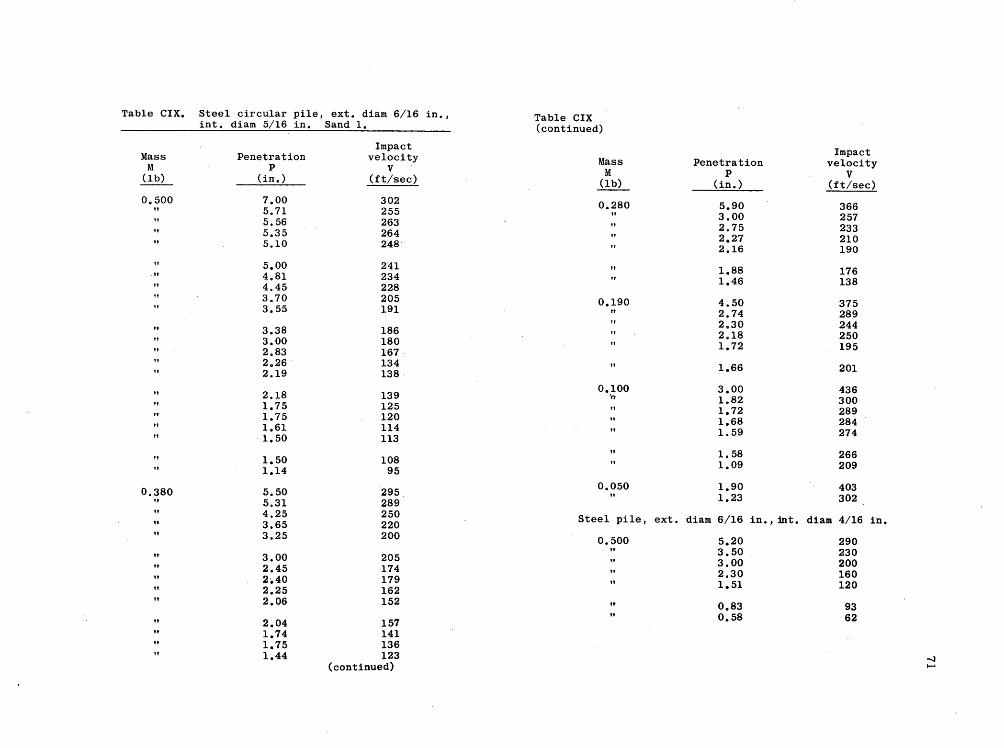
Table ClX. Steel circular pile, ext. diam 6/16 in. , Table ClX into diam 5/16 in. Sand 1. (continued)
Impact Impact Mass Penetration velocity Mass Penetration velocity M P V M P V Q!?L (in. ) (ft/sec) Q!?L (in. ) (ft/sec)
0.500 7.00 302 0.280 5.90 366 " 5.71 255 " 3.00 257 5.56 263 2.75 233 5.35 264 2027 210 5.10 248 2.16 190
5.00 241 1.88 176 4.81 234 1.46 138 4.45 228 3.70 205 0.190 4.50 375 3.55 191 2.74 289
2.30 244 3.38 1'86 2.18 250 3.00 180 1.72 195 2.83 167 2 026. 134 1.66 201 2.19 138
0.100 3.00 436 2.18 139 '0 1.82 300 1.75 125 1.72 289 1.75 120 1.68 284 1.61 114 1.59 274 1.50 113
1. 58 266 1.50 108 1.09 209 1.14 95
0.050 1.90 403 0.380 5.50 295 " 1.23 302 " 5.31 289 " 4.25 250 Steel pile, ext. diam 6/16 in., into d1am 4/16 in. n 3.65 220 It 3.25 200 0.500 5.20 290
3.50 230 .t 3.00 205 3.00 200 It 2.45 174 2.30 160 It 2.40 179 1.51 120 It 2.25 162 It 2.06 152 0.83 93 It 2.04 157 0.58 62 It 1.74 141
1.75 136 It 1.44 123 -.J
(continued) .....
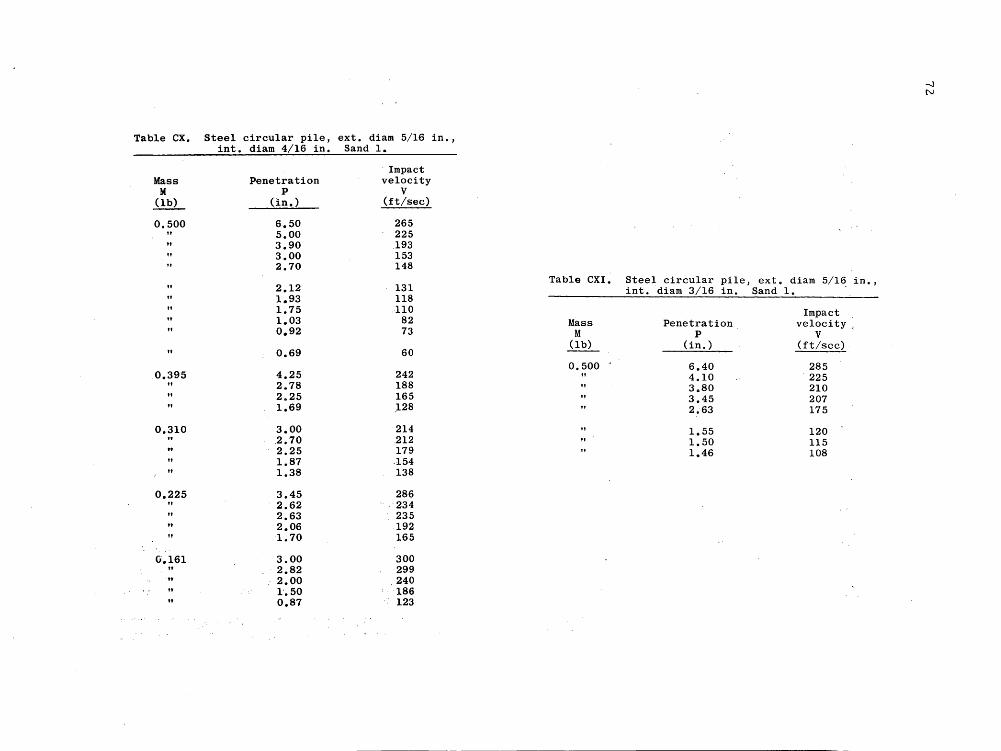
Table ex. Steel circular pile, ext. diam 5/16 in., into diam 4/16 in. Sand 1.
Mass M
(lb)
0.500
" .0.395
0.310
0.225 "
0.161
Penetration P
Un. )
6.50 5.00 3.90 3.00 2.70
2.12 1.93 1.75 1.03 0.92
0.69
4.25 2.78 2.25 1.69
3.00 .2.70 2.25 1.87 1.38
3.45 2.62 2.63 2.06 1.70
3.00 2.82 2.00 1'.50 0.87
Impact Velocity
V (ft/sec)
265 225 193 153 148
131 118 110
82 73
60
242 188 165 ,128
214 .212 179 ·154 138
286 234 235 192 165
300 299
.. 240 186 123
Table eXI. Steel circular pile, ext. diam 5/16 in., into diam 3/16 in. Sand 1. '
Impact Mass Penetration veloci ty ,
M P V
~ (in. ) (ft/sec) .
0.500 6.40 285 4.10 225 30 8 0 210 3.45 207 2.63 175
1.55 120 1.50 115 1.46 108

APPENDIX D
Firing data of the first investigation of Phase II.
Table DI. Steel circular pile, ext. diam 7/16 in., into diam 6/16 in., mass 0.5 lb. Sand 1. Impact velocity, 240 ft/sec.
Penetration Time P .. t
(i5. ) (msec)
0.000 0.0 0.278·· 0.1 0.557 0.2 0.820 0.3 1.080 0.4
1.340 0.5 1.585 0.6 1.825 0.7 2.060 0.8 2.285 0.9
2.490 1.0 2.690 1.1 2.885 1.2 3.075 1.3 3.245 1.4
3.420 1.5 3.575 1.6 3.725 1.7 3.870 1.8 4.005 1.9
4.140 2.0 4.260 2.1 4.370 2.2 4.4·65 2.3 4.565 2.4
4.650 2.5 4.730 2.6 4.790 2.7 4.845 2.8 4.890 2.9
4.930 3.0 4.960 3.1 4.980 3.2 4.990 3.3 5.000 3.4
Table DIl. 6/16 in.,
Steel circular pile, ext. diam 7/16 in., into diam mass 0.5 lb. Sand 1. Impact velocity, 198 ft/sec.
Penetration Time p. t (i~. ) (msec)
0.000 0.0 0.230 0.1 0.455 0.2 0.680 0.3 0.900 0.4
1.105 0.5 1.300 0.6 1.505 0.7 1.695 0.8 1. 870 . 0.9
2.045 1.0 2.200 l.l 2.360 1.2 2.505 1.3 2.650 l.4
2.780 l.5 2.910 l.6 3.030 l.7 3.140 l.8 3.240 l.9
3.340 2.0 3.425 2.1 3.5'05 2.2 3.575 2.3 3.640 2.4
3.~03 2.5 3.760 2.6 3.810 2.7 3.855 2.8 3.895 2.9
3.925 3.0 3.955 3.1 3.975 3.2 3.995 3.3 4.000 3.4
--J VJ

Table DIll. Steel circular pile, ext. diam 7/16 iri., into diam 6/16 in., mass 0.5 lb. Sand 1. Impact velocit~ 188 ft/sec.
Penetration Time P. t
(iR. ) (msec)
0.000 0.0 0.225 0.1 0.440 0.2 0.650 0.3 0.855 0.4
1.055 0.5 1.250 0.6 1.425 0.7 1.600 0.8 1.760 0.9
1.920 1.0 2.065 1.1 2.205 1.2 2.335 1.3 2.455 1.4
2.565 1.5 2.670 1.6 2.765 1.7 2.855 1.8 2.930 1.9
3.000 2.0 3.060 2.1 3.115 2,2 3.150 2.3 3.185 2.4
3.205 2.5 3.220 2.6
Table DIV. Steel circular pile, ext. diam 7/16 in., into .diam 6/16 in., mass 0.5 lb. Sand 1. Impact velocity, 184 ft/sec.
Penetration Time Pi t
(in. ) (msec)
0.000 0.0 0.220 0.1 0.420 0.2 0;620 0.3 0.820 0.4
1.010 0.5 1.200 0.6 1.375 0.7 1.540 0.8 1.705 0.9
1.861 1.0 2.000 1.1 2.140 1.2 2.265 1.3 2.380 1.4
2.495 1.5 2.600 1.6 2.690 1.7 2.775 1.8 2.855 1.9
2.936 2.0 2.990 2.1 3.040 2.2 3.085 2.3 3.115 2.4
3.140 2.5 3.150 2.6
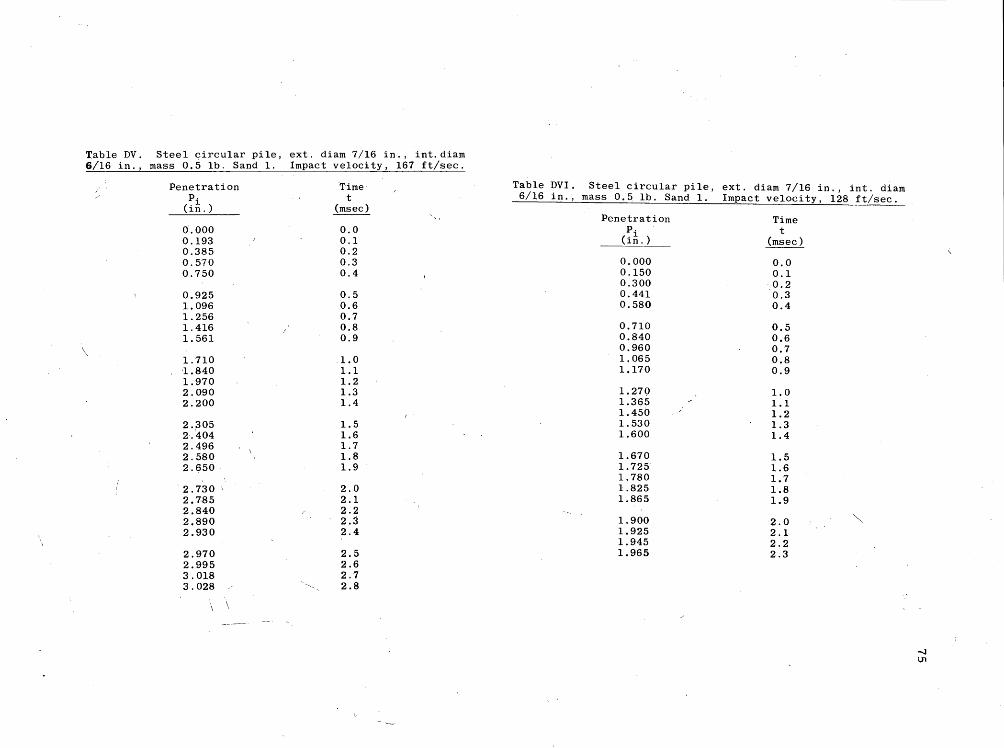
Table DV. 6/16 in.,
\
Steel circular pile, ext. diam 7/16 in., int.diam mass 0.5 lb. Sand 1. Impact velocity, 167 ft/sec.
Penetration Time Pi t
(in. ) (msec) , "
0.000 0.0 0.193 0.1 0.385 0.2 0.570 0.3 0.750 0.4
0.925 0.5 1.096 0.6 1.256 0.7 1.416 0.8 1.561 0.9
1. 710 1.0 'l. 840 1.1 1.970 1.2 2.090 1.3 2.200 1.4
2 .. 305 1.5 2.404 1.6 2.496 1.7 2.580 1.8 2.650 1.9
2.730 \ 2.0 2.7.85 2.1 2.840 2.2 2.890 2.3 2.930 2.4
2.970 2.5 2.995 2.6 3.018 2.7 3.028 '-' ... 2.8
Table DVI. 6/16 in.,
Steel circular pile, ext. diam 7/16 in., into diam mass 0.5 lb. Sand 1. Impact velocity, 128 ft/sec.
Penetration Time p. t (i~. ) (msec)
0.000 0.0 0.150 0.1 0.300 0.2 0.441 0.3 0.580 0.4
0.710 0.5 0.840 0.6 0.960 0.7 1.065 0.8 1.170 0.9
1.270 1.0 1.365 1.1 1.450 1.2 1.530 1.3 1.600 1.4
1.670 1.5 1.725 1.6 1.780 1.7 1.825 1.8 1.865 1.9
1.900 2.0 1.925 2.1 1.945 2.2 1.965 2.3

Table DVII. Steel circular pile, ext. diam 7/16 in., into diam 6/16 in., mass 0.5 lb. Sand 1. Impact velocity, 126 ft/sec.
Penetration Time p. t
(ifi. ) (msec)
0.000 0.0 0.155 0.1 0.300 0.2 0.435 0.3 0.565 0.4
0.690 0.5 0.810 0.6 0.925 0.7 1.030 0.8 1.130 0.9
1.225 1.0 1.305 1.1 1.380 1.2 1.450 1.3 1.515 1.4
1.570 1.5 1.620 1.6 1.663 1.7 1. 703 1.8 1. 735 1.9
1.760 2.0 1. 775 2.1 1.780 2.2
Table DVIII. Steel circular pile, ext. diam 7/16 in., into diam 6/16 in., mass 0.5 lb. Sand 1. Impact velocity, 122 ft/sec.
Penetration Time Pi t
(in. ) (msec)
0.000 0.0 0.142 0.1 0.280 0.2 0.415 0.3 0.545 0.4
0.670 0.5 0.788 0.6 0.892 0.7 1.000 0.8 1.095 0.9
1.185 1.0 1.270 1.1 1.345 1.2 1.420 1.3 1.480 1.4
1.540 1.5 1.590, 1.6 1.635 1.7 1.670 1.8 1.703 1.9
1.735 2.0 1. 760 2.1 1. 770 2.2 1.780 2.3
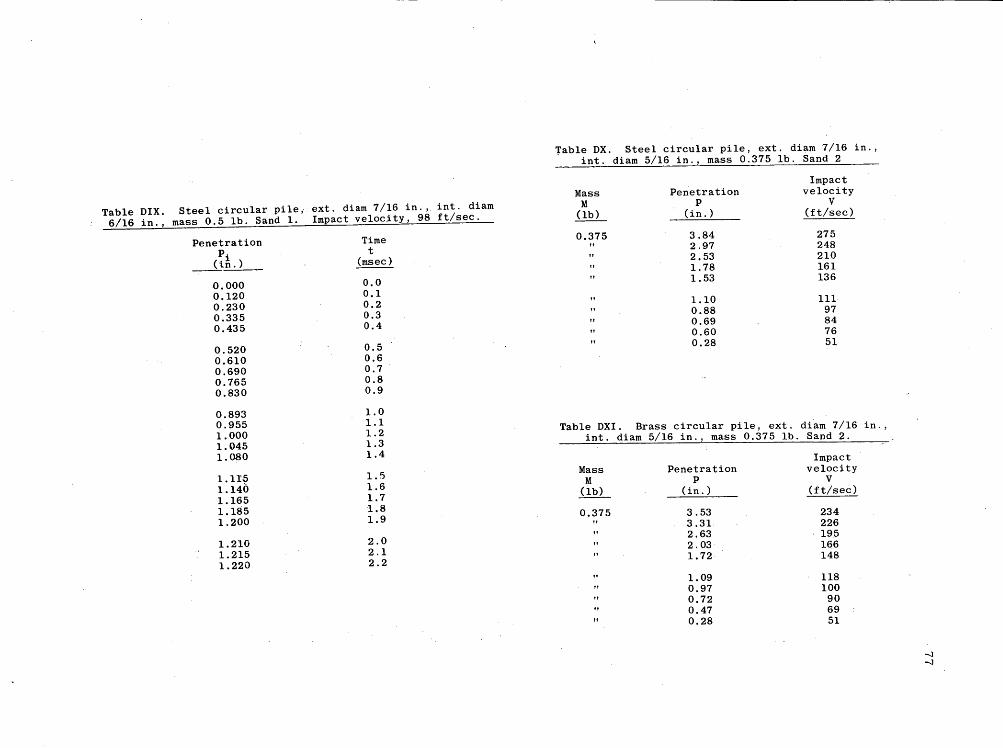
Table OIX. 6/16 in.,
Steel circular pile, ext. diam 7/16 in., into diam mass 0.5 lb. Sand 1. Impact velocity, 98 ft/sec.
Penetration Time p. t
__ (_i.~ (msec)
0.000 0.0 0.120 0.1 0.230 0.2 0.335 0.3 0.435 0.4
0.520 0.5 0.610 0.6 0.690 0.7 0.765 0.8 0.830 0.9
0.893 1.0 0.955 1.1 1.000 1.2 1.045 1.3 1.080 1.4
1.115 1.5 1.140 1.6 1.165 1.7 1.185 1.8 1.200 1.9
1.210 2.0 1.215 2.1 1.220 2.2
Table ox. Steel circular pile, ext. diam 7/16 in., into diam 5/16 in., mass 0.375 lb. Sand 2
Impact Mass Penetration velocity
M P V (lb) (in. ) (ft/sec)
0.375 3.84 275 2.97 248 2.53 210 1. 78 161 1.53 136
1.10 III 0.88 97 0.69 84 0.60 76 0.28 51
Table OXI. Brass circular pile, ext. diam 7/16 in., into diam 5/16 in., mass 0.375 lb. Sand 2.
Mass M
(lb)
0.375
Penetration P
(in. )
3.53 3.31 2.63 2.03 1. 72
1.09 0.97 0.72 0.47 0.28
Impact velocity
V (ft/sec)
234 226 195 166 148
118 100
90 69 51

/ /
-J .00
Table DXII. Steel "wall reduced pile", ext. diam 6/16 in. , Table DXIV. Steel circular pile, ext. diam 7/16 in. , into diam 5/16 in. , mass 0.382 lb. Sand 2. into diam 6/16 in. Sand 2.
" "-
Impact Impact Mass Penetration velocity Mass Penetration. velocity'
M P V ". M P V ill.L (in. ) ('it/sec) i!!?L (in. ) (it/sec)
0.382 6.16 312 0.471 4.94 276 4.84 241 2.70 166 2.47 190 1.25 101 2.13 158 1. 00 74 1.41 143 0.82 66
1.41 130 0.82 62 1.03 106 0.63 53 0.69 90 0.43 38 0.66 81 0.56 75 0.386 5.75 347
4.13 272 0.34 56 3.25 239
3.06 237 2.88 214
2.75 180 2.43 168
Table DXIII. Steel circular pile, ext. diam 6/16 in;, into diam 2.06 162 4/16 in., mass o .3821b. Sand 2 1. 75 142
\ 1. 70 140 Impact
Mass Penetration velocity 1.00 81 M P V 0.95 78
ill.L (in. ) (ft/sec) 0.94 85 0.82 76
0.382 4.03 251 0.70 63 3.72 .253 3.72 247 0.70 61 2.10 171 0.63 65 2.00 161 0.63 61
0.44 50 1.40 124 0.44 47 1.19 121 1.06 114 0.38 42 . 0.85 98 0.72 90 0.287 6.87 366
6.07 348 0.66 83 5.80 375 0.47 65 5.63 356
5.08 341

Table DXIV. APPENDIX E (continued)
Impact Firing data of the second investigation of Phase II. Mass Penetration velocity M P V Table EI. Steel rectangular pile, Sl' mass 0.322 Ibs. i!E.L (in. ) (it/sec) Sand 2.
0.287 4.50 270 3.50 216 Impact 3.07 226 Figure Penetration velocity 2.87 225 P V 2.80 219 (in. ) (ft/sec)
2.80 203 35a 0.50 65 2.62 207 0.56 73 2.13 177 0.69 78 1.25 119 0.88 93 0.88 96 0.38 52
0.88 98 0.81 84 6:88 96 0.25 39 0.80 99 0.38 58 0.57 75 1.06 102 0.57 71 1.50 127
0.50 66 1.94 154 4.38 242 0.183 3.53 334 II 5.44 ·275
3.09 293 5.19 258 2.65 268 2.65 262 35b 0.12 40 1. 72 186 II 0.34 70
0.72 107 1. 53 173 1.12 128 1.15 139 1.44 147 1. 03 134 0.78 107 1.66 158 0.72 109 1.88 171
0.~2 108 42b 0.38 60 0.65 109 0.69 80 0.65 108 1.03 106 0.65 107 1.81 129 0.12 33 2.12 154
~ -..0
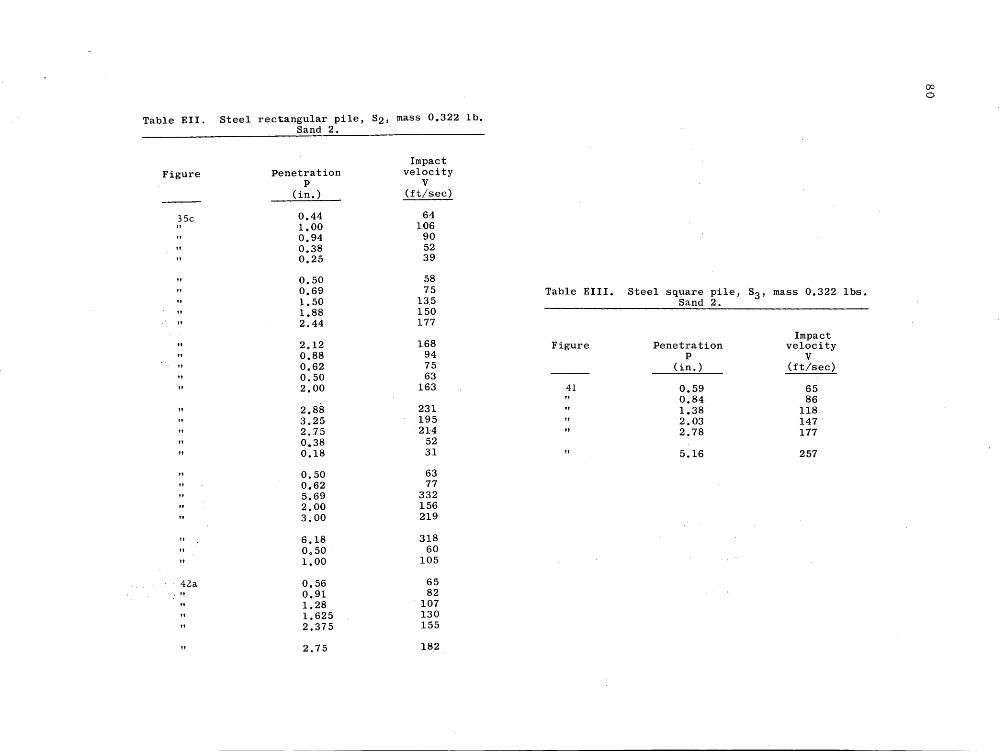
Table Ell. Steel rectangular pile, S2, mass 0.322 lb. Sand 2.
Impact Penetration velocity
P V Figure
(in. ) (ft/sec)
35c 0.44 64
" 1.00 106 0.94 90 0.38 52 0.25 39
0.50 58 0.69 75 1.50 13,5 1.88 150 2.44 177
2.12 168 0.88 94 0.62 75 0.50 63 2.00 163
2.88 231 3.25 195 2.75 214 0.38 52 0.18 31
0.50 63 0.62 77 5.69 332 2.00 156 3.00 219
6.18 318 0.50 60 1.00 105
42a 0.56 65 0.91 82 1.28 107 1.625 130 2.375 155
2.75 182
Table EIII. Steel square pile, S3' mass 0.322 Ibs. Sand 2.
Impact Figure Penetration velocity
P V (in. ) (ft/sec)
41 0.59 65 0.84 86 1.38 118 2.03 147 ' 2.78 177
5.16 257
00 o

Table EIV. Steel circular pile, S1' mass 0.322 1b Table EI V Sand 2, Ground silica, Go den soil. (continued)
Impact Impa~t Figure Penetration velocity Figure Penetration ve1oci J;.;y
P V P V (in. ) (ft/sec) (in. ) (ft/sec)
35a and 0.31 43 37b 0.59 87 37c 0.40 51 1.00 109
0.44 57 1.41 129 0.88 78 1.59 145 0.81 79 1.97 162
0.50 54 0.59 74 0.81 73 0.69 66 40c 0.41 54
0.81 84 35b 1.22 127 1.28 117
1.38 133 1.81 148 1.53 137 2.47 168 2.38 175 1.00 102 5.16 261
0.50 72 40b 0.84 102 0.18 42 1.16 117
1.22 123 35c and 2.25 164 1.66 144 36 3.25 222 1.47 131
1.94 147 1.25 122 2.34 176 0.97 101 0.59 67
2.44 175 0.62 80
1.94 147 37d 2.06 183 1.19 112 2.62 223 1.88 149 1.88 175 0.44 58 1.06 121
1.12 120 37a 1.91 174
0.66 93 2.69 234 1.12 122 6.19 396 0.72 90
0.31 52 0.41 64 1.06 118
2.78 214 1.31 118
2.44 161 (continued) 1.31 123
0.94 107 2.31 152 00 3.62 252 (continued) i-'

00 Table EIV N (continued) Table EVI. Steel cross shape, S6' mass 0.322 Ib
Sand 2, Ground silica.
Impact Impact Figure Penetration velocity Figure Penetration velocity
P V P V (in. ) (ft/sec) (in. ) (ft/sec)
37d 0.56 91 37c 0.75 94 0.50 78 0.50 73 0 0 62 90 0.50 67 0.44 65 0.44 69 3.38 251 0.44 62
2.19 205 0.31 56 0.25 48
40a 1.03 83 0.69 91 1.34 98 0.69 92 2.03 119 0.69 86 2.18 142 3.19 161 2,12 184
1.12 122 3.47 170 1.19 117
1.56 140 2.00 161
Table EV. Steel cross-shaped pile, S5' mass 0.322 Ib 2.00 160 Sand 2. 1.88 152
1. 56 148
Impact 2.50 194
Figure Penetration velocity P V 37d 1.00 138
(in. ) (ft/sec) 2.00 220 1.31 148
37b 0.75 77 2.12 219 0.88 95 1.38 142 1.25 117 1.50 132 0.78 124 1.69 146 0.44 80
0.88 116 2.00 166 1.88 196 1.12 108 1.69 181 0.75 80
1.38 154 37a 1.50 141 0.88 123
0.69 86 0.62 98 0.38 57 0.81 115 0.57 77 3.00 271
(continued)
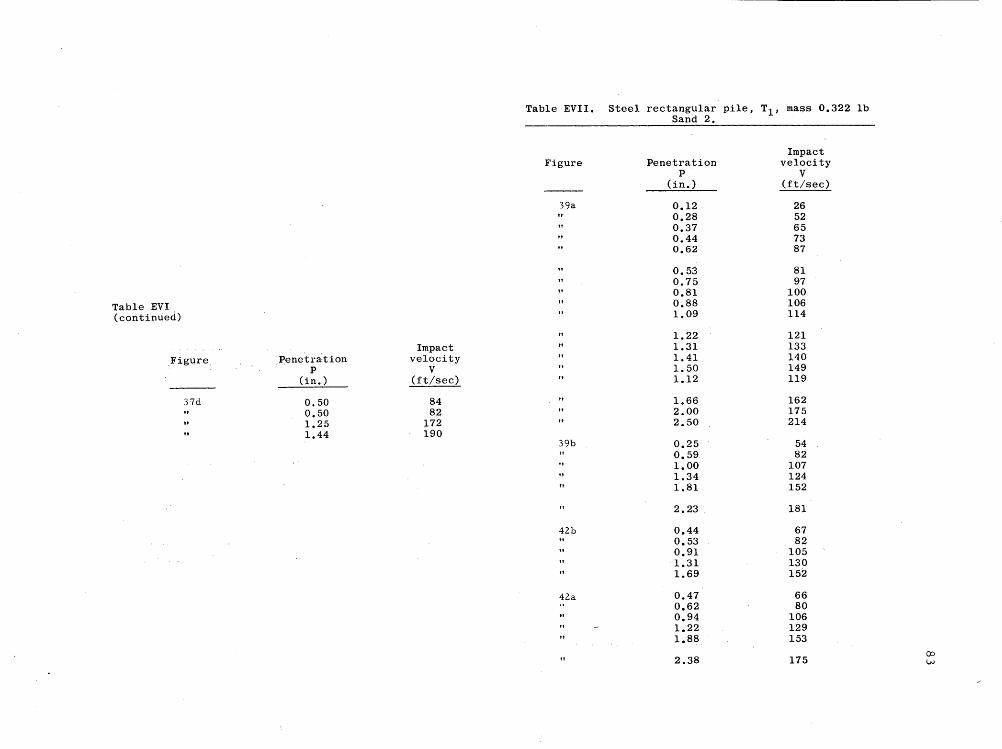
Table EVIl. Steel rectangular pile, T1 , mass 0.322 1b Sand 2.
Impact Figure Penetration velocity
P V (in. ) (ft/sec)
39a 0.12 26 0.28 52 0.37 65 0.44 73 0.62 87
0.53 81 0.75 97 0.81 100
Table EVI 0.88 106 (continued) 1.09 114
1.22 121 Impact 1.31 133
Figure :penetration velocity 1.41 140 P V 1. 50 149
(in. ) (ft/sec) 1.12 119
37d 0.50 84 1.66 162 0.50 82 2.00 175 1.25 172 2.50 214 1.44 190
39b 0.25 54 0.59 82 1.00 107 1.34 124 1.81 152
2.23 181
42b 0.44 67 0.53 82 0.91 105 1.31 130 1.69 152
42a 0.47 66 0.62 80 0.94 106 1.22 129 1.88 153
2.38 175 00 w

Table EVIII. Steel rectangular pile, T2 , mass 0.322 lb. Sand 2
Figure
42a
Table EIX. Steel
Figure
41
Penetration P
(in. )
0.41 0.56 0.88 1.34 2.31
square pile, Sand 2.
Penetration P
(in. )
0.44 0.56 1.19 1.56 2.19
4.34
Impact velocity
V (ft/sec)
64 81
105 126 163
T3' mass 0.322 lb.
Impact velocity
V (ft/sec)
69 84
114 139 170
254
TaBle EX.
Figure
39a
39b
40b
40c
40a
00 ~
Steel circular pile, Ti' mass 0.322 1b Sand 2, Golden soi •
Impact Penetration velocity
p V (in. ) (ft/sec)
0.25 48 0.56 73 0.97 97 1.31 126 1.66 147
2.12 174
0.34 51 0.66 83 1.00 107 1.44 128 1.84 152
2.34 182
0.69 100 0.38 65 0.81 91 0.60 82 1.22 128
2.00 177
0.31 54 0.59 84 1.06 113 1.47 152 2.09 178
4.38 291
0.75 83 1.03 95 1.66 115 2.00 140 '2.72 159
3.47 176 1.62 113 5.81 247
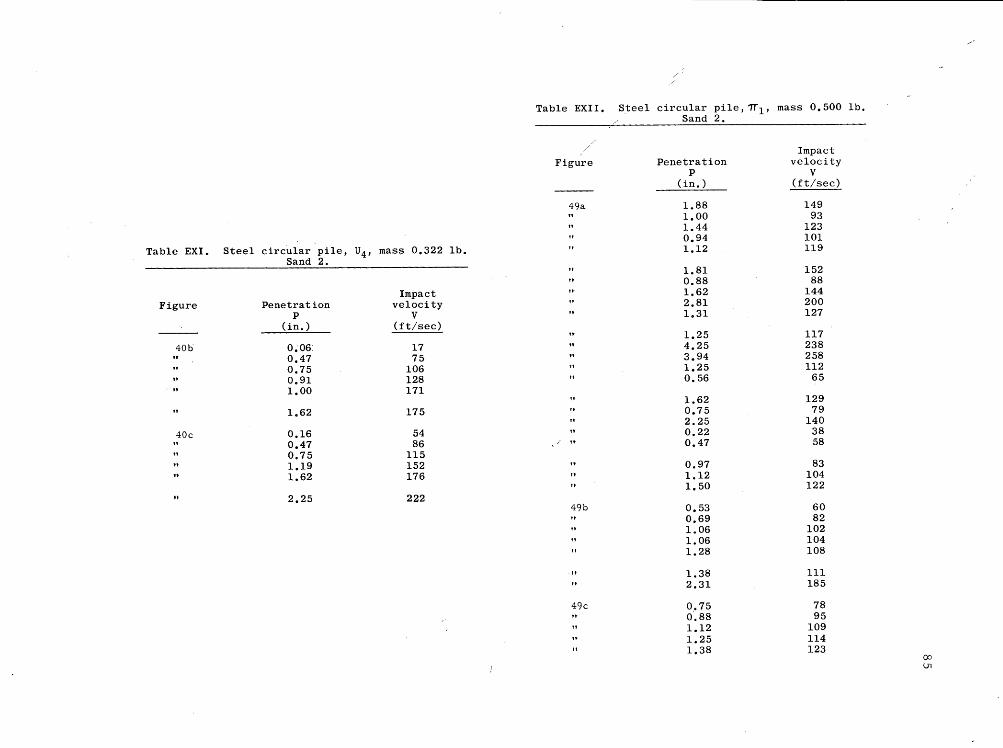
/
Table EXII. Steel circular pile, 7T l' mass 0.500 lb. Sand 2.
Impact Figure Penetration velocity
P V (in.) (ft/sec)
49a 1.88 149 1.00 93 1.44 123 0.94 101
Table EXI. Steel circular pile, U4 , mass 0.322 lb. Sand 2.
1.12 119
1.81 152 0.88 88 1.62 144 2.81 200 1.31 127
Impact Penetration velocity
P V Figure
(in. ) (ft/sec) 1.25 117 4.25 238 3.94 258 1.25 112 0.56 65
0~06' 17 0.47 75 0.75 106 0.91 128
40b
1.62 129 1.00 171
0.75 79 2.25 140
1.62 175
0.22 38 0.47 58
40c 0.16 54 0.47 86 / tt
0.75 115 1.19 152 0.97 83 1.62 176 1.12 104
1.50 122 2.25 222
49b 0.53 60 0.69 82 1.06 102 1.06 104 1.28 108
1.38 111 2.31 185
49c 0.75 78 0'.88 95 1.12 109 1.25 114 1.38 123
0:> U1
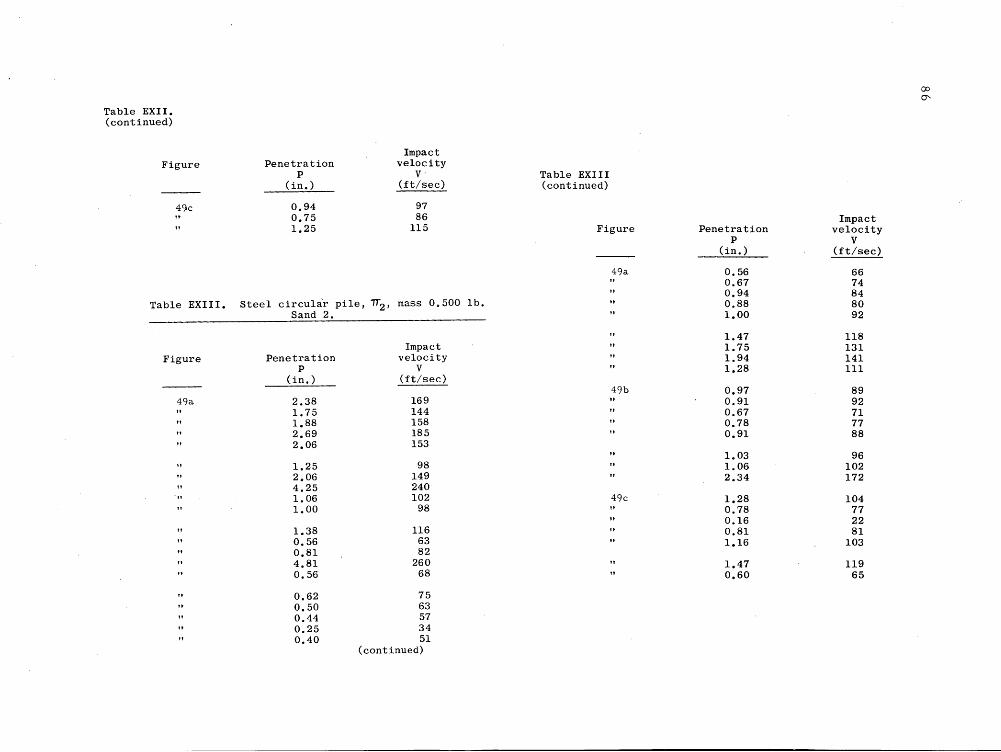
Table EXII. (continued)
Figure
49c
Penetration P
(in. )
0.94 0.75 1.25
Impact velocity
V' (ft/sec)
97 86
115
Table EXIII. Steel circular pile, 1i2 , mass 0.500 lb. Sand 2.
Impact Figure Penetration velocity
P V (in. ) (ft/sec)
49a 2.38 169 1. 75 144 1.88 158 2.69 185 2.06 153
1.25 98 2 0 06 149 4.25 240 1.06 102 1.00 98
1.38 116 0.56 63 0.81 82 4.81 260 0.56 68
0.62 75 0.50 63 0.44 57 0.25 34 0.40 51
(continued)
Table EXIIl (continued)
Figure
49a
49b
49c
Penetration P
(in. )
0.56 0.67 0.94 0.88 1.00
1.47 1. 75 1.94 1.28
0.97 0.91 0.67 0.78 0.91
1.03 1.06 2.34
1.28 0.78 0.16 0.81 1.16
1.47 0.60
Impact velocity
V (ft/sec)
66 74 84 80 92
118 131 141 III
89 92 71 77 88
96 102 172
104 77 22 81
103
119 65
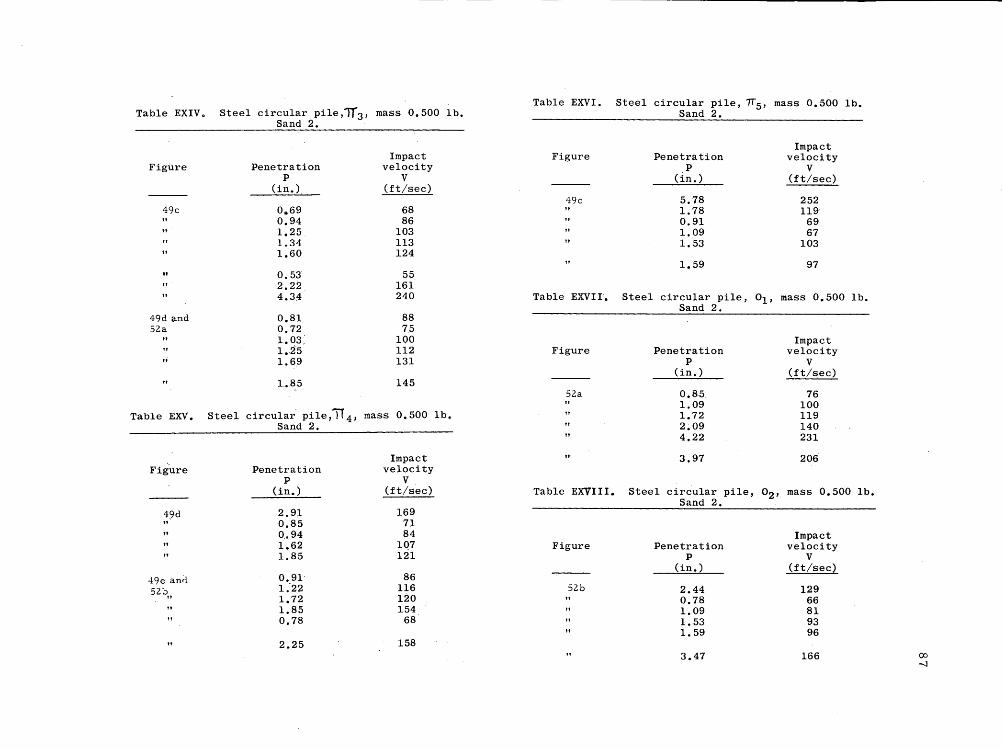
Table EXVI. Steel circular pile,7T5 , mass 0.500 lb. Table EXIV. Steel circular pile,1T3 , mass 0.500 lb. Sand 2.
Sand 2.
Impact Impact Figure Penetration velocity
Figure Penetration velocity P V P V (in. ) (it/sec)
(in. ) (ft/sec) 49c 5.78 252
49c 0 0 69 68 " 1. 78 119 0.94 86 0.91 69 1.25 103 1.09 67 1.34 113 1.53 103 1.60 124
1.59 97
" 0.53 55 2.22 161 4.3:4 240 Table EXVII'. Steel circular pile,
Sand 2. °1' mass 0.500 lb.
49d and 0.81 88 52a 0.72 75
1.03~ 100 Impact 1.25 112 Figure Penetration velocity
,j 1.69 131 P V (in.) (ft/sec)
1.85 145 52a 0.85. 76
1.09 100 Table EXV. Steel circular pile,TT 4' mass 0.500 lb. 1. 72 119
Sand 2. 2.09 140 4.22 231
Impact 3.97 206 Figure Penetration velocity
P V (in. ) (ft/sec) Table EXVIII. Steel circular pile, °2' mass 0.500 lb.
Sand 2. 49d 2.91 169 ,,' 0.85 71
0 .• 94 84 Impact 1.62 107 Figure Penetration velocity 1.85 121 P V
(in. ) (ft/sec) 4ge anti 0.91· 86
52'.:>" 1.-22 116 52b 2.44 129 1. 72 120 0.78 66 1.85 154 1.09 81 0.78 68 1.53 93
1. 59 96 2.25 158
3.47 166 00 -J

Table EXIX. Steel cross-shaped pile, T5 , mass 0.459 lb. Sand 1.
Impact Figure Penetration velocity
P V (in. ) (ft/sec)
46 3.62 273 3.56 258 4.38 286 2.50 203 2.88 198
2.88 204 1.81 162 0.75 90 0.36 54 2.65 20p
3.10 221 1.13 109 2.10 182 2.35 195 1.54· 140
2.35 194 2.55 194 1.03 121 2.60 208 2.85 213
1. 75 161 1.50 129 0.75 81 2.80 213 3.75 248
2.50 200 2.35 188 1.80 166 2.25 162 3.00 185
2.47 161 0.75 129 1.00 123 1.25 145 0.50 69
1.92 159 2.75 220 2.43 196 1.05 110
Table EXX. Steel cross-shaped pile, Golden soil.
Figure Penetration p
(in. )
45 1.38 2.50 4.50 2.25 2.50
4.75 5.25 5.75 1.00
1.1.50
Bl, mass 3.67
Impact velocity
V (ft/sec)
73 109 172 112 III
160 175 188
56 280
lb.
00 00

APPENDIX F
Determination of the shape factor Q.
Solid circular pile
According to the assumptions made in the section "Effective
Thickness", the lines of flow are the radii. In polar
coordinates, the shape factor Q for a solid circular pile is
then given by:
R
Q = J 2 rrr(R-r) dr/lTR3
o
1/3
where the quantities R, r are given in the sketch below:
R
Figure Fl.
Square-shaped pile
The direction of the lines of flow is indicated in the
sketch below. The shape factor Q for a square-shaped pile is
then given by:
a a
Q =J (a-x) ·x·dx/a r x·dx o ~o .
1/3
Figure Fl.
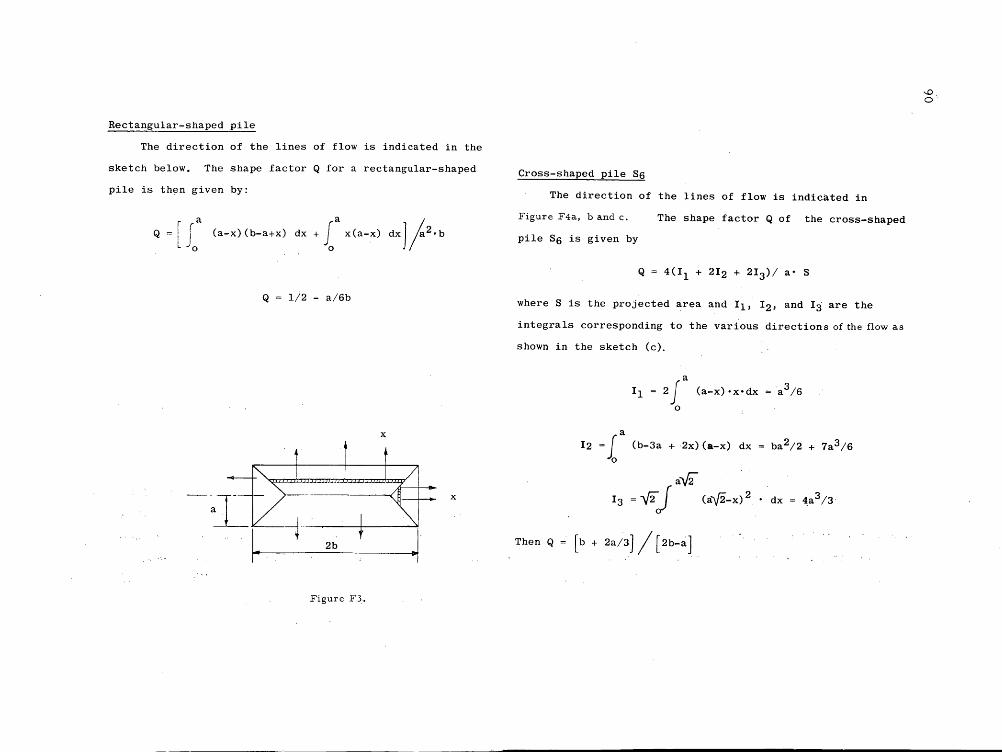
Rectangular-shaped pile
The direction of the lines of flow is indicated in the
sketch below. The shape factor Q for a rectangular-shaped
pile is then given by:
Q ~ [ta
(a-x) (b-a+x) dx + ~a x(a-x) dx J ;'20 b
Q li2 - a/6b
x
-l x
I· 2b
Figure F3.
Cross-shaped pile S6
The direction of the lines of flow is indicated in
Figure F4a, band c. The shape factor Q of the cross-shaped
pile S6 is given by
where S is the projected area and 11, 12 , and 13 are the
integrals corresponding to the various directions of the flow as
shown in the sketch (c).
2Ja
(a-x)·x·dx
o
a 12 = 1 (b-3a +2x) (a-x) dx
o
aV2 13 ="V2 j (al.[2-x) 2 • dx
-.D. o·

x
(a) (b)
x x
(c)
Figure F4.
Cross-shaped piles, S5, T5, and Bl
The piles S5, T5, and Bl were assumed to be thin enough
for the use of a simplified formula. In this case, the
projected areM of these piles were considered equivalent to the
projected area of a thin rectangle. Then the shape factor Q
is given by:
Q 1 - a/12b
Hollow circular piles
For thin hollow circular piles, the assumption made for
the piles S5, T5.and Bl is also used. Then the shape factor of
thin,hollo~ circular piles becomes:
Q
This above formula is assumed to hold for piles having a PiT
ratio bigger than 60. For thick, hollow, circular piles, a
slight correction was made to the results obtained with the
above formula.

92
APPENDIX G
Firing record of Alaskan tests.
Ext. Int. Impact Nominal diam diam Mass velocity Penetration
diameter Dl D2 M V P (in. ) (in.) (in. ) (lb) (ft/sec) (ft) Remarks
2 2.37 1.93 115 480 4.50 Pipe driven to hilt 115 526 4.50 Pipe driven to hilt 258 72 1.42 One velocity only 118 515 5.00 Pipe driven to hilt 242 200 Pipe collapsed by bending
4 4.50 4.02 140 231 2.08 Extracted-End Collapsed
" 134 289 2.25 139 286 2.50 Extracted-End Collapsed 134 269 2.00 134 450 2.33 One velocity only 134 1.83 Counters did not operate 134 355 1.67 One velocity reading only 201 264 2.00 240 80 0.75 Pipe pulled-no end damage 246 2.67 Counters did not operate 246 169 2.58 252 176 2.75 240 135 1.50 262 80 0.67 With drive shoe 147 286 1.92 With drive shoe 251 201 1.42 With drive shoe 147 275 1.75 With drive shoe
4 4.50 3.82 162 203 2.00 Pipe pulled-no end damage 162 171 1.08 Hit timing stand-one
velocity-pipe pulled-no end damage
Appendix G (continued)
Ext. Int. Impact Nominal diam diam Mass velocity Penetration
diameter Dl D2 M V P (in.) (in.) (in. ) (lb) (ft/sec) (ft) Remarks
4 4.50 3.82 155 204 1.75 Pipe pulled-no end damage 155 1.67 Counters did not operate 162 213 2.00 162 355 2.58 155 2.00 Missed timing stand 162 342 2.25 155 397 2.58
It " 274 133 3.08 267 245 2.83 274 336 2.16
6 6.62 6.06 185 591 2.00 Pipe pulled -. end collapsed 185 Pile hit timing stand 185 1.67 Fuses blew-no velocity meas.
" " 185 220 2.00 " " 185 214 1.58
185 213 1.75 Pipe pulled·..., end collapsed " 185 224 1.67 Pipe pulled - end collapsed
194 1.75 Counters did not stop 185 480 1.58 244 658 2.92
It 244 745 2.92 287 242 2.50 300 123 1.08 With drive shoe
tt " " 196 164 0.92 With drive ·shoe

93
Appendix G (continued)
Ext. Int. Impact Nominal diam diam Mass velocity Penetration
diameter Dl D2 M V P (in. ) (in. ) (in.) (lb) (ft/sec) (ft) Remarks
6 6.62 5.76 247 152 1033 Pipe pulled-no end damage 247 148 0.67 Pipe pulled-no end damage 247 152 1.42 305 155 1.00 233 160 1.08 358 203 3.16 349 180 2.25 335 85 0.75 Pipe pulled-no end damage 349 76 1.16 Pipe pulled-po end damage 335 124 1.16 358 62 0.75
8 8.62 8.18 146 End collapsed on impact 170 1.00 End collapsed on impact
8 8.62 8.05 215 208 1.42 Pipe pulled-no end damage 265 292 2.33
,,' 228 220 1.83 Pipe pulled - end collapsed 278 315 2,.16 278 130 0.83 Pipe pulled - end collapsed 205 242 1.83 270 131 0.75 Pipe pulled-no end damage
" 270 260 1.92

94
APPENDIX H: BUCKLING OF PILES UNDER DECELERATION
by
Sp/4 Christopher Goetze
In the main body of this report the mechanism of penetration is studied in detail, but no design criteria are provided for the piles themselves. I f improperly designed, however, piles may be expected to buckle under the tremendous decelerations encountered in penetration. This appendix is 'intended to provide a criterion to guard against this type of failure.
Consider a pile with physical properties,
p = density E = Young's modulus I = Moment of inertia of the cross-section.
I n Figure HZ the pile is shown undergoing an instantaneous deceleration ~ with an exposed length 1.. A small displacement from the vertical is shown with dimensions y,x, and u as indicated. A horizontal deceleration, a. a {a small}, has been included to take into account the possibility that the pile may be deflected slightly from the vertical during the early stage s of penetration as shown in Figure HI. This could be due to an irregularity in the firing procedure or to inhomogeneity of the soil. High speed photographs of actual penetration tests will have to be consulted to obtain an idea of how large a is in practice but theory indicates that this may be a significant variable.
~---+------i~-~ P a a du I I
~a
u
x
Figure HI. Figure HZ.
Taking moments about P we have
dZ i,e EI ~ = pa [y{u} - y(x} + 0.( u-x}] du
dxz x ( 1 )
differentiating with respect to ~

A-PPENDIX H
d 3 y· d EI = - pa (1 - x) d~ - paa(1 - x)
dx3
letting p2 =~ EI
d3
Y + p2 (1. _ x) dy . = _ aP2 (1 - x). dx3 dx
To solve the hOITlogeneous equation, we perforITl the substitutibns
We have
d dx
= -P~1-x d dS
- dT) P / 2 + p2 (1 _ x) 3 / 2 - dS
Substituting into eq 3
The solution to this is known to be
T) = AJ 1 (S) + BJ 1 ( S ) 3 -3
where A, Bare undeterITlined constants.
dd y = ~ [AJl (S) + BJ· l (S)] I
x 3-3
_ x)' ]
=
To this we add the obvious particular solution dy/ dx = -a, obtaining
95
(2)
(3)
( 4)
~dd = - a + ~ [AJ l (S)+ BJ l (S)] (5) x 3 - 3
S = ~ P(f - x) 3/2.
The boundary conditions we wish to satisfy are
y( 0) :% 0
dy(O) = 0 dx
( 6)
(7)
(8)
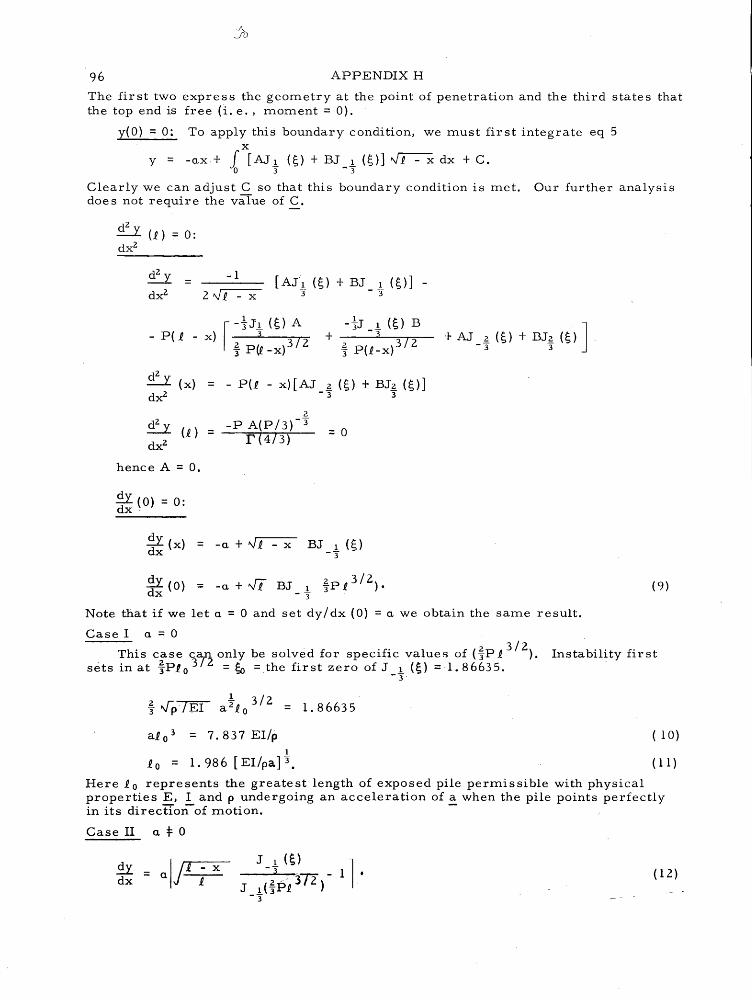
96 APPENDIX H
The first two express the geometry at the point of penetration and the third states that the top end is free (i. e., moment = 0).
y(O) = 0; To apply this boundary condition, we must first integrate eq 5 x
y = -ax + I [AJ 1. (s) + BJ 1. (s)] ~ dx + C. o 3 - 3
Clearly we can adjust C so that this boundary condition is met. Our further analysis does not require the value of C.
d 2 Y (£)=0:
-1 [AJ'l ( S) + BJ 1 (s)] -
3 -3
d 2 Y (x) = - P (£ - x)[ AJ ~ (S) + BJ ~ (S)]
d2 v --'- (£)
2
= - P A( P / 3) - 3 r (4/3)
- 3 3
= 0
hence A = O.
~ (0) = 0: dx '
~ (x) = -a + ~ £ - x
dy (0) :: -a + -IT BJ 1 j-P1 3 / 2). dx - 3
+ AJ ~ (S) + BJ ~ (S) ] - 3 3
Note that if we let a = 0 and set dy/dx (0) = a we obtain the same result.
Case I a = 0
(9)
, This c:se ca,ll only be solv.ed for specific values of (ip 13
/2
). Instability first sets in at '3P103/2 = So =the fIrst zero of J 1 (;) =1.86635.
-3
j- "Jp7E'I a t£ 03
/2 = 1. 86635
a£ 0 3 = 7. 837 EI/p 1
£0 = 1. 986 [EI/pa]3.
( 10)
( 11 )
Here £ 0 represents the greatest length of exposed pile permissible with physical properties E, I and p undergoing an acceleration of a when the pile points perfectly in its direction-of motion. -
Case II a f 0
~ - fjl - x dx - a -1.-- (12 )

APPENDIXH 97 The critical value for unlimited deformation is again ip I.. 3/2 = first zero of
J 1 (g) as in the case of a = O. In this case, however, the moment may reach high -3"
values before buckling (i. e., elastic instability) sets in. These are reached as I.. -I.. o. To investigate this, let us consider the moment:
[2 3/2]
Z -PEI(I.. - x) a J_2 -3P(I.. - x) d Y EI = ______________ ~3 ____ ~~-------
tJT J dtP £3!2) -3"
2 3/2 expand J 1 ( 3" P £ ) a bout £ = £ 0 to obtain
-3" To simplify thi s
[2 3/2] EIP(I.. - x) a J~ 3"P(1.. - ~)
3
Since J ~ (g) is a monotonically increasing function of g for 0 <'g < ~ we may safely assume that3the maximum moment occurs at x = 0 or
Max. moment = Mo EI .Jf a =
or
3EIa = 2£ [1 .:. (I.. /£0 ) 3 7 2]
(13 )
To solve exactly for £ requires the solution of a cubic but we can obtain an approximate expression for £0 - I.. «1..0 as follows:
2~0 (.Jfo - .Jf) (I.. + ~ - £ 0) = EIa.Jf
or approximately
aEI
2Mo~
J~ - 1· aEI , 1;;- - - 2Mo£ 0
Again making approximations, we obtain
aEI £ = £ 0 - Mo . ( 14)
We cannot use relati()nships 11 and 14 directly as de sign criteria since £ 0 refers only to the portion which has not yet penetrated the ground. With reference to eq 10 we can see that the greatest buckling danger occurs when a£ 3 is a maximum •.
1 L-s
Figure H3.
let f = (L-s)3~ dtZ
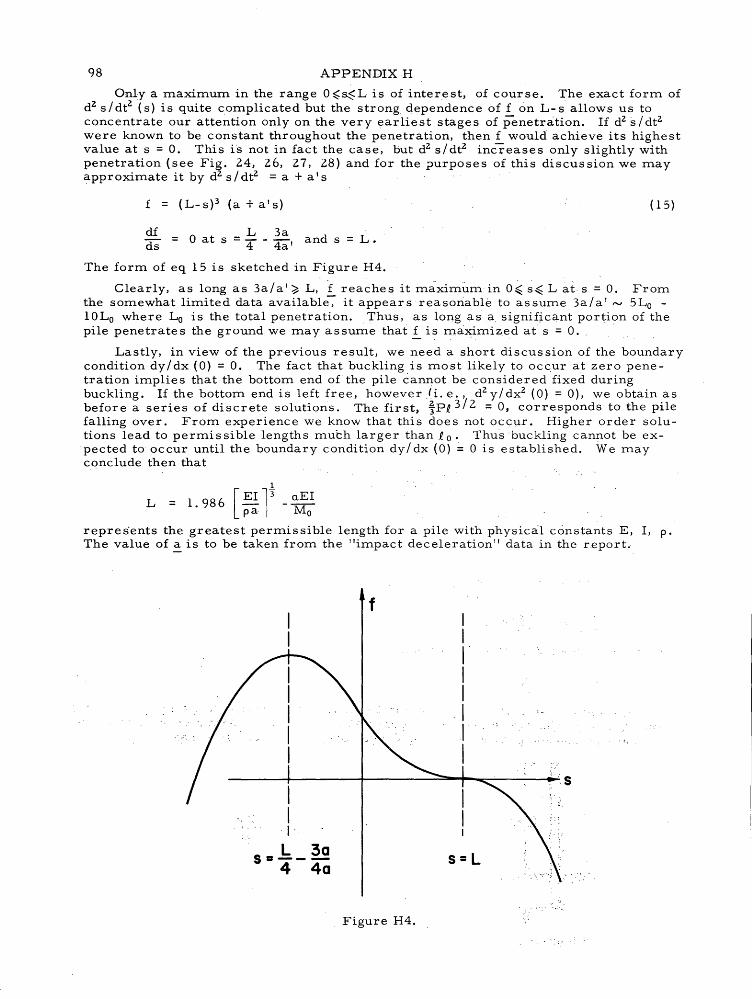
98 APPENDIXH
Only a maximum in the range 0 ~~L is of interest, of course. The exact form of dZ s/dtZ (s) is quite complicated but the strong dependence of f on L-s allows us to concentrate our attention only on the very earliest stages of penetration. If dZ s / dtZ
were known to be constant throughout the penetration, then f would achieve its highest value at s = O. This is not in fact the case, but dZ s/dtz increases only slightly with penetration (see Fig. 24, 26, 27, 28) and for the purposes of this discussion we may approximate it by d Z s/dtZ = a + a's
f = (L-s)3 (a + a's) (15 )
df L 3a ds = 0 at s = '4 - 4a' and s = L.
The form of eq 15 is sketched in Figure H4.
Clearly, as long as 3a/a' ~ L, 'f reaches it maximum in O~ s~ L at s = O. From the somewhat limited data available-;- it appear s reasonable to as sume 3a/ a' ,...., 5Lo -lOLo where Lo is the total penetration. Thus, as long as a signi#cant portion of the pile penetrates the ground we may assume that i... is maximized at s = O.
Lastly, in view of the previous result, we need a short discus sion of the boundary condition dy/dx (0) = O. The fact that buckling is most likely to occur at zero penetration implies that the bottom end of the pile cannot be considered fixed during buckling. If the bottom end is left free, however Ji. e., dZy/dxz (0) = 0), we obtain as before a series of discrete solutions. The first, ~Pf 3/2 = 0, corresponds to the pile falling over. From experience we know that this does not occur. Higher order solutions lead to permis sible lengths much larger than f o. Thus 'buckling cannot be expected to occur until the boundary condition dy/ dx (0) ~ 0 is established. We may conclude then that
1
= 1. 986 [EI l3 nEI pa - Mo L
repres"ents the greatest permissible length for a pile with physical constants E, I, p. The value of a is to be taken from the "impact deceleration" data in the r.eport.
f
------~--------~--------~~~~------~;S
I I I-
L 30 Sa---4 40
s=L
Figure H4.

.Unclas sified Securi ty Classification
DOCUMENT CONTROL DATA· R&D (Security classification 01 title. body 01 abstract and indexing annotation must be entered when the overall report is classified)
1. ORIGINATIN G ACTIVITY (Corporate author) 2a. REPORT SEC URI TV C LASSIFICA TION
Colorado School 6f Mines Research Foundation, Inc. Unclassified Golden, Colorado 2 b. GROUP
3. REPORT TITLE
MECHANICS OF PENETRATION OF PILES INTO PERMAFROST
4. DESCRIPTIVE NOTES (Type 01 report and inclusive dates)
Final Report 5. AUTHOR(S) (Last name. lirst name. initial)
Chares,t, Jacques; Duler,Philippe; and Rinehart, John S.
6. REPO RT DATE
Sept 65 8a. CONTRACT OR GRANT NO.
DA-11-190-ENG-92 b. PROJEC T NO.
c.
d.
10. A V A IL ABILITY /LIMITATION NOTICES
7a. TOTAL NO. OF PAGES j7b. NO. 0; REFS
116 9a. ORIGINATOR'S REPORT NUMBER(S)
9b. OTHER REPORT NO(S) (Any other numbers that may be assigned thIS report)
CRREL Technical Report 122
Distribution of this document is unlimited
11. SUPPL EMENTARY NOTES
13. ABSTRACT
12. SPONSORING MILITARY ACTIVITY
U. S.Army Cold Regions Research and Engineering Laboratory, Hanover, N. H.
Laboratory and field tests have been conducted to determine the feasibility of using rockets for driving piles. Phase I consisted of driving hollow circular model piles into. artificial permafrost u'sing guns. Measured parameters were the penetrations and impact velocities of piles having various masses and various external and internal diameter s. The main purpose of Phase II was the measur.ement, of parameter s in order to find' a physical meaning of the empirical equation developed in Phase 1. ,The field test program consisted of driving thin, hollow, full- size piles into natural permafrost using a rocket as the driving agent,' and measuring the same parameters as in Phase 1. The results indlcate that the use of rockets is technically feasible. It is estimated that a 6 in. nominal diameter pile of 0 .• 56-in. wall thickness coqld be driven 6 to 8 ft into permafrost by a 100,000 lb thrust rocket having an 80 msec burning duration. To resist collapse upon impact with the permafrost, the pile should have either a ,reinforcement shoe or a minimum wall thickness of O. 56 in. A design of an integrated pilerocket assembly meeting these requirements is proposed.
"
DO 1473 FORM , JAN «54 Unclas sified
seCurity Classification

Unclas sified Security Classification
14; LINK A LINK B LINK C KEY WORDS
ROLE ROLE WT ROLE WT
Pile driving.IIlethods . Foundation construction in permafrost
INSTRUCTIONS
1. ORIGINATING ACTIVITY: Enter the name and address of the contractor, subcontractor, grantee, Department of Defense {lctivity or other organization (corporate author) issuing the report.
2a. REPORT SECURITY CLASSIFICATION: Enter the overall security classification of the report. Indicate whether "Restricted Data" is included. Marking is to be in accordance with appropriate. security r~gu1ati<>ns.
2b. GROUP: Automatic downgrading is specified in 000 Directive 5200.10 and Armed Forces' Industrial Manual. Enter the group number. Also, when applicable, show that optional markings have been used for Group 3 and Group 4 'as author-ized. -
3. REPORT TITLE: Enter the complete report title in all capital letters. Titles in all cases should be unclassified. If a meaningful title cannot be selected without classifica-. tion, snow title classification in all capitals in parenthesis immediate'ly following the title.
4. DESCRIPTIVE NOTES: If appropriate, enter the type of report, e. g., interim, progress, summary, annual, or final. Give the inclusive dates when a specific reporting period is covered.
5. AUT HOR(S): Enter the name(s) of author(s) as shown on or in the, report •. ~nter last name, first name, middle initial. If military, show rank and branch of service. The 'name of the principal author is an absolute minimum requirement.
6. REPORT DATE: En~er the dateqf the report as day, month( year; or mO,nth, year. If more than one date appears on the report, use date of pUblication.
7 a. l TOT AL NU~BER OF PAGES: The total page count should follow normal pagination procedures" i.e.,: enter the number of pageS containi~g information.
7b. NUMBER OF REFERENCES: Enter'the total number of refereric'e'scited in the report. '
8a ... · CONTRACT ORG~A~T NUMBER: If appropriate, enter the applicabl.e number of the. contract :or grant under which the report was w;ritten.
8b, Sc, ,& 8d . . PROJECT NUMBER:, . Enter the appropriate military 'department identification, such as project numb~r, . subproject number, system numbers, task number, etc.
9a. ORIGINATOR'S REPORT NUMBER(S): Enter the offi-. cial report number by which the document will be identified and controlled by the originating activity. This number must be unique to this report.
9b. OTHER REPORT NUMBER(S): If the report has been assigned any other report numbers (either by the ori~inator or by the sponsor), also enter this number(s).
10. AVAILABILITY /LIMIT ATION NOTICES: Enter any lim-' itations on further dissemination of the report, other than those imposed by security classification, using standard statements such as:
(1) "Qualified requesters may obtain copies of this report from DDC."
(2) "Foreign announcement and dissemination of this report by DOC is not authorized." , , .
(3) "U. S. Government agencies may obtain copies of this report directly from DOC. Other qualified DOC users shall· request through
(4) "U. S. military agencies may obtain copies of this report directly from DOC. Other qualified users shall request through
"
(5) "All distribution of this report is controlled. Qualified DOC users shall request through
" If the report has been furnished to the Office of Technical
Services, Department of Commerce, for sale to the public, indicate .this fact and enter the price, if known.
11. SUPPLEMENTARY NOTES: Use for Illddit~~mal explana..; tory nGtes., ' 12. SPONSORING MILITARY ACTIVITY: ,Enter th~ name of the departmental project office or laboratory sponsoring (paY'" in~ for) the rese~rch and dev~lopment. Include address. 13. ABSTRACT: Enter an abstract giving a brief and factual su~maryof therlocument indicative of the report, even'though it may also appear elsewhere in the body of the technical report. If' additional space is required, acontinullltion sheet shatl be attached. .
It is highly desirableth'at the abst'ract of classifiedreports be' unclassified. Each :paragraph· of the abstract shall end with an indication of the military security classificiation of'the infor'mationin the paragraph, represented as (TS), (S), (C), or (U).
T.here is no llmitatiori on the length of the abstraCt. However, the suggesteci length is from 150 to 225 words.
14. KEY WORDS: Key words are technically meaningful terms or short phrases that characterize a report and may be used as index entries for cataloging the report. Key words must be selected so that no security classification is required.o Idenfiers. such as equipment model designation, trade name, military project code name, geographic location, may be used as key words but will be followed by an indication of technical context. The assignment of links, rules, and weights ~s optional.
Unclas sified Security Classification
Copyright © 2022 FDOKUMEN