Crowdsourcing Fact Extraction from Scientific Literature
12
Crowdsourcing Fact Extraction from Scientific Literature Christin Seifert 1 , Michael Granitzer 1 , Patrick H¨ ofler 2 , Belgin Mutlu 2 , Vedran Sabol 2 , Kai Schlegel 1 , Sebastian Bayerl 1 , Florian Stegmaier 1 , Stefan Zwicklbauer 1 , and Roman Kern 2 1 University of Passau Innstrae 33, 94032 Passau, Germany {<firstname>.<lastname>}@uni-passau.de http://uni-passau.de 2 Know-Center Inffeldgasse 13/6, 8010 Graz, Austria {phoefler,bmutlu,vsabol,rkern}@know-center.at http://know-center.at Abstract. Scientific publications constitute an extremely valuable body of knowledge and can be seen as the roots of our civilisation. However, with the exponential growth of written publications, comparing facts and findings between different research groups and communities becomes nearly impossible. In this paper, we present a conceptual approach and a first implementation for creating an open knowledge base of scientific knowledge mined from research publications. This requires to extract facts - mostly empirical observations - from unstructured texts (mainly PDF’s). Due to the importance of extracting facts with high-accuracy and the impreciseness of automatic methods, human quality control is of utmost importance. In order to establish such quality control mecha- nisms, we rely on intelligent visual interfaces and on establishing a toolset for crowdsourcing fact extraction, text mining and data integration tasks. Keywords: triplification, linked-open-data, web-based visual analytics, crowdsourcing, web 2.0 1 Introduction Scientific publications foster an extremely valuable body of knowledge and can be seen as the roots of our civilisation. However, with the exponential growth of written publications, comparing facts and findings between different research groups and communities becomes nearly impossible. For example, Armstrong et al. [1] conducted a meta-study on the improvements in ad-hoc retrieval conclud- ing that “.. there is little evidence of improvement in ad-hoc retrieval technology over the past decade. Baselines are generally weak, often being below the median original TREC system”. It could be expected, that more such results can be found in other tasks/disciplines. Efforts to overcome these issues are twofold.
-
Upload
independent -
Category
Documents
-
view
0 -
download
0
Transcript of Crowdsourcing Fact Extraction from Scientific Literature
Crowdsourcing Fact Extractionfrom Scientific Literature
Christin Seifert1, Michael Granitzer1, Patrick Hofler2, Belgin Mutlu2,Vedran Sabol2, Kai Schlegel1, Sebastian Bayerl1, Florian Stegmaier1, Stefan
Zwicklbauer1, and Roman Kern2
1University of PassauInnstrae 33, 94032 Passau, Germany
{<firstname>.<lastname>}@uni-passau.de
http://uni-passau.de
2Know-CenterInffeldgasse 13/6, 8010 Graz, Austria
{phoefler,bmutlu,vsabol,rkern}@know-center.at
http://know-center.at
Abstract. Scientific publications constitute an extremely valuable bodyof knowledge and can be seen as the roots of our civilisation. However,with the exponential growth of written publications, comparing factsand findings between different research groups and communities becomesnearly impossible. In this paper, we present a conceptual approach anda first implementation for creating an open knowledge base of scientificknowledge mined from research publications. This requires to extractfacts - mostly empirical observations - from unstructured texts (mainlyPDF’s). Due to the importance of extracting facts with high-accuracyand the impreciseness of automatic methods, human quality control isof utmost importance. In order to establish such quality control mecha-nisms, we rely on intelligent visual interfaces and on establishing a toolsetfor crowdsourcing fact extraction, text mining and data integration tasks.
Keywords: triplification, linked-open-data, web-based visual analytics,crowdsourcing, web 2.0
1 Introduction
Scientific publications foster an extremely valuable body of knowledge and canbe seen as the roots of our civilisation. However, with the exponential growthof written publications, comparing facts and findings between different researchgroups and communities becomes nearly impossible. For example, Armstrong etal. [1] conducted a meta-study on the improvements in ad-hoc retrieval conclud-ing that “.. there is little evidence of improvement in ad-hoc retrieval technologyover the past decade. Baselines are generally weak, often being below the medianoriginal TREC system”. It could be expected, that more such results can befound in other tasks/disciplines. Efforts to overcome these issues are twofold.
First, various researchers developed benchmarking frameworks (e.g. TIRA [2])for comparing different techniques and methodologies. Second, research data ispublished along with the regular papers. While both approaches are very impor-tant for the future of the research process, published papers usually do not maketheir research data explicit and reusable. In a recent paper, Holzinger et al. [3]showed that large-scale analysis of scientific papers can lead to new insights fordomain experts. The authors showed that many disease have a strong statisticalrelationship to rheumatic diseases – however, full interpretation of automaticallygenerated results must be performed by domain experts. It stands to reason thatif domain experts are given adequate tools to master the enormous amount ofscientific information, new, interesting, and helpful scientific knowledge could beobtained.
In this paper, we present a conceptual approach and first implementationfor creating an open knowledge base of scientific knowledge mined from researchpapers. We aim to leverage research findings into an explicit, factual knowl-edge base which is re-usable for future research. This requires to extract factsfrom scientific papers, which are mostly published in Portable Document Format(PDF). Because the extracted facts need to be highly accurate and the automaticmethods are imprecise, human quality control is of utmost importance. In orderto establish quality control, we rely on visual interfaces and on establishing atoolset for crowdsourcing fact extraction, text mining and data integration tasks.While our conceptual approach aims to extract facts from different sources, weemphasise fact extraction and integration from tabular data in this paper (see [4]for more details on the CODE project in general). In particular, we:
1. Define a semantic format for expressing empirical research facts in the novelRDF Data Cube Vocabulary.
2. Discuss the process for extracting tabular data from research papers andintegrating the single facts in those tables into the defined format. We showa first prototype along with a heuristic evaluation.
3. Discuss collaborative visual analytics applications on top of data cubes tofoster extraction, integration and analysis of facts. We provide the visualanalytics vocabulary, an ontology that supports semi-automatic mapping ofdata cubes to visualisations and sharing of the full state of visual analyticsapplications among collaborators.
Section 2 gives an overview of our approach, including a formal definition of thelanguage for representing facts. Sections 3 to 5 then describe the core steps ofour approach (table extraction, table normalisation and linking, web-based visualanalytics). A summary and directions of future work are given in section 6.
2 Approach
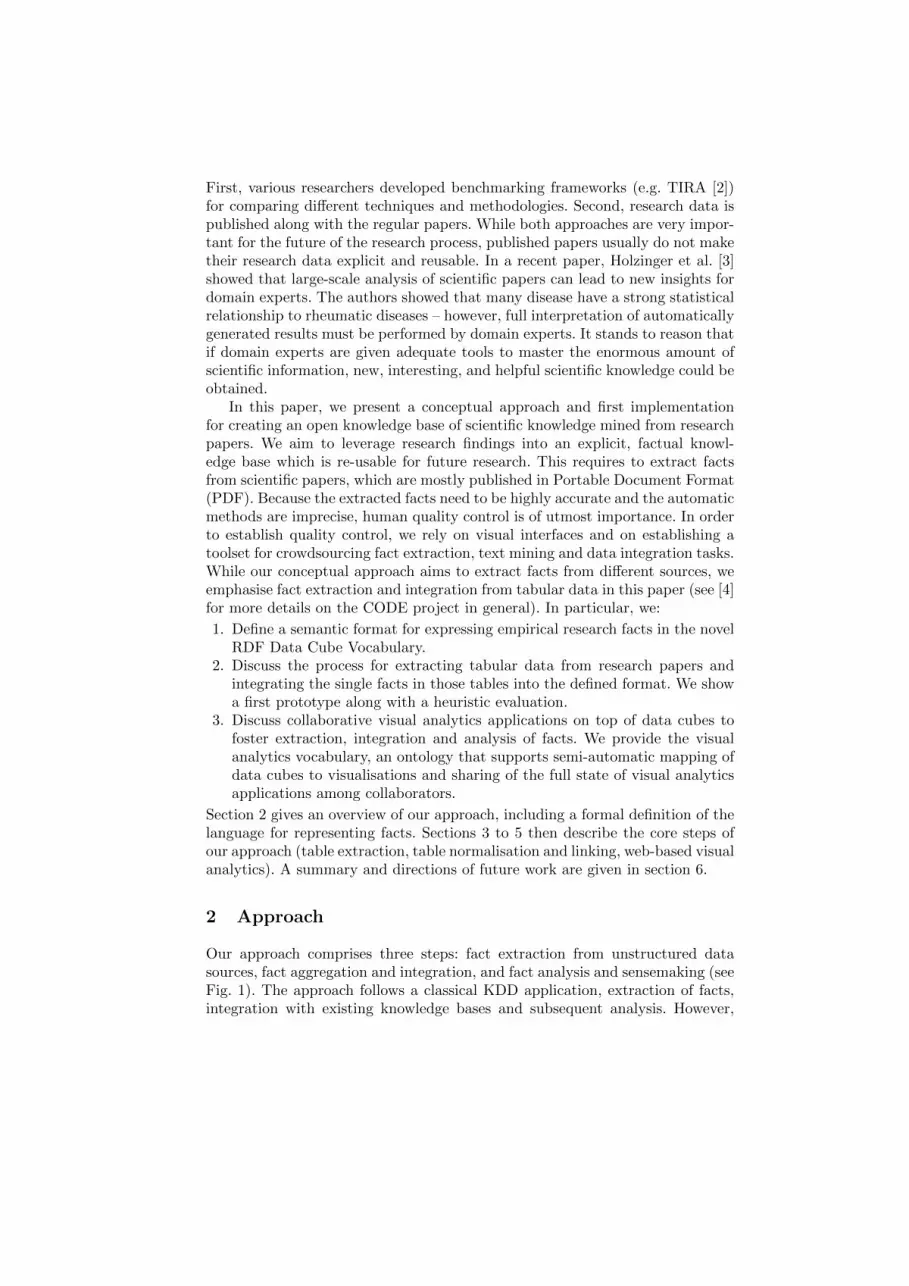
Our approach comprises three steps: fact extraction from unstructured datasources, fact aggregation and integration, and fact analysis and sensemaking (seeFig. 1). The approach follows a classical KDD application, extraction of facts,integration with existing knowledge bases and subsequent analysis. However,
Extraction Integration Analysis
Crowdsourcing
WorldFact-book
JohnPeel
(DBTune)
Pokedex
Pfam
US SEC(rdfabout)
LinkedLCCN
Europeana
EEA
IEEE
ChEMBL
SemanticXBRL
SWDogFood
CORDIS(FUB)
AGROVOC
OpenlyLocal
Discogs(Data
Incubator)
DBpedia
yovisto
Tele-graphis
tags2condelicious
NSF
MediCare
BrazilianPoli-
ticians
dotAC
ERA
OpenCyc
Italianpublic
schools
UB Mann-heim
JISC
MoseleyFolk
SemanticTweet
OS
GTAA
totl.net
OAI
Portu-guese
DBpedia
LOCAH
KEGGGlycan
CORDIS(RKB
Explorer)
UMBEL
Affy-metrix
riese
business.data.gov.
uk
OpenData
Thesau-rus
GeoLinkedData
UK Post-codes
SmartLink
ECCO-TCP
UniProt(Bio2RDF)
SSWThesau-
rus
RDFohloh
Freebase
LondonGazette
OpenCorpo-rates
Airports
GEMET
P20
TCMGeneDIT
Source CodeEcosystemLinked Data
OMIM
HellenicFBD
DataGov.ie
MusicBrainz
(DBTune)
data.gov.ukintervals
LODE
Climbing
SIDER
ProjectGuten-berg
MusicBrainz
(zitgist)
ProDom
HGNC
SMCJournals
Reactome
NationalRadio-activity
JP
legislationdata.gov.uk
AEMET
ProductTypes
Ontology
LinkedUser
Feedback
Revyu
GeneOntology
NHS(En-
AKTing)
URIBurner
DBTropes
Eurécom
ISTATImmi-
gration
LichfieldSpen-ding
SurgeRadio
Euro-stat
(FUB)
PiedmontAccomo-dations
NewYork
Times
Klapp-stuhl-club
EUNIS
Bricklink
reegle
CO2Emission
(En-AKTing)
AudioScrobbler(DBTune)
GovTrack
GovWILDECS
South-amptonEPrints
KEGGReaction
LinkedEDGAR
(OntologyCentral)
LIBRIS
OpenLibrary
KEGGDrug
research.data.gov.
uk
VIVOCornell
UniRef
WordNet(RKB
Explorer)
Cornetto
medu-cator
DDC DeutscheBio-
graphie
Wiki
Ulm
NASA(Data Incu-
bator)
BBCMusic
DrugBank
Turismode
Zaragoza
PlymouthReading
Lists
education.data.gov.
uk
KISTI
UniPathway
Eurostat(OntologyCentral)
OGOLOD
Twarql
MusicBrainz(Data
Incubator)
GeoNames
PubChem
ItalianMuseums
Good-win
Familyflickr
wrappr
Eurostat
Thesau-rus W
OpenLibrary(Talis)
LOIUS
LinkedGeoData
LinkedOpenColors
WordNet(VUA)
patents.data.gov.
uk
GreekDBpedia
SussexReading
Lists
MetofficeWeatherForecasts
GND
LinkedCT
SISVU
transport.data.gov.
uk
Didac-talia
dbpedialite
BNB
OntosNewsPortal
LAAS
ProductDB
iServe
Recht-spraak.
nl
KEGGCom-pound
GeoSpecies
VIVO UF
LinkedSensor Data(Kno.e.sis)
lobidOrgani-sations
LEM
LinkedCrunch-
base
FTS
OceanDrillingCodices
JanusAMP
ntnusc
WeatherStations
Amster-dam
Museum
lingvoj
Crime(En-
AKTing)
Course-ware
PubMed
ACM
BBCWildlifeFinder
Calames
Chronic-ling
America
data-open-
ac-uk
OpenElection
DataProject
Slide-share2RDF
FinnishMunici-palities
OpenEI
MARCCodes
List
VIVOIndiana
HellenicPD
LCSH
FanHubz
bibleontology
IdRefSudoc
KEGGEnzyme
NTUResource
Lists
PRO-SITE
LinkedOpen
Numbers
Energy(En-
AKTing)
Roma
OpenCalais
databnf.fr
lobidResources
IRIT
theses.fr
LOV
Rådatanå!
DailyMed
Taxo-nomy
New-castle
GoogleArt
wrapper
Poké-pédia
EURES
BibBase
RESEX
STITCH
PDB
EARTh
IBM
Last.FMartists
(DBTune)
YAGO
ECS(RKB
Explorer)
EventMedia
STW
myExperi-ment
BBCProgram-
mes
NDLsubjects
TaxonConcept
Pisa
KEGGPathway
UniParc
Jamendo(DBtune)
Popula-tion (En-AKTing)
Geo-WordNet
RAMEAUSH
UniSTS
Mortality(En-
AKTing)
AlpineSki
Austria
DBLP(RKB
Explorer)
Chem2Bio2RDF
MGI
DBLP(L3S)
Yahoo!Geo
Planet
GeneID
RDF BookMashup
El ViajeroTourism
Uberblic
SwedishOpen
CulturalHeritage
GESIS
datadcs
Last.FM(rdfize)
Ren.EnergyGenera-
tors
Sears
RAE2001
NSZLCatalog
Homolo-Gene
Ord-nanceSurvey
TWC LOGD
Disea-some
EUTCProduc-
tions
PSH
WordNet(W3C)
semanticweb.org
ScotlandGeo-
graphy
Magna-tune
Norwe-gian
MeSH
SGD
TrafficScotland
statistics.data.gov.
uk
CrimeReports
UK
UniProt
US Census(rdfabout)
Man-chesterReading
Lists
EU Insti-tutions
PBAC
VIAF
UN/LOCODE
Lexvo
LinkedMDB
ESDstan-dards
reference.data.gov.
uk
t4gminfo
Sudoc
ECSSouth-ampton
ePrints
Classical(DB
Tune)
DBLP(FU
Berlin)
Scholaro-meter
St.AndrewsResource
Lists
NVD
Fishesof
TexasScotlandPupils &Exams
RISKS
gnoss
DEPLOY
InterPro
Lotico
OxPoints
Enipedia
ndlna
Budapest
CiteSeer
semantic representation of facts traceable analysis process
Facts fromstructured &unstructuredsources
Fig. 1. The overall process for acquiring knowledge from scientific literature. All stepsare semi-automatic involving users for quality control, data enrichment and discovery.
every single step is imperfect, adding errors to the final results. In order toovercome these issues, we emphasise crowdsourcing mechanisms through visualinterfaces that engage users into quality control and enrichment processes. Inorder to conduct in-depth analysis of factual scientific knowledge we have todefine a consistent semantic format for representing facts. We use the RDFData Cube Vocabulary to achieve this. Given the RDF Data Cube Vocabulary,we have to address the following three questions in order to unleash the fullpotential for empirical facts:
1. How to extract data cubes from scientific papers? ⇒ section 3
2. How to integrate data cubes with existing linked data sources? ⇒ section 4
3. How to conduct visual analysis on extracted, integrated data cubes in acollaboratively? ⇒ section 5
As described above, we focus on empirical research data, which is mostly rep-resented in tables of scientific publications. Thus, we have to identify tables inunstructured texts, normalise these tables and link the table structure and con-tent to the Linked Data Cloud. All processing steps involve approaches, which donot always return perfect results when performed fully automatically. Thus, werequire user involvement for quality control, data set enrichment and knowledgediscovery. Hence, we developed visual interfaces in order to conduct the differentsteps semi-automatically. In the following we motivate the choice of representingfacts as RDF data cubes (section 2.1).
2.1 Semantic Representation of Facts
In order to conduct in-depth analysis of factual scientific knowledge, we have todefine the format for representing facts. In the last decade, Semantic Web lan-guages have emerged as a general format of expressing explicit knowledge andassociated facts. In their most basic form, RDF (Resource Description Format)1,information is represented as Subject, Predicate and Object patterns. Togetherwith languages of higher expressiveness, e.g., RDFS (RDF Schema)2 and OWL
1 http://www.w3.org/RDF/2 http://www.w3.org/TR/rdf-schema/
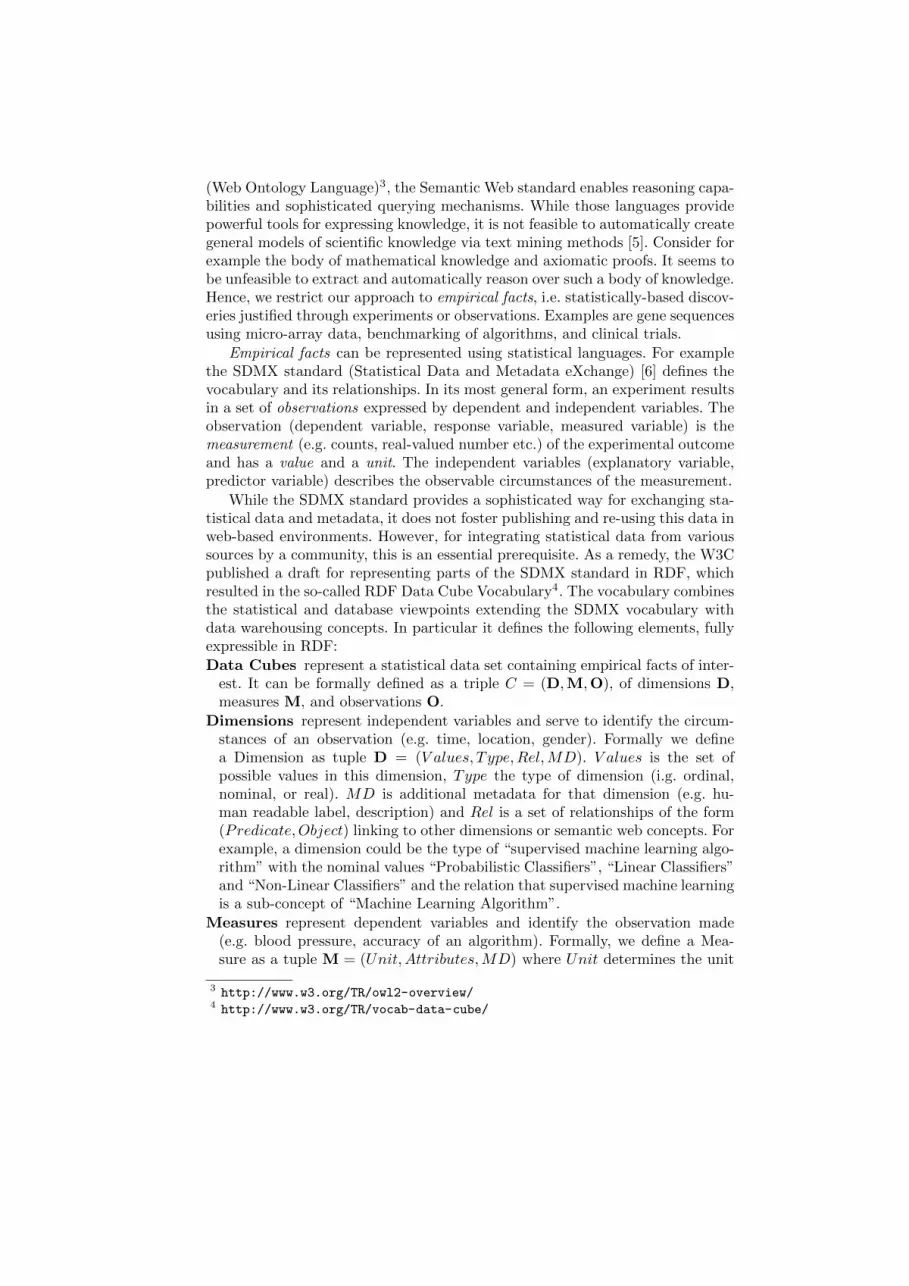
(Web Ontology Language)3, the Semantic Web standard enables reasoning capa-bilities and sophisticated querying mechanisms. While those languages providepowerful tools for expressing knowledge, it is not feasible to automatically creategeneral models of scientific knowledge via text mining methods [5]. Consider forexample the body of mathematical knowledge and axiomatic proofs. It seems tobe unfeasible to extract and automatically reason over such a body of knowledge.Hence, we restrict our approach to empirical facts, i.e. statistically-based discov-eries justified through experiments or observations. Examples are gene sequencesusing micro-array data, benchmarking of algorithms, and clinical trials.
Empirical facts can be represented using statistical languages. For examplethe SDMX standard (Statistical Data and Metadata eXchange) [6] defines thevocabulary and its relationships. In its most general form, an experiment resultsin a set of observations expressed by dependent and independent variables. Theobservation (dependent variable, response variable, measured variable) is themeasurement (e.g. counts, real-valued number etc.) of the experimental outcomeand has a value and a unit. The independent variables (explanatory variable,predictor variable) describes the observable circumstances of the measurement.
While the SDMX standard provides a sophisticated way for exchanging sta-tistical data and metadata, it does not foster publishing and re-using this data inweb-based environments. However, for integrating statistical data from varioussources by a community, this is an essential prerequisite. As a remedy, the W3Cpublished a draft for representing parts of the SDMX standard in RDF, whichresulted in the so-called RDF Data Cube Vocabulary4. The vocabulary combinesthe statistical and database viewpoints extending the SDMX vocabulary withdata warehousing concepts. In particular it defines the following elements, fullyexpressible in RDF:
Data Cubes represent a statistical data set containing empirical facts of inter-est. It can be formally defined as a triple C = (D,M,O), of dimensions D,measures M, and observations O.
Dimensions represent independent variables and serve to identify the circum-stances of an observation (e.g. time, location, gender). Formally we definea Dimension as tuple D = (V alues, Type,Rel,MD). V alues is the set ofpossible values in this dimension, Type the type of dimension (i.g. ordinal,nominal, or real). MD is additional metadata for that dimension (e.g. hu-man readable label, description) and Rel is a set of relationships of the form(Predicate,Object) linking to other dimensions or semantic web concepts. Forexample, a dimension could be the type of “supervised machine learning algo-rithm” with the nominal values “Probabilistic Classifiers”, “Linear Classifiers”and “Non-Linear Classifiers” and the relation that supervised machine learningis a sub-concept of “Machine Learning Algorithm”.
Measures represent dependent variables and identify the observation made(e.g. blood pressure, accuracy of an algorithm). Formally, we define a Mea-sure as a tuple M = (Unit, Attributes,MD) where Unit determines the unit
3 http://www.w3.org/TR/owl2-overview/4 http://www.w3.org/TR/vocab-data-cube/
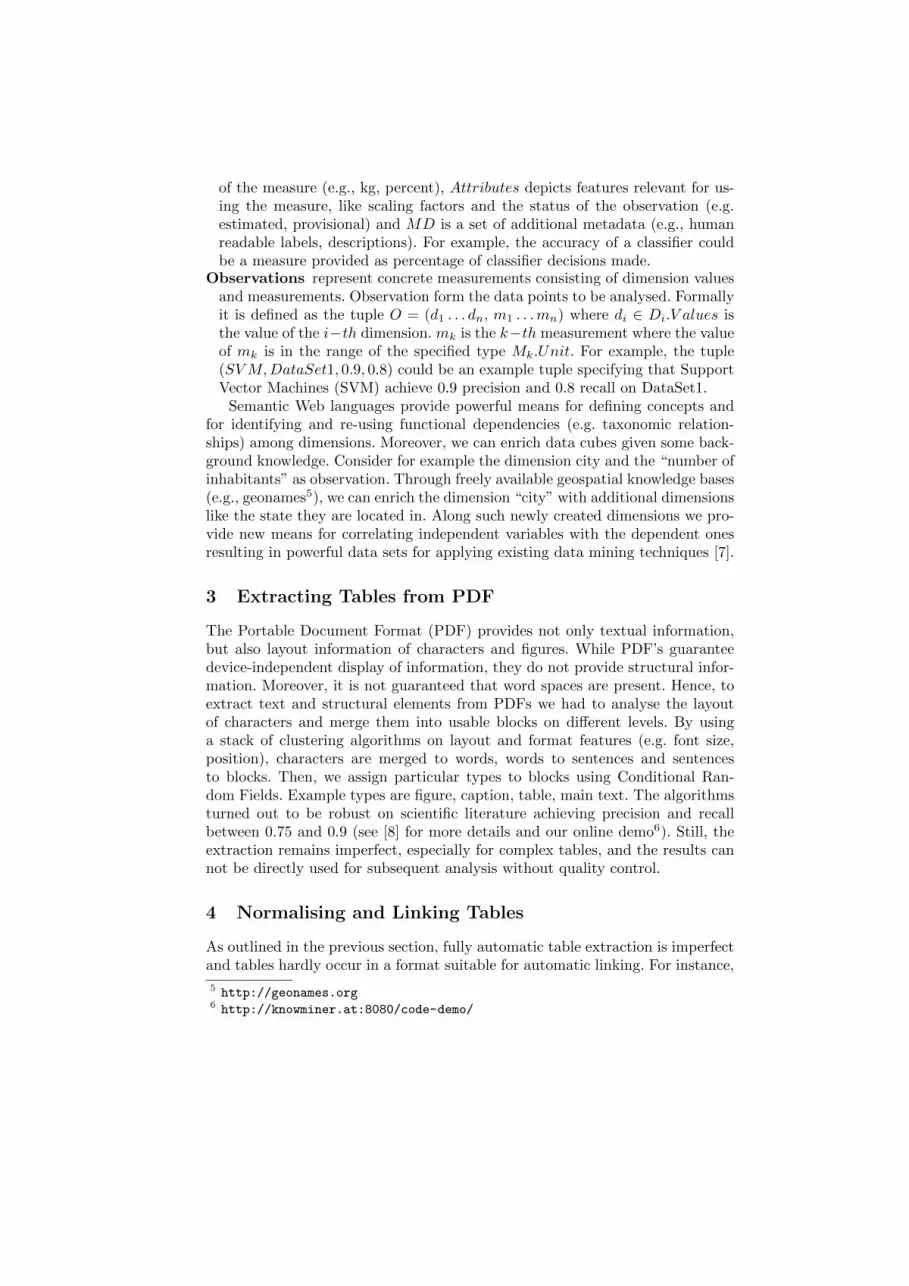
of the measure (e.g., kg, percent), Attributes depicts features relevant for us-ing the measure, like scaling factors and the status of the observation (e.g.estimated, provisional) and MD is a set of additional metadata (e.g., humanreadable labels, descriptions). For example, the accuracy of a classifier couldbe a measure provided as percentage of classifier decisions made.
Observations represent concrete measurements consisting of dimension valuesand measurements. Observation form the data points to be analysed. Formallyit is defined as the tuple O = (d1 . . . dn, m1 . . .mn) where di ∈ Di.V alues isthe value of the i−th dimension. mk is the k−th measurement where the valueof mk is in the range of the specified type Mk.Unit. For example, the tuple(SVM,DataSet1, 0.9, 0.8) could be an example tuple specifying that SupportVector Machines (SVM) achieve 0.9 precision and 0.8 recall on DataSet1.
Semantic Web languages provide powerful means for defining concepts andfor identifying and re-using functional dependencies (e.g. taxonomic relation-ships) among dimensions. Moreover, we can enrich data cubes given some back-ground knowledge. Consider for example the dimension city and the “number ofinhabitants” as observation. Through freely available geospatial knowledge bases(e.g., geonames5), we can enrich the dimension “city” with additional dimensionslike the state they are located in. Along such newly created dimensions we pro-vide new means for correlating independent variables with the dependent onesresulting in powerful data sets for applying existing data mining techniques [7].
3 Extracting Tables from PDF
The Portable Document Format (PDF) provides not only textual information,but also layout information of characters and figures. While PDF’s guaranteedevice-independent display of information, they do not provide structural infor-mation. Moreover, it is not guaranteed that word spaces are present. Hence, toextract text and structural elements from PDFs we had to analyse the layoutof characters and merge them into usable blocks on different levels. By usinga stack of clustering algorithms on layout and format features (e.g. font size,position), characters are merged to words, words to sentences and sentencesto blocks. Then, we assign particular types to blocks using Conditional Ran-dom Fields. Example types are figure, caption, table, main text. The algorithmsturned out to be robust on scientific literature achieving precision and recallbetween 0.75 and 0.9 (see [8] for more details and our online demo6). Still, theextraction remains imperfect, especially for complex tables, and the results cannot be directly used for subsequent analysis without quality control.
4 Normalising and Linking Tables
As outlined in the previous section, fully automatic table extraction is imperfectand tables hardly occur in a format suitable for automatic linking. For instance,
5 http://geonames.org6 http://knowminer.at:8080/code-demo/
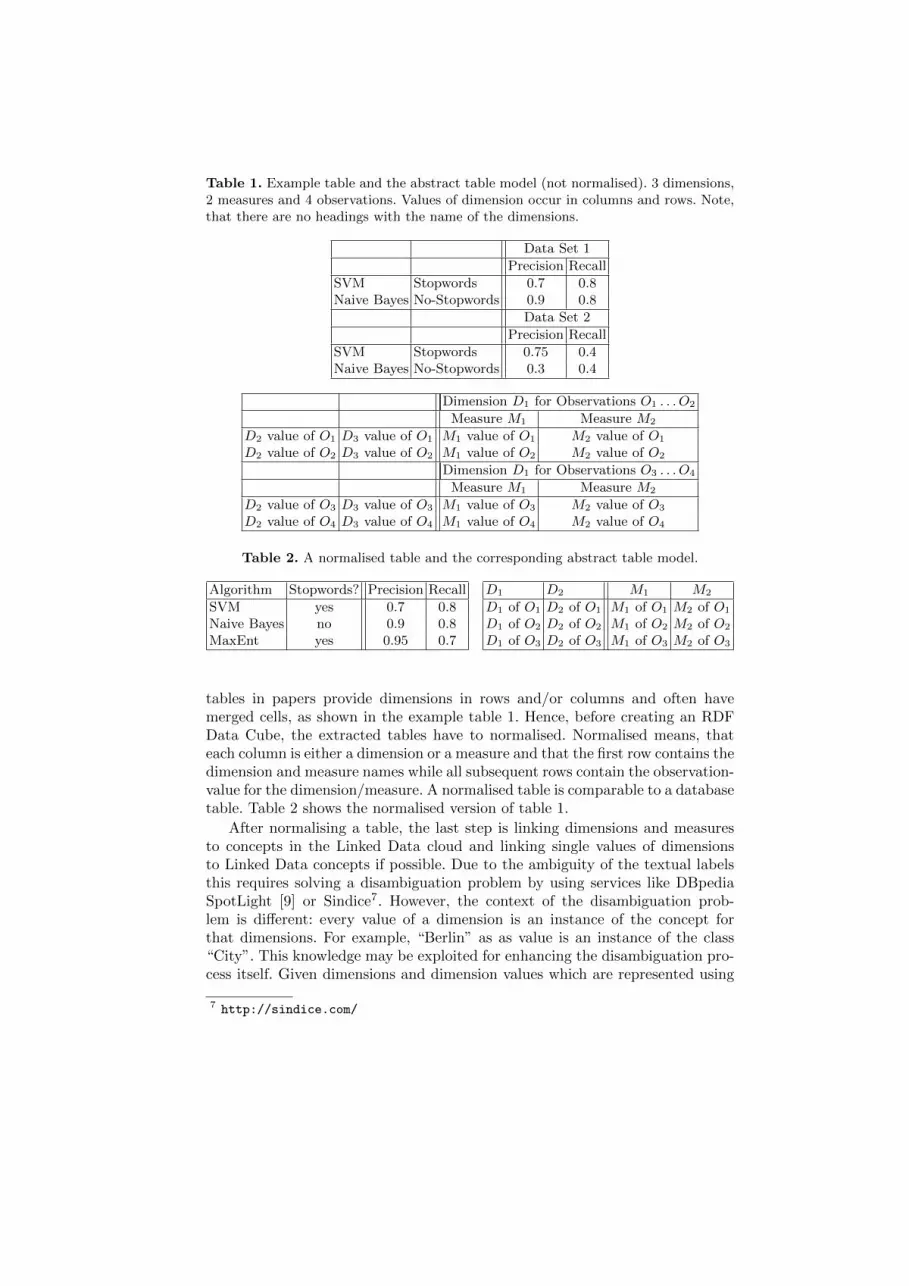
Table 1. Example table and the abstract table model (not normalised). 3 dimensions,2 measures and 4 observations. Values of dimension occur in columns and rows. Note,that there are no headings with the name of the dimensions.
Data Set 1
Precision Recall
SVM Stopwords 0.7 0.8Naive Bayes No-Stopwords 0.9 0.8
Data Set 2
Precision Recall
SVM Stopwords 0.75 0.4Naive Bayes No-Stopwords 0.3 0.4
Dimension D1 for Observations O1 . . . O2
Measure M1 Measure M2
D2 value of O1 D3 value of O1 M1 value of O1 M2 value of O1
D2 value of O2 D3 value of O2 M1 value of O2 M2 value of O2
Dimension D1 for Observations O3 . . . O4
Measure M1 Measure M2
D2 value of O3 D3 value of O3 M1 value of O3 M2 value of O3
D2 value of O4 D3 value of O4 M1 value of O4 M2 value of O4
Table 2. A normalised table and the corresponding abstract table model.
Algorithm Stopwords? Precision Recall
SVM yes 0.7 0.8Naive Bayes no 0.9 0.8MaxEnt yes 0.95 0.7
D1 D2 M1 M2
D1 of O1 D2 of O1 M1 of O1 M2 of O1
D1 of O2 D2 of O2 M1 of O2 M2 of O2
D1 of O3 D2 of O3 M1 of O3 M2 of O3
tables in papers provide dimensions in rows and/or columns and often havemerged cells, as shown in the example table 1. Hence, before creating an RDFData Cube, the extracted tables have to normalised. Normalised means, thateach column is either a dimension or a measure and that the first row contains thedimension and measure names while all subsequent rows contain the observation-value for the dimension/measure. A normalised table is comparable to a databasetable. Table 2 shows the normalised version of table 1.
After normalising a table, the last step is linking dimensions and measuresto concepts in the Linked Data cloud and linking single values of dimensionsto Linked Data concepts if possible. Due to the ambiguity of the textual labelsthis requires solving a disambiguation problem by using services like DBpediaSpotLight [9] or Sindice7. However, the context of the disambiguation prob-lem is different: every value of a dimension is an instance of the concept forthat dimensions. For example, “Berlin” as as value is an instance of the class“City”. This knowledge may be exploited for enhancing the disambiguation pro-cess itself. Given dimensions and dimension values which are represented using
7 http://sindice.com/
Semantic Web concepts, we are able to add additional dimensions exploitingsemantic predicates like taxonomic or mereotopological relationships or identifysuch relationships between existing columns. Hence, we get new, enriched datasets that allow to conduct analysis beyond the originally intended scope. Suchanalysis can be done automatically or by using visual interfaces. As outlinedin the next section, we emphasise the latter one. Both steps, table normalisa-tion and linking, are performed semi-automatically, including users’ backgroundknowledge for correcting and refining the automatic methods. The next sectiondescribes the prototypical implementation of this semi-automatic approach.
4.1 Prototypical Implementation
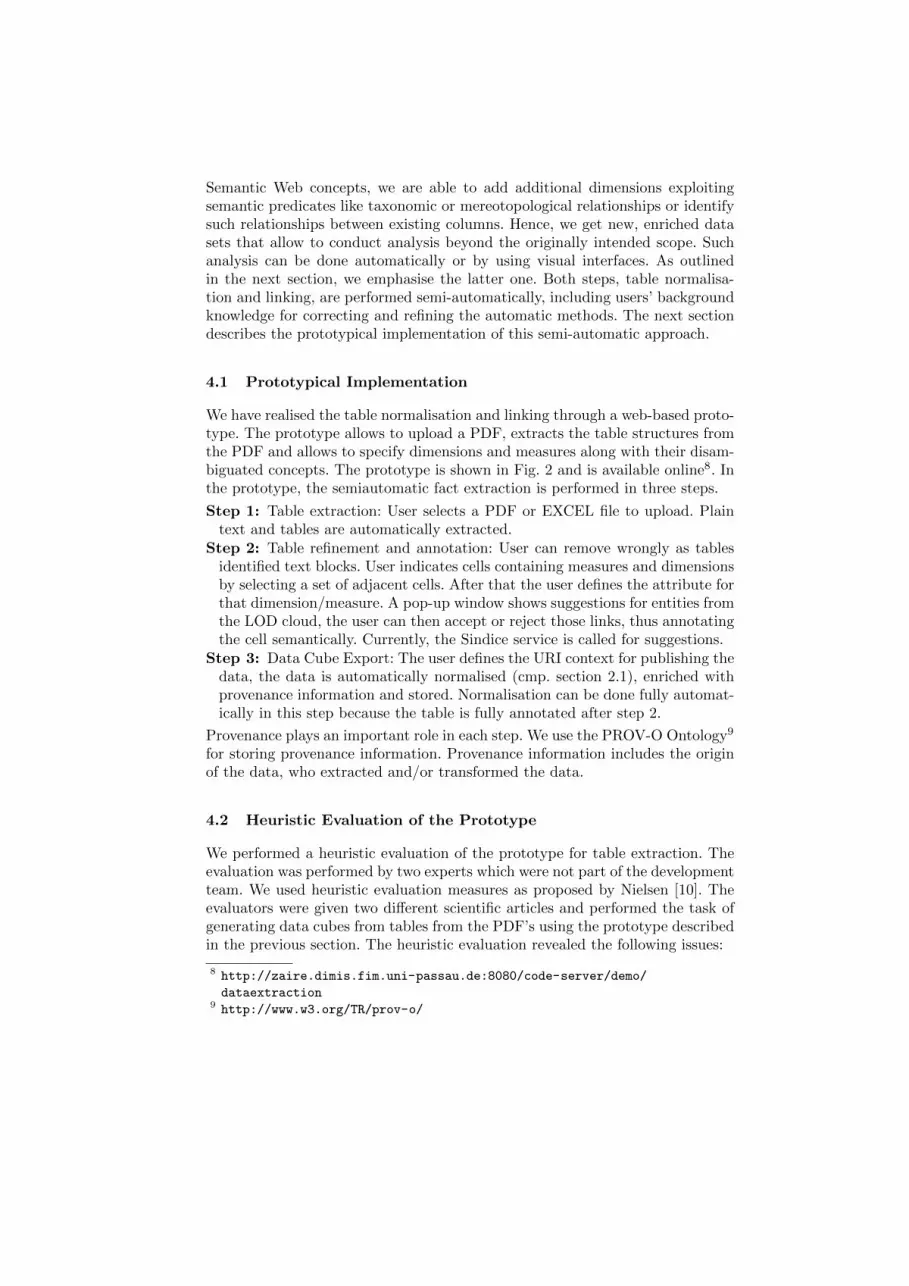
We have realised the table normalisation and linking through a web-based proto-type. The prototype allows to upload a PDF, extracts the table structures fromthe PDF and allows to specify dimensions and measures along with their disam-biguated concepts. The prototype is shown in Fig. 2 and is available online8. Inthe prototype, the semiautomatic fact extraction is performed in three steps.
Step 1: Table extraction: User selects a PDF or EXCEL file to upload. Plaintext and tables are automatically extracted.
Step 2: Table refinement and annotation: User can remove wrongly as tablesidentified text blocks. User indicates cells containing measures and dimensionsby selecting a set of adjacent cells. After that the user defines the attribute forthat dimension/measure. A pop-up window shows suggestions for entities fromthe LOD cloud, the user can then accept or reject those links, thus annotatingthe cell semantically. Currently, the Sindice service is called for suggestions.
Step 3: Data Cube Export: The user defines the URI context for publishing thedata, the data is automatically normalised (cmp. section 2.1), enriched withprovenance information and stored. Normalisation can be done fully automat-ically in this step because the table is fully annotated after step 2.
Provenance plays an important role in each step. We use the PROV-O Ontology9
for storing provenance information. Provenance information includes the originof the data, who extracted and/or transformed the data.
4.2 Heuristic Evaluation of the Prototype
We performed a heuristic evaluation of the prototype for table extraction. Theevaluation was performed by two experts which were not part of the developmentteam. We used heuristic evaluation measures as proposed by Nielsen [10]. Theevaluators were given two different scientific articles and performed the task ofgenerating data cubes from tables from the PDF’s using the prototype describedin the previous section. The heuristic evaluation revealed the following issues:
8 http://zaire.dimis.fim.uni-passau.de:8080/code-server/demo/
dataextraction9 http://www.w3.org/TR/prov-o/
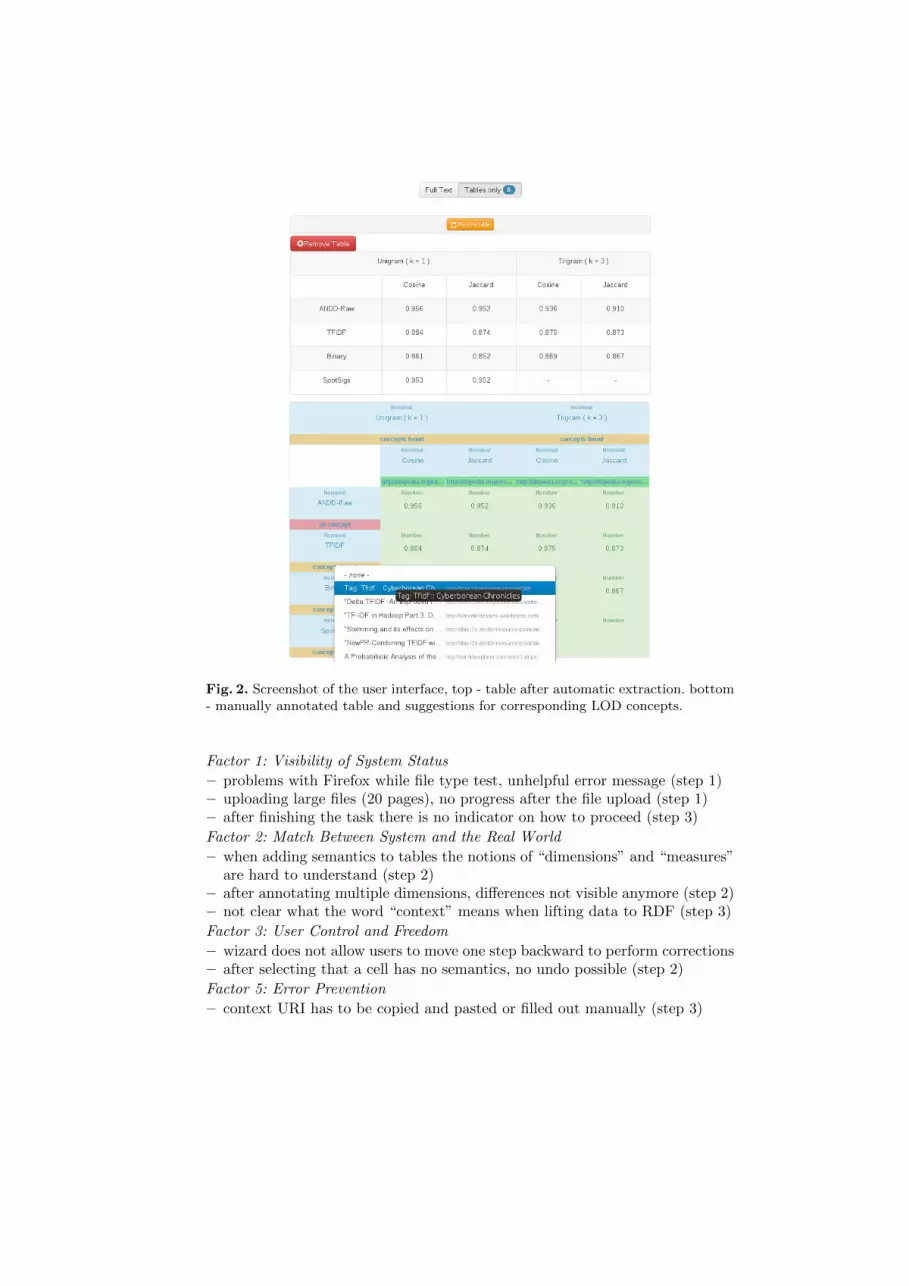
Fig. 2. Screenshot of the user interface, top - table after automatic extraction. bottom- manually annotated table and suggestions for corresponding LOD concepts.
Factor 1: Visibility of System Status
– problems with Firefox while file type test, unhelpful error message (step 1)– uploading large files (20 pages), no progress after the file upload (step 1)– after finishing the task there is no indicator on how to proceed (step 3)
Factor 2: Match Between System and the Real World
– when adding semantics to tables the notions of “dimensions” and “measures”are hard to understand (step 2)
– after annotating multiple dimensions, differences not visible anymore (step 2)– not clear what the word “context” means when lifting data to RDF (step 3)
Factor 3: User Control and Freedom
– wizard does not allow users to move one step backward to perform corrections– after selecting that a cell has no semantics, no undo possible (step 2)
Factor 5: Error Prevention
– context URI has to be copied and pasted or filled out manually (step 3)
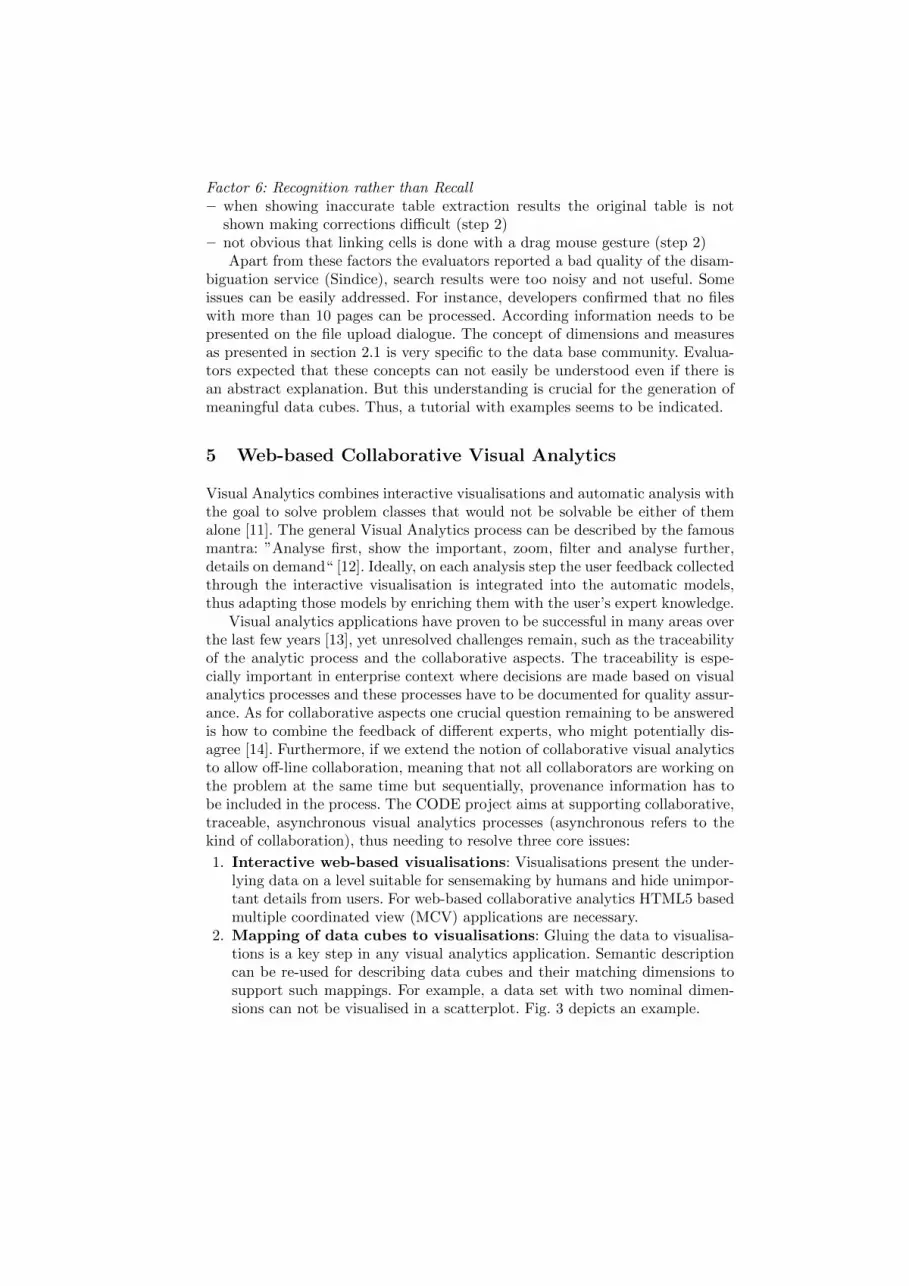
Factor 6: Recognition rather than Recall– when showing inaccurate table extraction results the original table is not
shown making corrections difficult (step 2)– not obvious that linking cells is done with a drag mouse gesture (step 2)
Apart from these factors the evaluators reported a bad quality of the disam-biguation service (Sindice), search results were too noisy and not useful. Someissues can be easily addressed. For instance, developers confirmed that no fileswith more than 10 pages can be processed. According information needs to bepresented on the file upload dialogue. The concept of dimensions and measuresas presented in section 2.1 is very specific to the data base community. Evalua-tors expected that these concepts can not easily be understood even if there isan abstract explanation. But this understanding is crucial for the generation ofmeaningful data cubes. Thus, a tutorial with examples seems to be indicated.
5 Web-based Collaborative Visual Analytics
Visual Analytics combines interactive visualisations and automatic analysis withthe goal to solve problem classes that would not be solvable be either of themalone [11]. The general Visual Analytics process can be described by the famousmantra: ”Analyse first, show the important, zoom, filter and analyse further,details on demand“ [12]. Ideally, on each analysis step the user feedback collectedthrough the interactive visualisation is integrated into the automatic models,thus adapting those models by enriching them with the user’s expert knowledge.
Visual analytics applications have proven to be successful in many areas overthe last few years [13], yet unresolved challenges remain, such as the traceabilityof the analytic process and the collaborative aspects. The traceability is espe-cially important in enterprise context where decisions are made based on visualanalytics processes and these processes have to be documented for quality assur-ance. As for collaborative aspects one crucial question remaining to be answeredis how to combine the feedback of different experts, who might potentially dis-agree [14]. Furthermore, if we extend the notion of collaborative visual analyticsto allow off-line collaboration, meaning that not all collaborators are working onthe problem at the same time but sequentially, provenance information has tobe included in the process. The CODE project aims at supporting collaborative,traceable, asynchronous visual analytics processes (asynchronous refers to thekind of collaboration), thus needing to resolve three core issues:
1. Interactive web-based visualisations: Visualisations present the under-lying data on a level suitable for sensemaking by humans and hide unimpor-tant details from users. For web-based collaborative analytics HTML5 basedmultiple coordinated view (MCV) applications are necessary.
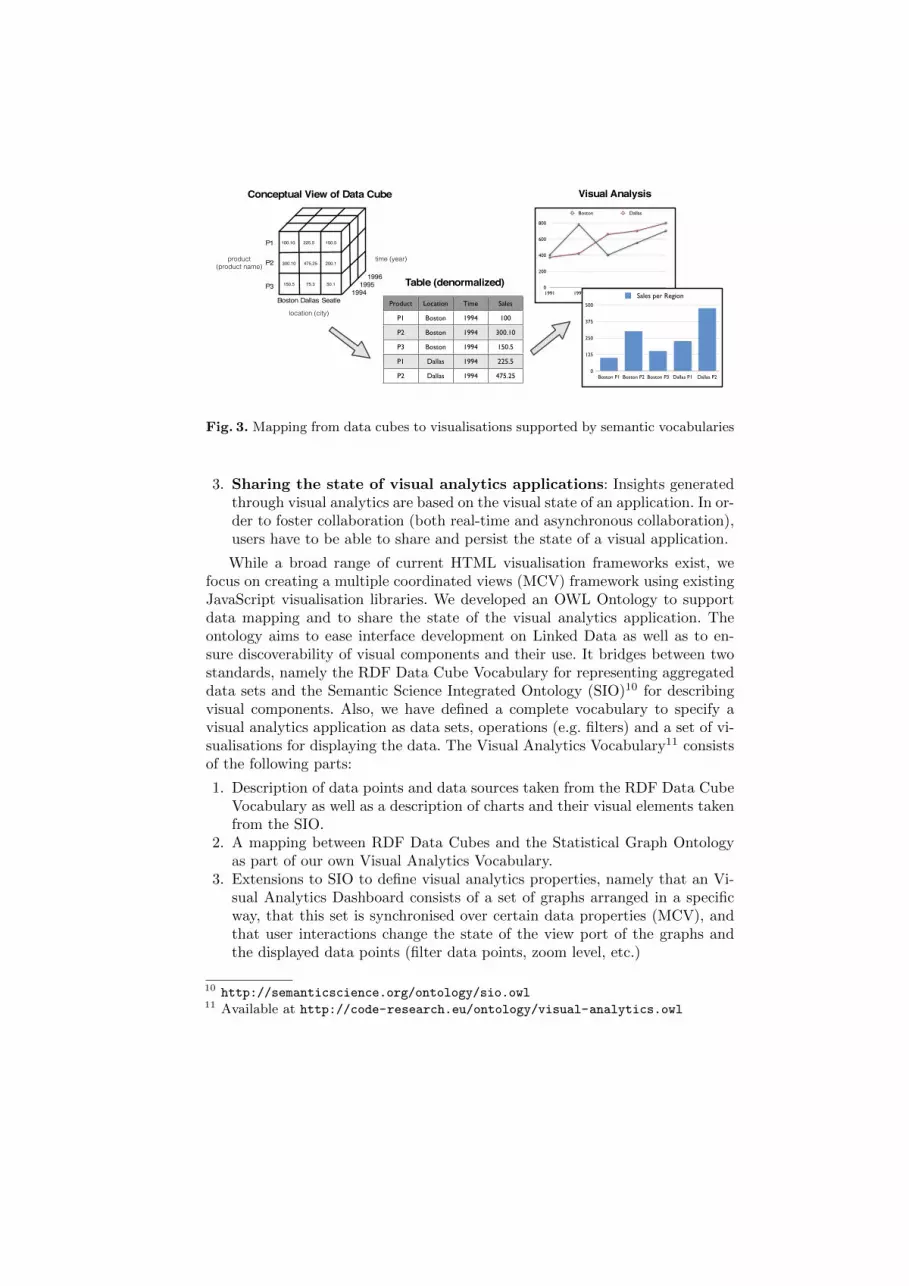
2. Mapping of data cubes to visualisations: Gluing the data to visualisa-tions is a key step in any visual analytics application. Semantic descriptioncan be re-used for describing data cubes and their matching dimensions tosupport such mappings. For example, a data set with two nominal dimen-sions can not be visualised in a scatterplot. Fig. 3 depicts an example.
P1
P2
P3
Boston Dallas Seatle199419951996
100.10 225.5 150.5
300.10 475.25 200.1
150.5 75.3 50.1
time (year)
location (city)
product(product name)
Conceptual View of Data Cube
Table (denormalized)
Visual Analysis
Product Location Time Sales
P1 Boston 1994 100
P2 Boston 1994 300.10
P3 Boston 1994 150.5
P1 Dallas 1994 225.5
P2 Dallas 1994 475.25
0
200
400
600
800
1991 1992 1993 1994 1995
Boston Dallas
0
125
250
375
500
Boston P1 Boston P2 Boston P3 Dallas P1 Dallas P2
Sales per Region
Fig. 3. Mapping from data cubes to visualisations supported by semantic vocabularies
3. Sharing the state of visual analytics applications: Insights generatedthrough visual analytics are based on the visual state of an application. In or-der to foster collaboration (both real-time and asynchronous collaboration),users have to be able to share and persist the state of a visual application.
While a broad range of current HTML visualisation frameworks exist, wefocus on creating a multiple coordinated views (MCV) framework using existingJavaScript visualisation libraries. We developed an OWL Ontology to supportdata mapping and to share the state of the visual analytics application. Theontology aims to ease interface development on Linked Data as well as to en-sure discoverability of visual components and their use. It bridges between twostandards, namely the RDF Data Cube Vocabulary for representing aggregateddata sets and the Semantic Science Integrated Ontology (SIO)10 for describingvisual components. Also, we have defined a complete vocabulary to specify avisual analytics application as data sets, operations (e.g. filters) and a set of vi-sualisations for displaying the data. The Visual Analytics Vocabulary11 consistsof the following parts:
1. Description of data points and data sources taken from the RDF Data CubeVocabulary as well as a description of charts and their visual elements takenfrom the SIO.
2. A mapping between RDF Data Cubes and the Statistical Graph Ontologyas part of our own Visual Analytics Vocabulary.
3. Extensions to SIO to define visual analytics properties, namely that an Vi-sual Analytics Dashboard consists of a set of graphs arranged in a specificway, that this set is synchronised over certain data properties (MCV), andthat user interactions change the state of the view port of the graphs andthe displayed data points (filter data points, zoom level, etc.)
10 http://semanticscience.org/ontology/sio.owl11 Available at http://code-research.eu/ontology/visual-analytics.owl
In our vision, the visual analytics vocabulary in combination with the RDFData Cube vocabulary will allow open, collaborative visual analytics applicationyielding a new kind of large-scale, web-based virtual analytics. The ontology isdescribed in detail in [15] and a first prototype is currently available online12.
6 Conclusion and Future Work
We presented a conceptual approach for creating a open knowledge base of sci-entific knowledge mined from research publications. We detailed the necessarysteps and concluded that all three steps (extraction, integration, and analysis)can not be done fully automatically. Our work is a first step in the direction ofa large scale visual analytics application for analysis of results published in sci-entific papers. Domain experts can upload papers, extract findings and comparefindings from different publications and making informed judgements.
The presented approach includes crowdsourcing concepts in the following twoways: First, extracted cubes are stored in a central repository and can be sharedamong users. These stored cubes represent not only facts from papers, but alsousers’ background knowledge integrated through the semi-automatic annotationprocess. Cube sharing allows collaborative visual analysis, potentially leading toinsights that otherwise not possible. Second, in the table linking step, the useris presented with suggestions from a disambiguation service. User’s decisions ofaccepting, rejecting or creating new concepts are collected and are planned tobe used to improve the link suggestions. This user feedback to the link sugges-tion service, which is technically a table disambiguation service, is currently notexploited, but a service integrating those suggestions is under development.
While the conceptual approach seems sound, our prototypes are not fullyusable by domain experts, yet. The developed prototypes for each steps need tobe effectively combined into a consistent web application to allow flawless anduser-friendly semi-automatic fact extraction and analysis for scientific papers.Further, cubes extracted by other users can be combined with own extractedcubes allowing collaborative analysis.
We presented a heuristic evaluation of a prototype of web-based user interfacefor table extraction. We will improve the prototype addressing issues detected bythe heuristic evaluation. For improving the quality of the automatic suggestionsour own disambiguation service is developed within the CODE project aimingat providing high-quality suggestions for LOD entities and replacing Sindice inthe final version.
Acknowledgements. The presented work was developed within the CODE project
funded by the EU Seventh Framework Programme, grant agreement number 296150.
The Know-Center is funded within the Austrian COMET Program under the auspices
of the Austrian Ministry of Transport, Innovation and Technology, the Austrian Min-
istry of Economics, Family and Youth and by the State of Styria. COMET is managed
by the Austrian Research Promotion Agency FFG.
12 http://code.know-center.tugraz.at/vis
References
1. Armstrong, T.G., Moffat, A., Webber, W., Zobel, J.: Improvements that don’t addup: ad-hoc retrieval results since 1998. In: Proceedings of the 18th ACM conferenceon Information and knowledge management. CIKM ’09, New York, NY, USA, ACM(2009) 601–610
2. Gollub, T., Stein, B., Burrows, S.: Ousting Ivory Tower Research: Towards aWeb Framework for Providing Experiments as a Service. In Hersh, B., Callan, J.,Maarek, Y., Sanderson, M., eds.: 35th International ACM Conference on Researchand Development in Information Retrieval (SIGIR 12), ACM (2012) 1125–1126
3. Holzinger, A., Simonic, K.M., Yildirim, P.: Disease-disease relationships forrheumatic diseases: Web-based biomedical textmining an knowledge discovery toassist medical decision making. In: Computer Software and Applications Confer-ence (COMPSAC), 2012 IEEE 36th Annual. (2012) 573–580
4. Stegmaier, F., Seifert, C., Kern, R., Hofler, P., Bayerl, S., Granitzer, M., Kosch,H., Lindstaedt, S., Mutlu, B., Sabol, V., Schlegel, K., Zwicklbauer, S.: Unleashingsemantics of research data. In: Proceedings of the 2nd Workshop on Big DataBenchmarking. (2012)
5. Hazman, M., El-Beltagy, S.R., Rafea, A.: A survey of ontology learning approaches.International Journal of Computer Applications 22 (2011) 36–43 Published byFoundation of Computer Science.
6. Gillman, D.W.: Common metadata constructs for statistical data. Proceedings ofStatistics Canada Symposium 2005 (2005) 9 Symposium 2005 : MethodologicalChallenges for Future Information needs Catalogue no. 11-522-XIE.
7. Paulheim, H., Furnkranz, J.: Unsupervised generation of data mining features fromlinked open data. In: International Conference on Web Intelligence and Semantics(WIMS’12). (2012)
8. Kern, R., Jack, K., Hristakeva, M.: TeamBeam – Meta-Data Extraction fromScientific Literature. D-Lib Magazine 18 (2012)
9. Mendes, P.N., Jakob, M., Garcıa-Silva, A., Bizer, C.: Dbpedia spotlight: sheddinglight on the web of documents. In: Proceedings of the 7th International Conferenceon Semantic Systems. I-Semantics ’11, New York, NY, USA, ACM (2011) 1–8
10. Nielsen, J.: Enhancing the explanatory power of usability heuristics. In: Proceed-ings of the SIGCHI Conference on Human Factors in Computing Systems. CHI’94, New York, NY, USA, ACM (1994) 152–158
11. Thomas, J.J., Cook, K.A., eds.: Illuminating the Path: The Research and Devel-opment Agenda for Visual Analytics. IEEE Computer Society (2005)
12. Keim, D.A., Mansmann, F., Thomas, J.: Visual analytics: how much visualizationand how much analytics? SIGKDD Explor. Newsl. 11 (2010) 5–8
13. Keim, D.A., Mansmann, F., Oelke, D., Ziegler, H.: Visual analytics: Combiningautomated discovery with interactive visualizations. In: Discovery Science (DS2008). LNAI (2008) 2–14
14. Heer, J., Agrawala, M.: Design considerations for collaborative visual analytics.In: Visual Analytics Science and Technology, 2007. VAST 2007. IEEE Symposiumon. (2007) 171 –178
15. Mutlu, B., Hoefler, P., Granitzer, M., Sabol, V.: D 4.1 - Semantic Descriptions forVisual Analytics Components (2012)