Cross-National Differences in Special Education Coverage: An Empirical Analysis
16
http://ecx.sagepub.com/ Exceptional Children http://ecx.sagepub.com/content/80/3/353 The online version of this article can be found at: DOI: 10.1177/0014402914522421 2014 80: 353 Exceptional Children Dimitris Anastasiou and Clayton E. Keller Cross-National Differences in Special Education Coverage: An Empirical Analysis Published by: http://www.sagepublications.com On behalf of: Council for Exceptional Children can be found at: Exceptional Children Additional services and information for http://ecx.sagepub.com/cgi/alerts Email Alerts: http://ecx.sagepub.com/subscriptions Subscriptions: http://www.sagepub.com/journalsReprints.nav Reprints: http://www.sagepub.com/journalsPermissions.nav Permissions: What is This? - Apr 1, 2014 Version of Record >> by guest on March 19, 2014 ecx.sagepub.com Downloaded from by guest on March 19, 2014 ecx.sagepub.com Downloaded from
-
Upload
siucarbondale -
Category
Documents
-
view
2 -
download
0
Transcript of Cross-National Differences in Special Education Coverage: An Empirical Analysis
http://ecx.sagepub.com/Exceptional Children
http://ecx.sagepub.com/content/80/3/353The online version of this article can be found at:
DOI: 10.1177/0014402914522421
2014 80: 353Exceptional ChildrenDimitris Anastasiou and Clayton E. Keller
Cross-National Differences in Special Education Coverage: An Empirical Analysis
Published by:
http://www.sagepublications.com
On behalf of:
Council for Exceptional Children
can be found at:Exceptional ChildrenAdditional services and information for
http://ecx.sagepub.com/cgi/alertsEmail Alerts:
http://ecx.sagepub.com/subscriptionsSubscriptions:
http://www.sagepub.com/journalsReprints.navReprints:
http://www.sagepub.com/journalsPermissions.navPermissions:
What is This?
- Apr 1, 2014Version of Record >>
by guest on March 19, 2014ecx.sagepub.comDownloaded from by guest on March 19, 2014ecx.sagepub.comDownloaded from
Exceptional Children 353355Exceptional Children
There is enormous variability inhow countries around the worldprovide education to studentswith disabilities in terms of classi-fications, identification and eligi-
bility criteria, funding, and types of placement(Anastasiou & Keller, 2011; Florian et al., 2006).It should come as no surprise, then, that severalcross-national surveys have revealed that the extentto which children and adolescents with disabilitiesreceive special education services varies consider-ably across nations, including its use in inclusivesettings (e.g., European Agency for Developmentin Special Needs Education, 2009; Organizationfor Economic Co-operation and Development,
2007). Why is this the case, given the existence oflaws in many countries assuring the right to edu-cation for students with special needs and exten-sive acceptance of the policies stated in documentslike the Salamanca Statement and Framework forAction on Special Needs Education (UNESCO,1994) and the United Nations’ Convention on theRights of Persons with Disabilities (2006)?
The purpose of our research was to investi-gate what, beyond the surface features of specialeducation, might be the reasons for such differ-ences in national special education coverage. Ourstudy began by reviewing cross-national compar-isons in special education and research on contex-tual factors that affect the provision of special
Vol. 80, No. 3, pp. 355-369.©2014 Council for Exceptional Children.DOI: 10.1177/0014402914522421
Cross-National Differences in Special Education Coverage:An Empirical AnalysisDIMITRIS ANASTASIOUSouthern Illinois University Carbondale
CLAYTON E. KELLERQatar University
ABSTRACT: This study investigated the role of educational and socioeconomic factors in explainingdifferences in national special education coverage. Data were derived from several internationaland governmental sources, targeting the year 2008 and covering 143 countries. Descriptive statis-tics revealed huge disparities in access to special education among countries. Using a theoreticalmodel linking socioeconomic and educational variables to differences in how many students receivespecial education at a national level and structural equation modeling, the authors evaluated therelationships among the variables. The structural equation model showed that gross national in-come per capita, adult literacy rate, educational variables, and expected years of formal schoolingaccounted for 77.3% of the variance in special education coverage, and that the contributions ofgross national income per capita and adult literacy were unique and significantly important. Theimplications for special education and inclusion policy and research are discussed.
Exceptional ChildrenVol. 80, No. 3, pp. 353 –367.
by guest on March 19, 2014ecx.sagepub.comDownloaded from
354 Spring 2014
education. We then proposed a model for howthe factors interrelate to impact special educationcoverage, which we empirically tested across asample of 143 countries.
C R O S S - N A T I O N A L
C O M P A R I S O N S I N
S P E C I A L E D U C A T I O N
There are several approaches to cross-nationalstudies in special education: (a) examining specialeducation in selected nations as case studies to de-tect major issues and explore emerging trends(e.g., Meijer, 2003), (b) emphasizing how coun-tries address inclusion issues (e.g., Barton & Arm-strong, 2007), (c) considering specific issues suchas school reform (e.g., McLaughlin & Rouse,2000), (d) using a geographical lens to examinespecial education and inclusion in specific regionsof the world (e.g., Artiles & Hallahan, 1995; For-lin & Lian, 2008), (e) focusing on special educa-tion among member countries of an internationalorganization or network (EADSNE, 2009;OECD, 2007), and (f ) applying a typological ap-proach to international differences in special edu-cation (Anastasiou & Keller, 2011). Across thesecross-national approaches, however, there is oftena lack of systematic empirical analysis. Such re-search in special education, using large samples ofcountries, is in general rare, with few notable ex-ceptions, and there are two reasons for this. First,comparable international special education datawere scarce until quite recently. Over the lastdecade, however, the UNESCO Institute forStatistics (UIS), United Nations Statistics Divi-sion, the World Bank, and other internationalnetworks (e.g., Eurydice) have collected interna-tionally comparable indicators and statistics oneducation and literacy.
Second, there is great variability in howcountries around the world provide special educa-tion. This diversity extends to how services are de-scribed and reported in public documents,making the use of the information problematicfor comparisons. Take, for example, the great vari-ety in the “language of exceptionality” and theconcepts underlying terms such as exceptionalities,disabilities, and special (educational) needs as wellas the variety of categories of exceptional studentsreceiving special education services, provided
under a similar range of terms (Anastasiou &Keller, 2011).
There is great variability in how countries around the world
provide special education.
The thriving field of comparative health carepolicy, though, provides an example of how sys-tematic empirical analysis can be used to investi-gate cross-national differences. In particular, theimpact of socioeconomic factors–such as nationalincome, poverty rate, and income inequality—onvariables of health outcomes has been extensivelystudied (e.g., Schell, Reilly, Rosling, Peterson, &Ekström, 2007). Such research provides both amodel for this study’s methods and a source forfactors that might explain variance in nationalspecial education coverage.
F A C T O R S A S S O C I A T E D W I T H
D I F F E R E N C E S I N S P E C I A L
E D U C A T I O N C O V E R A G E
ED U C AT I O N A L
As special education is embedded in national edu-cation systems, disparities in the educational pro-vision for students with exceptionalities amongcountries are likely to be related to differences inthe extent to which nations provide education toall of their students. In their typology, Anastasiouand Keller (2011) provided some evidence thatthe limitations of a country’s general educationsystem restrict its special education provision,possibly placing an upper limit on special educa-tion provision due to the infrastructure it pro-vides. A strong national education system may bea necessary but not automatically sufficient pre-requisite for the implementation of effective poli-cies towards students with disabilities (Anastasiou& Keller, 2011). Thus, factors that describe acountry’s general education context may play arole in explaining cross-national differences inspecial education coverage.
ECO N O M I C
More than educational factors are likely at play,however. Research in the United States has exam-
356 Spring 2014 by guest on March 19, 2014ecx.sagepub.comDownloaded from
Exceptional Children 355357Exceptional Children
ined the inter-state variability of special educationprevalence rates (Hallahan et al., 2007) and rea-sons for such differences. Significant relationshipshave been found between the identification andplacement rates of high-incidence disabilities and(a) state per pupil expenditure, per pupil revenue,and per capita income (Cosier & Causton-Theo-haris, 2011; Coutinho, Oswald, & Best, 2002);(b) cultural factors such as race and ethnicity(Anastasiou, Gardner, & Michail, 2011); (c) so-ciodemographic factors such as gender and ruralschool-age population (Coutinho, et al, 2002;Coutinho & Oswald, 2011); and (d) politicalvariables (Wiley & Siperstein, 2011).
Economic factors are those that can be read-ily investigated cross-nationally and have beenused to examine the huge differences amongcountries across several domains of social welfare(Esping-Andersen, 1990). Specifically, consider-able disparities among nations have been found inthe health care domain, and economic growth, in-come inequality, and female illiteracy significantlypredict the number of physicians per 1,000 indi-viduals in a population, life expectancy, and in-fant mortality (Schell et al., 2007).
Along these lines, UNESCO (2011) has ar-gued that differences in provision for studentswith disabilities are, to some degree, rooted in dif-ferences in economic development. Winzer andMazurek (2009) noted a significant gap betweenthe rhetoric about and reality of inclusion, a gappartly attributed to economic hardships thatmake many states unable or unwilling to pursuethis goal. In Nigeria and other sub-Saharan coun-tries, fiscal constraints have affected the inclusionof children with disabilities from any form of ed-ucation, special or not (Anastasiou & Keller,2011). Despite the proclamations or legal guaran-tee of free education, elementary schools continueto charge fees in many sub-Saharan African coun-tries with detrimental effects on the education ofchildren with disabilities (Hunt, 2008; Tom -aševski, 2006). Governments often retreat fromtheir declared responsibility to provide a free edu-cation and underfund education because of heav-ily indebted economies, leading to reductions ofpublic spending in vital social programs(Tomaševski, 2006).
ECO N O M I C IN E QUA L I T Y
In addition, the relationship between inequalitiesin income distribution and disability or schoolachievement is a common theme in internationaldialogues. UNESCO (2011) noted the signifi-cance of income distribution for the completionof elementary school by poor students. In Burk-ina Faso, completion rates for the poorest 20% ofthe population are 10 times lower than those ofthe richest 20% of the population. This gap isequally great in Senegal, Malawi, and Cambodia(UNESCO, 2011). Hunt (2008) reported thatpoor children, disabled or not, are far more likelyto drop out than children from wealthier homesin Burkina Faso, the Niger, Uganda, and Zambia.Fujiura and Yamaki (2000) provided evidence fora relationship between childhood disability preva-lence and economic status in the United States,especially for the link between poverty and riskfor disability. The experience of disadvantaged so-cial and educational conditions may increase boththe susceptibility to disability and the need for re-ceiving special education services (Oswald,Coutinho, & Best, 2002).
LI T E R AC Y
Besides the involvement of educational and so-cioeconomic factors in explaining the variance inspecial education coverage across countries, liter-acy may also be a factor. In health care policy re-search, Schell et al. (2007) found that femaleilliteracy was an important predictor of infantmortality and argued that literate women are vec-tors of basic health skills. Through such effects onhealth matters that might relate to disability andto education outcomes, one might suppose thatliterate environments are somehow related to spe-cial education provision.
E X P L O R I N G P R E D I C T O R S O F
S P E C I A L E D U C A T I O N C O V E R A G E
Consequently, relationships among educational,socioeconomic, and adult literacy factors may beable to explain some of the cross-national variancein special education provision. Although cross-national studies have provided a great deal ofknowledge, they have not addressed some funda-mental questions about the relationships among
by guest on March 19, 2014ecx.sagepub.comDownloaded from
356 Spring 2014
socio-economic factors, a national education sys-tem, and its special education subsystem. Con-ceptually and logically, one would presume thatsuch relationships exist, but what are the (a) rela-tionships among these variables, (b) strength ofeach variable, and (c) implications for improvingeducational opportunities for students with dis-abilities in countries around the world? The pur-pose of this research was to conduct an empiricalanalysis of these relationships and provide answersto such questions.
Our working hypothesis about cross-nationaldifferences in special education coverage is illus-trated in Figure 1. Such a hypothesis is testableusing statistical techniques on comparable observ-able variables that are defined operationally.
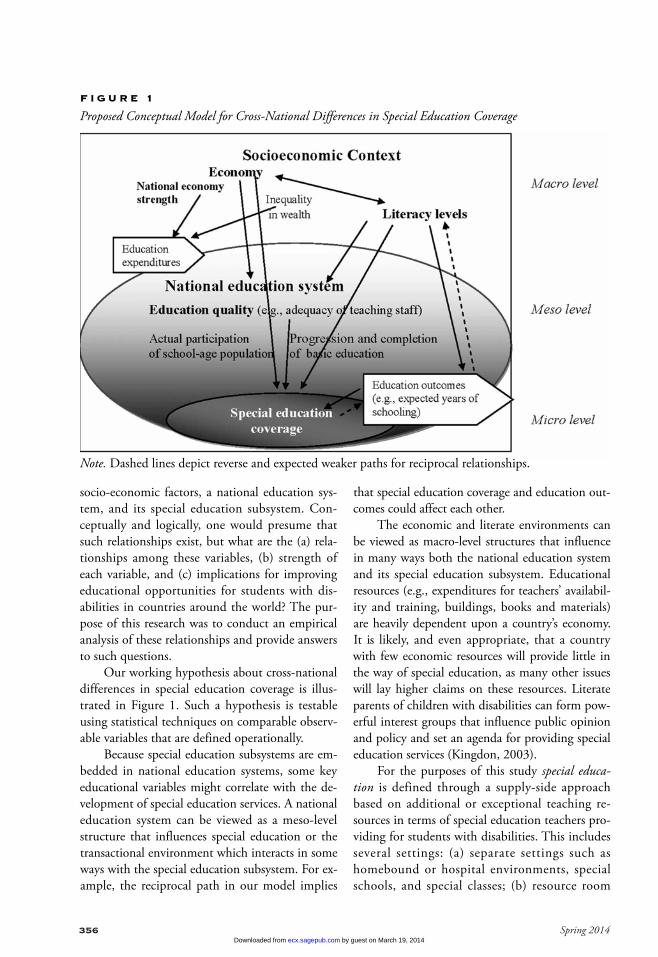
Because special education subsystems are em-bedded in national education systems, some keyeducational variables might correlate with the de-velopment of special education services. A nationaleducation system can be viewed as a meso-levelstructure that influences special education or thetransactional environment which interacts in someways with the special education subsystem. For ex-ample, the reciprocal path in our model implies
that special education coverage and education out-comes could affect each other.
The economic and literate environments canbe viewed as macro-level structures that influencein many ways both the national education systemand its special education subsystem. Educationalresources (e.g., expenditures for teachers’ availabil-ity and training, buildings, books and materials)are heavily dependent upon a country’s economy.It is likely, and even appropriate, that a countrywith few economic resources will provide little inthe way of special education, as many other issueswill lay higher claims on these resources. Literateparents of children with disabilities can form pow-erful interest groups that influence public opinionand policy and set an agenda for providing specialeducation services (Kingdon, 2003).
For the purposes of this study special educa-tion is defined through a supply-side approachbased on additional or exceptional teaching re-sources in terms of special education teachers pro-viding for students with disabilities. This includesseveral settings: (a) separate settings such ashomebound or hospital environments, specialschools, and special classes; (b) resource room
358 Spring 2014
F I G U R E 1
Proposed Conceptual Model for Cross-National Differences in Special Education Coverage
Note. Dashed lines depict reverse and expected weaker paths for reciprocal relationships.
by guest on March 19, 2014ecx.sagepub.comDownloaded from
Exceptional Children 357
models; and (c) inclusive settings mainly in theform of co-teaching models.
In this study, the term disabilities refers tostudents with physical disabilities, hearing loss ordeafness, visual impairments or blindness, speechimpairments, intellectual disabilities, emotionalor behavioral disabilities, autism spectrum disor-der, and specific learning disabilities (e.g.,dyslexia), corresponding to cross-national Cate-gories A (disabilities) and B (learning difficulties)defined by OECD (2007). It does not includestudents in OECD’s cross-national Category Cwith disadvantages primarily from socioeco-nomic, cultural, or linguistic factors. Along theselines, special education coverage in this article refersto the proportion of the student population re-ceiving special education in a country.
The empirical approach we used—compar-ing countries across quantitative characteristics—is a nomothetic approach to a social phenomenon(e.g., systems for welfare, health, special educa-tion) in that it tries to find independent variablesthat account for the variation in an outcome vari-able (Thomae, 1999). The volume of data for 143countries in this study did not allow for compar-isons in depth across special education systems.Nevertheless, studies such as ours could point theway to more detailed international studies of spe-cific contextual factors.
Our research hypothesis was that a structuralmodel close to the initial conceptual model ofFigure 1—a model posited to explain the variabil-ity in special education coverage across coun-tries—would fit the data. In short, wehypothesized that the economy and adult literacylevels in a country influence educational context;this, in turn, influences the expected years ofschooling as a direct educational outcome. Ex-pected years of schooling acts as a mediator vari-able between educational context and specialeducation coverage. In turn, special educationcoverage influences expected years of schooling.And, economic context and literacy levels also di-rectly affect special education coverage.
M E T H O D
To analyze the relationship between educationaland socioeconomic variables and special educa-tion coverage, we used countries with a school-age
population of over 50,000 children as the units ofobservation. Variables included the outcome vari-able of special education coverage and three typesof predictor variables linked to the study’s concep-tual model for differences in special educationcoverage (see Figure 1).
DATA SO U R C E S
The main sources of data were (a) UIS for generaleducation indicators, (b) the World Bank for eco-nomic indicators, and (c) a range of officialsources for special education coverage. Data weretargeted for the year 2008 or the closest year; how-ever, the reported year of reference covered a widerrange (1999–2010) for most variables with the ex-ception of gross national income (GNI) per capita(2007–2008) and Gini index (1994–2009), ameasure of unequal income distribution in acountry. The largest proportions of data for eachvariable, however, did fall within a limited timeperiod.
The dataset provided information for 143countries or 81.8% of the 175 countries and spe-cial administration territories which were offi-cially recognized by the United Nations as of2008—174 countries and territories plus Tai-wan—that had school-age populations over50,000 children.
VA R I A B L E S
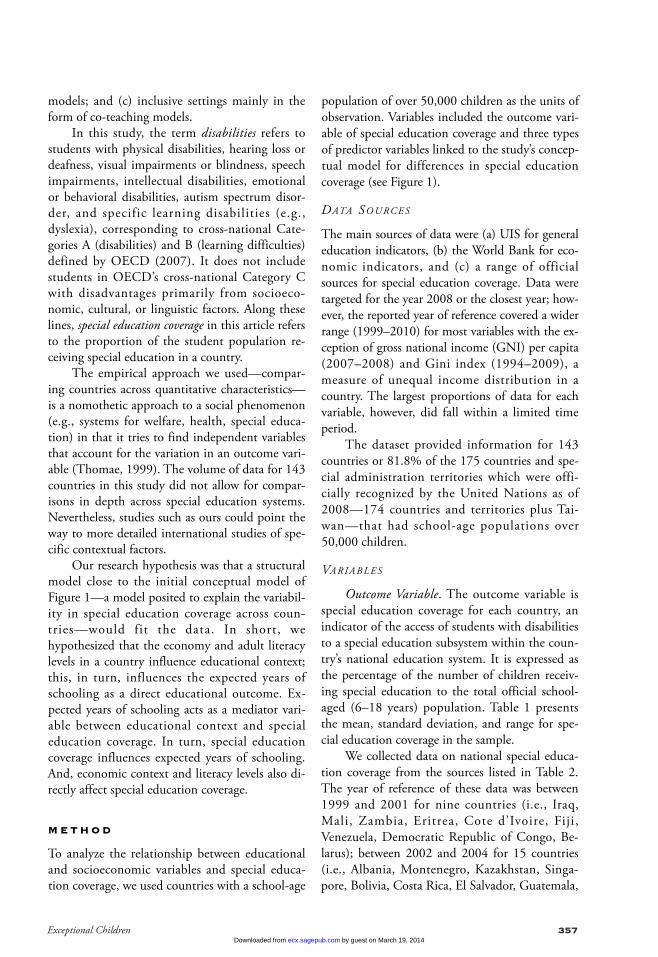
Outcome Variable. The outcome variable isspecial education coverage for each country, anindicator of the access of students with disabilitiesto a special education subsystem within the coun-try’s national education system. It is expressed asthe percentage of the number of children receiv-ing special education to the total official school-aged (6–18 years) population. Table 1 presentsthe mean, standard deviation, and range for spe-cial education coverage in the sample.
We collected data on national special educa-tion coverage from the sources listed in Table 2.The year of reference of these data was between1999 and 2001 for nine countries (i.e., Iraq,Mali, Zambia, Eritrea, Cote d’Ivoire, Fiji,Venezuela, Democratic Republic of Congo, Be-larus); between 2002 and 2004 for 15 countries(i.e., Albania, Montenegro, Kazakhstan, Singa-pore, Bolivia, Costa Rica, El Salvador, Guatemala,
359Exceptional Children by guest on March 19, 2014ecx.sagepub.comDownloaded from
358 Spring 2014
Pakistan, Congo Republic, Liberia, Nigeria, Sene-gal, Swaziland, Uganda); and, for the remaining119 countries, between 2005 and 2009.
There were complete data on special educa-tion coverage for all Central and Eastern Euro-pean (21) and North American and WesternEuropean countries (23). There were 32 countriesand territories, however, with missing data on thisvariable. Three out of a total of 19 (15.8%) wereArab countries, one out of nine (9%) was CentralAsian, nine out of 25 (36.0%) were East Asianand Pacific countries, four out of 26 (15.5%)were Latin American and Caribbean, one out ofnine (9.0%) was Southwest Asian, and 14 out of
43 (32.6%) were sub-Saharan countries. Thus,there was a sampling underrepresentation ofcountries across Asia, Africa, and Latin America,and an overrepresentation from North Americaand Western, Central, and Eastern Europe.
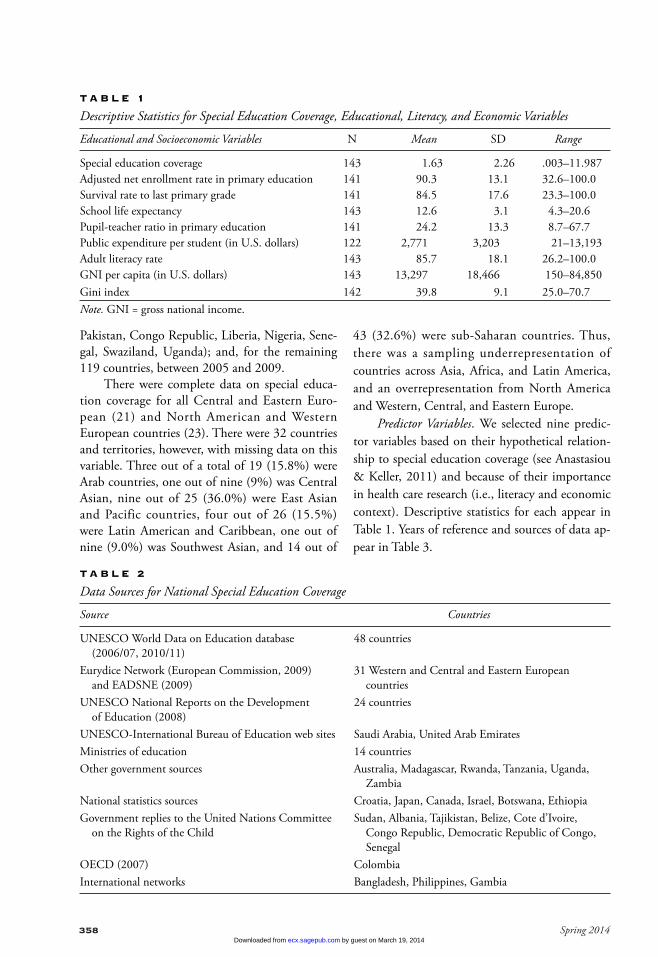
Predictor Variables. We selected nine predic-tor variables based on their hypothetical relation-ship to special education coverage (see Anastasiou& Keller, 2011) and because of their importancein health care research (i.e., literacy and economiccontext). Descriptive statistics for each appear inTable 1. Years of reference and sources of data ap-pear in Table 3.
360 Spring 2014
T A B L E 1
Descriptive Statistics for Special Education Coverage, Educational, Literacy, and Economic Variables
Educational and Socioeconomic Variables N Mean SD Range
Special education coverage 143 1.63 2.26 .003–11.987Adjusted net enrollment rate in primary education 141 90.3 13.1 32.6–100.0Survival rate to last primary grade 141 84.5 17.6 23.3–100.0School life expectancy 143 12.6 3.1 4.3–20.6Pupil-teacher ratio in primary education 141 24.2 13.3 8.7–67.7Public expenditure per student (in U.S. dollars) 122 2,771 3,203 21–13,193Adult literacy rate 143 85.7 18.1 26.2–100.0GNI per capita (in U.S. dollars) 143 13,297 18,466 150–84,850Gini index 142 39.8 9.1 25.0–70.7Note. GNI = gross national income.
T A B L E 2
Data Sources for National Special Education Coverage
Source Countries
UNESCO World Data on Education database 48 countries(2006/07, 2010/11)
Eurydice Network (European Commission, 2009) 31 Western and Central and Eastern European and EADSNE (2009) countries
UNESCO National Reports on the Development 24 countriesof Education (2008)
UNESCO-International Bureau of Education web sites Saudi Arabia, United Arab EmiratesMinistries of education 14 countriesOther government sources Australia, Madagascar, Rwanda, Tanzania, Uganda,
ZambiaNational statistics sources Croatia, Japan, Canada, Israel, Botswana, EthiopiaGovernment replies to the United Nations Committee Sudan, Albania, Tajikistan, Belize, Cote d’Ivoire,
on the Rights of the Child Congo Republic, Democratic Republic of Congo, Senegal
OECD (2007) ColombiaInternational networks Bangladesh, Philippines, Gambia
by guest on March 19, 2014ecx.sagepub.comDownloaded from
Exceptional Children 359
Adjusted Net Enrollment Rate (ANER) in Pri-mary Education. The net enrollment rate (NER)measures the actual participation of the school-aged population at the elementary educationallevel as it is nationally defined. As the classic NERunderestimates the enrollment of children, theUIS uses ANER, which includes children in ele-mentary education who have reached secondaryeducation either because they had accessed ele-mentary education earlier than the official age orhad skipped some grades due to their perfor-mance (UIS, 2009).
Survival Rate to Last Primary Grade. The sur-vival rate to last primary grade is the percentageof a cohort of students enrolled in the first gradeof primary education who are expected to reachthe last grade of elementary school (usually Grade5 or 6), regardless of repetition. It is a measure ofthe retention capacity of an education system atthe elementary level, reflecting also the extent towhich students drop out of primary education(UIS, 2009).
School Life Expectancy. This variable measuresthe total number of years of formal schooling thatchildren in a certain country can expect to receive
in their lifetime. School life expectancy shows theacceptability and dynamics of an education sys-tem in terms of the average number of years ofschooling that the system offers to the eligiblepopulation (UIS, 2009).
Pupil-Teacher Ratio (Primary). The pupil-teacher ratio is the average number of studentsper teacher in the elementary level of education ina given school year (UIS, 2009). From a globalperspective, pupil-teacher ratio reflects to somedegree teaching quality, but it does not take intoaccount critical factors which could affect thequality of teaching, such as differences in (a)teachers’ qualifications, training, and status; (b)teaching methods and materials; and (c) class-room conditions (UIS, 2009).
(Yearly) Public Expenditure on Primary Educa-tion Per Student. This variable is derived from agovernment’s current spending on elementary ed-ucation, divided by the total number of students,and expressed in equivalent U.S. dollars con-verted using purchasing power parity. It denotesresource allocation and helps in assessing a coun-try’s level of investment in this level of education(UIS, 2009).
361Exceptional Children
T A B L E 3
Years of Reference and Sources of Data for the Predictor Variables
Predictor Variable Years of Reference Sources of Data
ANER, primary 1999–2004: 9 countries Mainly from UIS; for 6 cases, from EFA reports,education 2005–2009: 132 countries intergovernmental networks, and governmental sources.Survival rate to 1999–2004: 9 countries Mainly from UIS; for 16 cases, from EFA reports andlast primary grade 2005–2009: 130 countries ministerial and governmental sources.School life 1999–2004: 13 countries Mainly from UIS; for 6 cases, from United Nations,expectancy 2005–2009: 130 countries governmental sources, and CIA (2010).Pupil-teacher ratio 1999–2004: 6 countries Mainly from UIS; for 7 cases, from Eurydice Network,(primary education) 2005–2010: 135 countries EFA reports, ministerial, and governmental sources. PEPE 2000-2004: 10 countries Mainly from UIS; for 6 cases, from UIS Global Digest
2005-2009: 112 countries reports; for 1 case (China) from OECD (2007). Adult literacy rate 2002–2004: 4 countries Mainly from UIS; for 29 cases, from EFA reports and
2005–2009: 139 countries CIA (2010). GNI per capita 2007: Kuwait Mainly from World Bank; for Qatar and Myanmar,
2008: 142 countries from UIS.Gini coefficient 1994–1998: 5 countries Mainly from World Bank; for 8 cases, from the Global
1999–2004: 31 countries Peace Index (2008) and for 18 cases, from CIA (2010). 2005–2009: 106 countries
Note. ANER = adjusted net enrollment rate; UIS = UNESCO Institute for Statistics; EFA = United Nations Edu-cation for All initiative; PEPE = public expenditure on primary education per student; CIA = Central IntelligenceAgency; GNI = gross national income.
by guest on March 19, 2014ecx.sagepub.comDownloaded from
360 Spring 2014
Adult Literacy Rate (ALR). The adult literacyrate is the percentage of adult literate persons, age15 and above, who can both read with under-standing and write a short simple statement ontheir everyday life (UIS, 2009). This indicator re-flects the literate environment of formal educa-tion and, to a degree, shows the potential forliteracy support within families. There are, how-ever, several limitations to the reliability of liter-acy statistics, as some countries apply definitionsand criteria for literacy that are different from theinternational standards (UIS, 2009).
GNI Per Capita. This variable reports a coun-try’s GNI in a year (2008 in our case), convertedto current U.S. dollars using the World BankAtlas method, divided by the midyear population(World Bank, 2011). It measures the average in-come of the country’s citizens and reflects its eco-nomic strengths, needs, and general standard ofliving.
Gini Coefficient or Ratio. The Gini index“measures the extent to which the distribution ofincome (or, in some cases, consumption expendi-ture) among individuals or households within aneconomy deviates from a perfectly equal distribu-tion” (World Bank, 2011). The minimum valueof zero represents a perfect equality, whereas amaximum value of 100.0 a maximal inequality.The limitations of Gini index lie in its relative na-ture, as it loses information about absolute in-comes. Countries with identical Gini indices candiffer greatly in wealth.
R E S U L T S
EX P LO R ATO RY AN A LY S E S
We screened variables for outliers, multivariateoutliers, normality of distribution, and linearity.Nonlinearity between variables often arose forsimilar data covering the globe (e.g., gross na-tional income per capita, illiteracy, Gini index,public spending on health; Schell et al., 2007), asthe relationship between two variables is not lin-ear over the spectrum of values. Nonlinearity wasaddressed by log transforming the data on specialeducation coverage, pupil-teacher ratio in primaryeducation, public expenditure per student, GNIper capita, and the Gini index. Data on the vari-ables of adjusted net enrollment rate in primary
education, survival rate, and adult literacy ratewere reflecting and log transforming. School lifeexpectancy data were normally distributed and inlinear relationship with other variables and so nottransformed. For the sake of clarity, the correla-tional values in Table 4 are on the mathematicallytransformed variables; the directions of the rela-tionships refer to the actual relationships, not thetransformed ones.
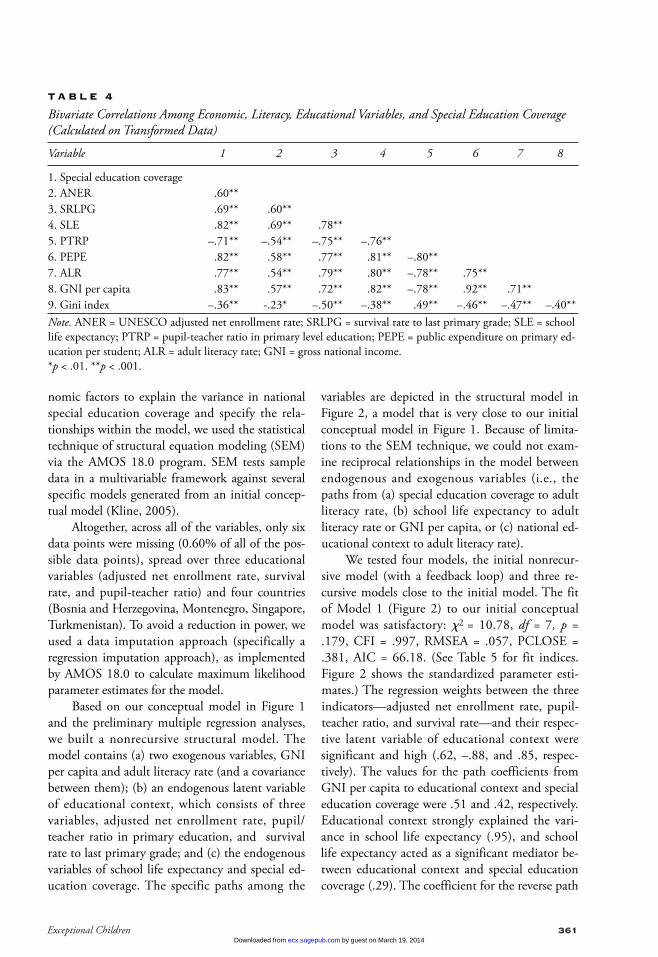
Table 4 shows the relationships among theeconomic, literacy, and educational variables andspecial education coverage. Special education cov-erage was significantly correlated with all othervariables: highly with the educational variables (rsvary from .60 to .82), adult literacy rate (r = .77),and GNI per capita (r = .83), and moderatelywith the Gini index (r = –.36).
An important finding at this exploratorystage was the very high correlation between GNIper capita and public expenditure per student (r =.92), despite the fact that the data were comingfrom completely different sources. Because ofmulticollinearity limitations, and the fact that wehad complete data on GNI per capita but weremissing data on public expenditure per studentfor 21 countries, only the former variable was en-tered into the subsequent analyses.
PR E L I M I N A RY HI E R A R C H I C A L MU LT I P L E
LI N E A R RE G R E S S I O N AN A LY S E S
As there have been no previous empirical studieson cross-national differences in special educationcoverage, we conducted two hierarchical multiplelinear regression analyses. In the first, we began byentering the block of educational predictors andthen the set of socioeconomic ones to determinethe unique contribution of socioeconomic vari-ables to the prediction of special education cover-age while controlling for the educationalvariables. In the second analysis we followed thereverse steps. Both analyses showed that the betaweights for the Gini index were small and not sig-nificant. Thus, the Gini index was excluded fromthe structural equation modeling analyses.
ST R U C T U R A L EQUAT I O N
MO D E L I N G AN A LY S E S
To test our a priori hypothetical model in Figure1, which combines educational and socioeco-
362 Spring 2014 by guest on March 19, 2014ecx.sagepub.comDownloaded from
Exceptional Children 361
nomic factors to explain the variance in nationalspecial education coverage and specify the rela-tionships within the model, we used the statisticaltechnique of structural equation modeling (SEM)via the AMOS 18.0 program. SEM tests sampledata in a multivariable framework against severalspecific models generated from an initial concep-tual model (Kline, 2005).
Altogether, across all of the variables, only sixdata points were missing (0.60% of all of the pos-sible data points), spread over three educationalvariables (adjusted net enrollment rate, survivalrate, and pupil-teacher ratio) and four countries(Bosnia and Herzegovina, Montenegro, Singapore,Turkmenistan). To avoid a reduction in power, weused a data imputation approach (specifically a regression imputation approach), as implementedby AMOS 18.0 to calculate maximum likelihoodparameter estimates for the model.
Based on our conceptual model in Figure 1and the preliminary multiple regression analyses,we built a nonrecursive structural model. Themodel contains (a) two exogenous variables, GNIper capita and adult literacy rate (and a covariancebetween them); (b) an endogenous latent variableof educational context, which consists of threevariables, adjusted net enrollment rate, pupil/teacher ratio in primary education, and survivalrate to last primary grade; and (c) the endogenousvariables of school life expectancy and special ed-ucation coverage. The specific paths among the
variables are depicted in the structural model inFigure 2, a model that is very close to our initialconceptual model in Figure 1. Because of limita-tions to the SEM technique, we could not exam-ine reciprocal relationships in the model betweenendogenous and exogenous variables (i.e., thepaths from (a) special education coverage to adultliteracy rate, (b) school life expectancy to adultliteracy rate or GNI per capita, or (c) national ed-ucational context to adult literacy rate).
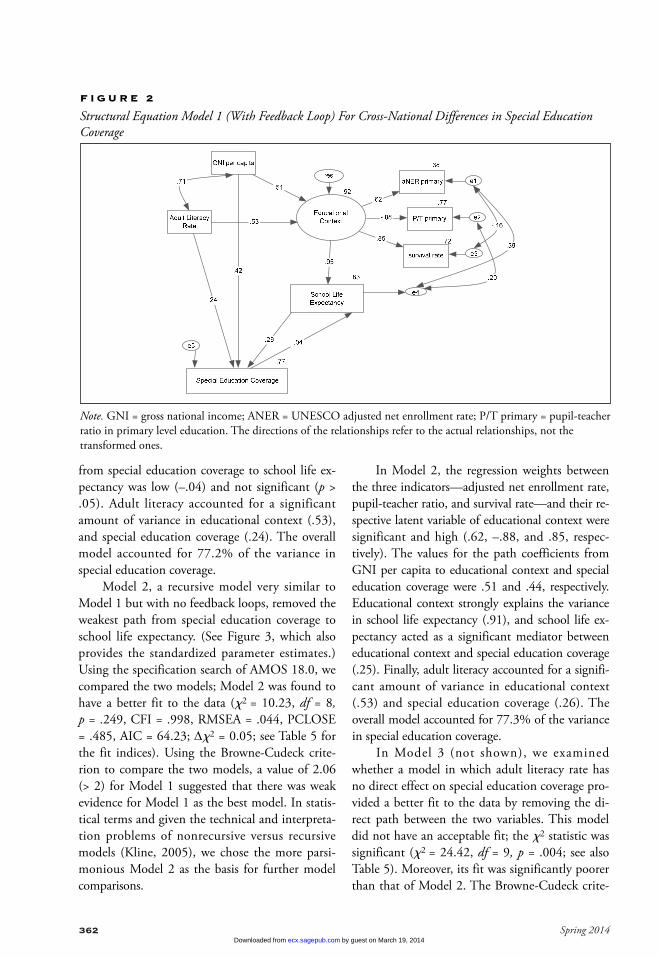
We tested four models, the initial nonrecur-sive model (with a feedback loop) and three re-cursive models close to the initial model. The fitof Model 1 (Figure 2) to our initial conceptualmodel was satisfactory: ñ2 = 10.78, df = 7, p =.179, CFI = .997, RMSEA = .057, PCLOSE =.381, AIC = 66.18. (See Table 5 for fit indices.Figure 2 shows the standardized parameter esti-mates.) The regression weights between the threeindicators—adjusted net enrollment rate, pupil-teacher ratio, and survival rate—and their respec-tive latent variable of educational context weresignificant and high (.62, –.88, and .85, respec-tively). The values for the path coefficients fromGNI per capita to educational context and specialeducation coverage were .51 and .42, respectively.Educational context strongly explained the vari-ance in school life expectancy (.95), and schoollife expectancy acted as a significant mediator be-tween educational context and special educationcoverage (.29). The coefficient for the reverse path
363Exceptional Children
T A B L E 4
Bivariate Correlations Among Economic, Literacy, Educational Variables, and Special Education Coverage(Calculated on Transformed Data)
Variable 1 2 3 4 5 6 7 8
1. Special education coverage2. ANER .60**3. SRLPG .69** .60**4. SLE .82** .69** .78**5. PTRP –.71** –.54** –.75** –.76**6. PEPE .82** .58** .77** .81** –.80**7. ALR .77** .54** .79** .80** –.78** .75**8. GNI per capita .83** .57** .72** .82** –.78** .92** .71**9. Gini index –.36** -.23* –.50** –.38** .49** –.46** –.47** –.40**Note. ANER = UNESCO adjusted net enrollment rate; SRLPG = survival rate to last primary grade; SLE = schoollife expectancy; PTRP = pupil-teacher ratio in primary level education; PEPE = public expenditure on primary ed-ucation per student; ALR = adult literacy rate; GNI = gross national income.*p < .01. **p < .001.
by guest on March 19, 2014ecx.sagepub.comDownloaded from
362 Spring 2014
from special education coverage to school life ex-pectancy was low (–.04) and not significant (p >.05). Adult literacy accounted for a significantamount of variance in educational context (.53),and special education coverage (.24). The overallmodel accounted for 77.2% of the variance inspecial education coverage.
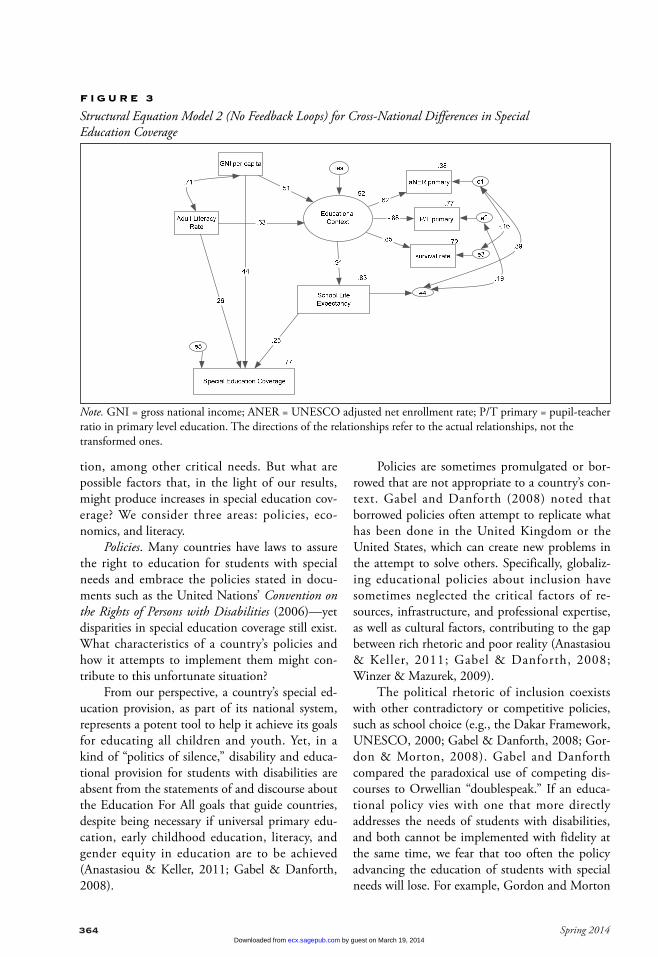
Model 2, a recursive model very similar toModel 1 but with no feedback loops, removed theweakest path from special education coverage toschool life expectancy. (See Figure 3, which alsoprovides the standardized parameter estimates.)Using the specification search of AMOS 18.0, wecompared the two models; Model 2 was found tohave a better fit to the data (ñ2 = 10.23, df = 8,p = .249, CFI = .998, RMSEA = .044, PCLOSE= .485, AIC = 64.23; Dñ2 = 0.05; see Table 5 forthe fit indices). Using the Browne-Cudeck crite-rion to compare the two models, a value of 2.06(> 2) for Model 1 suggested that there was weakevidence for Model 1 as the best model. In statis-tical terms and given the technical and interpreta-tion problems of nonrecursive versus recursivemodels (Kline, 2005), we chose the more parsi-monious Model 2 as the basis for further modelcomparisons.
In Model 2, the regression weights betweenthe three indicators—adjusted net enrollment rate,pupil-teacher ratio, and survival rate—and their re-spective latent variable of educational context weresignificant and high (.62, –.88, and .85, respec-tively). The values for the path coefficients fromGNI per capita to educational context and specialeducation coverage were .51 and .44, respectively.Educational context strongly explains the variancein school life expectancy (.91), and school life ex-pectancy acted as a significant mediator betweeneducational context and special education coverage(.25). Finally, adult literacy accounted for a signifi-cant amount of variance in educational context(.53) and special education coverage (.26). Theoverall model accounted for 77.3% of the variancein special education coverage.
In Model 3 (not shown), we examinedwhether a model in which adult literacy rate hasno direct effect on special education coverage pro-vided a better fit to the data by removing the di-rect path between the two variables. This modeldid not have an acceptable fit; the ñ2 statistic wassignificant (ñ2 = 24.42, df = 9, p = .004; see alsoTable 5). Moreover, its fit was significantly poorerthan that of Model 2. The Browne-Cudeck crite-
364 Spring 2014
F I G U R E 2
Structural Equation Model 1 (With Feedback Loop) For Cross-National Differences in Special EducationCoverage
Note. GNI = gross national income; ANER = UNESCO adjusted net enrollment rate; P/T primary = pupil-teacherratio in primary level education. The directions of the relationships refer to the actual relationships, not the transformed ones.
by guest on March 19, 2014ecx.sagepub.comDownloaded from
Exceptional Children 363
rion value of 12.06 (> 10) for Model 3 suggestedstrongly that Model 3 was not the best.
In Model 4 (not shown), we tested the as-sumption that GNI per capita has no direct effecton special education coverage by removing thepath between the two variables. This model alsodid not have an acceptable fit to the data as the ñ2
statistic was significant (ñ2 = 44.66, df = 9, p <.001; see Table 5). The Browne-Cudeck criterionvalue of 44.66 (>10) for Model 4 suggestedstrongly that it was not the best. The results fromthe latter two models supported the inclusion ofdirect effects on special education coverage fromadult literacy rate and GNI per capita.
D I S C U S S I O N
The findings from this study’s structural equationmodeling analyses indicated that cross-nationalvariation in special education coverage can be sig-nificantly explained by socioeconomic and edu -cational factors. A parsimonious model ofeducational and two socioeconomic variables (i.e.,adult literacy rate and gross national income percapita) accounted for more than 77% of the vari-ance in special education coverage; that is, the ex-tent to which special education was provided at national levels across the 143 countries in oursample.
SEM analyses confirmed that a structuralmodel close to the initial conceptual model of ourstudy fit the data well. Economic context andadult literacy levels predicted educational contextand this directly predicted expected years ofschooling as an outcome. Expected years of
schooling acted as a mediator variable betweeneducational context and special education cover-age. And economic context and literacy levels pre-dicted special education coverage. The analysesfor Models 3 and 4 showed that the inclusion ofeconomic factors and adult literacy levels resultedin a better prediction of special education cover-age than if these factors were not included.
Our study also provided a systematic estima-tion and documentation of the huge magnitudeof disparities in special education coverage acrosscountries. Special education coverage at the na-tional level in our sample varied from .003% inChad to 11.987% in Canada, an almost 4,000-fold difference. Such a disparity is much greaterthan that found at the national level in theUnited States, where a 50-fold difference amongstates in the rates of identifying and serving highincidence disabilities has been observed (Oswald& Coutinho, 1995). The magnitude of cross-na-tional disparities in special education coveragebears a closer resemblance in scale to those foundin public expenditure per student (a 500-fold dif-ference) and GNI per capita (a more than 500-fold difference).
IM P L I C AT I O N S F O R PO L I C Y A N D RE S E A R C H
We believe that an increase in special educationcoverage—meaning the provision of specially de-signed instruction for a country’s students withdisabilities—is a desirable goal, though clearly notthe only one that countries with limited resourceshave to address, especially impoverished ones thatstruggle with providing safety, health, and nutri-
365Exceptional Children
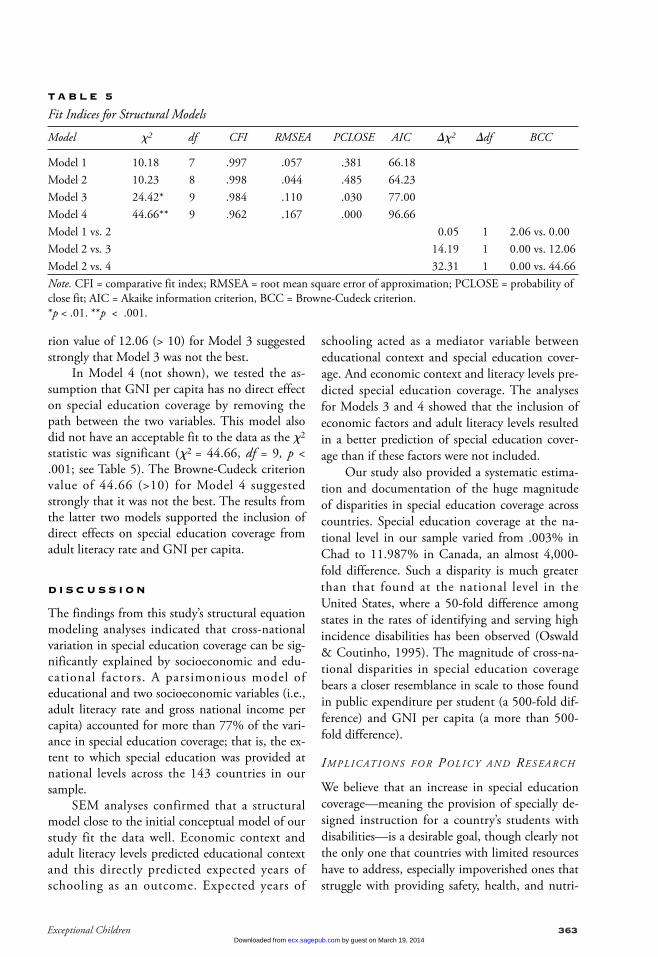
T A B L E 5
Fit Indices for Structural Models
Model ñ2 df CFI RMSEA PCLOSE AIC añ2 adf BCC
Model 1 10.18 7 .997 .057 .381 66.18Model 2 10.23 8 .998 .044 .485 64.23Model 3 24.42* 9 .984 .110 .030 77.00Model 4 44.66** 9 .962 .167 .000 96.66Model 1 vs. 2 0.05 1 2.06 vs. 0.00 Model 2 vs. 3 14.19 1 0.00 vs. 12.06Model 2 vs. 4 32.31 1 0.00 vs. 44.66Note. CFI = comparative fit index; RMSEA = root mean square error of approximation; PCLOSE = probability ofclose fit; AIC = Akaike information criterion, BCC = Browne-Cudeck criterion. *p < .01. **p < .001.
by guest on March 19, 2014ecx.sagepub.comDownloaded from
364 Spring 2014
tion, among other critical needs. But what arepossible factors that, in the light of our results,might produce increases in special education cov-erage? We consider three areas: policies, eco-nomics, and literacy.
Policies. Many countries have laws to assurethe right to education for students with specialneeds and embrace the policies stated in docu-ments such as the United Nations’ Convention onthe Rights of Persons with Disabilities (2006)—yetdisparities in special education coverage still exist.What characteristics of a country’s policies andhow it attempts to implement them might con-tribute to this unfortunate situation?
From our perspective, a country’s special ed-ucation provision, as part of its national system,represents a potent tool to help it achieve its goalsfor educating all children and youth. Yet, in akind of “politics of silence,” disability and educa-tional provision for students with disabilities areabsent from the statements of and discourse aboutthe Education For All goals that guide countries,despite being necessary if universal primary edu-cation, early childhood education, literacy, andgender equity in education are to be achieved(Anastasiou & Keller, 2011; Gabel & Danforth,2008).
Policies are sometimes promulgated or bor-rowed that are not appropriate to a country’s con-text. Gabel and Danforth (2008) noted thatborrowed policies often attempt to replicate whathas been done in the United Kingdom or theUnited States, which can create new problems inthe attempt to solve others. Specifically, globaliz-ing educational policies about inclusion havesometimes neglected the critical factors of re-sources, infrastructure, and professional expertise,as well as cultural factors, contributing to the gapbetween rich rhetoric and poor reality (Anastasiou& Keller, 2011; Gabel & Danforth, 2008;Winzer & Mazurek, 2009).
The political rhetoric of inclusion coexistswith other contradictory or competitive policies,such as school choice (e.g., the Dakar Framework,UNESCO, 2000; Gabel & Danforth, 2008; Gor-don & Morton, 2008). Gabel and Danforthcompared the paradoxical use of competing dis-courses to Orwellian “doublespeak.” If an educa-tional policy vies with one that more directlyaddresses the needs of students with disabilities,and both cannot be implemented with fidelity atthe same time, we fear that too often the policyadvancing the education of students with specialneeds will lose. For example, Gordon and Morton
366 Spring 2014
F I G U R E 3
Structural Equation Model 2 (No Feedback Loops) for Cross-National Differences in Special Education Coverage
Note. GNI = gross national income; ANER = UNESCO adjusted net enrollment rate; P/T primary = pupil-teacherratio in primary level education. The directions of the relationships refer to the actual relationships, not the transformed ones.
by guest on March 19, 2014ecx.sagepub.comDownloaded from
Exceptional Children 365
(2008) argued that school choice policies tend tohinder the inclusion of students with disabilitiesin New Zealand.
Economics. It is clear from our study the sig-nificant role that GNI per capita may play in ex-plaining the unwillingness or inability ofcountries to serve their students with disabilitiesbecause of this factor’s effects on the basic struc-tures of education. In our model, this variable hada significant direct effect on special educationcoverage and an indirect effect through educa-tional context and school life expectancy.
The importance of GNI per capita on specialeducation cannot be assumed to be constant,though, across all national economic levels. Forexample, examining countries that are more ho-mogeneous economically restricts the range ofthis variable and can lead to a smaller effect onspecial education coverage, decreasing this predic-tor’s influence. Therefore, regional or organiza-tional pictures (e.g., OECD) are not necessarilyglobal ones.
In the final structural model the path coeffi-cients from GNI per capita to educational contextand special education coverage were .51 and .44,respectively. That means that, for every standarddeviation increase in GNI per capita ($18,466;see Table 1), special education coverage is ex-pected to increase by one percentage point (.44 P2.26 [the SD of special education coverage] = .99in special education coverage), holding educa-tional context, school life expectancy, and adultliteracy rate constant. Thus, if we could signifi-cantly increase the GNI per capita of those coun-tries at the lower end of the continuum of specialeducation coverage, we would likely be able to in-crease the education provided to students withdisabilities. This route is, however, unrealistic.
Literacy. Similar to what has been found inhealth care policy research (e.g., Schell et al.,2007), literacy in our study was related to betteroutcomes. Here the predictor variable of adult lit-eracy rate had a significant direct effect on specialeducation coverage (.26) and an indirect effectthrough educational context (.53) and school lifeexpectancy. That means for every standard devia-tion increase in the adult literacy rate in a coun-try, special education coverage is expected toincrease by more than one-half of a percentagepoint (.26 P 2.26 [the SD of special education
coverage] = .59 in special education coverage),holding educational context, school life ex-pectancy, and GNI per capita constant.
Improvements in a country’s adult literacylevels thus represent a realistic and substantialroute to increasing special education coverage, asit is a factor that is amenable to improvement. Forinstance, some sub-Saharan countries (i.e., Burk-ina-Faso, Cote d’Ivoire, Gambia, Guinea, Guinea-Bissau, Malawi, Mali, Mozambique, Senegal)significantly increased their rates of adult literacywithin the last 10 to 15 years (UIS, 2010). If lit-erate women can be vectors of basic health (Schellet al., 2007), perhaps they also can be vectors forthe improvement of educational opportunities forstudents with disabilities.
Improvements in a country’s adult literacy levels thus represent a
realistic and substantial route to increasing special education coverage.
ME T H O D O LO G I C A L IS S U E S
A N D LI M I TAT I O N S
We have concerns about the quality of some data.The reliability of adult literacy rates has beenquestioned because of how countries apply defini-tions and criteria relative to international stan-dards (UIS, 2009). Gini index data for a sizeablenumber of countries (about 20%) came fromthree different sources (i.e., World Bank, 2011;Global Peace Index, 2008; Central IntelligenceAgency, 2009). There was considerable variabilityin the year of reference for the Gini index, though75% of the Gini data came from a 4-year period.The Gini data were not used in the SEM analysesbecause of the results of the multiple linear regres-sions.
The data on special education coverage alsocame from many different types of sources. Forsome countries we collected data on several yearsto detect spurious values but this was not feasiblefor a considerable part of our sample. The specificunder- and overrepresentation of countries in oursample likely underestimated the role of the so-cioeconomic variables. The role of educationalcontext in our analyses was restricted as we could
367Exceptional Children by guest on March 19, 2014ecx.sagepub.comDownloaded from
366 Spring 2014
not include public expenditure on education inour models due to multicollinearity.
C O N C L U S I O N
Our model’s ability to explain 77% of the variancein special education coverage could be consideredlarge. In the health care sector, though, GNI percapita, young female illiteracy, and income in-equality predicted 92% of the global variation ininfant mortality rates (Schell et al., 2007). Whatmight be the sources that account for the 23% ofthe variance that is unexplained by our structuralmodel? How might these interact with adult liter-acy, a variable that accounts for a sizable portion ofthe variance and is amenable to improvement?Factors such as gender, aspects of culture, demo-graphics, and politics may be worth investigating.This study represents only a departure point. Anyincrease in our ability to understand, and thuschange, these differences is worth the effort.
R E F E R E N C E S
Anastasiou, D., Gardner, R., & Michail, D. (2011).Ethnicity and exceptionality. In J. M. Kauffman & D. P.Hallahan (Eds.), Handbook of special education (pp.745–758). New York, NY: Routledge.Anastasiou, D., & Keller, C. (2011). International dif-ferences in provision for exceptional learners. In J. M.Kauffman & D. P. Hallahan (Eds.), Handbook of specialeducation (pp. 773–787). New York, NY: Routledge.Artiles, A. J., & Hallahan, D. P. (Eds.). (1995). Specialeducation in Latin America. Westport, CT: Greenwood.Barton, L., & Armstrong, F. (Eds.). (2007). Policy, expe-rience and change: Cross cultural reflections on inclusiveeducation (Vol. 4). Dordrecht, Netherlands: Springer. Central Intelligence Agency. (2009). The CIA WorldFactbook 2010. New York, NY: Skyhorse. Cosier, M. E., & Causton-Theoharis, J. (2011). Eco-nomic and demographic predictors of inclusive educa-tion. Remedial and Special Education, 32, 496–505.http://dx.doi.org/10.1177/0741932510362513 Coutinho, M. J., & Oswald, D. P. (2011). Gender andexceptionality. In J. M. Kauffman & D. P. Hallahan(Eds.), Handbook of special education (pp. 759–772).New York, NY: Routledge.Coutinho, M. J., Oswald, D. P., & Best, A. M. (2002).The influence of sociodemographics and gender on thedisproportionate identification of minority students ashaving learning disabilities. Remedial and Special Educa-
tion, 23, 49–59. http://dx.doi.org/10.1177/074193250202300107European Agency for Development in Special Needs Ed-ucation. (2009). Special needs education: Country data2008. Middelfart, Denmark: European Agency for De-velopment in Special Needs Education. Esping-Andersen, C. (1990). Three worlds of welfare cap-italism. Princeton, NJ: Princeton University Press.European Commission. (2009). Eurydice. Network oneducation systems and policies in Europe. Available athttp://eacea.ec.europa.eu/education/eurydice/Florian, L., Hollenweger, J., Simeonsson, R. J., Wedell,K., Ridell, S., Terzi, L., & Holland, A. (2006). Cross-cultural perspectives on the classification of childrenwith disabilities: Part I. Issues in the classification ofchildren with disabilities. The Journal of Special Educa-tion, 40, 36–45. http://dx.doi.org/10.1177/00224669060400010401Forlin, C., & Lian, M.-G. J. (Eds.). (2008). Reform,inclu sion and teacher education. London, England:Routledge.Fujiura, G. T., & Yamaki, K. (2000). Trends in demog-raphy of childhood poverty and disability. ExceptionalChildren, 66, 187–199.Gabel, S. L., & Danforth, S. (2008). Disability and theinternational politics of education. In. S. L. Gabel & S.Danforth, (Eds.), Disability & the politics of education:An international reader (pp. 1–13). New York, NY: PeterLang. Global Peace Index. (2008). GPI Gini 2008. Retrievedfrom http://www.visionofhumanity.org/gpi-data/#/2011/GINI Gordon, L., & Morton, M. (2008). Inclusive educationand school choice: Democratic rights in a devolved sys-tem. In. S. L. Gabel & S. Danforth (Eds.), Disability &the politics of education: An international reader (pp.237–250). New York, NY: Peter Lang. Hallahan, D. P., Keller, C. E., Martinez, E. A., Byrd, E.S., Gelman, J. A., & Fan, X. (2007). How variable areinterstate prevalence rates of learning disabilities andother special education categories? A longitudinal com-parison. Exceptional Children, 73, 136–146. Hunt, F. (2008). Dropping out from school: A cross-coun-try review of literature. Brighton, England: University ofSussex, Centre for International Education, Consor-tium for Research on Educational Access. Kingdon, J. W. (2003). Agendas, alternatives and publicpolicies (2nd ed.). New York, NY: Longman. Kline, R. B. (2005). Principles and practice of structuralequation modeling (2nd ed.). New York, NY: Guilford.
368 Spring 2014 by guest on March 19, 2014ecx.sagepub.comDownloaded from
Exceptional Children 367
McLaughlin, M., & Rouse, M. (Eds.). (2000). Specialeducation and school reform in the United States andBritain. London, England: Routledge. Meijer, C. J. W. (2003). Special education across Europein 2003: Trends in provision in 18 European countries.Middelfart, Denmark: European Agency for Develop-ment in Special Needs Education. Organization for Economic Co-operation and Develop-ment. (2007). Students with disabilities, learning diffi-culties and disadvantages: Policies, statistics andindicators. Paris, France: Author.Oswald, D. P., & Coutinho, M. J. (1995). Identifica-tion and placement of students with serious emotionaldisturbance: Part I: Correlates of state child-count data.Journal of Emotional & Behavioral Disorders, 3,224–230. http://dx.doi.org/10.1177/106342669500300404 Oswald, D. P., Coutinho, M. J., & Best, A. M. (2002).Community and school predictors of overrepresentationof minority children in special education. In D. J. Losen& G. Orfield (Eds.), Racial inequity in special education(pp. 1–14). Boston, MA: Harvard Education Press.Schell, C. O., Reilly, M., Rosling, H., Peterson, S., &Ekström, A. M. (2007). Socioeconomic determinantsof infant mortality: A worldwide study of 152 low-,middle-, and high-income countries. ScandinavianJournal of Public Health, 35, 288–297. http://dx.doi.org/10.1080/14034940600979171Thomae, H. (1999). The nomothetic-idiographic issue:Some roots and recent trends. International Journal ofGroup Tensions, 28, 187–215. http://dx.doi.org/10.1023/A:1021891506378 Tomaševski, K. (2006). The state of the right to education worldwide: Free or fee-2006 global report.Copenhagen, Denmark. Retrieved from http://www.katarinatomasevski.com/images/GlobalReport.pdfUnited Nations Educational, Scientific and CulturalOrganization. (1994, June). The Salamanca statementand framework for action on special needs education.Paris, France: Author. Retrieved from http://www.unesco.org/education/pdf/SALAMA_E.PDFUnited Nations Educational, Scientific and CulturalOrganization. (2000). The Dakar framework for action.Paris, France: UNESCO. Retrieved from http://unesdoc.unesco.org/images/0012/001211/121147e.pdfUnited Nations Educational, Scientific and CulturalOrganization. (2011). Education for all global monitor-ing report 2011: The hidden crisis: Armed conflict and ed-ucation. Paris, France: UNESCO. United Nations Educational, Scientific and CulturalOrganization Institute for Statistics (UIS). (2009). Ed-
ucation indicators: Technical guidelines. Montreal,Canada: UIS.United Nations Educational, Scientific and CulturalOrganization Institute for Statistics (UIS). (2010).Global digest 2010: Comparing education statistics acrossthe world. Montreal, Canada: UIS. United Nations Educational, Scientific and CulturalOrganization International Bureau of Education.(2006/07). World data on education (6th ed.) [Data base].Retrieved from http://www.ibe.unesco.org/en/services/online-materials/world-data-on-education.htmlUnited Nations Educational, Scientific and CulturalOrganization International Bureau of Education.(2008). National reports on the development of education.Retrieved from http://www.ibe.unesco.org/en/ice/48th-ice-2008/national-reports.htmlUnited Nations Educational, Scientific and CulturalOrganization International Bureau of Education.(2010/11). World data on education (7th ed.)[Database]. Retrieved from http://www.ibe.unesco.org/en/services/online-materials/world-data-on-education/seventh-edition-2010-11.htmlUnited Nations. (2006). Convention on the rights of per-sons with disabilities. Retrieved from http://www.un.org/disabilities/convention/conventionfull.shtmlWiley, A., & Siperstein, G. (2011). Seeing red, feelingblue: The impact of state political leaning on stateidentification rates for emotional disturbance. Behav-ioral Disorders, 36, 195–207. Winzer, M., & Mazurek, K. (2009). Inclusive school-ing: Global ideals and national realities. Journal of International Special Needs Education, 12, 1–10.World Bank. (2011, September). World development in-dicators. Retrieved from http://data.worldbank.org
A B O U T T H E A U T H O R S
DIMITRIS ANASTASIOU (Illinois CEC), Assis-tant Professor of Special Education, Southern Illi-nois University, Carbondale. CLAYTON E.
KELLER, (CEC), Associate Professor of SpecialEducation, Qatar University, Doha.
Address correspondence regarding this article toDimitris Anastasiou, Department of EducationalPsychology & Special Education, Southern IllinoisUniversity, 625 Wham Drive, Carbondale, IL62901 (e-mail: [email protected]).
Manuscript received June 2012; accepted May2013.
369Exceptional Children by guest on March 19, 2014ecx.sagepub.comDownloaded from