
Critical Review-Maulana-3613100063
43
Journal of Retailing and Consumer Services 9 (2010) 185–199 Central place practice: shopping centre attractiveness measures, hinterland boundaries and the UK retail hierarchy Charles Dennis*, David Marsland, Tony Cockett School of Business & Management, Brunel University, Borough Road, Isleworth TW7 5DU, UK Abstract Christaller’s (Central Places in Southern Germany (translated by Baskin C (1966)), Prentice- Hall, Englewood Cliffs, NJ, 1933) well-known and much criticised ‘central place theory’ was based on classical, arguably unsustainable, economic assumptions such as the uniformity of consumers and travel. Nevertheless, it has been claimed that the emergence of shopping areas in UK towns could largely be explained in terms of central place principles (Retail Location: A Micro-Scale Perspective, Aldershot, Avebury, 1992). Brown drew support from the example of the retail hierarchy of Cardiff (UK, Store Location and Store Assessment Research, Chichester, Wiley, 1984): a town centre core radiating progressively further out with greater numbers of district centres, neighbourhood centres and finally local centres. Christaller’s theory was based on rigid ‘laws of distribution of central places’ and ‘laws of settlement’ which ‘often determine[d] with astonishing exactness, the location of central places’ in southern Germany. Guy considered that for useful application to UK retail, a more flexible interpretation was needed and that strict economic assumptions could be relaxed in a more pragmatic approach. The ‘classical’ approach fails to account for the positions and hinterland (or catchment area) boundaries of modern out-of-town regional shopping centres. Except in defining the components of places at various levels in the hierarchy, Christaller
-
Upload
independent -
Category
Documents
-
view
1 -
download
0
Transcript of Critical Review-Maulana-3613100063
Journal of Retailing and Consumer Services 9 (2010) 185–199
Central place practice: shopping centre attractiveness measures, hinterland boundaries and the UK retail hierarchy
Charles Dennis*, David Marsland, Tony Cockett
School of Business & Management, Brunel University, Borough Road, Isleworth TW7 5DU, UK
Abstract
Christaller’s (Central Places in Southern Germany (translated by Baskin C (1966)), Prentice-Hall, Englewood Cliffs, NJ, 1933) well-known and much criticised ‘central place theory’ was based on classical, arguably unsustainable, economic assumptions such as the uniformity of consumers and travel. Nevertheless, it has been claimed that the emergence of shopping areas in UK towns could largely be explained in terms of central place principles (Retail Location:A Micro-Scale Perspective, Aldershot, Avebury, 1992). Brown drew support from the example of the retail hierarchy of Cardiff (UK, Store Location and Store Assessment Research, Chichester, Wiley, 1984): a town centre core radiating progressively further out with greaternumbers of district centres, neighbourhood centres and finally local centres. Christaller’s theory was based on rigid ‘laws of distribution of central places’ and ‘laws of settlement’ which ‘often determine[d] with astonishing exactness, the location of central places’ in southern Germany. Guy considered that for useful application to UK retail, a more flexible interpretation was needed and that strict economic assumptions could be relaxed in a more pragmatic approach. The ‘classical’ approach fails to account for the positions and hinterland (or catchment area) boundaries of modern out-of-town regional shopping centres. Except in defining the components of places at various levels in the hierarchy, Christaller
did not even consider the attractiveness of shopping areas in consumer choice. A number of other authors have investigated various measures to define positions in the retail hierarchy.In the Cardiff example, Guy used retail sales floor area as a surrogate measure. Systems havebeen proposed based on numbers and status of retail outlets (The New Guide to Shopping Centres of Great Britain, Hillier Parker, London, 1991; Shopping Centres, Mintel, London, 1997; J. Property Res. 9 (1992) 122–160; J. Property Res. 9 (1985) 122–160). This paper evaluates the authors’ empirically based measurement system for attractiveness that can be applied to out-of-town as well as in-town shopping centres. The approach adapts previous simple systems based on retailer counts. These have been combined in attractiveness measurements applied to definitions of position in the hierarchy. Results support the prediction of central place hinterland boundaries based on the authors’ attractiveness measures and adaptation of (The Law of Gravitation, Knickerbocker Press, New York, 1931) ‘Law’. The data fit exemplar published empirical data on shopping centre hinterlands more closely than do the commonly used drive-time isochrones. r 2002 Elsevier Science Ltd. All rights reserved.
Keywords: Shopping centres; Central place; Hierarchy; Hinterlands; Catchment; Attractiveness
1. Introduction
Planned shopping centres comprise an essentialpart of the UK economy, employing over three-quarters of a million people and playing ‘a key role in the investments
$An earlier version of this paper was presented tothe 7th International Conference on Recent Advances in Retailing and Services Science, Eindhoven, EIRASS. (Dennis, C.E., Marsland, D., Cockett, W., 2000d. Central place theory revisited: the use of attractiveness measures in predicting shopping centre hinterland (catchment area) boundaries).
*Corresponding author. Tel.: +44-(0)208-891-0121;fax: +44-(0)208-891-8291.
E-mail address: [email protected] (C. Dennis).
of pension funds’ (OXIRM, 1999; Davies et al., 1993). In the context of this paper, a shopping centre is defined as ‘a planned retail development comprising at least three shops, under one freehold, managed and marketed as aunit’ (Guy, 1994a).
Modelling and predicting shopping centre hinterland boundaries and positions in the retail hierarchy have implications for developers and planners. Questions might be explored, for example, as to whether there will be sufficient business to support a new shopping centre development. Issues include the extent to which existing facilities will be affected by a particular development and the number of new customers who might be attracted

if an existing shopping centre was to be
0969-6989/02/$ - see front matter r 2002 Elsevier Science Ltd. All rights reserved. PII: S 0 9 6 9 - 6 98 9 ( 0 1 ) 0 0 0 2 1 - 2
extended. Despite research effort, this remains an inexactscience. Some centres have been reported only 50% let 12 months after opening (Kirkup and Rafiq, 1993, 1994a, b). Theoretical approaches to modelling shopping centre hinterlands have ‘produced consider-able controversy’ andmodels in which the fit of thedistance component must be adjusted by the ‘Fiddle Factor’ (Rogers, 1984, p. 320;drawing on Openshaw, 1973). Complex models are ‘unpopular among practitioners’ (Breheny,1988).
This paper introduces and tests the authors’ empiri-cally based measurement systemfor the attractiveness of shopping centresFin- and out-of-townFwith a view to modelling and predicting
hinterlands and positions in the hierarchy. The paper proceeds as follows. Firstly, the implications of central place theory and the retail hierarchy are briefly outlined. The development of the authors’ attractiveness model follows and the model isused, in case study examples, to define steps in the retail hierarchy, based on shoppers’ choice behaviour. Scales proposed by other researchers are examined and it is demonstrated that such scales can be modified in the light of the empirical research. A unified attractiveness scale is proposed and demonstrated to have utility in predicting hinterland boundaries, consistent with the principlesof central place theory. Finally, the authors consider whether, when changes in attractiveness are considered,central place theory modellingcan become dynamic. In

discussing the results, indicators are drawn for possible changes that might beanticipated in the UK retail and population structure.
2. Central place theory
Central place theory is based on classical economic assumptions such as uniformityof consumers and travel, a theory described by Brown (1992, p. 40) as an ‘elegant andymuch maligned conceptualisation.’ Based on the work of the German geographer, Christaller (1933)and economist Losch (1940), the theory was, according to O’Brien and Harris (1991), ‘widely accepted by the planning profession as a modelof retail organisation’. O’Brien and Harris considered that central place theory, forexample, ‘explains why London [UK] contain[ed] the major fashion houses and top stores,and why small places such as Durham [UK] [did] not have department stores.’
The theory has been criticised inrecent decades and dismissed as ‘more elegant than practical’ by O’Brien and Harris, who drew support from Dawson (1979, p. 190):
Whilst the theory serves to describe and, in part, explainlocational patterns developed prior to the 1960s, it can no longer be used as anyexplanation of present patterns or planning future.
According to Dawson, central place modelling was flawed because of the complex nature of retailing and scrambled merchandise mixes. Despite acknowledged drawbacks, in this paper, the authors revisit and adapt central place ideas in modelling hinterland boundaries and positions in the retail hierarchy.
In Christaller’s terminology, goods were described in terms of ‘threshold’ (the populationneeded to make supply worthwhile) and range (distance from source of supply beyond which demand falls to zero). According to Brown:
Expensive and infrequently purchased [‘‘compa-rison’’] goodsyhave higher thresholds and ranges than inexpensive, everyday [‘‘convenience’’] purcha-sesyThere will be a large number of purveyors of [convenience] goods and
relatively few sellers of [comparison] merchandise.
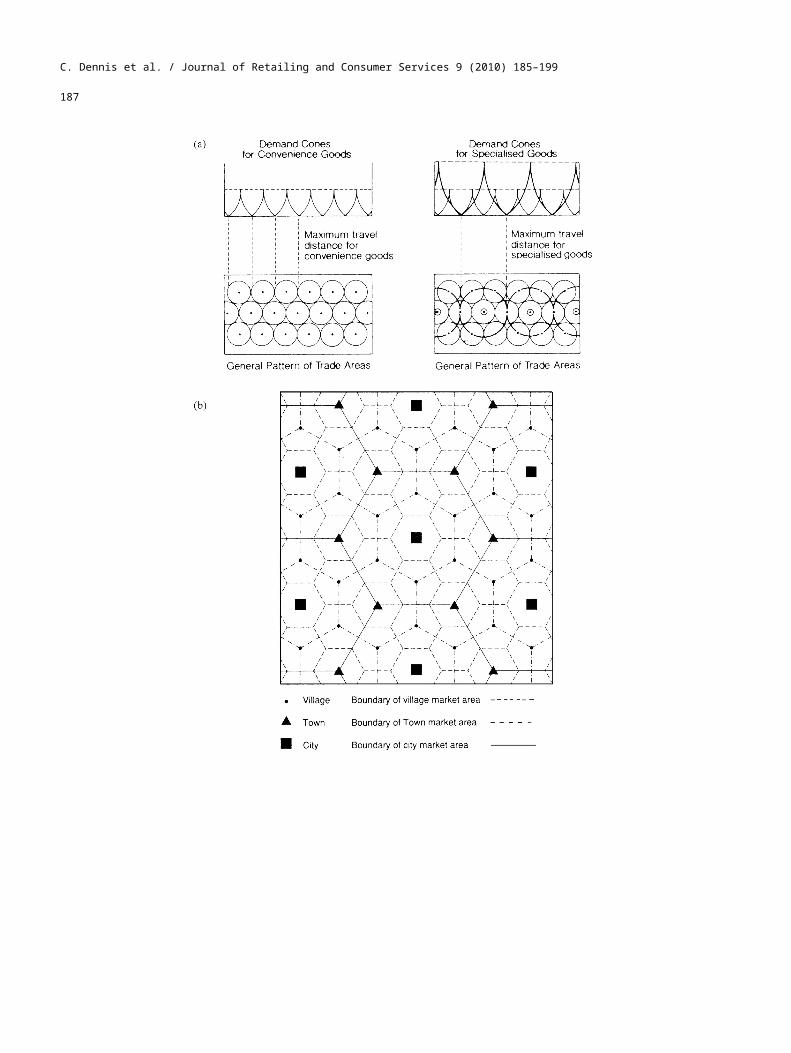
By combining the concepts of threshold and range, hinterlands are defined in which comparison goods are only supplied from populous ‘central’ places whilst convenience goods are sold locally. Economic modelling based on these assumptions produces maps of catch-ment hinterlands in terms of interlocking and over-lapping areas (Fig. 1).
Brown points out that:
The spatial arrangement of shopping facilities in the majority of British cities is explicable in terms of centralplace principles. Typically, this comprises a [comparison] retailing core, a series of [convenience] shopping districts surrounding the corebut closer to it than the edgeof the city, and a greater number of shopping districts in the inner than the outer parts of the urban area.
Effectively summing up researchers’ ambivalent ap-proaches to central place theory, Tang and Ingene (2000)drew attention to essential assumptions that cannot be sustained in reality, for
example the homo-geneity of households and purchasing demands. Never-theless, in calibrating their shopping model (using the example of Shanghai), they observed that the retail hierarchy predictedby the theory was actually observed in practice.
3. The retail hierarchy
The distinction between higherorder comparison and lower order convenience goods has been observed in empirical data, illustrated for example in Fig. 2. Christaller (1933, p. 58) observed that:
We always find great numbers ofcentral places of a lower order, i.e. lesser importance and smaller size. Beside them, we find a considerable number of
C. Dennis et al. / Journal of Retailing and Consumer Services 9 (2010) 185–199
187

Fig. 1. Central place theoryFillustration of demand areas. (a) Hypothetical demand cones. (b) Hierarchy. Notes: (i) Different types and orders of goods supplied from different levels of places will have different ranges and thresholdsand thus sizes of market areas. A nested hierarchy will be produced. (ii) This

pattern is known as a K ¼ 3 hierarchy. The K value is determined by the number of lower order centres served by the next higher level of place. The numbers of centres follows a geometrical progression, proportional to 1, 3, 9 and so on according to the number of levels. Sources:
(a) Brown (1992); originally sourced from Davies (1976). (b) O’Brien and Harris (1991).
central places that have a somewhat greater impor-tance, a still smaller number of places of a higher order, and only very seldom, places of the highest orderyThe greater a town is, the smaller is the numberyin its respective category.
Analogous to Reilly’s (1929, 1931) approach to measuring attractiveness, Christaller based his hierarch-ical systemon population numbers. The (then) standard German classification defined five categories, from the
‘county town’ of 2000–5000 to the ‘metropolis’ of 1,000,000+population. Despite having apparently uti-lised these classifications, Christaller claimed to base
his definitions of the hierarchy on the classification of goods on offer. For any particular good,the outer limit of its range is defined by the distance that shoppers will travel to obtain that good. Beyond a certain distance they may purchase from another place, or may not purchase at all. The inner limit is ‘determinedby the minimum salesyto make the offering pay.’ Christaller claimed to classify

188 C. Dennis et al. / Journal of Retailing and Consumer Services 9 (2010) 185–199
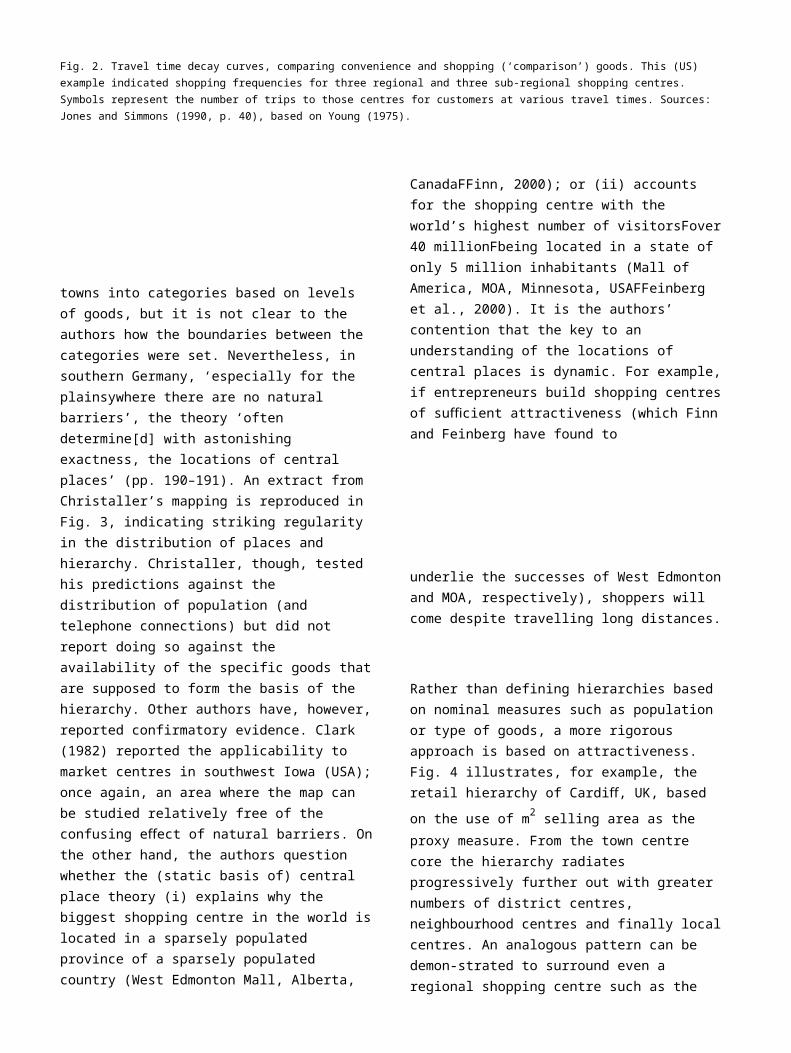
Fig. 2. Travel time decay curves, comparing convenience and shopping (‘comparison’) goods. This (US) example indicated shopping frequencies for three regional and three sub-regional shopping centres. Symbols represent the number of trips to those centres for customers at various travel times. Sources: Jones and Simmons (1990, p. 40), based on Young (1975).
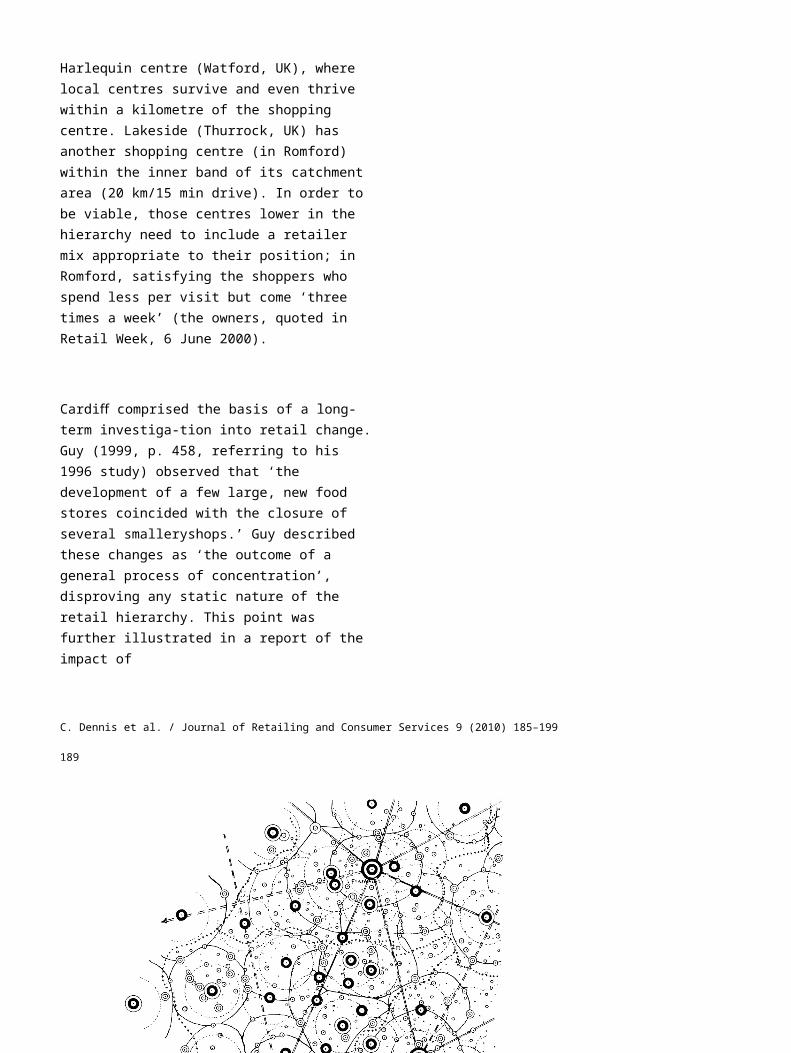
towns into categories based on levels of goods, but it is not clear to the authors how the boundaries between the categories were set. Nevertheless, in southern Germany, ‘especially for the plainsywhere there are no natural barriers’, the theory ‘often determine[d] with astonishing exactness, the locations of central places’ (pp. 190–191). An extract from Christaller’s mapping is reproduced in Fig. 3, indicating striking regularity in the distribution of places and hierarchy. Christaller, though, tested his predictions against the distribution of population (and telephone connections) but did not report doing so against the availability of the specific goods thatare supposed to form the basis of the hierarchy. Other authors have, however,reported confirmatory evidence. Clark (1982) reported the applicability to market centres in southwest Iowa (USA);once again, an area where the map can be studied relatively free of the confusing effect of natural barriers. Onthe other hand, the authors question whether the (static basis of) central place theory (i) explains why the biggest shopping centre in the world islocated in a sparsely populated province of a sparsely populated country (West Edmonton Mall, Alberta,
CanadaFFinn, 2000); or (ii) accounts for the shopping centre with the world’s highest number of visitorsFover40 millionFbeing located in a state of only 5 million inhabitants (Mall of America, MOA, Minnesota, USAFFeinberg et al., 2000). It is the authors’ contention that the key to an understanding of the locations of central places is dynamic. For example,if entrepreneurs build shopping centresof sufficient attractiveness (which Finn and Feinberg have found to
underlie the successes of West Edmontonand MOA, respectively), shoppers will come despite travelling long distances.
Rather than defining hierarchies based on nominal measures such as population or type of goods, a more rigorous approach is based on attractiveness. Fig. 4 illustrates, for example, the retail hierarchy of Cardiff, UK, based on the use of m2 selling area as the proxy measure. From the town centre core the hierarchy radiates progressively further out with greater numbers of district centres, neighbourhood centres and finally localcentres. An analogous pattern can be demon-strated to surround even a regional shopping centre such as the
Harlequin centre (Watford, UK), where local centres survive and even thrive within a kilometre of the shopping centre. Lakeside (Thurrock, UK) has another shopping centre (in Romford) within the inner band of its catchment area (20 km/15 min drive). In order to be viable, those centres lower in the hierarchy need to include a retailer mix appropriate to their position; in Romford, satisfying the shoppers who spend less per visit but come ‘three times a week’ (the owners, quoted in Retail Week, 6 June 2000).
Cardiff comprised the basis of a long-term investiga-tion into retail change.Guy (1999, p. 458, referring to his 1996 study) observed that ‘the development of a few large, new food stores coincided with the closure of several smalleryshops.’ Guy described these changes as ‘the outcome of a general process of concentration’, disproving any static nature of the retail hierarchy. This point was further illustrated in a report of the impact of
C. Dennis et al. / Journal of Retailing and Consumer Services 9 (2010) 185–199
189


Fig. 3. The distribution of towns as central places in southern Germany. Source: Adapted from Christaller, 1933, p. 225.
the Merry Hill regional shopping centre(UK) on the adjacent town of Dudley. Oncompletion of the shopping centre in 1989, a number of major retailers closed their stores and ‘in effect movedthem to Merry Hill’. Many other shops were closed and the premises were reoccupied by low quality and discount stores (Guy, 1999).
In the UK, retail areas have grown in a‘haphazard manner’, from origins as markets in the centres of towns and in
suburban areas through conversions of other types of property (Guy, 1998). Patterns are not as regular as in, for example, southern Germany or southwest Iowa. Guy criticised central place theory as relying on the notion that consumers would tend to buy the goods required at the nearest available location, an assumption:
Clearly incorrect for many shopping trips since other determinants of shopping success are also impor-tantyConsumer choice of shopping destination reflects several qualities,

such as variety of goods, price of goods, cleanliness, spaciousness and security of the centre, and quality andquantity of car parking, for example. Central place theory, which relies mainly on distance as a choice criterion, becomes inadequate in this situation.
Guy, though, goes on to review dimensions of retail classification systems including goods sold, trip purpose, size of store, store ownership, catchment area, physical form, function, location, development history and type. Guy pointed out that shoppers make their choices of shoppingcentre destination from an ‘evoked set’with

190 C. Dennis et al. / Journal of Retailing and Consumer Services 9 (2010) 185–199
Fig. 4. The urban retail hierarchy of Cardiff (UK). Source: Brown (1992); originally sourced from Guy (1984).
respect to a particular combination of location and trip purpose, suggesting a hierarchical classification based on trip purpose and size.
An example is the system used in the UK which sums the numbers of non-food shops in a centre, ranking centres in order of attractiveness (Reynolds and Schiller, 1992; Schiller and Jarrett, 1985). Reynolds and Schiller examined the cumulative frequency of scores, fitting the divisions in the hierarchy to the gaps between size clusters where possible. The hierarchy classifications illustrate the increases in numbers of centresat the lower levels but cannot be observed to follow the strict geometrical progression of central place theory. The six levels were:
Multiple branch
Number of
(Goad) score
centres

National
186
1
Metropolitan
93–132
6
Major regional
35–74
99
Minor regional
25–34
60
Major district
6–24
290
Minor district
2–5
370
In this paper, the authors haveattempted a pre-liminary exploration of the use of retail attractiveness measures in defining positions in the hierarchies and hinterland boundaries for shopping centresand towns. A description of theempirical measurement system for shopping centre attractiveness developed by theauthors is as follows. Empirical measurements have
been compared with ‘retailer count’ systems and a unified scale has been proposed. In a further step, the attractiveness scale has been utilised in defining posi-tionsin the retail hierarchy and predicting hinterland
boundaries, comparing with data not gathered by the authors and not used in developing the model.
4. Propositions to be investigated
Based on the preceding discussion, two propositions onthe development of central places and on consumers’ shopping centre choice behaviour can be derived.
(P1) Population and retail provision tend to cluster around central places defined on a matrix.
(P2) Hinterlands and the retail hierarchy follow the attractiveness of shopping andtown centres.
P1 represents Christaller’s ‘classical’ approach, whereas

P2 follows the more recent classification systems of (e.g.) Guy; Reynolds and Schiller. P1 and P2 are not necessarily mutually exclusive, but if P2 is accepted, a trend towards the redistribution of popula-tion around attractive shopping destinations might be expected. Accordingly, this study was designed to test, onan exploratory basis, the extent to which P1 and P2 fit available exemplar UK data.
5. Attractiveness
The use of attractiveness measurements in the context of consumers’ choices of shopping centres has been reported earlier(Dennis et al., 1999a). The studywas based on a questionnaire survey of 287 respondents at six UK shopping centres varying in size from small in-town sub-regional to large regional out-of-town centres. A ‘regional’ centre has a gross retail area ofgreater than 50,000 m2 and a ‘sub-regional’ one 20,000–50,000 m2 (based on Guy, 1994a, b; Marjanen, 1993; Reynolds, 1993). The study evaluated shoppers’ comparative ratings of two shopping centres, one of them being the centre where the interview took place. The alternative centre was the one where they shopped most (or next most after the interview centre) for non-food shopping. The
questionnaire instrument was based on the ‘attributes of image’ elements employed by McGoldrick and Thompson (1992a, b) together with additional constructs derived from analyses of preliminary un-structured interviews. Respondents stated their percep-tions of the ‘importance’ of each of 38 attributes (including those identified by Guy as figuring in consumers’ choices of shopping destination, for exam-ple, ‘quality of stores’, ‘cleanliness’ and ‘availability of toilets’, following Hackett and Foxall, 1994). Each attributewas also ‘rated’ for both the centre studied and the alternative centre. Respondents estimated perceived travel distance and time to both centresand supplied details such as age,location of residence and
C. Dennis et al. / Journal of Retailing and Consumer Services 9 (2010) 185–199
191
occupation of the main earner in the household. Examination of the characteristics of the sample indicated the distribution of socio-economicgroups, age and sex reasonablyrepresentative of that anticipated at UK shopping centres.
Further questions concerned typical perceived monthly spend at each of the two centres. As McGoldrick and Thompson pointed out, much of the variation in shoppers’ expenditure relates to factorssuch as income or socio-economic groups, rather than travel distance or attributes of the shopping centre. Following this approach, the main dependent variable used in this study was the ‘individual relative spend’. Avalue of 100 indicated all expenditure at the centre studied none at the alternative centre. A value of50 indicated half of the expenditure at each centre. The same approach was used to scale perceived travel distance and time producing the variables ‘individual relative travel distance’ and ‘time’.
The view of ‘attractiveness’ taken by the authors is that any product (such as a shopping centre) ‘can be seen as a bundle of expected costs and rewards’ which East (1997,p. 131) found was ‘upheld by research’. East drew support from Westbrook’s (1980) finding that ‘an overall measure of retail satisfactioncorrelated well with a simple addition of the satisfactions and dissatisfactions that customers experienced.’ In theauthors’ methodol-ogy, the measures of satisfaction and dissatisfaction have been taken from the respondents’ ratings of the shopping centrecompared to their main alternative centre (on 5-pointsemantic differential type scales). These satisfactions for the individual attributes were weighted, firstly by the ‘importance’ of the attribute to the respondent (also on a 5-point scale) and secondly bythe degree of association withthe stated relative spend. Once weighted, satisfactions were added, giving an overall ‘attractiveness’ measured value. The authors combined the attractiveness measurements with the relativetravel time or distance variables, to derive
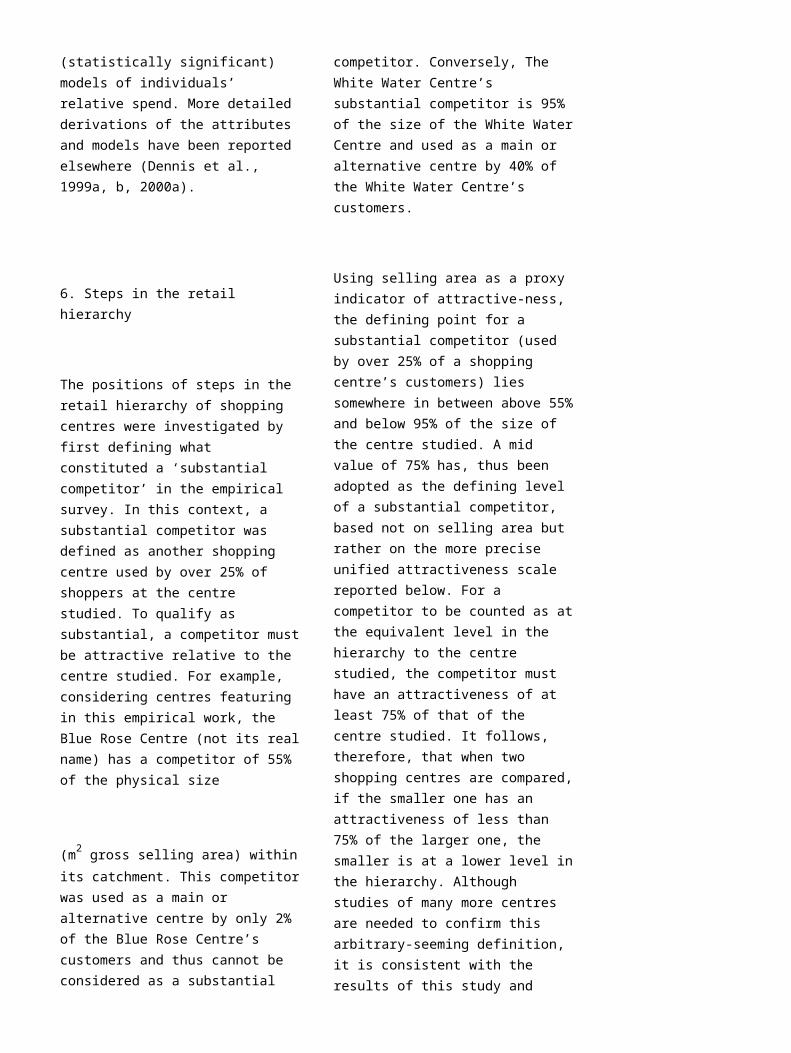
(statistically significant) models of individuals’ relative spend. More detailed derivations of the attributes and models have been reported elsewhere (Dennis et al., 1999a, b, 2000a).
6. Steps in the retail hierarchy
The positions of steps in the retail hierarchy of shopping centres were investigated by first defining what constituted a ‘substantial competitor’ in the empirical survey. In this context, a substantial competitor was defined as another shopping centre used by over 25% of shoppers at the centre studied. To qualify as substantial, a competitor mustbe attractive relative to the centre studied. For example, considering centres featuring in this empirical work, the Blue Rose Centre (not its realname) has a competitor of 55% of the physical size
(m2 gross selling area) withinits catchment. This competitorwas used as a main or alternative centre by only 2% of the Blue Rose Centre’s customers and thus cannot be considered as a substantial
competitor. Conversely, The White Water Centre’s substantial competitor is 95% of the size of the White WaterCentre and used as a main or alternative centre by 40% of the White Water Centre’s customers.
Using selling area as a proxy indicator of attractive-ness, the defining point for a substantial competitor (used by over 25% of a shopping centre’s customers) lies somewhere in between above 55%and below 95% of the size of the centre studied. A mid value of 75% has, thus been adopted as the defining level of a substantial competitor, based not on selling area but rather on the more precise unified attractiveness scale reported below. For a competitor to be counted as atthe equivalent level in the hierarchy to the centre studied, the competitor must have an attractiveness of at least 75% of that of the centre studied. It follows, therefore, that when two shopping centres are compared,if the smaller one has an attractiveness of less than 75% of the larger one, the smaller is at a lower level inthe hierarchy. Although studies of many more centres are needed to confirm this arbitrary-seeming definition, it is consistent with the results of this study and

those of other authors analysed below. That is, a centre at a lower level can lie within the catchment of a larger centre, whilst there will be a ‘break point’ in catchment boundary between twocentres at the same level.
7. Unified attractiveness scale
Mintel (1997) reported an attractiveness measurement scale for shopping centres andtowns, based on numbers of retail outlets, scoring multiples higher than others and certain specific named retailers higher still. In thelight of many considerations that are known to inform shoppers’ choices of shopping destinations, measuring shopping centre attractiveness, in such a manner, initially appears trivial. Nevertheless, evidence in sup-port can be inferred from at least two independent sources. Firstly, Finn and Louviere (1996) investigated all 17 regional and community shopping centresin Edmonton, Canada. The fit of their regression models was‘highly significant, with between 70% and 90% of image item variance accounted for bythe store tenant variables’ such as the presence of
particular major and discount department stores. Other characteristics had some significant effects, but the additional effect on image was ‘generally rather small’. It was concluded that specific anchor stores had a substantial impact on consumers’ images of shopping centres, accounting for ‘most of the variation in centre patronage’. Secondly, Feinbergand associates (2000) investigated the

192 C. Dennis et al. / Journal of Retailing and Consumer Services 9 (2010) 185–199
prediction of (US) mall patronage from attraction scales using stepwise logit regression. In every case, therating of specific stores thatmost attracted customers was demonstrated to be the most significant variable. Findingssuch as these, are understandable when it is considered that the most attractive shopping centres will be expected to attract the most successful and popular retailers.
In this study, the ‘Mintel’ scale correlated well with theempirical measurements from the questionnaire surveys, R2 ¼ 0:94 for Eq. (1):
A ¼ 0:978B; ð1Þ
where A is the Mintel score and B the empirical ‘Brunel Index’ for attractiveness (from the survey-measured weighted attractiveness summations, rescaled to use anequivalent numerical scale to the Mintel scoreFFig. 5). Corrections must be made, though, for the differences
Fig. 5. ‘Mintel’ scores, A; of shopping centres vs. the ‘Brunel’ measured attractiveness index, B; of the centres on the ‘Mintel’ scaleFcorrected for towns (intercept set to 0).
between planned, covered shopping centre attractivenessand the unplanned town

centres, and in addition for the effect that the surroundingtown area has on shoppers’ perceptions of the attractiveness of the centre. The attractiveness measure wassignificantly associated with shopping centre sales turnoverand rental income (R2=0.99 and0.98, respectively, reported more fully elsewhere: Dennis et al., 2000b).
To estimate and plot hinterland boundaries, maps indicating the locations of towns and shopping centres along with their Mintel scoreswould be useful. Such maps canbe produced to order by data owner(s). The Hillier Parker’s‘New Guide to shopping centresof Great Britain (Goad Plans/OXIRM, 1991, the ‘Goad Plan’) is useful in this connection. The Goad Plan is based on the numbers of branches of 113 specific multiple retailers (‘Goad scores’Fbased on one of the examples referred to by Guy and designed to reflect the presence of multiple comparison goods retailersFRey-nolds and
Schiller, 1992). An extract from the Goad Plan is reproduced in Fig. 6. The areaselected deliber-ately typifies a part of middle England relatively free from natural barriers and having inconsequence some regularity inthe distribution of towns. Below those towns rated in theGoad hierarchy, there is a level of smaller places, such that, in the Middle Ages, every habitation was within a one-day return walk of a market.
The authors have determined the Goad scores to be valid measures of attractiveness fortowns, correlating with scalesproposed by other research organisations (such as Management Horizons, 1995: for15 towns also rated on the Goad Plan, R2 ¼ 0:88; significant as p ¼ 0:01). The Mintel scores, though, are valid for both towns and shopping centres. To facilitate data handling, the Goad scores have been rescaledto the Mintel equivalents.

Fig. 6. Towns and shopping centres in central England. Source: Extracted and adapted from Goad Plans/OXIRM, 1991.
C. Dennis et al. / Journal of Retailing and Consumer Services 9 (2010) 185–199
193
Based on the best fit of available data, it has been estimated that, for plotting hinterland boundaries, the attractiveness of towns must
be scaled down by a fixed percentage compared to shopping centres. Validating the combined scale as linear, estimates of sales values for town and shopping centre combinations together with

out-of-town shopping centres correlated well with the combined attractiveness scale (coefficient of determina-tion,R2 ¼ 0:92; significant at p ¼ 0:01). It must be stressed that the authors’ new empirical attractiveness measures should be used whenever practicable. Never-theless, the scale based on Goad and Mintel values, adjusted for town centres vs. shopping centres, can be utilised as alternative where the empirical measures are notavailable.
Fig. 7. Distance exponent, d; on visit rate per 1000 residents vs. ‘Brunel’ measured attractiveness index of shopping centre plus correction for town centre (where relevant) on the ‘Mintel’ scale, B:
8. Distance exponent
The principle of the ‘gravitational’ theory of retail is that shoppers are more likely to shop in a more attractive town or shopping centre, but the attractive-ness decreases with distance. Spend can be considered as being positively related to some measure(s) of attrac-tiveness and negatively
related to some measures(s) ofunattractiveness or deterrence, such as ‘distance’. Reilly (1929, 1931) used analogy with gravitation as the basis of his ‘law’ which forms the bases of many approaches to retail location. The frequencywith which residents trade with a town is postulated to be directly propor-tional to the attractiveness and inversely proportional to somepower of the distance that they travel. This inverse effect of distance, though,

need not be limited to its ‘square’ as in Reilly’s gravitational analogy. Rephrasing, the ‘distance exponent’ is not necessarily numerically equal to _2. Basedon the questionnaire survey outlined above, the authors have previously reported on varia-tions in the distance exponent (Dennis et al., 1999b, 2000a). The distance exponent was demonstrated to be a variable related to attractiveness. The authors contend that an estimation of the distance exponent, d; can be predicted from the Brunel Index of attractiveness, B; using a relationship derived from a linear regression (SPSS):
d ¼ _0:0044B þ 3:19: ð2Þ
The empirical data comprising thebasis of the relationship are illustrated in Fig. 7.
9. The hinterland boundary
Reilly’s ‘law’ has been restated (Converse, 1949) to estimate the ‘break point’ between two towns which separates the areas of dominance of each. As reported
elsewhere, the break point calculation can be modified
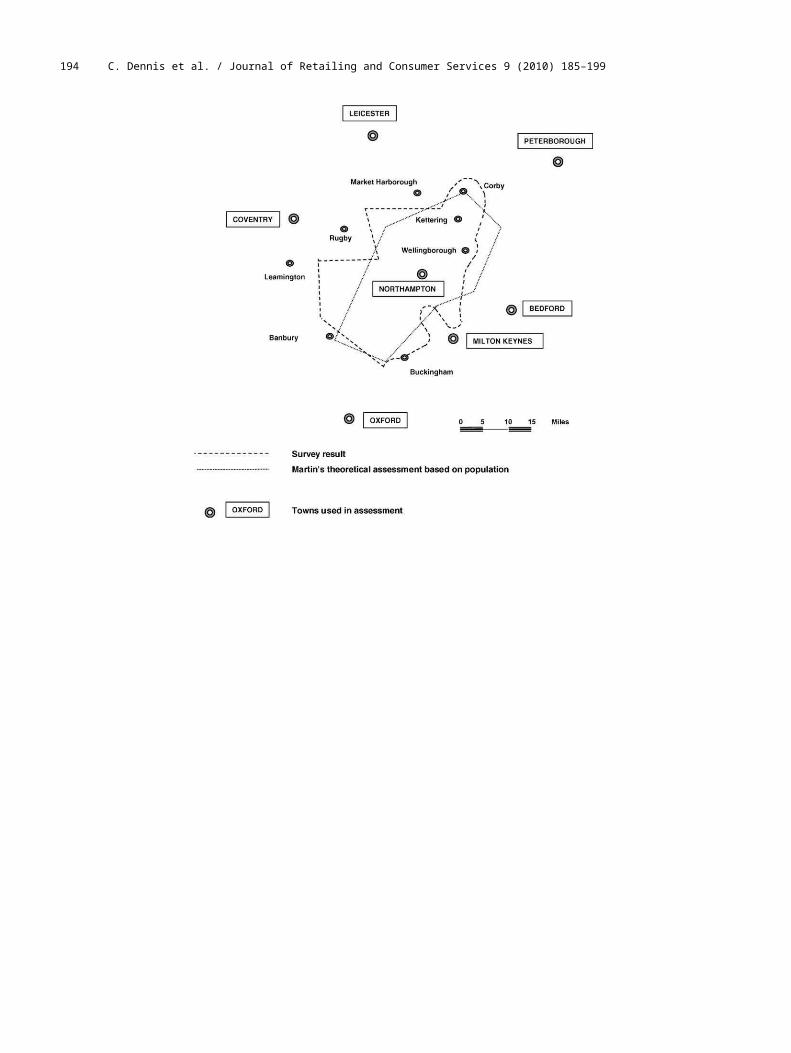
to incorporate varying distance exponents (Dennis et al., 2000c). Martin (1982) demonstrated that Reilly’s lawbreak points could be used to define a notional catchment area boundary, by calculating (and joining) multiple break points with surrounding towns.Martin compared the calculatedbreak points around North-ampton (England) and surrounding towns with a survey data contour (from 1350respondents) enclosing the area from which 90% of Northampton’s shoppers travelled.
Martin’s calculated break points for Northampton produced a hinterland boundaryin reasonable agree-ment with survey results, illustrated inFig. 8. This provided a quick quantitative method of estimating the catchment area,but with two disadvantages. Firstly, there was only a single measure of attractivenessFpo-pulation. Population must be an inappropriate measure for the attractiveness of the new townshopping centre of Milton Keynes, which acts in effect ina similar way to an out-of-town shopping centre for a large hinterland. Secondly,

the distance exponent was treated as a constant althoughit has been demonstrated to bea variable. The authors have reworked the break point calculations using unified attractiveness scores togetherwith estimated distance exponents (derived from Fig. 7). An intuitive restatement of the Reilly/Converse break point prediction of the position of the break point between towns a and b would be
distance from a ¼ distance from ato b
;
ð3Þ
1 þ ½db
pffiffiffiffiffiffi=
pffiffiffiffiffiffi
& Ab
½da& Aa
where da and db are the distance exponents for towns ‘a’ and ‘b’, respectively, Aa
and Ab their attractiveness scores. Eq. (3) is, though, only a first approximation of a relationship to which there is no straightforward arithmetic solution. The full derivation has been reported elsewhere (Dennis et al., 2000c) and space limitations preclude inclusion here. In brief, the break point derivedfrom Eq. (2) must be multiplied by the
194 C. Dennis et al. / Journal of Retailing and Consumer Services 9 (2010) 185–199

Fig. 8. Catchment area of Northampton, comparing the theoretical assessment from the Reilly/Converse ‘law’ with the survey result. Source: Adapted from Martin (1982, p. 71).
correction factor rffiffiffiffiffiffiffiffiffiffiffiffiffiffiffiffiffiffiffiffiffiffiffiffiffiffi
½d& 1 þ Fa _ Fb;
2F
where the values of Fa and Fb; respectively, are
Aa
and
Ab
:
Dada
Dbda
Da and Db are the distances of the calculated break point (Eq. (3)) from a and b, respectively, d the higher of the distance exponents and F the lower of the Faand Fb function values. In the authors’ experience, this simpli-fied procedure has always estimated break points within 0.2 km of the theoretically optimum solution.
Martin defined the catchment area in what may seem to be an arbitrary mannerFthe boundary which enclosed 90% of the shoppers, pointing out that ‘anyattempt to identify more than around 90% of catchment area results in absurdities such as claiming that partsofyAmerica should be included’. The authors have investigated the use of values other than 90%. No other value was more useful in modelling shopper

spend. The value of 90% has therefore been retained as a standard (R2 value inpredicting the effect of distance on individual spend 0.85 when using the 90% value for
defining catchment, compared to 0.62 and 0.57 for 85% and 95%, respectively).
By substituting ‘attractiveness’ for ‘population’, and using distance exponent values estimated from attrac-tiveness, the break point method has been adapted to help predict catchment area for an out-of-town shop-ping centre as well as for a town. The authors have tested predictions againstdata not gathered by them and not used in developing the models. There is a scarcity of such data published in the public domain, but two surveys mapping customer catchments have been used, a town (Northampton, UKFMartin, 1982Fthe example referred to above) and an out-of-town shopping centre (Meadowhall, UKFHoward, 1993). Predicted hinter-landboundaries have been compared with survey results for these two areas, illustrated in Figs. 8–10.
For out-of-town regional shopping centres, break point calculations in the main are less applicable than for towns as such centres are usually not surrounded by competitors attractive enough to figure at an equivalent levelin the retail hierarchy. Fig. 10 is an example of catchment data for Meadowhall out-of-town shopping centre,
near Sheffield, England using data from Ho-ward’s (1993) survey of 1244 respondents.
The authors’ break point calculations have been basedon estimated drive times from Automobile

C. Dennis et al. / Journal of Retailing and Consumer Services 9 (2010) 185–199
195
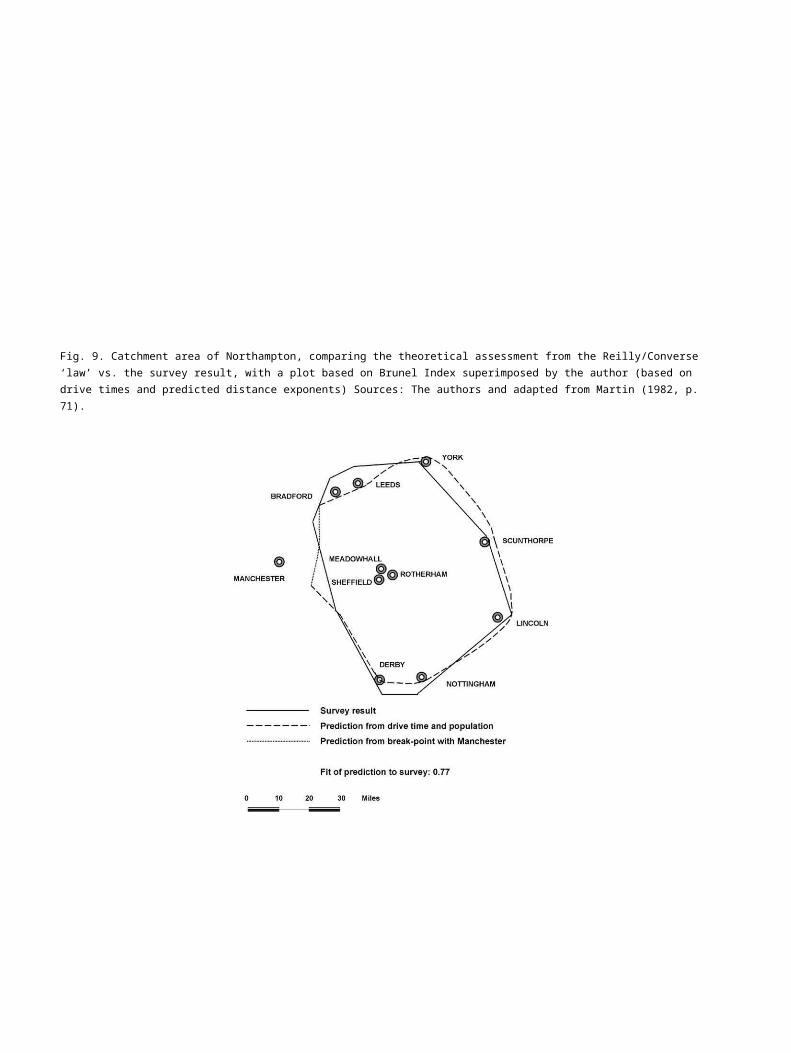
Fig. 9. Catchment area of Northampton, comparing the theoretical assessment from the Reilly/Converse ‘law’ vs. the survey result, with a plot based on Brunel Index superimposed by the author (based on drive times and predicted distance exponents) Sources: The authors and adapted from Martin (1982, p. 71).

Fig. 10. Catchment area of Meadowhall, comparing the theoretical assessment from predicted ‘Brunel attractiveness’, distance exponents and population, plus the ‘break points’ with Manchester (based on drive times) vs. the survey result. Sources: The author, adapted from Howard (1993, p. 101); Census (1991) and Routemaster (B1998).

196 C. Dennis et al. / Journal of Retailing and Consumer Services 9 (2010) 185–199
Association data (AA: Routemaster programme,B1998), plotted via the major roads. For Northampton, illustrated in Fig. 9, the radii of the predictions in the directions of towns in the vicinity of the hinterland boundary fit the survey result well, with aHoel and Jesson index of fit=0.82 (equivalent to the R2
valueF Hoel and Jesson, 1982).
In directions
other than Manchester,
the effect
of competitors
is not relevant and
predictions
were made using standard calculations based on population, drive time (or distance) and estimated distance exponents only. Populations (residents in households from Census, 1991) in radial segments in the direction of the main population centres have been analysed in conjunction with the (Routemaster, B1998) drivetimes together with the estimated distance exponent. Fig. 10 illustrates the catchment boundary calculated
on this basis (for directions other than Manchester) compared with the boundary enclosing 90% of respondents (estimated by the authors fromHoward’s respondent ‘spots’).
The predicted catchment for Meadowhall is less extensive than that observed in the directions of Bradford, Leeds,Nottingham and Derby but at York, Scunthorpe and Lincoln is close to the survey result.In the direction of Manchester, the catchment areaboundary has been calculated using break point calculationsFand the fit is considerably closer to the survey result than is the standard calculation.
Practitioners tend to favour the estimation of catch-ment area boundaries from drive time isochrones. For example, the authors have calculated that the isochrone that enclosed 90% of respondents inthe Meadowhall survey was at the 50 min drive time. This isochrone, though, extended into the city of Manchester, consider-ably beyond the observed catchment. The break point method predicts the catchment boundary in the direc-tion of Manchester more

closely than does either the standard calculation or the isochrone. The radii of the predictions using the break point method again fitted the survey result well. When combined with the standard distance exponent approach forother radii directions, catchment area was predicted with a Hoel and Jesson index of fit=0.77.
10. Discussion and conclusions
In this paper, the authors have eschewed the rigid ‘laws of settlement’ which, according to Christaller, determined ‘the location of central places’. Rather, the dynamic nature of shopper behaviour has been demon-strated with shoppers following the provision of attractive shopping areas. Decisions of developers and planners can lead to the building of large out-of-town shopping centres that redefinethe retail hierarchy. As
briefly alluded to above, Guy (1996, 1998, 1999) has studiedmany examples, and concluded that a more flexible interpretation of central place theory is needed for useful application to UK
retail. The authors share the view that strict economic assumptions can be relaxed in a more pragmatic approach.
On the one hand, the distribution of market towns in middle England, illustratedin Martin’s study of shopping patterns around Northampton, supported proposition P1. In that approach, population appeared clustered around central places defined on a matrix (classical central place theory), with hinterlandbreak points being defined by population (Reilly/ Converse).The authors, though, have demonstrated an alternative scenario. In line with proposition P2, hinterland catchment areas and the retailhierarchy followed the attractiveness of shopping andtown centres, which in turn was closely related to the provision of shops that shoppers considered attractive. This proposition was demonstrated to hold not only for traditional towns andshopping, but also for new out-of-town shopping centresFthus, extrapolating beyond the scope of P1.
The dynamic nature of shoppingbehaviour following the provision of shops can be further illustrated by comparing the famous,

traditional English Universitycities of Oxford and Cambridge. These are of similar population size (and socio-demographic profile), but Cambridge supports 15 moreof the specified multiple comparison goods retailers included in the Goad score (27% higher attractiveness score). Reynolds and Schiller (1992) suggested this to be due to Cambridge’s expan-sion in catchment draw resulting from the opening of the Grafton Centre on the edge of the central area. The results from this study indicate a correlation between attractiveness score and salesturnover (R2 ¼ 0:99; as mentioned above and reported elsewhere: Dennis et al., 2000b). By modelling sales turnover on this basis, it hasbeen deduced that Cambridge’s consumer spending is around a quarter more than that of Oxford, directly resulting from the building of the new shopping centre.
In the examples of Northamptonand Meadowhall, a fit has beenobserved between the predictedbreak points and the boundary containing 90% of shoppers. From this, it can be concludedthat there is an overlap of catchment area boundariesFclose to 10%. Shoppers do not necessarily shop at the nearest place that
satisfies their requirements for specific goods. Rather, they take into account many aspects of shopping destinations and, when considered on aggregate, distribute their (non-food) shopping expenditure accordingto their assess-ments of the attractivenesses of the destinations. Despite the manyother considerations in shoppers’ decisions of where to shop, there nevertheless appears to be a close association between assessments of attractiveness and

C. Dennis et al. / Journal of Retailing and Consumer Services 9 (2010) 185–199
197
the numbers of shops, particularly those shops especially desired by the consumers. This is understandable on the basis that the most attractive shopping centres will attract the most successful retailers.Centres under-performing on attractiveness lack the big name and designer stores.
The authors’ results have justified one aspect of classical central place theoryFthe nesting hierarchy of hinterlands. For example, from Fig. 9, the town of Market Harborough can be seen to lie within the hinterland of Northampton. On the other hand, there is a break point boundary between Milton Keynesand Northampton; although Milton Keynes is closer to Northampton than is Market Harborough. Milton Keynes (andthe other towns used in the break point assessments) is onthe equivalent hierarchy levelto Northampton, based on the rule of at least 75% of the attractiveness score of Northampton. Market Harborough, though, in common with a number of smaller townsnot used in the break points
assessment, is below the 75% measure. The authors’ data (ongoing study, to be reportedlater) indicate that the typical resident of Market Harborough has some comparisongoods expenditure in that market town, but substantiallymore in Northampton and/or Milton Keynes. In the examplesof both Northampton and Meadowhall, the defining levelof 75% of attractiveness appears to have been effective in defining the level in the hierarchy. Towns below 75% attractiveness do not appear to affect the catchment area boundaries of the larger centres.
The authors contend that classical central place theorycan be modified in the light of proposition P2, taking as abasis for the provision of retail offerings, which can be modified by planners and developers. Thus, it can be forecast that movements of population towards the new ‘central places’ will follow develop-ments of regional shopping centres. This effect has been observed in the USA from as long ago as 1976 (Gosling and Maitland, 1976; Lion, 1976). Young (1985) docu-mented the US trend for

residential and office develop-ment around ‘suburban growth poles’ centred on regional, out-of-town shopping centres, sometimes growing to ‘minicities’ of 300,000–500,000 residents (for example, Brae, California). Inthese ‘edge cities’, ‘malls usually function as the village squares’ (Garreau, 1991). Des Rosiers and associates (1996, Canada) reported a positive correlation between house prices and proximity to shopping centres. In the UK, it is understood that some of the best-known out-of-town shopping centres (The Metro Centre and LakesideF Mintel, 1997; BraeheadFLowe, 2000a) have attempted to be reclassified for planning regulation purposes as ‘in-town’, on the grounds that residential development has been attracted to the area. According to Lowe (2000b), UK shopping centres are becoming ‘the new high
streets’ in a trend even more marked than in the US. All of these indications support an essential tenet of central place theory associating the number of popula-tion and provision of services with theavailability of shops. Retail has been stated to form ‘the heart of virtually all [UK] towns and cities’ (Retail
Week, 9 June 2000). That article went on to claim that the first step in urban regeneration is renovating shopping centres and retail, citing the example of the ‘transformation of Wood Green Shopping City [that] created afocus for the north London community and improved the surrounding area’. The authors’ work has demonstratedthe link between shoppers and retail attractiveness to be part of a dynamic process in which planners and developers might take the initiative in providing shops, leading to changes in population, expenditure, residence patterns and indeed bringing new life into run-down areas.
If the findings are confirmed by larger studies, there may be a number of implications. Shopping centre developers will be able to more accurately model the likely catchment areas of new or extended centres, and plannerspredict the impact on existingfacilities with more confidence. By progressing to a further stage of modelling, residential developers and institutional len-ders can benefit from improvements to the prediction of house price changes. Planners will be ableto model the effects of regeneration projects in orderto more accurately assess

required infrastructure improvements and residential provision associated with retail and shopping centre developments.
The work reported has been exploratory in nature. Confirmatory studies of largernumbers of shopping centres and respondents are recommended. There are limitations to central place theory but the authors contendthat aspects of central place practice, when suitably modified to place the main focus on the retail provision,are worthy of further consideration by planners, developers and managers. The indications from the results to date are that, once the strict economic assumptions are relaxed, the principles can be applied to both in-townand out-of-town shopping centres, improving the prediction of hinterland catch-ment area boundaries anddefining positions of centres in the retail hierarchy.
Acknowledgements
The authors thank Capital Shopping Centres PLC for assistance with funding, Professor Peter McGoldrick of
UMIST for posing many searching questions on early versions of the results, Professors Ross Davies of the Oxford Institute of Retail Management, Clifford Guy of theCardiff University of Wales andHeli Marjanen of Turku School of Business Administration forproviding much extra useful information.
198 C. Dennis et al. / Journal of Retailing and Consumer Services 9 (2010) 185–199
References
Breheny, M.J., 1988. Practical methods of retail location analysis: a review. In: Wrigley (Ed.), Store Choice, Store Location and Market Analysis. Routledge, London, pp. 39–86.
Brown, S., 1992. Retail Location: a Micro-Scale Perspective. Alder-shot, Avebury.
Census, 1991. Census of Population. HMSO, London.
Christaller, W., 1933. Central Places in Southern Germany (translated by Baskin C (1966)). Prentice-Hall,Englewood Cliffs, NJ.
Clark, D., 1982. Urban Geography. Croom Helm, London. Converse, P.D., 1949. New laws of retail gravitation. Journal of
Marketing 14, 379–384.
Davies, R.L., 1976. Marketing Geography, with Special Reference to Retailing. Retail Planning Associates, Corbridge.
Davies, R.L., Howard, E., Reynolds, J., 1993. The Shopping Industry 1993:Thirty Years of Growth. Oxford Institute of Retail Management/British Council for Shopping Centres, Oxford.
Dawson, J.A., 1979. The Marketing Environment. Croom Helm, London.
Dennis, C.E., Marsland, D., Cockett, W.A., 1999a. Why do people shop wherethey do? Recent Advances in Retailingand Services Science, Proceedings of the 6th International Conference, TheEuropean Institute of Retailing and Services Studies, Eindhoven, The Netherlands.
Dennis, C.E., Marsland, D., Cockett, W.A., 1999b. Objects of desire: attraction and distance in shopping centre choice. Proceedings of the 10th International Conference on Research in the Distributive Trades, Institute for Retail Studies, Stirling.
Dennis, C.E., Marsland, D., Cockett, W.A., 2000a. Objects of desire: attraction and distance in shopping centre choice. International Journal of New Product Development and Innovation Manage-ment 2 (2), 43–60.
Dennis, C.E., Marsland, D., Cockett, W.A., 2000b. Can a shopping centre be a brand? Proceedings of the 11th International EARCD Conference on RetailInnovation, ESADE, Barcelona.
Dennis, C.E., Marsland, D., Cockett, W.A., 2000c. The ‘‘break point’’ revisited, Contemporary Issues in Retailing and Mar-keting Conference 2000, the Planning and Management of Retail Locations, Manchester Metropolitan University, Manchester.

Des Rosiers, F., Lagana, A., Thierault, M., Beaudoin, M., 1996. Shopping centres and house values: anempirical investigation. Journal of Property Valuation and Investment 14 (4), 411–462.
East, R., 1997. Consumer Behaviour. Prentice-Hall, Hemel Hemp-stead.
Feinberg, R., Stanton, J., Keen, C., Kim, I.-S., Hokama, L., de Ruyter, K., 2000. Attraction as a determinantof mall choice. Proceedings of the 7th International Conference on Retailing and Services Science, European Institute of Retailing and Services Science, Eindhoven.
Finn, A., 2000. Retail entertainment:lessons from the world’s first mega-multi-mall. Proceedings of the 11th International EARCD Conference on Retail Innovation, ESADE, Barcelona.
Finn, A., Louviere, J.J., 1996. Shopping centre image, consideration and choice: anchor store contribution. Journal of Business Research 35, 241–251.
Garreau, J., 1991. Edge City: Life onthe New Frontier. Anchor, New York.
Goad Plans/OXIRM, 1991. The New Guide toShopping Centres of Great Britain. Hillier Parker, London.
Gosling, D., Maitland, B., 1976. Design and Planning of Retail Systems. Architectural Press, London.
Guy, C.M., 1984. The urban pattern ofretailing: within the UK. In: Davies,R.L., Rogers, D.S. (Eds.), Store Location and Store Assessment Research. Wiley, Chichester.
Guy, C.M., 1994a. The Retail Development Process: Location, Property and Planning. Routledge, London.
Guy, C.M., 1994b. Whatever happened to regional shopping centres. Geography 79 (4), 293–312.
Guy, C.M., 1996. Corporate strategiesin food retailing and their local impacts: a case study of Cardiff. Environment and Planning A 28, 1575–1602.
Guy, C.M., 1998. Classification of retail stores and shopping centres: some methodological issues. Geojournal 45, 255–264.
Guy, C.M., 1999. Retail location analysis. In:Pacione, M. (Ed.), Applied Geography: Principles and Practice. Routledge, London.
Hackett, P.M.W., Foxall, G.R., 1994. A factor analytic study of consumer’slocation specific values: a traditional high street and a modern shopping mall. Journal of Marketing Management 10, 163–178.
Hoel, P.G., Jesson, R.J., 1982. BasicStatistics for Business and Economics. Wiley, New York.
Howard, E., 1993. Assessing the impact of shopping centre develop-

ment: the Meadowhall case. Journal ofProperty Research 10, 97–119.
Jones, K., Simmons, J., 1990. The Retail Environment. Routledge, London.
Kirkup, M., Rafiq, M., 1993. An examination of occupancy dynamics in new shopping centres. Marketing Education Group, Proceedings of Annual Conference 2, 559–569.
Kirkup, M., Rafiq, M., 1994a. Tenancydevelopment in new shopping centres: implications for developers and retailers. The International Review of Retail Distribution and Consumer Research 4 (1), 17–32.
Kirkup, M., Rafiq, M., 1994b. Managing tenant mix in new shopping centres. International Journal of Retail and Distribution Manage-ment 22 (6), 29–37.
Lion, E., 1976. Shopping Centres Planning Development and Administration. Wiley, New York.
Losch, A., 1940. The Economics of Location (translated by Woglam W H, Stolper W F (1954))Yale University, New Haven, CT.
Lowe, M.S., 2000a. Britain’s regional shopping centres: new urban forms. UrbanStudies 37 (2), 261–274.
Lowe, M.S., 2000b. Britain’s regionalshopping centres: new urban forms. Proceedings of the 7th International
Conference on Retailing and Services Science, European Institute of retailing and Services Science, Eindhoven.
Management Horizons, 1995. Index of Shopping Venues, Manage-ment Horizons, London.
Marjanen, H., 1993. Store location analysis and the mystery of consumer spatial behaviour: competition between downtown shopping areas and out-of-town shopping centres as a special case, Turku School of Economics and Business Administration, Turku, Finland.
Martin, P.G., 1982. Shopping Centre Management. London,Spon. McGoldrick, P.J., Thompson, M.G., 1992a. The roleof image
in the attraction of the out of town centre. The International Review of Retail, Distribution and Consumer Research 2 (1), 81–98.
McGoldrick, P.J., Thompson, M.G., 1992b. Regional Shopping Centres: Out-of-Town versus In-Town. Aldershot, Avebury.
Mintel, 1997. Shopping Centres. London, Mintel.
OBrien, L., Harris, F., 1991. Retailing: Shopping, Society, Space. David Fulton, London.
Openshaw, S., 1973. Insoluble problems in shopping model cali-bration when the trip pattern is not known. Regional Studies 7, 367–371.
OXIRM, 1999. The Shopping Centre Industry: its Importance to the UK Economy, Oxford Institute of Retail Management/MCB, Oxford.
C. Dennis et al. / Journal of Retailing and Consumer Services 9 (2010) 185–199
199
Reilly, W.J., 1929. Methods for the study of retail relationships. University of Texas Bulletin, p. 2944.
Reilly, W.J., 1931. The Law of Gravitation. Knickerbocker Press, NewYork.
Reynolds, J., 1993. The proliferationof the planned shopping centre. In: Bromley, D.F., Thomas, C.J. (Eds.), Retail Change Contem-porary Issues. UCL, London.
Reynolds, J., Schiller, R., 1992. A new classification of shopping centres in Great Britain using multiple branch numbers. Journal of Property Research 9, 122–160.
Routemaster, 1998. SK 6801 St Albans, Pan Star.
Rogers, D.S., 1984. Modern methods ofsales forecasting. In: Davies, R.L., Rogers, D.S. (Eds.), Store Location and Store Assessment Research. Wiley,Chichester, UK, pp. 319–331.
Schiller, R., Jarrett, A., 1985. A ranking of shopping centres using multiple branch numbers. Journal ofProperty Research 9, 122–160.
Tang, E., Ingene, C., 2000. Determinants of consumer shopping productivity. Proceedings of the 7th International Conference on Retailing and Services Science, European Institute of Retailing andServices Science, Eindhoven.
Westbrook, R.A., 1980. Intrapersonal affective influences upon consumer satisfaction. Journal of Consumer Research 7, 49–54.
Young, R.A., 1985. Suburban growth poles. In: Dawson, J.A., Lord, J.D.(Eds.), Shopping Centre Development: Policies and Prospects. Croom Helm, London.
Young, W., 1975. Distance decay valuesand shopping centre size. ProfessionalGeographer 27, 304–309.