Feasibility of superconductivity in semiconductor superlatices
Upload
independentCategory
view
0download
0
Critical change in the Fermi surface of iron arsenic
superconductors at the onset of superconductivity
Chang Liu1∗
, Takeshi Kondo1*
, Rafael M. Fernandes1, Ari D. Palczewski
1,
Eun Deok Mun1, Ni Ni
1, Alexander N. Thaler
1, Aaron Bostwick
2, Eli Rotenberg
2,
Jörg Schmalian1, Sergey L. Bud’ko
1, Paul C. Canfield
1, and Adam Kaminski
1
(Dated: September 18, 2009)
PACS: 79.60.-i, 74.25.Jb, 74.70.Dd
1 Ames Laboratory and Department of Physics and Astronomy, Iowa State University, Ames, Iowa
50011, USA 2 Advanced Light Source, Lawrence Berkeley National Laboratory, Berkeley, California 94720,
USA ∗ These authors contribute equally to this work.
The phase diagram of a correlated material is the result of a complex interplay
between several degrees of freedom, providing a map of the material’s behavior.
One can understand (and ultimately control) the material’s ground state by
associating features and regions of the phase diagram, with specific physical
events or underlying quantum mechanical properties. The phase diagram of the
newly discovered iron arsenic high temperature superconductors1 , 2
is
particularly rich and interesting. In the AE(Fe1-xTx)2As2 class (AE being Ca, Sr,
Ba, T being transition metals), the simultaneous structural/magnetic phase
transition that occurs at elevated temperature in the undoped material, splits
and is suppressed by carrier doping, the suppression being complete around
optimal doping3,4,5,6
. A dome of superconductivity exists with apparent equal ease
in the orthorhombic / antiferromagnetic (AFM) state as well as in the tetragonal
state with no long range magnetic order3,7,8,9,10
. The question then is what
determines the critical doping at which superconductivity emerges, if the AFM
order is fully suppressed only at higher doping values. Here we report evidence
from angle resolved photoemission spectroscopy (ARPES) that critical changes
in the Fermi surface (FS) occur at the doping level that marks the onset of
superconductivity. The presence of the AFM order leads to a reconstruction of
the electronic structure, most significantly the appearance of the small hole
pockets at the Fermi level. These hole pockets vanish, i. e. undergo a Lifshitz
transition, at the onset of superconductivity. Superconductivity and magnetism
are competing states in the iron arsenic superconductors7. In the presence of the
hole pockets superconductivity is fully suppressed, while in their absence the two
states can coexist.
Previous studies demonstrated that the presence of the long range AFM order in the
undoped pnictides leads to a substantial reconstruction of the Fermi
surface11,12,13,14,15,16
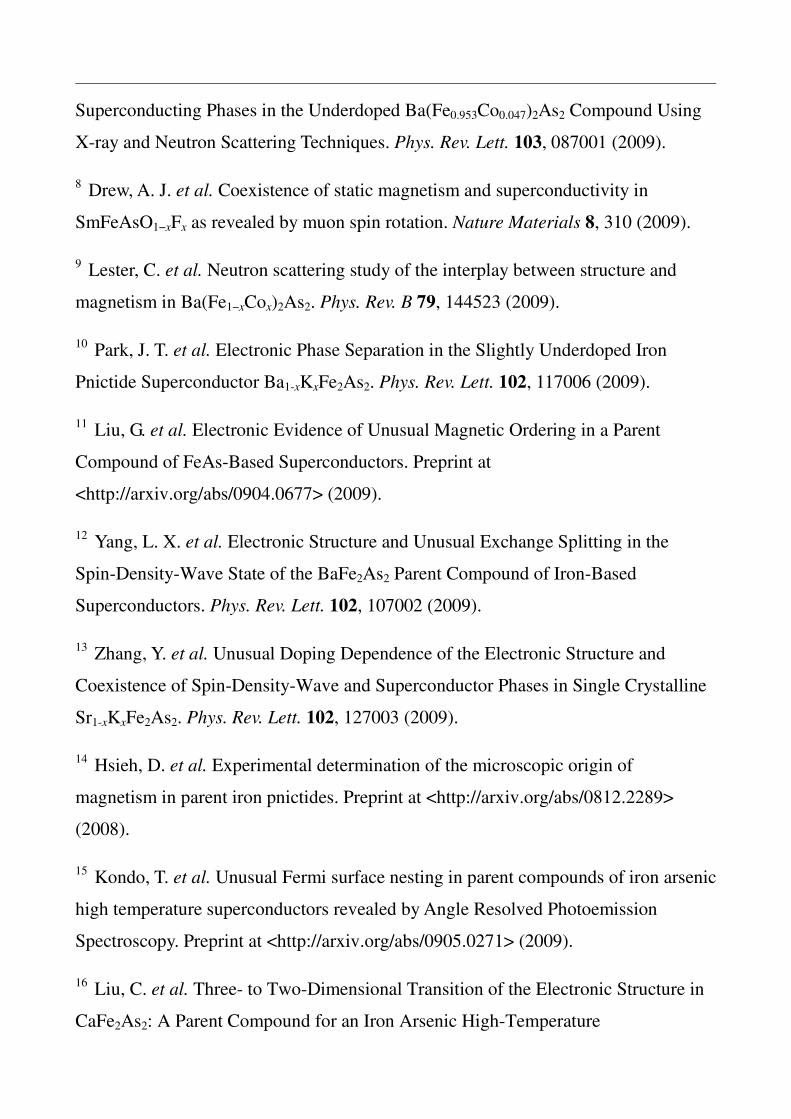
. In Figs. 1a, 1b we present the FS maps of Ba(Fe1-xCox)2As2 at T =
20K for two extreme doping levels: x = 0 where AFM order is present, and x = 0.114
where it is fully suppressed by cobalt doping. In the undoped samples the X-pocket
FS looks like four flower petals15
– high intensity peaks are visible along the diagonal
k(110) and k(1,-1,0) directions. For heavily overdoped, paramagnetic samples (x = 0.114),
the X-pocket FS changes to an oval shape and the peaks along the k(110) direction are
absent. In Figs. 1c - 1j we point out the magnetic origin of this FS reconstruction by
comparing the details of the X-pocket for the two doping levels and a prediction of a
five band tight binding model calculation (similar to Ref. 15) with and without an
AFM order. Figs. 1c - 1f show the ARPES intensity plots at the chemical potential (µ)
and 50meV below µ in the vicinity of the X-point. Figs. 1g - 1j show the
corresponding theoretical prediction. The presence of the AFM order is measured by
the mean field order parameter ∆AF, or in other words, the gap opened in the AFM
state. The comparison shown in Fig. 1 clearly demonstrates that the observed FS
reconstruction is consistent with the effects of a long range AFM order on the
electronic structure. In the AFM state, the four Fermi peaks that make up the “flower
petals” appear in both the experimental data and the theoretical calculation, and they
are hole-like – increasing the binding energy results in a larger size of the “petals” in
the constant energy cuts. In the PM state, however, these “petals” are absent in both
the experiment and theory. The main X-pocket is electron-like – increasing the
binding energy results in smaller pockets. We will utilize these features to quantify
the effects of the AFM order on the electronic structure of the pnictides.
In Fig. 2 we plot the ARPES FS maps at T = 13 and 150K for several different cobalt
doping levels obtained with a photon energy of 21.2eV (He-I line). It is clear that the
reconstructed hole pockets are present for x < 0.034 at low temperatures and vanish
above the magnetic transition temperature T*. It is worth noting that the temperature
dependence of the FS is not due to thermal broadening, since the low and high
temperature data for higher doping levels are very similar. The first and most
important observation in Fig. 2 is that the FS reconstruction vanishes rather rapidly at
intermediate doping levels. The intensity of those reconstructed pieces of the FS at
low temperature starts to decrease at a doping level of x = 0.024, and effectively the
intensity has vanished by x = 0.038. This is due to the fact that the top of the hole
bands move below the Fermi energy, which is a classic signature of a Lifshitz
transition. This occurs at the doping where superconductivity emerges in the phase
diagram. In Fig. 2b we quantify this transition by plotting the maximum intensity
around the X-pocket FS (from panels in Fig. 2a) as a function of the angle (α) with
respect to the k(110) direction. With hole pockets present (0 < x < 0.028) there is a
strong peak at α = 0°. This peak decreases as x changes from 0.024 to 0.034 and
vanishes by x = 0.038. Beyond this doping these small reconstructed pieces of FS are
absent. Neutron scattering experiments7 clearly demonstrate that long range AFM
order coexists and competes with superconductivity for x = 0.047, and likely extends
up to x ~ 0.06. Indeed in ARPES data such reconstruction is observed up to x = 0.058,
but only at higher binding energies (see supplementary information). This suggests
that the response of the FS to the AFM order is essential for the existence of
superconductivity. As the doping increases beyond x ~ 0.03, the small hole pockets
disappear and superconductivity can take place even in the AFM state.
In Fig. 2c we focus on the doping evolution of the nesting condition by examining the
contours of the X- and Γ- pocket FS sheets in the doping region where the FS
reconstruction is absent. For doping levels in the range 0.038 < x < 0.073, both
pockets are roughly similar in shape and size indicating reasonably good nesting
conditions. For heavily overdoped samples, however, the X-pocket is significantly
larger than the Γ-pocket. This is noteworthy since this sample is still superconducting
(Tc = 12.8K) and nesting is considered very important for the pairing mechanism in
these materials17,18,19
.
We now compare our ARPES data to recent results of the Hall Effect and
thermoelectric power (TEP) measurements20
. In Fig. 3a we plot the Hall coefficient
RH as a function of doping at T = 25 and 150K20
measured on samples from the same
batch as those used for the ARPES measurements, compared with the maximum
ARPES intensity of the reconstructed FS from Fig. 2b (defined in the caption). One
can see that the onset of superconductivity 0.024 < xCRIT < 0.034 correlates with a
dramatic change of the Hall coefficient that ends rapidly inside the superconducting
dome. In a similar manner the TEP data20
(not shown) changes abruptly with doping
between x = 0.02 and x = 0.024 for a surprisingly wide range of temperatures (25K <
T < 300K). This implies that the TEP data is much more sensitive to the onset of this
change – consistent with TEP being more closely related to the derivative of the
density of state at the chemical potential with respect to energy (dN(EF)/dE) rather
than N(EF) itself. It is possible that finer ARPES measurements can identify the
changes in the electronic properties at high temperature observed by TEP.
We summarize our main findings in Fig. 3b, where we plot the locations of each
ARPES data on the x-T phase diagram. Fig. 3b shows that the emergence of
superconductivity in Ba(Fe1-xCox)2As2 coincides with the disappearance of the
reconstructed pieces of the Fermi surface. Our observation explains that the changes
in Hall coefficient, namely the rapid increase of RH, are caused by critical changes of
the Fermi surface topology. The pairing interaction on the reconstructed Fermi
surface is reduced due to the requirement that the quasi-particle induced spin wave
damping must vanishes at the ordering vector21
. In the context of the pnictides, this
effect leads to the reduced pairing interaction of the magnetically ordered state found
by Parker et al.22
. The modified wave functions in the magnetically ordered state
couple less efficiently to magnetic fluctuations. The effect is strongest for large
magnetization with pronounced down folding and demonstrates the sensitivity of an
electronic pairing mechanism with respect to an antiferromagnetic FS reconstruction.
The finding of the present paper clearly demonstrates that avoiding the Fermi surface
reconstruction is key to establishing the superconductivity in iron arsenic high
temperature superconductors.
Methods
Single crystals of Ba(Fe1-xCox)2As2 were grown via self-flux using conventional
high-temperature solution growth techniques. The doping level x was determined
using wavelength dispersive X-ray spectroscopy in a JEOL JXA-8200 electron
microprobe3. Transport and magnetization measurements report a tetragonal to
orthorhombic structural transition with a paramagnetic to AFM transition at T* ≈ TN ≈
135K for the undoped (x = 0) samples. Increasing the doping significantly suppresses
and splits the two transition temperatures3,7
; superconductivity appears around xCRIT ~
0.03 and a maximum onset Tc of ~24K was observed for the x = 0.058 samples3. The
ARPES measurements were performed at a laboratory-based ARPES system
consisting of a Scienta SES2002 electron analyzer, GammaData UV lamp and custom
designed refocusing optics at Ames Laboratory, as well as beamline 7.0.1 of the
Advanced Light Source (ALS), Berkeley, California with a Scienta R4000 electron
analyzer. Vacuum conditions were better than 3 × 10-11
torr. Energy resolution was set
at ~25meV for Figs. 1 and ~15meV for Fig. 2. All samples were cleaved in situ
yielding mirror-like, clean a-b surfaces. Cleaved surfaces of all samples were stable
for at least 24 hours. Results were reproduced at the Advanced Light Source beamline
7.0.1 as well as Ames Laboratory on several samples. The high symmetry point X is
defined to be (±π/a, ±π/a(b), 0) with the kx and ky axes along the Fe-As bonds.
Acknowledgements
We acknowledge useful discussions with J. Schmalian and Y. S. Kim for his excellent
instrumental support at ALS. Ames Laboratory is supported by the Department of
Energy - Basic Energy Sciences under Contract No. DE-AC02-07CH11358. ALS is
operated by the US DOE under Contract No. DE-AC03-76SF00098.
References
1 Kamihara, Y., Watanabe, T., Hirano, M., and Hosono, H. Iron-based layered
superconductor La[O1-xFx]FeAs (x = 0.05-0.12) with Tc = 26 K. J. Am. Chem. Soc.
130, 3296 (2008).
2 Rotter, M., Tegel, M., and Johrendt, D. Superconductivity at 38 K in the Iron
Arsenide (Ba1-xKx)Fe2As2. Phys. Rev. Lett. 101, 107006 (2008). 3 Ni, N. et al. Effects of Co substitution on thermodynamic and transport properties
and anisotropic Hc2 in Ba(Fe1−xCox)2As2 single crystals. Phys. Rev. B 78, 214515
(2008).
4 Luetkens, H. et al. The electronic phase diagram of the LaO1−xFxFeAs
superconductor. Nature Materials 8, 305 (2009).
5 Zhao, J. et al. Structural and magnetic phase diagram of CeFeAsO1−xFx and its
relation to high-temperature superconductivity. Nature Materials 7, 953 (2008).
6 Canfield, P. C., Bud’ko, S. L., Ni, N., Yan, J. Q., and Kracher, A. Decoupling of the
superconducting and magnetic (structural) phase transitions in electron-doped
BaFe2As2. Phys. Rev. B 80, 060501 (2009).
7 Pratt, D. K. et al. Coexistence of Competing Antiferromagnetic and
Superconducting Phases in the Underdoped Ba(Fe0.953Co0.047)2As2 Compound Using
X-ray and Neutron Scattering Techniques. Phys. Rev. Lett. 103, 087001 (2009).
8 Drew, A. J. et al. Coexistence of static magnetism and superconductivity in
SmFeAsO1−xFx as revealed by muon spin rotation. Nature Materials 8, 310 (2009).
9 Lester, C. et al. Neutron scattering study of the interplay between structure and
magnetism in Ba(Fe1−xCox)2As2. Phys. Rev. B 79, 144523 (2009).
10 Park, J. T. et al. Electronic Phase Separation in the Slightly Underdoped Iron
Pnictide Superconductor Ba1-xKxFe2As2. Phys. Rev. Lett. 102, 117006 (2009).
11 Liu, G. et al. Electronic Evidence of Unusual Magnetic Ordering in a Parent
Compound of FeAs-Based Superconductors. Preprint at
<http://arxiv.org/abs/0904.0677> (2009).
12 Yang, L. X. et al. Electronic Structure and Unusual Exchange Splitting in the
Spin-Density-Wave State of the BaFe2As2 Parent Compound of Iron-Based
Superconductors. Phys. Rev. Lett. 102, 107002 (2009).
13 Zhang, Y. et al. Unusual Doping Dependence of the Electronic Structure and
Coexistence of Spin-Density-Wave and Superconductor Phases in Single Crystalline
Sr1-xKxFe2As2. Phys. Rev. Lett. 102, 127003 (2009).
14 Hsieh, D. et al. Experimental determination of the microscopic origin of
magnetism in parent iron pnictides. Preprint at <http://arxiv.org/abs/0812.2289>
(2008).
15 Kondo, T. et al. Unusual Fermi surface nesting in parent compounds of iron arsenic
high temperature superconductors revealed by Angle Resolved Photoemission
Spectroscopy. Preprint at <http://arxiv.org/abs/0905.0271> (2009).
16 Liu, C. et al. Three- to Two-Dimensional Transition of the Electronic Structure in
CaFe2As2: A Parent Compound for an Iron Arsenic High-Temperature

Superconductor. Phys. Rev. Lett. 102, 167004 (2009).
17 Kuroki, K. and Aoki, H. Unconventional pairing originating from disconnected
Fermi surfaces in the iron-based superconductor. Preprint at
<http://arxiv.org/abs/0902.3691> (2009) 18
Terashima, K. et al. Fermi surface nesting induced strong pairing in iron-based
superconductors. Proc. Natl. Acad. Sci. USA 106, 7330 (2009). 19
Mazin, I. I., Singh, D. J., Johannes, M. D. and Du, M. H. Unconventional
Superconductivity with a Sign Reversal in the Order Parameter of LaFeAsO1-xFx.
Phys. Rev. Lett. 101, 057003 (2008). 20
Mun, E. D., Bud’ko, S. L., Ni, N., and Canfield, P. C. Thermoelectric power and
Hall coefficient measurements on Ba(Fe1-xTx)2As2 (T = Co and Cu). Phys. Rev. B 80,
054517 (2009).
21 Schrieffer, J. R. Wards Identity and the Suppression of Spin Fluctuation
Superconductivity. J. Low Temp. Phys. 99, 397 (1995).
22 Parker, D., Vavilov, M. G., Chubukov, A. V., and Mazin, I. I. Coexistence of
superconductivity and a spin density wave in pnictides: Gap symmetry and nodal
lines. Preprint at <http://arxiv.org/abs/0907.2826> (2009).
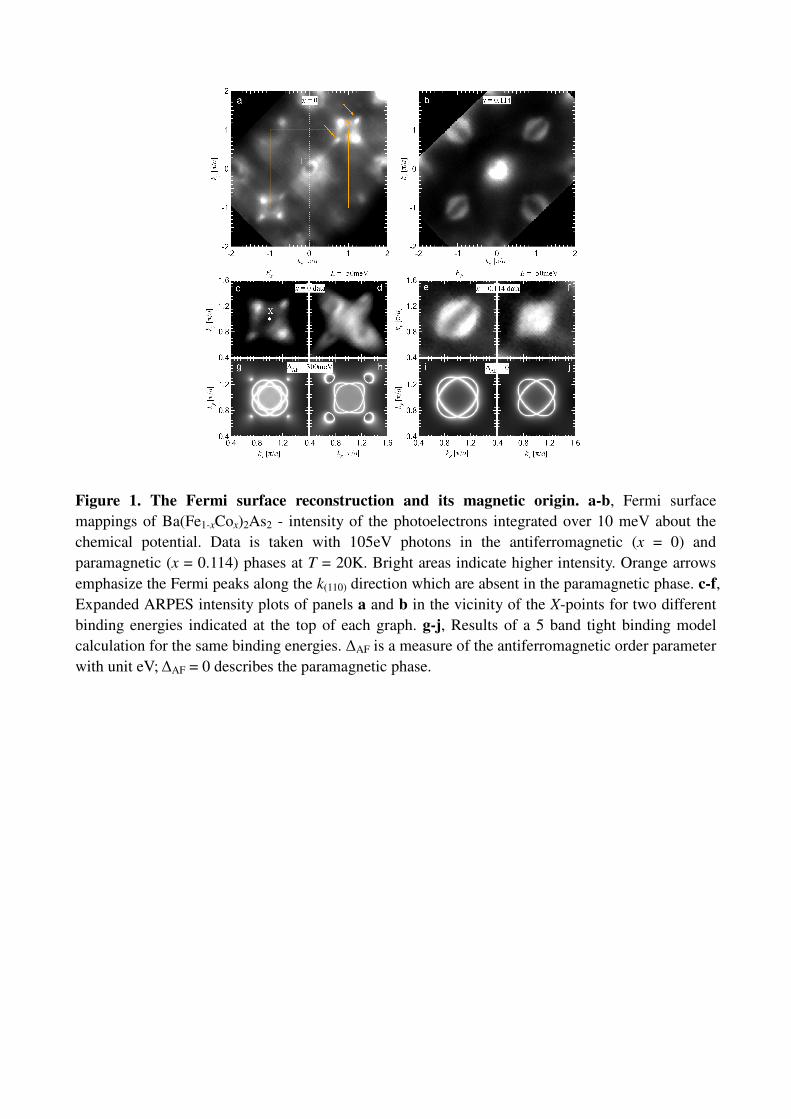
Figure 1. The Fermi surface reconstruction and its magnetic origin. a-b, Fermi surface
mappings of Ba(Fe1-xCox)2As2 - intensity of the photoelectrons integrated over 10 meV about the
chemical potential. Data is taken with 105eV photons in the antiferromagnetic (x = 0) and
paramagnetic (x = 0.114) phases at T = 20K. Bright areas indicate higher intensity. Orange arrows
emphasize the Fermi peaks along the k(110) direction which are absent in the paramagnetic phase. c-f,
Expanded ARPES intensity plots of panels a and b in the vicinity of the X-points for two different
binding energies indicated at the top of each graph. g-j, Results of a 5 band tight binding model
calculation for the same binding energies. ∆AF is a measure of the antiferromagnetic order parameter
with unit eV; ∆AF = 0 describes the paramagnetic phase.
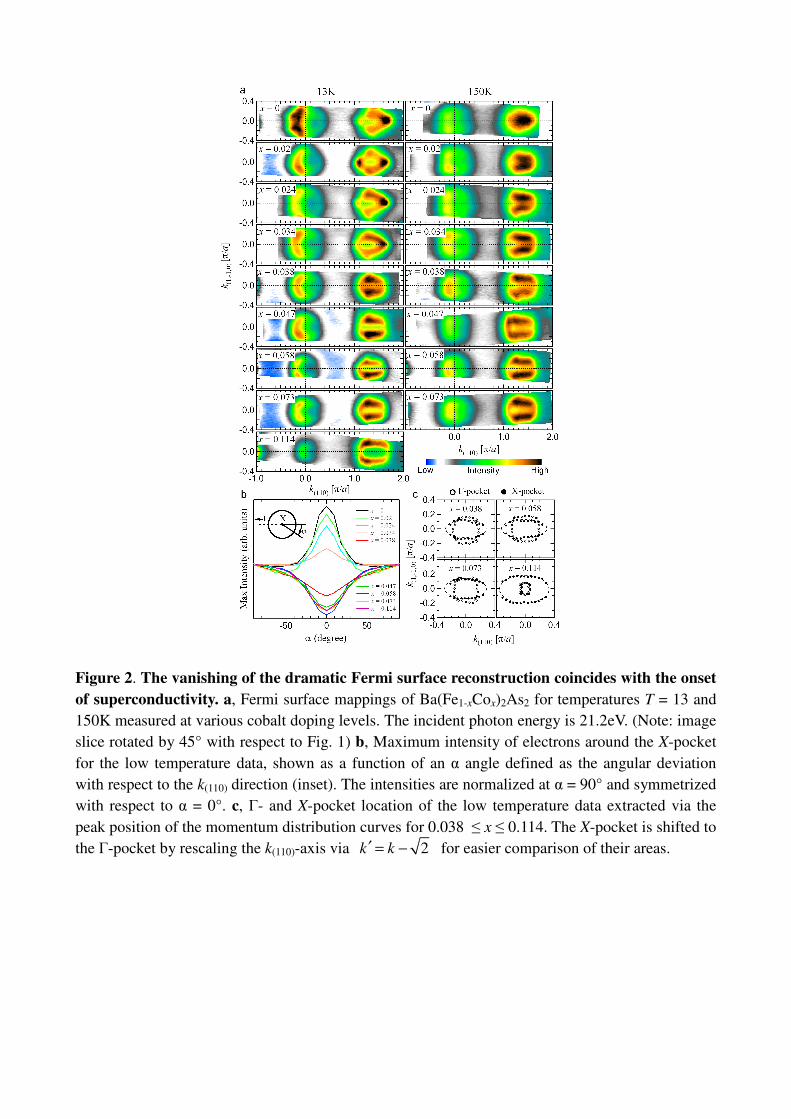
Figure 2. The vanishing of the dramatic Fermi surface reconstruction coincides with the onset
of superconductivity. a, Fermi surface mappings of Ba(Fe1-xCox)2As2 for temperatures T = 13 and
150K measured at various cobalt doping levels. The incident photon energy is 21.2eV. (Note: image
slice rotated by 45° with respect to Fig. 1) b, Maximum intensity of electrons around the X-pocket
for the low temperature data, shown as a function of an α angle defined as the angular deviation
with respect to the k(110) direction (inset). The intensities are normalized at α = 90° and symmetrized
with respect to α = 0°. c, Γ- and X-pocket location of the low temperature data extracted via the
peak position of the momentum distribution curves for 0.038 ≤ x ≤ 0.114. The X-pocket is shifted to
the Γ-pocket by rescaling the k(110)-axis via 2k k′ = − for easier comparison of their areas.
Figure 3. a, Left axis: The a-b plane Hall coefficient RH ≡ ρH / H vs. x data of Ba(Fe1-xCox)2As2
with magnetic field H = 90 kOe||c, measured at two temperatures T = 25 and 150K; Data from Ref.
20 is used. Right axis: ARPES intensity IARPES at α = 0° extracted from Fig. 2b, subtracted by the
intensity at the highest doping x = 0.114. b, Schematic phase diagram of Ba(Fe1-xCox)2As2 based on
ARPES and transport measurements. Black squares show the magnetic transition temperature T*
determined by resistivity measurements, red hollow circles show the onset temperature of
superconductivity determined by resistivity measurements; Data from Ref. 3 is used. Green dashed
line shows the doping location of the sudden change in thermoelectric power; Data from Ref. 20 is
used. Blue area demonstrates the doping-temperature region where the reconstructed Fermi surface
is present. Red area indicates the superconducting dome. Purple (yellow) stars mark the phase
diagram locations of each ARPES intensity map showing a reconstructed (non-reconstructed) Fermi
surface. Some data is shown in the online supplementary information.
Online supplementary information for
“Critical change in the Fermi surface of iron arsenic
superconductors at the onset of superconductivity”
Chang Liu1∗
, Takeshi Kondo1*
, Rafael M. Fernandes1, Ari D. Palczewski
1,
Eun Deok Mun1, Ni Ni
1, Alexander N. Thaler
1, Aaron Bostwick
2, Eli Rotenberg
2,
Jörg Schmalian1, Sergey L. Bud’ko
1, Paul C. Canfield
1 and Adam Kaminski
1
(Dated: September 18, 2009)
PACS: 79.60.-i, 74.25.Jb, 74.70.Dd
1 Ames Laboratory and Department of Physics and Astronomy, Iowa State University, Ames, Iowa
50011, USA 2 Advanced Light Source, Lawrence Berkeley National Laboratory, Berkeley, California 94720,
USA ∗ These authors contribute equally to this work.
1. Temperature and doping dependence of the Fermi surface in
Ba(Fe1-xCox)2As2 measured with 105eV photons.
ARPES data on the Fermi surface (FS) evolution similar to Fig. 2 of the paper
“Critical change in the Fermi surface of iron arsenic superconductors at the onset of
superconductivity” is also collected at a higher photon energy which corresponds to a
different value of kz. Fig. S1 shows the FS mappings of Ba(Fe1-xCox)2As2 measured
via a monochromatic synchrotron photon beam with photon energy hν = 105eV. With
a choice of the inner potential V0 = 15eV1, the kz value for 105eV and 21.2eV photons
differs by 10.9π (or 1.1π in the reduced zone scheme) at Γ. It is a notable fact that no
apparent difference of the FS reconstruction is observed for these two different kzs.
“Petals” and ovals are seen for antiferromagnetic (AFM) and paramagnetic states,
respectively, and the FS reconstruction occurs below the doping level x = 0.038. This
fact is better seen in Fig. S1(j) where the momentum distribution curves (MDCs)
along the k(110) direction are extracted for the low temperature data for the five doping
levels. The sharp peaks located at k(110) ~ 1.05 and 1.75 π/a disappear when the
doping is changed from x = 0.02 to x = 0.038. Both the low and high temperature data
is fully consistent with Fig. 2 in the main text, proving that the main conclusion of the
paper is reproducible.
2. Cobalt doping and binding energy dependence of the electronic structure in
Ba(Fe1-xCox)2As2.
Fig. S2 shows the low temperature (T = 20K) electronic structure of Ba(Fe1-xCox)2As2
for different Co doping levels and binding energies. From Fig. S2 it is clear that the
electronic structure reconstruction due to the presence of the magnetic order is seen
up to the doping level of x = 0.058, where antiferromagnetism is coexisting with
superconductivity. Such a reconstruction presents itself as a typical band back-folding
effect, forming hole pockets around the X-point at higher binding energies. Therefore
the ARPES intensity maps for the x = 0 and x = 0.058 samples are very similar at
binding energies Eb > 60meV. What is important is the fact that this effect is absent at
the Fermi level for the superconducting samples. Typically for x = 0.058 (Tc ~ 24K),
the bright peaks at EF along the k(110) and k(1,-1,0) directions are absent, in sharp
contrast with The FS topology for the undoped sample. This observation fully verifies
the main argument of the paper that maintaining the paramagnetic-like electronic
structure at the Fermi level at low temperatures is a critical ingredient for
superconductivity in the iron pnictides.
3. Temperature dependence of the electronic structure of Ba(Fe0.953Co0.047)2As2.
In order to verify the fact that the doping-temperature region for the reconstructed FS
follows a straight line up to T* around the onset of superconductivity, ARPES
intensity map is taken at several temperatures for Ba(Fe0.953Co0.047)2As2. At this
doping level, neutron diffraction data2 from the same growth batch clearly shows
three main transitions: a tetragonal to orthorhombic transition at TS = 60K, a
second-order magnetic transition from paramagnetic to AFM order at T* = 47K, and
a superconducting transition at Tc = 17K below which the AFM order coexists with
superconductivity. If the vanishing of the electronic structure reconstruction at EF
were solely resulting from the appearance of superconductivity, the AFM
reconstructed FS would be expected for Tc < T < T*. Fig. S3 shows the ARPES
intensity plot for Ba(Fe0.953Co0.047)2As2 at T = 13, 30 and 150K, among which T =
30K lies between Tc and T*. It is very clear from the figure that no observable
reconstruction is present close to EF even at T = 30K. This result is not due to aging
effect, since the sample was cleaved in the vacuum chamber at 30K and the same
ARPES map is measured for several times in a time span of about 48 hours (not
shown), no major difference with time is seen. This data proves that there is no FS
reconstruction at x = 0.047, even though AFM order is confirmed below T* = 47K.
Similar temperature dependence data is also taken at x = 0.038 (not shown), where
again no FS reconstruction can be seen. Therefore, the electronic response to the
AFM order at the Fermi level does not coincide with the AFM transition. The
pronounced FS reconstruction is absent for all samples beyond the doping level of x =
0.038.
References
1 Kondo, T. et al. Unusual Fermi surface nesting in parent compounds of iron arsenic
high temperature superconductors revealed by Angle Resolved Photoemission
Spectroscopy. Preprint at <http://arxiv.org/abs/0905.0271> (2009). 2 Pratt, D. K. et al. Coexistence of Competing Antiferromagnetic and
Superconducting Phases in the Underdoped Ba(Fe0.953Co0.047)2As2 Compound Using
X-ray and Neutron Scattering Techniques. Phys. Rev. Lett. 103, 087001 (2009).
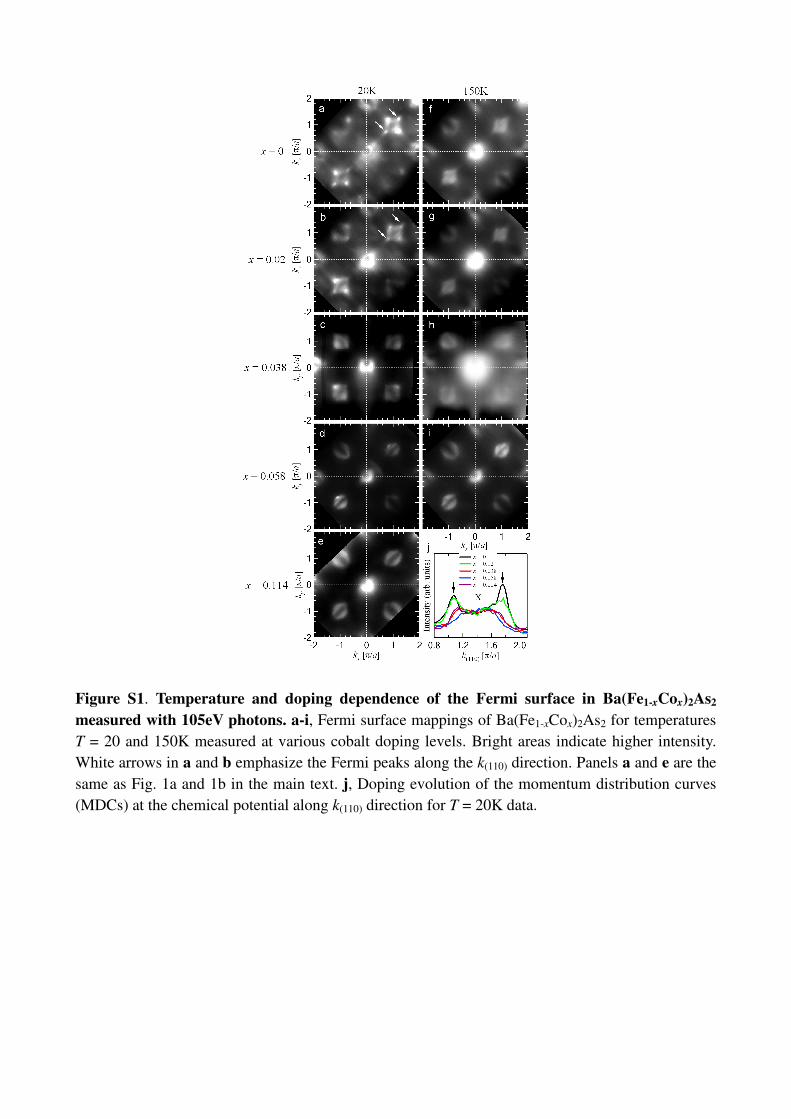
Figure S1. Temperature and doping dependence of the Fermi surface in Ba(Fe1-xCox)2As2
measured with 105eV photons. a-i, Fermi surface mappings of Ba(Fe1-xCox)2As2 for temperatures
T = 20 and 150K measured at various cobalt doping levels. Bright areas indicate higher intensity.
White arrows in a and b emphasize the Fermi peaks along the k(110) direction. Panels a and e are the
same as Fig. 1a and 1b in the main text. j, Doping evolution of the momentum distribution curves
(MDCs) at the chemical potential along k(110) direction for T = 20K data.
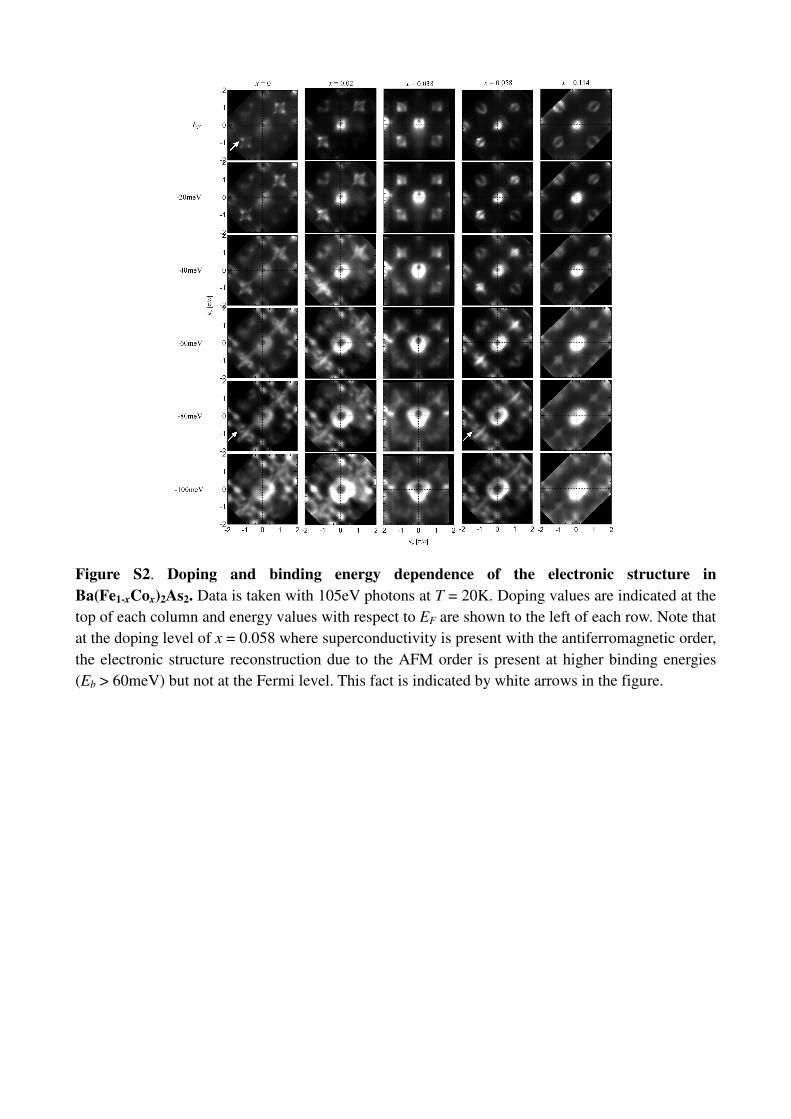
Figure S2. Doping and binding energy dependence of the electronic structure in
Ba(Fe1-xCox)2As2. Data is taken with 105eV photons at T = 20K. Doping values are indicated at the
top of each column and energy values with respect to EF are shown to the left of each row. Note that
at the doping level of x = 0.058 where superconductivity is present with the antiferromagnetic order,
the electronic structure reconstruction due to the AFM order is present at higher binding energies
(Eb > 60meV) but not at the Fermi level. This fact is indicated by white arrows in the figure.
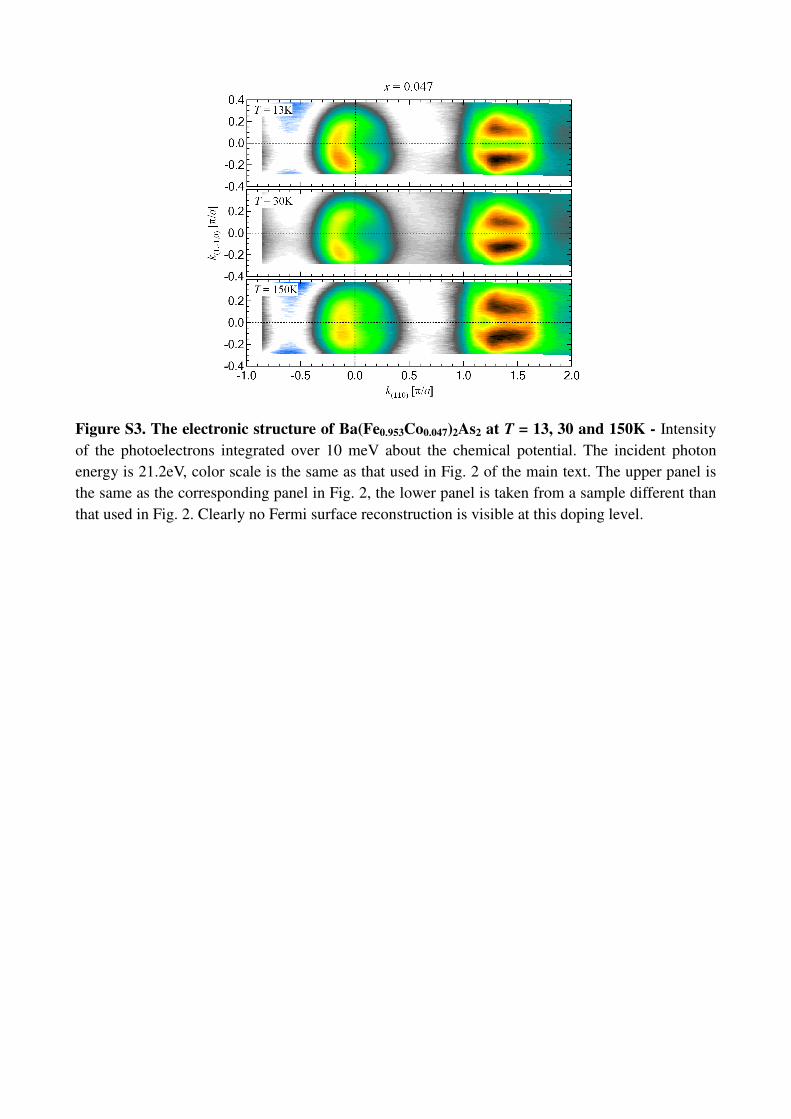
Figure S3. The electronic structure of Ba(Fe0.953Co0.047)2As2 at T = 13, 30 and 150K - Intensity
of the photoelectrons integrated over 10 meV about the chemical potential. The incident photon
energy is 21.2eV, color scale is the same as that used in Fig. 2 of the main text. The upper panel is
the same as the corresponding panel in Fig. 2, the lower panel is taken from a sample different than
that used in Fig. 2. Clearly no Fermi surface reconstruction is visible at this doping level.
Copyright © 2022 FDOKUMEN