
Preclinical and clinical aspects of biomodulation of 5-fluorouracil
Upload
independentCategory
view
2download
0
Credentialing Preclinical Pediatric Xenograft Models Using Gene
Expression and Tissue Microarray Analysis
Craig C. Whiteford,1Sven Bilke,
1Braden T. Greer,
1Qingrong Chen,
1Till A. Braunschweig,
4
Nicola Cenacchi,1Jun S. Wei,
1Malcolm A. Smith,
5Peter Houghton,
6Christopher Morton,
6
C. Patrick Reynolds,7Richard Lock,
8Richard Gorlick,
9Chand Khanna,
2Carol J. Thiele,
3
Mikiko Takikita,4Daniel Catchpoole,
10Stephen M. Hewitt,
4and Javed Khan
1
1Oncogenomics Section, 2Comparative Oncology Program, and 3Cell and Molecular Biology Section, Pediatric Oncology Branch; 4TissueArray Research Program, Laboratory of Pathology; and 5Cancer Therapy Evaluation Program, National Cancer Institute, NIH, Bethesda,Maryland; 6St. Jude Children’s Research Hospital Memphis, Memphis, Tennessee; 7Developmental Therapeutics Program, USC-CHLA,Institute for Pediatric Clinical Research, Children’s Hospital Los Angeles, Los Angeles, California; 8Leukaemia Biology Program,Children’s Cancer Institute Australia for Medical Research, Sydney, New South Wales, Australia; 9Section ofHematology/Oncology, The Children’s Hospital at Montefiore, Bronx, New York; and 10Tumour Bank,The Children’s Hospital at Westmead, Westmead, New South Wales, Australia
Abstract
Human tumor xenografts have been used extensively for rapidscreening of the efficacy of anticancer drugs for the past 35years. The selection of appropriate xenograft models for drugtesting has been largely empirical and has not incorporated asimilarity to the tumor type of origin at the molecular level.This study is the first comprehensive analysis of the tran-scriptome of a large set of pediatric xenografts, which arecurrently used for preclinical drug testing. Suitable modelsrepresenting the tumor type of origin were identified. It wasfound that the characteristic expression patterns of theprimary tumors were maintained in the correspondingxenografts for the majority of samples. Because a prerequisitefor developing rationally designed drugs is that the target isexpressed at the protein level, we developed tissue arrays fromthese xenografts and corroborated that high mRNA levelsyielded high protein levels for two tested genes. The webdatabase and availability of tissue arrays will allow for the rapidconfirmation of the expression of potential targets at both themRNA and the protein level for molecularly targeted agents.The database will facilitate the identification of tumor markerspredictive of response to tested agents as well as the discoveryof new molecular targets. [Cancer Res 2007;67(1):32–40]
Introduction
Human tumor xenografts have been extensively used for rapidscreening of the efficacy of anticancer drugs in the past 35 years(1, 2). However, controversy exists about the usefulness of thesepreclinical models in predicting response to therapy because manyreagents show high activity in these in vivo models yet are inactivein the clinical setting (3). This controversy was further fueled by thefindings of the National Cancer Institute (NCI) that after 10 years ofextensive screening of compounds through preclinical models, onlya moderate predictive value was found for their xenograft models,
and even less concordance was found between in vitro testing dataand clinical usefulness (1).For pediatric cancers, preclinical in vitro and xenograft model
systems have been used for drug screening with some success (3).However, because of the rarity of pediatric cancers compared withadult cancers, there has been little emphasis on developing thesemodels by pharmaceutical companies. Consequently, a substantialproportion of pediatric phase 1 trials is being conducted withlimited or no prior testing of the agents in pediatric preclinicalmodels (4). Effective prioritization of new agents for clinical testingusing reliable preclinical models is especially important in pediatriconcology drug development because of the limited number ofchildren with specific cancer types. Cancer remains the leadingcause of disease-related mortality in children >12 months of age,with >2,200 children dying of cancer in the United States aloneeach year. Future progress in identifying more effective treatmentsfor these children will depend on using reliable preclinical data toselect truly active agents for clinical evaluation from among themuch larger universe of agents that could be studied.Several controllable factors contribute to the reliability of
xenograft models in predicting in vivo drug activity. However,some factors are inherent to these model systems; for example,differences in pharmacokinetic behavior of a drug in mice andhumans may render much higher doses of an agent tolerable inmice, leading to a false prediction of clinical activity in humans.Fortunately, these pharmacokinetic differences can be consideredand accounted for when interpreting results from these models (3).The use of individual xenograft models rather than a panel of suchmodels may reduce the predictive value because single modelscannot capture the inherent variability of the corresponding cancer(5). In addition, certain xenograft models may be poor representa-tions of their purported tumor type of origin. This discordancebetween the clinical and preclinical entities may go unrecognizedbecause of inadequate biological characterization of the xenograftmodels. Optimal use of xenograft models for drug testing requiresuse of panels of xenograft models that closely mimic the biologicalcharacteristics of their respective primary tumors and requiresconsideration of pharmacokinetic differences of tested agents inthe human and mice. This report contributes to the optimal use ofchildhood cancer xenograft models by the molecular characteriza-tion of panels of xenograft lines representing many of the morecommon cancers that occur in children. With this focus on a largepanel of models of several pediatric cancers, this study differs fromearlier investigations. A panel of 85 xenografts as models of adult
Note: Supplementary data for this article are available at Cancer Research Online(http://cancerres.aacrjournals.org/).
C.C. Whiteford and S. Bilke contributed equally to this work.Requests for reprints: Javed Khan, Oncogenomics Section, Pediatric Oncology
Branch, National Cancer Institute, NIH, Room 134E, 8717 Grovemont Circle, Bethesda,MD 20892-4605. Phone: 301-435-2937; Fax: 301-480-0341; E-mail: [email protected].
I2007 American Association for Cancer Research.doi:10.1158/0008-5472.CAN-06-0610
Cancer Res 2007; 67: (1). January 1, 2007 32 www.aacrjournals.org
Research Article
Research. on January 8, 2016. © 2007 American Association for Cancercancerres.aacrjournals.org Downloaded from

cancers was analyzed by Zembutsu et al. (6). Other investigationstypically focused on single adult cancer types, such as prostatecancer (7) or ovarian carcinomas (8). In most cases, a relativelysmall number of samples were used. For example the work of Mintzet al. (9) on pediatric osteosarcomas used only three xenografts forthe verification of expression profiles observed in primary cancertissues. An analysis of the protein transcription of selected markerswas done by Fichtner et al. (10) but this study did not include agenome-wide analysis of expression levels.A 2001 meeting organized by the NCI and the Children’s
Oncology Group identified the need for a systematic approach topediatric preclinical testing to allow the identification of preclinicalmodels that can be used to reliably inform clinical prioritizationdecisions (11). An early step in implementing the recommenda-tions of the meeting was the Pediatric Oncology PreclinicalProtein-Tissue Array Project (POPP-TAP), a collaborative effortbetween the NCI and the Children’s Oncology Group. Xenografts ofpediatric tumors were solicited for the POPP-TAP project and atotal of 75 high-quality xenografts representing eight tumor typeswere collected. The majority of these xenografts will be used toscreen agents for anticancer activity (11). Objectives of POPP-TAPincluded developing xenograft tissue microarrays (XMA) forprotein expression of a panel of pediatric xenografts and alsodetermining the gene expression profiles of these preclinicalmodels. This study contributes a molecular characterization of alarge panel of pediatric xenograft models and determines theextent of their similarity to a set of corresponding primary tumors.In the course of this study, a few xenografts were identified thatwere not good representations of their primary tumors (i.e., theirmRNA profile did not capture the characteristic RNA signaturetypical for the primary tumors), and these lines have been excludedfrom further drug testing. This study also shows the use of thexenograft transcriptomic maps along with that of XMA for thediscovery of potential new molecular targets applicable to specificchildhood cancers.
Materials and Methods
Xenograft, primary tumor, and cell line samples. Samples were
acquired through the Pediatric Preclinical Testing Program (PPTP)
established by the NCI. An open solicitation for xenografts was made
in the journal Cancer Research in November 2002. From this solicitation,95 samples were received for microarray analysis and construction of
XMAs. All samples received required appropriate Institutional Review
Board and Material Transfer Agreement approval from the donating
institution. From these 95 tumors, we chose tumor types that had threeor more representative xenografts with high-quality RNA. Seventy-five
tumors met these criteria and were used for further analysis (Table 1;
additional data of the xenograft production are described in Supplemen-tary Table S1).
RNA extraction, amplification, and labeling of cDNA. Total RNA wasextracted from the tumors according to the published protocols (12).
Agilent BioAnalyzer 2100 (Agilent, Palo Alto, CA) was used to assess theintegrity of the total RNAs extracted from all of the samples. Total RNA
from seven human cancer cell lines (CHP212, RD, HeLa, A204, K562, RDES,
and CA46) was pooled in equal portions to constitute a reference RNA,
which was used in all of the cDNA microarrray experiments (13). RNA wassubjected to one round mRNA amplification using a modified Eberwine
RNA amplification procedure (14). Next, an indirect fluorescent-labeling
method was used to label cDNA as described by Hegde et al. (15).
Fabrication of cDNA microarrays, hybridization, image acquisition,and analysis. Sequence-verified cDNA libraries were purchased from
Research Genetics (Huntsville, AL), and a total of 42,578 cDNA clones,
representing 13,606 unique genes and 12,327 expressed sequence tags, were
printed on microarrays using a BioRobotics MicroGrid II spotter (Harvard
Bioscience, Holliston, MA). Fabrication, hybridization, and washing of
microarrays were done as described by Hegde et al. (15). Images wereacquired by an Agilent DNA microarray scanner (Agilent) and analyzed
using the Microarray Suite program as described (16), coded in IPLab
(Scanalytics, Fairfax, VA).Data normalization, filtering, and hierarchical clustering. Gene
expression ratios between tumor RNA and reference RNA on each
microarray were normalized using a pin-based normalization method
modified from Chen et al. (13, 17). To include only high-quality data inthe analysis, the quality of each individual cDNA spot was calculated
according to Chen et al. (17). Next, spots with an average quality across
all of the samples <0.95 were excluded from all of the analyses. There
were 38,789 clones that passed this quality filter. All quality-filteredclones (38,789 clones representing 17,349 unique UniGene clusters) were
then subjected to hierarchical clustering using a Euclidean distance
metric with average linkage (18). Hierarchical clustering was done usingthe modified Eisen program, Gene Cluster 3.0, and Java TreeView
software.11 The entire data set for all 42,421 cDNA clones was released
through our Web site.12 This database allows investigators to make
simple queries of the data to extract gene expression profiles based onIMAGE Clone ID, Gene ID ( formerly LocusLink), Gene Ontology Terms,
Gene Ontology ID, Gene Symbol, UniGene ID, Clone Title, Cytoband, and
Chromosome.
Artificial neural networks and clone-cutter artificial neural net-work. Feed-forward resilient back-propagation multilayer perceptron
artificial neural networks (ANN; coded in Matlab, The Mathworks, Natick,
MA) with three layers were used: an input layer of the top 10 principal
components of the data; a hidden layer with five nodes; and an output layergenerating a committee vote for each of the three input classes. A 4-fold
cross-validation scheme with 250 repetitions was used to create 250 ‘‘votes’’
for each sample for each of the three classes (e.g., 0, 0, and 1 or 0.2, 0.8, and0.3). An average of these ANN committee votes was used to classify samples,
and a sample was classified based on the maximum vote it received from the
three classes (13, 19). For ANN clone removal analysis, quality-filtered clones
were ranked by determining the sensitivity of prediction of the trainingsamples with respect to a change in the gene expression level of each clone.
Then, increasing numbers of the top-ranking clones (i.e., the top-ranking
1,000, 5,000, 10,000, 15,000, 20,000, 25,000, 30,000, and 35,000) were cut or
removed from both the training and the testing sample data sets, and theANNs were retrained with the reduced gene sets. The sensitivities and
specificities for each of the shaved gene sets were calculated.
Table 1. The number of samples for the various primarytumors analyzed in this study
Samples analyzed
Tumor type Xenograft Primary tumor Cell lines
Neuroblastoma 20 30 12
Rhabdomyosarcoma 10 21 3
Ewing’s 9 19 3Acute lymphoblastic
leukemia
10 — —
Wilms’ Tumor 8 — —Osteosarcoma 8 — —
Meduloblastoma 6 — —
Ependymona 4 — —
Total 75 70 18
11 http://bonsai.ims.u-tokyo.ac.jp/fmdehoon/software/cluster/software.htm#ctv.12 http://home.ccr.cancer.gov/oncology/oncogenomics/.
Expression Profiling of Pediatric Xenograft Models
www.aacrjournals.org 33 Cancer Res 2007; 67: (1). January 1, 2007
Research. on January 8, 2016. © 2007 American Association for Cancercancerres.aacrjournals.org Downloaded from
The ANN rankings based on training on primary tumor or xenograftexpression patterns were compared using Spearman’s rank-order correla-
tion, r . The intrinsic statistical variability was estimated by randomly
splitting the xenograft data set (after removing the misclassified samples:
aRMS-X3, eRMS-X26, and NB-X66) into two data sets with the relativenumber of tumor types kept constant and by calculating the gene ranking
for each of these. The correlation r was estimated from the coefficients
calculated by comparing primary with the xenograft gene ranking and
Cancer Research
Cancer Res 2007; 67: (1). January 1, 2007 34 www.aacrjournals.org
Research. on January 8, 2016. © 2007 American Association for Cancercancerres.aacrjournals.org Downloaded from
xenograft with xenograft gene rankings, respectively. The P value indicatingnonrandomness of an observed correlation coefficient r was estimated
using Students distribution with
t ¼ffiffiffiffiffiffiffiffiffiffiffiffiffiN � 2
1� r2
r
and N � 2 degrees of freedom (20).
Numerical methods for similarity metric between primary tumor,xenograft models, and cell lines. To measure the similarity betweendifferent samples (e1 and e2), the Euclidean metric
da;b ¼ffiffiffiffiffiffiffiffiffiffiffiffiffiffiffiffiffiffiffiffiffiffiffiffiffiffiXNi
ðai � biÞ2vuut
was used, where the sum runs over N genes. With this metric, a smaller
distance indicates that two samples are more similar. The distance betweentwo sets A and B of genes was defined as
DðA;BÞ ¼ffiffiffiffiffiffiffiffiffiffiffiffiffiffiffiffiffiffiffiffiffiffiffiffiffiffiXa�A;b�B
ðda;bÞ 2
s
When comparing a set to itself (A = B), this distance measures the spread
of the individual samples within the set. When comparing two sets,xenografts X and cell lines C , to a third set of samples, primary tumors
P, the set X was said to be more similar to P when D(X,P) < D(C,P). To test
how dependent such a result was on the specific choice of genes used in the
comparison, the numerical experiment was repeated for different randomlyselected subsets of genes. For various subset sizes, the fraction of cases out
of 1,000 repeats for which D(X,P) < D(C,P) was counted. The same type of
experiment was done using the Pearson’s correlation as a metric. When
comparing two sets, the average correlation coefficient (as opposed to the
average squared distance used with the Euclidean metric) was used. The setX was said to be more similar to P than the set C if D(X,P) > D(C,P) with the
correlation as the metric.
Identifying cancer-specific gene targets. Differentially expressed geneswere first identified by doing a t test analysis to identify genes whose meanratio was significantly higher in xenograft compared with normal tissues
(n = 76 samples). Clones were selected using the criteria that the Bonferroni
adjusted P values was < 0.01 (n = 14,489). Next, the list was further filteredby requiring that the median ratio in xenografts be five times greater than
the median ratio of normal tissues (n = 248). Any clone that belonged to
either zero or multiple UniGene clusters or expressed sequence tags was
then removed (remaining, n = 157). Finally, redundant clones in UniGenecluster represented by multiple clones were removed by removing all but
the highest ranked clone (n = 120).
XMA construction. Frozen xenograft samples were defrosted to room
temperature >5 min, sectioned to appropriate thickness (2–3 mm), placed inprocessing cassettes, and fixed in 70% ethanol at 4jC (21). Ethanol was
chosen as a fixative instead of formalin because it is useful for downstream
proteomic analysis as planned (22) and offers many advantages as follows.Ethanol is a non–cross-linking fixative that can be used to replace formalin
where recovery of native proteins and intact nucleic acids is desired. In
addition, immunohistochemistry on ethanol-fixed tissue requires less or no
antigen retrieval compared with formalin-fixed tissues. In addition, a greaterfraction of antibodies doing well in Western blot can be used when comparing
ethanol-fixed to formalin-fixed tissue. Our choice thus makes the XMA
particularly suitable for testing antibodies not commonly used in immuno-
histochemistry (21). However, we will also offer a XMA built with formalin-fixed tissues, which allows the use of conventional diagnostic antibodies.
After ethanol fixation for 48 h, the specimens were processed and
infiltrated with paraffin and subsequently embedded for sectioning. H&E
sections were made of each xenograft and reviewed to select appropriateareas (zones without necrosis) of the xenograft for arraying. The XMA was
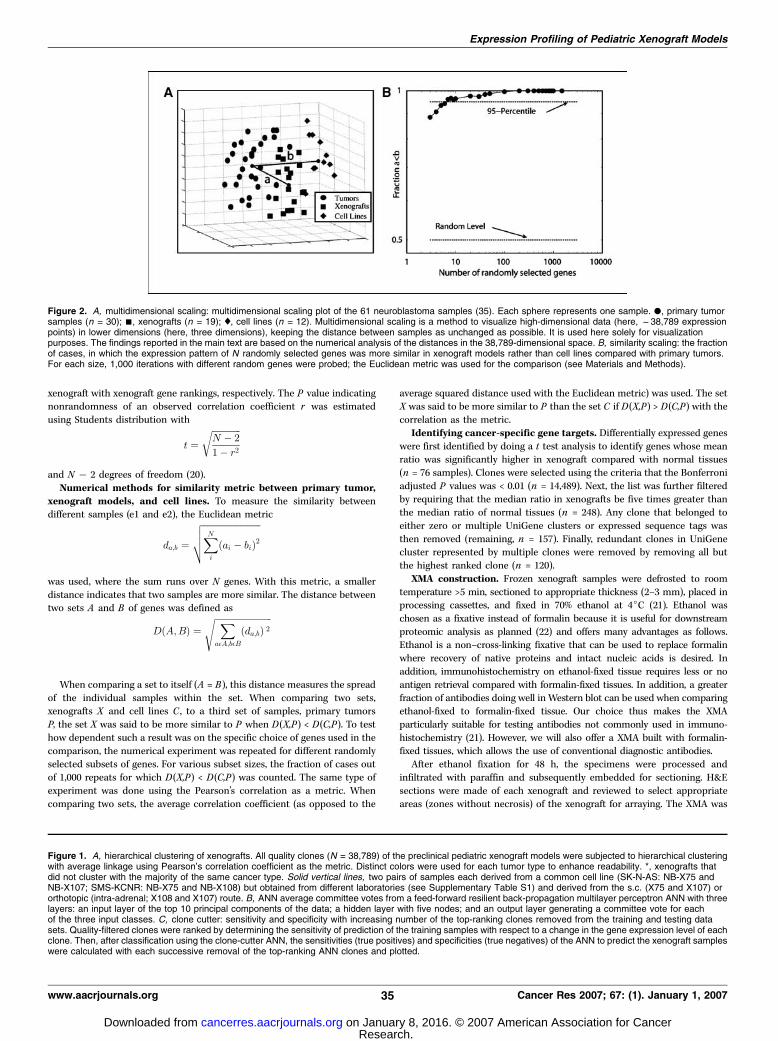
Figure 2. A, multidimensional scaling: multidimensional scaling plot of the 61 neuroblastoma samples (35). Each sphere represents one sample. ., primary tumorsamples (n = 30); n, xenografts (n = 19); x, cell lines (n = 12). Multidimensional scaling is a method to visualize high-dimensional data (here, f38,789 expressionpoints) in lower dimensions (here, three dimensions), keeping the distance between samples as unchanged as possible. It is used here solely for visualizationpurposes. The findings reported in the main text are based on the numerical analysis of the distances in the 38,789-dimensional space. B, similarity scaling: the fractionof cases, in which the expression pattern of N randomly selected genes was more similar in xenograft models rather than cell lines compared with primary tumors.For each size, 1,000 iterations with different random genes were probed; the Euclidean metric was used for the comparison (see Materials and Methods).
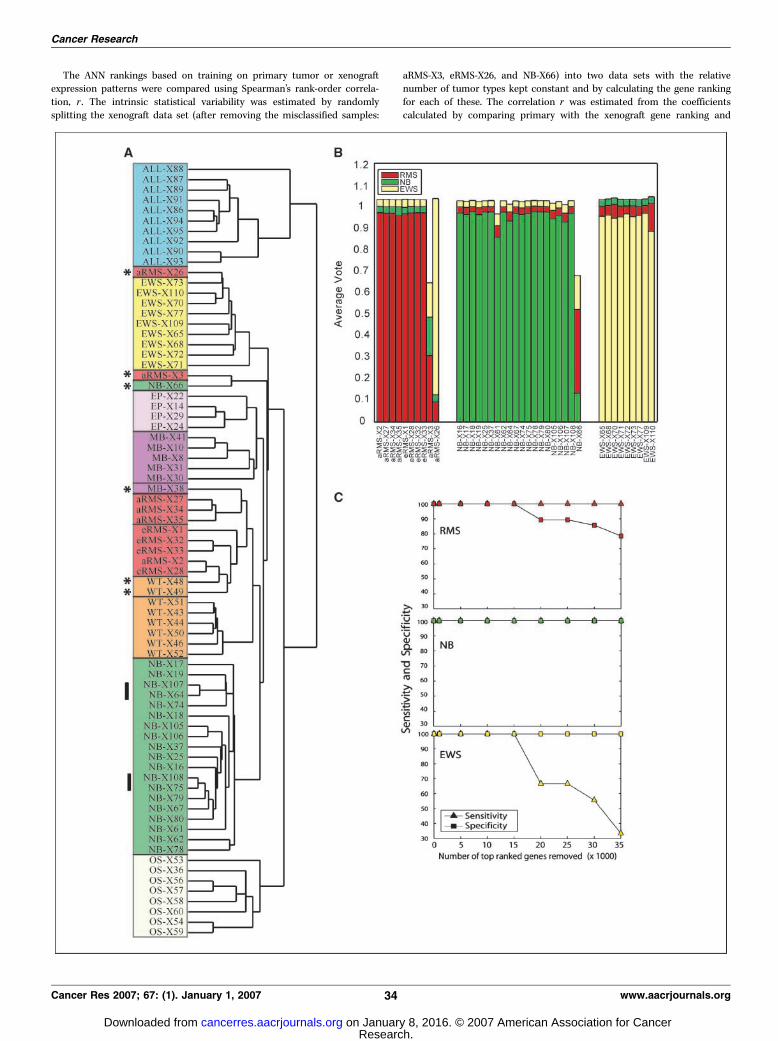
Figure 1. A, hierarchical clustering of xenografts. All quality clones (N = 38,789) of the preclinical pediatric xenograft models were subjected to hierarchical clusteringwith average linkage using Pearson’s correlation coefficient as the metric. Distinct colors were used for each tumor type to enhance readability. *, xenografts thatdid not cluster with the majority of the same cancer type. Solid vertical lines, two pairs of samples each derived from a common cell line (SK-N-AS: NB-X75 andNB-X107; SMS-KCNR: NB-X75 and NB-X108) but obtained from different laboratories (see Supplementary Table S1) and derived from the s.c. (X75 and X107) ororthotopic (intra-adrenal; X108 and X107) route. B, ANN average committee votes from a feed-forward resilient back-propagation multilayer perceptron ANN with threelayers: an input layer of the top 10 principal components of the data; a hidden layer with five nodes; and an output layer generating a committee vote for eachof the three input classes. C, clone cutter: sensitivity and specificity with increasing number of the top-ranking clones removed from the training and testing datasets. Quality-filtered clones were ranked by determining the sensitivity of prediction of the training samples with respect to a change in the gene expression level of eachclone. Then, after classification using the clone-cutter ANN, the sensitivities (true positives) and specificities (true negatives) of the ANN to predict the xenograft sampleswere calculated with each successive removal of the top-ranking ANN clones and plotted.
Expression Profiling of Pediatric Xenograft Models
www.aacrjournals.org 35 Cancer Res 2007; 67: (1). January 1, 2007
Research. on January 8, 2016. © 2007 American Association for Cancercancerres.aacrjournals.org Downloaded from
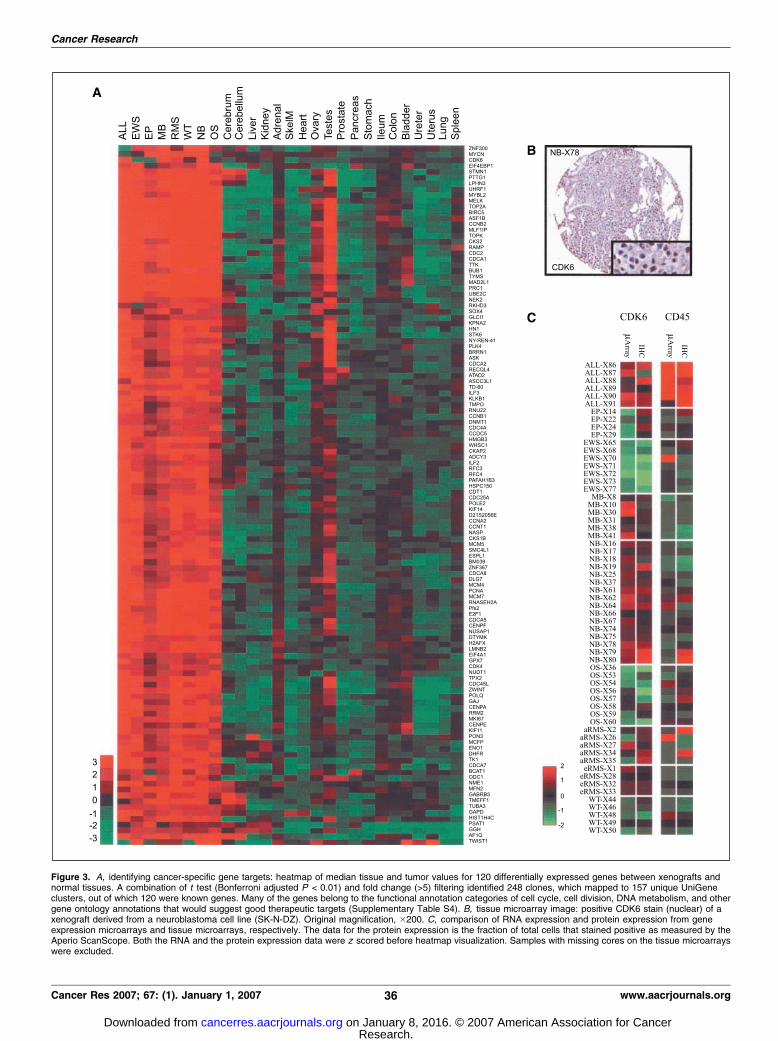
Figure 3. A, identifying cancer-specific gene targets: heatmap of median tissue and tumor values for 120 differentially expressed genes between xenografts andnormal tissues. A combination of t test (Bonferroni adjusted P < 0.01) and fold change (>5) filtering identified 248 clones, which mapped to 157 unique UniGeneclusters, out of which 120 were known genes. Many of the genes belong to the functional annotation categories of cell cycle, cell division, DNA metabolism, and othergene ontology annotations that would suggest good therapeutic targets (Supplementary Table S4). B, tissue microarray image: positive CDK6 stain (nuclear) of axenograft derived from a neuroblastoma cell line (SK-N-DZ). Original magnification, �200. C, comparison of RNA expression and protein expression from geneexpression microarrays and tissue microarrays, respectively. The data for the protein expression is the fraction of total cells that stained positive as measured by theAperio ScanScope. Both the RNA and the protein expression data were z scored before heatmap visualization. Samples with missing cores on the tissue microarrayswere excluded.
Cancer Research
Cancer Res 2007; 67: (1). January 1, 2007 36 www.aacrjournals.org
Research. on January 8, 2016. © 2007 American Association for Cancercancerres.aacrjournals.org Downloaded from
constructed as described previously (23), using 1.00-mm needles on aBeecher manual tissue microarrayer MTA-1 (Beecher Instruments, Sun
Prairie, WI). The resultant recipient XMA block was sectioned into 5-Amsections with the aid of an Instrumedics tape sectioning system (St. Louis,
MO). Our XMAs are available for investigators to confirm the proteinexpression levels of their own target(s) of interest. We strongly encourage
submission of the images of the immunostains of the XMA to our databases
as we have done.
Immunohistochemistry and scoring. Immunohistochemistry wasdone according to standard protocols as described previously (24). The
antibody against CD45 was obtained from DAKO (Carpinteria, CA) and used
at titers with incubation times as follows: prediluted, 60 min, room
temperature; anti–cyclin-dependent kinase 6 (CDK6) was obtained fromSanta Cruz Biotechnology (Santa Cruz, CA) and used at 1:50 titer with an
overnight incubation time at 4jC. Preceding treatment of the slides was anantigen retrieval at 95jC for 25 min with antigen retrieval solution (DAKO),endogenous peroxidase blocking, and unspecific binding blocking. All
antibodies were detected with the LSAB2 system and 3,3¶-diaminobenzidineas the colorizing step (DAKO). Immunostains were reviewed both manually
and with the aid of automated image analysis. An Aperio T2 Scanscope(Aperio, Vista, CA) was used to generate high-resolution images of the XMA.
These images were quantitatively analyzed (24) with Aperio image analysis
software using appropriate algorithms for membranous and nuclear
staining. For membranous staining, a ratio of the number of positive(brown) pixels to the sum of all pixels was calculated. For nuclear staining, a
ratio of positive (brown) nuclei to the sum of all nuclei was calculated.
Web-based database. We have released the gene expression data fromthe xenografts, tumor tissues, and cell lines12 as well as immunohistoche-misty images. The web interface offers a broad variety of options for dataquery, normalization, and visualization. It also offers an option to comparethe expression profiles to our expression database of normal humantissues (25).
Results
Hierarchical clustering of xenograft models. To determinethe transcriptomic consistency among the panel of pediatricxenograft models, cDNA microarray analysis was done on 75preclinical pediatric xenograft models, 70 primary tumors samples,and 18 cell lines (Table 1). All quality-filtered clones (38789; ref. 17)were subjected to hierarchical clustering (18). Figure 1A shows thatthe xenograft models primarily clustered according to theirprospective tumor types with the exception of 6 of 75 xenograftsanalyzed. Of note, in two cases where xenografts were derived fromthe same original cell lines but were propagated through distinctpathways (s.c. and intra-adrenal in two different laboratories), thecorresponding samples clustered closest to each other, suggestingthat the global expression profile is not strongly affected by thechoice of the site of implantation. The xenografts that did notcluster according to their tumor type were WT-X48, WT-X49, MB-X38, NB-X66, aRMS-X3, and eRMS-X26.
ANN classification of xenograft models. To establish if thexenografts maintained the characteristic expression pattern of theprimary tumors, cDNA microarray analysis was done on anadditional set of primary tumor tissue consisting of 19 Ewing’stumor, 22 rhabdomyosarcomas, and 30 neuroblastomas (Supple-mentary Table S2). ANNs were trained with all of the quality-filteredclones (38 and 789) in the primary tumors and then classified ortested the respective xenograft samples (13, 19). In Fig. 1B , theaverage ANN vote is shown for the xenografts (the test set). Thisgraph shows that the ANN predicted the respective xenografttumors based on the expression profiles present in the primarytumors with the exception of NB-X66, aRMS-X3, and eRMS-X26. Tofurther show the similarity of the xenografts with the primary
tumors, the same analysis was done with the xenografts as thetraining set (with the three misclassified samples removed) and theprimary tumors as the test samples. The resulting classifier wasable to classify all of the primary tumors correctly (SupplementaryTable S3).To determine if the clones used by the classifier extended beyond
a particular small subset of clones or if there is a larger set ofdiscriminating clones, another ANN analysis was done, in whichthe top ANN-ranked clones were sequentially removed. Figure 1Cshows that the sensitivity and specificity of the primary tumors topredict respective xenografts remained at 100%, even with the25,000 most informative clones, almost two thirds of the entire dataset, were removed. This analysis (referred to as clone-cutter ANN)showed that many different subsets of genes were equally capableof distinguishing the different tumor types.
Spearman’s rank-order correlation of ANN-ranked clones.Our ANN analysis showed that it is possible to develop a broadclassifier on the model systems, which could in turn predictprimary tumors and vice versa. However, for many applications ofthe xenograft expression database (e.g., the identification ofmarkers), it is necessary that the ‘‘importance’’ attributed to agene does not depend on whether it was estimated from xenograftor primary tumor data. The weight of a genes contribution to theclassifier, the so-called ANN rank, is frequently used to selectpotentially biological important genes (13, 19). The ranking of agene should therefore not differ when xenografts or primarytumors were used to develop the classifier. The degree of similarityof the ranking was determined by calculating Spearman’s rank-order correlation between the list of ANN-ranked clones whenprimary tumors were used to train the ANN and the list obtainedwhen xenografts were used for training. Although the observedcorrelation r = 0.67 (P < 0.001) was smaller than a perfectcorrelation r = 1, it was strong. Potential contributors for r < 1 arestatistical noise and true biological differences. To estimate howmuch each contributed, the ‘‘normal’’ statistical fluctuation wasestimated by calculating the correlation between two lists withoutsystematic biological differences: xenografts were split in twononoverlapping groups and the rank order was estimated for eachgroup individually. The correlation for these two groups was 0.76(P < 0.001), only moderately higher than r = 0.67 for primarytumors/xenografts. This suggests that differences in the lists of theANN-ranked genes trained on either primary tumors or xenograftsare mostly of statistical nature and reflect only weakly systematicdifferences in gene expression.
Multidimensional scaling and similarity metric betweenprimary tumor, xenograft models, and cell lines. Up to thispoint, the overall high transcriptional similarity has been shownbetween the xenografts and their respective primary tumor types.An even more immediate way to measure the similarity ofexpression profiles is to calculate the distance between expressionvectors using some metric. The average Euclidean distancebetween all pairs of xenografts and primary human tumors wasEx = 0.622 F 0.002. Obviously, such a pure number is difficult tointerpret because it lacks a scale. Comparison to anotherestablished model system, cell lines, provided a reference point.For additional 12 neuroblastoma cell lines, the average distance toprimary tumors was Ec = 0.757 F 0.004. The difference between theEx and Ec, >30 SEs, was highly significant with P < 0.0001 (20),indicating that, compared with cell lines, xenograft expression wascloser to primary tumors. The experiment was repeated usingPearson’s correlation r as the metric. Again, the xenografts were
Expression Profiling of Pediatric Xenograft Models
www.aacrjournals.org 37 Cancer Res 2007; 67: (1). January 1, 2007
Research. on January 8, 2016. © 2007 American Association for Cancercancerres.aacrjournals.org Downloaded from

significantly (P < 0.0001; ref. 20) more similar to the primarytumors (1 � r = 0.43) than the cell lines (1 � r = 0.56). Figure 2Avisualizes these results.The global comparison does not exclude the possibility that only
a small, specific set of clones is more similar in the xenograftmodels, whereas in the remaining transcriptome cell lines couldbe equally similar or even closer to primary tumors. To addressthis question, random subsets of clones were chosen and thenumber of cases where the xenograft expression pattern was moresimilar to the primary tumors than the cell lines was counted.Subset sizes ranged from 3 clones to 2,000 clones with 1,000randomly generated subsets for each subset size (Fig. 2B). Evenwhen selecting only three genes, the xenografts were closer to theprimary tumors in >80% of the cases. Interestingly, this valueincreased quickly with the size of the gene subset; the 95% levelwas achieved with only 10 genes. For sets as small as 100 randomgenes, the neuroblastoma xenograft models were always found tobe more similar to the primary tumors than the cell lines.
Identification of potential therapeutic targets. One applica-tion of the xenograft expression database is to identify uniquelyexpressed genes, potential diagnostic markers, or targets fortherapy. The identification of such genes of interest depends onthe exact biological question and the method used to extract thesegenes. For this reason, we have released the entire gene expressiondata set to enable other researchers to develop their own optimizedqueries and do simple searches and compare gene, the expressionlevel of that gene, with normal tissues. The data can also bedownloaded or queried using a versatile user interface on our Website.12 As one possible example of a gene identification, wecompared the xenografts with a previously published geneexpression database of normal organs. An on-line version of thisdatabase is available online13 (25). It was found that 120 knowngenes were up-regulated (Fig. 3A) with many genes involved in cellcycle, cell division, DNA metabolism, and other gene ontologyannotations that may be good therapeutic targets (SupplementaryTable S4).One challenge in identifying biomarkers or drug targets based
on gene expression analysis is the fact that in some instances thetranscripts may not correlate with the protein levels due to post-transcriptional and translational regulation (26, 27). The XMAdeveloped for this study thus enables a further selection ofpotential markers based on protein expression. As a demonstra-tion, we chose one established clinically useful markers, CD45(lymphoid malignancies), as well as one of the 120 up-regulatedgenes, CDK6 (Fig. 3B). This cell cycle protein was chosen aspotentially ‘‘druggable’’ as it showed an elevated expression levelin the xenograft models for acute lymphoblastic leukemia,meduloblastoma, rhabdomyosarcoma, and neuroblastoma. Auto-mated image analysis of the XMAs provided quantitative data ofprotein expression. A significant (P < 0.001; ref. 20) Pearson’scorrelation r between the protein signal and the mRNA level wasobserved (Fig. 3C) for all tested genes: r = 0.42 (CD45) and r =0.55 (CDK6). The images are also released in our on-line geneexpression database.12
Discussion
A fundamental assumption in using human tumor xenografts asmodels for preclinical anticancer drug development is that the
xenografts closely resemble the corresponding primary tumors.Previous studies have analyzed the similarity of xenograft models toprimary tumors by comparing specific biological phenotypes of theprimary tumor, such as tumorigenicity (28), tumor volume (29), orDNA index (30). Here, we have taken a more systemic approach.Rather than focusing on one specific aspect of tumor biology, wequantified transcriptional similarities on scales ranging from only afew genes to a level of thousands of genes. We and others have shownthat such profiles reflect the overall biology of cancers (13, 25, 31).The first step of our analysis was to do a global survey of our
expression data, which also served to ensure internal consistencyof the data set. Using hierarchical clustering, we verified thatspecific tumor types have similar expression patterns to themselvesand that they clustered according to their respective tumor type.Hierarchical clustering showed that the majority of the xenograftsgrouped according to their specific tumor types (with the exceptionof six xenografts), which also established the internal consistency ofour data set.The second step was to formally validate that the expression
profiles of the xenografts reflect those of the correspondingprimary tumors. ANNs on three sets of tumors (Ewing’s tumor,rhabdomyosarcoma, and neuroblastoma) were used to test if thecharacteristic patterns discriminating different tumor types inprimary tumors were preserved in the xenograft models. The ANNtrained with profiles of primary tumors could accurately diagnosethe xenograft tumors for the majority of xenograft models. TheANN rank assigned to a specific gene was similar regardless of thesamples (xenografts or primary tumors) used to train the ANN.The variations of gene ranks between xenografts and primarytumor-generated classifiers could be mostly explained by statisticaluncertainty. The stability of the ranking between model system andprimary tumor therefore suggests that the xenograft geneexpression database is an effective tool also for marker discovery,particularly in combination with the XMA.Next, we used the Euclidean and Pearson’s distance of
expression profiles as the most immediate way to measureprofile similarity. The average distance of model systems fromprimary tumors indicates how well the model represents theprimary tumor. Interestingly, the comparison of the results fortwo clinical model systems in neuroblastoma revealed thatxenografts were significantly closer to primary tumors than celllines were. This suggests that this higher level of similarity on themRNA level may translate also to a higher level of similarity inthe physiologic response to a drug. Of particular importance inthis context is the finding that this higher level of similarity holdsnot only on the systemic scale, the entire transcriptome, but alsofor smaller, randomly selected sets of genes. Naturally, one canthink of a drug affecting the function of particular biologicalpathways with only a modest number of genes involved. On thescale of pathways (we used 100 genes in our experiments), weobserved that xenografts were closer to the primary tumors in allof the 1,000 probed random sets of genes. Even on a ‘‘microscale’’,10 genes, this remained true in 95% of the cases. This finding mayhave implications on the choice of model systems for the testingof drugs, in that the xenograft models might be a better choiceespecially when testing drugs with unknown targets or multipletargets (i.e., so-called ‘‘dirty drugs’’). In other words, this analysisfor neuroblastoma xenografts indicates that it is highly probableto find a higher level of similarity to primary tumors not only fora particular gene target or targets but also for the genes in thecontext (i.e., the biological system), in which these targeted genes13 http://ntddb.abcc.ncifcrf.gov/cgi_bin/nltissue.pl.
Cancer Research
Cancer Res 2007; 67: (1). January 1, 2007 38 www.aacrjournals.org
Research. on January 8, 2016. © 2007 American Association for Cancercancerres.aacrjournals.org Downloaded from
function. Because the transcriptional similarity reflects the overallbiology of the cancer (13, 25, 31), it is conceivable that a higherlevel of transcriptional similarity would be additive to thepredictive value of the xenograft model system. Interestingly,the neuroblastoma xenograft samples in this analysis were notdirect transplants but rather derived from cell lines. The observedchange of their expression profiles from that of cell lines towardthat of primary tumor tissues therefore suggests that this shift isinduced by the microenvironment emulated by the foreign hostorganism. Still, the multidimensional scaling in Figure 2A clearlyindicates that significant systematic differences in expressionlevels of primary tumors and xenografts remain. This is partiallyexplained by the fact that the human cDNA array in this study isrelatively insensitive to mouse RNA due to differences in the 3¶sequences of mouse and human RNA. A separate hybridization ofonly mouse RNA to our microarray showed low signal intensities(Supplementary Fig. S1). RNA from stroma cells or blood vessels,which are present in both human and xenograft samples, aretherefore detected only in the primary samples. An analysis of thedifferences as well as the pattern of the mouse stroma will besubject of future studies.Of note, the ANNs trained on tumor samples rejected the very
same xenografts (NB-X66, aRMS-X3, and eRMS-X26) that did notcluster with their respective tumor type in the hierarchicalclustering, thus emphasizing the internal consistency of our dataand the concordance of our analysis. The NB-X66 and aRMS-X3xenografts neither clustered nor classified with any other xenografttumors present in our analysis. In the hierarchical clustering, thesetwo xenografts shared a common and isolated branch, suggestingthat they share some common features, but not related to theiroriginal diagnostic assignment, and thus would not be a goodmodel to test drugs targeted against neuroblastoma or RMS,respectively. Of the remaining misclassified samples (eRMS-X26,WT-X48, WT-X49, and MB-X38), the ANNs classified eRMS-X26 as aEwing’s tumor. Interestingly, eRMS-X26 was initially diagnosed asembryonal rhabdomyosarcoma; however, review by others hasreclassified it as a primitive neuroectodermal tumor, which is amember of the Ewing’s family of tumors (32). The presence of theEWS-FLI translocation in this xenograft was confirmed by reversetranscription-PCR analysis (data not shown). Therefore, ourtranscriptomic analysis was able to correctly diagnose on a globalscale a xenograft that was initially misdiagnosed. The two Wilms’xenografts (WT-X48 and WT-X49) and the medulloblastoma (MB-X38) clustered with the rhabdomyosarcoma. This is not surprisinggiven the fact that both of these groups of cancers have beenreported on occasions to express muscle markers. Indeed,meduloblastomas are a heterogeneous group of cancers and themajority of reported cases in the literature have been biphasic,containing both primitive neuroectodermal and rhabdomyoblasticcells (33, 34). Within our database, all three of these tumors were
found to have the highest expression of insulin-like growth factor IIin each of their cancer types at levels comparable with levels inrhabdomyosarcoma (data not shown; see on-line database).12 Thisobservation leads us to conclude that the heterogeneity of theWilms’ tumor and meduloblastoma xenografts reflects that ofthe tumor group that they were derived from and is one of thestrengths of using a panel of xenografts rather than individualmodels for drug testing.The XMA presented in this work will be of particular usefulness
for the confirmation of protein expression detectable by immuno-histochemistry. The platform offers a high-density approach, whichis not feasible with Western blots and additionally offers the benefitof histomorphology. The intention to make the XMA available toother research groups essentially ruled out an array based onfrozen tissue. We decided to use ethanol as a fixative, which is‘‘proteomic friendly’’ (22) and offers many advantages as outlinedin Materials and Methods. However, all fixation protocols can beassociated with loss of localization of antigens, and non–cross-linking fixatives, such as ethanol, are associated with lesssubcellular detail; nevertheless, ethanol fixation has become thefixation of choice for nonclinical samples to allow a broader rangeof investigations to be done on these samples.In conclusion, we have characterized the gene expression
profiles of a large panel of pediatric xenografts and haveestablished that xenografts closely resemble their tumor types oforigin even at the level of 10 randomly selected genes. Many ofthe xenografts that we have shown to resemble their tumor typeof origin have been subsequently incorporated into the NCI-sponsored PPTP (11). These tumor panels will be used tosystematically evaluate the activity of 10 to 15 new agents yearlythat are being considered for clinical evaluation in children withcancer. The transcriptional profiles and XMAs described here willmake key contributions to the PPTP. Our web database andtissue arrays (see Materials and Methods) will make possible therapid confirmation of potential targets at both the mRNA andprotein level for available molecularly targeted agents. Finally, ourdata should facilitate the identification of tumor markerspredictive of response to tested agents as well as the discoveryof new molecular targets applicable to specific childhoodcancers.
Acknowledgments
Received 2/16/2006; revised 9/7/2006; accepted 10/27/2006.Grant support: This research was supported in part by the Intramural Research
Program of the NIH, National Cancer Institute, Center for Cancer Research.The costs of publication of this article were defrayed in part by the payment of page
charges. This article must therefore be hereby marked advertisement in accordancewith 18 U.S.C. Section 1734 solely to indicate this fact.
We thank Drs. Peter Adamson and John Maris from the Children’s Hospital ofPhiladelphia, University of Pennsylvania School of Medicine and the Children’sOncology Group Phase 1 Consortium for fruitful discussion and insightful commentsduring the planning stages of this study.
References
1. Johnson JI, Decker S, Zaharevitz D, et al. Relationshipsbetween drug activity in NCI preclinical in vitro andin vivo models and early clinical trials. Br J Cancer 2001;84:1424–31.
2. Sausville A, Burger AM. Contribution of human tumorxenografts to anticancer drug development. Cancer Res2006;66:3351–4.
3. Peterson JK, Houghton PJ. Integrating pharmacologyand in vivo cancer models in preclinical and clinicaldrug development. Eur J Cancer 2004;40:837–44.
4. Houghton PJ, Adamson PC, Blaney S, et al. Testingof new agents in childhood cancer preclinicalmodels: meeting summary. Clin Cancer Res 2002;8:3646–57.
5. Voskoglou-Nomikos T, Pater JL, Seymour L. Clinicalpredictive value of the in vitro cell line, human
xenograft, and mouse allograft preclinical cancermodels. Clin Cancer Res 2003;9:4227–39.
6. Zembutsu H, Ohnishi Y, Tsunado T, et al. Genome-wide cDNA microarray screening to correlate geneexpression profiles with sensitivity of 85 human cancerxenografts to anticancer drugs. Cancer Res 2002;62:518–27.
7. Glinsky GV, Krones-Herzig A, Glinskii AB, Gebauer G.Microarray analysis of xenograft-derived cancer cell
Expression Profiling of Pediatric Xenograft Models
www.aacrjournals.org 39 Cancer Res 2007; 67: (1). January 1, 2007
Research. on January 8, 2016. © 2007 American Association for Cancercancerres.aacrjournals.org Downloaded from

lines representing multiple experimental models ofhuman prostate cancer. Mol Carcinog 2003;37:209–21.
8. Bani MR, Nicoletti MI, Alkharouf NW, et al. Gene expres-sion correlating with response to paclitaxel in ovariancarcinoma xenografts. Mol Cancer Ther 2004;3:111–21.
9. Mintz M, Sowers R, Brown KM, et al. An expressionsignature classifies chemotherapy-resistant pediatricosteosarcoma. Cancer Res 2005;65:1748–54.
10. Fichtner I, Slisow W, Gill J, et al. Anticancer drugresponse and expression of molecular markers in early-passage xenotransplanted colon carcinomas. Eur JCancer 2004;40:293–307.
11. Houghton PJ, Gorlick R, Friedman H, et al. PediatricPreclinical Testing Program (PPTP)—a molecularlycharacterized panel of childhood cancer models fornew agent testing [abstract 4731]. Proceedings of the96th Annual Meeting of the AACR; 2005. p. 1116–7.
12. Wei JSKJ. Purification of total RNA from mammaliancells and tissues. Cold Spring Harbor, New York: ColdSpring Harbor Laboratory Press; 2002.
13. Wei JS, Greer BT, Westermann F, et al. Prediction ofclinical outcome using gene expression profiling andartificial neural networks for patients with neuroblas-toma. Cancer Res 2004;64:6883–91.
14. Eberwine J. Amplification of mRNA populationsusing aRNA generated from immobilized oligo(dT)-T7primed cDNA. Biotechniques 1996;20:584–91.
15. Hegde P, Qi R, Abernathy K, et al. A concise guideto cDNA microarray analysis. Biotechniques 2000;29:548–50, 52–4, 56 passim.
16. Chen Y, Kamat V, Dougherty ER, Bittner ML, MeltzerPS, Trent JM. Ratio statistics of gene expression levelsand applications to microarray data analysis. Bioinfor-matics 2002;18:1207–15.
17. Chen YJ, Kodell R, Sistare F, Thompson KL, MorrisS, Chen JJ. Normalization methods for analysis ofmicroarray gene-expression data. J Biopharm Stat2003;13:57–74.
18. Eisen MB, Spellman PT, Brown PO, Botstein D.Cluster analysis and display of genome-wide expressionpatterns. Proc Natl Acad Sci U S A 1998;95:14863–8.
19. Khan J, Wei JS, Ringner M, et al. Classification anddiagnostic prediction of cancers using gene expressionprofiling and artificial neural networks. Nat Med 2001;7:673–9.
20. Press WH, Tukoslky SA, Vetterling WT, N FlanneryBP. Numerical recipes in C. 2nd Ed. CambridgeUniversity Press; 1992.
21. Gillespie JW, Best CJ, Bichsel VE, et al. Evaluation ofnon-formalin tissue fixation for molecular profilingstudies. Am J Pathol 2002;160:449–57.
22. Ahram M, Flaig MJ, Gillespie JW, et al. Evaluation ofethanol-fixed, paraffin-embedded tissues for proteomicapplications. Proteomics 2003;3:413–21.
23. Khanna C, Wan X, Bose S, et al. The membrane-cytoskeleton linker ezrin is necessary for osteosarcomametastasis. Nat Med 2004;10:182–6.
24. Tan AR, Yang X, Hewitt SM, et al. Evaluation ofbiologic end points and pharmacokinetics in patientswith metastatic breast cancer after treatment witherlotinib, an epidermal growth factor receptor tyrosinekinase inhibitor. J Clin Oncol 2004;22:3080–90.
25. Son CG, Bilke S, Davis S, et al. Database of mRNAgene expression profiles of multiple human organs.Genome Res 2005;15:443–50.
26. Chen G, Gharib TG, Huang CC, et al. Discordantprotein and mRNA expression in lung adenocarcinomas.Mol Cell Proteomics 2002;1:304–13.
27. Beyer A, Hollunder J, Nasheuer HP, Wilhelm T. Post-transcriptional expression regulation in the yeastSaccharomyces cerevisiae on a genomic scale. Mol CellProteomics 2004;3:1083–92.
28. Verschraegen CF, Hu W, Du Y, et al. Establishmentand characterization of cancer cell cultures andxenografts derived from primary or metastatic Mulleri-an cancers. Clin Cancer Res 2003;9:845–52.
29. Schmidt KF, Ziu M, Schmidt NO, et al. Volumereconstruction techniques improve the correlationbetween histological and in vivo tumor volumemeasurements in mouse models of human gliomas.J Neurooncol 2004;68:207–15.
30. Verstijnen CP, Arends JW, Moerkerk P, et al. Culturingand xenografting of primary colorectal carcinoma cells:comparison of in vitro , and in vivo model and primarytumor. Anticancer Res 1988;8:1193–200.
31. Khanna C, Khan J, Nguyen P, et al. Metastasis-associated differences in gene expression in a murinemodel of osteosarcoma. Cancer Res 2001;61:3750–9.
32. Morton CL, Potter PM. Rhabdomyosarcoma-specificexpression of the herpes simplex virus thymidine kinasegene confers sensitivity to ganciclovir. J Pharmacol ExpTher 1998;286:1066–73.
33. Misugi K, Liss L. Medulloblastoma with cross-striated muscle. A fine structural study. Cancer 1970;25:1279–85.
34. Helton KJ, Fouladi M, Boop FA, et al. Medullomyo-blastoma: a radiographic and clinicopathologic analysisof six cases and review of the literature. Cancer 2004;101:1445–54.
35. Khan J, Saal LH, Bittner ML, Chen Y, Trent JM,Meltzer PS. Expression profiling in cancer using cDNAmicroarrays. Electrophoresis 1999;20:223–9.
Cancer Research
Cancer Res 2007; 67: (1). January 1, 2007 40 www.aacrjournals.org
Research. on January 8, 2016. © 2007 American Association for Cancercancerres.aacrjournals.org Downloaded from

2007;67:32-40. Cancer Res Craig C. Whiteford, Sven Bilke, Braden T. Greer, et al. Gene Expression and Tissue Microarray AnalysisCredentialing Preclinical Pediatric Xenograft Models Using
Updated version
http://cancerres.aacrjournals.org/content/67/1/32
Access the most recent version of this article at:
Material
Supplementary
http://cancerres.aacrjournals.org/content/suppl/2006/12/27/67.1.32.DC1.html
Access the most recent supplemental material at:
Cited articles
http://cancerres.aacrjournals.org/content/67/1/32.full.html#ref-list-1
This article cites 31 articles, 16 of which you can access for free at:
Citing articles
http://cancerres.aacrjournals.org/content/67/1/32.full.html#related-urls
This article has been cited by 18 HighWire-hosted articles. Access the articles at:
E-mail alerts related to this article or journal.Sign up to receive free email-alerts
Subscriptions
Reprints and
To order reprints of this article or to subscribe to the journal, contact the AACR Publications
Permissions
To request permission to re-use all or part of this article, contact the AACR Publications
Research. on January 8, 2016. © 2007 American Association for Cancercancerres.aacrjournals.org Downloaded from
Copyright © 2022 FDOKUMEN