Creating Markets for Climate Business
176
Creating Markets for Climate Business An IFC Climate Investment Opportunities Report Public Disclosure Authorized Public Disclosure Authorized Public Disclosure Authorized closure Authorized
-
Upload
khangminh22 -
Category
Documents
-
view
2 -
download
0
Transcript of Creating Markets for Climate Business

Creating Markets for Climate Business An IFC Climate Investment Opportunities ReportPub
lic D
iscl
osur
e A
utho
rized
Pub
lic D
iscl
osur
e A
utho
rized
Pub
lic D
iscl
osur
e A
utho
rized
Pub
lic D
iscl
osur
e A
utho
rized

About IFC
IFC, a member of the World Bank Group, is the
largest global development institution focused on
the private sector in emerging markets. Working
with more than 2,000 businesses worldwide,
we use our capital, expertise, and influence to
create markets and opportunities in the toughest
areas of the world. In FY17, we delivered a
record $19.3 billion in long-term financing for
developing countries, leveraging the power of
the private sector to help end poverty and boost
shared prosperity. For more information, visit
www.ifc.org.
© International Finance Corporation [2017]. All rights reserved.2121 Pennsylvania Avenue, N.W. Washington, D.C. 20433Internet: www.ifc.org
The material in this work is copyrighted. Copying and/or transmitting portions or all of this work without permission may be a violation of applicable law. IFC encourages dissemination of its work and will normally grant permission to reproduce portions of the work promptly, and when the reproduction is for educational and non-commercial purposes, without a fee, subject to such attributions and notices as we may reasonably require.
IFC does not guarantee the accuracy, reliability or completeness of the content included in this work, or for the conclusions or judgments described herein, and accepts no responsibility or liability for any omissions or errors (including, without limitation, typographical errors and technical errors) in the content whatsoever or for reliance thereon. The boundaries, colors, denominations, and other information shown on any map in this work do not imply any judgment on the part of The World Bank concerning the legal status of any territory or the endorsement or acceptance of such boundaries. The findings, interpretations, and conclusions expressed in this volume do not necessarily reflect the views of the Executive Directors of The World Bank or the governments they represent.
The contents of this work are intended for general informational purposes only and are not intended to constitute legal, securities, or investment advice, an opinion regarding the appropriateness of any investment, or a solicitation of any type. IFC or its affiliates may have an investment in, provide other advice or services to, or otherwise have a financial interest in, certain of the companies and parties named herein.
All other queries on rights and licenses, including subsidiary rights, should be addressed to IFC Communications, 2121 Pennsylvania Avenue, N.W., Washington, D.C. 20433.
International Finance Corporation is an international organization established by Articles of Agreement among its member countries, and a member of the World Bank Group. All names, logos and trademarks are the property of IFC and you may not use any of such materials for any purpose without the express written consent of IFC. Additionally, “International Finance Corporation” and “IFC” are registered trademarks of IFC and are protected under international law.

Creating Markets for Climate Business An IFC Climate Investment Opportunities Report

1 19 35Grid-Connected
Renewable Power
Summary
Market snapshot and growth potential
Creating markets for grid-tied renewable power
Initiatives, tools, and resources
Off-Grid Solar and Storage
Summary
Market snapshot and growth potential
Creating markets for off-grid solar and storage
Initiatives, tools, and resources
Climate-Smart Agriculture
Summary
Market snapshot and growth potential
Creating markets for climate-smart agriculture
Initiatives, tools, and resources
iv
vi
Acknowledgements
Acronyms
v
vii
150
123
Foreword
Introduction
Endnotes
Making It Happen: Cross-Cutting Solutions for Market Creation
Pathways to grow green finance
How can blended finance help deliver NDC investment goals?
Creating markets for green innovation
Tools, initiatives and resources
ii Creating Markets for Climate Business: An IFC Climate Investment Opportunities Report
Contents

53 71 87 107Green Buildings
Summary
Market snapshot and growth potential
Creating markets for green buildings
Initiatives, tools, and resources
Climate-Smart Urban Transport and
Logistics
Summary
Market snapshot and growth potential
Creating markets for climate-smart urban
transport
Initiatives, tools, and resources
Climate-Smart Urban Water
Infrastructure
Summary
Market snapshot and growth potential
Creating markets for climate-smart urban
water investment
Initiatives, tools, and resources
Climate-Smart Urban Waste Management
Summary
Market snapshot and growth potential
Creating markets for climate-smart waste
investment
Initiatives, tools, and resources
iii
Contents

iv Creating Markets for Climate Business: An IFC Climate Investment Opportunities Report
AcknowledgementsThis report was prepared by the Climate Business
Department (Alzbeta Klein, Director), Climate Finance
and Policy Group (Vikram Widge, Head). The lead
author was Tom Kerr, with significant support from Aditi
Maheshwari and consultant Jagabanta Ningthoujam.
Sona Panajyan managed communications around the
report. Initial sector policy research was performed
by Vivid Economics. Report design and production
assistance was provided by Maria Teresita Aniana.
Creative design, layout and printing services were
provided by the World Bank’s in-house printing and
multimedia team, led by Gregory Wlosinski. Copy
editing services were provided by Clarity Editorial. Yulia
Guzairova managed the budget.
Many World Bank Group colleagues and experts
provided critical input and ideas to shape this report.
The authors are very grateful for the insightful
review and expert input from the following people:
Grid-Connected Renewable Power chapter: Guido
Agostinelli, Peter Mockel, and Sean Whittaker; Off-
Grid Solar and Storage chapter: Guido Agostinelli,
Peter Mockel and Hoi-Ying So; Climate-Smart
Agriculture Chapter: Nina Zegger, Ahmad Slaibi,
Marc Sadler, Alberto Millan, Tobias Baedecker, Stephen
D’Alessandro, Aira Htenas, Marketa Jonasova and
Katie Kennedy; Green Buildings Chapter: Prashant
Kapoor, Corinne Figueredo, Rebecca Menes, Rusmir
Music, Autif Sayyed, Lenore Cairncross, Martina
Bosi and Thomas Moullier; Climate-Smart Urban
Transport and Logistics chapter: John Graham,
Navaid Qureshi, Shomik Mehndiratta, Tatiana Quiros
and Maria Cordiero; Climate-Smart Urban Water
Infrastructure chapter: George Butler, William Davies,
Sophie Tremolet, William Kingdom and Ye-rin Um;
and Climate-Smart Urban Waste Management chapter:
James Michelsen and Silpa Kaza. Berit Lindholdt
Lauridsen, Joyita Mukherjee, Jonathan Coony, Justine
White, Joshua Gallo and Geoff Keele all offered
significant input to the Making it Happen chapter.
In addition, several other colleagues provided very
helpful cross-cutting input and comments, including
John Donnelly, Steven Baillie, John Graham, Ye-ra
Park, Charlene Coyukiat, Lisa Da Silva, Minakshi
Seth, Martin Buehler, Wenxin Li, Milagros Rivas Saiz,
Vipul Bhagat, Eliana Kaloshi, Rong Zhang, Jean-Marie
Masse, Vipul Prakash, Ruth Hupart, Philip Kileen, Arun
Sharma, Vladimir Stenek, Peer Stein, Elcin Akcura,
Denise Odaro, Brenna Lundstrom, Raul Alfaro-Pelico,
and Amelia Midgely. The Climate Business Department
Anchors also reviewed and supported the report.
Finally, this report benefited tremendously from the
review and comments of a number of external experts,
including: Lance Pierce, President, CDP North America;
Marina Grossi and Laura Albuquerque, CEBDS;
Barbara Buchner, Senior Director and Jessica Brown,
Associate Director, Climate Policy Initiative; Marwan
Ladki, Expert in Sustainable Agriculture, Food and
Agriculture Organization; Michael Waldron, Markets
Analyst, Renewable Energy Division, International
Energy Agency; Steve Nicholls, Head of Environmental
Sustainability, National Business Initiative—South
Africa; Jane Ebinger, Director of Policy, Sustainable
Energy for All; Annapurna Vancheswaran, Senior
Director of Communication, Outreach and Advocacy
Unit, TERI; Grant Kirkman, Head Relations
Management—Finance for Climate, United Nations
Framework Convention on Climate Change; Jayoung
Park, Senior Manager, Environment and Climate and
Heidi Huusko, Senior Manager, Government Affairs,
Environment and Climate, United Nations Global
Compact; Emily Farnworth, Head of Climate Change at
the World Economic Forum. Their collective wisdom and
contributions have dramatically improved the report’s
comprehensiveness and potential for impact.
v
Forewordcommitments submitted by 21 emerging market countries as
part of the Paris Agreement, and found $23 trillion in investment
opportunity if they achieve their targets by 2030. This report
builds from that effort by providing information for investors,
banks and companies about the most attractive climate
investment opportunities, while offering governments a set of
best practice policies and measures that have been proven to
attract private investment.
The way to deliver on the Paris climate pledges is to create
vibrant markets for climate business. The good news is that
many countries are already making progress. Over $1 trillion
in investment is already flowing annually into climate-related
projects; with the right policy frameworks in place, trillions
more will be triggered.
Witness the Mobisol Pay-As-You-Go business model, which
is providing over 60,000 affordable solar home systems in
East Africa, via payment through mobile phones. This has led
to an expanding set of local jobs and has the added benefit of
establishing credit histories for customers that had previously
lacked them. There is also a growing market for green buildings.
In the four years since its inception, IFC’s EDGE has resulted
in the certification of more than three million square meters
of green floor space, and is now available in more than 130
countries. In Vietnam, a consortium of 12 developers has
pledged to certify projects green with IFC's EDGE program.
Agribusiness is increasingly investing in climate-smart practices
that deliver increased productivity, enhanced resilience and
reduced emissions—thereby helping countries to achieve their
climate and food security goals. IFC client Kingenta is helping
China achieve its target of zero growth in fertilizer use by
transforming to an integrated solutions provider that supports
farmers with high-quality and locally tailored fertilizers and
advice. These activities will improve yields while promoting
healthy soil, clean groundwater and reduced greenhouse-gas
emissions. The City of Buenos Aires is demonstrating how
local governments can create markets for urban transport and
waste that are attractive for private investors. It has launched
an ambitious $400 million transportation plan to boost urban
connectivity, decrease congestion, and ease pollution by
reducing the use of cars through a bus rapid transit line and bike
sharing stations; and is also advancing climate-smart waste
management and green buildings. Finally, we can and must
increase private investment in adaptation and resilience. IFC
recently used blended finance to invest in the Mocuba Solar
plant, which delivers climate resilience for Mozambique by
diversifying the electricity mix, while producing electricity that
is cheaper and cleaner than fossil-fuel-based alternatives.
IFC is also using financial innovations such as green bonds to
make it easier for investors to participate in climate business.
Colombian banks Bancolombia and Davivienda became the
first private banks in Latin America to issue green bonds in April
2017; other private banks in the region are expected to follow.
And in October 2017, Fiji became the first emerging market to
issue a sovereign green bond, raising 100 million Fijian dollars
($50 million) to support climate change mitigation and adaption.
IFC is privileged to play a key role in advancing climate solutions
with the private sector. Since 2005, we have provided advice
and invested more than $18 billion in long-term financing for
climate business. In the last fiscal year alone, we provided more
than $4.7 billion in climate-smart financing, including more than
$1.7 billion mobilized from other investors. IFC is committed to
step up as an advisor, investor and partner with our clients and
governments to build on this success and grow new markets for
climate business.
Philippe le HouérouChief Executive Officer, IFC
A dangerously warming planet is not just an environmental
challenge—it is a fundamental threat to our way of life and
threatens to put prosperity out of the reach of millions of people.
In 2015, governments acted decisively by establishing the Paris
Agreement, which aims to stabilize the climate before the end
of this century. Unlike previous commitments, the Agreement
took a bottom-up approach in which 189 countries submitted
national commitments that sent a clear signal to businesses and
investors around the world: a low-carbon future is coming.
As we seek to address climate change, we need to remember
that the lion’s share of economic growth, infrastructure needs,
and related carbon pollution will take place in rapidly growing
emerging economies. This creates a unique opportunity: to
ensure that this growth is sustainable and resilient, while
creating jobs, improving livelihoods, and offering positive
returns on investment. Last year, IFC studied the national

vi Creating Markets for Climate Business: An IFC Climate Investment Opportunities Report
AcronymsBRT Bus rapid transport
CSA Climate-smart agriculture
EBRD European Bank for Reconstruction and Development
EDGE Excellence in Design for Greater Efficiencies
ESCO Energy service company
GDP Gross domestic product
GHG Greenhouse gas
GPS Global positioning system
GW Gigawatt
GWh Gigawatt-hour
IRENA International Renewable Energy Agency
KWh Kilowatt-hour
LED Light-emitting diode
MW Megawatt
MWh Megawatt-hour
NDC Nationally determined contribution
OECD Organisation for Economic Co-operation and Development
PAYG Pay-As-You-Go
PPP Public Private Partnership
PV Photovoltaic
REDD Reduce emissions from deforestation and forest degradation in developing countries
SE4All Sustainable Energy for All
SSA Sub-Saharan Africa
TWh Terawatt-hour
VAT Value-added tax

Introduction
vii

Introduction
the norm for companies. In 2016, 190 of the Fortune 500 companies
reported saving $3.7 billion through renewable energy and energy-
efficiency efforts alone.3
Engaging the private sector in climate-smart investments will be essential
to achieving the goals of the Paris Agreement. In many sectors, private
finance already plays a large role; the Climate Policy Initiative estimated
that in 2014, private capital made up over 60 percent of $392 billion in
annual climate finance flows.4 However, meeting the ambitious targets
set in Paris will require trillions of dollars more in investment. The New
Climate Economy initiative estimates that the world needs to double
its current investment—to about $6 trillion per year—between now
and 2030 just to meet global infrastructure needs.5 Two-thirds of this
investment is needed in low- and middle-income countries, which have
gained an increasing share of global gross domestic product (GDP) since
1990.6 Growth has accelerated not only in large economies such as China
and India, but also in many smaller countries in Asia, Africa, and Latin
America. This means that nearly all projected economic growth—and
related greenhouse-gas emissions growth—is expected to come from
developing countries.7
Climate change is a business opportunity and markets are growing. The
climate challenge is an opportunity—one in which the private sector is
ready to invest. Businesses are increasingly finding innovative solutions
to reduce greenhouse-gas emissions at a profit in sectors like renewable
energy, climate-smart agriculture (CSA), green buildings, and sustainable
transport, while generating jobs and making cities cleaner, healthier,
Climate change presents us with perhaps our biggest challenge.
In recent years, we have seen growing evidence of the effects of
climate change. Greenhouse-gas pollution continues to build up in the
atmosphere, causing more intense storms, floods, droughts, and heat
waves. In recent years, we have seen growing certainty and evidence
of climate change impacts, with supply chains disrupted, increased
commodity price volatility, and severe impacts on communities. The
World Bank Group’s Turn Down the Heat report warns that even more
dangerous effects are still to come unless humanity changes course.1
In 2015, governments acted decisively, putting in place the Paris Agreement
to tackle climate change before the end of this century. Unlike previous
commitments, this agreement took a bottom-up approach—189 countries
submitted national commitments with targets to increase investment in
renewable energy, energy efficiency, sustainable infrastructure, and climate-
smart agriculture. These commitments sent a clear signal to businesses and
investors around the world: a low-carbon future is coming.
Achieving the Paris Agreement will create significant investment
opportunities. If the commitments are realized, they will create over $23
trillion in investment potential in 21 large emerging markets between
now and 2030.2
Governments are not the only ones taking action. More than 1,000
businesses and hundreds of local governments have made ambitious
climate commitments, and are putting their pledges into action by
investing in low-carbon solutions (Box 1). There is growing proof
that clean energy and other climate-smart investments are becoming
viii Creating Markets for Climate Business: An IFC Climate Investment Opportunities Report

Business and local governments: Leading on climate change
Any effort to decarbonize the economy at the
local, regional or global level requires business
engagement. Public policy plays a key role in
stimulating innovation by requiring or incentivizing
businesses to reduce their emissions. Business and
investor leadership is also key. This leadership has
been growing steadily since the United Nations
Secretary General’s Climate Summit in 2014, and was
in evidence at the Peru, Paris and Marrakech climate
talks. The Non-State Actor Zone for Climate Action
now includes commitments by more than 2,000
companies and over 450 investors.8
“More than 600 companies, based in 47 countries,
representing a market capitalization of more than
$15 trillion have now made bold commitments to
climate action. They include over 300 of the world’s
biggest companies committing to set a science-based
target, indicating their commitment to the Paris
Agreement. The momentum is unstoppable.”
— Nigel Topping, Chief Executive Officer, We Mean Business coalition
Local governments are also vital actors in addressing
climate change. Cities consume two-thirds of the
world’s energy and generate 70 percent of global
carbon emissions. The Business and Sustainable
Development Commission estimates that energy-
efficient buildings, clean vehicles, urban public
transport and resilience-building in cities represents
an opportunity of over $1.1 trillion globally by
2030.9 To tap into these low-carbon, private
sector solutions, cities are adopting land rights
reforms, improving access to resilient, low-carbon
infrastructure, and providing incentives for private
investment.
For example, the City of Bogotá’s bus rapid transit
(BRT) system—featuring dedicated bus lanes,
elevated stations, and smart card payments—has
saved commuters as much as 40 minutes per day
and reduced air pollution by 40 percent, making
public transit an attractive alternative to driving.
Other cities, including Buenos Aires, Johannesburg
and Cape Town, are building and expanding similar
networks as part of an emphasis on transit-oriented
development—making green and efficient mobility a
priority. In Izmir, a city of 4 million people on Turkey’s
Aegean coast, municipal authorities have tackled
growing congestion and air emissions through
investments in a new ferry service, metro line,
tramway, and a smart traffic lights network. Izmir
also received a domestic AAA credit rating for local
currency lending, sending a signal of confidence to
investors.
IFC’s Cities Program10 is engaging in these types of
strategic investments with cities around the world
by taking a holistic view of needs and offering
solutions in urban transportation, water and waste
management, street lighting, affordable housing,
energy efficiency, and climate resilience. IFC’s global
network enhances its ability to mobilize commercial
financing for priority projects, connect cities with
capital markets, and help improve creditworthiness
through financial management training.
“Cities are leading the way in confronting climate
change, and they would be doing even more, even
faster, if they had greater access to funding. This is
a big challenge that we can start to address with
practical steps, like helping cities improve their credit
rating, measure their funding needs, and connect
specific projects with lenders. The more power we can
give cities, the more investment opportunities we can
unlock.”
— Michael Bloomberg, United Nations Special Envoy for Cities and Climate Change
BOX 1
ixIntroduction

73 percent since 2000 and 50 percent since 2014)15 and governments
invest in charging infrastructure. In 2017, France, India, and Norway set
aggressive targets to phase out gasoline-powered vehicles in the next 15
years. Bloomberg New Energy Finance forecasts that electric cars will
be cheaper than conventional cars without subsidies between 2025 and
2030.16 Global renewable power providers like Enel are beginning to
combine batteries with solar PV to produce power after dark in sunny
places where power is expensive, such as in mining operations in Chile.17
All of these changes will require governments to respond with targeted
policies to ensure that renewable providers are fairly paid for their services.
“Open cross-industry partnerships spanning along the value chain
will bring new opportunities for the efficient consumption of
clean energy. A digitized grid, coupled with a sound investment
framework, will allow for unprecedented interactions between all
the actors of the energy system.”
— Francesco Starace, Chief Executive Officer, Enel Group
This rapid growth is expected to continue. Bloomberg New Energy
Finance projects $6 trillion in new investment in wind and solar power
between now and 2040. Global electricity markets will be completely
reshaped, with wind and solar as the two largest generators of power,
and fossil fuels making up less than a third of capacity.18 Just less than
half of global investment in new power capacity to 2040 will be in Asia
Pacific, with $4 trillion going to China and India.19
Successful climate business markets are on the rise. $388 billion was
invested in energy-efficient buildings globally in 2015, up 9 percent from
the previous year.20 While this investment has been centered in developed
countries so far, rapidly growing urban populations in countries like China
and India will account for much of the new growth. Energy-efficient
heating, ventilation, and air conditioning is currently a $76 billion global
market.21 Businesses and cities are collaborating to develop low-carbon,
resilient urban infrastructure to provide citizens with sustainable transport,
water, and waste management services. Over the next decade, trillions of
and more resilient. Nowhere is this more evident than in China,
which became a green energy leader after the government designated
renewable energy as a strategic industry. It now has more than one-third
of the world’s wind power capacity and a quarter of its solar power, and
is leading a revolution in battery technologies.11 Africa has seen 62,000
jobs created from renewable energy development, with thousands more
expected as the continent realizes its potential to tap into more than
1,100 gigawatts (GW) of solar power capacity, 350 GW of hydropower
capacity, and over 100 GW of wind power capacity.12
“The Paris Agreement has been called a $20 trillion investment
opportunity. Whatever the precise figure, it is certainly an economic
opportunity with profound social and environmental benefits too.
I would urge all businesses, corporations, financial institutions, and
investors to fully align with the goals of the Agreement—in support
of governments, in support of people everywhere.”
— Patricia Espinosa, United Nations Framework Convention on
Climate Change Executive Secretary
Annual global investment in climate business solutions is over $1 trillion,
and is accelerating. The combined markets for renewable energy ($297
billion), energy storage ($2.5 billion), green buildings ($388 billion),
climate-smart urban transport ($288 billion), water recycling ($23 billion),
and municipal waste management ($160 billion) are today worth more
than $1.1 trillion. In 2016, global renewable power generation capacity
rose by 9 percent; a fourfold increase from 2000. For the second year in
a row, renewable energy accounted for more than half of the new power
generation added worldwide.13 Solar power is getting cheaper much quicker
than anticipated: photovoltaic (PV) module prices have reduced 72 percent
since 2009, and experts forecast another 67 percent reduction by 2040.14
Wind energy is also making major advances in cost and performance.
Electricity delivery and use is becoming a decentralized, community-based
business, particularly in Africa and Asia, where communities are using
smarter energy by combining small-scale solar, and batteries. Electric
vehicles are also gaining popularity as battery costs continue to drop (down
x Creating Markets for Climate Business: An IFC Climate Investment Opportunities Report

dollars will be invested in transport infrastructure, with many climate-
smart investment opportunities for businesses, including electric vehicles,
BRT, light rail, and multimodal transport and logistics. The global waste
market is already worth $154 billion and is expected to double by 2020,
while water supply and sanitation services require more than $13 trillion in
investment between 2016 and 2030. Companies are partnering with local
governments to offer low-carbon water savings and recycling services, as
well as waste-to-energy systems. Climate-smart agriculture is also a rapidly
expanding market, as food producers strive to meet growing demand for
modern, sustainable diets. Between 2004 and 2013, global investment in
the agribusiness sector tripled to more than $100 billion. Climate-smart
agricultural practices are gaining ground as businesses seek to address the
combined challenges of food security and climate change.
Government action is accelerating market development. Addressing
climate change requires large-scale economic transformation, with
major changes in the energy system, industrial processes, heating and
cooling, transport systems, urban infrastructure, land use and consumer
behavior. Countries have adopted more than 1,200 climate change laws,
up from 60 two decades ago. Renewables now receive direct policy
support in nearly 150 countries.22
The implementation of the Nationally Determined Contributions (NDCs)
submitted as part of the Paris Agreement will only accelerate the market
for climate-friendly solutions. Several countries are starting to implement
these targets, with a focus on creating a positive climate for private
investment that results in a pipeline of bankable projects for investors
(Figure 1).
“The top priority for governments and business should be to
convert the targets agreed and the pledges made at Paris into
vibrant markets for climate business. This is the growth story of
the future, and is the only way to deliver lasting and inclusive
prosperity.”
— Nicholas Stern, Chair, Grantham Research Institute on Climate
Change and the Environment, London School of Economics
xiIntroduction

FIGURE 1: Countries are making progress in creating markets for climate business
Morocco
France
Sweden
Zambia
India
Côte d’IvoireColombia
Chile
Costa Rica
(Source: IFC analysis)
COSTA RICA
Supportive policies for EVs and renewables will help Costa Rica become carbon neutral by 2021
COLOMBIA
Colombia's 10-year National Climate Policy prioritizes sectors for investment; the Sostenible Fund will raise capital
CHILE
Chile's new National Climate Action Plan will accelerate private investment in renewable energy
SWEDEN
Sweden recently raised ambition to be climate neutral by 2045
FRANCE
Plan Climat raises France's climate ambition with strong targets for EV, renewables and carbon pricing
MOROCCO
Already a clean energy leader, Morocco is using public-private initiatives to achieve its NDC
CÔTE D'IVOIRE
Cote d'Ivoire aims to generate 42 percent of power from renewables by working with IFC to attract private investment
ZAMBIA
Scaling Solar is helping Zambia to attract low-cost solar investment and deliver energy access
INDIA
India is already on track to exceed its NDC targets for solar and wind energy due to strong policies and incentives
xii Creating Markets for Climate Business: An IFC Climate Investment Opportunities Report

C O LO M B I A
In June 2017, Colombia announced a
10-year National Climate Policy for
comprehensive management plans that
integrate climate considerations into local
and territorial development plans, as well
as national energy and infrastructure
sector strategies. The government also
established a new fund, Colombia
Sostenible, to raise public, private,
and international funding for NDC
implementation.25 The private sector has
been contributing ideas for innovative
climate solutions through efforts like the
banking sector’s Green Protocol, which
is developing climate-smart agriculture
financing tools, and the National
Association of Industrialists’ Clean
Energy Investment Accelerator, which is
demonstrating the potential for rooftop
solar electricity.26
“Colombia is committed to fiscal
policies and reforms that help us
to successfully implement the Paris
Agreement, as shown in the tax
reform approved last year where we
included a carbon tax, among other
climate related provisions that are
part of our sustainable development
agenda. From instituting carbon
taxes to strengthening social
and economic resilience, finance
ministers have access to a wide range
of public policy instruments which
could help their countries to manage
the effects of climate change.”27
— Mauricio Cárdenas, Minister of
Finance, Colombia
C H I L E
During the last decade, Chile has
established itself as one of the top
10 renewable energy markets. The
government introduced competition in
electricity markets, which has resulted
in a stronger grid with dramatically
reduced electricity production costs.23
The country has also worked to diversify
its renewable energy base away from
hydropower to a mix of solar, wind, and
geothermal power. This has resulted in
reduced energy imports. Chile’s NDC
builds on this success, setting a carbon
intensity target to reduce carbon dioxide
emissions by 30 percent below 2007
levels by 2030. In August 2017, the
country launched the National Climate
Action Plan, with the goal of doubling its
current renewable electricity generation
from 45 percent of the energy mix to
90 percent by 2030.24
C O S TA R I C A
The government aims to be the world’s
first carbon-neutral economy by 2021,
with 100 percent renewable energy by
2030. The Seventh National Energy Plan
2015–2030 sets a clear path for private
investment in Costa Rica’s low-carbon
future: it currently has tax exemptions
for renewables, tenders for new
projects, and net metering to facilitate
development. A new law to promote
the use of electric vehicles will exempt
electric and plug-in hybrid cars from
tax, and another law proposes to ban
petroleum vehicles by 2030.28
xiiiIntroduction

F R A N C E
In June 2017, France adopted the Plan
Climat, which includes a new long-term
objective to be carbon neutral by 2050.
This is significantly more ambitious
than the country’s NDC.30 Plan Climat
includes a commitment to use carbon
pricing to phase out coal power plants
by 2022, and to increase the share of
renewable energy to 32 percent by 2030.
It also aims to end the issuing of new
licenses for hydrocarbon exploration or
the renewal of existing permits by 2040.
The government has set a target to phase
out all greenhouse-gas-emitting cars by
2040, when only hydrogen-powered or
electric vehicles may be sold.
C Ô T E D ’ I V O I R E
In its NDC, Côte d’Ivoire committed to
reduce greenhouse-gas emissions by
28 percent compared to business as
usual by 2030.29 To achieve these targets,
the government has developed a plan
for implementation and monitoring of
the proposed actions, and recognizes
the importance of developing a well-
defined resource mobilization strategy
comprising public and private financing.
“Cote d’Ivoire has strong ambitions
to scale up cost-effective, reliable
renewable energy; we are pleased to
work with IFC to engage the private
sector to help achieve our targets.”
— Thierry Tanoh, Minister
for Petroleum, Energy, and
Renewable Energy Development
I N D I A
By some estimates, India is already on
track to exceed its NDC target of reducing
greenhouse-gas emissions intensity by up to
35 percent by 2030.31 Its success in creating
markets for solar power, estimated at more
than 13 GW in capacity in 2017, has led
the government to expand its National
Solar Mission. The new target is 175 GW
of installed solar energy by 2022—five
times the original target. Guided by the
National Wind Energy Mission, with a
target to install 60 GW by 2022, India is
now the world’s fourth largest wind power
generator. The government also recently
announced a commitment to end the sale
of gasoline-powered cars by 2030.
“India aspires to global leadership
on climate action, by setting
ambitious solar targets and directing
that all cars sold in the country be
electric by 2030. For companies
like Mahindra, this represents a way
to reinvent ourselves and deliver
profits—and prosperity—for all.”
— Anand Mahindra, Chairman,
Mahindra Group
xiv Creating Markets for Climate Business: An IFC Climate Investment Opportunities Report

Z A M B I A
Zambia’s NDC aims to boost off-grid
and decentralized renewable energy
systems. This will help address frequent
blackouts and power shortages in the
country. The government has joined
the World Bank Group’s Scaling Solar
Program and completed its first private
auction in May 2016 to build two large
solar plants (600 megawatts [MW]
capacity in total). The lowest bid was just
over $0.06 per kilowatt-hour (kWh)—the
cheapest solar power to date in Sub-
Saharan Africa and among the lowest
tariffs in the world.35 By comparison,
diesel-fired power costs about $0.20 per
kWh and is subject to price volatility.
M O R O C C O
Morocco is integrating its NDC targets
into the country’s policy framework,
including leveling the playing field for
renewable energy by reducing fossil-fuel
subsidies. The country’s NDC sets a
52 percent renewable energy generation
target for 2030, and is making strong
progress. In early 2016, 35 percent of
the country’s energy mix was renewable,
largely as a result of the Noor I solar
park in Ouarzazate.32 The government
has also created innovative new public-
private entities to help increase capacity
and awareness about climate change
solutions, including 4C Maroc, also
known as the Moroccan Competence
Center for Climate Change. 4C Maroc
establishes a platform for dialogue
between Moroccan ministries, private
sector actors, and civil society groups to
develop implementation roadmaps and
investment plans.33
S W E D E N
Sweden has already successfully
decoupled its economic growth from
greenhouse-gas emissions growth
through supportive policies that include
carbon taxes. In June 2017, the country
officially committed to achieving carbon
neutrality by 2045, five years earlier
than its previous plan. Its new climate
legislation will provide the long-term
conditions for business and society to
implement the transition. Sweden now
has long-term climate goals that go
beyond 2020 and an independent climate
policy council that reviews climate
policy.34
“There can be no doubt that
developing countries will be at the
forefront of the green economic
revolution, bringing jobs in clean
energy, improved air quality and
more productive land.”
— Ngozi Okonjo-Iweala, Co-Chair
of the Global Commission on the
Economy and Climate; Chair of
the Board of Gavi, The Vaccine
Alliance
xvIntroduction
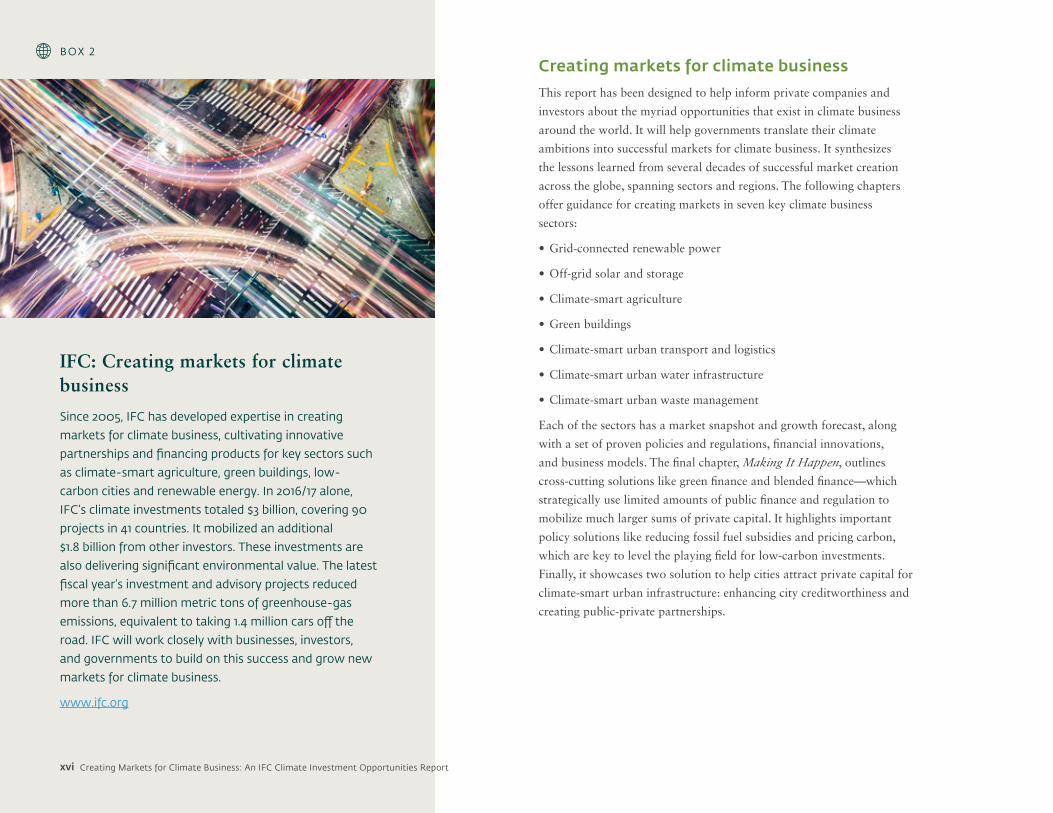
IFC: Creating markets for climate business
Since 2005, IFC has developed expertise in creating
markets for climate business, cultivating innovative
partnerships and financing products for key sectors such
as climate-smart agriculture, green buildings, low-
carbon cities and renewable energy. In 2016/17 alone,
IFC’s climate investments totaled $3 billion, covering 90
projects in 41 countries. It mobilized an additional
$1.8 billion from other investors. These investments are
also delivering significant environmental value. The latest
fiscal year’s investment and advisory projects reduced
more than 6.7 million metric tons of greenhouse-gas
emissions, equivalent to taking 1.4 million cars off the
road. IFC will work closely with businesses, investors,
and governments to build on this success and grow new
markets for climate business.
www.ifc.org
BOX 2Creating markets for climate business
This report has been designed to help inform private companies and
investors about the myriad opportunities that exist in climate business
around the world. It will help governments translate their climate
ambitions into successful markets for climate business. It synthesizes
the lessons learned from several decades of successful market creation
across the globe, spanning sectors and regions. The following chapters
offer guidance for creating markets in seven key climate business
sectors:
• Grid-connected renewable power
• Off-grid solar and storage
• Climate-smart agriculture
• Green buildings
• Climate-smart urban transport and logistics
• Climate-smart urban water infrastructure
• Climate-smart urban waste management
Each of the sectors has a market snapshot and growth forecast, along
with a set of proven policies and regulations, financial innovations,
and business models. The final chapter, Making It Happen, outlines
cross-cutting solutions like green finance and blended finance—which
strategically use limited amounts of public finance and regulation to
mobilize much larger sums of private capital. It highlights important
policy solutions like reducing fossil fuel subsidies and pricing carbon,
which are key to level the playing field for low-carbon investments.
Finally, it showcases two solution to help cities attract private capital for
climate-smart urban infrastructure: enhancing city creditworthiness and
creating public-private partnerships.
xvi Creating Markets for Climate Business: An IFC Climate Investment Opportunities Report

Sector Market snapshot Highest growth markets Key actions to attract private investment
Grid-Tied Renewables
• In 2016, over 160 GW of renewable energy capacity was built
• This was $280 billion in investment, 2X fossil-fuel investment
• China & India are the leading markets, with nearly 1/2 new capacity added
• Over 100 countries targeted renewable energy in their NDCs
• There is $6 trillion in new investment potential in wind and solar power up to 2040; half in Asia-Pacific region
• Africa is attracting solar investment, with 170 MW in Algeria and 500 MW in South Africa
• China led in wind power additions in 2016, with 23.4 GW new capacity
• Battery storage markets are expected to reach 21 GW by 2025
Step 1: Set a target.
Step 2: Put in place smart, market-responsive policies.
Step 3: Ensure that other policies are not inhibiting market growth.
Step 4: Adapt policies to meet the evolving needs of the electricity market.
Off-Grid Solar and Storage
• The global energy storage market was $2.5 billion in 2016, with hot markets in Sub-Saharan Africa and South Asia
• 89 million people in the developing world own at least one solar light
• 31 NDCs target off-grid solar and storage
• Investment in emerging market energy storage will grow from $2.5 billion to $23 billion in 2025
• Sub-Saharan Africa has the greatest growth potential
• Pay-as-You-Go companies raised $223 million in capital in 2016
Step 1: Set a target.
Step 2: Publicize a grid expansion plan to give confidence to developers and investors.
Step 3: Provide targeted incentives to encourage deployment.
Step 4: Allow different electricity tariffs for mini-grids and rooftop PV.
Step 5: Provide microfinance, training and education.
Climate-Smart Agriculture
• Agriculture is a $5 trillion global industry, supporting 500 million farmers and responsible for 10% of consumer spending and 30% of greenhouse-gas emissions
• Over the last 40 years, global meat consumption has grown 2X and will continue to grow
• Over a third of all food that is grown is wasted
• 61 NDCs specifically target CSA
• By 2032, food demand will increase 20%, driven by growth in the developing world.
• Food production will need to increase 70%
Step 1: Mainstream climate-smart agriculture into national policies and sector development plans.
Step 2: Address inefficient government price and subsidy regimes to reward CSA.
Step 3: Invest in strategic infrastructure to facilitate CSA investment.
Step 4: Promote outreach, training, and agribusiness centers of excellence.
Green Buildings • Energy-efficient building investment was $388 billion in 2015 and is growing
• 86 countries target energy-efficient buildings in their NDCs
• Energy-efficient buildings need nearly $300 billion annual investment to achieve climate stabilization
• ESCOs have emerged as a key business model; global revenues were $24 billion in 2015
Step 1: Develop regulatory tools, including building codes, government procurement, appliance standards and performance labels.
Step 2: Build capacity via public awareness, awards, audits, ratings and certification, workforce training and technical assistance.
Step 3: Provide targeted incentives, revolving loan funds, risk guarantees and energy performance contracts.
Step 4: Encourage utilities to act via advanced metering, demand response, time-based tariffs, subsidies and ESCO support.
xviiIntroduction

Sector Market snapshot Highest growth markets Key actions to attract private investment
Transport and Logistics
• Over 750,000 EVs have been sold— a $163 billion market
• Governments are creating markets for EVs by phasing out combustion engines in the coming decades
• Bus Rapid Transit is an attractive urban mobility option—over 150 global cities now have BRT systems
• Over 80 countries target transport in their NDCs
• Investment in transport infrastructure will grow to $900 billion per year by 2025
• The Asia-Pacific will attract over $8 trillion in investment through 2025
• Doubling vehicle efficiency and enabling fuel switching could save $8 trillion cumulatively by 2050
Step 1: Avoid the need for urban commuting via better urban design, bike lanes and consolidated freight centers.
Step 2: Shift from personal vehicles to other modes of transport with BRT, metro systems, travel demand management, fiscal measures and PPPs.
Step 3: Improve technology for passenger vehicles and freight via fuel economy standards, tax rebates, EV infrastructure and automation and optimized routing.
Climate-Smart Water Infrastructure
• More governments are looking to the private sector for climate-friendly water supply and treatment investment
• In 2015, private sector water investment totaled $5.3 billion
• More than 100 countries mention the water sector in their NDCs
• Investment for water supply and sanitation could exceed $13 trillion by 2030, with $8 trillion needed in the Asia-Pacific region alone
• The global market for water recycling technologies is $23 billion, and rapid growth will continue
Step 1: Establish water access, cost recovery and service quality goals, increase inter-government coordination and foster water-smart public awareness.
Step 2: Ensure financial sustainability by implementing water pricing and removing subsidies.
Step 3: Make public-private cooperation deliver increased water efficiency via guarantees, PPPs, project preparation funds and performance-based contracting.
Step 4: Build capacity through training, regional cooperation, public awareness, home/equipment certification, auditing and benchmarking.
Climate-Smart Urban Waste Management
• The global waste market may reach $2 trillion by 2020
• Over the past 2 years, $300 billion in waste processing investment projects have attracted capital
• 800 waste-to-energy facilities were worth $7.4 billion in 2013
• Waste recovery and recycling markets are around $265 billion
• Over 80 countries include waste in their NDCs
• Strong waste-to-energy investment is likely; the Asia-Pacific and Latin American regions will see the most growth
• Between 2009 and 2013, waste generation increased by 15 percent each year in Brazil and China
Step 1: Achieve economies of scale by aggregating waste flows and developing regional plans/partnerships.
Step 2: Use an integrated waste management approach to attract private investment.
Step 3: Get the prices right via cost recovery through taxes, volume-based fees and other means.
Step 4: Put incentives in place through appropriate WTE pricing, mandates for compost and other sector policies.
Step 5: Raise consumer awareness to reduce non-recoverable waste streams.
xviii Creating Markets for Climate Business: An IFC Climate Investment Opportunities Report

Grid-Connected Renewable Power
1

There is $6 trillion in new investment potential in wind
and solar power between now and 2040; half of this potential is in the Asia-Pacific region. There will be up to $11 trillion
cumulative investment by 2040, mostly in emerging markets.
In 2016, over 160 GW of renewables capacity was built around the world accounting for
$280 billion investment, double what fossil fuels received.
China and India lead market development, with nearly 50% of
new global capacity.
2 Creating Markets for Climate Business: An IFC Climate Investment Opportunities Report
Key indicators

China led in global wind power installation in 2016,
building over 23 GW.
Over 100 countries targeted grid-connected renewable power in their
NDCs.
Over 100 major companies are creating markets by committing to go 100%
renewable energy.
Battery storage markets are expected to reach 21
GW by 2025, driven by cost reductions of over 50%.
Africa is beginning to attract major solar investment, with
Algeria (170 MW+), South Africa (500 MW+) and
Zambia leading the way.
In 2016, 75 GW of solar PV was built around the
world—equivalent to 31,000 panels installed
every hour.
2015
2016
3
Key indicators
Grid-Connected Renewable Power

Grid-Connected Renewable Power
competition, with record-breaking bids achieving the lowest installed
cost for renewables to date.
There is growing corporate appetite or customer-sited renewable energy.
Led by the RE100 initiative (see Box 3), companies from diverse sectors
are committing to power 100 percent of their global operations with
renewable energy. This includes technology giants like Intel, Google,
Apple, and Amazon, as well as banks like Goldman Sachs—the first U.S.
bank to sign a corporate power purchase agreement—and consumer-
oriented companies like Unilever.38 In 2016, Dalmia Cement from India
became the first cement company to join the RE100. IFC banking clients
also cite renewable energy as the top priority for their climate business.
Increasing cost-competitiveness, policy support, and corporate demand
means that the forecast is good for renewable energy. According to the
International Energy Agency, cumulative investment in renewable energy
could reach between $7 trillion and $11 trillion by 2040.39 Much of
the new investment will be concentrated in solar PV and wind power in
developing markets. Innovation and economies of scale have cut the cost
of solar PV by half since 2009, and the cost of wind power keeps falling
as turbine size grows and lessons are learned. These advances have
seen solar and wind reach costs comparable with non-renewables in a
growing number of countries, which has boosted investor confidence
and driven the sector’s growth.
Policies are still needed to ensure strong market growth, including
supportive frameworks that facilitate an increasing amount of variable
renewable energy on the grid. Smart policies and market reforms are
1.1 Summary
Renewable power is transforming the global electricity system, with new
capacity and investment values consistently outstripping performance
in the fossil-fuel sector. In 2016, more than 160 GW of solar, wind,
hydropower, geothermal, and biomass capacity was built around the
world, equivalent to twice the United Kingdom’s total installed capacity.
This means that 62 percent of capacity added to the system that year
was renewable, representing an investment of almost $297 billion, more
than double the investment in fossil fuel and nuclear generation.36
There is increasing demand for renewable energy in emerging markets,
led by China and India. According to Bloomberg New Energy Finance, in
2016 China added 34.5 GW of solar power and India added 4.1 GW—
together accounting for more than 50 percent of new global solar
capacity. Similarly, China and India added 23.4 GW and 3.6 GW of wind
power respectively in 2016, accounting for half of global capacity added
that year. Brazil, Jordan, and South Africa are other emerging markets
with significant new investment in renewable energy.
Policies are accelerating market creation. A total of 114 countries
targeted renewable energy growth as part of their national commitments
to the Paris Agreement, sending a strong signal to investors and
companies. To implement these targets, governments are increasingly
using market-creating policies like renewable energy auctions. More
than 20 countries held auctions in 2016.37 This has led to increased
4 Creating Markets for Climate Business: An IFC Climate Investment Opportunities Report

TA B L E 1 : N U M B E R O F C O U N T R I E S TA R G E T I N G R E N E WA B L E E N E R G Y I N T H E I R N D C 4 0
Region Ren
ewab
le
ener
gy
Sola
r
Win
d
Hyd
ro
Bio
fuel
s
Geo
ther
mal
Sola
r, u
tilit
y sc
ale
Was
te-t
o-en
ergy
Oce
an
Was
te
East Asia and Pacific 24 15 10 9 14 6 5 1 4
Europe and Central Asia 7 5 5 6 2 2 1
Latin America and Caribbean 22 9 13 9 11 6 4 2 1
Middle East and North Africa 14 10 8 2 1 3 1 4 1 1
Oceania 2
South Asia 6 4 4 4 5 3 3 1 1
Sub-Saharan Africa 37 32 24 32 23 6 8 4
Western Europe 2
Total 114 75 64 62 56 23 17 17 8 3
(Source: World Bank, INDC Database; see indc.worldbank.org)
needed to incentivize energy storage, so that it can help balance the
grid and manage supply. Policies should ensure that renewable power
providers are not disadvantaged as they enter the grid. Countries where
renewables are at an early stage of development will need to work with
stakeholders to develop a plan for grid expansion.
The sector will continue to grow as countries implement their climate
targets. The countries focusing on renewable energy in their NDCs have
many technology-specific targets and actions to achieve, as shown in
Table 1. Because solar and wind receive the most attention, this chapter
will focus largely on these two technologies.
1.2 Market snapshot and growth potential
Renewable power deployment continued to break records in 2016.
More than 160 GW of new renewable power capacity was added in
2016—the largest annual increase in renewable power capacity to date.
This represents about 62 percent of the power added to the grid that
year, which means capacity in renewables outpaced fossil fuels by a ratio
of almost 2:1.41 Solar PV had the largest capacity increase, with 75 GW
added in 2016, followed by wind (55 GW) and hydro (25 GW).42
Investment in renewable energy remained robust in 2016, at $297 billion
(including large hydropower), falling slightly by 3 percent because
of falling costs and fewer hydro plants coming online.43 Emerging
markets accounted for just over half of this investment (Figure 2).
China remained the largest investor, accounting for almost 30 percent
5Grid-Connected Renewable Power

FIGURE 2: Global investment in renewable power
(Source: Bloomberg New Energy Finance)
UNITED STATES
AMERICAS
BRAZIL AFRICA & MIDDLE EAST INDIA ASIA & PACIFIC
CHINA
EUROPE
0
10
20
30
40
50
2005
2006
2007
2008
2009
2010
2011
2012
2013
2014
2015
Billi
on U
SD
0
3
6
9
12
15
2005
2006
2007
2008
2009
2010
2011
2012
2013
2014
2015
Billi
on U
SD
0
2
4
6
8
10
12
2005
2006
2007
2008
2009
2010
2011
2012
2013
2014
2015
Billi
on U
SD
0
3
6
9
12
15
2005
2006
2007
2008
2009
2010
2011
2012
2013
2014
2015
Billi
on U
SD
0
3
6
9
12
15
2005
2006
2007
2008
2009
2010
2011
2012
2013
2014
2015
Billi
on U
SD
0
10
20
30
40
50
2005
2006
2007
2008
2009
2010
2011
2012
2013
2014
2015
Billi
on U
SD
0
20
40
60
80
100
120
2005
2006
2007
2008
2009
2010
2011
2012
2013
2014
2015
Billi
on U
SD
0
30
60
90
120
150
2005
2006
2007
2008
2009
2010
2011
2012
2013
2014
2015
Billi
on U
SD6 Creating Markets for Climate Business: An IFC Climate Investment Opportunities Report

of global financing in 2016. After China, India ($8.7 billion) and Brazil
($7 billion) were the other two developing countries among the top 10
markets for non-hydro renewable energy investment.44
Renewable power markets are expected to maintain strong growth.
The International Energy Agency expects total deployed renewable
energy capacity to grow from more than 2,100 GW in 2016 to between
about 2,800 GW and 3,000 GW by 2021; this will result in between
$7-11 trillion in cumulative investment in the sector.45
The cost of solar and wind power is expected to continue to fall. The
cost of wind was 66 percent lower in 2016 than in 2009 and solar
PV costs decreased by more than 85 percent.46 Costs are expected to
continue to drop, with a 66 percent decrease for solar PV, a 47 percent
decrease for onshore wind, and a 71 percent decrease for offshore wind
by 2040.47 These projected reductions are largely the result of cheaper
technology and equipment, better operation and maintenance regimes,
and increased efficiency from larger initiatives, especially in wind.48
Bloomberg New Energy Finance expects installed solar capacity to
increase 14-fold by 2040, while wind is projected to grow fourfold.49
The nascent energy storage market is poised for growth. Clean
Technica expects global energy storage to grow seven-fold, from
about 3 gigawatt-hours (GWh) in 2016 to more than 20 GWh in
2025.50 Although costs are more difficult to predict, a steep fall in the
cost of storing energy is anticipated. 2016 saw a 12 percent drop in
utility-scaled lithium-ion batteries from the previous year; this trend is
expected to continue as production ramps up globally.51
Favorable prices and policies have led to increased corporate interest.
Commercial and industrial customer demand is becoming a major
driver of growth for the renewable industry. Corporate renewable
energy demand has increased from about 500 MW in 2010 to a peak
of 5.3 GW in 2015, with 3.25 GW in the United States alone.52 Despite
slowing to 4.5 GW in 2016, largely due to changes in the U.S. market,
record capacity in Europe, the Middle East, Africa, and the Asia Pacific
helped sustain demand.53 Initiatives like the RE100 (see Box 3) are
enabling further growth, with some of the largest companies in the
world committing to procuring 100 percent of their electricity from
renewable sources.
S O L A R P V
Solar PV overtook wind as the fastest growing renewable energy
technology in 2016. A total of 75 GW of solar PV was built around the
world—the equivalent of 31,000 panels installed every hour.54 China
was the global leader, followed by the United States, Japan, India, and
the United Kingdom, which together accounted for 85 percent of new
construction. The largest additions in Africa were by South Africa (over
500 MW) and Algeria (over 170 MW), while Zambia claimed the
lowest-cost solar PV bid on the continent (see Box 5).
Continued cost reductions may see the global market double by 2021.
The solar PV sector attracted $114 billion in investment in 2016. This
represents a fall of about 4 percent year-on-year, demonstrating that
cost reductions are allowing more capacity to be built for less money.
Achieving cost-competitiveness across most countries is expected to
increase investment in solar, creating major demand for energy storage
and electricity market reform. Solar PV is forecast to increase from
303 GW of total installed capacity at the end of 2016 to between
550 GW and 650 GW by 2021.55
Grid-tied distributed solar, i.e. rooftop solar for residential and
commercial consumers, is set to grow in key emerging markets like
India. In 2016, there was nearly $40 billion invested in rooftop and
other small PV projects.56 The United States invested the most (more
than $13 billion), followed by Japan ($8.5 billion, down from about
$27 billion in 2015), and China ($3.5 billion). India’s small-scale solar
sector is poised for growth, driven by the government’s ambitious target
to install 40 GW of rooftop solar power by 2022.
W I N D
Wind power remains the second largest source of renewable energy after
hydro, accounting for almost 22 percent of total renewable capacity. A
total of 55 GW of wind power was built in 2016, increasing total global
wind capacity by about 12 percent to 487 GW. China led construction,
7Grid-Connected Renewable Power
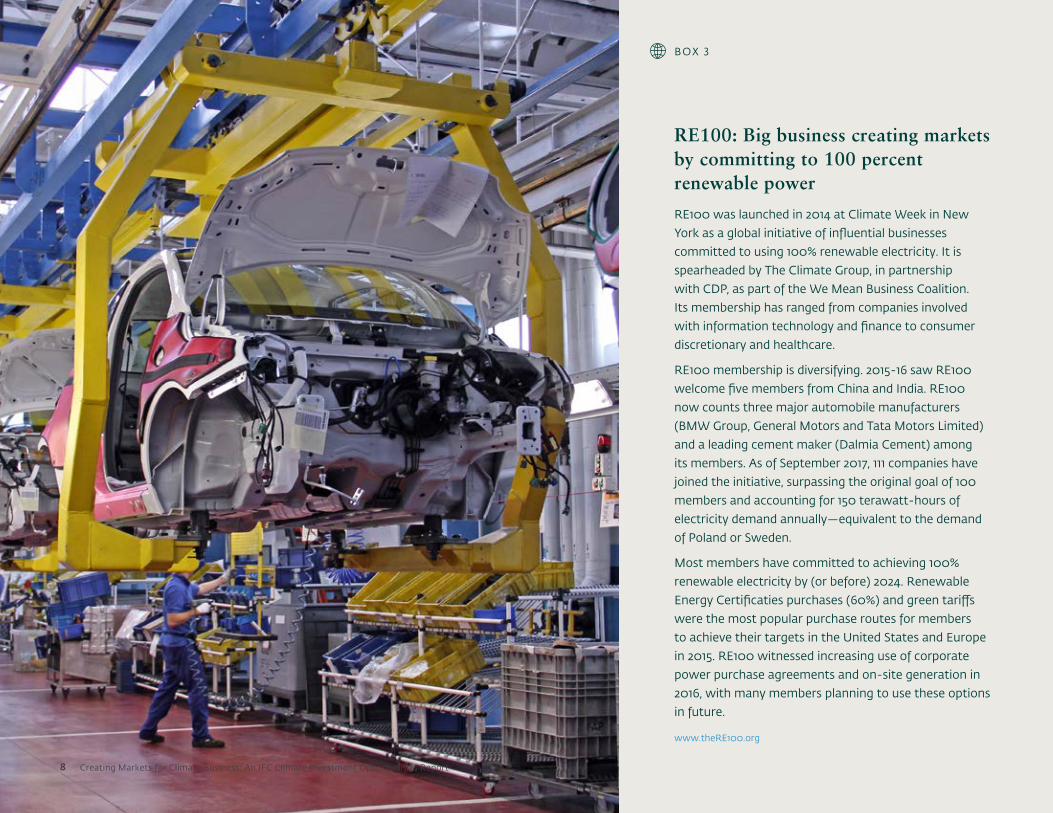
RE100: Big business creating markets by committing to 100 percent renewable power
RE100 was launched in 2014 at Climate Week in New
York as a global initiative of influential businesses
committed to using 100% renewable electricity. It is
spearheaded by The Climate Group, in partnership
with CDP, as part of the We Mean Business Coalition.
Its membership has ranged from companies involved
with information technology and finance to consumer
discretionary and healthcare.
RE100 membership is diversifying. 2015-16 saw RE100
welcome five members from China and India. RE100
now counts three major automobile manufacturers
(BMW Group, General Motors and Tata Motors Limited)
and a leading cement maker (Dalmia Cement) among
its members. As of September 2017, 111 companies have
joined the initiative, surpassing the original goal of 100
members and accounting for 150 terawatt-hours of
electricity demand annually—equivalent to the demand
of Poland or Sweden.
Most members have committed to achieving 100%
renewable electricity by (or before) 2024. Renewable
Energy Certificaties purchases (60%) and green tariffs
were the most popular purchase routes for members
to achieve their targets in the United States and Europe
in 2015. RE100 witnessed increasing use of corporate
power purchase agreements and on-site generation in
2016, with many members planning to use these options
in future.
www.theRE100.org
BOX 3
8 Creating Markets for Climate Business: An IFC Climate Investment Opportunities Report

building 23.4 GW of wind, followed by the United States, Germany,
India, and Brazil.
Major investment and cost reductions may see wind power capacity
more than double by 2026.57 The sector attracted $112 billion in 2016,
down 9 percent year-on-year but yielding more capacity, again reflecting
lower costs of installation. The average total installed cost of wind
power has fallen by two-thirds between 1983 and 2014, and may fall by
a further 12 percent by 2025. The cost of electricity from new turbines
is likely to fall even faster, because efficiency gains, increased use, and
better logistics are making the electricity produced by new turbines
considerably less expensive—potentially falling by up to 34 percent by
2025. Wind power is forecast to rise from 487 GW of total installed
capacity at the end of 2016 to around 1,110 GW by 2026.58,59
U T I L I T Y - S C A L E S T O R A G E
Utility-scale energy storage is emerging as a high-growth market that
can play a role in supporting the development of renewable energy.
Energy storage technologies can be broadly categorized as follows:
• Mechanical (such as flywheel, pumped hydro)
• Electrochemical (batteries)
• Chemical (hydrogen, synthetic natural gas)
• Thermal
• Electromagnetic (capacitors).
They are being developed to address different needs, including managing
supply and demand, and balancing loads when renewables are not
operating. There is no single best storage technology. The optimal choice
depends on parameters such as density, round-trip efficiency, cycle life,
ambient temperatures, safety needs and cost. The cost of different storage
options depends on scale, application and siting. Prices for large installed
grid-scale battery storage systems are approaching $300-350/kWh today,
and are expected to be around $250/kWh in the early 2020s. This is
based on today's cost of a Lithium-ion battery pack at $220/kWh.60
Pumped storage remains the biggest storage technology by capacity,
but battery storage is growing fast. Pumped storage is a conventional
technology that pumps water uphill to a reservoir during times of
excess capacity, and then releases it through a hydroelectric turbine to
generate electricity when it is needed. It accounts for 96 percent of the
world’s storage. However, lithium-ion electrochemical storage is the
subject of growing interest, since it is the most common battery type in
electric vehicles and has benefited from major research and development
investment in recent years. This has supported a 65 percent cost
reduction from 2010 to 2015.61 Clean Technica expects global energy
storage to grow from about 2.9 GWh at the end of 2016 to 21 GWh by
2025.62 Half of this storage will take place “behind the meter,” meaning
it will be installed on the customer’s side of the utility meter to reduce
the customer’s utility bill. The largest markets for grid-connected energy
storage by 2025 will be the United States, Japan, China, Germany,
Australia, the United Kingdom, and India, with eight countries expected
to breach 1 GWh of storage in their markets. While the markets
are smaller, activity is also growing in Kenya, South Africa, and the
Philippines.63
1.3 Creating markets for grid-connected renewable power
While the market outlook is strong for grid-tied renewable energy, policies
are still needed to address risks, including uncertainty about grid access,
unclear land titles, and a high cost of financing. Governments can foster
attractive markets for grid-tied renewables through setting targets, adopting
supportive renewable energy policies, ensuring non-renewable polices align
with renewable energy goals, and adapting policies to manage dynamic
market needs as the share of renewables in the energy system grows
(Figure 3). In addition, countries where renewables are at an early stage
of development can develop a comprehensive plan for grid expansion,
in partnership with large electricity customers, developers, investors and
utilities. To help facilitate an increasing amount of variable renewable
resources, countries should provide policy frameworks, market reforms
and incentives for energy storage so that it can help balance the grid and
manage supply. Finally, policies should ensure that renewable power
providers are not disadvantaged as they attempt to connect with the system.
9Grid-Connected Renewable Power

1 2 3 4
• Consult with
stakeholders and
develop vision
statements leading to
specific targets
• Targets can be
capacity-based or share
of energy generation/
consumption
• Grid extension/access
policies are needed to
ensure that renewable
power can come to
market at lowest cost
• Address issues related
to land titles, permits
and approvals,
especially in densely
populated areas
• Using an independent
market regulator can
help level the playing
field, especially in
vertically integrated
markets
• Reverse auctions are a
good way to unleash
competition and
mitigate budget risks
• Feed-in tariffs should
be carefully managed
to avoid lock-in of
technology and to allow
for rapidly changing
technology costs
• Renewable portfolio
standards, renewable
energy certificates and
net metering, among
other policies, can help
provide holistic policy
support
• Conduct a public
assessment of grid
capacity/future growth
to ensure grid stability
and renewables
integration at lowest
cost
• Support grid
interconnection, which
allows for electricity
to be traded between
countries and regions
• Recognize the value
of energy storage via
incentives and removal
of barriers
SET A TARGET
ALIGN OTHER POLICIES WITH RENEWABLE ENERGY GOALS
ADOPT MARKET-RESPONSIVE POLICIES
ADOPT MARKET-RESPONSIVE POLICIES
FIGURE 3: Steps to create markets for grid-connected renewable energy
10 Creating Markets for Climate Business: An IFC Climate Investment Opportunities Report
S T E P 1 : S E T A TA R G E T.
Most governments develop clean energy white papers and vision
statements in consultation with industry and affected stakeholders.
These actions signal a country’s clean energy ambitions and help to
ensure that plans are achievable and broadly supported before targets
are set. More than 150 countries have set national renewable energy
targets.64 Some countries develop technology-specific targets and frame
them in terms of capacity. For example, India’s National Solar Mission
aims to have 100 GW of solar power by 2022. Other targets are
expressed in terms of a share of final energy consumption. For example,
the European Union intends to have at least a 27 percent share of
renewable energy consumption by 2030, encompassing energy end-uses
such as electricity, heat, and transport fuels. Other factors to consider
in setting a target include the ease of monitoring progress, incentivizing
generation rather than capacity, making targets mandatory rather than
aspirational, stakeholder engagement to generate support for the target,
and the existence of supportive policies.65
S T E P 2 : P U T I N P L A C E S M A R T, M A R K E T-R E S P O N S I V E P O L I C Y F R A M E W O R K S T O A C H I E V E T H E TA R G E T.
In many countries, preference for feed-in tariffs is giving way to
auctions. But the local context, such as the state of the electricity
market, fuel subsidies, and the relative cost of electricity, is an important
determinant in the success of market development policies.
Renewables auctions are an increasingly popular tool to encourage
usage in a controlled manner. Sometimes called “reverse auctions”,
this approach involves the government or utility setting a target for the
amount of renewable energy it wants to acquire, then asking developers
to offer project bids, including the electricity price required to build and
operate the project under a long-term power purchase agreement. Once
bids are received, the authority awards contracts to winning proposals
based on criteria such as price and project feasibility until the targeted
capacity is achieved. As renewable energy technology costs fall, this
method helps to manage the challenge of determining market prices
and mitigates budgetary risks associated with other policies such as
feed-in tariffs.66 Auctions have been successful in advanced renewable
markets like Germany and the United Kingdom, as well as in emerging
economies like Brazil, Chile, India, Mexico, and South Africa.67
Feed-in tariffs remain a popular policy tool, but must be managed
carefully. About 70 countries have some type of feed-in tariff,68 which sets
a fixed price per unit of renewable energy in the electricity grid. Different
technologies may attract different tariffs depending on technology
costs and location. With rapidly changing technology costs, commercial
sensitivities around pricing, and accelerating learning rates, creating
fair and durable feed-in tariffs is challenging. This can be addressed by
integrating flexibility mechanisms into tariff policy, such as rates that
decline predictably over time and regularly scheduled rate reviews.
Other policy instruments include the renewable portfolio standards and
renewable energy certificates. Portfolio standards ensure distribution
utilities and direct consumers procure a certain share of their electricity
from renewable sources, usually in some form of timely increment. This
can be expanded to include storage technologies. While the standards
have helped create markets in advanced economies like the United
States and the United Kingdom, it has had mixed results in emerging
markets, including India, which tried a form of portfolio standards in
the early 2010s. Renewable energy certificates—whereby the owner
claims the emissions and other benefits associated with renewable
energy generation—are tradable financial instruments that can be used
by utilities and large independent consumers to fulfill their renewable
obligations. They are usually implemented together with portfolio
standards to fulfill obligations when there could be physical shortage of
renewable electricity. Creating similar certificates for storage capacity
can monetize storage and encourage the use of renewable energy,
supported by the system-level cost savings that storage can deliver.
The state of the electricity market, in addition to supply and demand,
determines the appropriateness and success of renewable portfolio
standards and energy certificates.
Net-metering policy can be used in tandem with other policy
instruments (especially feed-in tariffs) to support customer-sited
renewable energy on the grid, especially residential and corporate
rooftop solar and other customer-sited installations. It allows
11Grid-Connected Renewable Power

Creating markets for grid-tied renewable energy
ARGENTINA: RENEWABLE ENERGY AUCTIONS
In 2016, Argentina embarked on a series of energy
sector reforms with the arrival of new President
Mauricio Macri. Following a 15-year hiatus of
international investor interest in Argentina, the
Macri administration realized the importance
of establishing a bankable, best-practice power
purchase agreement regime and energy auction
process to achieve competitive electricity generation
costs and increase investment. The government of
Argentina teamed up with IFC’s Global Power team
to draft a power purchase agreement and structure
the bid process, which included:
• Reducing the retail price, which will advance
competition.
• Tailoring bidding criteria by defining and
adhering to capacity limits and quotes, and
allowing for market opening measures and a
simpler approach to the bidding process.
• Including international arbitration in the power purchase agreement to ensure project
bankability.
• Standardizing environmental and social standards by ensuring IFC performance
standards are applied for each project.
• Incorporating a guarantee of off-taker obligations to backstop ongoing payments and
termination payments.
Following IFC’s advice and the implementation of
a World Bank guarantee, Argentina successfully
completed two energy auctions in October and
November 2016, awarding 1.5 GW of wind and
900 MW of solar projects to local and international
bidders. The November auction resulted in average
pricing of $53/MWh for wind and $55/MWh for solar.
The auctions are estimated to bring in $3.5 billion
in investment over the next two years and grow
renewable energy from just under 2 percent of the
current energy mix to at least 8 percent by 2018.
WESTERN BALKANS: DEVELOPING PARTNERSHIPS TO SCALE UP SMALL HYDROPOWER
IFC used a holistic strategy to grow the small
hydropower market in the Western Balkans. The
approach involved:
• Working with governments to improve the
investment climate.
• Helping energy companies strengthen project
concepts, technical designs, and business plans.
• Helping clients secure financing.
• Supporting local banks to boost internal capacity
and process renewable energy loans.
• Organizing business-to-business workshops and
databases to match international companies and
local developers for joint ventures.
The result was the development of a $1.1 billion
investment program in 500 MW of small-scale
hydro projects in the region, generating 2000 GWh/
year. IFC provided $28 million in financing for these
projects and mobilized another $40 million. The
Small Hydro program is now being replicated in
Nepal, with similar plans under development in East
Asia Pacific and Sub-Saharan Africa.
www.ifc.org
BOX 4
12 Creating Markets for Climate Business: An IFC Climate Investment Opportunities Report

13Grid-Connected Renewable Power

BOX 5
Solar power is an increasingly affordable, quick-to-
build solution for countries in need of additional
electricity. Scaling Solar, launched by the World
Bank Group in 2015, provides an easy-to-follow
process to plan, procure, and launch grid-connected
solar projects within two years using private sector
financing. It offers governments the tools to quickly
increase energy generation at stable low tariffs
and allows developers to bid on well-structured,
standardized projects through a competitive,
transparent process that reduces risk and costs.
Zambia was experiencing daily blackouts, stemming
from drought that had crippled its hydroelectric
capacity, when it became the first country to sign
up for Scaling Solar in 2015. The government aims
to build two large solar plants as part of its long-
term strategy to generate 600 MW from solar. In
May 2016, the program completed its first auction,
choosing from seven prequalified bids. The lowest
bid was just over $0.06 per kWh, which is fixed for
25 years. This is the cheapest solar power to date
in Sub-Saharan Africa and among the lowest solar
tariffs in 2017.
Zambia’s Scaling Solar debut is expected to meet its
targets and deliver 73 MW of solar power capacity
within two years. It is the region’s first utility-scale
solar project outside South Africa. While a partial
risk guarantee helped mitigate off-taker risk, Zambia
has demonstrated that market solutions and private
sector financing for low-cost renewables in low-
income countries are feasible.
www.scalingsolar.org
Scaling Solar in Zambia
14 Creating Markets for Climate Business: An IFC Climate Investment Opportunities Report

homeowners and commercial and industrial consumers to sell excess
electricity back to the grid, offsetting their costs and creating an
additional incentive to use renewables. Net metering has been used
widely in North America and Europe and is gaining traction in emerging
markets—especially in China and India—but delays in market reform
are a challenge. Regulations for a competitive wholesale and distribution
market and open access have been difficult to implement, but are
catalytic to market development.
Other fiscal credits and incentives such as accelerated depreciation
and generation-based incentives can be used with some of the policy
instruments discussed above to enhance market creation. Market
regulators can make the issuing of operational permits and the approval
of utility modernization plans contingent on storage.69
S T E P 3 : E N S U R E T H AT O T H E R N O N - R E N E WA B L E P O L I C I E S A R E N O T I N H I B I T I N G M A R K E T G R O W T H .
Countries are developing solutions to manage challenges related to
renewable energy technologies. These include:
• Creating policies to ensure renewable power can come to market. The
best renewable energy resources are often in less populated areas far
from the grid, which means built capacity may remain unconnected to
the grid.70 This can be overcome by extending the grid, or preparing
approved construction sites with grid connectivity, as has been done
in India, where the government prepared sites with prebuilt grid
connections for large solar power projects.71
• Addressing issues related to land titles, permits, and approval
processes. When renewables are developed in densely populated areas,
secure access to land is a challenge. In addition to land acquisition,
the permit and approval processes often create unanticipated project
delays in developing countries, especially for large wind farms and
solar installations. Innovative solutions that focus on underused land,
such as India’s canal-top solar installations, can help address land
challenges,72 while providing secure land tenure can help make land
markets much more efficient. Streamlining the permit and approval
processes can also help accelerate project development.
India: Creating markets for grid-connected renewables
India’s government is targeting 175 GW of installed
renewable power capacity by the end of 2022, including
100 GW from solar, 60 GW from wind, 10 GW from
biomass, and 5 GW from small hydro.
Reverse auctions have played a major role in achieving
the cost-effective use of renewable energy while
minimizing government risks. Tariffs continue to break
record lows, with the winning bid for 250 MW of solar
PV in April 2017 at $0.05/kWh, continuing a long-term
trend that has seen auction prices fall by 70 percent
since 2010.73 To avoid failure in the auction process, and
recognizing the limits of transmission infrastructure to
transport electricity from India’s solar PV hotspots to
demand centers, a major green energy corridor is being
built in partnership with Germany’s GIZ via a €1 billion
soft loan from the German development bank KfW.74
As the share of renewables on the grid grows, India is
focusing on energy storage. In 2016, the government
mandated that storage be included in a 100 MW solar
tender in Andhra Pradesh and a 200 MW solar tender
in Karnataka Saurabh.75 Renewables make up about
17 percent of India’s total installed capacity, and its
most recent renewable electricity roadmap aims for
40 percent by 2030. The move towards specifying
storage requirements shows that India is transitioning
towards a future-oriented grid that requires storage
to maintain frequency control, balance the grid, and
manage the inherent intermittency of renewable energy.
BOX 6
15Grid-Connected Renewable Power
• Using independent and non-discriminatory regulation to ensure
that renewable generators, who are often new market entrants, are
not disadvantaged. This is particularly important when renewable
generators are selling electricity to a utility with thermal generation
interests. Without a strong, independent regulator ensuring market
competition, incumbents might discriminate against renewable
generators and independent power producers.
S T E P 4 : A D A P T P O L I C I E S T O M E E T T H E E V O LV I N G N E E D S O F T H E E L E C T R I C I T Y M A R K E T.
When renewables are at an early stage of integration, it is best practice
for authorities to conduct a public technical assessment of grid
connection capacity and tailor grid investments with the growth of
renewables in mind. As renewable penetration grows, ensuring grid
stability is of paramount importance. Electricity market reforms can
be used to incentivize the right types of generation capacity and reduce
demand during peak periods. Support for grid interconnection allows
electricity to be traded.76 In addition, it is important that wind and solar
plant outputs are reflected in planning for the wider power system. A
well-balanced portfolio of wind and solar PV plants can contribute
to grid stability without needing to expand the grid. Building plants
in different locations also helps ensure a smoother output of power,
enabling better management.77
Energy storage contributes to grid stability, and incentives can help
encourage storage use.78 For example, the United Kingdom has
undertaken major electricity market reforms to incentivize investment
in secure, low-carbon electricity,79 and California has developed energy
storage mandates requiring its major utilities to procure 1.3 GW of
storage capacity by 2020.80 In June 2017, the state of Massachusetts
introduced a comprehensive program for energy storage. Targets were
set for 600 MW of installed capacity by 2025.81 New York is expected
to follow suit soon. Success in developed country markets could send a
strong signal to developing countries.
Regulation and market design are key for storage. Energy storage can
deliver several benefits to the grid. The business case for storage is
easier to make if storage assets can participate in different markets at
different times, for example via intermittent short charges/discharges
for frequency regulation, via load reduction during peak hours, or via
shifting renewable generation over several hours. Market design should
allow for “value stacking” of different applications and for storage to
operate both as a generation and transmission asset.
I N N O VAT I V E F I N A N C I N G M O D E L S
Yieldcos are an influential financial innovation in the renewables
industry. A yieldco is a publicly traded company focused on dividend
growth, created by a parent or standalone energy company. The yieldco
owns and operates renewable assets, promising contracted predictable
cash flows while maintaining tax advantage.82 It allows parent
companies to finance large-scale projects while ensuring access to lower
capital costs. The first yieldco was started in the United States in 2012
and grew to 10 companies with a peak market capitalization of almost
$28 billion by 2015.83 After a challenging year in 2015, owing to the
low oil price and the effects of renewable energy company SunEdison’s
bankruptcy, the yieldco market is slowly making a recovery.84
Securitizing assets, particularly for residential solar, is another financial
innovation promising lower capital costs. Solar asset-backed securities
are emerging as a credible debt financing instrument in the U.S.
residential solar market. IFC is helping to demonstrate the viability of
asset-backed securities structures for rooftop solar in India (see Box 7),
and then translate this for other emerging markets.85
Project financing is central to the future health, direction, and
momentum of the energy storage industry.86 It is a transition away
from reliance on self-funding, captive lending, and government
grants, signaling technology maturity and growth. In 2017, CIT Bank,
Macquarie Capital, and Advanced Microgrid Solutions provided the
industry’s first financing for an energy storage project—a 50 MW fleet
of behind-the-meter systems in West Los Angeles.87 SUSI Partners, a
Swiss investment manager, recently closed the first round of its Energy
Storage Fund with a pool of €66 million. Another €14 million is already
committed for the second round of financing.88
16 Creating Markets for Climate Business: An IFC Climate Investment Opportunities Report

Can the asset-backed securities market finance solar?The India Innovation Lab for Green Finance is a
public-private initiative that aims to drive green
growth in India. IFC is working with the lab
secretariat, the Climate Policy Initiative, to refine the
program’s structure.
The proposed financing program will provide
affordable and accessible debt financing to
developers of solar rooftop projects that target
institutional, commercial, and industrial customers,
and demonstrate the viability of a sustainability-
focused asset-backed securities structure for the
Indian market.
In the first phase, the program will establish a
loan book (warehouse line) to provide loans to
creditworthy solar rooftop projects. In the second
phase, the loans will be refinanced by issuing green
asset-backed securities, initially to local institutional
debt investors. The composition of the loan pools
will have to meet certain underwriting criteria. The
size and timing of the bond issuance will depend on
market conditions and investor appetite, and may be
issued on a rolling basis.
www.climatefinancelab.org/the-labs/india
BOX 7
17Grid-Connected Renewable Power

1.4 Initiatives, tools, and resources
The International Energy Agency (IEA) works to ensure reliable, affordable and clean energy for its 29 member countries and beyond, and has a wealth of data, policy perspectives, technology roadmaps and outlook reports on renewable energy.
www.iea.org
The International Renewable Energy Agency (IRENA) is an intergovernmental organisation that supports countries in their transition to a sustainable energy future, and serves as the principal platform for international cooperation, a centre of excellence, and a repository of policy, technology, resource and financial knowledge on renewable energy.
www.irena.org
The Renewable Energy Policy Network for the 21st Century (REN21) brings together governments, NGOs, research institutes and academia, international organizations and industry to learn from each other to advance renewable energy.
www.ren21.net
The Renewable Energy and Energy Efficiency Partnership (REEEP) focuses on advancing the renewable and energy-efficiency market, particularly in developing countries, primarily by de-risking and scaling up clean energy business models.
www.reeep.org
Sustainable Energy for All (SE4ALL) is a global initiative to achieve universal energy access, improve energy efficiency, and increase the use of renewable energy.
www.se4all.org
The International Solar Alliance (ISA) is a common platform for cooperation to advance deployment of solar energy through innovative policies, projects, programmes, capacity-building measures and financial instruments.
www.isolaralliance.org
The Global Solar Council (GSC) is an international organization founded in 2015 to coordinate the efforts of the world’s solar energy associations.
www.globalsolarcouncil.org
The Global Wind Energy Council (GWEC) was established in 2005 to provide international representation for the wind energy sector.
www.gwec.net
The Global Energy Storage Alliance (GESA) was established in 2014 to bring together energy storage and clean energy industry associations for knowledge sharing and advancement of energy storage solutions.
www.globalesa.org
The RE100 is a collaborative global initiative uniting more than 100 businesses committed to 100 percent renewable electricity, working to increase demand for—and delivery of—renewable energy.
www.re100.org
The Regulatory Indicators for Renewable Energy (RISE) is a global policy scorecard that assesses policy and regulatory frameworks for energy access, energy efficiency and renewable energy.
http://www.worldbank.org/en/topic/energy/publication/rise---regulatory-indicators-for-sustainable-energy
The Energy Sector Management Assistance Program (ESMAP) is administered by the World Bank Group, and focuses on increasing the knowledge and technical capacity of low- and middle-income countries to achieve a sustainable energy solution.
www.esmap.org
The World Business Council for Sustainable Development's Low Carbon Technology Partnerships initiative (LCTPi) is a joint public and private initiative to accelerate low-carbon technology development. Renewable energy is one of the solutions that the WBCSD and its member companies have identified as critical to reach climate stabilization.
www.lcpti.wbcsd.org
18 Creating Markets for Climate Business: An IFC Climate Investment Opportunities Report

Off-Grid Solar and Storage
19

Cost reductions in batteries and solar PV have opened up many
new markets—the number of off-grid systems grew by 41 percent
between 2015 and 2016, with 8.2 million systems sold.
Sub-Saharan Africa and South Asia dominate the off-grid market. There
are now over 100 off-grid solar companies globally and 20 million
quality certified solar lights have been sold. 89 million people in the developing world own at least one
solar light.
20 Creating Markets for Climate Business: An IFC Climate Investment Opportunities Report
Key indicators

India leads the off-grid solar market, with over 3 million
systems sold in 2016; Kenya was 2nd with 1.2 million, and
Ethiopia third with 500,000.
PAYG solar business models raised $223 million in capital
in 2016.
31 NDCs include targets for this sector.
Annual investment in energy storage in emerging
markets was 2.5 billion in 2016 and is expected to
reach $23 billion in 2025.
KenyaEthiopia
India
pay-as-you-go
21
Key indicators
Off-Grid Solar and Storage

Off-Grid Solar and Storage
storage solutions have opened up new off-grid applications that were
previously too expensive. Globally, the number of off-grid solar systems
in use grew by 41 percent between 2015 and 2016, with the 8.2 million
systems sold representing about 50 percent of sales of all off-grid
products in that period. Investment in micro- and mini-grids has also
accelerated, with the global market expected to reach $200 billion.93
There are now over 220 mini-grids in operation; in 2015-2016, mini-
grids accounted for $68 million of equity, debt and grants raised.94
New business models have reduced transaction costs and introduced
a more reliable way to pay for solar home systems and mini-grid
applications. Pay-As-You-Go (PAYG) solar companies raised $223 million
in capital in 2016, while $75 million was raised in debt and equity finance
for mini- and micro-grids in East Africa and Southeast Asia alone.95 This
growth is expected to continue, particularly in the storage sector: annual
investments in storage of all types in emerging markets are forecast to
grow from about $2.5 billion in 2016 to $23 billion in 2025, with China
and India leading the way.96 This will result in 80 GW of new storage
capacity compared to the estimated 2 GW existing today, only a small
fraction of which will be in remote applications.97
There are still barriers preventing strong off-grid markets, including a
failure to capture the value of off-grid solar and storage in regulations,
challenges with permitting, and challenges accessing suitable finance.
Governments are beginning to address these by recognizing the role that
off-grid technologies play in electrification and providing supportive
policies, including differentiated tariffs, clear technical and safety
2.1 Summary
Providing energy to communities with limited access to formal energy
grids remains the main driver for off-grid solar power and distributed
storage. These off-grid technologies include solar lanterns, solar home
systems, mini-grids and micro-grids, and distributed battery storage.
Solar lanterns and solar home systems provide enough electricity
to power lights and charge cellphones, while mini- and micro-grids
support demand from residential, industrial, and commercial customers.
Moreover, small-scale energy storage can create autonomous mini-grids
that provide households with uninterrupted electricity access and/or on-
demand electricity service.89
The off-grid solar market is dominated by emerging markets, mainly in
Sub-Saharan Africa and South Asia. Ethiopia, Kenya, and Tanzania are
the leading markets in Africa, accounting for 66 percent of units sold,
while India leads the way in Asia.90 In less than a decade, more than 100
companies around the world have been created to focus on standalone
solar lanterns and solar home systems. By July 2015, 20 million solar
lights had been sold. Today, about 90 million people in the developing
world have at least one solar lighting product in their home.91
Bloomberg New Energy Finance predicts that one in three households
globally will use off-grid solar by 2020.92
Cost reductions and advances in technology are enabling large-scale
deployment of distributed solar PV and mini-grids. The dramatic drop
in the costs of solar PV and lithium-ion batteries and advances in energy
22 Creating Markets for Climate Business: An IFC Climate Investment Opportunities Report
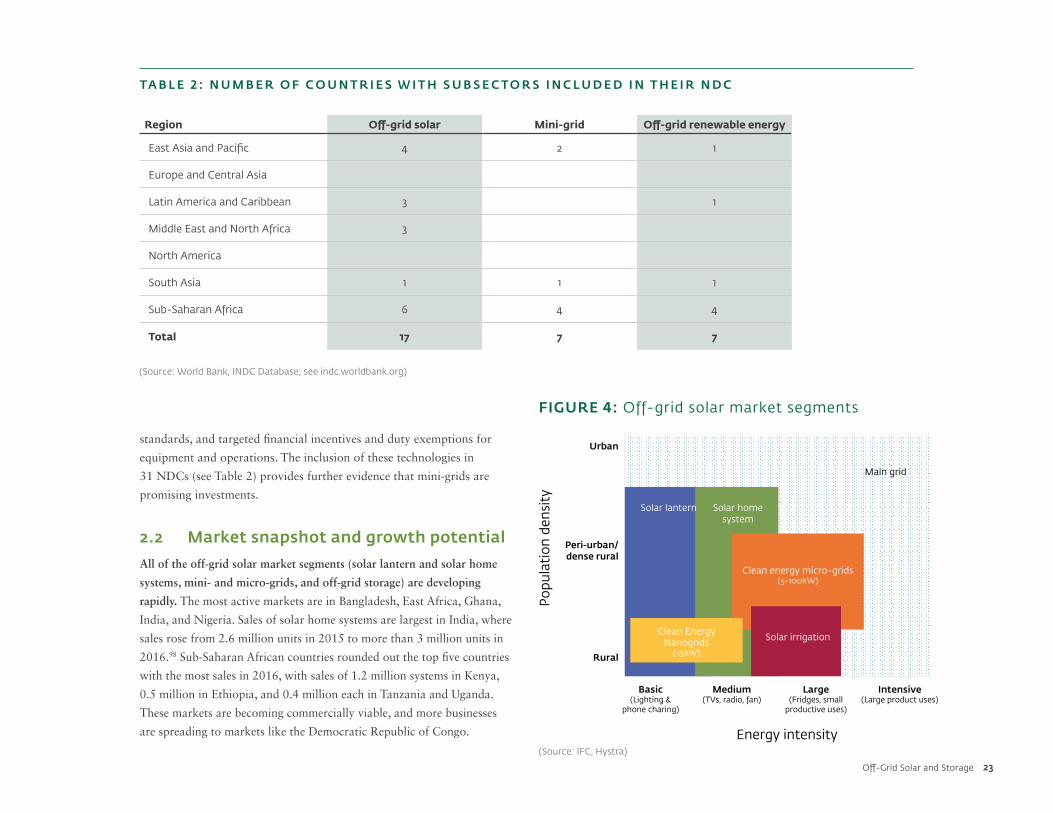
standards, and targeted financial incentives and duty exemptions for
equipment and operations. The inclusion of these technologies in
31 NDCs (see Table 2) provides further evidence that mini-grids are
promising investments.
2.2 Market snapshot and growth potential
All of the off-grid solar market segments (solar lantern and solar home
systems, mini- and micro-grids, and off-grid storage) are developing
rapidly. The most active markets are in Bangladesh, East Africa, Ghana,
India, and Nigeria. Sales of solar home systems are largest in India, where
sales rose from 2.6 million units in 2015 to more than 3 million units in
2016.98 Sub-Saharan African countries rounded out the top five countries
with the most sales in 2016, with sales of 1.2 million systems in Kenya,
0.5 million in Ethiopia, and 0.4 million each in Tanzania and Uganda.
These markets are becoming commercially viable, and more businesses
are spreading to markets like the Democratic Republic of Congo.
TA B L E 2 : N U M B E R O F C O U N T R I E S W I T H S U B S E C T O R S I N C L U D E D I N T H E I R N D C
(Source: World Bank, INDC Database; see indc.worldbank.org)
Region Off-grid solar Mini-grid Off-grid renewable energy
East Asia and Pacific 4 2 1
Europe and Central Asia
Latin America and Caribbean 3 1
Middle East and North Africa 3
North America
South Asia 1 1 1
Sub-Saharan Africa 6 4 4
Total 17 7 7
FIGURE 4: Off-grid solar market segments
Medium(TVs, radio, fan)
Basic(Lighting &
phone charing)
Urban
Rural
Peri-urban/dense rural
Solar lantern
Solar irrigationClean EnergyNanogrids
(<5kW)
Solar homesystem
Clean energy micro-grids(5-100kW)
Main grid
Large(Fridges, small
productive uses)
Intensive(Large product uses)
Energy intensity
Popu
lati
on d
ensi
ty
(Source: IFC, Hystra)
23Off-Grid Solar and Storage

With a low electrification rate (35 percent of households connected to
electricity overall), Sub-Saharan Africa has the greatest growth potential
for off-grid solutions, though opportunity also exists in Bangladesh,
India, Indonesia, and Pakistan.99 South-Central Asia is the second largest
market for distributed solar systems, with sales growth of
19 percent between 2015 and 2016.100
O F F - G R I D S O L A R
Solar PV costs are falling rapidly—a trend that is expected to continue—
making solar home systems an increasingly attractive solution.
Innovation, increased production, and the implementation of lessons
learned from experience have reduced the price of solar PV by 58 percent
since 2010.101 Increased cell efficiency has driven down costs by reducing
the surface area and associated materials needed to produce the same
output. Large additional cost reductions are still to come from improved
solar modules and other components, with the total cost of rooftop
systems expected to fall by more than 20 percent by 2021 in countries
like India and China.102
Sales of off-grid solar systems are growing rapidly, especially in India.
The use of off-grid solar systems (including pico-solar and systems less
than 100 watts) grew by 42 percent globally between 2015 and 2016
to 8.1 million systems, representing about 50 percent of sales of all off-
grid products in that year. Sales of off-grid solar systems in 2016 were
led by India (3.1 million systems), Kenya (1.2 million), and Ethiopia
(500,000 million). Pico-scale products—lightweight, portable solar
panels—are the most common types of systems, comprising 94 percent
of all off-grid solar products. Sub-Saharan Africa and South Asia
together accounted for more than 80 percent of global sales in 2016.103
The PAYG business model is changing the viability of rural
electrification, and PAYG companies are attracting significant
investment, especially in East Africa. PAYG solar companies raised
$223 million in 2016, up from just $3 million invested in 2012.104
The mobile-enabled PAYG business model is revolutionizing the
commercial viability of rural electrification: it allows people to make
small payments over time, making solar products accessible to low-
income households. The PAYG business model is being used by more
than 32 companies in at least 30 countries. Companies like Lumos
Global, Mobisol (see Box 8), M-KOPA, d.light, and BBoxx are already
connecting thousands of homes each month using rooftop solar
home systems. The model is now being applied to other areas like
clean cooking and water pumping. Mobile PAYG is particularly well
established in East Africa, where mobile phone penetration is relatively
high, and is gaining popularity in West Africa and Southern Asia. In
the future, data from PAYG customers may be used to establish credit
histories, improving access to finance.105
New business models will expand markets for energy storage. High
upfront costs for residential products remain a challenge, especially
among the poorest households. Pico-solar projects package lightweight,
portable charging panels with electrical appliances, making solar home
systems more affordable. The success of innovative PAYG schemes
in East African markets could be rolled out more broadly. A major
challenge for distributed energy storage is developing ways to share the
financial benefits of energy storage systems between consumers and the
project developer.
M I N I - G R I D S
The falling cost of renewables is making micro- and mini-grids more
cost-effective than extending the grid in some markets. Investment in
micro- and mini-grids continued to accelerate in 2016, with the global
market expected to reach $200 billion.106 Markets are maturing to allow
grids to accept power for less than 24 hours, so that systems can be
turned off when there is insufficient renewable energy to meet demand.
In addition, mini-grid systems that can provide constant power are
widely available.107
Small islands are becoming an attractive market for distributed solar and
storage mini-grids. This is largely driven by the need for small islands to
reduce their overreliance on imported petroleum products, which have
cost, ecological, and energy security risks. The World Bank’s Energy
Sector Management Assistance Program is behind the Small Island
Developing States “DOCK” Support Program, which provides advice
and investment support to small island developing states looking to
transition to clean technology. Solar projects include the Regional Solar
24 Creating Markets for Climate Business: An IFC Climate Investment Opportunities Report

Mobisol makes solar power affordable in East Africa
Mobisol GmbH is a leading PAYG solar energy service
company in East Africa. It seeks to make renewable
energy solutions affordable for consumers who
lack access to grid electricity through an innovative
lease-to-own business model. It has developed a
high-quality, modular solar home system that has an
embedded metering system. This allows customers
to pay through a 36-month payment plan via mobile
money payment platforms. To date, the company
has sold over 60,000 units in Rwanda and Tanzania,
which is equal to more than 4 MW of total installed
capacity.
In 2016, IFC was invited to partner with FMO, the
Dutch development bank, to help Mobisol accelerate
growth in Kenya, Rwanda, and Tanzania; expand
into new markets such as Nigeria, Uganda, and
Zambia; and fund new products and services, such
as insurance products and microloans. IFC invested
more than €5.4 million in the company and expects
the following:
• Access to energy: Mobisol is scaling up off-grid
power solutions in Sub-Saharan Africa to people
without access to electricity. It is expected to
provide energy access to more than 4 million
people by 2021.
• Environmental and health benefits: Solar
home systems displace the use of fossil fuels, such
as kerosene and diesel, or car batteries, which
pollute the environment and come with health
and safety hazards.
BOX 8
• Job creation: Mobisol’s expanding sales and
distribution network, as well as customer service
offerings, supports small business and creates
local jobs.
• Establishing credit histories for the unbanked: By offering customers a chance to pay for the
solar home system over time, Mobisol enables
unscored and unbanked individuals to build a
credit history, resulting in enhanced financial
inclusion. Customers have gone on to buy other
products such as appliances or access to school
loans using the same payment technology after
they have paid off their Mobisol loan.
www.ifc.org
25Off-Grid Solar and Storage
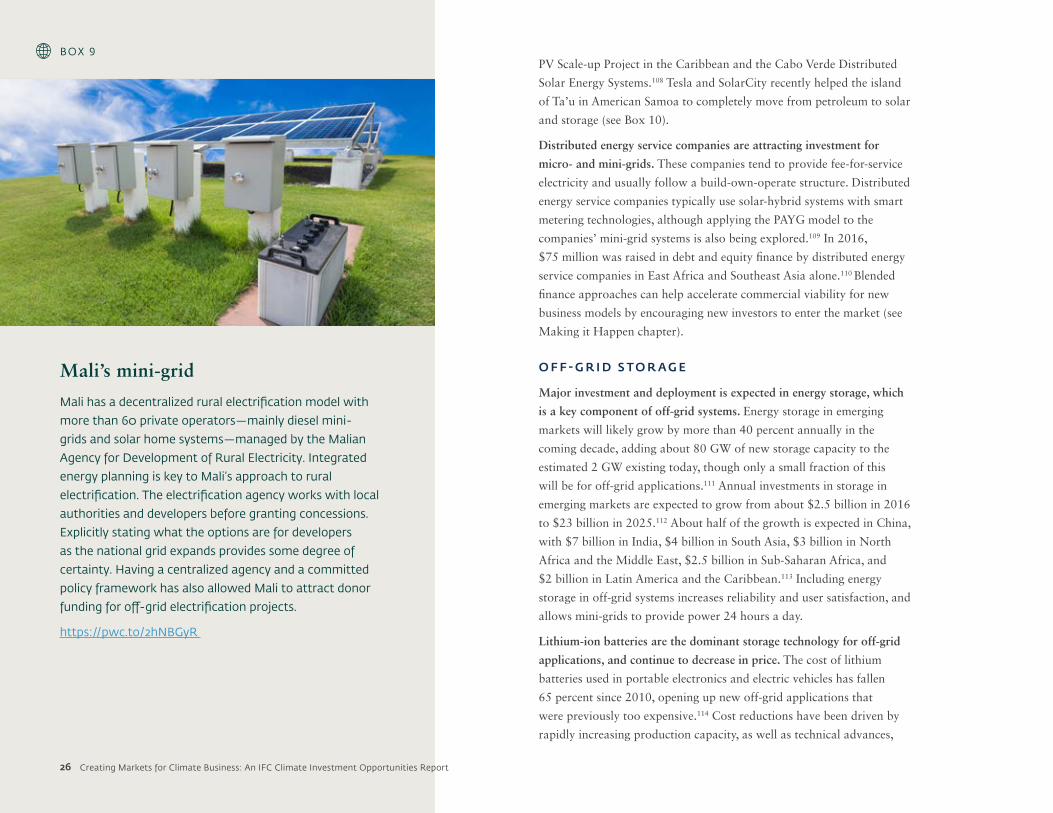
PV Scale-up Project in the Caribbean and the Cabo Verde Distributed
Solar Energy Systems.108 Tesla and SolarCity recently helped the island
of Ta’u in American Samoa to completely move from petroleum to solar
and storage (see Box 10).
Distributed energy service companies are attracting investment for
micro- and mini-grids. These companies tend to provide fee-for-service
electricity and usually follow a build-own-operate structure. Distributed
energy service companies typically use solar-hybrid systems with smart
metering technologies, although applying the PAYG model to the
companies’ mini-grid systems is also being explored.109 In 2016,
$75 million was raised in debt and equity finance by distributed energy
service companies in East Africa and Southeast Asia alone.110 Blended
finance approaches can help accelerate commercial viability for new
business models by encouraging new investors to enter the market (see
Making it Happen chapter).
O F F - G R I D S T O R A G E
Major investment and deployment is expected in energy storage, which
is a key component of off-grid systems. Energy storage in emerging
markets will likely grow by more than 40 percent annually in the
coming decade, adding about 80 GW of new storage capacity to the
estimated 2 GW existing today, though only a small fraction of this
will be for off-grid applications.111 Annual investments in storage in
emerging markets are expected to grow from about $2.5 billion in 2016
to $23 billion in 2025.112 About half of the growth is expected in China,
with $7 billion in India, $4 billion in South Asia, $3 billion in North
Africa and the Middle East, $2.5 billion in Sub-Saharan Africa, and
$2 billion in Latin America and the Caribbean.113 Including energy
storage in off-grid systems increases reliability and user satisfaction, and
allows mini-grids to provide power 24 hours a day.
Lithium-ion batteries are the dominant storage technology for off-grid
applications, and continue to decrease in price. The cost of lithium
batteries used in portable electronics and electric vehicles has fallen
65 percent since 2010, opening up new off-grid applications that
were previously too expensive.114 Cost reductions have been driven by
rapidly increasing production capacity, as well as technical advances,
Mali’s mini-grid
Mali has a decentralized rural electrification model with
more than 60 private operators—mainly diesel mini-
grids and solar home systems—managed by the Malian
Agency for Development of Rural Electricity. Integrated
energy planning is key to Mali’s approach to rural
electrification. The electrification agency works with local
authorities and developers before granting concessions.
Explicitly stating what the options are for developers
as the national grid expands provides some degree of
certainty. Having a centralized agency and a committed
policy framework has also allowed Mali to attract donor
funding for off-grid electrification projects.
https://pwc.to/2hNBGyR
BOX 9
26 Creating Markets for Climate Business: An IFC Climate Investment Opportunities Report

SOLAR AND BATTERY STORAGE MICRO-GRID REPLACING DIESEL IN TA’U ISLAND, AMERICAN SAMOA
Like most small islands, islands in American
Samoa have traditionally been powered by diesel
generators. Aside from the environmental cost,
this means that islands are susceptible to high
transport costs and supply and cost risks from a
volatile commodity like oil. In 2017, the island of
Ta’u managed to completely move away from
diesel by installing a solar and battery storage-
enabled micro-grid that can supply all of the island’s
electricity needs.
BOX 10
The project involved a 1.4 MW solar micro-grid,
backed by 6 MWh of battery storage. SolarCity
provided the solar installation while 60 Tesla
Powerpacks secured the storage requirements. The
project took a year to implement and was financed
by the American Samoa Economic Development
Authority, the Environmental Protection Agency, and
the U.S. Department of the Interior. It is expected
to save more than 100,000 gallons of diesel fuel per
year, in addition to ensuring a reliable and secure
supply of energy on the island.
OFF-GRID SOLAR ENERGY IN PAPUA NEW GUINEA
In Papua New Guinea, about 80 percent of the
population have no access to electricity. Since 2014,
more than 1.3 million people, or 16 percent of the
country’s population, have gained access to phone
charging and energy services. Over the next two
years, Lighting Papua New Guinea is expected to
build a market for a further 300,000 people with
access to PAYG and other smart solar products. IFC
provided business connections, market intelligence,
and consumer education that allowed global solar
manufacturers enter the market.
For more information, see: blog.solarcity.com/
island-in-the-sun/ and http://bit.ly/2y27Txj.
Creating markets for off-grid solar in the Pacific
27Off-Grid Solar and Storage

FIGURE 5: Steps to create markets for off-grid solar and storage
1 2 3 4 5
• A target sends a signal
to the private sector
that the government
supports off-grid
systems
• Potential incentives
include subsidies for
off-grid equipment and
removal of excise duties
• Grants, incentives,
rebates and
demonstration projects
will encourage energy
storage deployment
• Project preparation
facilities can help fill the
gap between concept
and investment
• Publicizing a grid
expansion plan
gives confidence to
developers about policy
support and market size
• Provide clarity on the
future of mini-grid
operations when the
main grid arrives
• Differentiated tariffs
can be used to help
mini-grid operators
achieve cost recovery
• Introducing time-
varying rates can
incentivize energy
storage by allowing
consumers to use
behind-the-meter
storage systems for
cost reduction and peak
management
• Encourage microfinance
for customers and
suppliers
• Training and education
is critical for mini-grid
deployment and the
widespread deployment
of distributed energy
storage
SET A TARGETUSE FISCAL INCENTIVES
MAKE ELECTRICITY PLANNING TRANSPARENT
CONSIDER DIFFERENTIATED TARIFF STRUCTURES
ENHANCE SUPPORTING POLICIES
28 Creating Markets for Climate Business: An IFC Climate Investment Opportunities Report

including thicker electrodes and higher voltages.115 Lithium-ion batteries
are estimated to account for 80 percent of global energy storage
installations by 2025.116
2.3 Creating markets for off-grid solar and storage
Off-grid solar and storage markets have tremendous promise, but
investors and companies still face risks and barriers. These include a lack
of clarity on the role of off-grid storage in overall national and local
energy plans, a failure to capture the value of off-grid solar and storage
in regulations, challenges with permitting, and low access to finance
on suitable terms.117 Governments can address these risks by taking a
holistic approach that includes target setting, planning for expansion,
smart policies and incentives (including different tariff structures) and
other policies (Figure 5).
S T E P 1 : S E T A TA R G E T.
Targets signal to private players that the government supports off-grid
systems. Several countries have developed distributed solar targets:
Rwanda aims to reach 22 percent of its population with distributed
renewable energy systems by the 2018 fiscal year, increasing its off-grid
power generation to 22 MW. Tanzania announced a target of 1 million
solar installations by the end of 2017, which is expected to supply solar
electricity to 10 percent of the nation’s population and create over
15,000 jobs.118
S T E P 2 : M A K E E L E C T R I C I T Y P L A N N I N G T R A N S PA R E N T.
Making electricity grid expansion plans public helps give confidence
to developers making investments in off-grid equipment.119 The
government of Rwanda is providing clear policy support for solar home
systems and mini-grids in the country’s short-term electrification plan.
The governments of Kenya and Sierra Leone have both indicated that
mini-grids are part of their national electrification strategy, while the
Nigerian Electricity Regulatory Commission has recently stated that
Fluidic Energy provides a cleaner alternative to diesel
Fluidic Energy, headquartered in Scottsdale, Arizona,
is a privately held provider of energy storage solutions.
Founded in 2007, the company supplies zinc-air batteries
to support critical loads and backup power applications
worldwide, particularly in Southeast Asia. IFC invested
$7 million in the company in 2013.
The company’s products include remote site
management, multi-year performance warranties, and
innovative financing terms. Its rechargeable metal-air
battery system provides low-cost backup power to
cellular towers connected to unreliable electricity grids.
This novel technology, which Fluidic has already deployed
in countries such as Indonesia, helps reduce the costs
of sustaining mobile networks in rural areas and offers
a cleaner alternative to diesel generators and lead-acid
batteries.
http://bit.ly/2wQ2O8S
BOX 11
29Off-Grid Solar and Storage

electricity distribution companies may now use mini-grids as a bridge
technology to accelerate electrification activities.120
To sustain the market for mini-grids, clarify what will happen when the
main grid arrives.121 Typical options that can be developed for mini-grid
owner-operators if the grid arrives include:
• Converting from a power producer to a power distributor and buying
electricity from the main grid for resale to customers.
• Selling electricity to the interconnected grid operator and ceasing sales
to retail customers.
• Selling the distribution grid to the interconnected grid operator and
receiving compensation for the asset.
S T E P 3 : C O N S I D E R O F F E R I N G F I S C A L I N C E N T I V E S T O E N C O U R A G E D E P LO Y M E N T.
Kenya, Rwanda, and Tanzania all removed value-added tax (VAT) on
solar products in the 2015 fiscal year.122 Tanzania also offers subsidies
for mini-grids, storage systems, and renewable energy equipment, as well
as some duty exemptions for mini-grid enabling technologies.123 India
removed excise duties on off-grid solar systems in 2014. In 2015, Uttar
Pradesh, the Indian state with the most people lacking access to energy,
announced plans to waive its VAT on solar energy equipment. Other
incentives, such as grants and rebates, can further help to stimulate the
energy storage market.
S T E P 4 : C O N S I D E R A L LO W I N G D I F F E R E N T E L E C T R I C I T Y TA R I F F S T R U C T U R E S D E P E N D I N G O N T H E S I Z E A N D O T H E R C H A R A C T E R I S T I C S O F M I N I - G R I D S O R R O O F T O P P V.
Tanzania applies differentiated rules to distributed energy service
companies that allows them to charge cost-reflective tariffs that differ
from the national tariff, depending on the size of the mini-grid. India’s
Ministry of New and Renewable Energy developed a Best Practice
Guidebook on State Level Solar Rooftop PV Programmes that includes
options for setting differentiated tariffs.124 It can also be valuable to
introduce time-varying rates, which incentivize energy storage by
Securitization of renewable assets is helping to lower the cost of capital for BBOXX
In 2015, BBOXX, a leading PAYG company based in
the United Kingdom, partnered with Oikocredit, a
Netherlands-based investor, to structure the first
securitization of off-grid solar assets in the world. Using
12 years’ worth of data it had collected, BBOXX structured
asset-backed notes called distributed energy asset
receivables. These notes represent a bundle of customer
contracts. Their value is based on future receivables
on the customers’ contracts. The initial pool of notes
consisted of 2,400 customers with a low risk of default
based on repayment history. Oikocredit bought the first
issuance for 52 million Kenyan shillings ($508,000), which
gave BBOXX enough capital for about 1,200 solar home
systems.
http://bit.ly/2eTRyUs
BOX 12
30 Creating Markets for Climate Business: An IFC Climate Investment Opportunities Report

allowing consumers to use behind-the-meter storage systems to reduce
electricity costs and better manage peak loads.125
S T E P 5 : E N H A N C E S U P P O R T I N G P O L I C I E S
Encourage microfinance for customers and suppliers. Governments
can support microfinance independently or by arranging financing
with multilateral institutions and managing it through domestic
programs. Under the microfinance model, households and businesses
may take out a small loan from a bank to cover the cost of renewable
energy equipment. For example, the Renewable Energy Microfinance
and Microenterprise Program initiative by Arc Finance offers small
loans that have benefited more than 1 million people across Haiti,
India, Kenya, Nepal, and Uganda by supporting the sale of 200,000
distributed renewable energy products.126
Provide training opportunities to ensure successful deployment of
mini-grids and distributed energy storage. The Massachusetts Energy
Storage Initiative recommends that the state, national government, and
electricity regulators educate city and educational institutions, electricity
distribution companies, and energy managers about policy options and
savings opportunities available through distributed storage, especially
when paired with time-of-use pricing.127 For solar and mini-grid
deployment, education and training is also essential. IRENA offers an
online training platform called Project Navigator that provides guidance
on how to develop bankable renewable energy projects, including mini-
grids and solar home systems.128
I N N O VAT I V E F I N A N C I N G M O D E L S
In addition to implementing supportive policies, innovative financing
models can help unlock private investment in solar power. Traditionally,
most solar home system business models were based on equity
financing. But as off-grid solar business grows, their capital needs are
changing, and they are increasingly seeking international grants and
equity financing to address the high costs of local debt. One solution
being advanced is US-India Clean Energy Finance, a project preparation
facility that aims to provide access to energy in underserved regions of
India by supporting early-stage distributed solar project development.
A partnership between the Indian Ministry of New and Renewable
Energy, the Overseas Private Investment Corporation, and a consortium
of foundations, the initiative provides project preparation support that
will catalyze long-term debt financing for distributed solar power. The
Climate Policy Initiative serves as the program manager.129
Larger players are using the debt market to raise capital. Off Grid
Electric, which operates in Rwanda and Tanzania, raised $45 million in
December 2015 through a debt facility, with capital from the Packard
Foundation, Ceniarth, the Calvert Foundation, and USAID, among
others.130 Nova Lumos in Nigeria secured a $50 million debt facility
from the Overseas Private Investment Corporation in November 2016.131
More tested businesses can move towards securitizing assets, which helps
lower the cost of capital and opens up opportunities to attract/leverage
additional investment. In 2015, in a first of its kind, PAYG company
BBOXX managed to securitize its off-grid solar assets and raise more
than $500,000 through a Dutch investor, Oikocredit (see Box 12). While
it remains relatively new and small in scale, securitization can provide
the necessary financing tool for larger PAYG and distributed energy
service companies to access debt financing and diversify risk.
31Off-Grid Solar and Storage

To support growth of the off-grid solar industry, IFC
launched Lighting Global. This program supports
market development by reducing risk for businesses
in this sector and encouraging private sector
investment through quality assurance, market
intelligence, and business support. It has teams in 10
countries: Afghanistan, Bangladesh, Ethiopia, India,
Kenya, Myanmar, Nigeria, Pakistan, Papua New
Guinea, and Tanzania.
The program created an internationally recognized
quality assurance standard for solar systems and
products up to 350 watts—the Lighting Global
BOX 13
Quality Assurance framework. This standard ensures
performance for buyers, users, and investors in the
sector, reducing risk and catalyzing competition
and innovation. The International Electric Technical
Commission has adopted these standards, and
country governments are now adopting it as a
minimum standard to import products. More than 23
million Lighting Global quality-verified products have
been sold since 2008, eliminating over 25 million
metric tons of greenhouse-gas emissions.
Lighting Global is the primary information source for
the sector. It produces industry sales information,
charts the industry’s development (the Market
Trends Report), and convenes a biannual meeting
for the industry (the Global Off-Grid Solar Forum
and Expo). These publications and events have
made IFC an authority on the sector, and investors,
new company entrants, donors, and established
companies in the sector rely on Lighting Global
products to inform investment and strategy.
www.lightingglobal.org
Lighting Global: Developing the off-grid solar industry
32 Creating Markets for Climate Business: An IFC Climate Investment Opportunities Report
33Off-Grid Solar and Storage

Scaling Solar brings together a suite of World Bank Group services under a single engagement aimed at creating viable markets for solar power. The “one-stop shop” program aims to make privately funded grid-connected solar projects operational within two years and at competitive tariffs.
www.scalingsolar.org
Lighting Global is the World Bank Group’s platform to support development of commercial markets for modern energy services for the more than 1.2 billion people in the world without access to electricity.
www.lightingglobal.org
The International Energy Agency (IEA) works to ensure reliable, affordable and clean energy for its 29 member countries and beyond, and has a wealth of data, policy perspectives, technology roadmaps and outlook reports on renewable energy.
www.iea.org
Sustainable Energy for All (SE4ALL) is a global initiative led by the former Secretary-General of the United Nations, Ban Ki-moon to achieve universal energy access, improve energy efficiency, and increase the use of renewable energy.
www.se4all.org
The International Renewable Energy Agency (IRENA) is an intergovernmental organisation that supports countries in their transition to a sustainable energy future, and serves as the principal platform for international cooperation, a centre of excellence, and a repository of policy, technology, resource and financial knowledge on renewable energy.
www.irena.org
The Global Off-Grid Lighting Association (GOGLA) is a neutral, independent, not-for-profit association created to promote clean, quality off-grid lighting solutions that benefit society and businesses in developing and emerging markets.
www.gogla.org
The Global Solar Council (GSC) is an international organization founded in 2015 to coordinate the efforts of the world’s solar energy associations.
www.globalsolarcouncil.org
The Energy Sector Management Assistance Program (ESMAP) is administered by the World Bank Group, and focuses on increasing the knowledge and technical capacity of low- and middle-income countries to achieve a sustainable energy solution.
www.esmap.org
The Global Lighting and Energy Access Partnership (Global LEAP) is the Clean Energy Ministerial’s energy access initiative, and is led by the U.S. Department of Energy.
www.globalleap.org
SIDSDOCK is an initiative of the Alliance of Small Island States to provide the small island developing states with a collective institutional mechanism to assist them transform their national energy sectors.
www.sidsdock.org
The Global Network on Energy for Sustainable Development (GNESD) is a United Nations Environment-facilitated network of Centers of Excellence dedicated to improving energy access for the poor in developing countries.
www.gnesd.org
The Regulatory Indicators for Renewable Energy (RISE) is a global policy scorecard that assesses policy and regulatory frameworks for energy access, energy efficiency and renewable energy.
http://www.worldbank.org/en/topic/energy/publication/rise---regulatory-indicators-for-sustainable-energy
The Islands Energy Program is an initiative of the Rocky Mountain Institute supporting the development of more than 20 off-grid projects in the Caribbean islands.
www.rmi.org/our-work/global-energy-transitions/islands-energy-program/
2.4 Initiatives, tools, and resources
34 Creating Markets for Climate Business: An IFC Climate Investment Opportunities Report

Climate-Smart Agriculture
35

Over one third of all food that is grown is wasted.
148 NDCs include agriculture in their targets.
We have seen a doubling of meat consumption over the past 40 years.
Food demand is expected to increase 20% over the next 15 years, driven by the developing world. This will require increasing food production 70%.
36 Creating Markets for Climate Business: An IFC Climate Investment Opportunities Report
Key indicators

37
Key indicators
Climate-Smart Agriculture

Climate-Smart Agriculture
productivity in livestock agriculture—generating more meat and milk
per animal—through a combination of genetics, feed substitutes and
supplements, and improved farm operations. This leads to lower
methane emissions per animal. The second focus area involves helping
farmers to grow more food with fewer inputs through innovative
practices such as precision agriculture, efficient irrigation, and
optimizing the amount of fertilizer used. The third focus area involves
helping clients to reduce post-harvest food losses, improve food security,
and boost incomes by investing in improved warehouses and silos,
cold storage facilities, better logistics and distribution, and consumer
education programs.
Companies, communities, and governments share an interest in creating
markets for climate-smart agriculture. Governments are incorporating
climate-smart policies and support measures into broader public policy,
expenditure, and planning frameworks at all levels of government.
Climate-smart agriculture requires coordination between agencies across
different sectors (agriculture, energy, infrastructure, environment, and
finance), and close partnerships with farmers’ groups and the private
sector. Securing land rights also provides an enabling environment for
investments in sustainable water and land management. For the private
sector, an integrated approach to providing incentives has shown
promise, as have financial innovations like warehouse receipts and
weather-based, or index, insurance. Through the World Bank Group’s
Making Climate Finance Work in Agriculture initiative, investors
and financial institutions are learning how to invest in climate-smart
3.1 Summary
The agriculture sector drives many economies, but must evolve to meet
growing food demand while adapting to a changing climate. The global
population is expected to reach 9 billion by 2050, and food demand is
estimated to increase by 20 percent globally over the next 15 years, with
the greatest increases projected in Sub-Saharan Africa, South Asia, and
East Asia.132 In addition, the sector will be negatively affected by climate
change—with floods, droughts, heat waves, wild fires, and rising sea
levels threatening farmers and businesses along the entire supply chain.
Food and agriculture are a $5 trillion global industry that represents
10 percent of consumer spending and 30 percent of greenhouse-gas
emissions.133 Since 2004, global investments in the sector have grown
threefold to more than $100 billion in 2013.134 Agriculture supports
about 500 million smallholder farmers. In developing countries, it
is the largest source of incomes and jobs.135 Therefore, boosting the
productivity, profitability, and sustainability of agriculture is essential for
fighting hunger, increasing jobs, and ensuring climate-resilient growth.136
Climate-smart agriculture is a set of practices and business models that
can help reduce emissions and build resilience. It aims to address both
food insecurity and climate change by improving resilience against
climate impacts, reducing greenhouse-gas emissions, and increasing
productivity in farming. The private sector is increasingly investing in
climate-smart practices and new business models. IFC has defined three
strategic focus areas. The first involves helping companies to enhance
38 Creating Markets for Climate Business: An IFC Climate Investment Opportunities Report

agriculture using new business models and finance mechanisms.137
Companies, communities, and governments share an interest in creating
markets for climate-smart agriculture. To provide a common framework
and provide incentives, governments are incorporating climate-smart
policies and support measures into broader public policy, expenditure,
and planning frameworks at all levels of government. One risk is a lack
of coordination between agencies across different sectors (agriculture,
energy, infrastructure, environment, and finance), farmers’ groups
and the private sector. Climate-smart agriculture creates a platform to
encourage this cooperation. There are also risks related to securing land
rights. Appropriate financing is also needed to deliver working capital
TA B L E 3 : N U M B E R O F C O U N T R I E S W I T H S U B S E C T O R I N C L U D E D I N T H E I R N D C
Region Agr
icu
ltu
re:
Gen
eral
Clim
ate-
smar
t ag
ricu
ltu
re
Agr
icu
ltu
ral
was
te
Live
stoc
k
Irri
gati
on
Cro
ps
Fert
ilize
rs
East Asia and Pacific 11 5 4 4 2 5 2
Europe and Central Asia 12 2 3 3 3 1 1
Latin America and Caribbean 19 6 4 7 4 3 2
Middle East and North Africa 8 11 4 3 5 2
North America 1
Oceania 1
South Asia 3 5 1 5 4 3 2
Sub-Saharan Africa 22 32 8 24 18 23 5
Western Europe 3
Total 79 61 24 46 36 35 15
(Source: World Bank, INDC Database; see indc.worldbank.org)
to farmers. Some of these solutions are likely to come, as countries
implement their NDCs (see Table 3).
3.2 Market snapshot and growth potential
Food demand is growing. The world’s population is expected to reach
9 billion people by 2050, with most growth occurring in developing
countries. This will lead to higher food demand. Rising income
levels will also raise demand for protein, processed food and other
agricultural products. Together, these trends might require raising
overall gross agricultural output by 50 percent by 2050 (Figure 6); in
select countries, production may need to nearly double.138 The Food
and Agriculture Organization projects that under a moderate 2050
39Climate-Smart Agriculture

$100 billion.142 Successful private investment in agriculture requires
a strong understanding of crops and geographies, as well as complex
local value chains that include agricultural machinery, seeds, fertilizer,
data providers, transport and logistics, food production and processing,
and retailing. There is a growing number of climate-smart agricultural
practices and technologies that range in effectiveness in emerging
markets; the successful scaling up of solutions will require knowledge of
the technical feasibility and economic viability of specific measures, as
well as identifying and addressing the risks associated with investment.
Agriculture contributes to—and is affected by—climate change.
Agriculture and forestry are major drivers of climate change, accounting
for up to 30 percent of global greenhouse-gas emissions.143 Most of
these emissions come from meat and milk production and the expansion
of agriculture into forested areas. Farmers across the globe are
experiencing more droughts, floods, and heat waves that are increasing
production variability and pushing already vulnerable populations into
poverty and potential climate migration, as farmers seek new sources of
income. Climate change also increases food price volatility, which drives
up food prices and increases the risk of food insecurity.
The World Bank Group describes climate-smart agriculture as an
integrated approach to managing landscapes—cropland, livestock,
forests, and fisheries—that addresses the interlinked challenges of
food security and climate change.144 Climate-smart agriculture aims to
achieve three outcomes:
1. Increased productivity: Produce more from existing farms to improve
food and nutrition security and boost the incomes of 75 percent of the
world’s poor, many of whom rely on agriculture for their livelihoods.
2. Enhanced resilience: Reduce vulnerability to drought, pests, disease, and
other shocks; and improve capacity to adapt and grow in the face of
longer-term stresses like shortened seasons and erratic weather patterns.
3. Reduced emissions: Pursue lower emissions for each calorie or
kilogram of food produced, avoid deforestation from agriculture, and
identify ways to store carbon.
economic growth scenario, global annual cereal production may need
to grow by 1 billion metric tons compared to 2005-07, while meat
production may need to grow 200 million metric tons to a total of
around 460 million metric tons.140
A thriving agricultural sector has been the basis for successful economic
growth in many countries. Investment in agriculture creates food
surpluses, keeps food prices low, and creates jobs for rural communities.
Europe, North America, and China have successfully followed this
development path. More recently, Vietnam, Latin America, and Sub-
Saharan African countries have focused on agriculture to grow their
economies.141 However, satisfying the world’s food needs requires
much greater private investment. Global investments in the food and
agribusiness sector tripled between 2004 and 2013 to more than
FIGURE 6: Global agricultural output growth and demand projections
1961–2012 2012–2050
WORLD HIGH-INCOMECOUNTIRES
LOW- & MIDDLE-INCOME
COUNTIRES
SOUTH ASIA &SUB-SAHARAN
AFRICA
LATINAMERICA &CARRIBEAN
0
100
200
300
400
Perc
ent
Source: Based on FAO (2017).139
40 Creating Markets for Climate Business: An IFC Climate Investment Opportunities Report

A growing number of companies are concerned that the effects of
climate change will disrupt their supply chains and their ability to grow
sustainably and profitably. In addition, more companies are making
commitments to reduce their impact on the environment by, for example,
integrating climate-smart agriculture into their business models, or
pledging to use only renewable energy. Agriculture input providers are
developing innovative technologies to increase production efficiency,
resilience, and yield. These technologies include precision agriculture
(such as use of drones, soil testing, sensors, efficient irrigation, and GPS-
enabled machinery) as well as improved animal nutrition and breeding
methods. Companies are also becoming more fully integrated with local
farmers by providing advice and solutions rather than inputs only. In
addition, some investors and large commercial banks are beginning to
establish strict criteria on what they can invest in.145
E F F I C I E N T A N I M A L P R O T E I N
Livestock consumes a large and growing volume of global natural
resources. The world’s 20 billion farm animals graze on roughly
30 percent of all terrestrial land, and one-third of cropland is devoted
to producing animal feed. Roughly one-third of the world’s freshwater
resources are used for livestock production and processing. Global
meat consumption has doubled over the past 40 years, and further
growth in meat and dairy consumption is expected as incomes rise and
urbanization accelerates, especially in developing regions.146
Methane from digestion is the main source of emissions from livestock,
and is especially high in developing countries. Emissions are influenced
by the quality of feed as well as the age and weight of livestock at
slaughter. These differences lead to a vast range of emissions between
regions. South Asian beef produces ten times more methane than
Eastern European beef on average, and methane emissions from milk
production in Sub-Saharan Africa are about ten times larger than
in Western European milk production, according to the Food and
Agriculture Organization.147
Improving animal productivity and health can reduce emissions while
creating attractive investment opportunities. The projected surge
in demand for meat in emerging markets creates opportunities for
IFC’s approach to climate-smart agriculture
IFC provides investments and advice that contribute
to the three pillars of climate-smart agriculture. It has
identified the following focus areas:
• Helping animal protein producers to increase their
productivity (reduce greenhouse-gas emissions per
kilogram of meat or liter of milk) through a wide
range of measures, including manure management,
improved nutrition and animal health, better genetics,
and other feed-to-food conversion efficiencies in
livestock and aquaculture.
• Precision agriculture through integrated agriculture
input suppliers (reduce greenhouse gases per unit
of land or food produced) as a platform to promote
precision farming technologies (such as soil testing,
water solutions, appropriate use of fertilizers, and
pest control) and financing to increase farmers’
productivity and resilience.
• Helping producers, traders, and processors to reduce
post-harvest waste and losses of food by, for example,
optimizing food transport logistics and developing
cold chain and storage infrastructure (including green
or EDGE-certified warehouses).
www.ifc.org/climatebusiness
BOX 14
41Climate-Smart Agriculture

Kingenta: An integrated solutions providerIn 2015, China indicated that it is targeting “zero
growth” in consumption of nitrogen and phosphate
fertilizers by 2020. In response, Kingenta, a leading
producer of nitrogenous and specialty fertilizer in
China, started transforming its business model from
a pure manufacturer of fertilizer to an integrated
solutions provider that supports farmers with high-
quality and locally tailored fertilizers, and advice.
IFC is investing $200 million to help Kingenta
implement a $1 billion program that will upgrade
10 conventional single-nutrient fertilizer plants to
produce higher efficiency/specialty fertilizers and
establish a platform of 300 crop-production service
centers across eight Chinese provinces. These
service centers will provide agronomic services and
farmer training, as well as increase the adoption
of soil testing and precision farming practices,
thereby improving crop productivity and reducing
input waste. These investments will help promote
appropriate use of fertilizer to mitigate nitrogen
and phosphate overuse, reducing related impacts
on soil quality, groundwater, and greenhouse-gas
emissions.
The project expects to increase crop productivity
across 3.8 million hectares of land farmed by 3 million
farmer families. Yields are expected to improve
by between 10 percent and 40 percent as farmers
gain direct access to quality inputs, training, and
climate-smart farming practices. In addition, these
investments may reduce 377,000 tons of equivalent
carbon dioxide per year through appropriate
fertilizer.
www.ifc.org
BOX 15
42 Creating Markets for Climate Business: An IFC Climate Investment Opportunities Report

companies in meat production and supporting industries such as
livestock, feed, and vaccines. Making feed conversion more efficient and
climate-smart, so that animals produce more meat while consuming the
same amount of feed, is a profitable opportunity for companies that
specialize in genetics, feeding, fertility, and farm management.
I N C R E A S I N G F O O D P R O D U C T I V I T Y
Depleting natural resources, climate change, and reduced agricultural
productivity are negatively affecting growth in the global food supply.
For example, by 2030, the gap between anticipated water withdrawals
and existing supply may reach 40 percent.148 This puts pressure on
governments and business to innovate, by expanding to new locations
and applying tools and practices that lead to “precision agriculture.”
Emissions from agricultural soils have been growing rapidly, particularly
in developing countries. Manure is a valuable agricultural input,
especially in developing countries, where the cost of synthetic fertilizers
is relatively high. Spreading manure on cropland helps to increase
soil fertility and stabilization, increase water retention capacity,
reduce erosion, and increase microbial density. However, manure also
contributes to greenhouse-gas emissions: methane is produced when
manure is stored, and nitrous oxide is released when manure is spread
on croplands. Strategies to reduce emissions from manure include
capturing and using methane as biogas, and preventing methane-
producing conditions. Sealing manure and collecting and burning
methane for heat or electricity is another effective option. Composting
manure also reduces greenhouse-gas emissions.149
Fertilizer has significantly increased agricultural productivity and
helped reduce the pressure on forests, but over-application of fertilizer
is wasteful, polluting, and emissions-intensive. Fertilizer demand was
roughly 187 million metric tons in 2016, up by 30 million metric
tons from 20 years ago, and is projected to grow at about 1 percent
per year to 2030.150,151 Appropriate application of fertilizer leads to
improved yields, especially on irrigated land. But over-application
results in excessive greenhouse-gas emissions and other environmental
consequences like eutrophication, where water runoff from fields causes
an excessive build-up of nutrients in water bodies, leading to dense plant
growth and depleted oxygen levels. The likely explanations for excessive
use of fertilizer include a lack of knowledge and training, subsidized
fertilizer prices, and poverty-driven risk aversion.
Precision agriculture aims to improve productivity and address
emissions from fertilizer and energy use by observing, measuring, and
responding to site-specific conditions. It may involve:
• Precision application of fertilizers (for example, using data from
sensors, soil tests, and satellite measurements to inform which type,
how much and where fertilizer should be applied).
• Use of waste biomass for energy (for example, rice husk gasification)
and as cover crops.
• Improved energy efficiency (for example, reducing diesel use by
tractors/pumps/equipment). Solar pumps, when combined with drip
irrigation systems, offer a low-carbon way to access water. However,
the uptake has been slow. To expand the use of solar pumps, the
initial investment cost needs to be reduced and subsidies for electricity
addressed.152
• Improved water efficiency (through, for example, drip or precision
irrigation, or laser leveling of soil). The adoption of modern micro-
irrigation technologies like drip irrigation not only reduces the
amount of water needed per unit of food produced, but also decreases
a farm’s reliance on chemical fertilizers and facilitates low- or no-till
farming.
• Drought-, salt-, and heat-tolerant seeds can help reduce the effects of
climate change on farmers.
R E D U C I N G F O O D LO S S E S
Global food losses are enormous. The Food and Agriculture
Organization estimates that about a third of all food that is grown
is lost due to infestation, spoilage, waste, ineffective processing and
transport, inefficient logistics, and consumer preferences/waste.153
This is equal to 1.3 billion metric tons of wasted food, which results
in emissions of more than 4 metric gigatons of equivalent carbon
43Climate-Smart Agriculture

dioxide—an amount greater than all countries, other than the United
States and China, emit annually.155
Improved transport and storage are greatly reducing food losses.156
Reducing food waste in emerging markets is a large investment
opportunity, particularly in logistics and transport. In China alone,
the cold storage and transportation market generates $12 billion to
$18 billion in revenues; this market is expected to grow by between
10 percent and 15 percent annually to meet the country’s expanding
food demand.157 Given that most food loss and waste in developing
countries occurs during production and after it is harvested, the
greatest potential for reduction is investment in infrastructure related
to storage, transport, cold chains, and distribution, together with
skills development.158 Commercial farms are increasingly replacing
traditional storage spaces made from locally available resources like
mud bricks, wood, or straw with modern storage facilities, which tend
to be illuminated, ventilated, and equipped with screens and moisture
barriers.159 Opportunities to extend food shelf life and improve
packaging to reduce downstream waste also exist.
Investment in cold storage and warehouses is growing rapidly, driven
by China and India. The total capacity of refrigerated warehouses
was 600 million cubic meters in 2016, an increase of 8.6 percent since
2014. According to the Global Cold Chain Alliance, this was driven
by considerable new construction in emerging markets, especially
China (30 million cubic meters) and India (10 million cubic meters).160
Globally, the cold chain market is projected to reach $271 billion by
2022, with an annual growth rate of 7 percent.161 Technology advances
in cold storage are helping to phase out hydrofluorocarbons—a potent
greenhouse gas—and reduce energy consumption. Technology advances
are also allowing use of cold storage in warmer climates.162
Policies and practices to reduce post-harvest food loss
• Evaluate opportunities to reduce food waste along the
value chain, taking into account infrastructure needs
and bottlenecks and the need to invest in new storage
facilities.
• Set a standard for reduction in food waste; establish
targets and plans of action to achieve them.
• Provide appropriate technologies (such as storage
containers and sealed bags).
• Introduce training programs for value chain actors
for packaging, processing, post-harvest handling, and
distribution.
• Raise consumer awareness via food labeling (sell
by/use by dates) and introduce social awareness
campaigns to promote consumer reduction in food
waste.
• Provide incentives for investments in systems to
redistribute food and reuse discarded food.
• Improve data collection and knowledge sharing on
food waste among value chain actors.
Source: World Bank154
BOX 16
44 Creating Markets for Climate Business: An IFC Climate Investment Opportunities Report

1 2 3 4
• Use the NDCs as a
platform for integrating
climate change in
agricultural sector
planning
• Secure land/property
rights, export-ready
food standards and
extension services are
key enablers
• Infrastructure build-out
should be strategic—via
targeted investment
in a specific crop’s
value chain, in a
“breadbasket” region,
or in an infrastructure
corridor
• Consider climate
resilience up
front to mitigate
potential weather-
related damage to
infrastructure
• Price support and
energy subsidies should
be directed to practices
that recognize and
reward climate-smart
agriculture
• Fertilizer subsidies can
be climate-smart if they
increase yield
• Water pricing,
technology support and
awareness raising can
address water waste
• Establish agribusiness
centers to provide
farmers with
appropriate
technologies, peer
exchange and extension
services
• Actively engage the
private sector through
creation of partnerships
and dedicated outreach
efforts
• Work with international
and local agribusiness
and banks on access to
finance
MAINSTREAM CSA INTO NATIONAL POLICIES AND SECTOR DEVELOPMENT PLANS
DEVELOP AN AGRICULTURE DEVELOPMENT PLAN THAT INCLUDES INFRASTRUCTURE
ADDRESS INEFFICIENT PRICE AND SUBSIDY REGIMES
PROMOTE FARMER OUTREACH AND TRAINING
FIGURE 7: Steps to create markets for climate-smart agriculture
45Climate-Smart Agriculture

3.3 Creating markets for climate-smart agriculture
The majority of agricultural investments are not yet climate-smart, and
data on private investments in agriculture and information on their
sustainability are lacking.164 Accelerating investment in climate-smart
agriculture will require agreement across government, the private sector,
farmers’ groups, and agricultural scientists. National policies create
enabling conditions for agricultural investment. Key policy actions
include removing inefficient public subsidies and food pricing programs;
establishing rural credit, land tenure rules, and property rights;
supporting research and extension services; offering innovative financing
models like warehouse receipts; and fostering new insurance models like
weather-based crop (index) insurance.
S T E P 1 : M A I N S T R E A M C L I M AT E - S M A R T A G R I C U LT U R E I N T O N AT I O N A L P O L I C I E S A N D S E C T O R D E V E LO P M E N T P L A N S .
This requires engaging ministries of finance, planning and energy to
work with their agricultural and environmental counterparts. The
NDCs provide an important platform for integrating climate change
into agricultural sector planning. The commitments made in NDCs can
promote climate-compatible development and reduce poverty in the
agriculture sector. They can also provide an opportunity for groups of
countries to develop regional climate-smart policies, recognizing the
common challenges that they face.
Different levels of government will need to play distinctive roles to roll
out climate-smart agriculture investments. While the national government
usually serves as regulator, funder, and provider of scientific information,
local govern¬ments need to help promote climate-smart agriculture by
mobilizing and supporting farmers and adapting regulations to align
with local circumstances. Setting up learning platforms and extension
programs—rather than ad hoc consulta¬tions—is important for delivering
and refining climate-smart programs over time.165
Enabling factors that encourage climate-smart agriculture include secure
land/property rights, good transport infrastructure, regulations and fiscal
Kenya: Integrating climate change into agricultural sector planning
Several lessons can be drawn from Kenya’s
mainstreaming of climate change into its national
planning and development strategies during a 2012
update to its National Development Plan. It used
the most up-to-date socioeconomic, geographic,
and climatological information to assess risks and
vulnerabilities to develop mitigation and adaptation
scenarios. “Champions” were identified in key ministries,
including the Ministry of Planning, the Ministry of Energy,
and the Ministry of Environment. A cost-benefit analysis
and other tools were used to prioritize actions, and
existing initiatives were reviewed to determine how
they could incorporate climate considerations. This built
on practitioners’ familiarity with the subject matter
and minimized learning costs. It also framed climate
change as a cross-cutting issue, rather than exclusively
an environmental one, which built a constituency of
support for climate-smart activities. Finally, it monitored
results and outcomes so that lessons could be used when
new opportunities for climate mainstreaming arose. The
result was a more integrated approach to mitigation
and adaptation, which may serve as a model for other
countries.
Source: McFetridge & Murphy, 2012; Mitchell & Maxwell, 2010163
BOX 17
46 Creating Markets for Climate Business: An IFC Climate Investment Opportunities Report

policies that incentivize climate-smart investment, adoption of food laws
and standards that allow for export, and agricultural extension practices
to train farmers on climate-smart methods.
S T E P 2 : A D D R E S S I N E F F I C I E N T G O V E R N M E N T P R I C E A N D S U B S I D Y R E G I M E S .
Governments often maintain prices through subsidies for inputs
such as fertilizer, energy, water, and seeds. The Food and Agriculture
Organization recommends that price support and energy subsidies
recognize and reward climate-smart practices, and enable value addition,
commercialization, and trade. For example, input subsidies designed
to support a more efficient and timely use of fertilizers.166 Fertilizer
subsidies can be climate-smart if they increase yield and enhance
plant growth and the storing of carbon in the soil. However, to ensure
precision fertilizer application, the price support should be accompanied
by training and improved access to reliable information on rainfall.167
Subsidizing energy use in farms may lead to negative climate impacts, by
contributing to overuse of water in water-scarce areas. Inadequate water
regulation and pricing lead to water waste, contributing to drainage and
salinity problems in irrigation-dependent countries. These issues can
be addressed through water pricing (where appropriate), support for
technologies, and awareness raising.168
S T E P 3 : D E V E LO P A F O C U S E D A G R I C U LT U R A L S E C T O R D E V E LO P M E N T P L A N T H AT A D D R E S S E S I N F R A S T R U C T U R E .
In many countries, poor infrastructure limits investment in climate-smart
agriculture.169 Governments can address this obstacle by concentrating
investment on infrastructure in a “breadbasket” region (a major cereal-
producing region), or in a particular infrastructure corridor. Mali, for
example, is considering a pilot breadbasket program for its Sikasso
region. The initiative aims to raise cereal production by 60 percent
through a combination of yield increases and limited expansion onto
new land. There will also be strong support for export development,
new roads and warehouses, and measures for climate mitigation and
adaptation (such as water harvesting and locally adapted drought-
Uruguay: More efficient agriculture production at a rapid pace
Uruguay has long been at the forefront of managing
and conserving natural resources, particularly soils.
Uruguayan producers, supported by public policies and
research, use many climate-smart practices. For dairy
production, the majority of practices are focused on
water distribution throughout the property and the use
of supplementary irrigation in strategic areas of the dairy
farm (on about 10 percent of the total area). In the case
of rain-fed agriculture (soybean, maize, wheat), given
that more than 70 percent of the area is cultivated by
medium and large companies, climate-smart practices
such as direct seeding and land-use management
plans have higher levels of adoption. Integrated crop
management is the most common climate-smart
practice for intensive vegetable production (citrus,
deciduous plants, horticulture). It includes techniques
for soil, pests, and disease management that help
stabilize and/or increase production and reduce use of
agrochemicals.
Source: World Bank170
BOX 18
47Climate-Smart Agriculture

middlemen perform important roles in linking small-scale farmers
to markets or providing inputs appropriate for local crop and soil
conditions. Governments and donors rarely have the local knowledge or
capacity for these jobs. International trading companies can contribute
technologies and management skills, while also buying commodities.
I N N O VAT I V E F I N A N C I N G M O D E L S
Access to sufficient financing is vital to create markets for climate-
smart agriculture, as farmers often do not have access to credit because
financial institutions see them as high risk. Implementing climate-smart
agriculture often involves upfront investments that take time to result
in productivity gains, and market premiums for sustainable produce
rarely provide sufficient margins to fund climate-smart programs.175
Improved access to long-term finance is especially important in tree crop
cultivation, where replacing older trees with newer, higher-yield varieties
may lead to short-term revenue losses. A range of publicly supported
incentives, regulations, extension programs, and market access can
unlock investment.
International investors also have concerns about foreign exchange rate
risk when considering agribusiness investments in emerging markets.
The Climate Finance Lab is piloting the Long-Term Foreign Exchange
Risk Management instrument, which will provide tools to address
currency and interest rate risk for climate-smart agriculture projects in
developing countries.176
Warehouse receipts systems—whereby inventory credits can be written
for inventory or products held in storage—are an effective way to enhance
agricultural livelihoods and reduce post-harvest losses. When backed
by appropriate policy frameworks,177 they allow stored produce to be
used as collateral, and inventory credits can then be sold, traded, and
used as financial instruments. This mobilizes credit to farmers, smooths
out market prices, increases the market power of farmers (who can sell
produce when they want), reduces agricultural risk, and reduces post-
harvest losses as farmers seek out better storage conditions.178 IFC’s
Global Warehouse Finance Program is extending this concept (Box 20).
resistant seed).171,172 Another approach is an agricultural development
corridor, in which commercial farms and facilities for storage and
processing are concentrated around a major infrastructure project.173
Agriculture depends heavily on infrastructure: road, rail, ports,
equipment, and buildings. However, any infrastructure investment
needs to be made climate-resilient. To reduce the impact of extreme
weather events on infrastructure, governments have successfully
developed preventative actions and instruments tailored to the region.
This includes long-term plans that consider the redesign, relocation, and
rebuilding of major agricultural transportation routes, while landscape
planning considers integrating irrigation systems with natural wetlands
and waterways that act as buffers against climate shocks.174
S T E P 4 : P R O M O T E O U T R E A C H , T R A I N I N G , A N D C E N T E R S O F E X C E L L E N C E .
Establish agribusiness centers to provide farmers with appropriate
technologies, training, and information. These centers of excellence can
be part of existing government agriculture extension services, or new
entities established to help farmers to learn practices from one another,
and can also create economies of scale by aggregating, for example,
collection and storage from multiple farms. They also allow for the
rapid spread of new ideas, technologies, and business models related
to climate-smart agriculture. The centers can partner with financial
institutions to offer farmers inventory credit. In addition, governments
can facilitate climate information services—often via mobile phones—
to help smallholder farmers and agribusiness better manage weather
variability, particularly rainfall changes. To foster improved on-farm
weather monitoring and reduce risk, governments can provide timely
weather information.
Governments are attracting investment in climate-smart agriculture by
engaging the private sector through partnerships and outreach efforts.
Private sector groups to be consulted include smallholder farmers,
input suppliers, warehouse operators, buyers, traders, and international
trading companies. In addition, domestic financial institutions can
be educated on the business models for climate-smart agriculture
to identify opportunities to increase investment. Dealers and other
48 Creating Markets for Climate Business: An IFC Climate Investment Opportunities Report

M O R O C C O ’ S P L A N V E R T
Morocco’s Green Plan (“Plan Vert”) is an integrated
approach to providing incentives for climate-smart
agriculture. It takes a dual approach to addressing
water scarcity in its river basins. In irrigated areas,
Plan Vert provides incentives for improving water
management and conservation and for integrating
national value chains with international markets.
In rain-fed areas, it increases access to social
services and supports participatory natural resource
management initiatives. It also supports replacing
arable crops with more drought-tolerant ones such
as olive trees. Plan Vert is implemented through a
range of policy measures, and it receives support for
specific technical innovations.
BOX 19
C O LO M B I A
Colombia has focused on integrated landscape
planning within a broader strategy for sustainable
agriculture and forestry. A mix of policies and
incentives has resulted in sustainable increases in
livestock productivity by encouraging landscape-
based mixed agriculture/forestry systems. The
objective is to introduce trees and improved pasture
in livestock grazing lands. This improves fodder and
shade, lowers heat stress for animals, and reduces
soil degradation. Results have included increased
meat and milk yields, improved water infiltration,
increased bird populations, reduced methane
emissions, and greater capture of carbon dioxide.
Z A M B I A
The Zambian government provides technological
advice to farmers, supplemented by modest
support for producers to help them overcome
the upfront costs of moving to sustainable land
management practices in cropping and livestock.
Five climate-smart techniques are being used:
retaining crop residues; concentrating tillage and
fertilizer application in a permanent grid of planting
basins or series of planting rows; completing land
preparation in the dry season; weeding aggressively
to reduce plant competition; and intercropping/
rotating nitrogen-fixing legumes on 30 percent
of the cultivated area. While these practices are
delivering significant benefits, barriers continue to
prevent adoption—pointing to the continued need
for training and institutions.
Governments creating positive environments for investment in climate-smart agriculture179
49Climate-Smart Agriculture

Climate finance innovations can also contribute to investment. Countries
are working with international financial institutions and donors
to explore how financiers in developing countries can partner with
climate finance investors to further their investments in climate-smart
agriculture. They are experimenting with blended finance (concessional
or below market rates), innovative risk management tools (including
credit scoring and the use of artificial intelligence), first loss and partial
risk guarantees, new investment vehicles that meet the risk-return profile
of different investors, and bonds.180 These efforts are helping to connect
food companies, climate finance investors, and governments with
domestic and international financial institutions, as many farmers and
agribusinesses are willing to adopt new practices and technologies but
lack the necessary capital to do so.
Index-based insurance supports climate-smart agriculture by protecting
lenders and providers of agricultural outreach products against weather
events. Index-based, or parametric, insurance uses an independently
developed index, typically weather-related for agricultural application,
to predetermine payouts for clearly defined hazards. This ensures
that claims are paid out quickly. Domestic policy is often needed to
facilitate this type of insurance; governments can help by regulating
index insurance under domestic law and supporting the needed data
infrastructure (see Box 20).
50 Creating Markets for Climate Business: An IFC Climate Investment Opportunities Report

Enabling access to finance for farmers
T H E G LO B A L WA R E H O U S E F I N A N C E P R O G R A M H E L P S FA R M E R S I N A F R I C A
In 2017, IFC, together with the Global Agriculture and
Food Security Program, invested $5 million in risk-
sharing facilities with partner banks in Rwanda and
Tanzania to finance farmer cooperatives. The money
enables farmers to buy higher-quality agricultural
inputs, produce food crops, and provide working
capital for the aggregation and storage of harvested
crops during the post-harvest period.
The World Food Program arranges input supplies
(including seeds, fertilizer, and crop protection)
and crop insurance. IFC is also providing advice to
farmers in partnership with World Food Program
partners, including the Alliance for a Green
Revolution in Africa. The project aims to benefit
more than 65,000 local smallholder farmers to
increase their productivity through practices that
contribute to climate-smart agriculture. More
importantly, through this initiative, IFC will be
helping farmers access markets through the offtake
contracts from the World Food Program and other
platform partners.
An early success has been in Burkina Faso. The
agricultural sector employs 80 percent of Burkina
Faso’s active population, with cotton being the
most important crop. The sector is being negatively
affected by climate change, including higher average
temperatures, more severe dry seasons, and
increased frequency of crop diseases. Recognizing
this, the government prioritized climate-smart
practices in its NDC. IFC and the World Food
Program have helped farmers to access finance to
increase production while conserving land by using
rain-fed water storage and climate-smart irrigation
techniques, which are expected to raise yields by
up to 30 percent. The investment will also avoid
production losses through more efficient collection
and storage. The project will result in a sustainable,
more resilient supply of cotton to SOFITEX, the
country’s largest producer.
T H E G LO B A L I N D E X I N S U R A N C E FA C I L I T Y
The Global Index Insurance Facility (GIIF) is a
dedicated World Bank Group's program that
facilitates access to finance for smallholder farmers,
micro-entrepreneurs, and microfinance institutions
by providing catastrophic risk transfer solutions and
index-based insurance in developing countries. It
has facilitated more than 1.5 million contracts, with
$151 million in sums insured, covering about 6 million
people, primarily in Sub-Saharan Africa, Asia, and
Latin America and the Caribbean.
Providing access to finance for the vulnerable,
insurance is an important tool to address poverty.
Unfortunately, agricultural insurance and disaster
insurance are either unavailable or prohibitively
expensive in many developing countries.
Index insurance is an innovative approach to
insurance provision that pays out benefits on
the basis of a predetermined index or loss of
assets and investments resulting from weather
and catastrophic events, without requiring the
traditional services of insurance claims assessors. It
also allows for the claims settlement process to be
quicker and more objective. Funded by the European
Union, Germany, Japan, and the Netherlands, the
Global Index Insurance Facility is managed by the
World Bank Group as part of the Finance & Markets
Global Practice.
www.ifc.org
BOX 20
51Climate-Smart Agriculture

3.4 Initiatives, tools, and resources
The Food and Agriculture Organization (FAO) is a specialized agency of the United Nations that leads international efforts to defeat hunger. Climate-smart agriculture is one of the 11 corporate areas for resource mobilization under the FAO’s strategic objectives; as such, FAO offers a variety of outlooks, data, and policy tools to countries seeking to advance solutions.
www.fao.org
CGIAR is a strategic alliance of countries, international and regional organizations and private foundations that was established in 1971 to disseminate the knowledge of agricultural science to benefit developing countries. Its Research Program on Climate Change Agriculture and Food Security addresses the increasing challenge of global warming and declining food security on agricultural practices, policies and measures.
www.cgiar.org
The Global Alliance For Climate-Smart Agriculture (GACSA) is an inclusive, voluntary and action-oriented multi-stakeholder platform on CSA hosted by the FAO.
www.fao.org/gacsa/en/
The International Food Policy Research Institute (IFPRI) is an international agricultural research center founded to improve the understanding of national agricultural and food policies to promote the adoption of innovations in agricultural technology.
www.ifpri.org
The International Fund for Agriculture Development (IFAD) is an international financial institution and a specialized agency of the United Nations dedicated to eradicating poverty and hunger in the rural areas of the developing world.
www.ifad.org
The World Food Programme is the food-assistance branch of the United Nations and the world's largest humanitarian organization addressing hunger and promoting food security.
www1.wfp.org
The Adaptation of African Agriculture (AAA) was started upstream of COP22 and aims to reduce the vulnerability of Africa and its agriculture to climate change.
www.aaainitiative.org
The World Business Council for Sustainable Development's Low Carbon Technology Partnerships initiative (LCTPi) is a joint public and private initiative to accelerate low-carbon technology development. CSA is one of the solutions that the WBCSD and its member companies have identified as critical to reach climate stabilization.
www.lcpti.wbcsd.org
Champions 12.3 is a coalition of executives from governments, businesses, international organizations, research institutions, farmer groups, and civil society dedicated to inspiring ambition, mobilizing action, and accelerating progress toward achieving Sustainable Development Goal Target 12.3 by 2030.
https://champions123.org
The Climate-Smart Agriculture 101 guide provides a comprehensive set of recommendations, tools, and resources to help countries implement climate-smart agriculture.
https://csa.guide
The World Bank Group has developed a series of country-specific profiles and tools to advance climate-smart agriculture.
http://www.worldbank.org/en/topic/climate-smart-agriculture
The Global Cold Chain Alliance represents all major industries engaged in temperature-controlled logistics, and works to reduce food waste and loss throughout the value chain.
www.gcca.org
52 Creating Markets for Climate Business: An IFC Climate Investment Opportunities Report

Green Buildings
53

ESCO markets were $24 billion globally in 2015.
Green buildings investment was $388 billion in 2015, and green buildings are at least a 3.4 trillion opportunity through 2025.
86 countries target energy-efficient buildings in their NDCs.
Building energy efficiency needs an additional $296 billion a year to meet climate targets; the biggest opportunities are in developing countries.
54 Creating Markets for Climate Business: An IFC Climate Investment Opportunities Report
Key indicators

55
Key indicators
Green Buildings

in 2016 reached $406 billion, with an incremental investment of
$133 billion, a 12 percent increase from 2015.184
Countries and cities must map out their own pathways. Understanding
the local context is essential for identifying the appropriate policies, such
as improving building design, to create a market for green buildings.
A blend of regulatory, financial and voluntary interventions will address
risks and support greater investment. Voluntary green building rating
systems have paved the way for mandatory regulations by increasing
awareness among professionals, consumers, and policymakers.
Examples from around the world show that financial incentives (such as
low interest rate loans, tax reductions, and subsidies) and non-financial
incentives (such as expedited permitting and green certification) are
having a positive effect. These positive results can be reinforced by
governments enforcing building codes, embedding energy-efficiency
practices, and mandatory benchmarking of energy use. Businesses are
responding with new business models, such as green mortgages and
energy service companies (ESCOs). As countries implement the buildings
and demand-side efficiency targets in their NDCs, they can address some
of these issues (Table 4).
4.2 Market snapshot and growth potential
Resource-efficient building practices are helping economies move onto
a greener development path. Green building is the practice of creating
and using more resource-efficient and environmentally friendly models
4.1 Summary
Urbanization presents a large opportunity for green buildings. Today’s
buildings generate 19 percent of energy-related greenhouse-gas
emissions and consume 40 percent of electricity globally.181 By 2050,
the built environment is expected to double182 due to high population
growth and urbanization trends. Most of this growth will occur
in emerging markets, particularly in middle-income countries. The
adoption of resource-efficient “green” building practices offers a chance
to secure emission cuts at a low cost and lock in energy and water
savings for decades.
Most of the growth in the global building market is expected to come
from developing countries, driven by growing populations, urbanization,
and increased incomes.183 The rapid growth in construction in these
countries, along with the urgency of mitigating climate change, makes
green buildings an important solution. In 2015, investment in green
buildings was mainly in Organisation for Economic Co-operation
and Development (OECD) countries—70 percent in the G7 countries
alone. But the building market is also growing in China and India,
accounting for 19 percent and 2 percent of investment in green buildings
respectively.
IFC sees a $3.4 trillion green buildings investment opportunity through
2025 in key emerging markets, driven by policies, technology advances
and increased awareness. Total investment in energy-efficient buildings
Green Buildings
56 Creating Markets for Climate Business: An IFC Climate Investment Opportunities Report

of construction, renovation, operation, maintenance, and demolition.
Green construction offers a chance to secure emission cuts at a low cost
and lock in energy and water savings for decades. While environmental
pressures are compelling reasons to build responsibly, green buildings
create additional benefits. Operational savings quickly recover capital
costs; renewable energies reduce infrastructure investment; innovative
products stimulate job creation; and reduced reliance on fossil fuels
leads to energy security.
About $388 billion of the $4.6 trillion spent on construction was
invested in green buildings in 2015. Global investment in energy-
efficient buildings in 2015 was $118 billion, up 9 percent from the
previous year.185 Most of this investment was in developed countries,
as well as in China and India, which accounted for 19 percent and 2
percent respectively.186
Markets for constructing buildings are expected to grow fastest in the
Asia-Pacific region, led by China. Figure 8 shows the expected growth
in building stock between 2014 and 2024; with China at over 40
percent of new buildings, followed by India at 8 percent. This creates
an opportunity to create new markets for green buildings, driven by
the increased uptake of green practices, standards and technologies in
new construction. Among building types, the residential sector shows
highest growth potential—this means that market creation efforts will
need to be tailored, given that codes and standards are easier to apply
to commercial buildings than more dispersed, smaller players in the
residential construction market.
M A R K E T O P P O R T U N I T I E S F O R G R E E N B U I L D I N G S
Expected growth in emerging markets creates a large opportunity
for green buildings. The sector is expected to grow at 1.2 percent
annually, and most of this growth is expected in residential buildings in
developing countries, particularly in Asia.187 IFC’s EDGE Program (See
Box 21) recently analyzed green buildings market growth and found a
TA B L E 4 : N U M B E R O F C O U N T R I E S W I T H S U B S E C T O R I N C L U D E D I N T H E I R N D C
(Source: World Bank, INDC Database; see indc.worldbank.org)
Region BuildingsDemand-side efficiency:
Buildings
East Asia and Pacific 11 3
Europe and Central Asia 8 2
Latin America and Caribbean 9 6
Middle East and North Africa 10 7
North America 1 0
South Asia 3 2
Sub-Saharan Africa 11 13
Total 53 33
57Green Buildings

• The rest of Africa is expected to see high construction growth,
particularly in residential buildings. While the green buildings market
is nascent, South Africa, Kenya, and Ghana are establishing sizeable
markets. For the region, IFC found $4 billion in commercial green
buildings potential and $13 billion in residential sector opportunities,
for a total of $17 billion.
• South Asia is dominated by India, which is experiencing very high
construction rates. IFC conservatively estimates a $12 billion
commercial market and a $76 billion residential market through
2025.
• East Asia will be dominated by China, which is seeing high
construction growth as well as ambitious green building policies.
The total regional investment opportunity is over $3 trillion through
$3.4 trillion investment opportunity through 2025 in 36 countries (see
Figure 9).189 Regional highlights include:
• In Latin America, green buildings markets are established in Brazil,
and are taking off in Argentina and Colombia, leading to a forecast of
$80 billion in green buildings opportunities through 2025, with
$70 billion in residential and $10 billion in commercial construction.
• In Eastern Europe, there is a contraction of the building stock, so
IFC’s analysis focused only on new buildings. Projected markets for
new green construction are at $42 billion through 2025, with
$13 billion for commercial and $28 billion for residential buildings.
• In the Middle East and North Africa, IFC found $13 billion in
opportunity in Egypt, Jordan and Morocco, split between the
commercial ($2 billion) and residential sector ($11 billion).
Multi-unit residential
Single family detached
Residential buildings (71%)Oce
Retail
Education
Healthcare
Hotels & restaurants
Institutional/assembly
Warehouse
Transport
Commercial buildings (29%)
44%
8%2%10%
15%
5%
7%0%
5%4%
ChinaIndiaOECD (Asia Pacific)Rest of Asia PacificNorth America
Western EuropeLatin America
Eastern EuropeMiddle EastAfrica2014 2024
BUILDING STOCK BY GEOGRAPHY
2%3%5%8%
15%
21%
7%
7%5%
28%
2%3%5%8%
14%
20%
7%
6%5%
29%
China(2.1%)
Asia-Pacific(1.7%)
NorthAmerica(0.9%)
W. Europe(0.4%)
Total CAGRGrowth(1.2%)
172 Bn m2
151 Bn m2
SHARE OF NEW CONSTRUCTION BY GEOGRAPHY SHARE OF NEW CONSTRUCTION BY BUILDING TYPE
Asi
a Pa
cifi
c (4
6%)
Asi
a Pa
cifi
c (4
8%)
45%
27%
4%
4%
9%
1%4%
1% 4% 1%
Note: CAGR = compound annual growth rate (Source: Navigant Research (2015), Global Building Stock Database (Square Meters)188
FIGURE 8: Medium-term market outlook for the building sector
58 Creating Markets for Climate Business: An IFC Climate Investment Opportunities Report

2025, split between $726 billion for commercial and $2.4 trillion for
residential buildings.
Building envelopes make up the largest share of investments in green
buildings. They constitute the physical barrier between the interior and
exterior of the building, where energy-efficient insulation, reflective
coatings, windows, and doors can improve performance. Several
cost-effective low-tech solutions and clever architectural designs are
becoming increasingly popular. Examples include natural ventilation,
which reduces reliance on mechanical ventilation, and increased indoor
vegetation, which cools the building while reducing its carbon footprint.
In developing countries, the biggest opportunity is in new buildings with
green envelopes.191
Falling prices of technologies like LED have resulted in a rise in
energy-saving lighting, but the market remains largely untapped. The
International Energy Agency estimates that only 1 percent of the
potential energy savings have been achieved in lighting.192 The United
Nations Environment Programme estimates that there were still 7 billion
incandescent lights in use in 2016, providing huge growth potential for
energy-efficient lighting. Growing penetration of LEDs will continue to
reduce unit costs.
Energy-efficient heating, ventilation, and air conditioning are a $76 billion
global market. This amounted to nearly 28 percent of total investment in
energy-efficient buildings in 2015, with incremental investment of
$27 billion.193 Demand in emerging markets for cooling is growing
rapidly from a small base: in India, for example, around 5 percent of
homes have air conditioning.194 District cooling195 is emerging as a way to
provide centralized cooling to a large population, saving energy, reducing
costs, and improving efficiency.
FIGURE 9: Emerging market green buildings potential
(Source: IFC’s EDGE Program190; Map: World Bank)
Middle East$13 billion opportunity in
3 countries
Eastern Europe$40 billion opportunity in new
green build, more in retrofitsSouth Asiaconservative estimate of
$90 billion opportunity
East Asia$3 trillion opportunity,
driven by Chinese market
Latin America$80 billion opportunity
Sub-Saharan Africa$16 billion opportunity
59Green Buildings

Green buildings market creation: A priority for IFC and the World Bank Group
IFC’s Green Buildings Market Transformation
Program helps to create a virtuous cycle of supply
and demand for resource-efficient building design,
construction and ownership. The aim is to set a
metrics-driven definition of what constitutes a
green building, reward property developers for
building green, increase regulatory pull, and promote
direct investment. Following is IFC’s strategy to
promote green building growth:
1. An enabling environment of
supportive government policies that
raises the bar through increasingly
greener building codes. Governments
can provide the right mix of incentives
to the private sector and raise public
awareness about the benefits of green building
ownership. IFC offers expertise on government
policy reform.
2. A metrics-driven definition through the EDGE green building standard and scalable certification system that focuses on a minimum
achievement of less energy, water and embodied
energy in materials. The standard is verifiable and
leads to demonstrated reductions in utility costs.
3. The identification of low-cost, high-return design
options through easy-to-use software that
encourages architects and engineers to choose
the best design practices and solutions, combined
with a fast, inexpensive certification system to
verify that the standard has been met.
4. Direct investment in IFC’s own green buildings
portfolio, mobilization through its banking
partners, and support for new product development such as green mortgages,
green bonds and green construction
financing. EDGE can be used to streamline
eligibility procedures and the reporting
needs of financial institutions as they move
towards green investment portfolios.
5. A collection of evidence that building green is
profitable for all parties in the ecosystem. This
can best be achieved through a network of global
champions and certification entities who support
the verification, rewarding and collection of data
for proof of concept reporting.
www.edgebuildings.com
BOX 21
Investing in buildings and
materials
Supporting new products for financial institutions
Government regulations and
procurement
EDGE
Edge certification
system
60 Creating Markets for Climate Business: An IFC Climate Investment Opportunities Report

The energy efficiency of buildings could be improved by up to nearly 70
percent by enhancing building envelopes and using high-performance
equipment.196 This requires coordination between national and local
policies and across the entire value chain in the building sector. Policy
measures will need to be complemented by investment in research and
development and innovative business models.
I N N O VAT I V E B U S I N E S S M O D E L S
ESCOs have emerged as a key business model for improving energy
efficiency in buildings. ESCOs improve energy efficiency in buildings
through energy-savings projects. They typically invest in energy-efficient
technologies for commercial buildings and earn royalties on the energy
savings without owning the building. Generally, the energy savings that
their interventions generate are used to pay back their investment, with
the ESCO bearing the risk if energy savings do not materialize. Royalties
and ownership of the energy-efficient upgrades are negotiated using
energy performance contracts.
ESCOs are particularly prominent in China, with Chinese ESCO
revenues at $13 billion, U.S. revenues at $6 billion, and European
Union revenues at $3 billion in 2015. This made up the bulk of total
global ESCO revenue, which totaled $24 billion that year. ESCO
revenues increased by 7 percent in both China and the United States in
2015. Income from energy performance contracts is exempt from tax
for the first three years in China, which has increased the feasibility
of ESCOs.197 In 2015, the Indian government launched Energy
Efficiency Service Limited, the largest public ESCO in the world,
to initiate projects and help unlock the country’s energy-efficiency
market, estimated at between $10 billion and $35 billion.198 The
Una Jyoti by Affordable LEDs and Appliances for All program has
been instrumental in the growth of India’s LED market. As the ESCO
market matures, the potential exists to expand such contracting and
business models globally.
EDGE certification in Ghana: The Exchange Complex
Designed by Dar Al-Handasah and HOK Architects, The
Exchange Complex was the first EDGE-certified hotel
complex in Ghana. Located close to Kotoka International
Airport, the project was financed and developed by UK
development finance institution CDC and private equity
fund Actis in partnership with Mabani Holdings. The 98,000
square-meter development is currently under construction,
with an estimated completion date of July 2018.
The Exchange Complex features office and residential
buildings, retail space and public outdoor space. The
property includes an EDGE-certified Radisson Blu hotel,
underscoring the commitment of brand owner Carlson
Rezidor in promoting green buildings in Sub-Saharan
Africa. More than 100 of the apartments in the complex
will be EDGE-certified, with residents benefiting from a
28 percent reduction in monthly utility bills due to low-E
coated glass, energy-saving lighting systems, low-flow
plumbing fixtures and efficient air-conditioning systems.
www.edgebuildings.com
BOX 22
61Green Buildings

The sector is segmented by income and building types, and the type of
players, opportunities and technology, policy, and market instruments
needed to construct green buildings are markedly different depending
on the location and type of building. When creating a market, it is
important to consider the different roles of the various stakeholders,
including national and local government, utilities, and market players
like builders and project developers.
Countries or cities can map out their own policy pathways.
Understanding the local context is essential for identifying the correct
policies. For example, if the growth in new buildings is substantial, there
4.3 Creating markets for green buildings
A blend of regulatory, financial, and voluntary interventions will address
barriers that prevent greater private investment in green buildings,
including voluntary rating systems, building codes, tailored financial
incentives and greater action by utilities.
I M P O R TA N C E O F LO C A L C O N T E X T
The segmented nature of the building sector has hindered the
development of green buildings, especially in large developing countries.
(Source: IFC Analysis)
FIGURE 10: Interventions based on type of housing
TOWNSHIPS PRIVATE SECTOR LOW INCOME/SOCIAL RURAL & INFORMAL
Green bonds, financial
support for sustainable
urban infrastructure, green
standards incorporated
in developers' guidelines,
policies and mandatory
green building regulations
Incentives through financial
institutions using products
such as green mortgages,
voluntary green buildings
certification, regulations
and green construction
finance for developers
PPPs, incentives/subsidies
for green technologies (for
example, solar heating and
lighting), green building
standards and training
and capacity building for
housing boards
Access to low-cost
materials, skills/capacity
building, provision
of power, water and
sewage infrastructure,
disaster protection and
microfinance for low-cost
materials/construction
Number of homes
Scale and type of housing
62 Creating Markets for Climate Business: An IFC Climate Investment Opportunities Report
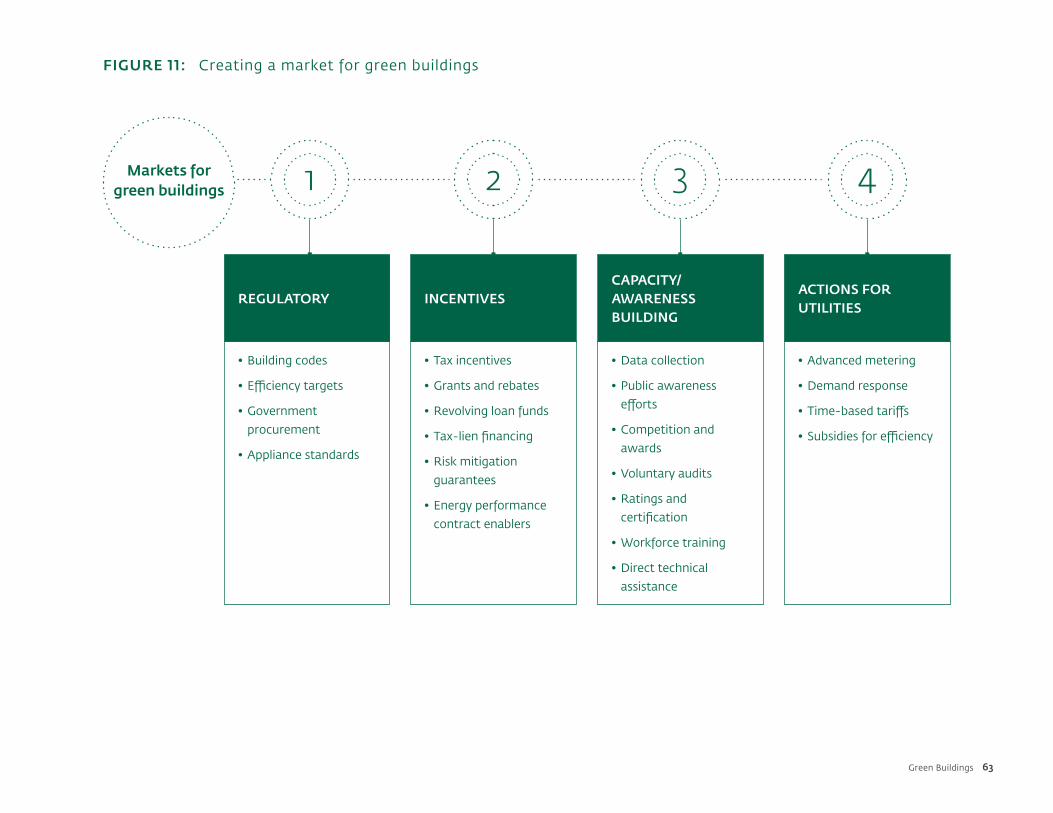
FIGURE 11: Creating a market for green buildings
1 2 3 4
• Building codes
• Efficiency targets
• Government
procurement
• Appliance standards
• Data collection
• Public awareness
efforts
• Competition and
awards
• Voluntary audits
• Ratings and
certification
• Workforce training
• Direct technical
assistance
• Tax incentives
• Grants and rebates
• Revolving loan funds
• Tax-lien financing
• Risk mitigation
guarantees
• Energy performance
contract enablers
• Advanced metering
• Demand response
• Time-based tariffs
• Subsidies for efficiency
REGULATORYCAPACITY/AWARENESS BUILDING
INCENTIVESACTIONS FOR UTILITIES
Markets for green buildings
63Green Buildings

IFC’s role in developing Jakarta’s building codeIndonesia is one of the world’s largest greenhouse-
gas emitters, with its building sector accounting for
more than a quarter of the country’s total energy
use in 2004—and this share is expected to rise to
nearly 40 percent in the next two decades. Jakarta’s
provincial government has set a target to reduce
its greenhouse-gas emissions by 30 percent by
2020 and approached IFC to help it develop a green
building code.
The code sets energy and water-efficiency
requirements for large commercial and high-rise
residential buildings. It applies to both new and
existing buildings, but with different requirements.
Compliance with the code is mandatory and
integrated into the building permit application
process for this particular property market segment.
Implementation of the code is expected to reduce
energy consumption in large commercial and high-
rise residential buildings by between 17 percent and
36 percent, potentially cutting about 2.7 million
tonnes of equivalent carbon dioxide per year by
2020.
To soften the impact of the increased first cost,
the government is considering financial and other
incentives. IFC is also setting up investment facilities
through other financial institutions to finance the
construction of new buildings meeting or exceeding
the green building code requirements. These facilities
could finance construction loans for developers as
well as “green mortgages” for buyers.
www.ifc.org
BOX 23
64 Creating Markets for Climate Business: An IFC Climate Investment Opportunities Report

is greater room for policies on making new buildings green as opposed
to policies on retrofitting. Central mandates such as building codes
may be effective for offices and urban townships, but are likely to be
expensive and ineffective for informal housing, where local solutions
could be implemented. Identifying simple, low-cost measures to promote
green building, such as improving the design of building envelopes,
could be a cost-effective way to encourage growth in the market.
Policy and market interventions should be targeted to the local situation
and reflect input from key stakeholders. Opportunities to increase
“green” elements exist at each stage of a building’s life. Policies play an
important role in aligning various stakeholders’ interests.
S T E P 1 : D E V E LO P R E G U L AT O RY T O O L S .
Regulatory tools can be a mixture of building codes, efficiency
improvement targets, and minimum energy performance standards for
lighting and appliances.
Building codes can be an effective way to increase a building’s energy
efficiency.199 Codes and standards can set minimum thresholds for
energy performance for new or existing buildings. These often require
certification or have equivalent standards to certification programs.
For example, the European Union will require that all new buildings
be nearly zero energy from 2021 onwards.200 In India, the adoption
of building energy codes is increasing, with 23 of 36 Indian states and
territories having either adopted (or are in the process of adopting)
the country’s Energy Conservation Building Code.201 Building codes
can be implemented both at the national and subnational level, can be
mandatory or voluntary, and must be tailored to local conditions. The
national or provincial government usually sets the code, while local
governments are responsible for adapting and implementing them.
Minimum energy performance standards can shift producer and
consumer behavior towards energy-efficient technologies. Lighting is a
relatively simple product that makes up a large share of energy use, and
so is often one of the first technologies targeted, with several countries,
including Brazil, the Philippines, and Venezuela, aiming to phase out
incandescent lightbulbs.202,203,204 By 2012, 33 countries had lighting
policies in place.205 Such policies have been aided by the dramatic
decline in LED bulb prices.206
Energy performance labels compare electricity and water use against
a national or local benchmark to encourage property owners to adopt
green technologies or retrofits. Efficiency standards and labeling for
appliances now operate in more than 80 countries, covering more than
50 different types of appliances and equipment in the commercial,
industrial, and residential sectors.207 India introduced energy-efficiency
labeling in 2006 for air-conditioning units. The market share of five-star
products increased from 1 percent in 2008 to 21 percent in 2014 as
consumers switched to more efficient products.208
S T E P 2 : B U I L D C A PA C I T Y A N D AWA R E N E S S .
Lack of reliable data and awareness about energy efficiency and green
building can hinder the design of successful policies and efforts to
create a viable market. Availability and transparency of data on energy
consumption in buildings can enable owners, operators, and tenants to
make informed energy management decisions and aid in better policy
and program design. Voluntary audits can identify the technologies
and building structures that drive energy consumption and suggest
improvements.
Development of green building benchmarks can be accelerated through
ratings and certification programs. These programs help organize
building data into a standardized format that can be used to develop
a building benchmarking scheme, which is crucial for differentiating
buildings in the real estate market. Competitive awards for building
developers could spur the development of benchmarks by rewarding
best performers. Singapore’s Green Market Certification Scheme and
the Green Market Award have been instrumental in the Building and
Construction Authority’s push to develop a benchmark and green
building master plan.
Green building certifications positively influence decisions to buy real
estate. There is a high demand among buyers for green buildings as they
may benefit from utility bills that are up to 20 percent lower. Green
buildings also tend to have a higher resale value. In the United States
65Green Buildings

Energy-efficiency loan guarantees in Bulgaria209
Instituted with the help of the World Bank and the Global Environment Fund, the Energy Efficiency and Renewable Sources Fund (EERSF) provides loans at interest rates of between 5 to 10 percent for up to seven years. A minimum equity investment of between 10 and 25 percent is required from project developers, depending on the proposed financing model. The EERSF has also developed a portfolio guarantee for ESCOs that can cover up to 5 percent of potential defaults.
Green Mark incentive scheme, Singapore210
This scheme includes a cash incentive for upgrading and retrofitting that co-funds up to 50 percent (capped at $3 million) of the costs of installation of energy-efficient equipment and professional services in existing buildings. It also has an energy audit to determine the efficiency of the air-conditioning plants. The Singapore Building and Construction Authority funds 50 percent of the cost for conducting the energy audit.
Tax incentives fro building energy-efficiency investment in Moscow211
Russian taxpayers are entitled to a three-year exemption on corporate property tax for newly introduced energy-efficient systems such as air conditioners, elevators, and computer technology. For tax purposes, investments in energy-efficient equipment can also qualify for accelerated depreciation at twice the standard rate.
Building retrofit program, Seoul212
Through the Building Retrofit Program, the Seoul Metropolitan Government provides low-interest loans to buildings and ESCOs to reduce costs. The Seoul government offers eight-year loans at an annual interest rate of 1.75 percent for up to $1.87 million for each project.
Thailand's Encon revolving loan fund213
The Thai government introduced the Encon Revolving Loan Fund to enhance investment in energy-efficiency measures buildings. It was financed by a levy of $0.001/liter on petroleum products and provides low-interest loans to energy-efficiency projects, including ESCOs.
Free energy efficiency retrofit program for low-income families in Houston214
The city partnered with electricity distribution company CenterPoint to offer free energy-efficiency retrofits to low-income families. The utility hired contractors to do the work, leading to cost savings for families.
Qualiverde Program in Rio de Janeiro215
Under the Qualiverde Program, projects with the certification are eligible to receive tax incentives, property tax reductions, or exemptions from some local building regulations.
TA B L E 6 : E X A M P L E S O F F I N A N C I A L I N C E N T I V E S
(Source: IFC, WRI Ross Centre for Sustainable Cities)
66 Creating Markets for Climate Business: An IFC Climate Investment Opportunities Report

and the European Union, green certified homes can sell for between
4 percent and 9 percent more.216 Green certification can also make
buildings eligible for lower interest rates and tax rebates or exemptions.
Direct technical assistance can help build expertise in policy
development, legal and governance frameworks, and implementation
and evaluation of projects. Accreditation systems of building
professionals, accredited training institutions for the construction labor
force, licensing and verifying the credentials of building professionals,
quality control processes for building materials, professional codes of
practice, and other locally meaningful regulatory packages can help
ensure compliance with building codes. For example, the National
University of Singapore provides formal training in energy management
through its Singapore Certified Energy Manager Program. Singapore
also has an accreditation scheme for ESCOs to enhance services.
Governments can use public sector construction to develop experience
in green building through direct technical assistance and workforce
training. Projects to construct green buildings help increase the skills
of people involved in the project and, once complete, the buildings can
be used to showcase green technologies to architects and the public.
Governments can also use these building projects to dispel financial
concerns by making the capital and operating costs publicly available.
Customer preferences can also be shifted through education and
awareness programs. Lighting can be an easy win, because energy-
efficient technologies often have the lowest lifetime cost. China’s Green
Lights Program includes disseminating information about efficient
lighting through mass media outlets and displaying their products to
familiarize shoppers with energy-efficient options.
S T E P 3 : P R O V I D E TA R G E T E D I N C E N T I V E S .
Low interest rate loans from government can support investment.
Such schemes have been introduced in Austria, Germany, Japan, the
Netherlands, South Korea, and Switzerland.217 In Lebanon, the Central
Bank, supported by the European Union, provides subsidized loans to
small businesses that want to invest in saving energy.218 A €14 million
grant from the European Union unlocked $128 million in investment,
Punjab National Bank Green Construction Bond
As part of its Eco-Cities Program for India, IFC invested
nearly $76 million in green bonds issued by Punjab
National Bank to help construct green residential
buildings. The bank, which is one of India’s largest
housing finance companies, uses the funds to finance
residential projects based on recognized green building
standards, including EDGE. The bank’s green bond is the
first issuance designated to green buildings in India and
IFC is the sole investor. The investment helps the bank to
develop a committed green lending practice and grow its
green loan portfolio.
www.ifc.org
BOX 24
67Green Buildings

the majority of which went into green buildings.219 Risk mitigation
guarantees can help lower the cost of investing in green buildings and
energy-efficient technologies.
Grants and subsidies for green building projects, green retrofits, and
ESCO business models are effective in fostering investment. China offers
a 30,000 yuan reward for buildings with a three-star certification or a
subsidy of 45 yuan per square meter for a two-star certified building.
Chinese subsidies for ESCOs have resulted in energy savings and the
reduction of over 130 million tons of carbon dioxide per year.220
Tax incentives continue to serve as a primary motivator for investors in
green building. In China, income from energy performance contracts is
tax exempt for the first three years and then has a reduced rate for three
years.221 In the United States, property and corporate tax reductions
have encouraged private investment.222
S T E P 4 : E N C O U R A G E U T I L I T I E S T O TA K E A C T I O N .
Utilities enhance the energy efficiency of buildings, especially in urban
areas. As service providers for energy and water, they have direct
relationships with consumers and can collect energy and resource usage
data, which are crucial in making buildings more efficient. They can also
enhance building efficiency by controlling resource use through pricing
and tariff mechanisms.
Revenue decoupling shifts utility behavior from a focus on sales to a
focus on service provision. It involves disassociating a utility’s profit
from its sales and instituting a variable rate of return to meet revenue
targets. According to the Center for Climate and Energy Solutions, 14
states in the United States have implemented revenue decoupling for
electric and gas utilities.
Modulating tariffs through measures like time-based tariffs can
help change consumption habits, especially for large consumers.
Utilities can further encourage these tariffs by investing in smart grid
infrastructure such as advanced metering and demand response. It
could also encourage the market of ESCOs and demand response
companies to evolve.
Direct financial assistance like utility public benefit funds and on-bill
financing can help investment in energy efficiency in buildings. Utilities
could include a small, additional cost to the utility bill that is used to
finance energy-efficiency projects. More sophisticated programs like
on-bill financing can help individuals repay their investment in energy
efficiency on their utility bills. Mexico, for example, has a program that
allows individuals to repay their energy-efficient refrigerator through
their electricity bill. The program is set up so that households should
save more on energy each month from the refrigerator than they pay to
repay the loan.223
Utilities can also encourage the market for ESCOs to take off through
partnerships or by providing financial rebates for energy-efficiency
measures. Since 1990, ESCOs have delivered $30 billion in infrastructure
improvements for greater energy efficiency in the United States alone.
About one-third of ESCO projects in the public and institutional sectors,
which make up 80 percent of all projects, used utility rebates that
provided roughly 16 percent of the total project cost.224
I N N O VAT I V E F I N A N C I N G M O D E L S
In addition to the various forms of financial incentives discussed,
instruments such as green construction bonds, green mortgages, and
green mortgage-backed securities could be used.
The green bond market is maturing and emerging as a potential
source of financing in the real estate market (see final section of this
report). Projects qualifying as green could range from new buildings to
retrofitting and refinancing existing buildings.225 Building rating systems
such as Leadership in Energy and Environmental Design, Building
Research Establishment Environmental Assessment Method, or IFC’s
EDGE could be used to assess the eligibility of green projects.
Financial instruments geared towards individuals offer promise. Possible
instruments include home improvement loan instruments like the
energy-efficient mortgage or green mortgages, green rewards, green
building insurance, and a green building certification pricing break.
Green mortgages allow users to finance the incorporation of energy-
efficient technologies and designs into existing or new buildings through
a reduced utility bill.
68 Creating Markets for Climate Business: An IFC Climate Investment Opportunities Report

As the green debt market matures, green mortgage securities are
emerging. The underlying assets are mortgages, loans, and other debt
instruments. In 2016, Obvion, a wholly owned subsidiary of Rabobank
in the Netherlands, issued the first green residential mortgage-backed
securities, backed by residential loans on new and retrofitted energy-
efficient houses.226
Financial innovations are also targeting green refurbishment and
affordable housing. For example, the Low Carbon Workplace
Fund finances the refurbishment of existing buildings. The fund is
a partnership between the Carbon Trust, fund manager Columbia
Threadneedle Investments and property developer Stanhope. The
business model revolves around acquiring of commercial office buildings
and refurbishing them to high energy-efficiency standards, before leasing
them to commercial tenants. Further, Carbon Trust encourages the
occupiers to minimize their energy consumption and carbon emissions
by ensuring support for day-to-day performance. The fund has invested
in eight properties valued at over £200 million.227 Another innovative
financial solution targets impact investors for affordable housing. IFC
client International Housing Solutions has successfully blended catalytic
and commercial capital to build demand for low-cost green homes in
South Africa. By including such technologies as solar PV and smart
meters, it has achieved EDGE certification for thousands of its new
properties, enabling the real estate investment management company to
measure and market the benefits of its green residential portfolio.228
Outreach initiatives are also helping accelerate the development of a
global asset class for energy-efficiency investment in buildings. The
Investor Confidence Project, developed by the Environmental Defense
Fund is helping to accelerate the development of a global market
by standardizing the way in which energy-efficiency projects and
energy savings are calculated and measured. The project develops
consensus frameworks in the United States and in Europe to provide
a foundation for consistent, predictable, and reliable energy-savings
outcomes. Standardization is expected to increase deal flow and reduce
transaction costs.229
69Green Buildings

4.4 Initiatives, tools, and resources
The World Green Building Council is a coalition of green building councils from around the world with membership from organizations in 80 countries. It also represents over 30,000 property and construction companies.
www.worldgbc.org
The Green Building Performance Network (GBPN) was founded in 2010 with the mandate to advance knowledge and expertise globally on building energy performance and the structure to achieve it. It works with regional research partners in the United States, Europe, China and India.
www.gbpn.org
The International Energy Agency (IEA) works to ensure reliable, affordable and clean energy for its 29 member countries and beyond, and has a wealth of data, policy perspectives, technology roadmaps and outlook reports on energy efficiency in buildings.
www.iea.org
The WRI Ross Center for Sustainable Cities is the cities and urban development research arm of the World Resources Institute. Within the Ross Center, the Building Efficiency Initiative focuses on the building sector and efficient urban development.
www.wrirosscities.org
The UNEP Sustainable Buildings and Climate Initiative (UNEP-SBCI) is a partnership of major public and private sector stakeholders in the building sector working to promote sustainable building policies and practices.
www.staging.unep.org/sbci
The Global Alliance for Buildings and Construction (Global ABC) was launched at COP21 with the aim of fostering the development of appropriate policies for sustainable energy-efficient buildings, which allows a concrete value chain transformation of the sector.
www.globalabc.org
70 Creating Markets for Climate Business: An IFC Climate Investment Opportunities Report

Climate-Smart Urban Transport and Logistics
71
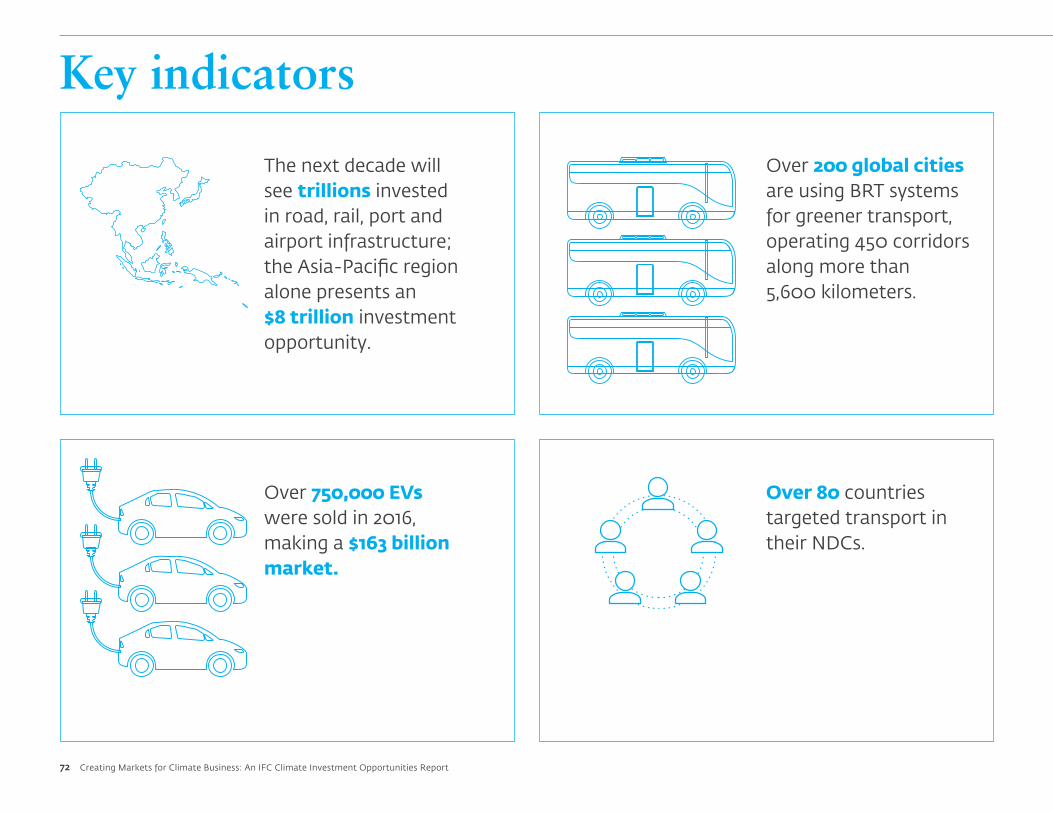
Over 750,000 EVs were sold in 2016, making a $163 billion market.
The next decade will see trillions invested in road, rail, port and airport infrastructure; the Asia-Pacific region alone presents an $8 trillion investment opportunity.
Over 80 countries targeted transport in their NDCs.
Over 200 global cities are using BRT systems for greener transport, operating 450 corridors along more than 5,600 kilometers.
72 Creating Markets for Climate Business: An IFC Climate Investment Opportunities Report
Key indicators

73
Key indicators
Climate-Smart Urban Transport and Logistics

more than 750,000 of them were sold in 2016 alone.233 Governments
are setting up mandates to accelerate the deployment of electric vehicles.
Governments are adopting an avoid-shift-improve strategy to address
the barriers to low-carbon urban transport. Avoid measures involve
reducing the need for commuting through urban planning, land-use
efficiency, and transit-oriented development strategies. Shift instruments
improve trip efficiency and encourage a shift towards public transport,
biking, and walking. Improve strategies enhance vehicle technology, fuel
efficiency, and transport infrastructure.
Clean air, reduced traffic congestion and resilient infrastructure are a
major government focus; NDCs and local policies aim to deliver these
solutions via investment in cleaner transport. Targeted policies are
encouraging climate-smart transport investments, growing markets, and
enabling private sector involvement. This is set to continue, with over
80 countries identifying the transport sector as an area of focus in their
NDCs (see Table 7).
5.2 Market snapshot and growth potential
Rapid urbanization in emerging markets presents transport challenges
and opportunities. By 2050, an additional 2.5 billion people are
expected to live to in urban areas.234 According to the International
Transport Forum’s Transport Outlook 2017, global demand for urban
mobility will be 95 percent higher in 2050 than in 2015, with a
185 percent increase in non-OECD countries. Global road freight
5.1 Summary
The next decade will see trillions of dollars invested in transport
infrastructure. Regionally, total investment in road, rail, port, and airport
infrastructure between 2016 and 2025 will be led by the Asia Pacific
(driven by China) at more than $8 trillion, with $5 trillion in roads and
about $2.3 trillion in rail.230 Investment in transport infrastructure is
expected to grow at an average annual rate of 5 percent, from
$557 billion per year in 2014 to $900 billion per year by 2025.231 Sub-
Saharan Africa will have the fastest average annual growth rate of over
11 percent, while Western Europe’s growth rate is expected to decline.
There are many private investment opportunities in transport. BRT
and light rail systems require infrastructure that is often financed and
operated by the private sector. Cities and mayoral initiatives are at the
forefront of greening urban transport and attracting private investment.
Transport accounts for about 18 percent of total human-caused
greenhouse emissions. BRT is proving to be an attractive low-carbon
option, especially in Latin America. Rail and light rail is also a highly
efficient low-carbon way of moving people in cities.
Tighter fuel efficiency standards, biofuel blending, and electric and plug-
in hybrid electric vehicles are driving decarbonization and saving money.
Doubling vehicle efficiency and enabling fuel switching for vehicles
with internal combustion engines could save $8 trillion cumulatively by
2050.232 Electric vehicles already represent a $163 billion market and
Climate-Smart Urban Transport and Logistics
74 Creating Markets for Climate Business: An IFC Climate Investment Opportunities Report

activity is also expected to more than double between 2016 and 2050.
Emerging market countries, particularly China and India, account for
90 percent of that increase.235
Making urban transportation and logistics sustainable will require
new thinking around urban design, infrastructure investment, energy-
efficiency technology, and business models. Figure 12 illustrates
that most developing country cities will require efficient cars and
new technologies, as well as new investment in public transport
infrastructure. Businesses are already responding with mobility and
logistics solutions that reduce trip lengths, reduce carbon emissions, and
enhance non-motorized transport options.
T E C H N O LO G Y T R E N D S A N D M A R K E T O P P O R T U N I T I E S
Fuel economy standards continue to drive vehicle efficiency. According
to the Global Fuel Economy Initiative, the average fuel economy of light
duty vehicles entering the market between 2005 and 2015 has shown
strong improvement globally. Turkey made the most progress, followed
by the United Kingdom and Japan.236 These improvements have been
driven by fuel economy standards and technology enhancements.
However, new light vehicles entering emerging markets were less
efficient than those entering industrialized countries. This presents an
opportunity to improve fleet efficiency in developing countries and drive
significant new investment.
TA B L E 7 : N U M B E R O F C O U N T R I E S W I T H S U B S E C T O R I N C L U D E D I N T H E I R N D C
Region Tran
spor
t:
Gen
eral
Tran
spor
tati
on
infr
astr
uct
ure
Pu
blic
tr
ansp
ort
Veh
icle
flee
t
Infr
astr
uct
ure
an
d ro
ads
Urb
an
tran
spor
t
BR
T
Tran
spor
t pl
ann
ing
East Asia and Pacific 18 5 10 6 4 3 2 1
Europe and Central Asia 8 2 3 4 3 1
Latin America and Caribbean 15 1 7 12 4 1 2
Middle East and North Africa 8 4 6 2 1 2
North America 1
South Asia 6 2 3 4 3 1 1
Sub-Saharan Africa 24 2 12 9 8 9 1 6
Western Europe 2 1
Total 82 10 39 40 25 17 6 11
(Source: World Bank, INDC Database; see indc.worldbank.org)
75Climate-Smart Urban Transport and Logistics

the developed world; Norway leads with a 29 percent market share,
followed by the Netherlands with more than 6 percent, and Sweden
with over 3 percent. China, France, and the United Kingdom have a
collective market share of nearly 2 percent.240
More countries are encouraging electrification of passenger cars. Electric
vehicle markets are expected to accelerate as a result of government
mandates, low-cost battery manufacturing, and investments in charging
infrastructure. Norway aims for all of its new car sales to be electric
by 2025, and is using a 25 percent VAT exemption to help achieve
this goal.241 France also recently announced that it would end sales of
gasoline-based vehicles by 2040. But electric vehicle ambitions are not
Electric vehicle sales are growing rapidly, led by China. Electric
vehicle markets are growing faster than anticipated. In 2016, annual
sales grew by 40 percent year-on-year to reach 750,000. Today, the
total global stock of electric vehicles exceeds 2 million. Annual sales
in China reached over 330,000, followed by 160,000 in the United
States, 215,000 across Europe, and most of the remainder in Japan and
Canada.238 About 60 percent of these sales were battery electric vehicles,
with plug-in hybrid electric vehicles making up the balance. China also
leads in the electrification of other modes, with 200 million electric
two-wheelers, up to 4 million low-speed electric vehicles, and more than
300,000 electric buses.239 Market penetration remains concentrated in
(Source: McKinsey)237
FIGURE 12: Type of cities and potential change in urban mobility
Popu
latio
n de
nsity
Quality of public transport
Car-dominated mature cities
Rising megacities
Mature advanced cities
Established megacities
LOW
HIGH
ADVANCEDDEVELOPING
Individual car ownership
Public transit
New mobility services
Walking and biking
High growth potential
Strong decline potential
Gradual growth
Gradual decline
Limited change
76 Creating Markets for Climate Business: An IFC Climate Investment Opportunities Report

limited to advanced economies. India recently announced that it will
only sell electric vehicles by 2030, and is working on a plan to achieve
this target.
Auto manufacturers are responding to these goals. Volvo expects to
build only electric or hybrid cars by 2019.242 The top 10 manufacturers
with electric car ambitions aim to sell between 9 million and 20 million
units by 2020. The International Energy Agency243 estimates that there
could be between 40 million and 70 million electric vehicles on the road
by 2025.
Accelerating electric vehicle production at this rate will require
significant new battery manufacturing capacity, equivalent to about 10
new Tesla-style “gigafactories.”244 Batteries have historically been a cost-
limiting factor for electric vehicles, but investment in battery technology
has led to a 65 percent drop in the cost of lithium-ion batteries since
2010.245 The rapid growth in public charging stations—increasing by
72 percent in 2016 to 320,000 globally—is helping address concerns
regarding the distances electric vehicles can travel.246 As a result, cities
are increasingly investing in buses and other electric transit solutions.
Electric vehicles also have a role to play in freight transport. Last-mile
freight transport tends to be the most inefficient leg of the journey,
but, especially with the rise of online shopping, demand is growing
significantly. Electric light duty trucks can significantly reduce air
and noise pollution, which could enable night-time deliveries and
decongest streets.247
BRT is a popular way to rapidly decarbonize intra-city public transport.
BRT has the largest ridership in Latin America, with more than 20 million
passengers a day, followed by Asia at about 9 million passengers a day.248
Europe’s BRT systems carry about 2 million passengers a day, with
Oceania and Africa each carrying about 420,000 people daily. Brazilians
use BRT the most, with nearly 12 million passengers per day across 33
cities using 124 BRT corridors. In total, 205 cities have a BRT system,
operating 450 corridors along more than 5,600 kilometers of road.
Light rail transit has growing private sector interest. Light rail transit
includes light rail, tram, monorail, metrorail, subway, airport rail links,
and other forms of passenger trains. It can be the backbone of a city’s
The city of Buenos Aires is creating markets for climate-smart transport and buildings
Buenos Aires accounts for nearly half of Argentina’s
GDP and hosts six million passengers traveling through
the city each business day. The city has embarked on
an ambitious $400 million transportation plan to boost
urban connectivity, decrease congestion, and ease
pollution by reducing the use of cars. With support from
a $50 million IFC loan, the city is building a new
3.5 kilometer BRT line connecting Paseo Colon to Avenida
Alem, one of the busiest traffic corridors in Buenos Aires,
as well as bus interconnection terminals. IFC funds are
also being used to create 88 new bike-sharing stations
and add 33 kilometers of dedicated bike lanes. IFC is also
advising the city to promote green buildings standards
and improve solid waste management, transport systems
and energy efficiency in public buildings.
www.ifc.org
BOX 25
77Climate-Smart Urban Transport and Logistics

Creating markets for light rail in Izmir, Turkey
Izmir, Turkey’s third largest city and its main port on
the Aegean Sea, is a vibrant city with nearly 4 million
inhabitants. In 2015, IFC and the Multilateral Investment
Guarantee Agency helped finance an extension of Izmir’s
light rail network. IFC provided a €12 million loan and
mobilized another €23.5 million through the Multilateral
Investment Guarantee Agency’s role as guarantor of a
parallel loan provided by ING Bank. Other lenders include
the French Agency for Development and the European
Bank for Reconstruction and Development.
The finance package, nearly €72 million in total, will
support Izmir Metropolitan Municipality’s work to
increase metro ridership through the acquisition of
85 light rail transit vehicles, adding capacity as new
stations are opened. IFC previously invested €55 million
and coordinated a further €110 million for two urban
tram lines in March 2014. The Multilateral Investment
Guarantee Agency issued more than €66 million in
guarantees to the commercial lenders on this project.
www.ifc.org
BOX 26public transit system, facilitate radial access to a city’s downtown
center, and complement other modes of public and private transport to
manage high-capacity routes. Globally, light rail systems carry up to 45
million passengers daily. Many systems are being planned and built in
the Middle East, North Africa, and Asia, and are being considered in
Latin America as a complement to the BRT system. Nearly 400 cities
around the world have a light rail system, operating 2,300 lines along
15,600 kilometers. In 2015, 850 kilometers of new track were under
construction, with a further 2,350 kilometers in planning.249
Green logistics can help reduce emissions from trucks, which generate over
40 percent of transport sector emissions in Africa, China, India, and Latin
America.250 The global logistics market is projected to reach $2.2 trillion by
2022, with the Asia-Pacific region accounting for 34 percent of revenue.251
Beyond fuel efficiency standards, green logistics can reduce emissions
significantly by restructuring supply chains, replacing a mode of transport
with another to make the first less congested, improving vehicle use and
energy efficiency, and decarbonizing the energy mix.252
I N N O VAT I V E B U S I N E S S M O D E L S
Ride-sharing platforms like Uber and Lyft have dramatically changed
personal transport. Ride sharing has a large market in major developing
countries. Didi-Chuxing in China and Ola in India are among the
top five ride-sharing companies in the world. Car-sharing business
models are attracting interest from car manufacturers and technology
companies. BMW’s DriveNow and Daimler’s Car2Go are helping reduce
the need for vehicle ownership.
Smart new forms of transport, such as shared mobility and autonomous
vehicles, are potentially revolutionary investment markets. Self-driving
vehicles provided a market worth $30 billion in revenue in 2014. This
is set to swell to $250 billion by 2030.253 Autonomous vehicles are
likely to be particularly compatible with another innovative trend:
the use of shared taxis and taxi buses (either manned or autonomous)
offering door-to-door shared transport.254 These systems, led by the
private sector, could significantly reduce emissions at a low cost, even
with the current reliance on internal combustion engine vehicles, and
are compatible with low-emissions alternatives such as electric vehicles.
78 Creating Markets for Climate Business: An IFC Climate Investment Opportunities Report

But bringing this technology to emerging markets could be hindered by
infrastructural and regulatory constraints.
The sharing economy is now being used to improve the fleet efficiency
of freight transport. Uber started a freight business recently and is
already drawing competitor start-ups like Doft and Convoy. In emerging
markets, where freight efficiency improvement has huge potential,
start-ups like Huochebang in China and BlackBuck in India are leading
the way in streamlining and maximizing fleet efficiency (see Box 27).
As fewer vehicles are needed with these smart shared mobility systems,
investment opportunities are likely to shift to smaller-scale, specialized
vehicle manufacturing and services and enabling infrastructure.255
5.3 Creating markets for climate-smart urban transport
Policymakers are approaching climate-smart urban transport through
a variety of means. At regional and national levels, the electric vehicle
market is being driven by mandates, initiatives, and related policies.
Municipal transit plans help policymakers evaluate and compare
public transit modes such as BRT and light rail. Their development,
construction, and operation are being cost-effectively delivered through
PPPs that unlock commercial finance and expertise.
Given the expected growth in vehicle ownership, technology alone will
not address the expected growth in greenhouse-gas emissions from
transport. Investment in road infrastructure is needed and continues
to attract private investment through PPPs (see Box 28). Continued
reliance on traditional modes of mobility will exacerbate congestion and
urban sprawl, despite growth in road access. As a result, NDC targets
are less focused on road infrastructure and more on vehicle fleets, public
transport, and fuel.
To address risks and barriers preventing greater private investment in
low-carbon transport, policymakers can adopt an avoid-shift-improve
strategy—a holistic and system-wide urban mobility solution. They can
also invest in PPPs and use tailored financing solutions.
Uber for trucks: IFC’s investment in Huochebang and BlackBuck
IFC Venture Capital recently invested in two start-ups in
e-logistics—Huochebang in China in 2016 and BlackBuck in
India in 2017. Huochebang has developed an online platform
that connects and coordinates truckers, shippers, and
service centers. It reduces empty miles and waiting times
between loads, making shipping more environmentally
friendly. At the end of 2016, it was working with 2.3 million
truckers and 350,000 shippers across about 1,000 service
centers in more than 360 Chinese cities. A China Daily
article reported that the Huochebang handles as much as
100,000 orders and processes up to $120 million in shipping
fees every day.256 Similarly, BlackBuck in India operates an
online marketplace to connect shippers to truckers seeking
work, while maximizing the load carried by the trucks. It
works with more than 100,000 trucks across 300 locations.
www.ifc.org
BOX 27
79Climate-Smart Urban Transport and Logistics

FIGURE 13: Creating markets for climate-smart urban transport
AVOID(Reduce or avoid the
need to travel)
SHIFT(Shift to more
environmentally friendly modes)
IMPROVE(Improve efficiency
and vehicle technology)
• Urban design
• Bike and walking lanes
• PPPs
• BRT and metro PPPs
• Travel demand
management
• Fiscal measures—
congestion and parking
pricing
• Regulated zero-emission
zones
• Removal of fossil-fuel
subsidies
• Progressive fuel economy/
emissions standards
• Differentiated taxes or
rebates
• Electric vehicles
• Investment in research and
development
• Automation
• Urban consolidation
centers
• Rail development
• Electrification for rail
• High-capacity vehicles
• Differentiated taxes
• Fuel economy standards
• Optimized routing
• Improved vehicle use
• Backhauling
• Last-mile efficiency
PASSENGER VEHICLES PASSENGER VEHICLES PASSENGER VEHICLES
FREIGHT FREIGHT FREIGHT
80 Creating Markets for Climate Business: An IFC Climate Investment Opportunities Report

S T E P 1 : “AV O I D ” — R E D U C E T H E N E E D F O R U R B A N C O M M U T I N G .
Focus on system efficiency and reduce the need for urban commuting
through smart urban planning, land-use efficiency, and transport
demand management. Transport investments and metropolitan land-use
management that lead to concentrated development around mass transit
corridors is not easy to accomplish but is very much in the interest of
cities. City planners and designers in newer, evolving cities in emerging
markets can develop compact, transit-oriented cities that encourage people
to walk (see Box 29). Other measures could include enabling increased
access to information and communications technology for teleworking.
In the context of freight, the avoid strategy can take the form of urban
consolidation centers, which are logistics facilities relatively close to
the geographical area of consumption. Governments can incentivize
the creation of these centers through tax rebates or by subsidizing their
operational costs. Urban consolidation centers have had mixed results
and a careful study of underlying market realities is needed before
encouraging such investments.
S T E P 2 : S H I F T — M O V E F R O M P E R S O N A L V E H I C L E S T O O T H E R M O D E S O F T R A N S P O R T.
Improve trip efficiency by moving from personal vehicles to public transport,
biking, and walking. Paris, for example, adopted an urban mobility plan
in 1998 that included mass transit, parking, and traffic management. The
plan later included dedicated bus lanes, a bike-sharing program (Vélib’), and
an electric-car-sharing program (Autolib’). Driving in Paris fell 24 percent
between 2001 and 2010, while regional rail into the city increased by nearly
30 percent, metro trips rose by 18 percent, and bus travel increased by
10 percent.257 IFC’s engagement with Buenos Aires is taking a similar
system-wide approach to improving urban transit (see Box 25).
Encouraging ride sharing to complement public transit can reduce
vehicle ownership. Ride sharing is mostly initiated by entrepreneurs,
but governments can encourage these initiatives through monetary
and non-monetary incentives. Monetary support for the initial and
operational stages, which can take the form of direct aid or tax relief,
Transport PPPs: Manila Light Rail Extension
Manila’s Light Rail Transit Line 1 has been an integral part
of the urban transport system for 30 years. However,
years of underspending on maintenance has deteriorated
the system, reduced the available train fleet, and raised
safety concerns. Population growth and urban sprawl
also meant that the line needed to be extended to
new communities to help more people commute to
jobs in the city and remove cars from the road. With
IFC advisory assistance, the Philippine government has
secured a PPP for the operation and maintenance of Line
1 and the construction and operation of the 12-kilometer
Cavite extension. Once complete, the project is expected
to benefit more than one million daily passengers, yield
over $310 million in fiscal benefits, and reduce carbon
dioxide emissions by 40,000 tons per year (equivalent to
taking 8,500 cars off the road).
www.ifc.org
BOX 28
81Climate-Smart Urban Transport and Logistics

can help address some of the early-stage risks involved. Government
can also directly fund pilot projects.259 For example, Hangzhou in China
initiated a successful system of public bike sharing in 2008, which
helped demonstrate the viability of the model for other Chinese cities.
Non-monetary measures could include integrated transport planning,
conducive parking policies, incentives for sharing rather than owning
cars, and raising political and public awareness.
Government action can take the form of direct investment in
infrastructure like the public metro, BRT, or light rail through public
funding or PPPs. Removing fossil-fuel subsidies, implementing a
congestion tax, and introducing zero-emission zones could encourage
people to change the way they commute. Building biking and walking
lanes could also help in this regard.
S T E P 3 : I M P R O V E — U P G R A D E A N D O P T I M I Z E T E C H N O LO G Y A N D I N F R A S T R U C T U R E .
Enable vehicle .technology, improve fuel efficiency and optimize
transport infrastructure. Policymakers can encourage people and vehicle
manufacturers to improve vehicle efficiency and technologies, by, for
example, promoting alternative fuel vehicles with incentives, improving
fuel economy standards, and reducing speed limits. As the developed
world moves to electrification, automation, and shared mobility for
transport, developing countries have the opportunity to adopt new
technologies and business models too. While vehicle automation remains
challenging, electrification has emerged as a viable option for cities in
developing countries.
Fuel standards can directly improve efficiency and reduce costs,
especially for urban freight, where fuel remains the largest contributor
to trucking costs. In Ethiopia, the use of Euro II fuels excludes the
possibility of importing older trucks from Europe or the United States,
which means it has a newer and more fuel-efficient fleet than some
of its neighboring countries.260 Fuel-blending mandates and targets,
particularly for biodiesel, are an effective way to encourage freight
efficiency. Fuel standards need to be combined with fleet modernization
programs, including financial incentives, tax reductions, or scrappage
programs promoting the replacement of old vehicles.
A city for pedestrians in Tianfu District Great City, China
Transit-oriented development creates compact,
walkable mixed-use areas around high-quality public
transport. Tianfu District Great City in southwest China
has used this model to reduce greenhouse emissions
and congestion, and enhance livability. It is building a
new satellite city near Chengdu for 80,000 people. The
streets are designed so that any location can be reached
in 15 minutes on foot. Motorized vehicles will be allowed
on half the roads; the rest are for walkers and cyclists.
Source: McKinsey 2015258
BOX 29
82 Creating Markets for Climate Business: An IFC Climate Investment Opportunities Report

Emission standards and fleet modernization in India
India has been implementing an ambitious fuel emission
standards program since 2009. The latest norms have
been in effect since April 2017 and new vehicles must
comply with this standard. Based on European standards,
its Bharat stage emission program has progressively
become more stringent. India recently decided to skip the
fifth stage in its program and implement the sixth stage
by 2020. In addition, the country is discussing a draft
of the Voluntary Fleet Modernization Program, which
includes tax benefits and discounts to owners to replace
their older heavy-duty vehicles. The program aims to
retire all vehicles bought before 2005—those below the
emission standards currently in place.
Source: GIZ 2016267 and International Council on Clean Transportation 2016268
BOX 30To promote the electric vehicle market, governments have developed
mandates and supporting regulations and increased research and
development spending.261 Research and development efforts have prioritized
improving lithium-ion battery performance, decreasing battery costs, and
enabling large-scale battery manufacturing. Stronger ambition in the electric
vehicle market needs to be complemented by national and subnational
government mandates. For example, California’s 2016 Zero Emissions
Vehicles Action Plan aims to have 1.5 million such vehicles on the road
by 2025.262 Regulations like CAFÉ standards in the United States tighten
maximum emissions from fleets, encouraging the use of electric vehicles.
Mandates around charging infrastructure also play a crucial role in enabling
large-scale use of electric vehicles. For example, according to a China Daily
article, China intends to deploy 100,000 charging stations in 2017.263
Support electric vehicle markets through consumer incentives. These
can take the form of rebates, tax breaks, or exemptions, based on the
technology used or emission levels. Other instruments, typically offered
by municipalities, include exemptions from city-center congestion
charges, free parking, or access to priority lanes.
I N N O VAT I V E F I N A N C I N G M O D E L S
PPPs for transport can offer a safe and stable long-term investment
opportunity, with reasonable returns for private investors if projects
are well planned and risks are appropriately managed.264 Developing a
national policy and regulatory framework for PPPs is an important step
in mobilizing private sector investment in transport infrastructure.
Transport PPPs offer secure and stable long-term revenue. For example,
in 2012, local government’s 70 percent share in the port of Rotterdam
paid out €65 million in dividends.265 PPPs need not be funded with
tolls, but they offer an opportunity to make tolls politically acceptable.
Because free-flow tolling is now feasible, tolls can reduce congestion,
ensure an adequate mix of public and private transport, and help
finance maintenance and new infrastructure.266 Transit-oriented
development strategies also create opportunities for municipalities to
address financing challenges by using profits from urban development to
subsidize transport investment.
83Climate-Smart Urban Transport and Logistics

Between 2000 and 2008, a 225-kilometer system
of urban highways was built in Santiago, Chile’s
capital. The system was divided among eight PPP
concessions. Most of the funding to pay for the
$3 billion investment will come from electronic toll
collections over the next 20 to 30 years.
Santiago built this system in less than a decade
through a PPP program planned and executed by a
division in the Ministry of Public Works, which has
BOX 31
authority over streets and highways across several
municipalities. The program began in the early 1990s,
along with studies on building urban highways. A law
was passed to regulate concessions in 1996, and PPPs
were put to tender between 2000 and 2005.
But the system’s origin dates as far back as the
late 1950s and early 1960s. Planners anticipated
that Santiago’s rapid growth, which had begun
in the 1940s, would eventually transform it
into a polycentric city covering a substantial,
expanding area. It was crucial to plan and build
streets connecting metropolitan subcenters and
municipalities, avoiding trips passing through the city
center. The plan anticipated the necessary transport
investments, reserved strips of land for roads, and
gradually executed the investments to put the plan
to work.
Source: World Bank 2014269
A PPP plan comes together in Santiago, Chile
84 Creating Markets for Climate Business: An IFC Climate Investment Opportunities Report

85Climate-Smart Urban Transport and Logistics

5.4 Initiatives, tools, and resources
The International Energy Agency (IEA) conducts a broad range of transport research and analysis, focusing on ways in which countries can improve energy efficiency in their transport sectors and shift to lower-carbon fuels.
www.iea.org
The International Transport Forum (ITF) at the OECD is an intergovernmental organization with 59 member countries that acts as a think tank for transport policy and organizes an annual summit of transport ministers.
www.itf-oecd.org
The Global Fuel Economy Initiative (GFEI) involves multiple organizations working together to secure real improvements in fuel economy, and maximize the use of existing fuel economy technologies in vehicles across the world.
www.globalfueleconomy.org
Union Internationale des Transports Publics (UITP) is the International Association of Public Transport and it brings together all public transport stakeholders and all sustainable transport modes.
www.uitp.org
The WRI Ross Center for Sustainable Cities is the cities and urban development research arm of the World Resources Institute. Within the Ross Center, the EMBARQ initiative focuses on sustainable urban mobility.
www.wrirosscities.org
The Institute for Transportation and Development Policy (ITDP) is a global nonprofit that provides technical expertise to accelerate the growth of sustainable transport and urban development around the world.
ww.itdp.org
The International Council on Clean Transportation (ICCT) is a research nonprofit with a focus on environmental performance and energy efficiency of transportation.
www.theicct.org
The Partnership on Sustainable Low Carbon Transport (SLoCaT) is a multi-stakeholder partnership of over 90 organizations established in 2009 to provide a global voice on sustainable transport.
www.slocat.net
The Sustainable Mobility for All (SuM4All) is a World Bank led global, multi-stakeholder proposed in 2016 at the United Nations (UN) Climate Action Summit and established in 2017 with the purpose of realizing a future where mobility is sustainable.
sum4all.org
86 Creating Markets for Climate Business: An IFC Climate Investment Opportunities Report

Climate-Smart Urban Water Infrastructure
87

The global market for water recycling technologies was $23 billion investment in 2013, and is growing.
Investment in urban water infrastructure could exceed $13 trillion to 2030.
More than 100 countries mention the water sector in their NDCs.
In 2015, private sector water investment totaled $5.3 billion.
88 Creating Markets for Climate Business: An IFC Climate Investment Opportunities Report
Key indicators

89
Key indicators
Climate-Smart Urban Water Infrastructure

Commercial finance in the water sector faces challenges and risks.
Investments in water efficiency (including in waste-to-resource or
desalination systems) should be available and attractive to all water
service providers, irrespective of ownership. To attract commercial
finance, governments can provide predictable regulatory frameworks
and help foster innovative business models. Water pricing at predictable
and sustainable levels can enhance cost recovery and increase the
creditworthiness of utilities. PPPs, including the use of performance-
based contracts, are helping to finance urban water management and
efficiency improvement projects. Blended finance solutions can also
help share risks efficiently, and address equity and affordability issues.
Increasingly, there will be more opportunities to mobilize commercial
finance simply through borrowing in domestic markets. More than
100 countries mention water in their NDCs (Table 8); offering an
opportunity to address many of these issues.
6.2 Market snapshot and growth potential
T E C H N O LO G Y T R E N D S A N D M A R K E T O P P O R T U N I T I E S
Water infrastructure investment will need to grow rapidly to meet
demand. Planned global investment in water infrastructure is $10 trillion
by 2030.274 This will need to grow substantially to ensure adequate and
sanitary water supply in line with countries’ growth ambitions and the
effects of climate change. Water is becoming increasingly scarce. Based
6.1 Summary
Water and wastewater infrastructure demand in cities is large and
growing due to rapid urbanization. The OECD270 estimates that the
required investment for water supply and sanitation could be more than
$13 trillion between 2016 and 2030. The Asian Development Bank
(2017) estimates an investment need of almost $8 trillion in the Asia-
Pacific region alone during the same period.271
Urban water infrastructure is critical for climate mitigation and
adaptation. A carbon-neutral water sector could deliver up to
20 percent of the mitigation pledged under existing NDCs.272 Water
savings and recycling can mitigate climate change by reducing the
energy used by water systems and using waste-to-energy systems. The
sector can also help ensure that people are resilient to the increasing
frequency and severity of climate change events, such as droughts and
floods. Water efficiency is becoming increasingly important due to the
gap between supply and demand.
Governments are increasingly looking to the private sector to invest in
climate-friendly water supply and treatment technologies. Historically,
the share of investment from commercial sources has been low. Given
the investment required, however, governments are expected to source a
larger share of commercial financing. In many middle-income markets
this shift is already taking place. In 2015 alone, private sector water
investment totaled more than $5 billion.273
Climate-Smart Urban Water Infrastructure
90 Creating Markets for Climate Business: An IFC Climate Investment Opportunities Report

on trends in population, climate, and urbanization, water demand could
exceed supply by 40 percent in 2030.275 Public financing is unlikely
to be available at the scale necessary to meet these needs, creating an
opportunity for private investment. The private sector could provide up
to half of the investment required for water supply.276
Water equipment and technology suppliers are growing, especially in
large emerging markets. All major segments of the supply chain are
expected to grow by more than 2 percent per year globally, with these
annual growth rates potentially reaching up to 25 percent in emerging
markets such as China and India (Figure 14).277
Wastewater offers strong opportunities for private sector investment.
Wastewater treatment and recycling encompasses a range of processes
used to reuse wastewater or allow it to be safely returned to the
environment. It includes technologies that extract energy from
wastewater streams, such as biogas generation, which can be used to
generate electricity. Climate-related wastewater treatment opportunities
include energy efficiency, waste-to-energy, and water recycling solutions.
Wastewater treatment and recycling usually results in sewage sludge as
a by-product. Businesses are finding innovative, profitable uses for this
sludge (see Box 32), including as soil conditioner and for compost.
TA B L E 8 : N U M B E R O F C O U N T R I E S W I T H S U B S E C T O R I N C L U D E D I N T H E I R N D C
Region Wat
er
man
agem
ent
Wat
er s
upp
ly
Wat
er
con
serv
atio
n
and
reu
se
Was
tew
ater
Wat
er
infr
astr
uct
ure
Wat
er
trea
tmen
t
Wat
er
effici
ency
Wat
er
san
itat
ion
East Asia and Pacific 6 8 2 4 1
Europe and Central Asia 3 1 1 2 2 1 1
Latin America and Caribbean 13 6 8 3 6 2 2
Middle East and North Africa 9 4 8 6 2 3 3
North America 3 3 3 3 2 1 1
South Asia 29 13 11 8 9 4 4
Sub-Saharan Africa 2
Western Europe
Total 63 35 33 26 22 11 10 3
(Source: World Bank, INDC Database; see indc.worldbank.org)
91Climate-Smart Urban Water Infrastructure

2.4
Mar
ket g
row
th ra
te (%
)
0
5
10
15
20
25
30
PUMPS, PIPESAND VALVES
WATERTREATMENTEQUIPMENT
DESALINATIONMEMBRANES
WATER TESTINGEQUIPMENT
IRRIGATION WATER,WASTEWATER
PROJECT MARKET
ChinaGlobal India
15
2.4
1513.5
20
26
20 20
11
7
20
16
12
16
24
6.2
15
The water recycling and reuse market has recently doubled, and this is
set to continue. BCC Research280 estimated the global market for water
recycling technologies at $23 billion in 2013, more than double the
2012 market size. Industrial water reuse and desalination technologies
are expected to reach a total market value of $12 billion by 2025.281
Improving water efficiency through new technologies is also an $8
billion market and is growing—the 2017 Global Opportunity Report282
ranked smart water technologies, such as smart meters and pipes, as the
top innovative business opportunity.
The need for water-efficient infrastructure is growing and offers a
significant opportunity for private investment with quick payback rates.
Up to 40 percent of potable water is estimated to be lost in existing
water systems.283 Water efficiency covers improving the productivity
of water treatment plants and distribution systems, as well as water-
intensive industrial users. Better management of the water supply
network by optimizing pumping, pressure, and distribution systems can
significantly reduce water losses in the short term, but ultimately some
renovation or replacement of supply pipes may be required. Improved
(Source: Impax, 2013)
FIGURE 14: Growth in water market segments
Organica Water: Developing innovative wastewater solutionsOrganica Water has designed and manufactured a
sludge biological wastewater treatment system that
allows treated effluent to be reused in a cost-effective
manner.278 The system has lower infrastructure and
capital costs than conventional wastewater treatment
systems, with a low physical and environmental
footprint.279 The U.S.-based company has been in
operation since 1988 and began raising investment in
2008. In 2013, it raised over $12.6 million from a range
of financers. In 2015, it raised more than $9 million from
a consortium including IFC, XPV Capital Corporation,
Idinvest Partners (through their Electranova fund), and
Gamma Capital Partners. The latest round of funding
will be used to develop an online project that will allow
Organica to further spread its cost-effective, low-
emissions wastewater treatment systems.
www.ifc.org
BOX 32
(Source: Impax (2013), Investing in Water: Global Oppurtunities in a Growth Sector, London, UK)
92 Creating Markets for Climate Business: An IFC Climate Investment Opportunities Report

At Anglo American Coal South Africa, water
treatment plants are used extensively to treat
mine-affected water. The flagship eMalahleni
Water Reclamation plant, built by Anglo American
in partnership with BHP Billiton and the eMalahleni
Municipal Council in 2007, treats around 25,000
cubic meters of mine-affected water every day
to meet the potable water needs of nearby mines
while providing drinking water for 80,000 people.
The treatment process produces gypsum-based
BOX 33
by-products, which are used in the manufacture
of cement and fertilizer industries. Gypsum is also
used for making building materials—it is mixed
with cement, clay and water and baked to produce
bricks, blocks and panels for building homes. Anglo
American has built 60 houses from the gypsum-
based building materials.
https://unfccc.int/files/secretariat/momentum_for_
change/application/pdf/3_water_reclammation.pdf
eMalahleni Water Reclamation Plant
93Climate-Smart Urban Water Infrastructure

pricing schemes will also encourage efficient water allocation and use.
The costs and market growth rates of water-efficiency technologies
vary significantly across equipment, region, and application, but most
investments in water efficiency create positive returns within three years,
contingent on cost-reflective water pricing regimes.289
Improving water efficiency through new technologies is a growing
market. The 2017 Global Opportunity Report290 ranked smart water
technologies, such as smart meters and pipes, as the top innovative
business opportunity. The market for water-smart technologies is
expected to grow from more than $8 billion in 2016 to over $20 billion
in 2021.
6.3 Creating markets for climate-smart urban water investment
Country-specific challenges and risks need to be addressed to attract
commercial finance in water. Countries vary significantly in their level of
water scarcity, as well as in their use of water pricing and receptiveness
to commercial finance. This highlights the need for a nuanced, locally
tailored approach to attract water sector investment, supported by
strong and sustained political support.
There is a range of options available to support private investments and
improve efficiency in the water sector, from full privatization of assets to
small-scale management contracts. The choice of approach will depend
on the public sector's capacity to engage with the private sector, as
well as the need to attract commercial funding. Private sector solutions
can improve service and efficiency, but they need to be combined with
the necessary regulatory and legislative safeguards required for the
management of a service that is normally a natural monopoly.
Involving the private sector in water infrastructure will help ensure
sustainable access to water services. A sustainability analysis should
address health, environment, economy, socio-cultural, and technical
issues across the value chain.291 Ensuring adequate availability of
baseline information through data collection and surveys will lead to
better-informed decisions. Sustainability and cost-benefit analysis should
Renewable desalination offers climate-friendly water supply
Desalination technologies turn saline water into potable
water by extracting minerals. It is a rapidly growing
market in the Middle East and China: China is estimated
to have spent more than $4 billion on desalination
technologies between 2013 and 2015.284 However, most
desalination technologies, such as seawater reverse
osmosis, are energy intensive, so they can only be
considered climate smart when they are paired with
renewable energy sources. Desalination of brackish
water offers opportunities to produce lower-cost water
because it is less energy intensive, but it is unlikely to be
a main alternative water source in the future because of
the limited volume of brackish water worldwide.285
The market for renewable-powered desalinated water is
small but growing. In 2012, IRENA estimated that, globally,
just 1 percent of desalinated water came from renewable
sources. The falling cost of both renewable energy and
desalination technologies is expected to see this share
increase substantially. The cost of desalination has
decreased significantly over the last 30 years, from about
$2.50 per cubic meter in 1972 to $0.65 per cubic meter
in 2010.286 Renewable desalination systems are already
cost-competitive with conventional technologies in many
regions due to the rapidly dropping costs of renewable
energy.287 The world’s largest solar-powered desalination
plant is due to be constructed in the Saudi Arabian city of
Al Khafji. The plant is estimated to cost $130 million and
provide 60,000 cubic meters of water daily.288
BOX 34
94 Creating Markets for Climate Business: An IFC Climate Investment Opportunities Report

FIGURE 15: Creating markets for climate-smart urban water infrastructure
1 2 3 4
• Establish goals for
water access, cost
recovery and service
quality
• Create an enabling
institutional
environment among
various government
actors
• Establish the role of the
private sector
• Foster public awareness
about water waste and
efficiency
• Use guarantees,
benchmarking and
project preparation
funds to reduce risk and
improve attractiveness
to lenders
• PPPs encourage private
delivery of municipal
water services
• Performance-
based contracting
can improve water
efficiency
• Implement water
pricing with a goal to
achieve cost recovery
• Remove subsidies
and cross-subsidies
and incentivize water
efficiency
• Enhance city
creditworthiness
• Invest in capacity
building of local
authorities
• Empower institutions
via training and
knowledge transfer
• Develop intra-municipal
and intra-regional co-
operation
• Conduct public
awareness campaigns
• Provide home and
equipment certification
• Audit and benchmark
systems
ALIGN GOALS WITH INSTITUTIONAL FRAMEWORK AND PUBLIC RESOURCES
MAKE PUBLIC-PRIVATE COOPERATION WORK
ENSURE FINANCIAL SUSTAINABILITY AND COST RECOVERY
CAPACITY DEVELOPMENT & AWARENESS
95Climate-Smart Urban Water Infrastructure

go hand in hand with identifying market opportunities for new climate-
smart water solutions.
S T E P 1 : A L I G N S E C T O R G O A L S W I T H I N S T I T U T I O N A L F R A M E W O R K A N D P U B L I C R E S O U R C E S .
Regardless of public or private provision of water and sanitation
services, governments committed to best practice establish the policy,
planning, and governance framework required. Major sector reforms
will be needed in most countries. It is important to secure sustained
political support for water sector reforms that may be needed, including
a gradual transition to sustainable water tariffs. Sector policies need
to be realistic, fully funded, and integrated with investment plans that
include cost recovery and well-defined, targeted subsidies. Incentives
can be used to improve performance. Policies need to encourage
mobilization and efficient use of public funding from tariffs, charges,
and government taxes.294
Establish goals and strategies for the sector’s growth. Clear goals and
targets for water and sanitation, including water access, network
extension, cost recovery, and reliability of services,295 strengthen
common understanding and alignment across government and key
stakeholders. Several countries have successfully adopted the integrated
urban water management approach for the efficient, equitable, and
sustainable development and management of urban water resources
within the context of larger urban planning issues such as land use,
housing, energy, industry, and transport (see Box 35).296 This approach
can enhance capacity building and encourage greater private sector
confidence in the sector.
Use challenges to drive sector goals and strategies that lead to innovative
solutions. For example, in Cairo, water scarcity issues motivated the city
to develop PPPs for the treatment and reuse of wastewater (see Box 36).
Create an enabling institutional environment. A common challenge in
countries, regardless of public or private provision of services, is the lack
of an enabling institutional environment. The water sector is particularly
vulnerable to political interference. Private organizations generally view
Changing the way we think about water in cities
The World Bank’s integrated urban water management
approach is “a flexible, participatory and iterative process,
which integrates the elements of the urban water cycle
(water supply, sanitation, stormwater management, and
solid waste management) with both the city’s urban
development and river basin management to maximize
economic, social and environmental benefits in an
equitable manner.”292 It is more a way of thinking than a
methodology.
The approach can enhance water security and health,
reduce environmental impacts, and improve system-
wide performance.293 Since the 1990s, the World Bank
has applied the integrated urban water management
approach in cities in Africa, Central Asia, Europe, and Latin
America.
The local conditions in each city are an important
consideration in tailoring the approach for each
engagement. In general, the city should face multiple
water-related challenges that can be solved through an
integrated approach (water scarcity, flooding, drainage,
pollution), and have strong governance and institutional
capacity to drive the process.
www.worldbank.org
BOX 35
96 Creating Markets for Climate Business: An IFC Climate Investment Opportunities Report

With only a third of Egypt’s population connected to
a sewer system—and rapid urbanization straining
already overburdened infrastructure—fast-growing
cities likes New Cairo and 6th of October faced
significant water challenges. The government sought
World Bank Group support for a cost-effective
and safe wastewater treatment facility that would
mobilize private sector participation in both cities.
In 2006, the Public-Private Infrastructure Advisory
Facility, a multi-donor technical assistance facility
focusing on PPPs, assisted the government with
preparing the conceptual framework and transaction
model for a new wastewater treatment facility for
New Cairo.
With support from IFC’s PPP advisory team, the
government was able to structure and close its first
BOX 36
PPP project in 2009: the New Cairo Wastewater
Treatment Plant. The plant mobilized private
investments of about $200 million and serves more
than 1 million residents. Treated wastewater from
the plant is being used to irrigate agricultural land
and urban green areas, reducing freshwater demand.
In addition, sludge from the plant serves as fertilizer
to increase agricultural productivity and boost
economic growth. It also opened the market for
regional and international investors to work on other
PPP projects, including a wastewater treatment
plant in the 6th of October. The Public-Private
Infrastructure Advisory Facility provided technical
support, helping the government define the mandate
and operating environment and advising on policy
issues related to project design.
https://ppiaf.org
Private sector solutions for water scarcity in Cairo
97Climate-Smart Urban Water Infrastructure

An optimal water price should recoup the full costs
of supply and reflect water scarcity. However,
most water tariffs in developing countries only
recoup about 20 percent of their full cost.297 Even
most water pricing instruments used in developed
countries are insufficient and inequitable.298
Appropriate water prices create a reliable revenue
stream and change the underlying economics of
water projects, which attracts private investment.
But creating optimal water prices is a political
endeavor that often faces resistance from affected
communities.
There are ways to successfully address the politics
of water pricing. Sustainable water tariffs can
be phased in over time to allow communities to
adjust. At the same time, rising block tariffs—where
BOX 37
users pay different prices for different “blocks” of
consumption—can ensure that vulnerable users
are not priced out of the market while providing a
reliable revenue stream for private investors.299
Subsidy use and reform is another way to make
water pricing feasible and socially acceptable.
Subsidies, such as reduced water access fees, lump
sum transfers, and vouchers, can help lessen the
burden of higher water prices on low-income
households.300 As a first step, harmful subsidies,
such as foregone revenue from low environmental
pollution charges and direct subsidies to water and
sanitation providers,301 can be reformed without
incurring the same political resistance that changing
water prices might.
Implementing water pricing
98 Creating Markets for Climate Business: An IFC Climate Investment Opportunities Report

water infrastructure as a low-return, high-risk investment. To address
this, governments have successfully developed a predictable and reliable
regulatory environment and ensure that regulators are not susceptible
to political interference.302 It is also important that regulators are
properly funded and can attract and retain high-quality staff. Enhancing
governance and legislation, including property and contractual rights,
adequate competition law, and dispute settlement mechanisms, is
essential to attracting the private sector.303 Access to capital markets is
also important.
Avoid public funding crowding out commercial finance. Effective
mobilization and allocation of public finance, through taxes, tariffs,
and subsidies, is crucial for the sector. But this funding should be used
prudently in a manner that does not crowd out opportunities for
commercial finance.304
Ensure financial sustainability and cost recovery. Given the significant
investment required for water and wastewater provision, adequate
cost-recovery mechanisms need to be in place to ensure financial
sustainability. Cost-reflective water pricing is critical to recover costs and
stimulate private investment (see Box 37). Tariffs provide an effective
way to recover capital, operational, and maintenance costs from
users.305 Tariffs and subsidies should incentivize consumers and service
providers in a way that contributes to national objectives.306 To ensure
water-efficient consumer behavior and price recovery, it is important for
water pricing to be supported by strong governance frameworks. Water
pricing is unlikely to succeed without strong institutions for monitoring
and enforcement, which will in turn help ensure continuity and reduce
political risk.307
Include public awareness in strategies and demand management
programs to change water-use behavior. This can include awareness-
raising campaigns targeted at homes, businesses, and municipalities;
equipment certification programs; auditing and benchmarking systems;
and efficiency funds (see Box 38).
Behavioral change strengthens water demand management in Singapore
To reduce water consumption by 10 percent for businesses
and 10 liters a day for households, Singapore embarked on
a behavioral change campaign. The focus was on raising
awareness about the true value of water. It also introduced
a water-efficient homes certification program (including
mandatory installation of low-flow taps and toilets) and
a water-efficiency fund to incentivize business to manage
demand. The campaign was partly financed by a tariff
restructuring that penalized inefficient users (tax rate of
45 percent imposed on household use exceeding 40 cubic
meters a month). The campaign was a success, reducing
per capita water use from 165 liters a day to 152 liters a day,
and resulting in local communities and businesses adopting
more than 20 catchments and water sources.
www.2030wrg.org
BOX 38
99Climate-Smart Urban Water Infrastructure

S T E P 2 : I M P R O V E P E R F O R M A N C E O F S U B N AT I O N A L B O D I E S A N D U T I L I T I E S .
Improving operational and capital efficiency allows service providers
to deliver better, more cost-effective services, freeing up resources to
enhance or extend services that can help justify increased tariffs and
transfers from government sources.309 A more efficient service delivery
body also encourages private sector confidence.
Incentivize efficiency. Utilities can be technically and commercially
inefficient, particularly in developing countries.310 A better-performing
utility mobilizes capital more efficiently, improving creditworthiness
and access to commercial financing. Incentives for improving efficiency
come from policymakers and trickle down through local governments
and service providers, including management and technical staff.
Key considerations for promoting efficiency include ensuring service
standards are clear, improving the transparency of financial performance
and employee levels, measuring customer satisfaction, instituting
performance benchmarks, accounting for energy costs of water delivery
systems, and identifying and mitigating risks.311
Enhance creditworthiness. Only 4 percent of water and sanitation
service providers in low- and middle-income countries are
creditworthy.312 Even when service providers are creditworthy, they
do not always have access to commercial lenders if the local financial
market is not sufficiently mature. A country's policy and market
environment can help utilities become creditworthy. Beyond water
tariffs and transparency in subsidies, fiscal guarantees and clarity on
the relationship between national and subnational authorities enhances
private sector confidence. Subnational financing, such as municipal bond
markets and local-currency-linked loans also makes water infrastructure
more attractive to private investors (see Box 39).
S T E P 3 : M A K E P U B L I C - P R I VAT E C O O P E R AT I O N W O R K .
Even if service providers are efficient and well governed, lenders may
not immediately respond to new lending opportunities when they are
presented. Certain financing tools, such as guarantees, benchmarking,
Subnational financing and water infrastructure in Brazil
Companhia Caterinense de Aguas e Saneamento
is a majority state government-owned water and
wastewater utility in Santa Catarina, Brazil. In 2010, IFC
helped the utility with its efficiency and management
upgrade program. It involved strengthening the
company’s commercial viability, saving energy and
water resources, and improving subsidies for the poor.
Through the project, the utility installed and replaced
water meters, updated customer data, and purchased
equipment and training.
IFC helped the utility secure a loan of 40 million Brazilian
reais, linked to the inflation index and secured by tariff
receivables. This prepared the company for financing from
banks and local investors at attractive terms, and helped
diversify its funding sources. The project led to energy
and water savings, helped low-income residents, and
improved competitiveness.
Source: IFC 2010308
BOX 39
100 Creating Markets for Climate Business: An IFC Climate Investment Opportunities Report

Johannesburg Water showed how performance-
based PPPs can succeed in meeting development
and climate objectives in the water sector. The
municipality set out to establish a privately operated
utility in Johannesburg, South Africa, in 2000, when
city water and sanitation services were facing
bankruptcy. Through an international tender process,
it awarded a five-year management contract
to a consortium led by SUEZ Environnement of
France, which created the Johannesburg Water
Management utility. By the end of the contract
in 2006, the utility had met 90 percent of its
contractual targets and had overseen marked
improvements in cost efficiency, racial diversity
among employees, environmental compliance rates,
and financial performance. It has since evolved
into an independent company (Johannesburg
BOX 40
Water), with the municipal government as the sole
shareholder and an annual turnover of R1.6 billion.313
The company has expanded into energy generation. It
has installed biogas-to-electricity generation in several
wastewater facilities. Biogas scrubbing and combined
heat and power cogeneration projects were installed
in 2012 at the Northern Wastewater Treatment Works
and Driefontein Wastewater Treatment Works. Both
are significant facilities: the Northern plant is the
largest wastewater operation in Johannesburg. The
initial installation provided more than 1 MW of clean
energy, covering 18 percent of the plant’s electricity
consumption. Five biogas power plants, totaling more
than 17 MW, are planned, with an expected average
payback period of about five years.314
Source: Johannesburg Water
Johannesburg Water: A PPP success story
101Climate-Smart Urban Water Infrastructure

creditworthiness assessments, and project preparation funds,315 can be
used to reduce risk in the sector and make it more attractive to lenders.
Provision for competent and independent regulators, transparent
and competitive bidding processes, and adequate due diligence and
monitoring and evaluation can help make public-private cooperation
work. There are three main approaches in this context: the PPP model,
the performance-based contract model, and blended finance.
PPPs are an effective way to encourage private sector investment for
municipal water services. The availability of a sovereign guarantee—a
government’s agreement to take or refrain from certain actions
affecting the project—is often pivotal in PPP arrangements. The
private sector brings technical and managerial expertise, innovation
and greater financing capacity. This can increase the service provider’s
creditworthiness and open up further opportunities for commercial
finance (see final section for more detail on PPPs).
Performance-based contracting, where remuneration is based on
outcomes achieved, can improve water utility efficiency. Many of the
performance-based contracts in emerging markets are focused on
reducing non-revenue water (water that is “lost” before it reaches the
consumer, through leaks, for example). Through these contracts, utilities
can access the capacity and equipment that they lack. Results-based
payments increase the incentive to reduce leaks and improve inadequate
billing systems, reducing the risk of non-performance. However, it is
important that a clear benchmark to measure performance is established
at the start of a contract.
Blended financing is useful for markets that lack commercial sector
coverage or have high risk.316 As several of donor projects in middle-
income countries have demonstrated, blended finance can be a useful
tool in lowering the capital cost and correcting market failures, enabling
access to commercial finance (see final section of this report). Blended
finance can also be used to demonstrate the viability of a new business
or as once-off support to initiate self-sustaining, cost-recovering projects
and utilities.
Reducing water losses through performance-based contracting in Ho Chi Minh City
Non-revenue water is water in the system that is not
billed because of leaks or commercial failures. Efficient
management of non-revenue water offers significant
financial and environmental benefits.
Ho Chi Minh City is the largest city in Vietnam and
its water supply is managed by the Saigon Water
Corporation. The corporation set a target of reducing
non-revenue water from 35 percent in 2004 to 26 percent
in 2010. Within this context, the city partnered with the
World Bank to develop a performance-based contract.
The contract that emerged was a five-year design,
build, and operate contract with a strong performance
element. Payments included a fixed fee, a lump sum price
per district metering area, a performance fee per cubic
meter of leakage reduced, and a bill of quantities for
unforeseen works and connecting new customers. The
Saigon Water Corporation monitored the project, with
support from a specialist consultant.
BOX 41
102 Creating Markets for Climate Business: An IFC Climate Investment Opportunities Report

Jordan is one of the most water-scarce countries in
the world. The As-Samra Wastewater Treatment
Plant was built in 2008 to treat wastewater for the
2.3 million inhabitants of Amman, while supplying
quality irrigation water to the surrounding region.
However, the country’s rapid population growth
and influx of refugees tested the limit of the
plant’s capacity (both in terms of the volume of
wastewater received and solids processing) sooner
than anticipated. For this reason, the government
put a blended financial package in place to finance
the expansion of the As-Samra Wastewater
Treatment Plant.
The project was undertaken by the Samra
Wastewater Treatment Plant Company Limited,
a private operator recruited in 2012 to finance,
BOX 42
upgrade, and operate the treatment plant. The
financial package included public funds provided as
“viability gap funding,” including contributions from
the government ($20 million) and a grant from the
Millennium Challenge Corporation (over $90 million).
The viability gap funding helped leverage an additional
$110 million in private financing and reduced the
capital costs, while enabling the project to become
financially viable.
The As-Samra Wastewater Treatment Plant
expansion project became operational in October
2015, increasing the average daily capacity of the
plant from about 260,000 cubic meters per day to
more than 360,000 cubic meters per day.
Source: World Bank 2016317
Blended financing for As-Samra Wastewater Treatment Plant in Jordan
103Climate-Smart Urban Water Infrastructure

S T E P 4 : I N V E S T I N C A PA C I T Y B U I L D I N G .
Capacity building helps local authorities manage the commercial and
legal processes involved in private sector participation in the water
sector. It also improves efficiency. Municipal and regional cooperation
should be encouraged to share knowledge and resources. Utility
company management also needs the autonomy to set incentives
that motivate the workforce—proper pay and incentives are vital to
recruiting and retaining talent.318 National and local governments
can provide the leadership required and support designated agencies,
while establishing or enhancing sector performance measurement.
In turn, utilities can enhance capacity building through energy and
cost accounting and instituting pilot programs for improved water
management. City authorities can also work with multilateral banks to
enhance training and peer-to-peer learning. Finally, public awareness
campaigns can help build capacity among households and water
consumers along the water use chain to use water-efficient technologies
and practices.
I N N O VAT I V E F I N A N C I N G M O D E L S
The Water Financing Facility, spearheaded by the Global Innovation
Lab for Climate Finance, aims to mobilize private capital in the form
of institutional investment from sources such as pension funds and
insurance companies to aid national adaptation and mitigation goals in
the water sector. It seeks to coordinate this finance with public funding
and international impact investment to help bridge the investment,
infrastructure, and sustainability gaps countries are facing.319 In April
2017, the Dutch government announced a €10 million commitment for
the Water Financing Facility in Kenya. The facility will periodically issue
bonds for water and sanitation projects in Kenya, with the first taking
place by the end of 2017. The global facility aims to expand into two
more countries, planned for 2018, contingent on raising an additional
€21 million in donor funds.320
Pay for Success, also referred to as social or environmental impact
bonds, provides an innovative way for water service providers to
attract financing. Investors are paid back based on whether the service
provider delivers an outcome (such as water savings), as measured by
independent evaluators.104 Creating Markets for Climate Business: An IFC Climate Investment Opportunities Report

Washington, D.C. has antiquated stormwater
infrastructure, with a combined sewer system
designed 150 years ago. This means both raw sewage
and stormwater flow through the same pipes into
DC Water’s treatment facilities. During heavy rain
or snow, the volume of water and sewage exceeds
the pipes’ capacity and, by design, bypasses the
treatment facility and is discharged directly into
local rivers. It results in 2 billion gallons of sewage
overflowing directly into Chesapeake Bay every year.
To address this challenge, DC Water initially started
to build a $2.6 billion tunnel system to capture the
BOX 43
additional sewer outflow. However, halfway into the
20-year project, green infrastructure (such as rain
gardens, permeable pavements, green roofs, and rain
barrels) started emerging as a potential solution that
could soak up precipitation and slowly release it into
the sewer system, potentially preventing overload
and requiring fewer tunnels. But green infrastructure
had never been deployed at the scale DC Water was
planning, creating technological and financial risks.
The solution came in the form of an environmental
impact bond, which allowed DC Water to structure
the financing to transfer the risk to investors. With
DC Water’s environmental impact bond
Quantified Ventures as broker, DC Water raised the
United States’ first environmental impact bond—a
$25 million tax-exempt bond sold to the Calvert
Foundation and Goldman Sachs Urban Investment
Group. While standard municipal bondholders
invest in the issuer’s ability to repay on schedule,
DC Water’s investors bet on whether green
infrastructure will produce outcomes “as expected,”
“better than expected,” or “less than expected.”
Investor returns are tied to project outcomes.
Source: Quantified Ventures321
105Climate-Smart Urban Water Infrastructure

The United Nations Global Compact's CEO Water Mandate mobilizes companies to advance water stewardship, sanitation, and the Sustainable Development Goals—in partnership with the United Nations, governments, peers, civil society, and others. The mandate offers a platform and a set of tools to share best and emerging practices and to forge multi-stakeholder partnerships to address challenges related to water scarcity, water quality, water governance, and access to water and sanitation.
http://ceowatermandate.org
Business Alliance for Water and Climate (BAFWAC) was jointly launched by CDP, the CEO Water Mandate, SUEZ, and the WBCSD. BAFWAC companies commit to analyzing and sharing water-related risks to implement collaborative response strategies; measuring and reporting water use data; and reducing impacts on water in operations and throughout the value chain.
https://bafwac.org
6.4 Initiatives, tools, and resources
The Global Water Partnership is an multi-stakeholder international network in the water sector, with a goal of fostering an integrated approach to water resources management.
www.gwp.org
The International Water Association (IWA) is nonprofit organization and knowledge hub connecting water professionals around the world to find solutions to global water challenges.
www.iwa-network.org
The 2030 Water Resources Group (WRG) is a public-private-expert-civil society platform to help government water officials and their partners accelerate reforms to ensure sustainable water resource management for the long-term development and economic growth of their country.
www.2030wrg.org
An initiative of the World Resources Institute (WRI), Aqueduct measures, maps and understands water risks around the globe.
www.wri.org/our-work/project/aqueduct
United Nations Water (UN-Water) coordinates the efforts of United Nations entities and international organizations working on water and sanitation issues.
www.unwater.org
The World Bank Group's Water Scarce Cities Initiative offers a new avenue for knowledge sharing on urban water management by creating and sustaining stronger connections between cities facing water scarcity, and enabling urban water practitioners, global thought leaders and institutions to share solutions specific to that context.
http://pubdocs.worldbank.org/en/588881494274482854/Water-Scarce-Cities-Initiative.pdf
106 Creating Markets for Climate Business: An IFC Climate Investment Opportunities Report

Climate-Smart Urban Waste Management
107

The global waste sector is expected to reach $2 trillion in investment by 2020.
Waste recovery and recycling markets were around $265 billion in global revenue in 2016.
The global waste-to-energy market includes
800 plants and is at $7.4 billion in revenues.
The Asia-Pacific and Latin American regions
will see the most growth in waste market opportunities.
Over 80 countries include waste in their NDCs.
108 Creating Markets for Climate Business: An IFC Climate Investment Opportunities Report
Key indicators

109
Key indicators
Climate-Smart Urban Waste Management

and reusing waste (including e-waste recycling, composting, and
sustainable packaging). Emerging technologies such as advanced thermal
conversion technologies (pyrolysis, gasification, plasma gasification)
and applications for waste-to-liquid fuel may create new investment
opportunities in the waste sector.
There are a number of risks and challenges preventing private sector
investment in climate-smart urban waste. Cities can attract private
sector participation by extracting value (and energy) from recoverable
materials, selecting appropriate technologies, and working more
closely with the informal waste collection sector. Local and national
governments can also put in place regulatory and enforcement
frameworks, establish economic incentives and cost-recovery
mechanisms such as feed-in tariffs, and help drive waste-conscious
consumer behavior. Governments can also foster innovative new
business approaches, such as PPPs, microfinancing and micro-
privatization.
Realizing the potential of climate-smart technologies to reduce
greenhouse-gas emissions, over 80 countries have targeted solid waste
management in their NDCs (see Table 9).
7.2 Market snapshot and growth potential
The volume of solid waste being generated in cities is growing rapidly as
a result of urbanization and rising household income levels.327 Collecting
and disposing of solid waste safely is important to ensure public health.
7.1 Summary
Waste management is a large and growing global business opportunity.
Between 2011 and 2025, levels of waste generation in cities are expected
to increase from 1.3 billion metric tons to 2.2 billion metric tons
per year.322 Countries around the world are modernizing their waste
systems, leading to formalization of the sector and safer waste disposal.
Cities allocate one of the largest budgets to municipal solid waste,
which is also one of the largest employers. The global services market
for municipal solid waste was estimated at $160 billion in 2013 and
could be worth $300 billion by 2020, with most growth coming from
emerging markets.323
The Asia-Pacific and Latin American regions will see the biggest growth
in opportunities in the waste sector as a result of rapid urbanization.324
Between 2009 and 2013, waste generation increased by 15 percent
each year in Brazil and 16 percent in China.325 The World Bank expects
China to produce twice as much urban solid waste as the United States
in 2030.326
Climate-smart solid waste management encourages innovation in
technologies. Local governments and the private sector are innovating
to reduce the greenhouse-gas emissions associated with solid waste
management, while also providing energy and other resources. Climate-
smart options include energy generation via the capture and use of
landfill gas for energy, refuse-derived fuel, climate-smart transport of
waste via route optimization and low-carbon fuel use, and recycling
Climate-Smart Urban Waste Management
110 Creating Markets for Climate Business: An IFC Climate Investment Opportunities Report

While many middle-income countries have made significant progress in
modernizing solid waste management, collection is still about 50 percent
in low-income countries, with much lower rates in some countries.
Waste collection is particularly difficult in rural areas and informal
settlements in large urban centers. It is estimated that at least 2 billion
people worldwide still lack access to solid waste collection.328
Globally, waste management—including waste-to-energy, municipal
solid waste, industrial waste, and sustainable packaging—is almost a
$1.5 trillion market that could grow to $2 trillion by 2020.329 In 2011,
cities across the world generated about 1.3 billion metric tons of solid
waste. Driven by rapid population growth and economic development,
solid waste levels are expected to increase to 2.2 billion metric tons by
2025 and more than 4 billion metric tons by 2100.330 As the waste sector
matures in most advanced countries, the largest investment opportunities
will be in emerging economies with increasing waste flows, such as India.
Municipal solid waste services were worth $160 billion in 2013 and
could be worth nearly $300 billion by 2020.331
Markets for climate-smart urban waste management will grow as
countries and cities implement their climate goals. Methane emissions
from municipal solid waste management contribute 12 percent of
global methane emissions and 5 percent of global greenhouse-gas
emissions.332 Solid waste management is one of the most important
services a city provides; in low-income countries as well as many
middle-income countries, it is the largest single budget item for cities
and one of the largest employers.333 To address methane emissions from
waste, initiatives like the C40 Waste to Resources Network are working
with cities like Auckland in New Zealand and Guangzhou in China to
manage waste as a resource by reducing waste generation, enhancing
recycling, and reusing valuable materials.334
TA B L E 9 : N D C S TA R G E T I N G WA S T E M A N A G E M E N T
(Source : World Bank, INDC Database; see indc.worldbank.org)
Region Waste: General Solid waste Waste-to-energy Recycle, reuse, reduce
East Asia and Pacific 16 5 6 4
Europe and Central Asia 12 4 1 1
Latin America and Caribbean 13 6 3 3
Middle East and North Africa 9 6 3 4
South Asia 3 3 4 4
Sub-Saharan Africa 27 15 14 8
Western Europe 4 1
Total 84 39 32 24
111Climate-Smart Urban Waste Management

T E C H N O LO G Y T R E N D S A N D M A R K E T O P P O R T U N I T I E S
Resources are recovered from waste to use for other purposes, such as
recycling, composting, and energy generation. Global activity in new
waste processing facilities is high. Over the past two years, projects to
process waste worth more than $300 billion have been initiated, with
$85 billion directed to processing municipal solid waste. Most of this
investment activity is in industrialized countries, including biomass-to-
energy projects.335
WA S T E -T O - E N E R G Y
Strong investment in waste-to-energy is forecast as policymakers work
with businesses to unlock the environmental and energy benefits.
The global waste-to-energy market was worth $7.4 billion in 2013,
with about 800 waste-to-energy facilities combusting 130 million
(Source: Global Waste Management Outlook, 2015)
FIGURE 16: Total municipal solid waste generation by region
Sub-Saharan Africa
Latin America and the Caribbean
South Asia
East Asia and Pacific
Middle East and North Africa
Europe and Central Asia
High-income and OECD
2010 2020 2030 2040 2050 2060 2070 2080 2090 2100
0
1,000
1,500
500
2,000
3,500
3,000
2,500
Tota
l MSW
gen
erat
ion
(Ton
nes/
day)
Western Cape Industrial Symbiosis Programme: Connecting companies for waste reuse
The Western Cape Industrial Symbiosis Programme is
a free service that connects companies in South Africa
so that they can realize new business opportunities by
reusing residual materials, energy, water, assets, logistics
and expertise. The program is funded by the Western
Cape Department of Economic Development and Tourism
under its green economy portfolio and is delivered by
GreenCape, the province’s sector development agency
for the green economy. the program works with a broad
range of industries and companies to create mutually
beneficial links between member companies. To date,
the Programme has diverted over 1,750 tonnes of waste
from landfill, saving nearly 5,000 tonnes of carbon dioxide
and 5.1 million South African rands ($373,000) while
generating an additional 7 million South African rands
($512,000) of revenue. The pilot’s success has served as a
foundation for a national industrial symbiosis program,
and has helped inspire similar programs in KwaZulu-Natal
and Gauteng in South Africa.
http://greencape.co.za/wisp/about-us/about-us/
BOX 44
112 Creating Markets for Climate Business: An IFC Climate Investment Opportunities Report

metric tons of municipal solid waste.336,337 It is forecast to grow to
more than $80 billion by 2022.338 Estimates suggest waste-to-energy
could produce over 470 terawatt-hours of electricity, equivalent to
the electricity consumption of Brazil, by 2022.339 New technologies
are also emerging. Thermal combustion and non-thermal combustion
(anaerobic digestion and fermentation) are most commonly used,
but the costs of advanced thermal (plasma arc gasification, plasma
gasification, pyrolysis, and thermal depolymerization) are decreasing.340
R E F U S E - D E R I V E D F U E L
Refuse-derived fuels are increasingly being used for commercial
purposes. These solid fuels made from processed waste are used as an
alternative fuel in industrial plants (including the cement industry and
coal plants), or directly in a waste-to-energy facility. Co-processing of
waste in cement kilns is already widely employed across the European
Union, but there is large potential for further uptake in other regions.341
For example, in Poland, the cement industry consumes about one-third
of refuse-derived fuels produced.342 Companies are also exploring ways
to convert refuse-derived fuels into aviation fuel, offering the sector a
low-carbon fuel option.343
M AT E R I A L R E C YC L I N G A N D R E C O V E RY
Waste recovery and recycling markets represent $265 billion in global
revenue.344 Recycling provides income, conserves resources, and reduces
waste management costs. Driven by regulations and incentives, recycling
rates in countries belonging to the OECD have increased over the past
30 years. In lower-income countries, the informal sector can achieve
good recycling rates for solid waste.345 Market share and growth
rates vary substantially across material types. The global market for
post-consumer scrap metal is estimated to be 400 million metric tons
annually; the market for recycling cardboard and paper is 175 million
metric tons. Their combined market value is $30 billion a year.346 The
attractiveness of recycling solid waste differs depending on the type
of material. Metals, high-grade paper, and in some places high-quality
plastic (PET) pay for themselves (see Box 46), while recycling lower-
grade paper, plastics, glass, wood, and textiles often represents a net
Supporting private players in the waste-to-energy sector in China
Canvest is the 11th largest waste-to-energy company
in China, with a daily processing capacity of nearly
20,000 metric tons of municipal solid waste as of August
2017.347 In April 2016, IFC provided a five-year convertible
loan of about $60 million to help the company expand
its waste-to-energy business in a sector dominated
by state-owned enterprises. The investment helped
Canvest to reduce methane emissions, identify an energy
source, and develop ways to dispose of the waste.
Demonstrating further confidence in the company, in
April 2017, IFC exercised its conversion rights to convert
its outstanding loan into shares, translating into a
4.9 percent shareholding of Canvest.348
www.ifc.org
BOX 45
113Climate-Smart Urban Waste Management

BOX 46
PetStar was formed in June 2006 to establish a bottle
recycling facility in Toluca, Mexico. The facility converts
post-consumer polyethylene terephthalate bottles
into food-grade, recycled PET resin, which is then
sold to the Mexican soft drinks bottling industry. Key
elements of the project included:
• Developing a social responsibility program to
improve access to education for waste collectors
and their children.
• Using a suitable financing structure to enable
limited recourse project financing.
• Entering into contracts with equipment suppliers
and product off-takers.
• Accessing long-term funding that mobilized other
suitable lenders.
www.ifc.org
IFC invests in recycling plastic
114 Creating Markets for Climate Business: An IFC Climate Investment Opportunities Report

cost.349 Some municipalities invest in recycling mainly to reduce the net
cost of waste management.
Electronic waste recycling and reuse is a growing market. “E-waste” is
discarded electronic waste. The global market for e-waste recycling and
reuse was nearly $10 billion in 2012 and is expected to exceed $40 billion
in 2019.350 This growth is driven by increasing e-waste streams and reuse
and recycling rates in emerging markets, particularly China.
S M A R T T E C H N O LO G I E S A N D S U S TA I N A B L E PA C K A G I N G
By 2014, sustainable packaging became a $27 billion market, growing
at nearly 4 percent annually across three distinct segments: reusables,
recyclables, and degradables.351 The trend is expected to accelerate,
driven by consumer demand and producer and regulatory push for more
sustainable packaging. The food and beverage sector constitutes the
largest source of demand for sustainable packaging.
Smart technology is emerging in the solid waste sector, with products
including solar power trash compactors, integrated waste management
systems, and GPS-based route optimization solutions for trash
collection. One example is the Bigbelly solar power trash compactor,
which allows for up to six times the quantity of trash to fit into the same
volume as a traditional disposal unit. It also has an integrated device
that alerts municipalities when the container is full, enabling more
efficient waste collection. Based on these models, the global market for
smart waste collection technology is expected to grow from $58 million
in 2016 to over $224 million in 2025.352
B U S I N E S S M O D E L S
Innovative business models are attracting private investment in waste.
Waste falls under the mandate of municipal governments, which are
the dominant investors in the sector. However, as with the water sector,
municipal governments can face fiscal constraints and technical capacity
shortages, particularly in developing countries. PPPs and micro-
privatization efforts can help mobilize the private sector to invest in
waste management.
Promoting e-waste recycling in India
Established in 2008, Attero Recycling Private Limited
is a pioneer in the nascent domestic e-waste recycling
market in India. It uses a proprietary technology to
extract various metals from e-waste. IFC helped the
company integrate the informal sector into its supply
chain. The project focuses on collection centers and
public awareness campaigns about proper disposal of
electronic and electrical assets. In 2010, IFC’s Venture
Capital group invested $5 million in equity to further
expand the company’s capacity to collect and recycle
e-waste.353
www.ifc.org
BOX 47
115Climate-Smart Urban Waste Management
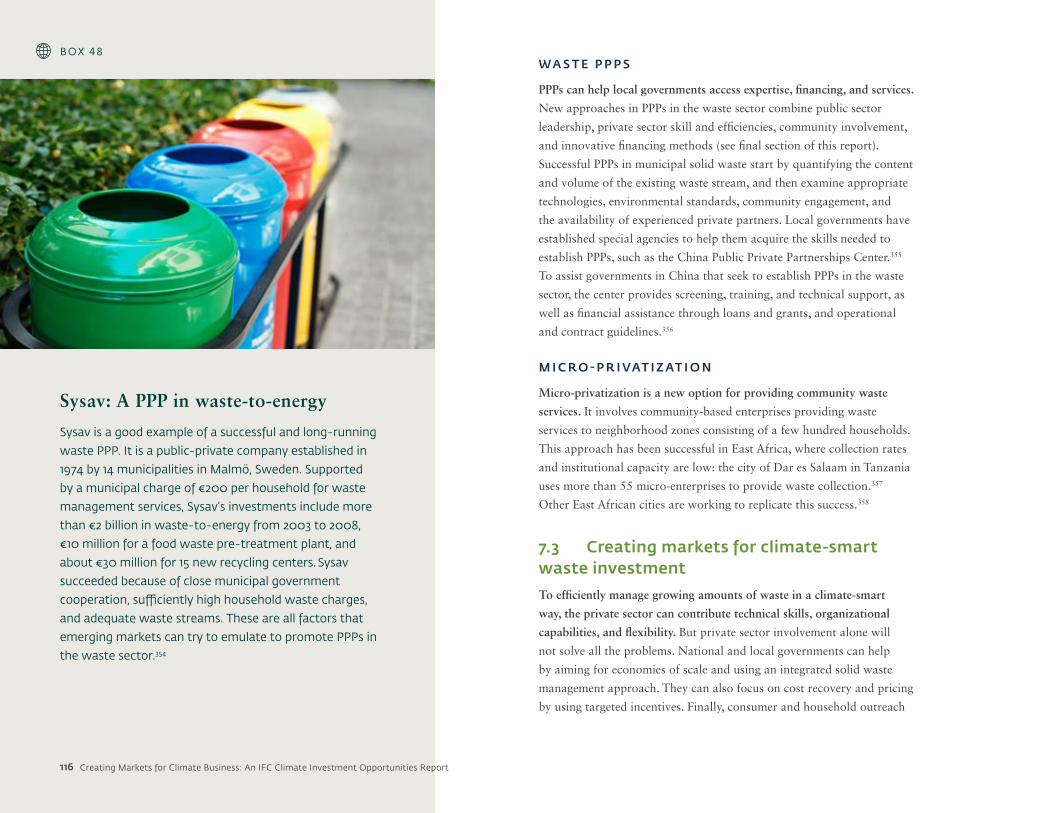
WA S T E P P P S
PPPs can help local governments access expertise, financing, and services.
New approaches in PPPs in the waste sector combine public sector
leadership, private sector skill and efficiencies, community involvement,
and innovative financing methods (see final section of this report).
Successful PPPs in municipal solid waste start by quantifying the content
and volume of the existing waste stream, and then examine appropriate
technologies, environmental standards, community engagement, and
the availability of experienced private partners. Local governments have
established special agencies to help them acquire the skills needed to
establish PPPs, such as the China Public Private Partnerships Center.355
To assist governments in China that seek to establish PPPs in the waste
sector, the center provides screening, training, and technical support, as
well as financial assistance through loans and grants, and operational
and contract guidelines.356
M I C R O - P R I VAT I Z AT I O N
Micro-privatization is a new option for providing community waste
services. It involves community-based enterprises providing waste
services to neighborhood zones consisting of a few hundred households.
This approach has been successful in East Africa, where collection rates
and institutional capacity are low: the city of Dar es Salaam in Tanzania
uses more than 55 micro-enterprises to provide waste collection.357
Other East African cities are working to replicate this success.358
7.3 Creating markets for climate-smart waste investment
To efficiently manage growing amounts of waste in a climate-smart
way, the private sector can contribute technical skills, organizational
capabilities, and flexibility. But private sector involvement alone will
not solve all the problems. National and local governments can help
by aiming for economies of scale and using an integrated solid waste
management approach. They can also focus on cost recovery and pricing
by using targeted incentives. Finally, consumer and household outreach
Sysav: A PPP in waste-to-energy
Sysav is a good example of a successful and long-running
waste PPP. It is a public-private company established in
1974 by 14 municipalities in Malmö, Sweden. Supported
by a municipal charge of €200 per household for waste
management services, Sysav’s investments include more
than €2 billion in waste-to-energy from 2003 to 2008,
€10 million for a food waste pre-treatment plant, and
about €30 million for 15 new recycling centers. Sysav
succeeded because of close municipal government
cooperation, sufficiently high household waste charges,
and adequate waste streams. These are all factors that
emerging markets can try to emulate to promote PPPs in
the waste sector.354
BOX 48
116 Creating Markets for Climate Business: An IFC Climate Investment Opportunities Report

FIGURE 17: Steps to create markets for climate-smart waste management
1 2 3 4 5
• Aggregate waste flows
into high volumes
• Develop regional waste
management plans
• Partner with
neighboring cities and
regional governments
• Focus on cost recovery
via taxes, volume-based
fees or other fiscal tools
• Establish “pay as you
throw” systems if
appropriate
• Integrate municipality
goals, objectives and
policies into a coherent
plan
• This helps to create
regulatory certainty for
investment and create
schedules for needed
infrastructure
• For waste-to-energy,
establish appropriate
pricing and tipping fees
• For compost, use
incentives and
mandates
• Supplement these
approaches with
financing mechanisms
and sector policies
• Ensure that consumers
are empowered and
motivated to reduce
and reuse waste
streams
ACHIEVE ECONOMIES OF SCALE
GET THE PRICES RIGHT
USE AN INTEGRATED SOLID WASTE MANAGEMENT APPROACH
PUT INCENTIVES IN PLACE TO DRIVE DESIRED OUTCOMES
RAISE CONSUMER AWARENESS
117Climate-Smart Urban Waste Management

Integrated solid waste management provides a
comprehensive approach to managing waste, and
is based on the hierarchy of waste management:
reduce, reuse, recycle—often adding a fourth “R” for
recovery. These waste diversion options are followed
by incineration and landfilling. It acknowledges the
critical role that the community, employees, and
local (and increasingly global) ecosystems play in
ensuring effective waste management.
Integrated solid waste management consists of three
interdependent and interconnected dimensions,
which need to be addressed simultaneously when
designing a solid waste management system:
stakeholders, elements, and aspects.
• Stakeholders: Individuals or groups that have
an interest or roles in the sector. All stakeholders
BOX 49
should be identified and, where practical, involved
in creating a solid waste management program.
• Elements (process): The technical aspects of
solid waste management. All stakeholders affect
one or more of the elements. The elements need
to be considered when creating an solid waste
management program to ensure it is efficient and
effective.
• Aspects (policies and impacts): The regulatory,
environmental, and financial context in which the
waste management system operates. Specific
aspects can be changeable, for example, a
community increases influence or environmental
regulations are tightened. Measures and priorities
are created based on these various local, national,
and global aspects.
Source: World Bank 2012: What a Waste359
Integrated solid waste management
118 Creating Markets for Climate Business: An IFC Climate Investment Opportunities Report

and education is vital to reduce waste streams and maximize recovery of
useful resources.
S T E P 1 : A C H I E V E E C O N O M I E S O F S C A L E .
Ensuring adequate waste volume is crucial to justify investment in
infrastructure and technology. Economies of scale and well-managed
reverse supply chains are needed. Aggregating waste flows into high
volumes will ensure more value can be recovered. Developing regional
solid waste management plans and working in partnership with
neighboring cities and regional governments helps to share costs and
risks, and makes the investment more attractive to the private sector.
S T E P 2 : U S E A N I N T E G R AT E D S O L I D WA S T E M A N A G E M E N T A P P R O A C H .
This helps to create regulatory certainty for investment and schedules
for needed infrastructure. The plan should be financially robust and
review all potential options. It can also provide an assessment of the
potential to reduce greenhouse-gas emissions. The plan should be
underlined by transparent and reliable data and forecasting for its
duration. It should include an outline of the detailed plan and schedule
of public consultations.360
S T E P 3 : G E T T H E P R I C E S R I G H T.
Various cost-recovery strategies can be used to pay for waste
management services. Landfill taxes have proven to be effective in
regions like Western Europe, but need to be managed in developing
countries to avoid illegal dumping.361 In South Korea, volume-based
waste fees have resulted in lower waste generation and increased waste
reuse.362 Municipalities have successfully used direct billing, property
taxes, and sales taxes to support municipal solid waste management, as
well as “pay as you throw” systems that make polluters pay for disposal.
S T E P 4 : P U T I N C E N T I V E S I N P L A C E T O A C H I E V E T H E D E S I R E D O U T C O M E S .
For waste-to-energy solutions, establish appropriate pricing and tipping
fees. Pricing support can come from feed-in tariffs, renewable energy
Policies are helping foster waste-to-energy markets in China
China has implemented various policies to encourage
private investment in waste-to-energy. The government
grants concessions to private partners to build, finance,
and operate waste-to-energy plants.363 China’s 12th
five-year plan targets more than $12 billion worth of
investment for waste-to-energy—about half of the
country’s total investment in municipal solid waste.364
Furthermore, waste-to-energy plants benefit from a tax
exemption of 5 percent, a feed-in tariff of $0.04/kWh,
and tipping fees ranging from $9.30/metric ton to $14.30/
metric ton.365 These policies make China an attractive
waste-to-energy market for the private sector. For
example, backed with a funding package from the Asian
Development Bank that is based on PPPs with municipal
governments and agreements with 10 commercial banks,
Dynagreen Environmental Protection Group is set to
build nine new plants by the end of 2018.
BOX 50
119Climate-Smart Urban Waste Management

Pilot Auction Facility: Innovative climate finance for urban waste solutions
In May 2016, 21 companies took part in a pilot online
auction managed by the World Bank Group. The nine
winners received $20 million in financing to reduce
methane emissions from waste management. The
auction was the second in a series of pilots by the
Pilot Auction Facility for Methane and Climate Change
Mitigation, which tests multiple auction formats that
are intended to attract private sector investment while
efficiently reducing emissions.366
BOX 51auctions, renewable energy certificates, access to qualified end users,
preferential grid access, and wheeling fees. The European Union is the
leading marketplace for waste-to-energy due to its Waste Framework
Directive. This directive, combined with a price on carbon under the
European Union’s Emissions Trading System and national renewable
energy support mechanisms, provides profitability and predictability
for waste-to-energy providers in countries such as Germany and
Sweden.367 China provides an example of a national market that uses
a combination of financing, economic instruments, PPPs, and feed-in
tariffs to drive growth in waste-to-energy plants (see Box 50). The
World Bank Group is also innovating new financial tools to help finance
methane emissions reductions in the waste sector via the Pilot Auction
Facility (see Box 51).
Financial and contractual approaches help secure private sector
investment in waste. Governments can encourage private sector
investment in climate-smart waste infrastructure and services through
subsidies, tax credits, grants, funds, and compensation for facility
hosting. Incentives can be paired with long-term contracts to provide
private partners and investors with predictable waste and revenue
flows. For example, in Quebec, Enerkem, a firm that generates cellulosic
bioethanol from non-recyclable household waste, invested 115 million
Canadian dollars in a methanol-to-ethanol unit at its production facility
in Edmonton. This private equity investment is driven by a guarantee
from the city to provide a consistent waste supply for the next 25
years and a payment of 75 Canadian dollars per metric ton of waste
used.368 The long-term contract and reliability provided by the city has
provided the certainty for Enerkem to undertake significant, long-term
investments in refuse-derived fuel production.
S T E P 5 : R A I S E C O N S U M E R AWA R E N E S S .
This is key to ensuring that consumer behavior supports waste
reduction, recycling, and reuse of easily converted waste streams. For
example, the success of the Waste Electrical and Electronic Equipment
Centre in Kenya hinges on outreach campaigns that collect and
encourage recycling of e-waste (see Box 52).
120 Creating Markets for Climate Business: An IFC Climate Investment Opportunities Report

Changing consumer behavior in KenyaThe Waste Electrical and Electronic Equipment
Centre shows how social education can help ensure
business profitability. In Kenya, an average of 3,000
tons of e-waste is generated each year with little
capacity for proper management. In response, in
2002 the center was established. It is run by local
entrepreneurs and supported by various national
and international sponsors. It sources e-waste
through local campaigns aimed at households and
then separates waste into two streams: repair
and refurbishment and recycling and dismantling.
Worldloop provided seed capital, which is tied to
meeting the center’s collection targets. The center is
now 73 percent self-sustaining.369
BOX 52
121Climate-Smart Urban Waste Management

7.4 Initiatives, tools, and resources
The International Solid Waste Association (ISWA) is a nonprofit association that promotes and develops professional waste management worldwide.
www.iswa.org
The Climate and Clean Air Coalition’s Municipal Solid Waste Initiative aims to reduce emissions of methane and other short-lived climate pollutants from the solid waste sector. This government-led initiative runs webinars and shares information through its knowledge platform.
http://www.waste.ccacoalition.org/
The C40 Cities Waste to Resources Network aims to help cities accelerate the transition from solid waste management to sustainable materials management, including resource recovery, through dialogues and resources on topics such as segregated collection, waste minimization, food waste avoidance, greenhouse-gas accounting, and vision/roadmap setting.
http://www.c40.org/networks/waste-to-resources
The World Economic Forum’s Platform for Accelerating the Circular Economy partners with the Ellen MacArthur Foundation to accelerate the transition to the circular economy through Project Mainstream—a CEO-led initiative to increase business-driven innovations in the sector.
https://www.weforum.org/projects/circular-economy
122 Creating Markets for Climate Business: An IFC Climate Investment Opportunities Report

Making It Happen: Cross-Cutting Solutions for Market Creation
123

Nearly 30 countries have implemented progressive fossil fuel reforms.
More than two-thirds of institutional investors are planning to increase low-carbon investments.
Over half of countries will use a carbon price to achieve their climate targets; 1400+ companies are putting in place internal carbon pricing.
The global green bonds market was $221 billion in 2017, and saw a 6x rise between 2013 and 2016.
124 Creating Markets for Climate Business: An IFC Climate Investment Opportunities Report
Key indicators

125
Key indicators
Making it Happen: Cross-Cutting Solutions for Market Creation

The issue of enabling greater private sector investment in climate
adaptation and resilience measures is also quickly emerging as a top
priority for governments and business (see Box 55).
PAT H WAY S T O G R O W G R E E N F I N A N C E
Recognizing the vital role of the financial sector in delivering the Paris
Agreement, policymakers are putting in place financial regulations and
catalyzing financial innovations to align with a greener future. Green
finance has risen to the top of the G20’s political agenda and is central
to the economic development strategies of China and Europe.370 Central
banks, financial regulators, and other government bodies are taking
a variety of actions, including standardizing what counts as “green,”
mandating environmental stress tests for financial institutions, asking
for improved climate risk disclosure and reporting, implementing tax
incentives, reducing capital requirements for green loans, and ensuring
fiduciary duties encompass sustainability.
The market is shifting and green finance is becoming mainstream. A
recent HSBC survey shows that more than two-thirds of institutional
investors are planning to increase low-carbon-related investments to
tackle climate change and accelerate the transition to a clean energy
economy. Growing investor appetite for low-carbon investments is
strongest in Europe (where 97 percent of investors have expressed
interest), the Americas (85 percent), and Asia (68 percent). The Middle
East (19 percent) is the only region to experience an annual decline in
this trend.371
This report has shown that markets are being successfully created
to leverage more private financing for low-carbon sectors. To
accelerate the creation of markets, countries can take certain steps as
they begin to implement their commitments. To maximize the use of
scarce public resources, governments are ensuring that public policies,
financial regulation and investment conditions are designed to enable
shifting investment flows into climate business. This includes helping
to grow demand for green finance, using blended finance in a way that
maximizes scarce public funds, and putting in place the right policies
and incentives—such as carbon pricing—that level the playing field for
investors.
When considering how to attract private finance for low-carbon
investment opportunities, it is important to ensure that different
investment risks are identified and allocated appropriately between
private investors, public entities and consumers. Many risks, such as
construction and operating costs, are generally better managed by
private investors. Other risks are better managed by governments or
development banks, or transferred to consumers. If private investors are
asked to address risks they are not well-placed to manage (e.g., policy
and planning risks), financing costs will be much higher, or private
investors may not be interested in the investment. A strategic approach
to identifying and allocating risks could help to significantly reduce
the overall costs of financing clean infrastructure. In two renewable
generation case studies CPI-Energy Finance analyzed, they found cost
savings of 10 to 40 percent (see Box 53).
Making It Happen: Cross-Cutting Solutions for Market Creation
126 Creating Markets for Climate Business: An IFC Climate Investment Opportunities Report

The right allocation of risks varies depending on the
type of investment and the country context. This
ideal allocation of risks can then be achieved through
a blend of ownership models, policy, regulation
and specific finance instruments. Figure 18 shows a
stylized example of optimal risk allocation for solar
investment in a developing country. This approach
to choosing ownership models and policy/finance
instruments can be applied across all types of
infrastructure investments.
For example:
• Construction and operational cost risks, typically
best managed by private investors, can be
privatized through private ownership models.
• Price and curtailment risks are more difficult
for private investors to manage. Risk exposure
here has a major impact on the private cost of
capital with little offsetting benefit in operating
efficiency. Curtailment risks can sometimes be
addressed through long-term fixed price power
purchase agreements with a state-owned utility
or paid on a “take or pay” basis. Policy risks can
also be partially transferred from private investors
through development bank policy risk insurance
or guarantees.
BOX 53
Getting the risk allocation correct is fundamental to lowering the cost of investments
FIGURE 18: Illustration of achieving an optimal risk allocation for a solar investment in a developing country
(Source: edited from Climate Policy Initiative372)
Development
Construction
Operating
Environmental
Decommissioning
Resource
Curtailment and utilization
Price
Policy
Currency
RISK
PUBLIC RISK PRIVATE RISK
Construction & operational risks can be privatized
through private ownership models
Price & curtailment risks can be socialised through
fixed-price FiTs/PPAs, paid on “take or pay” basis
Some policy risk can be socialized through MDB insurance
Currency risks can be socialized through dollar-indexed PPAs
Pure
pub
lic o
wne
rshi
p
Pure
pri
vate
ow
ners
hip
Ideal allocation of risks Private-owned with government contract
127Making It Happen: Cross-Cutting Solutions for Market Creation

The Task Force on Climate-Related Financial Disclosures: Understanding climate risk and opportunityThe Financial Stability Board established the Task Force
on Climate-Related Financial Disclosures to develop
recommendations for more effective climate-related
disclosures that “promote more informed investment,
credit, and insurance underwriting decisions,” that in
turn “would enable stakeholders to understand better
the concentrations of carbon-related assets in the
financial sector and the financial system’s exposures
to climate-related risks.”373 The task force developed
four recommendations on climate-related financial
disclosures that apply to organizations across sectors
and jurisdictions. The recommendations are structured
around four thematic areas that represent core
elements of how organizations operate:
• Governance— The organization’s governance of
climate-related risks and opportunities.
• Strategy—The actual and potential effects of
climate-related risks and opportunities on the
organization’s business, strategy, and financial
planning.
• Risk management—The processes used by
the organization to identify, assess and manage
climate risks.
There have been strong statements of support
from market actors, including members of the
World Economic Forum’s Alliance of CEO Climate
Leaders.374 In addition, 13 of the world’s leading
banks, with more than $7 trillion in assets, have
launched a pilot program to implement the task
force’s recommendations, with support from the
United Nations Environment Programme Finance
Initiative.375
“These recommendations are very welcome. The
impact of climate change and the transition to a
lower-carbon economy deserve board-level scrutiny
and governance. Independent research commissioned
by HSBC shows that less than a quarter of companies
currently disclose their environmental impact. This
makes it very difficult for analysts and investors to
assess and compare how sustainable these companies
are. These recommendations are a practical and
pragmatic response to the need for consistent and
comparable climate-related financial disclosure.”
— Stuart Gulliver, Chief Executive Officer, HSBC376
www.fsb-tcfd.org
BOX 54
Metrics and Targets
Risk Management
Strategy
Governance
• Metrics and targets—The metrics and targets
used to assess and manage relevant climate-
related risks and opportunities.
The Task Force also encouraged forward-looking
information through scenario analysis, including a two
degree Celsius or lower scenario, to help investors
and other stakeholders understand how resilient
organizations’ strategies are to climate-related risks.
128 Creating Markets for Climate Business: An IFC Climate Investment Opportunities Report

129Making It Happen: Cross-Cutting Solutions for Market Creation

Knowledge is power: Building private sector climate resilience
Events like heatwaves, droughts, storms, and floods
are becoming stronger and more frequent. The
global costs of extreme weather and climate events
are already on the order of tens of billions of dollars
annually—in the United States alone in 2016 they
amounted to more than $50 billion.377 These dramatic
changes can have significant effects on companies’
operations and market conditions in general.
Given that information is central to operations and
investments, the ability to anticipate and manage
the direct and indirect effects of climate change is an
increasing concern for business.
A recent report378 done by the National Business
Initiative in South Africa surveyed businesses on
emerging climate adaptation practices, challenges
and needs. Companies asked for locally relevant
climate data and tools to help them better
understand impacts on a facility and operational
level. This reinforces findings of an earlier adaptation
market study379 done in Turkey by IFC, which found
that companies want information about changing
climate conditions that are relevant for their
operations and investments.
Many companies are becoming more climate
resilient by incorporating improved climate
information in their business decisions. Bodegas
Torres, a Spanish winemaker that produces wine in
Spain, Chile and the United States and distributes
its products to over 140 countries, is using models
to examine the impacts of increased frequency and
intensity of heatwaves and droughts in the future.
Having that information allows the company to
address risks, by investing in grape varieties that
are better adapted to changing conditions and
by introducing new management practices. The
company is also acquiring land where climate
conditions today do not allow proper grape ripening
but where, the models show, conditions will be
optimal in the near future.
Better climate information can also help insurance
companies structure and offer products that can
protect against the new weather extremes. While
businesses are adapting their operations to the
new climate normals, financial impacts of the new
extremes—weather events that have low probability
of happening even when accounting for the current
effects of climate change—can be mitigated by using
such insurance products.
Some multilateral development banks are developing
informational tools and products to help improve
climate resilience and adaptation interventions in the
private sector. For example, in addition to providing
financing, IFC is developing sectoral climate risk
management tools that help companies assess the
effects of climate change on their operations, and
informational tools that identify adaptation options
and investments for specific sectors. These tools
begin to respond to the private sector’s need for
locally relevant climate change data.
For example, a tool for the forestry and pulp and
paper industry evaluates events that can be expected
in the near future at specific locations, such as forest
fires, drought, the spread of pests and diseases, and
changes in precipitation and floods. It also shows
the geographical change in the optimal growing
zones for commercial species, allowing companies
to identify new regions where species may be
successfully grown. Similar tools are available for
other sectors, such as ports and waterways, roads,
and airports. The African Development Bank is
developing a new adaptation benefit mechanism380
that seeks to help private clients identify adaptation
investments by communicating a price signal that
spurs developers to adopt resilient technologies.
BOX 55
130 Creating Markets for Climate Business: An IFC Climate Investment Opportunities Report

131Making It Happen: Cross-Cutting Solutions for Market Creation

Pathways that governments can take to catalyze green finance flows
include: leveraging green lending through the commercial bank market,
supporting the green bonds market, or establishing a green investment
bank (as well as blended finance, see section below). Regardless of which
pathway is taken, there are three basic principles that apply:383
• Establish green finance typologies and standards consistent with
policy targets and green finance needs.
• Set clear guidelines for evaluating and selecting green projects, and
managing money flows.
• Ensure transparency and reporting to track progress and avoid
“greenwashing” (when an entity claims to be more environmentally
friendly than it really is), which could undermine confidence in green
finance.
G R E E N L E N D I N G
Green lending practices are at various stages of development in different
countries. A bank’s response to environmental challenges depends on its
size and capacity, as well as the market and regulatory context in which
it operates. Challenges include:
• No universally accepted framework for green lending.
• A maturity mismatch for lending: Short-term funding of long-term
assets.
• Lack of environmental, social and governance information.
• The inability of the banking sector to fully assess the highly complex
and evolving risks associated with climate change (see Box 54).
A survey of IFC’s financial clients in 2016 revealed that 61 percent of the
responding institutions provided climate-related or green financing, but
only a small percentage of bank lending is explicitly classified as green
because of a lack of consistent, easily accessible definitions.384 Banks’
lending capacity is also constrained by capital requirements—depending
on the state of capital markets, banks can consider selling or securitizing
their loan books to address this issue. To address green finance
China leads the way to greener finance
China needs to mobilize private capital on a massive
scale to finance the carbon-emission reduction it has
pledged to achieve. China introduced Green Credits in
2012381 and is, to date, the only country to have introduced
standardized mandatory reporting on green loans for
its largest banks. It has established the world’s biggest
green credit market, with more than $1 trillion in green
credits.382 The loans cover energy saving, green transport,
pollution treatment, and resource recycling. China has
also created guidelines to encourage private capital
to invest in green sectors while restricting investment
in polluting industries. It plans to use public funds to
improve the returns on green projects, through interest
subsidies, for example, while reducing perverse subsidies
and raising taxes on pollution.
“There is a strong momentum globally to use green
finance solutions to drive private investment needed to
address environmental and climate challenges. China has
developed definitions and disclosure rules for several green
finance products, including green loans and green bonds,
and is aggressively pushing for new instruments such
as green investment funds, green insurance and carbon
finance. The central and local governments will introduce
additional incentives to unlock private capital at the scale
for green and sustainable investment.”
— Dr. Ma Jun, Chairman of Green Finance Committee of the China Society for Finance and Banking and Co-chair of G20 Green Finance Study Group
BOX 56
132 Creating Markets for Climate Business: An IFC Climate Investment Opportunities Report

challenges, G20 members—and China and Germany in particular—have
prioritized green finance (see Box 56).
The market is innovating. Dutch Bank ING recently launched a new
type of green loan for general corporate expenditures. The loan does
not have conditions for the green use of proceeds; instead, a company’s
overall sustainability performance and rating determine the interest to
be paid on the loan. If the rating goes up, the interest rate goes down—
and vice versa. For example, in April 2017, electronics giant Philips
entered a revolving credit facility of €1 billion with ING using this
approach. The deal is the first in the syndicated loan market where the
pricing is linked to the lender’s sustainability rating. It is supported by a
consortium of 16 banks, including Goldman Sachs, HSBC, and Morgan
Stanley. This innovation recognizes that sustainable companies are
better credit risks and provides an additional incentive for companies
to improve their sustainability performance. ING funded more than
€27 billion to clients aiming to green their operations in the first two
quarters of 2016 and the market is growing.385
G R E E N B O N D S
A green bond is distinguished from a regular bond by its proclaimed
commitment to exclusively use the funds raised to finance projects with
clear environmental benefits. Green bonds can provide long-term sources
of debt capital to match the funding required for long-term green
infrastructure projects, helping countries achieve their climate targets.
While there are currently no global standards for green bonds nor a
definition of “green” in the context of eligible assets, there are several
initiatives that underpin the generally used nomenclature. The Green
Bond Principles,386 Climate Bond Standards,387 assurance providers and
benchmark indices all play an important role in promoting transparency
and integrity in the development of the green bond market through
various frameworks, taxonomies and qualifying criteria on bond issues
and categories of eligible projects. Green bonds can directly finance
or refinance investments that could allow for “recycling” of lending
capacity, leading to increased lending. Green bonds are increasingly
attracting a much more diverse base of investors, pooling in new capital
into climate business. As project sponsors learn more about green bonds,
Colombian banks: creating markets for climate business via green bonds
The Colombian banking sector has taken the lead in Latin
America in addressing climate change by deploying green
bonds to scale up climate finance. Bancolombia and
Davivienda were the first private banks Latin America to
issue green bonds, mobilizing private finance that will help
Colombia achieve its NDC pledge of reducing emissions by
20 percent. Bancolombia is using the funding to step up its
lending to green buildings that reduce water and energy
consumption by as much as 40 percent, while Davivienda
will finance projects that address flooding risk, improved
water management and the production of cleaner energy.
IFC fully acquired both issuances, opening the door for
institutional investors to invest in these instruments in the
region, and helped the banks to follow the Green Bond
Principles, helping establish this standard as the reference
for new issuances. Other banks in the region are expected
to follow this example.
www.ifc.org
BOX 57
133Making It Happen: Cross-Cutting Solutions for Market Creation

Green finance innovations continue to create new markets
IFC recently partnered with the asset management
company Amundi to launch the world’s largest green
bond fund dedicated to emerging markets—the
Green Cornerstone Bond Fund. The $2 billion fund
will buy green bonds issued by banks in developing
countries, which in turn will encourage more
local financial institutions to issue green bonds by
increasing global demand and building local markets.
“This innovative partnership with IFC is a major
achievement for Amundi, the leading European
asset manager. This project highlights the strong
capabilities in green financial innovation of Credit
Agricole Group. I consider this project as a game
changer: it is both an investment opportunity for
institutional investors and it will have an impact on
society by accelerating the shift of emerging markets
toward a green economy.”
— Xavier Musca, Amundi SA
Zurich Insurance Company recently fulfilled its
pledge to buy $2 billion of green bonds—about
three-and-a-half years after announcing the target.
The company could have met its mandate sooner,
but part of the objective was to help the market
grow and develop. Zurich has invested in more than
120 green bonds from 75 issuers in seven currencies.
“The next stage of the evolution of the market is
probably one in which there’s much more clarity and
objectivity in the assessment of greenness.”
— Urban Angehrn, Group Chief Investment Officer, Zurich Insurance Group
The market is also testing new green bond models,
including the green sukuk388 and green coupon
bonds like IFC’s Forest Bond. The first green sukuk
was recently issued in Malaysia by Tadau Energy,
a renewables company. The proceeds of the 250
million Malaysian ringgit ($58 million) bond will be
used to finance a 50 MW solar power project. The
green sukuk could encourage green finance growth
in Islamic regions in the Middle East, Asia, and Africa.
In October 2016, IFC issued a Forest Bond, a first of
its kind, to reduce emissions from deforestation and
forest degradation (REDD) and develop sustainable
economic opportunities for communities in Kenya.
The bond gives investors the option of getting
repaid in either carbon credits or cash, and raised
$152 million—with $12 million targeted directly at
reforestation efforts.389
Financial institutions are also collaborating as never
before to open up new markets for climate business
for climate business, including via the Catalytic Finance Initiative.
"We launched the Catalytic Finance Initiative in
2014 to accelerate investments into high-impact
clean energy and other sustainable opportunities.
Financial innovation and capital play a critical
role in the transition to a low-carbon economy.
Together with our partners, including IFC, we have
already succeeded in raising more than $8 billion
for investments. This is demonstrating the power
of partners working together on innovative green
finance to achieve a greater collective impact.”
— Anne Finucane, Vice Chairman, Bank of America
BOX 58
134 Creating Markets for Climate Business: An IFC Climate Investment Opportunities Report

projects are structured in a manner to attract green bond financing
which should in time increase project pipelines.
The growth in green bonds and investor demand indicates that the
market could significantly help increase green capital flows. The size of
the global green bond market stands at $221 billion in 2017, and saw a
six fold rise between 2013 and 2016.390 While this is impressive, there is
ample room for growth.
Initially, the market was driven by multilateral institutions, but now
there is a range of issuers, with an increasing number of corporations,
banks, municipalities, and governments issuing green bonds. The
European Investment Bank, German development bank KfW and the
World Bank are still the largest issuers, but Chinese SPD Bank is in
fourth place, and among corporates, Iberdrola, TenneT Holding, and
French energy companies EDF and Engie round out the top 10.391 The
geographic base is also expanding. Since 2016, about 35 percent of
green bonds were issued in emerging markets.392 The first sovereign
green bond was issued by Poland in December 2016, followed by France
in January 2017. Sovereign issuance is expected to grow; in October
2017, Fiji became the first emerging market to issue a sovereign green
bond, raising 100 million Fijian dollars, or $50 million, to support
climate change mitigation and adaptation.393
Green sovereign bonds allow governments to raise capital to implement
infrastructure plans in line with their NDCs. A sovereign green bond
can provide liquidity and scale to a market, attracting other corporate
issuers and new investors. It can also improve collaboration between
ministries and improve policy certainty in the country. Green bonds
are playing an increasing role in helping cities to finance climate-smart
urban infrastructure. Green bonds issued to fund climate-smart cities
grew to $10 billion in the first half of 2017, up by 61 percent from
the previous year.394 However, few cities in emerging markets have
issued green bonds, largely as a result of their low credit standing.
Johannesburg in South Africa issued a 1.5 billion rand green bond in
2014 and Cape Town issued a 1 billion rand green bond in 2017. These
bonds fund renewable energy, water, and sanitation projects.
135Making It Happen: Cross-Cutting Solutions for Market Creation

The green bond market faces several challenges, including an insufficient
pipeline of bankable projects, a lack of commonly accepted standards
and definitions, underdeveloped local bond markets, and a scale
mismatch between projects, bonds, and institutional investors. To
address these issues, policymakers can develop green bond guidelines
and build market capacity through dedicated green bond market
programs. These programs may focus on enhancing credit to improve
the rating of the bond, introducing tax incentives for investors or
issuers, and reducing the cost of bond issuance and reporting.
All green finance approaches—green banking, green investment
banks, and green bonds—send a positive signal to the marketplace
and other countries that a country or region is seeking to become a
leader in private low-carbon investments. It is important to note that
they complement, but do not replace, the need for progressive climate
policies that create the conditions to stimulate low-carbon investments.
G R E E N I N V E S T M E N T B A N K S
Governments can establish dedicated green investment entities to
overcome investment barriers and leverage public finance. Green
investment banks are entities that are established to facilitate private
investment in low-carbon and climate-resilient infrastructure. They
catalyze investment by decreasing risks, increasing market transparency,
and improving investor and lender understanding of low-carbon
investments. Many green investment banks take on risks that other
financial actors would avoid by providing some type of concessionality,
such as longer loan tenors. There is a similarity between these entities
and blended finance approaches (see below).
Thirteen governments (national, provincial/state, and local) have tested
different models for green investment banks—nearly all in OECD
countries.395 They have successfully mainstreamed new technologies and
business models, and brought in private capital. While green investment
banks differ in scope and approach, they have similar mandates, have
the independence to design and implement interventions, and share
a focus on cost-effectiveness and performance. Governments have
capitalized these banks using a variety of funding sources, including
government appropriations and programs, revenue from carbon taxes,
emissions trading schemes, utility bill charges, and bonds.
Green investment banks use a range of financial instruments, including
senior and subordinate loans and equity. They also use various risk
management strategies such as loan loss reserves, guarantees, or
insurance alongside warehousing, securitization, co-investing, on-bill
financing and leasing. These banks typically have a mandate to avoid
“crowding-out” private investment and often finance riskier projects,
such as new technologies with less attractive risk-return profiles. Banks
can demonstrate accountability and validate performance by using
metrics to measure and track their performance, including emissions
reductions, the private investment mobilized per unit of bank spending,
and rates of return.
When setting up a green investment bank, it is important to consider:396
• Administration, mandate, and independence. Will the bank be a new
entity, or can existing entities be adapted?
• Capitalization and financial sustainability. How much capital is
needed? How will the bank be funded? Will there be a profit or other
leverage target established?
• Leadership and staffing. Green investment banks require strong
private sector expertise in transacting business, building a financially
sound portfolio, and mobilizing private capital. The staff should be
independent of the political decision-making process.
• Oversight, transparency, and accountability. How will success be
tracked and reported? What are the most important targets?
In emerging markets, green investment banks should ideally be set up
as public-private partnerships that can combine public resources with
private sector expertise and investment rigor. One example of this
approach is Tata Cleantech Capital Limited, a joint venture between
Tata Capital and IFC. Tata Cleantech has worked with over 40 clients
to identify, evaluate and fund renewable energy, energy-efficiency and
water treatment investments.397 This model can be repeated to scale up
investments in other regions.
136 Creating Markets for Climate Business: An IFC Climate Investment Opportunities Report

Mocuba Solar: Blended finance for mitigation and adaptation in Mozambique
Mozambique’s electrical grid infrastructure has not
kept pace with domestic demand for accessible and
reliable modern energy supply.398 Only 40 percent of
Mozambican households have access to electricity—
with rural electricity access at 27 percent.399
Responding to these challenges, Norway-based
independent power producer Scatec Solar partnered
with Mozambique’s electricity utility (Electricidade
de Moçambique) and Nortec, Norway’s development
finance agency, to develop the country’s first utility-
scale solar PV plant in Mocuba. The $76 million
project will help deliver power to a rural area in one
of the least-developed regions. Mocuba Solar will
also contribute to climate resilience and adaptation
by diversifying Mozambique’s electricity generation
mix and reducing dependence on the country’s
isolated northern grid. The project, operated
under a 25-year power purchase agreement with
Electricidade de Moçambique, will also produce
electricity more affordably than fossil-fuel-based
alternatives.
Representing its first engagement in Mozambique’s
renewable energy sector and first solar PV project in
Sub-Saharan Africa, IFC arranged a $55 million debt
finance package for the Mocuba Solar project. This
includes a $19 million loan from IFC, $19 million from
the Climate Investment Fund's Pilot Program for
Climate Resilience, and a $17 million syndicated loan
from the Emerging Africa Infrastructure Fund. The
project also received a $7 million viability gap funding
grant from the Private Infrastructure Development
Group. The remaining $14 million in project costs
was raised by selling of equity in the project
company, Central Solar de Mocuba S.A. While recent
macroeconomic instability has shaken investor
confidence in Mozambique, projects like Mocuba are
demonstrating how Mozambican renewable energy
projects remain a viable and attractive opportunity
for commercial financing.
www.ifc.org
BOX 59
137Making It Happen: Cross-Cutting Solutions for Market Creation

H O W C A N B L E N D E D F I N A N C E H E L P D E L I V E R N D C I N V E S T M E N T G O A L S ?
Blended finance—combining concessional funds and commercial
financing—can help create markets in climate-smart industries and
contribute to a country’s transition to a low-carbon economy. Private
sector investors and financiers generally look for a track record
before making investment decisions, but emerging sectors and new
companies have limited or no history of operational and financial
performance, which makes them a high risk for investors. Blended
finance demonstrates to private developers and financiers that these
sectors can be profitable, which in turn can stimulate a series of follow-
on investments, often on fully commercial terms. Most, if not all,
NDCs will require new and additional investments in climate-friendly
technologies and projects, particularly from the private sector. Blended
finance can play an important part to catalyze these investments.
When done well, blended finance serves as a highly effective catalyst
for high-risk, nascent markets in developing countries. Since 2010,
IFC has blended $442 million in concessional climate finance from
donors to support climate mitigation and adaptation investments. These
concessional funds leverage about $1.4 billion in IFC cofinancing and
roughly $4 billion in third-party financing. These investments have
supported pioneering projects, including innovative energy-efficiency
financing in Turkey, solar PV facilities in Thailand, and a solar PV plant
in Mozambique.
Poor use of concessional climate finance in private sector investments
can lead to market distortions, such as over-subsidization, windfall
gains, and inappropriate risk allocation, that undermine market creation
and transformation. Proper use of blended finance requires a careful
understanding and navigation of these potential pitfalls, by promoting
adherence to high standards of governance by private sector clients and
entities that undertake blended finance operations.
C R E AT I N G M A R K E T S F O R G R E E N I N N O VAT I O N
The investment needs in green sectors for developing countries are
expected to be immense, with huge opportunities for local firms.
According to a report released by the World Bank Group, Building
Competitive Green Industries, up to 25 percent of climate investments
in developing countries are available for local small and medium
enterprises.400 Innovation is taking place in many emerging markets as
clean technology is transformed into commercial business opportunities.
Another World Bank Group report, Innovations for Scaling Green
Sectors, outlines how advances in renewable energy, climate-smart
agriculture, and clean water create opportunities for companies to
address development challenges with cleaner, more climate-friendly
technologies and practices.401
There are many opportunities to grow
green enterprises in a range of selected
climate markets, including solar home
systems, community water purification,
and drip irrigation.
The first factor to consider is how
climate-related sectors differ from other
sectors. Green sectors are different from
other sectors in that the majority of green
enterprises deliver physical products to
market and are highly dependent on the
quality of regulatory regimes and the
public sector in general. Green businesses
can have high upfront capital needs and commonly take longer to reach
profitability than enterprises in more well-established sectors.
Emerging models offer lessons for how governments can create markets
that drive climate innovation with successful local private sector
participation. World Bank Group initiatives like Climate Competitive
Industries402 and the Climate Technology Program403 help local private
sector actors take advantage of opportunities for climate innovation.
These and other efforts provide a blueprint for actions that governments
can take to foster private sector-led innovation in this area.
Although experimentation and iteration are needed to encourage new
green markets to grow, there are a few specific actions that stakeholders,
including governments, development finance institutions, entrepreneurial
138 Creating Markets for Climate Business: An IFC Climate Investment Opportunities Report

(Source: Coady et al., 2015)
FIGURE 19: Projected fiscal benefit of removing fossil-fuel subsidies and reforming the price of energy
support organizations, and impact investors, can take to encourage
green sectors in developing countries.
G E T T I N G T H E P R I C E S R I G H T: F O S S I L- F U E L S U B S I D Y R E M O VA L A N D C A R B O N P R I C I N G
An important tool to attract private finance for the low-carbon
transition is to get the prices right—eliminating counterproductive
subsidies and putting a price on carbon pollution. Finance ministries
play a central role in achieving national climate targets. They can
integrate cost-effective climate policies into national development
strategies and budget processes, eliminate fossil-fuel subsidies, reflect the
cost of externalities in energy prices, address equity and competitiveness
in mitigation policies, and put in place fiscal buffers and contingency
plans to ensure fiscal sustainability. Recognizing this pivotal role, the
World Bank Group has created the Climate Action Peer Exchange, a
forum for peer exchange for finance ministers. The initiative brings
World
Latin America and the Caribbean
Advanced
Emerging Europe
E.D. Asia
Com. of Ind. States
Sub-Saharan Africa
Middle East and North Africa
World
Latin America and the Caribbean
Advanced
Emerging Europe
E.D. Asia
Com. of Ind. States
Sub-Saharan Africa
Middle East and North Africa
World
Latin America and the Caribbean
Advanced
Emerging Europe
E.D. Asia
Com. of Ind. States
Sub-Saharan Africa
Middle East and North Africa
US$
bill
ions
$ billions (nominal)
Percent
Perc
ent o
f rev
enue
Perc
ent o
f GD
P
0
0 10 20 30 40
500 1,000 1,500 2,000 2,500 3,000 3,500
Coal Petroleum Natural Gas Electricity
139Making It Happen: Cross-Cutting Solutions for Market Creation

• Creating new institutions or strengthening existing ones to support
reform.
• Using the fiscal space created for wider public goods.
• Reallocating the resources saved to those groups most affected by
reform by adopting complementary measures.
• Setting credible and predetermined timeframes for phasing out
subsidies, staggering the elimination of different subsidies, and
ideally undertaking reform as part of broader sector- or economy-
wide reforms.
C A R B O N P R I C I N G
Complementing subsidy removal, governments can use carbon pricing to
level the playing field for private investment in cleaner solutions, while
generating revenue that can be used to help transition away from fossil
fuel and other industries. There has been a strong resurgence in interest
in carbon pricing in recent years, with 81 NDCs mentinoing carbon
pricing as a strategy to achieve their targets. Over 42 national and 25
subnational governments are pricing carbon today, covering 15 percent
of global emissions. Progressive companies are taking note and pricing
carbon internally, while supporting government pricing policies through
initiatives like the Carbon Pricing Leadership Coalition.409 More
than 1,400 companies, including more than 100 Fortune Global 500
companies with collective annual revenues of about $7 trillion, are using
an internal carbon price or plan to do so soon.410
The Carbon Pricing Leadership Coalition, OECD, and International
Monetary Fund developed the FASTER Principles for Successful Carbon
Pricing, which capture the elements of a well-designed carbon pricing
system:411
• Fairness: Reflect the “polluter pays” principle and contribute to
distributing costs and benefits equitably, avoiding disproportionate
burdens on vulnerable groups.
• Alignment of policies and objectives: Use carbon pricing as one of a
range of measures that facilitate competition and openness, ensure
together finance ministers, senior technical staff, and other relevant
stakeholders to design climate-smart macroeconomic policies, discuss
fiscal policy measures for mitigating the impact of climate change, and
develop financing strategies for implementing NDCs.404
S U B S I D Y R E F O R M
Countries pay enormous subsidies to fossil-fuel producers and consumers.
These payments frustrate progress toward NDC implementation, and
deprive governments and industry of funds that could be used to finance
a transition towards a more sustainable future. Subsidies also decrease
the competitiveness of low-carbon businesses by discouraging investment
in renewable energy and energy efficiency. Fossil-fuel subsidies amounted
to about $5.3 trillion in 2015, or 6.5 percent of global GDP.405 The
International Monetary Fund estimates that eliminating subsidies in 2013
would have reduced global carbon emissions by 21 percent and fossil-
fuel-related air pollution deaths by 55 percent, while raising revenue of
4 percent of global GDP.406 Subsidy removal will also provide a significant
portion of the $90 trillion needed to finance the sustainable infrastructure
the world needs by 2050.
Many countries have made progress in reforming subsidies for fossil
fuels across a range of sectors. For example, Egypt raised fuel prices by
78 percent in 2014 and is doubling electricity prices over the next five
years; Indonesia raised gasoline and diesel prices by an average of
33 percent in 2013 and by another 34 percent in 2014; India eliminated
diesel subsidies in October 2014 after incremental increases over the
preceding two years; Iran raised gasoline prices by 75 percent in April
2015; and Malaysia raised fuel prices by between 10 percent and
20 percent in 2013, and again in 2014.407
The New Climate Economy recently collected a series of case studies
on fossil-fuel subsidy reform, and found the following key elements of
successful government approaches:408
• Mobilizing resources to support a robust reform process.
• Providing clear, open, and honest information on the scale of
subsidies, their costs and effects, who pays and who benefits, plans for
reform, and complementary measures to be adopted.
140 Creating Markets for Climate Business: An IFC Climate Investment Opportunities Report

equal opportunities for low-carbon alternatives, and interact with a
broader set of climate and non-climate policies.
• Stability and predictability: Implement carbon prices, within a
stable policy framework, that give a consistent, credible, and strong
investment signal.
• Transparency: Be clear in design and implementation.
• Efficiency and cost-effectiveness: Ensure that design promotes
economic efficiency and reduces the costs of emission reduction.
• Reliability and environmental integrity: Allow for a measurable
reduction in environmentally harmful behavior.
Carbon pricing is attractive to business because it generates new revenue
streams that can be used to enhance and support the creation of new
low-carbon markets. In addition to supporting low-income households,
the Carbon Pricing Leadership Coalition reports that revenues have
been used to support low-carbon energy, energy efficiency, research
and innovation, climate-friendly infrastructure, and international
commitments.412 For example, between 2009 and 2012, the states in the
Regional Greenhouse Gas Initiative in the Northeastern United States
directed more than 70 percent of revenues from their cap-and-trade
program to energy efficiency and renewable energy projects that are
estimated to save consumers more than $2 billion in energy use and
deliver 8 million tons of carbon reductions.413
“Carbon pricing is a key instrument to anchor addressing climate
change into our economic system. Putting a price on carbon
will create an economic incentive to speed up the transition to a
low-carbon economy and will unlock the private innovation—
and capital—needed to make the transition from fossil fuels to
the renewable century. In anticipation of this inevitable policy
opportunity, over 1,200 businesses—including Royal DSM—are
already working to ‘future proof’ their companies, by applying an
internal carbon price, for example to their investment decisions.”
— Feike Sijbesma, Chief Executive Officer, Royal DSM
141Making It Happen: Cross-Cutting Solutions for Market Creation

C I T Y C R E D I T W O R T H I N E S S
To attract funds from private investors for climate-smart urban
infrastructure, cities need to be creditworthy. This includes having
credible accounting mechanisms, sound financial management systems,
independent auditing of local government finance and performance
evaluation for local government services. Estimates reveal that only
4 percent of the 500 largest cities in developing countries are
creditworthy in international financial markets and 20 percent in their
domestic context. Creditworthiness is a key requirement for cities
to unlock the long-term resources they need to finance their capital
investments. By reaching investment-grade creditworthiness, local
governments will be able to tap into capital markets and other sources
of sub-national borrowing.
To address this need, the World Bank Group launched the City
Creditworthiness Initiative. This effort includes City Creditworthiness
Academies with hands-on learning programs that teach city leaders
the fundamentals of creditworthiness and municipal finance. Using
a preliminary online self-assessment toolkit, participants develop
a customized preliminary action plan of specific institutional
reforms, capacity building, and other actions that will improve
their creditworthiness and their ability to plan, finance and deliver
infrastructure services. Complementing the Academies, City
Creditworthiness Implementation Programs provide in-depth, multi-
year, on-the-job, customized technical assistance programs to help local
governments strengthen their financial management and performance,
and, wherever possible, pursue market-based financing transactions for
climate-smart infrastructure projects. So far, 261 local authorities across
30 different countries have participated in the Academy training.414
S U P P O R T, T O O L S A N D R E S O U R C E S T O C R E AT E M A R K E T S
As countries move to implement their climate strategies, now more than
ever the private sector is needed—and is ready—to provide technology
solutions, financing and business models. With the right mix of enabling
policies, incentives and targeted finance, the trillions of dollars that are
needed to construct low-carbon infrastructure, finance climate-smart
P U B L I C - P R I VAT E PA R T N E R S H I P S
As local governments move to build the low-carbon, resilient waste,
water and transport infrastructure that they need to meet the demands
of their citizens, they are increasingly looking to the private sector for
solutions. One tool municipalities are employing is PPPs. Many of
today’s climate-related infrastructure projects are PPPs by definition,
even if the partnership is not explicit. The government needs the infusion
of capital, and the innovation, smart technology, and cost-effectiveness
that comes with it, and the private sector is looking for healthy returns
and a clear business model that is driven by predictable regulations,
permits and incentives. PPPs are an important vehicle to promote
cost-effective infrastructure projects that spur innovation. PPPs can
contractually set minimum performance standards that reduce emissions
from the business-as-usual infrastructure investment—for example,
deploying energy-efficient LED streetlights with specific energy-
savings targets, transforming hundreds of tons of municipal waste into
renewable power, or minimum loss reduction targets for water supply.
Other possibilities include contractual incentives for utilization of
renewable energy, including access to a power purchase agreement or
to concessional financing. Governments can use incentives in a PPP to
drive technology innovation, such as via advanced scheduling/logistics
software for urban transport systems. The competitive bidding feature
of PPPs also ensures that developers maximize cost efficiency to have the
least-cost bid, saving money for the government and consumers. PPPs
can also serve to pilot new approaches, and simultaneously contribute to
the preparation of applicable regulations and contractual frameworks—
this develops a model and a framework that can pave the way to create
new markets. Finally, PPPs allow local governments to address climate
resilience in public infrastructure investments, given that they tend
to be longer-term (25 years or more) concessions, thereby allowing
the government to require that future climate impacts like increased
floods or sealevel rise be taken into account in the project’s design and
operation.
142 Creating Markets for Climate Business: An IFC Climate Investment Opportunities Report

B H U B A N E S WA R S T R E E T L I G H T I N G , I N D I A 4 1 5
Through this PPP model, the City of Bhubaneswar
sought bids that offered the highest energy
savings, with a minimum savings of 30 percent. The
winning company committed to save 75 percent on
current energy consumption on the existing street
lighting system by retrofitting 20,000 streetlights.
The winning bidder will invest in and manage
Bhubaneswar’s street lighting system and receive
payments generated by realized energy savings. The
project is expected to generate annual savings to
government of $100,000 and reduce greenhouse-
gas emissions by an estimated 10,500 tons of carbon
dioxide annually. IFC has replicated this project
in Gujarat and taken it to scale in Odisha state by
rolling it out in five cities. Bhubaneswar is part of
India’s Smart City program.
BOX 60
B E L G R A D E WA S T E M A N A G E M E N T/WA S T E -T O - E N E R G Y P P P
The city of Belgrade signed a PPP contract with
Suez Groupe SAS of France and Japan's Itochu
Environment Investment to build and operate a new
waste treatment and disposal complex for 25 years.
The project includes a waste-to-energy plant that
will produce electricity and heat for the city.
This is Serbia’s first large-scale PPP. By successfully
closing the nation’s first PPP transaction, IFC has
helped Belgrade demonstrate the fitness of the
country’s new regulatory framework and institutions,
which are necessary for Serbia to implement PPPs
on a large scale. The success of this project will help
the country bring more projects to the market and
generate greater private sector investment in its
municipal infrastructure.
PPP success stories
The city government was concerned by the
environmental threat posed by the city’s growing
waste problem. The city’s existing landfill in Vinča
is the largest landfill in Europe. It was designed
in the 1970s. “Vinča” is now a 50-meter-high pile
of untreated garbage, releasing leachate and gas
from rotting waste, polluting the soil and air, and
causing numerous spontaneous fires. With the city
generating 500,000 tons of waste each year, this
needed to be fixed. With this PPP, Belgrade can
begin turning its growing environmental problem
into a renewable energy asset, making it a cleaner
and more livable city and helping it comply with
European directives on waste management and
diversion rates.
www.ifc.org
143Making It Happen: Cross-Cutting Solutions for Market Creation

In August 2014, the Creditworthiness Partnership
with the Rockefeller Foundation set out to
support the City of Arusha—member of the 100
Resilient Cities network—in facing a revenue
collection challenge. The City Creditworthiness
Initiative performed an assessment of revenue
sources, a review of the legal environment, and a
study on enhancing the operational design of the
government’s information collection on revenue
sources.
As a result, the city has experienced an average
increase in its revenues of nearly 30 percent.
As Arusha is the first city to operationalize this
collection system, the findings are relevant for
other cities in Tanzania. The positive impact that
the system has had in the city is now being scaled
BOX 61
up country-wide with support from the World
Bank and the national government. Early in 2017,
the government rolled out the system to all local
government authorities, and currently the use of the
collection system has been adopted by 158 out of 168
municipalities.
The analysis and recommendations are also being
used to inform the design of a second additional
financing of the World Bank-funded Tanzania
Strategic Cities Project, currently under preparation
and have helped identify where the gaps and issues
experienced by the city are and how they can be
addressed.
www.worldbank.org/en/topic/urbandevelopment/
brief/city-creditworthiness-initiative
Achieving creditworthiness: The city of Arusha, Tanzania
144 Creating Markets for Climate Business: An IFC Climate Investment Opportunities Report

agriculture and construct green buildings can become a significant
investment opportunity.
A variety of platforms and initiatives are working to address the
growing need for public-private collaboration that achieves NDC
targets by scaling up private sector investment in climate business. These
include the NDC Partnership (See Box 62), the NDC Invest initiative
led by the Inter-American Development bank,416 the Low-Emissions
Development Strategies Global Partnership, which recently launched the
NDC Investment Accelerator,417 as well as NDCi Global, a community
resource to aid implementation and investment in NDCs.418
“There’s plenty of private investment money potentially available
for sustainable investing. But investors need clear market signals,
and a confidence that governments are serious. This is where NDCs
can help hugely, in setting the direction of travel for the coming
decades. We now need to develop private-sector friendly policies,
finance and partnerships that will make these goals a reality.”
— Andrew Steer, President, World Resources Institute
There are many solutions that have already delivered a strong start
towards achieving the promise of the Paris Agreement. By working
together to create markets for these solutions, we can accelerate
ambition—and investment—at the scale that is needed.
145Making It Happen: Cross-Cutting Solutions for Market Creation

NDC Partnership: Accelerating action and Mobilizing FinanceThe NDC Partnership is a global coalition of countries
and international institutions working together to
mobilize support and achieve ambitious climate goals,
while enhancing sustainable development. Launched
at COP22 in Marrakesh, the NDC Partnership aims to
enhance cooperation so that countries have access to
the technical knowledge and financial support they
need to achieve large-scale climate and sustainable
development targets as quickly and effectively as
possible, and increase global ambition over time.
The Partnership is guided by a steering committee
made up of developing and developed nations and
international institutions, and co-chaired by the
governments of Germany and Morocco.
I N - C O U N T RY E N G A G E M E N T
The Partnership engages directly with ministries
and other stakeholders to assess needs and identify
opportunities for collective action across sectors,
regions, and international partners. Through
the Partnership, members provide targeted
and coordinated assistance so that nations can
effectively develop and implement robust climate
and development plans. Leveraging the skills and
resources of multiple partners towards a common
objective, and delivering with speed, is a unique value
proposition that the Partnership brings.
K N O W L E D G E S H A R I N G
The Partnership’s Knowledge and Research
Services help countries implement their NDCs by
fostering learning between countries and by making
information easily accessible. The Partnership
raises awareness of and enhances access to climate
support initiatives, best practices, analytical tools,
and resources. Information to address specific
implementation needs is made available through
online portals, as well as communities and networks
that generate opportunities for knowledge sharing.
The NDC Toolbox Navigator, launched in May 2017, is
a database of tools, resources, and advisory services
to help countries implement their NDCs. It will soon
be complemented by Climate Watch, an exciting
new data platform that brings together data sets on
historical emissions, socio economic indicators, NDC
content, links to the Sustainable Development Goals,
and emissions scenarios.
M O B I L I Z I N G F I N A N C E
Mobilizing finance is key to successful
implementation of the NDCs. In-country, the
Partnership engages closely with finance ministers
and works to bring environment and finance
ministries into greater alignment. The Partnership
supports governments in framing a “Partnership
Plan,” to help connect stakeholders that can provide
technical assistance and mobilize investments.
Equally important, the NDC Partnership helps
countries learn about financing opportunities. The
NDC Funding and Initiatives Navigator, introduced in
November 2016, is a searchable database of funding,
capacity building, and technical assistance available
to support NDC planning and implementation that
includes upcoming grants and technical support for
which countries and organizations can apply.
“We have to do our utmost to achieve the goals
of the Paris Agreement and of the 2030 Agenda.
Supporting our partners quickly and effectively is key.
That is why we have co-founded the global NDC
Partnership. With its strong focus on cooperation
and collaboration, this coalition of developed and
developing countries is linking the global climate
and sustainable development agendas. We can only
achieve these goals if we manage to mobilize the
private sector. The sooner our focus shifts from cost
to opportunity, the faster we will be successful.”
— Dr. Gerd Müller, Federal Minister for Economic Cooperation and Development, Germany
www.ndcpartnership.org
BOX 62
146 Creating Markets for Climate Business: An IFC Climate Investment Opportunities Report

EBRD: Combining policy support, technical assistance and finance to support the green economy Preserving and improving the environment are
central features of a modern, well-functioning
market economy. Recognizing this, the European
Bank for Reconstruction and Development (EBRD)
launched the Green Economy Transition approach
in 2015 to support projects with meaningful
environmental benefits. The initiative seeks to
increase the bank’s annual volume of green financing
from an average of 24 percent over the previous 10
years to 40 percent by 2020. To this end, the bank
uses a combination of financing, technical assistance,
and policy dialogue to deliver sustainable climate
mitigation and adaptation investments. The bank
has had notable successes using this approach in the
Kyrgyz Republic and Kazakhstan.419
BUILDING ENERGY EFFICIENCY IN KYRGYZ REPUBLIC
The EBRD engaged with the Kyrgyz State
Agency for Construction and Architecture to
develop energy performance legislation. The law
was adopted in early 2012, and included a legal
responsibility for building owners and instruments
to promote energy efficiency. The bank helped
Kyrgyz authorities harmonize technical standards
used in building construction with the legislation,
including establishing a state registry of energy
certificates and inspection protocols, and drafting
rules and procedures for accreditation of green
building professionals. By creating a positive policy
environment for energy-efficiency improvements,
the Kyrgyz Republic has seen growing private
investment in building energy efficiency. In 2012, the
EBRD launched a financing facility for local banks
to lend money to building owners and operators
for energy-efficiency investments. The initial credit
facility of $20 million was increased to $35 million in
2016 to accommodate increasing demand.
RENEWABLE ENERGY IN KAZAKHSTAN
More than 70 percent of Kazakhstan’s electricity is
produced in ageing coal-fired plants. The energy
sector accounts for 80 percent of the country’s
carbon emissions. The EBRD has worked with the
government to develop a Sustainable Energy Action
Plan and renewable energy legislation. It has also
facilitated a series of policy dialogues and provided
technical support, resulting in the introduction of a
cost allocation system, draft feed-in tariff support
for renewables, concession award procedures,
standardized power purchase agreements, and
national standards for grid interconnection. In 2016,
the EBRD supported the government’s passing of
green economy legislation that removed several
remaining barriers to financing renewable energy.
The bank has cofinanced the installation of three
renewable energy projects, including a solar power
plant in Burnoye. In 2017, the Burnoye facility
doubled its capacity with the bank’s support,
making it the largest renewable energy generator in
Central Asia.
“The business model of the EBRD is particularly
suited to scale up climate financing by combining in a
practical manner policy dialogue, project preparation,
capacity building and investment with a focus on the
private sector. Through this approach, the EBRD has
developed a broad range of climate mitigation and
adaptation activities which already account for over
a third of its total annual investment. Climate action
with scale and reach!”
— Josué Tanaka, Managing Director of Energy Efficiency and Climate Change, EBRD
www.ebrd.com
BOX 63
147Making It Happen: Cross-Cutting Solutions for Market Creation

The Global Commission on the Economy and Climate comprises former heads of government and finance ministers and leaders in the fields of economics and business to provide authoritative and independent evidence on the relationsihp between actions that strengthen economic performance and those that reduce the risk of climate change.
http://newclimateeconomy.net
The Carbon Pricing Leadership Coalition is managed by the World Bank Group, and comprises over 200 governments, business and civil society groups working together to accelerate the uptake of successful carbon pricing around the world.
www.carbonpricingleadership.org
The World Bank Group's Public-Private Partnerships efforts help to strengthen data, build capacity, develop tools, promote disclosure and encourage stakeholder engagement around PPPs as a solution.
http://www.worldbank.org/en/topic/publicprivatepartnerships
The World Bank Group's City Creditworthiness Initiative provides cities with hands-on learning programs that teach leaders the fundamentals of creditworthiness and municipal finance.
http://www.worldbank.org/en/topic/urbandevelopment/brief/city-creditworthiness-initiative
The NDC Partnership is a global coalition of countries and international institutions working together to mobilize support and achieve ambitious climate goals, while enhancing sustainable development.
www.ndcpartnership.org
Climate Action in Financial Institutions is a coalition of public and private financial institutions around the globe aiming to adopt a pathway to systematically integrate climate change considerations across their strategies, programs and operations.
www.mainstreamingclimate.org
Making it happen: Tools, initiatives and resources
The Global Innovation Lab for Climate Finance helps to identify, design and pilot the next generation of climate finance instruments for all sectors.
www.climatefinancelab.org
The Climate Bonds Initiative is an international organisation working to promote investment in projects and assets necessary for a rapid transition to a low-carbon and climate-resilient economy.
https://www.climatebonds.net/
The Green Bonds Principles are voluntary process guidelines that recommend transparency and disclosure and promote integrity in the development of the green bond market by clarifying the approach for issuing green bonds.
https://www.icmagroup.org/Regulatory-Policy-and-Market-Practice/green-social-and-sustainability-bonds/green-bond-principles-gbp
The UNEP Inquiry into the Design of a Sustainable Financial System works to accelerate the transition to a green economy by identifying best practice, and exploring financial market policy and regulatory innovations.
www.unep.org/inquiry
The World Bank Group's InfoDev Climate Technology Program helps high-growth, clean-tech firms commercialize and scale the most innovative private sector solutions to climate change, and hosts the Climate Innovation Network, which convenes a global conversation that spreads the diffusion of innovative business models across borders and attracts public and private finance.
www.infodev.org/climate
The UN Global Compact Climate Action Platform is designed to help business and investors to contribute to enhancing and accelerating NDC and sustainable development goals action and implementation. The Platform is led by the UN Global Compact together with UNEP, UNFCCC, PRI and WRI.
www.unglobalcompact.org/sdgs/action-platforms
148 Creating Markets for Climate Business: An IFC Climate Investment Opportunities Report

149Making It Happen: Cross-Cutting Solutions for Market Creation

1 World Bank Group (2014), Turn Down the Heat: Confronting the New Climate Normal, available at http://www.worldbank.org/en/topic/climatechange/publication/turn-down-the-heat.
2 IFC (2016), Climate Investment Opportunities in Emerging Markets, available at http://www.ifc.org/wps/wcm/connect/news_ext_content/ifc_external_corporate_site/news+and+events/news/new+ifc+report+points+to+%2423+trillion+of+climate-smart+investment+opportunities+in+emerging+markets+by+2030.
3 The New Climate Economy (2016), Driving Low-Carbon Growth Through Business and Investor Action, available at www.newclimateeconomy.net.
4 Climate Policy Initiative (2015), Landscape of Climate Finance, available at https://climatepolicyinitiative.org/publication/global-landscape-of-climate-finance-2015/.
5 The Global Commission on the Economy and Climate (2016), The Sustainable Infrastructure Imperative: Financing for Better Growth and Development, available at http://newclimateeconomy.report/2016/.
6 The Global Commission on the Economy and Climate (2014), Better Growth, Better Climate: The New Climate Economy Report, available at http://newclimateeconomy.report/2014/.
7 PBL Netherlands Environmental Assessment Agency (2015), Trends in Global CO2 Emissions: 2015 Report, available at http://edgar.jrc.ec.europa.eu/news_docs/jrc-2015-trends-in-global-CO2-emissions-2015-report-98184.pdf.
8 Ibid.9 Business and Sustainable Development Commission (2016), Valuing the SDG Prize in Cities: Unlocking Business
Opportunities to Accelerate Sustainable and Inclusive Growth, available at http://businesscommission.org/news/press-release-companies-pushing-sustainable-urban-infrastructure-could-create-3-7-trillion-annual-windfall-in-2030.
10 See http://www.ifc.org/wps/wcm/connect/Industry_EXT_Content/IFC_External_Corporate_Site/PPP/Priorities/Cities/.
11 Clark, P., Financial Times (May 18, 2017), The Big Green Bang: How Renewable Energy Became Unstoppable, available at https://www.ft.com/content/44ed7e90-3960-11e7-ac89-b01cc67cfeec.
12 Okonjo-Iweala, N., Financial Times (July 25, 2017), Acting on Climate Change is Africa’s Opportunity, available at https://www.ft.com/content/48e7ca40-712e-11e7-aca6-c6bd07df1a3c.
13 Clark, P., Financial Times (May 18, 2017), The Big Green Bang: How Renewable Energy Became Unstoppable, available at https://www.ft.com/content/44ed7e90-3960-11e7-ac89-b01cc67cfeec.
14 Bloomberg New Energy Finance (2016), New Energy Outlook, available at https://about.newenergyfinance.com/international/china/new-energy-outlook/.
15 Ibid.16 Ibid.17 See http://energyandmines.com/2016/05/realizing-energy-savings-sustainable-power-and-enabling-community-
engagement-with-renewables-for-mines/. 18 Bloomberg New Energy Finance (2016), New Energy Outlook, available at https://about.newenergyfinance.com/
international/china/new-energy-outlook/.19 Ibid.20 International Energy Agency (2016), Energy Efficiency Market Report 2016, available at https://www.iea.org/eemr16/
files/medium-term-energy-efficiency-2016_WEB.PDF.21 Ibid. 22 Grantham Institute (2017), Global Trends in Climate Change Legislation and Litigation, available at http://www.lse.
ac.uk/GranthamInstitute/publication/global-trends-in-climate-change-legislation-and-litigation-2017-update/. 23 See https://www.nytimes.com/2017/08/12/world/americas/chile-green-energy-geothermal.html. 24 See http://climateobserver.org/chile-launches-new-national-action-plan-climate-change/. 25 See http://es.presidencia.gov.co/noticia/170214-Fondo-Colombia-Sostenible-maximiza-dividendos-ambientales-de-
la-paz. 26 NDC Partnership website, see http://ndcpartnership.org/country/colombia. 27 See http://www.worldbank.org/en/news/press-release/2017/09/28/finance-ministers-for-climate-action.28 NDC Partnership website, see http://ndcpartnership.org/country/costa-rica. 29 To view Cote d’Ivoire’s NDC, see http://www4.unfccc.int/Submissions/INDC/Published%20Documents/
C%C3%B4te%20d'Ivoire/1/Document_INDC_CI_22092015.pdf. 30 Download Plan Climat at http://www.diplomatie.gouv.fr/fr/politique-etrangere-de-la-france/climat/actualites-
liees-au-dereglement-climatique/actualites-2017-liees-au-dereglement-climatique/article/plan-climat-faire-de-l-accord-de-paris-une-realite-pour-les-francais-pour-l.
31 See http://www.mospi.nic.in/sites/default/files/publication_reports/Energy_Statistics_2017r.pdf.pdf. 32 See https://renewablesnow.com/news/renewables-slice-35-of-power-generation-mix-in-morocco-510884/.
33 NDC Partnership website, see http://ndcpartnership.org/country/morocco. 34 See http://newsroom.unfccc.int/unfccc-newsroom/sweden-plans-to-be-carbon-neutral-by-2045/. 35 See http://www.ifc.org/wps/wcm/connect/news_ext_content/ifc_external corporate site/news+and+events/news/
scaling+solar+delivers+low+cost+clean+energy+for+zambia for more information.36 Bloomberg New Energy Finance (2017), 2Q 2017 Clean Energy Investment Trends.37 REN21 (2017), Renewables 2017: Global Status Report, available at http://bit.ly/2ghNrlA.38 Bloomberg New Energy Finance (2017), McCrone: Companies Buying Green Power—How Big a Trend?, available at
http://bit.ly/2oUih3J.39 International Energy Agency (2016), World Energy Investment Outlook 2016, available at http://dx.doi.org/10.1787/
weo-2016-en.40 See http://spappssecext.worldbank.org/sites/indc/Pages/INDCHome.aspx. 41 REN21 (2017), Renewables 2017: Global Status Report, available at http://bit.ly/2ghNrlA.42 Ibid.43 International Energy Agency (2017), World Energy Investment 2017, available at http://dx.doi.
org/10.1787/9789264277854-en.44 Ibid.45 International Energy Agency (2016), Medium-Term Renewable Energy Market Report 2016, available at http://dx.doi.
org/10.1787/renewmar-2016-en.46 Lazard (2016), Lazard’s Levelized Cost of Energy Analysis—Version 10.0, available at https://www.lazard.com/
media/438038/levelized-cost-of-energy-v100.pdf.47 Ibid.48 Note that the level of cost reduction is not homogenous across countries. Renewable power generation costs are
site specific—see http://www.irena.org/DocumentDownloads/Publications/IRENA_Power_to_Change_2016.pdf ) for more information.
49 Bloomberg New Energy Finance (2017), Long-Term Electric Vehicle Outlook 2017.50 Clean Technica (2016), Global Grid-Connected Energy Storage Capacity to Double in 2016, Skyrocket by 2025,
available at http://bit.ly/2aBHUQy. 51 Lazard (2016), Lazard’s Levelized Cost of Energy Analysis—Version 10.0, available at https://www.lazard.com/
media/438038/levelized-cost-of-energy-v100.pdf.52 Ibid.53 Ibid.54 REN21 (2017), Renewables Global Futures Report: Great Debates Towards 100% Renewable Energy, available at
http://www.ren21.net/wp-content/uploads/2017/03/GFR-Full-Report-2017.pdf.55 International Energy Agency (2016), Medium-Term Renewable Energy Market Report 2016, available at http://dx.doi.
org/10.1787/renewmar-2016-en.56 Frankfurt School-UNEP Centre/ Bloomberg New Energy Finance (2017), Global Trends in Renewable Energy
Investment 2017, available at http://bit.ly/2ntIJnq.57 MAKE (2017), Q1/2017—Global Wind Power Market Outlook Update. 58 International Energy Agency (2016), Medium-Term Renewable Energy Market Report 2016, available at http://dx.doi.
org/10.1787/renewmar-2016-en.59 MAKE (2017), Q1/2017—Global Wind Power Market Outlook Update.60 Bloomberg New Energy Finance (2017).61 Lazard (2016), Lazard’s Levelized Cost of Energy Analysis—Version 10.0, available at https://www.lazard.com/
media/438038/levelized-cost-of-energy-v100.pdf.62 Clean Technica (2016), Global Grid-Connected Energy Storage Capacity to Double in 2016, Skyrocket by 2025,
available at http://bit.ly/2aBHUQy.63 Ibid. 64 International Renewable Energy Agency (2016). Data & Statistics, available at http://resourceirena.irena.org/
gateway/dashboard/.65 International Renewable Energy Agency (2015), Renewable Energy Target Setting, download at http://www.irena.
org/DocumentDownloads/Publications/IRENA_RE_Target_Setting_2015.pdf.66 Cozzi, P. (2012), Assessing Reverse Auctions as a Policy Tool for Renewable Energy Deployment, 7, available at
https://pdfs.semanticscholar.org/2e24/ed2d70df0cd9480b087156d88a647bb67011.pdf.
150 Creating Markets for Climate Business: An IFC Climate Investment Opportunities Report
Endnotes

67 Shrimali, G., Konda, C., Farooquee, A. A., & Nelson, D. (2015), Reaching India’s Renewable Energy Targets : Effective Project Allocation Mechanisms, Climate Policy Innitiative, available at https://climatepolicyinitiative.org/wp-content/uploads/2015/05/150512_Auctions_FINAL.pdf.
68 International Renewable Energy Agency (2015), Renewable Energy Target Setting, available at http://bit.ly/1RGq90i.69 Colthorpe, A. (2017), High Interest in India’s First Utility-Scale Solar-Plus-Storage Tender, available at https://www.
pv-tech.org/news/high-interest-in-indias-first-utility-scale-solar-plus-storage-tender.70 Dalby, C. (2017), China Needs to Priotize Westward Grid Expansion, available at http://www.globaltimes.cn/
content/1035727.shtml.71 Government of India (2014), Draft Scheme for Development of Solar Parks and Ultra Mega Solar Power Projects—
circulation for comments reg, available at http://bit.ly/1AsWWvQ.72 Government of India (2014), Pilot-Cum-Demonstration Project for Development of Grid Connected Solar PV Power
Plants on Canal Banks and Canal Tops, available at http://bit.ly/2fuVAms.73 Mercom Capital Group (n.d.), Mercom Exclusive: Pent Up Demand for Projects Results in Record Low Bid of Rs.3.15/
kWh at the Kadapa Solar Auction in India, available at http://bit.ly/2hrfcIP.74 Deutsches Institut für Entwicklungshilfe (n.d.), German Technology to Boost India’s RE Sector, available at https://
www.giz.de/en/worldwide/26502.html.75 REN21 (2017), Renewables 2017: Global Status Report, available at http://bit.ly/2ghNrlA.76 See International Energy Agency (2017), Getting Wind and Sun onto the Grid: A Manual for Policy Makers, www.iea.
org.77 International Energy Agency (2017), Getting Wind and Sun onto the Grid: A Manual for Policy Makers, available at
https://www.iea.org/publications/insights/insightpublications/Getting_Wind_and_Sun.pdf.78 Ibid.79 Ofgem (n.d.), Electricity Market Reform, available at http://bit.ly/2fuiryz.80 The State of California of the United States of America (2010), AB-2514 Energy Storage Systems, see http://www.
energy.ca.gov/assessments/ab2514_energy_storage.html81 GTM (2017), The Long-Awaited Massachusetts Energy Storage Target Has Arrived, available at http://bit.
ly/2u7QoaW.82 NREL (2014), A Deeper Look into Yieldco Structuring, available at http://bit.ly/1EUDno3.83 Baxter, R. (2016), Energy Storage Financing: A Roadmap for Accelerating Market Growth, available at http://bit.
ly/2h1RDlW.84 GTM (2016), Corporate Power-Purchase Agreements: Proceed Carefully When Buying Renewable Energy, available
at http://bit.ly/2wVAYL0.85 O’Sullivan, F. M. & Warren, C. H. (2016), Solar Securitization: An Innovation in Renewable Energy Finance, available at
http://bit.ly/2w72zJo.86 Baxter, R. (2016), Energy Storage Financing: A Roadmap for Accelerating Market Growth, available at http://bit.
ly/2h1RDlW.87 Macquarie Capital (2017), Macquarie Capital, Advanced Microgrid Solutions and CIT Close Industry-First Battery
Storage Project Financing, available at http://bit.ly/2vTx81m.88 Susi Partners (2017), Energy Transition Infrastructure as Investment Field—SUSI Energy Storage Fund reaches first
closing at 66 million euro, available at http://bit.ly/2jnoB4O.89 Eller, A. & Gauntlett, D. (2017), Energy Storage Trends and Opportunities in Emerging Markets, IFC, available at
http://bit.ly/2pZrubx.90 Bloomberg New Energy Finance/Lighting Global (2016), Off-Grid Solar Market Trends Report 2016, available at
http://bit.ly/2yp8Lcu.91 Bloomberg New Energy Finance (2016), Off-Grid Solar Market Trends Report 2016, available at https://about.bnef.
com/blog/off-grid-solar-market-trends-report-2016/.92 Ibid.93 REN21 (2017), Renewables 2017: Global Status Report, available at http://bit.ly/2ghNrlA.94 Bloomberg New Energy Finance (2017), Off-Grid and Mini-Grid: Q1 2017 Market Outlook, available at http://bit.
ly/2ifHzW7.95 REN21 (2017), Renewables 2017: Global Status Report, available at http://bit.ly/2ghNrlA.96 Eller, A. & Gauntlett, D. (2017), Energy Storage Trends and Opportunities in Emerging Markets, IFC, available at
http://bit.ly/2pZrubx.97 Ibid.98 REN21 (2017), Renewables 2017: Global Status Report, available at http://bit.ly/2ghNrlA.99 International Energy Agency (2016), World Energy Investment Outlook 2016, available at http://dx.doi.org/10.1787/
weo-2016-en.100 REN21 (2017), Renewables 2017: Global Status Report, available at http://bit.ly/2ghNrlA.101 International Renewable Energy Agency (2016), The Power to Change: Solar and Wind Cost Reduction Potential to
2025, available at http://bit.ly/1Yr4yhk.102 International Energy Agency (2016), Medium-Term Renewable Energy Market Report 2016, available at http://dx.doi.
org/10.1787/renewmar-2016-en.103 REN21 (2017), Renewables 2017: Global Status Report, available at http://bit.ly/2ghNrlA .
104 Ibid.105 Ibid.106 Ibid.107 Ibid.108 ESMAP (2015), SIDS Dock Support Program, available at http://bit.ly/2gLoH1v.109 Bardouille, P. & Shepherd, D. (2016), Emergence of a Commercial Market for Mini-Grids in Africa. ESI Africa.110 REN21 (2017), Renewables 2017: Global Status Report, available at http://bit.ly/2ghNrlA.111 Eller, A. & Gauntlett, D. (2017), Energy Storage Trends and Opportunities in Emerging Markets, IFC, available at
http://bit.ly/2pZrubx.112 Ibid.113 Ibid.114 REN21 (2017), Renewables Global Futures Report: Great Debates Towards 100% Renewable Energy, available at
http://www.ren21.net/wp-content/uploads/2017/03/GFR-Full-Report-2017.pdf.115 Bloomberg New Energy Finance/Lighting Global (2016), Off-Grid Solar Market Trends Report 2016, available at
http://bit.ly/2yp8Lcu.116 Hill, J. S. (2016), Global Grid-Connected Energy Storage Capacity to Double in 2016, Skyrocket by 2025, Clean
Technica, available at http://bit.ly/2aBHUQy.117 Sustainable Energy for All (2017), Energizing Finance: Scaling and Refining Finance in Countries with Large Energy
Access Gaps, available at http://www.se4all.org/EnergizingFinance.118 REN21 (2017), Renewables 2017: Global Status Report, available at http://bit.ly/2ghNrlA .119 Ibid.120 Bardouille, P. & Shepherd, D. (2016), Emergence of a Commercial Market for Mini-Grids in Africa. ESI Africa.121 World Bank Group (n.d.), Regulatory Indicators for Sustainable Energy, available at http://rise.esmap.org/.122 Africa Progress Panel (2017), Lights Power Action, available at http://bit.ly/2nxj5Kd.123 World Bank Group (n.d.), Regulatory Indicators for Sustainable Energy, available at http://rise.esmap.org/.124 To download this guide, see http://mnre.gov.in/file-manager/UserFiles/Best-Practices-Guide-on-State-Level-Solar-
Rooftop-Photovoltaic-Programs.pdf. 125 Ibid.126 REN21 (2017), Renewables 2017: Global Status Report, available at http://bit.ly/2ghNrlA.127 Massachusetts Energy Storage Initiative (n.d.), State of Charge, available at http://bit.ly/2drZHtF.128 International Renewable Energy Agency (n.d.), IRENA Project Navigator, available at https://navigator.irena.org/
index.html.129 See https://www.usicef.org/ for more information. 130 Off-Grid Electric (2016), Off Grid Electric Announces $45 Million Debt Financing for Distributed Solar Leasing to
African Households, Raising a Total of $70 Million in Investment this Year, available at http://bit.ly/1Jg8LKE.131 Bloomberg (2016), Nova Lumos Raises $90 Million for Off-Grid Solar in Africa, available at https://bloom.bg/2fIcXz9.132 World Bank Group (2017), Enabling the Business of Agriculture 2017, available at http://eba.worldbank.org. 133 Goedde, L., Horii, M., & Sanghvi, S. (2015), Global Agricultures, Many Opportunities, McKinsey and Company on
Investing, 2, McKinsey and Company, available at http://bit.ly/2k47dCk. 134 Ibid.135 World Bank Group (2017), Enabling the Business of Agriculture 2017, available at http://eba.worldbank.org.136 Food and Agriculture Organization of the United Nations (FAO) (2012), Smallholders and Family Farmers,
Sustainability Pathways, available at http://bit.ly/1gsC43t. 137 For more information, see http://www.worldbank.org/en/topic/agriculture/publication/making-climate-finance-
work-in-agriculture. 138 Consultation with FAO Global Perspectives Studies Team, as well as FAO (2017), The Future of Food and
Agriculture—Trends and challenges, Rome.139 FAO (2017), The Future of Food and Agriculture—Trends and Challenges, available at http://www.fao.org/
publications/fofa/en/.140 Alexandratos, N. and J. Bruinsma (2012) World Agriculture Towards 2030/2050, the 2012 revision. ESA Working Paper
No 12-03. Rome FAO.141 Ibid.142 Goedde, L., Horii, M., & Sanghvi, S. (2015), Pursuing the Global Opportunity in Food and Agribusiness, McKinsey and
Company, available at http://bit.ly/2yvW0wH. 143 CGIAR website, Food Emissions, available at https://ccafs.cgiar.org/bigfacts/#theme=food-emissions. 144 World Bank Group (2016), Foster Climate-Smart Agriculture, available at http://bit.ly/2xzXJo6. 145 See, for example, https://www.theguardian.com/sustainable-business/2017/jul/17/hsbc-investigation-palm-oil-
company-deforestation-allegations-noble-plantations. 146 Herrero, M., Henderson, B., Havlík, P., Thornton, P. K., Conant, R. T., Smith, P., & Gill, M. (2016), Greenhouse Gas
Mitigation Potentials in the Livestock Sector, available at http://www.nature.com/nclimate/journal/v6/n5/full/nclimate2925.html?foxtrotcallback=true.
151Endnotes

147 Gerber, P. J., Steinfeld, H., Henderson, B., Mottet, A., Opio, C., Dijkman, J., & Tempio, G. (2013), Tackling Climate Change Through Livestock: A Global Assessment of Emissions and Mitigation Opportunities, Rome: Food and Agriculture Organization of The United Nations, available at http://bit.ly/1Ttez9O.
148 Goedde, L., Horii, M., & Sanghvi, S. (2015), Pursuing the Global Opportunity in Food and Agribusiness, McKinsey and Company, available at http://bit.ly/2yvW0wH.
149 Hristov, A. N., Oh, J., Lee, C., Meinen, R., Montes, F., Ott, T., & Oosting, S. (2013), Mitigation of Greenhouse Gas Emissions in Livestock Production: A Review of Technical Options for Non-CO2 Emissions, Rome: Food and Agriculture Organization of The United Nations, available at http://www.fao.org/docrep/018/i3288e/i3288e.pdf.
150 FAO (2003), World Agriculture: Towards 2015/2030: An FAO Perspective, (J. Bruinsma, Ed.), Rome: Earthscan Publications Ltd, available at http://www.fao.org/3/a-i5627e.pdf.
151 FAO (2016), World Fertilizer Trends and Outlook to 2019, Rome, available at http://www.fao.org/3/a-i5627e.pdf. 152 Aisenberg, I. (2017), How Precision Farming Can Enable Climate-Smart Agribusiness, EMCompass, IFC, Washington,
D.C.153 FAO (2017), Post-Harvest Loss Management, available at http://bit.ly/2wZYvGu. 154 World Bank Group (2017), Food Systems for an Urbanizing World, Knowledge Product Decision Review, Washington,
D.C: World Bank. 155 Ibid.156 Sheahan, M. & Barrett, C. B. (2017), Review: Food Loss and Waste in Sub-Saharan Africa, Food Policy, 70: 1–12,
available at https://doi.org/10.1016/j.foodpol.2017.03.012. 157 Goedde. L, Horii, M., & Sanghvi, S. (2015), Pursuing the Global Opportunity in Food and Agribusiness, McKinsey and
Company, available at http://bit.ly/2yvW0wH.158 World Bank Group (2017), Food Systems for an Urbanizing World, Knowledge Product Decision Review, Washington,
D.C: World Bank. 159 See FAO website: http://www.fao.org/docrep/t1838e/t1838e16.htm, for more information. 160 Salin, V. (2016), Global Cold Storage Capacity Report, Global Cold Chain Alliance, available at http://www.gcca.org/
resources/publications/white-papers-reports/global-cold-storage-capacity/. 161 Research and Markets (2017), Cold Chain Market by Type, Temperature Type, Technology, Application, and Region—
Global Forecast to 2022, available at https://www.researchandmarkets.com/research/m5qwph/cold_chain_market. 162 Sowinski, L. L. (2014), Latest Cold Storage Trends Focus on Energy Efficiency, Food Logistics, available at http://bit.
ly/2xAZjWB. 163 McFatridge, S. & Murphy, D. (2012), Best Practices for Mainstreaming Climate Change in National Planning Processes:
Annotated Bibliography, International Institute for Sustainable Development, available at http://bit.ly/2wmTrfU. 164 Climate Policy Initiative (2015), Three Tools to Unlock Finance for Land Use Mitigation and Adaptation, available
at https://climatepolicyinitiative.org/publication/three-tools-to-unlock-finance-for-land-use-mitigation-and-adaptation/.
165 Ecoagriculture Partners (2015), Shades of Green: Multi-Stakeholder Initiatives to Reduce the Environmental Footprint of Commercial Agriculture, Greening Export Agriculture in East and Southeast Asia, Washington, D.C: World Bank, available at http://bit.ly/2wmxugR.
166 FAO (2013), Climate-Smart Agriculture Sourcebook, available at http://www.fao.org/docrep/018/i3325e/i3325e.pdf. 167 Ibid.168 Ibid.169 World Economic Forum (2016), Grow Africa: Partnering to Achieve African Agriculture Transformation, available at
http://bit.ly/2xJAPKf. 170 World Bank Group (2015), Climate-Smart Agriculture in Uruguay, CSA Country Profiles for Africa, Asia, and Latin
America and the Caribbean Series, Washington, D.C: World Bank Group, available at http://bit.ly/2xBo5WW. 171 Sanghvi, S., Simons, R., & Uchoa, R. (2011), Four Lessons for Transforming African Agriculture, McKinsey and
Company, available at http://bit.ly/2yIPmV3. 172 Andrieu, N., Sogoba, B., Zougmore, R., Howland, F., Samake, O., Bonilla-Findji, O., Lizarazo, M., Nowak, A., Dembele,
C., & Corner-Dolloff, C. (2017), Prioritizing Investments for Climate-Smart Agriculture: Lessons Learned from Mali, Agricultural Systems, 154: 13–24, available at https://doi.org/10.1016/j.agsy.2017.02.008.
173 Sanghvi, S., Simons, R., & Uchoa, R. (2011), Four Lessons for Transforming African Agriculture, McKinsey and Company, available at http://bit.ly/2yIPmV3.
174 For more information, see the CGIAR Research Program on Climate Change, Agriculture and Food Security website, Climate-Smart Agriculture 101, at http://bit.ly/2wYbyx5.
175 Dalberg Global Development Advisors (2012), Catalyzing Smallholder Agricultural Finance, available at http://bit.ly/2k78E31.
176 Climate Innovation Lab website, see https://www.climatefinancelab.org/news/the-global-innovation-lab-for-climate-finance-launches-four-initiatives-to-drive-billions-in-climate-investment/.
177 Onumah, G. (2010), Implementing Warehouse Receipt Systems in Africa: Potential and Challenges, available at http://bit.ly/2fvc0YI.
178 Giovannucci, D., Varangis, P., & Larson, D. (2014), Warehouse Receipts: Facilitating Credit and Commodity Markets, A Guide to Developing Agricultural Markets and Agro-enterprises, available at http://documents.worldbank.org/curated/en/224521468316149887/Warehouse-receipts-facilitating-credit-and-commodity-markets.
179 FAO (2013), Climate-Smart Agriculture Sourcebook, available at http://www.fao.org/docrep/018/i3325e/i3325e.pdf.
180 World Bank Group (2017), Making Climate Finance Work in Agriculture, available at http://documents.worldbank.org/curated/en/986961467721999165/pdf/ACS19080-REVISED-OUO-9-Making-Climate-Finance-Work-in-Agriculture-Final-Version.pdf.
181 Lucon O., D. Ürge-Vorsatz, A. Zain Ahmed, H. Akbari, P. Bertoldi, L.F. Cabeza, N. Eyre, A. Gadgil, L.D.D. Harvey, Y. Jiang, E. Liphoto, S. Mirasgedis, S. Murakami, J. Parikh, C. Pyke, and M.V. Vilariño, 2014: Buildings. In: Climate Change 2014: Mitigation of Climate Change. Contribution of Working Group III to the Fifth Assessment Report of the Intergovernmental Panel on Climate Change [Edenhofer, O., R. Pichs-Madruga, Y. Sokona, E. Farahani, S. Kadner, K. Seyboth, A. Adler, I. Baum, S. Brunner, P. Eickemeier, B. Kriemann, J. Savolainen, S. Schlömer, C. von Stechow, T. Zwickel and J.C. Minx (eds.)]. Cambridge University Press, Cambridge, United Kingdom and New York, NY, USA.
182 See https://globalabc.org/. 183 International Energy Agency (2017), Energy Technology Perspective 2017—Catalysing Technology Transformation,
available at https://www.iea.org/etp2017/.184 According to the International Energy Agency’s Energy Efficiency Market Report 2016, methodologies for estimating
the incremental investment in energy efficiency are specific to each sector and subsector. The basic principle is that incremental investment reflects money spent for additional energy efficiency over a baseline case for a product or service within the sector. For the building sector, the incremental investment is calculated by intervention—that is, action on the building envelope (insulation and windows) or systems (HVAC and controls)—and whether the building is existing or new (only a small portion of the spending on energy efficiency for new buildings is considered investment).
185 International Energy Agency (2016), Energy Efficiency Market Report 2016, available at https://www.iea.org/eemr16/files/medium-term-energy-efficiency-2016_WEB.PDF
186 Ibid.187 Ibid.188 Navigant Research (2015), Global Building Stock Database, accessible at https://www.navigantresearch.com/
research/global-building-stock-database.189 To access this analysis, visit https://www.edgebuildings.com/technical/presentations/.190 Ibid.191 International Energy Agency (2016), Energy Efficiency Market Report 2016, available at https://www.iea.org/eemr16/
files/medium-term-energy-efficiency-2016_WEB.PDF.192 Ibid.193 Ibid.194 See https://www.theverge.com/2017/9/14/16290934/india-air-conditioner-cooler-design-climate-change-cept-
symphony.195 District cooling, like district heating, is used to provide centralized cooling at the district scale by delivering chilled
water to offices and factories that need cooling through a network of pipelines. In cold countries like Finland and Sweden, CHP plants are used to run absorption refrigerators during summer—greatly reducing electricity usage, while in winter, sea water is used to cool. This greatly reduces the energy needed for cooling. In Middle Eastern countries like Qatar and Kuwait, centralized cooling also helps the governments save on the energy and environmental cost of large-scale air conditioning.
196 As per the International Energy Agency’s Energy Technology Perspective 2017’s 2BDS scenario. This is an annual publication highlighting technological options to help meet the two-degree scenario. The Beyond 2-degree C Scenario sets out a rapid de-carbonization pathway more ambitious than the two-degree scenario. It is an ambitious scenario where savings from green building is likely to cause a gradual decrease.
197 International Energy Agency (2016), Energy Efficiency Market Report 2016, available at https://doi.org/10.1016/j.energy.2004.04.055.
198 Alliance for an Energy Efficient Economy (2017), Transforming the Energy Service Sector in India—Towards a Billion Dollar ESCO Market, available at http://www.aeee.in/wp-content/uploads/2017/08/esco-report.pdf.
199 WRI Ross Center for Sustainable Cities (2016), Accelerating Building Efficiency: Eight Actions for Urban Leader, available at http://publications.wri.org/buildingefficiency/.
200 European Union 2010 Energy Performance of Buildings Directive and the 2012 Energy Efficiency Directive. Nearly zero-energy buildings are defined as buildings that require a low amount of energy to operate, and that use energy provided from renewable sources, to the extent possible, and especially from sources produced on-site or nearby.
201 International Energy Agency (2016), Tracking Clean Energy Progress 2016, available at https://doi.org/10.1787/energy_tech-2014-en.
202 Asian Development Bank (2008), Philippines Phasing Out Incandescent Bulbs to Cut Greenhouse Gas Emissions, available at https://www.adb.org/news/philippines-phasing-out-incandescent-bulbs-cut-greenhouse-gas-emissions.
203 Soares, E. (2016), Brazil: Sale of Incandescent Light Bulbs Prohibited, available at http://bit.ly/1sKN8Ra.204 Suggett, J. (2009), Venezuela Announces Special Measures to Boost Electricity Production, Lower Consumption,
available at https://venezuelanalysis.com/news/4919.205 Kechichian, E. R., Pantelias, A., Reeves, A., Henley, G., & Liu, J. (2016), A Greener Path to Competitiveness: Policies for
Climate Action in Industries and Products. Washington, D.C., World Bank Group, available at http://bit.ly/2yBKfG7.206 International Energy Agency (2016), Tracking Clean Energy Progress 2016, available at https://doi.org/10.1787/
energy_tech-2014-en.
152 Creating Markets for Climate Business: An IFC Climate Investment Opportunities Report

207 International Energy Agency (2015), Achievements of Appliance Energy Efficiency Standards and Labelling Programs: A Global Assessment (Vol. 7), available at https://doi.org/10.1038/NCHEM.2085.
208 Kechichian, E. R., Pantelias, A., Reeves, A., Henley, G., & Liu, J. (2016), A Greener Path to Competitiveness: Policies for Climate Action in Industries and Products. Washington, D.C., World Bank Group, available at http://bit.ly/2yBKfG7.
209 CGAP (n.d.), Bulgaria’s Energy Efficiency and Renewable Energy Source Fund, available at http://ccap.org/assets/CCAP-Booklet_Bulgaria.pdf.
210 Building and Construction Authority (n.d.), $100 Million Green Mark Incentive Scheme for Existing Buildings, available at https://www.bca.gov.sg/GreenMark/gmiseb.html.
211 WRI (2016), Accelerating Building Efficiency: Eight Actions for Urban Leaders, WRI Ross Center for Sustainable Cities, available at http://www.wri.org/sites/default/files/16_REP_Accelerating_Building_Efficiency_0.pdf.
212 C40 (2014), Case Study: Seoul’s Building Retrofit Program, available at http://www.c40.org/case_studies/seoul-s-building-retrofit-program.
213 Jue, E., Johnson, B., & Vanamali, A. (2012), Case Study: Thailand’s Energy Conservation Fund, CCAP, available at http://ccap.org/assets/Thailand-Energy-Conservation-ENCON-Fund_CCAP-Oct-2012.pdf.
214 WRI (2016), Accelerating Building Efficiency: Eight Actions for Urban Leaders, WRI Ross Center for Sustainable Cities, available at http://www.wri.org/sites/default/files/16_REP_Accelerating_Building_Efficiency_0.pdf.
215 C40, USGBC, & WGBC (2015), Green Building City Market Brief, available at http://www.c40.org/researches/c40-usgbc-and-wgbc-green-building-city-market-brief-compendium.
216 IFC (2016), Climate Investment Opportunities in Emerging Markets, available at http://bit.ly/2vfL0Du.217 Liu, F., Meyer, A. S., & Hogan, J. F. (2010), Mainstreaming Building Energy Efficiency Codes in Developing Countries:
Global Experiences and Lessons from Early Adopters, World Bank working paper, no. 204, Washington, D.C.: World Bank, available at http://bit.ly/2fMfxlS.
218 Climate Change Coordination Unit (2014), Climate Finance Loan Schemes: Existing and Planned Loan Schemes in Lebanon, available at http://bit.ly/2fMMajj.
219 Jabbour, M. & El-Guindy, R. (2014), National Energy Efficiency and Renewable Energy Action, available at http://www.rcreee.org/sites/default/files/lebanon_neerea_web.pdf.
220 Source: IFC calculation based on International Energy Agency (2016), Energy Efficiency Market Report 2016, available at https://doi.org/10.1016/j.energy.2004.04.055.
221 Ibid.222 US Green Building Council (2011), Green Buildings for Cool Cities—A Guide for Advancing Local Green Building
Policies, available at https://www.usgbc.org/sites/default/files/GreenBuildingsGreenCities.pdf.223 Institute for Building Efficiency (2012), Driving Transformation to Energy Efficient Buildings, Policies and Actions: 2nd
Edition, available at http://bit.ly/2wJyVXY.224 Pechman, C. (2016), Modernizing the Electric Distribution Utility to Support the Clean Energy Economy, U.S.
Department of Energy, available at http://bit.ly/2fni3yq.225 GRESB (2016), Green Bond Guidelines for the Real Estate Sector, available at http://bit.ly/2vNrq4M.226 Reuters (2016), UPDATE 1-Obvion Plans Europe’s First Green ABS Bond, available at http://reut.rs/2xPF6Kb.227 See https://www.carbontrust.com/client-services/programmes/low-carbon-workplace/. 228 For more information, see https://www.climatefinancelab.org/project/affordable-green-homes/ and http://www.
ihsinvestments.co.za/. 229 See http://www.eeperformance.org/ for more information. 230 PWC (2015), Assessing the Global Transport Infrastructure Market: Outlook to 2025, available at https://pwc.
to/2exB8Nm.231 Ibid.232 Global Fuel Economy Initiative (2016), Fuel Economy State of the World 2016: Time for Global Action, available at
http://bit.ly/2y6sLEO.233 International Energy Agency (2017), Global EV Outlook 2017: Two Million and Counting, available at https://www.iea.
org/publications/freepublications/publication/GlobalEVOutlook2017.pdf; https://www.statista.com/statistics/271537/worldwide-revenue-from-electric-vehicles-since-2010/
234 United Nations Department of Economic and Social Affairs (2014), World Urbanization Prospects, available at http://www.un.org/en/development/desa/news/population/world-urbanization-prospects-2014.html.
235 International Transport Forum (2017), ITF Transport Outlook 2017, Paris, available at http://dx.doi.org/10.1787/9789282108000-en.
236 Global Fuel Economy Initiative (2016), Fuel Economy State of the World 2016: Time for Global Action, available at http://bit.ly/2y6sLEO.
237 Bouton. S, S.M. Knupfer., I. Mihov and S. Swartz (2015), "Urban mobility at a tipping point," Mckinsey & Company, available at https://www.mckinsey.com/business-functions/sustainability-and-resource-productivity/our-insights/urban-mobility-at-a-tipping-point.
238 International Energy Agency (2017), Global EV Outlook 2017: Two Million and Counting, available at https://www.iea.org/publications/freepublications/publication/GlobalEVOutlook2017.pdf.
239 Ibid.240 Ibid.241 Futurism (2017), Norway Says All Cars in the Country Will Be 100% Electric, available at http://bit.ly/2lIp7db.
242 The Guardian (2017), All Volvo Cars to be Electric or Hybrid from 2019, available at http://bit.ly/2tHYR7g.243 International Energy Agency (2017), Global EV Outlook 2017: Two Million and Counting, available at https://www.iea.
org/publications/freepublications/publication/GlobalEVOutlook2017.pdf.244 Ibid.245 REN21 (2017), Renewables Global Futures Report: Great Debates Towards 100% Renewable Energy, Paris: REN21
Secretariat, available at http://bit.ly/2oZaiBc.246 International Energy Agency (2017), Global EV Outlook 2017: Two Million and Counting, available at https://www.iea.
org/publications/freepublications/publication/GlobalEVOutlook2017.pdf.247 European Commission (2011), Roadmap to a Single European Transport Area—Towards a Competitive and Resource-
Efficient Transport System, Brussels, available at http://bit.ly/1NIFdsy.248 BRTData.org (n.d.), Panorama per Country.249 UITP (2015), Light Rail in Figures, available at http://bit.ly/1qvCmgF.250 World Resource Institute (n.d.), CAIT Climate Date Explorer, available at cait.wri.org.251 AMR (2017), Logistics—Global Opportunity Analysis and Industry Forecast, 2014—2022, Portland, U.S.252 McKinnon, A. (2016), Freight Transport in a Low-Carbon World Assessing Opportunities for Cutting Emissions,
available at http://bit.ly/2wV5q3O.253 Jiang, T., Petrovic, S., Ayyer, U., Tolani, A., & Husain, S. (2015), Self-Driving Cars: Disruptive or Incremental, Applied
Innovation Review, 1: 3–22.254 Litman, T. (2014), Autonomous Vehicle Implementation Predictions, Victoria Transport Policy Institute, 28.255 International Transport Forum (2016), Shared Mobility: Innovation for Liveable Cities, Paris, France, available at
http://dx.doi.org/10.1787/5jlwvz8bd4mx-en.256 See https://www.bloomberg.com/news/articles/2016-12-21/china-s-uber-for-trucks-huochebang-said-to-raise-115-
million.257 International Energy Agency (2013), A Tale of Renewed Cities: A Policy Guide on How to Transform Cities by
Improving Energy Efficiency in Urban Transport Systems, Policy Pathway, available at http://bit.ly/1DmurV0.258 McKinsey and Company (2015), Urban Mobility at a Tipping Point, McKinsey Center for Business and Environment,
available at http://bit.ly/1RzulB7.259 GIZ (2016b), Carsharing Services in Emerging Economies, Sustainable Urban Transport Technical Document 12,
available at http://bit.ly/2vYtRxr.260 World Bank Group (n.d.), City Creditworthiness Initiative: A Partnership to Deliver Municipal Finance, available at
http://bit.ly/2yFJDPH.261 International Energy Agency (2017), Global EV Outlook 2017: Two Million and Counting, available at https://www.iea.
org/publications/freepublications/publication/GlobalEVOutlook2017.pdf.262 Brown Jr., G. E. G. B. (2016), ZEV Action Plan 2016: An Updated Roadmap Toward 1.5 Million Zero-Emission Vehicles
on California Roadways by 2025, available at http://bit.ly/2ep0Gzj.263 Xinhua (2017), China to Build More Charging Points for Electric Vehicles, China Daily, available at http://www.
chinadaily.com.cn/business/motoring/2017-02/10/content_28160372.htm.264 OECD (2013), Mobilising Private Investment in Sustainable Transport Infrastructure: The Case of Land-Based
Passenger Transport Infrastructure, available at http://dx.doi.org/10.1787/5k46hjm8jpmv-en.265 International Transport Forum (2017), Local Governments and Ports, International Transport Forum Policy Papers,
Paris, France, available at http://dx.doi.org/10.1787/820a7ecb-en.266 Engel, E. & Galetovic, A. (2014), Urban Transport: Can Public-Private Partnerships Work?, Policy Research Working
Paper, 6873, World Bank , available at http://bit.ly/2uYtuTp.267 GIZ (2016), Urban Freight and Logistics: The State of Practices in India, available at http://bit.ly/2x5ih56.268 International Council on Clean Transportation (2016), India Bharat Stage VI Emission Standards, Policy Update,
available at http://bit.ly/2x5RbuQ.269 Ibid.270 OECD (2016), Water, Growth and Finance: Policy Perspectives, Paris, France.271 ADB (2017), Meeting Asia’s Infrastructure Needs, available at http://bit.ly/2li0jcU.272 WaCCliM (2017), Climate Action in Urban Water Services, available at http://bit.ly/2wPFADe.273 World Bank (n.d), Private Participation in Infrastructure Database, Washington, D.C, available at http://ppi.
worldbank.org/snapshots/sector/water-and-sewerage.274 WaCCliM (2017), Climate Action in Urban Water Services, available at http://bit.ly/2wPFADe.275 World Bank (2016), High and Dry: Climate Change, Water and the Economy, Washington, D.C, available at http://bit.
ly/2pbH4lE.276 Schmidt-Traub, G. (2015), Investment Needs to Achieve the Sustainable Development Goals: Understanding the
Billions and Trillions, New York, U.S.277 Impax (2013), Investing in Water: Global Oppurtunities in a Growth Sector, London, UK.278 Chatterly, M. (2015), IFC Helps Treat Organica Water to $9.1 m. Global Government Venturing, available at http://
www.globalgovernmentventuring.com/news/ifc-helps-treat-organica-water-to-91m.279 Organica Water (2015), Organica Water Closes Series C Financing, Organica, available at https://www.
organicawater.com/organica-water-closes-series-c-financing-nw/.
153Endnotes

280 BCC Research (2013), Global Markets and Technologies for Water Recycling and Reuse, Wellesley, Massachusetts.281 GWI (2013), Industrial Desalination & Water Reuse: Ultrapure Water, Challenging Waste Streams and Improved
Efficiency, Oxford, UK.282 DNV GL AS (2017), Global Opportunity Report 2017, Oslo, Norway.283 BNP Paribas (2013), The Case for Investing in the Water Sector, Paris, France.284 BNP Paribas (2013), The Case for Investing in the Water Sector, Paris, France.285 Voutchkov, N. (2016), Desalination—Past, Present and Future, International Water Association, available at http://
www.iwa-network.org/desalination-past-present-future/.286 Water Reuse Association (2012), Seawater Desalination Costs, Alexandria, Virginia, available at https://watereuse.
org/wp-content/uploads/2015/10/WateReuse_Desal_Cost_White_Paper.pdf.287 IRENA (2012), Water Desalination Using Renewable Energy, Abu Dhabi, UAE.288 Harrington, K. (2015), Saudi Arabia Creates New Solar-Powered Desalination Technology, American Institute of
Chemical Engineers, available at http://bit.ly/2xIrzX9.289 Boccaletti, G., Grobbel, M., & Stuchtey, M. R. (2009), The Business Opportunity in Water Conservation, McKinsey
Quarterly, available at http://bit.ly/2cZOpfy. 290 DNV GL AS (2017), Global Opportunity Report 2017, Oslo, Norway.291 OECD (2009), Private Sector Participation in Water Infrastructure: OECD Checklist for Public Action, Pairs, France.292 World Bank (2016), Integrated Urban Water Management: A Summary Note, Washington, D.C, available at http://bit.
ly/2xtE6y5.293 World Bank (2016), Mainstreaming Water Resources Management in Urban Projects: Taking an Integrated Urban
Water Management Approach—A Guidance Note, Washington, D.C, available at http://bit.ly/2xSci74.294 World Bank (2017), Easing the Transition to Commercial Finance for Sustainable Water and Sanitation, Washington,
D.C, available at http://bit.ly/2xT8cvx. 295 OECD (2009), Private Sector Participation in Water Infrastructure: OECD Checklist for Public Action, Pairs, France. 296 World Bank (2016), Mainstreaming Water Resources Management in Urban Projects: Taking an Integrated Urban
Water Management Approach—A Guidance Note, Washington D.C, available at http://bit.ly/2xSci74.297 IFC (2016), Blending Public and Private Finance, Washington, D.C.298 OECD (2016), Water, Growth and Finance: Policy Perspectives, Paris, France.299 World Bank (2016), High and Dry: Climate Change, Water and the Economy, Washington, D.C, available at http://bit.
ly/2pbH4lE. 300 OECD (2016), Water, Growth and Finance: Policy Perspectives, Paris, France.301 Ibid.302 BNP Paribas (2013), The Case for Investing in the Water Sector, Paris, France.303 OECD (2009), Private Sector Participation in Water Infrastructure: OECD Checklist for Public Action, Pairs, France. 304 World Bank (2017), Easing the Transition to Commercial Finance for Sustainable Water and Sanitation, Washington,
D.C, available at http://bit.ly/2xT8cvx305 Dinar, A. & Subramanian, A. (1997), Water Pricing Experiences: An International Perspective, Washington, D.C.306 World Bank (2017), Easing the Transition to Commercial Finance for Sustainable Water and Sanitation, Washington,
D.C, available at http://bit.ly/2xT8cvx.307 OECD (2016), Water, Growth and Finance: Policy Perspectives, Paris, France.308 IFC (2010), IFC Investment Helps Brazilian Water Company Improve Efficiency and Reduce Water Losses,
Washington, D.C, available at http://bit.ly/2gGfJX2.309 World Bank (2017), Easing the Transition to Commercial Finance for Sustainable Water and Sanitation, Washington,
D.C, available at http://bit.ly/2xT8cvx.310 World Bank (2016), High and Dry: Climate Change, Water and the Economy, Washington, D.C, available at http://bit.
ly/2pbH4lE.311 World Bank (2017), Easing the Transition to Commercial Finance for Sustainable Water and Sanitation, Washington
D.C, available at http://bit.ly/2xT8cvx.312 Ibid.313 City of Johannesburg (2017), Johannesburg Water, available at http://bit.ly/2wRt3is.314 Johannesburg Water (2012), City of Johannesburg: Waste Water to Energy, available at http://bit.ly/2wTUQtY.315 World Bank (2017), Easing the Transition to Commercial Finance for Sustainable Water and Sanitation, Washington,
D.C, available at http://bit.ly/2xT8cvx.316 DFI Working Group on Blended Concessional Finance for Private Sector Projects (2017), available at https://
ifcextapps.ifc.org/ifcext/pressroom/ifcpressroom.nsf/0/875D484A28F7A2A7852581BB006BB88B.317 World Bank (2016), Case Studies in Blended Finance for Water and Sanitation, Washington, D.C available at http://
bit.ly/2w88VV3.318 ESMAP (2012), A Primer on Energy Efficiency for Municipal Water and Wastewater Utilities, Technical Report, 1,
Washington, D.C, available at http://bit.ly/2yDBKu1.319 Climate Finance Lab (2016), Water Financing Facility: Lab Instrument Analysis, available at http://bit.ly/2fceCKV.320 Climate Finance Lab (2017), Netherlands Government Commits EUR 10mn to Water Financing Facility, Marking a
Milestone for Water Finance and Climate Adaptation, available at http://bit.ly/2jLA0LS.
321 Quantified Ventures (n.d.), DC Water’s Green Infrastructure Environmental Impact Bond Overview, available at http://bit.ly/2vHmHlq.
322 Hoornweg, D. & Bhada-Tata, P. (2012), What a Waste: A Global Review of Solid Waste Management. Urban Development Series Knowledge Papers, 15, World Bank, available at http://bit.ly/2rI6nNn.
323 Frost & Sullivan (2014), Global Municipal Solid Waste Management Services Market: Landfill Legislation and Technology Development Drive Market, available at http://bit.ly/2ylThKq.
324 Stiehler, A. (2017), Longer Term Investments: Waste Management and Recycling, UBS, available at http://bit.ly/2frDs9.
325 Hauke. E, Stuchtey, M., & Vanthournout, H. (2016), Managing Waste in Emerging Markets, New York, U.S., available at http://bit.ly/1KBBdNz.
326 Ibid.327 Ibid.328 United Nations Environment Programme (UNEP) (2015), Global Waste Management Outlook, Nairobi, Kenya,
available at http://bit.ly/1LhOTaa. 329 Stiehler, A. (2017), Longer Term Investments: Waste Management and Recycling, UBS, available at http://bit.
ly/2frDs9.330 Ibid.331 Frost & Sullivan (2014), Global Municipal Solid Waste Management Services Market: Landfill Legislation and
Technology Development Drive Market, available at http://bit.ly/2ylThKq.332 Hoornweg, D. & Bhada-Tata, P. (2012), What a Waste: A Global Review of Solid Waste Management, Urban
Development Series Knowledge Papers, 15, World Bank, available at http://bit.ly/2rI6nNn.333 IFC (2014), Waste PPPs, Handshake: IFC’s Quarterly Journal on Public-Private Partnerships, 12, available at http://bit.
ly/2xCgMeQ. 334 For more information, see http://www.c40.org/blog_posts/waste-to-resources-an-incredible-opportunity-to-
reduce-ghg-emissions-and-transform-communities.335 UNEP (2015), Global Waste Management Outlook, Nairobi, Kenya, available at http://bit.ly/1LhOTaa. 336 Ibid.337 Nahal, S., Valery, L., & Dollé, J. (2013), No Time to Waste—Global Waste Primer, Bank of America Merrill Lynch, New
York, U.S., available at http://bit.ly/2woSdkx. 338 Ibid.339 Ibid.340 International Solid Waste Association (2013), Alternative Waste Conversion Technologies: White Paper, available at
https://www.iswa.org/index.php?eID=tx_iswaknowledgebase_download&documentUid=3155. 341 Ecofys (2016), Market Opportunities for Use of Alternative Fuels in Cement Plants across the EU: Assessment of
Drivers and Barriers for Increased Fossil Fuel Substitution in Three EU Member States: Greece, Poland and Germany, available at http://bit.ly/2xazA3k.
342 Brown, M. (2016), Refuse Derived Fuel—A European Market Heading for Overcapacity, Recycling, 2, available at http://bit.ly/2yE3T3A.
343 Frankfurt School & UNEP (2016), Global Trends in Renewable Energy, Frankfurt, Germany, available at http://bit.ly/1RAJA8w.
344 Frost & Sullivan (2017), Global Waste Recycling Market Outlook 2017, San Antonio, U.S., available at https://store.frost.com/global-waste-recycling-market-outlook-2017.html.
345 Hoornweg, D. & Bhada-Tata, P. (2012), What a Waste: A Global Review of Solid Waste Management, Urban Development Series Knowledge Papers, No. 15, World Bank, available at http://bit.ly/2rI6nNn.
346 UN Habitat (2009), Solid Waste Management in the World’s Cities, New York, U.S., available at http://bit.ly/2wpj2VJ. 347 Canvest Environmental Protection Group Company Limited (2017), Capturing Immense Opportunity Creating
Sustainable Growth, Interim Report 2017, available at http://bit.ly/2ykYhio. 348 Ibid.349 UNEP (2015), Global Waste Management Outlook, Nairobi, Kenya, available at http://bit.ly/1LhOTaa. 350 Transparency Market Research (2012), E-Waste Recycling and Reuse Services Market—Global and China
Scenario, Trends, Industry Analysis, Size, Share and Forecast 2010—2017, Albany, U.S., available at https://www.transparencymarketresearch.com/e-waste-recycling-and-reuse-services.html.
351 L.E.K. (2014), Green is Good: The Revolution in Sustainable Packaging, Executive Insights, XVI(27), available at http://bit.ly/2xThFBz.
352 Navigant Research (2016), Smart Waste Collection, available at http://bit.ly/2xWsdQL. 353 Miller, S. (2015), Challenges of Waste to Energy in Emerging Markets, IFC, available at http://bit.ly/2wtlQko.354 UNEP (2015), Global Waste Management Outlook. Nairobi, Kenya, available at http://bit.ly/1LhOTaa. 355 China Public-Private Partnerships Center (2017), China Public Private Partnerships Center: About, available at http://
bit.ly/2x3cE5K. 356 Ibid.357 Tilaye, M. & Van Dijk, M. P. (2014). Private Sector Participation in Solid Waste Collection in Addis Ababa (Ethiopia) by
Involving Micro-Enterprises, Waste and Management Research 32(1): 79–87.
154 Creating Markets for Climate Business: An IFC Climate Investment Opportunities Report

358 UNEP (2015), Global Waste Management Outlook, Nairobi, Kenya, available at http://bit.ly/1LhOTaa. 359 Ibid.360 Hoornweg, D. & Bhada-Tata, P. (2012), What a Waste: A Global Review of Solid Waste Management, Urban
Development Series Knowledge Papers, 15, World Bank, available at http://bit.ly/2rI6nNn.361 Vivid Economics (2014), Financing Green Growth, London, UK, available at http://www.vivideconomics.com/
publications/financing-green-growth. 362 Ibid.363 Qiu, L. (2012), An Analysis of the Economics of Waste-to-Energy Plants in China, Columbia University, available at
http://www.seas.columbia.edu/earth/wtert/sofos/Qiu_thesis.pdf. 364 Zhang, D., Guangqing, H., Yimin, X., & Qinghua, G. (2015), Waste-to-Energy in China: Key Challenges and
Opportunities, Energies 8: 14182–96, available at http://www.mdpi.com/1996-1073/8/12/12422. 365 Ibid.366 For more information, see http://www.pilotauctionfacility.org/. 367 See http://ec.europa.eu/environment/waste/framework/ for more information.368 Frankfurt School & UNEP (2016), Global Trends in Renewable Energy, Frankfurt, Germany, available at http://bit.
ly/1RAJA8w. 369 UNEP (2015), Global Waste Management Outlook, Nairobi, Kenya, available at http://bit.ly/1LhOTaa. 370 See, for example, China’s Guidelines for Establishing the Green Financial System at http://www.pbc.gov.cn/
english/130721/3133045/index.html, and Europe’s High-Level Expert Group on Sustainable Finance, information at http://europa.eu/rapid/press-release_IP-17-2022_en.htm.
371 HSBC (2017), Surveying Corporate Issuer and Investor Attitudes to Sustainable Finance, available at http://www.gbm.hsbc.com/insights/sustainable-financing/attitudes-to-sustainable-finance.
372 CPI-Energy Finance (2017), Financing Clean Power: A Risk-Based Approach to Choosing Ownership Models and Policy/Finance Instruments, available at https://climatepolicyinitiative.org/publication/financing-clean-power-risk-based-approach-choosing-ownership-models-policy-finance-instruments/.
373 Task Force on Climate-Related Disclosure (2017), Final Report, available at https://www.fsb-tcfd.org/wp-content/uploads/2017/06/FINAL-TCFD-Report-062817.pdf.
374 See https://www.weforum.org/agenda/2017/04/global-ceos-call-for-greater-disclosure-of-climate-risks-and-opportunities/.
375 See http://www.unepfi.org/news/industries/banking/eleven-unep-fi-member-banks-representing-over-7-trillion-are-first-in-industry-to-jointly-pilot-the-tcfd-recommendations/.
376 See https://www.fsb-tcfd.org/supportive-quotes/. 377 See https://www.americanprogress.org/issues/green/news/2017/01/19/296860/u-s-communities-clobbered-by-53-
billion-in-extreme-weather-and-climate-disasters-in-2016/ for more information. 378 National Business Initiative (2017), A New Climate of Risk: How South African Businesses Are Adapting to Climate
Change, available at www.nbi.org.za. 379 IFC & European Bank for Reconstruction and Development (EBRD) (2013), Pilot Climate Change Adaptation Market
Study, available at www.ifc.org/climaterisks. 380 See https://www.afdb.org/en/topics-and-sectors/initiatives-partnerships/adaptation-benefit-mechanism-abm/ for
more information.381 China Banking Regulatory Commission (2016), available at http://www.cbrc.gov.cn/EngdocView.
do?docID=3CE646AB629B46B9B533B1D8D9FF8C4A. 382 Reuters (September 2017), China Provides $1 trillion in “Green Credit” by End-June: Regulator, available at http://
www.reuters.com/article/us-china-greencard/china-provides-1-trillion-in-green-credit-by-end-june-regulator-idUSKCN1180T8.
383 G20 Green Finance Study Group Recommendations (2015), available at http://unepinquiry.org/g20greenfinancerepositoryeng/. See also Mainstreaming Climate Action within Financial Institutions: Emerging Practices (2015); access at https://www.mainstreamingclimate.org/wp-content/uploads/2017/03/fi_mainstreaming_epp_en-1.pdf.
384 IFC (2017), Green Finance: A bottom-Up Approach to Track Existing Flows, available at https://www.ifc.org/wps/wcm/connect/70725d70-b14a-4ffd-8360-cb020258d40a/Green+Finance_Bottom+up+approach_ConsultDraft.pdf?MOD=AJPERES.
385 See https://www.edie.net/news/7/Philips-agree-EUR1bn-loan-which-couples-finance-with-sustainability-performance.
386 See https://www.icmagroup.org/Regulatory-Policy-and-Market-Practice/green-social-and-sustainability-bonds/green-bond-principles-gbp/.
387 See https://www.climatebonds.net/standards. 388 “Sukuk” is the Arabic name for financial certificates, also commonly referred to as sharia-compliant bonds.389 For more information, see https://ifcextapps.ifc.org/ifcext/pressroom/ifcpressroom.
nsf/0/594A016A78A7B14E8525805D00461397. 390 Climate Bonds Initiative & HSBC (2017), Bonds and Climate Change: The State of the Market 2017, available at
https://www.climatebonds.net/files/files/CBI-SotM_2017-Bonds&ClimateChange.pdf. 391 Ibid.
392 See https://www.climatebonds.net/2017/09/our-top-5-eu-green-finance-developments-its-all-starting-add.393 See http://www.worldbank.org/en/news/press-release/2017/10/17/fiji-issues-first-developing-country-green-
bond-raising-50-million-for-climate-resilience.394 HSBC (August 2017), Green Bonds and the City, Global Research Report, available at https://www.research.hsbc.
com/R/20/JXVcJCBtzo9L. 395 OECD and Bloomberg Philanthropies (2015), Green Investment Banks: Policy Perspectives, available at https://www.
oecd.org/environment/cc/Green-Investment-Banks-POLICY-PERSPECTIVES-web.pdf.396 Ibid.397 See http://www.tatacleantechcapital.in/about-us/about-tata-cleantech-capital.htm for more information.398 Africa-EU Renewable Energy Cooperation Program, available at https://www.africa-eu-renewables.org/market-
information/mozambique/energy-sector/. 399 International Energy Agency (2016), World Energy Outlook 2016 Electricity Access Database, available at http://
www.worldenergyoutlook.org/resources/energydevelopment/energyaccessdatabase/. 400 World Bank Group (2014), Building Competitive Green Industries: The Climate and Clean Technology Opportunity for
Developing Countries, available at https://openknowledge.worldbank.org/handle/10986/20684. 401 World Bank Group (2017), Innovations for Scaling Green Sectors, available at https://www.infodev.org/climate/
innovations-for-scaling-green-sectors.402 See https://openknowledge.worldbank.org/handle/10986/25852. 403 For more information, see http://www.infodev.org/climate. 404 For more information, see http://www.worldbank.org/en/news/feature/2017/05/10/cape-a-peer-to-peer-
knowledge-exchange-for-finance-ministers-to-combat-climate-change. 405 Coady, D., Parry, I., Sears, L., & Shang, B. (2017), How Large Are Global Fossil Fuel Subsidies?, available at http://dx.doi.
org/10.1016/j.worlddev.2016.10.004. 406 Ibid. 407 Whitley, S. & Van der Burg, L. (2016), Fossil Fuel Subsidy Reform: From Rhetoric to Reality, The New Climate
Economy Working Paper, available at http://newclimateeconomy.report/2015/wp-content/uploads/sites/3/2015/11/Fossil-fuel-subsidy-reform_from-rhetoric-to-reality.pdf.
408 Ibid. 409 See www.carbonpricingleadership.org for more information.410 CDP & Ecofys (2017), Carbon Pricing Unlocked, available at http://www.ecofys.com/en/news/carbon-pricing-
unlocked-new-best-practice-guides-to-internal-carbon-pricing/. 411 World Bank Group & OECD (2015), FASTER Principles for Successful Carbon Pricing: An Approach Based on Initial
Experience, avilable at http://documents.worldbank.org/curated/en/901041467995665361/The-FASTER-principles-for-successful-carbon-pricing-an-approach-based-on-initial-experience.
412 Carbon Pricing Leadership Coalition (CPLC) (2016), Executive Briefing: What Are the Options for Using Carbon Pricing Revenues?, available at http://pubdocs.worldbank.org/en/668851474296920877/CPLC-Use-of-Revenues-Executive-Brief-09-2016.pdf.
413 See https://www.rggi.org/docs/ProceedsReport/RGGI_Proceeds_Report_2014.pdf. IFC (2011) Handshake Issue #2, “Climate Change ppps,” available at https://library.pppknowledgelab.org/documents/1945/download.
414 Ibid.415 For more information, see http://www.ifc.org/wps/wcm/connect/4445388a-b1c6-4eaa-a4f6-67beee0abbba/
PPPStories_India_BhubaneswarStreetLighting.pdf?MOD=AJPERES.416 For more information, visit www.ndcinvest.org. 417 For more information, visit www.ledsgp.org.418 For more information, visit http://ndci.global/. 419 For more information on these case studies, see http://www.ebrd.com/what-we-do/sectors-and-topics/policy-
dialogue-and-sustainable-resources.html%20.
155Endnotes

2121 Pennsylvania Ave., NW Washington, DC 20433, USA
www.ifc.org
2 0 1 7