Costs and Health Effects of Breast Cancer Interventions in Epidemiologically Different Regions of...
10
Address correspondence and reprint requests to: M. T. Groot, Institute for Medical Technology Assessment, Erasmus Medical Center, P.O. Box 1738, 3000 DR Rotterdam, or e-mail: [email protected]. © 2006 The Fred Hutchinson Cancer Research Center, 1075-122X/06 The Breast Journal, Volume 12 Suppl. 1, 2006 S81 –S90 Blackwell Publishing Inc Malden, USA TBJ The Breast Journal 1075-122X 2006 Blackwell Publishing January/February 2006 12 1 suppl Original Article Cost-Effectiveness of Breast Cancer Interventions groot et al. ORIGINAL ARTICLE: GLOBAL EPIDEMIOLOGIC METHODS Costs and Health Effects of Breast Cancer Interventions in Epidemiologically Different Regions of Africa, North America, and Asia Martijn T. Groot, MSc,* Rob Baltussen, PhD,* Carin A. Uyl-de Groot, PhD,* Benjamin O. Anderson, MD, † and Gabriel N. Hortobágyi, MD ‡ *Institute for Medical Technology Assessment, Erasmus Medical Center Rotterdam, Rotterdam, The Netherlands; † Department of Surgery, University of Washington, Seattle, Washington; and ‡ Department of Breast Medical Oncology, University of Texas M. D. Anderson Cancer Center, Houston, Texas Abstract: We estimated the costs and health effects of treating stage I, II, III, and IV breast cancer individually, of treating all stages, and of introducing an extensive cancer control program (treating all stages plus early stage diagnosis) in three epidemio- logically different world regions—Africa, North America, and Asia. We developed a mathematical simulation model of breast cancer using the stage distribution and case fatality rates in the presence and absence of treatment as predictors of survival. Outcome measures were life-years adjusted for disability (DALYs), costs (in 2000 U.S. dollars) of treatment and follow-up, and cost-effectiveness ratios (CERs; in dollars per DALY averted). Sensitivity analyses were performed to determine the robustness of the results. Treating patients with stage I breast cancer resulted in 23.41, 12.25, and 19.25 DALYs averted per patient in Africa, North America, and Asia, respectively. The corresponding average CERs compared with no intervention were $78, $1960, and $62 per DALY averted. The number of DALYs averted per patient decreased with stage; the value was lowest for stage IV treatment (0.18–0.19), with average CERs of $4986 in Africa, $70,380 in North America, and $3510 per DALY averted in Asia. An extensive breast cancer program resulted in 16.14, 12.91, and 12.58 DALYs averted per patient and average CERs of $75, $915, and $75 per DALY averted. Outcomes were most sensitive to case fatality rates for untreated patients, but varying model assumptions did not change the conclusions. These findings suggest that treating stage I disease and introducing an extensive breast cancer program are the most cost-effective breast cancer interventions. Key Words: breast cancer, cost-effectiveness, costs, developing countries, economic evaluation, modeling E ach year, breast cancer is newly diagnosed in more than 1 million women worldwide and more than 400,000 women die from it (1,2). Breast cancer as a public health problem is growing throughout the world, but especially in developing regions, where the incidence has increased as much as 5% per year (1,3). The mortality: incidence ratio is much higher in developing countries than in developed countries: only half of global breast cancers are diagnosed in the developing world, but they account for three-fourths of total deaths from the disease (1). The increasing burden of breast cancer is also acknow- ledged in the resolution on cancer prevention and control, as adopted by the 58th World Health Assembly in May 2005 (4). Therein, member states are urged to develop and reinforce comprehensive cancer control programs to reduce cancer mortality and improve quality of life for patients and their families. Cost-effectiveness analyses (CEAs) can provide useful information for planning and developing a breast cancer control policy. CEAs can be used to guide budget devel- opment, justify allocation of scarce resources to national breast cancer control programs, and identify the most effi- cient ways of delivering diagnostic and treatment services. Nearly all studies of the costs and health effects of breast cancer control interventions have been performed in developed countries (5), so data to guide resource allocation decisions in developing countries are scarce. Moreover, studies to date have focused on individual interventions, and interactions among interventions have been largely ignored. In addition, existing studies have focused on interventions specific to breast cancer control in situations where breast cancer care was already in place. This limitation precludes comparisons with interventions in settings where care systems have not been established or
-
Upload
independent -
Category
Documents
-
view
1 -
download
0
Transcript of Costs and Health Effects of Breast Cancer Interventions in Epidemiologically Different Regions of...
Address correspondence and reprint requests to: M. T. Groot, Institute forMedical Technology Assessment, Erasmus Medical Center, P.O. Box 1738, 3000DR Rotterdam, or e-mail: [email protected].
©
2006 The Fred Hutchinson Cancer Research Center, 1075-122X/06The Breast Journal, Volume 12 Suppl. 1, 2006 S81–S90
Blackwell Publishing IncMalden, USATBJThe Breast Journal1075-122X2006 Blackwell PublishingJanuary/February 2006121 supplOriginal Article
Cost-Effectiveness of Breast Cancer Interventions
groot et al.
ORIGINAL ARTICLE: GLOBAL EPIDEMIOLOGIC METHODS
Costs and Health Effects of Breast Cancer Interventions in Epidemiologically Different Regions of Africa, North America, and Asia
Martijn T. Groot, MSc,* Rob Baltussen, PhD,* Carin A. Uyl-de Groot, PhD,* Benjamin O. Anderson, MD,
†
and Gabriel N. Hortobágyi, MD
‡
*
Institute for Medical Technology Assessment, Erasmus Medical Center Rotterdam, Rotterdam, The Netherlands;
†
Department of Surgery, University of Washington, Seattle, Washington; and
‡
Department of Breast Medical Oncology, University of Texas M. D. Anderson Cancer Center, Houston, Texas
�
Abstract:
We estimated the costs and health effects of treating stage I, II, III, and IV breast cancer individually, of treating allstages, and of introducing an extensive cancer control program (treating all stages plus early stage diagnosis) in three epidemio-logically different world regions—Africa, North America, and Asia. We developed a mathematical simulation model of breast cancerusing the stage distribution and case fatality rates in the presence and absence of treatment as predictors of survival. Outcomemeasures were life-years adjusted for disability (DALYs), costs (in 2000 U.S. dollars) of treatment and follow-up, and cost-effectivenessratios (CERs; in dollars per DALY averted). Sensitivity analyses were performed to determine the robustness of the results. Treatingpatients with stage I breast cancer resulted in 23.41, 12.25, and 19.25 DALYs averted per patient in Africa, North America, andAsia, respectively. The corresponding average CERs compared with no intervention were $78, $1960, and $62 per DALY averted.The number of DALYs averted per patient decreased with stage; the value was lowest for stage IV treatment (0.18–0.19), withaverage CERs of $4986 in Africa, $70,380 in North America, and $3510 per DALY averted in Asia. An extensive breast cancerprogram resulted in 16.14, 12.91, and 12.58 DALYs averted per patient and average CERs of $75, $915, and $75 per DALY averted.Outcomes were most sensitive to case fatality rates for untreated patients, but varying model assumptions did not change theconclusions. These findings suggest that treating stage I disease and introducing an extensive breast cancer program are themost cost-effective breast cancer interventions.
�
Key Words:
breast cancer, cost-effectiveness, costs, developing countries, economic evaluation, modeling
E
ach year, breast cancer is newly diagnosed in morethan 1 million women worldwide and more than
400,000 women die from it (1,2). Breast cancer as a publichealth problem is growing throughout the world, butespecially in developing regions, where the incidence hasincreased as much as 5% per year (1,3). The mortality:incidence ratio is much higher in developing countriesthan in developed countries: only half of global breastcancers are diagnosed in the developing world, but theyaccount for three-fourths of total deaths from the disease(1). The increasing burden of breast cancer is also acknow-ledged in the resolution on cancer prevention and control,as adopted by the 58th World Health Assembly in May2005 (4). Therein, member states are urged to develop and
reinforce comprehensive cancer control programs to reducecancer mortality and improve quality of life for patientsand their families.
Cost-effectiveness analyses (CEAs) can provide usefulinformation for planning and developing a breast cancercontrol policy. CEAs can be used to guide budget devel-opment, justify allocation of scarce resources to nationalbreast cancer control programs, and identify the most effi-cient ways of delivering diagnostic and treatment services.Nearly all studies of the costs and health effects of breastcancer control interventions have been performed indeveloped countries (5), so data to guide resource allocationdecisions in developing countries are scarce. Moreover,studies to date have focused on individual interventions,and interactions among interventions have been largelyignored. In addition, existing studies have focused oninterventions specific to breast cancer control in situationswhere breast cancer care was already in place. Thislimitation precludes comparisons with interventions insettings where care systems have not been established or
S82
•
GROOT
ET
AL
.
with interventions that might be more relevant to otherregions of the world.
Our intention was to broadly assess the cost-effectivenessof breast cancer control that covers various interventionsin different settings and to enable comparisons with recentCEAs of other health care interventions that follow thesame analytic approach (6–9).
METHODS
Study Design
We used a simplified breast cancer model to simulatethe impact of six basic interventions on the course ofbreast cancer in three regions of the world (10). Each inter-vention was compared with no intervention (i.e., no activecase finding or breast cancer treatment). All interventionswere introduced starting in the year 2000 for a period of10 years, after which no breast cancer interventions wereavailable, and the maximum follow-up was 100 years, whichis in line with the World Health Organization (WHO) guide-lines on CEA (10). Following this standardized approach,we assumed that interventions were performed optimally.The outcomes of our analysis were life-years adjusted fordisability (DALYs) and the total costs of breast cancertreatment and follow-up for each of the six interventions.
We adopted a societal perspective (11) and included allcosts and effects in our model. Future costs and effectswere discounted at a rate of 3% per year (11). The averagecost-effectiveness ratio (CER) compared to the do-nothingscenario was calculated for each intervention by dividingthe total intervention costs (the costs are zero in thedo-nothing scenario) by the total DALYs averted (i.e.,the DALYs lost when no intervention is applied minus theDALYs lost when an intervention is applied for 10 years).The interventions were also compared to arrive at theincremental CER, which we defined as the additional costsof a more effective intervention divided by the size of thisadditional effect in terms of DALYs averted. To calculatethe incremental CERs, the interventions were ordered byincreasing effectiveness and the ratio of a scenario with itsadjacent, less effective scenario was determined.
Study Population and Analyzed Regions
The breast health of adolescent and adult women age15 years and older was simulated in an open cohort. Thecosts, effects, and cost-effectiveness of each of the inter-ventions were evaluated for three epidemiologic regions ofAfrica, North America (including Cuba), and Asia, definedby mortality strata (Appendix A) (10).
Model Assumptions
Interventions
In recent years, many developments indiagnosing and treating breast cancer have occurred, andwe could analyze a large number of interventions in ourmodel. However, we confined the model to a small set ofbasic interventions to allow comparability among theregions. We assessed the following six basic interventions:
• Stage I treatment: Lumpectomy with axillary dissectionsupplemented with external radiotherapy to the breast.Eligible patients also receive endocrine therapy.
• Stage II treatment: Lumpectomy with axillary dissectionsupplemented with external radiotherapy to the breast.Eligible patients also receive endocrine therapy.
• Stage III treatment: Neoadjuvant chemotherapy followedby mastectomy with axillary dissection supplementedwith adjuvant chemotherapy. External radiotherapy tothe breast is also administered and eligible patientsreceive endocrine therapy.
• Stage IV treatment: Systemic chemotherapy, supplementedwith endocrine therapy for eligible patients. In thisgroup of patients, these therapies are palliative.
• Treatment all stages: Treatment of all stages as describedabove.
• Extensive program: Treatment of all stages as describedabove, plus a breast awareness program and early casefinding through biannual mammographic screening inwomen age 50–70 years.
Model Structure
Six mutually exclusive health states wereincluded (Fig. 1): healthy (no breast cancer); AmericanJoint Committee on Cancer (12) stages I, II, III, and
Figure 1. Graphical representation of the model showing therelationships between the six different health states through theincidence rates of breast cancer (Rx1–Rx4) and the different mortalityrates for the different breast cancer stages (Fx1–4) and the backgroundmortality (M).
Cost-Effectiveness of Breast Cancer Interventions •
S83
IV breast cancer; and death from breast cancer. Regionalage-adjusted population estimates of breast cancer inci-dence, breast cancer prevalence, percentage of prevalentcases treated, and background mortality rates were basedon the WHO Burden of Disease study estimates for 2000(13).
Following the WHO guidelines (10), the interventionswere aimed at initial disease treatment only, but patientscould experience a relapse or progression after initialdiagnosis; therefore we filtered out the effect of treatingpatients whose disease progressed. It was assumed thatpatients could have a progression only to stage IV breastcancer and that cancer progressed at a constant rate (14).
Stage Distribution and Case Fatality Rates
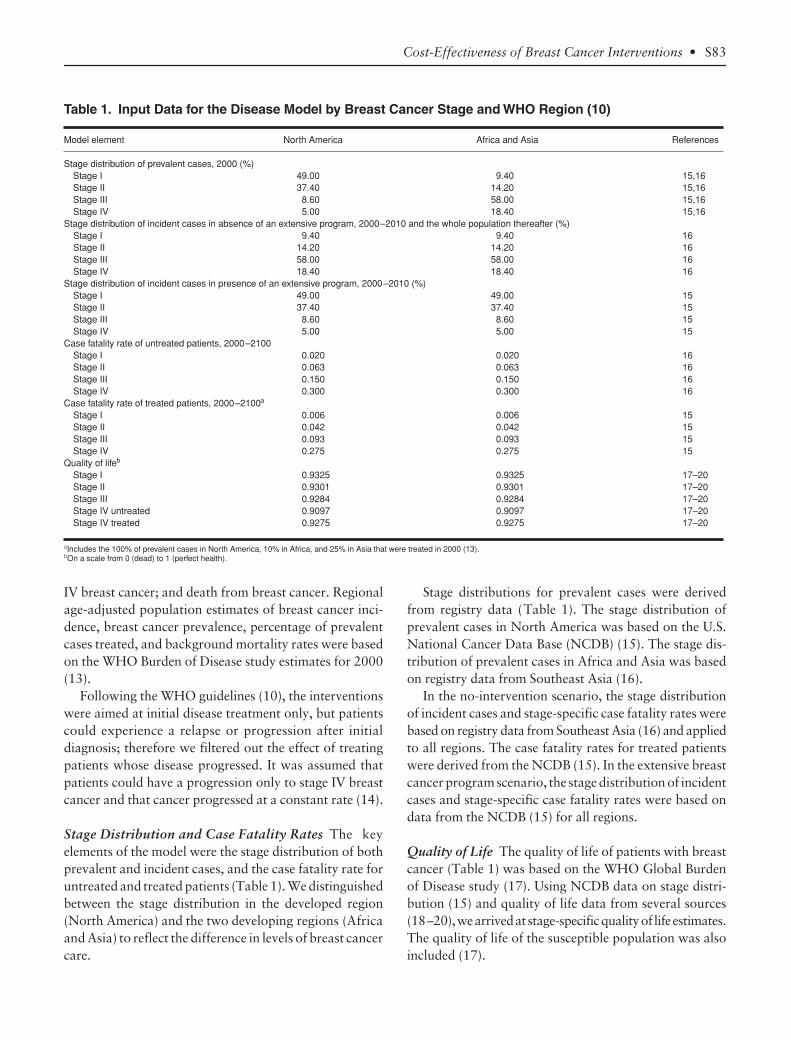
The keyelements of the model were the stage distribution of bothprevalent and incident cases, and the case fatality rate foruntreated and treated patients (Table 1). We distinguishedbetween the stage distribution in the developed region(North America) and the two developing regions (Africaand Asia) to reflect the difference in levels of breast cancercare.
Stage distributions for prevalent cases were derivedfrom registry data (Table 1). The stage distribution ofprevalent cases in North America was based on the U.S.National Cancer Data Base (NCDB) (15). The stage dis-tribution of prevalent cases in Africa and Asia was basedon registry data from Southeast Asia (16).
In the no-intervention scenario, the stage distributionof incident cases and stage-specific case fatality rates werebased on registry data from Southeast Asia (16) and appliedto all regions. The case fatality rates for treated patientswere derived from the NCDB (15). In the extensive breastcancer program scenario, the stage distribution of incidentcases and stage-specific case fatality rates were based ondata from the NCDB (15) for all regions.
Quality of Life
The quality of life of patients with breastcancer (Table 1) was based on the WHO Global Burdenof Disease study (17). Using NCDB data on stage distri-bution (15) and quality of life data from several sources(18–20), we arrived at stage-specific quality of life estimates.The quality of life of the susceptible population was alsoincluded (17).
Table 1. Input Data for the Disease Model by Breast Cancer Stage and WHO Region (10)
Model element North America Africa and Asia References
Stage distribution of prevalent cases, 2000 (%)Stage I 49.00 9.40 15,16Stage II 37.40 14.20 15,16Stage III 8.60 58.00 15,16Stage IV 5.00 18.40 15,16
Stage distribution of incident cases in absence of an extensive program, 2000–2010 and the whole population thereafter (%)Stage I 9.40 9.40 16Stage II 14.20 14.20 16Stage III 58.00 58.00 16Stage IV 18.40 18.40 16
Stage distribution of incident cases in presence of an extensive program, 2000–2010 (%)Stage I 49.00 49.00 15Stage II 37.40 37.40 15Stage III 8.60 8.60 15Stage IV 5.00 5.00 15
Case fatality rate of untreated patients, 2000–2100Stage I 0.020 0.020 16Stage II 0.063 0.063 16Stage III 0.150 0.150 16Stage IV 0.300 0.300 16
Case fatality rate of treated patients, 2000–2100a
Stage I 0.006 0.006 15Stage II 0.042 0.042 15Stage III 0.093 0.093 15Stage IV 0.275 0.275 15
Quality of lifeb
Stage I 0.9325 0.9325 17–20Stage II 0.9301 0.9301 17–20Stage III 0.9284 0.9284 17–20Stage IV untreated 0.9097 0.9097 17–20Stage IV treated 0.9275 0.9275 17–20
aIncludes the 100% of prevalent cases in North America, 10% in Africa, and 25% in Asia that were treated in 2000 (13).bOn a scale from 0 (dead) to 1 (perfect health).
S84
•
GROOT
ET
AL
.
Costs
All costs were calculated and are presented in 2000U.S. dollars. Two types of costs for health services weredistinguished: patient-level costs, which were those incurredfor individual patients, and program-level costs, whichwere those incurred at a level above that of the patient (10).
Patient-Level Costs
In all regions patient-level patterns ofresource use (i.e., initial evaluation, local treatment, andfollow-up) were based on clinical practice guidelines(21,22) (Table 2). These costs included evaluation ofwomen without breast cancer; it was assumed that breastcancer was diagnosed in only 6% of all presenting women(23).
Screening in the extensive cancer program includedcosts of mammographic screening in women age 50–70years and further diagnostic tests on referral (Table 2).Detailed lists of all tests and procedures, including hous-ing, personnel, and medical devices, were retrieved froma South African database (24) and were validated forwestern countries by a team of oncologists.
Unit costs were retrieved from the WHO-CHOICEdatabase on prices of traded and nontraded goods (http://www.who.int/choice). Unit costs of health center visitsand hospital inpatient days were based on a report byAdam et al. (25). We combined unit costs with resource
Table 2. Patient-Level Resource Use Patterns for Breast Cancer Interventions
ResourceaNo. of
outpatient visitsLength of
hospitalization (days)
Diagnosis 1 NABilateral mammographyComplete blood countTotal bilirubin assayAlkaline phosphatase assayFine needle aspiration or core needle biopsyLiver function testsECG in 50%Bone scan in 25%Ultrasonography of the liver in 25%
Non-breast cancer examinationb 1 NABilateral mammographyUltrasonography of the liver in 28%Fine needle aspiration or core needle biopsy in 0.27%
Stage I treatment 1 2Lumpectomy with axillary dissectionRadiotherapyc
Endocrine therapy in 50%d
Stage II treatment 1 2Lumpectomy with axillary dissectionRadiotherapyc
Endocrine therapy in 50%d
Stage III treatment 1 2(Neo)adjuvant chemotherapye
Mastectomy with axillary dissectionRadiotherapyc
Endocrine therapy in 50%d
Stage IV treatment 1 2(Neo)adjuvant chemotherapye
Endocrine therapy in 50%d
Follow-up year 1–5 (per year) 2 NA2 Bilateral mammographiesPelvic examination in 50%
Follow-up year 6–10 (per year) 1 NABilateral mammographyPelvic examination in 50%
Screening 1 NABilateral mammographyUltrasonography of the liver in 28%b
Fine needle aspiration or core needle biopsy in 0.27%b
aBased on clinical practice guidelines (21,22).bIncludes resource use of initial evaluation of women without breast cancer who were initially suspected of having breast cancer (23).cRadiotherapy includes a standard dose of 50 Gy given in 25 fractions of 2 Gy on an outpatient basis in all stages of breast cancer (33).dEndocrine therapy consists of 20 mg tamoxifen per day for 5 years (21,22).eThe (neo)adjuvant chemotherapy combination regimen consists of four, 21-day cycles of doxorubicin (60 mg/m2) and cyclophosphamide (830 mg/m2) supplemented with 4 mg dexamethasone, given on an outpatient basis (21,22).ECG, electrocardiography; NA, not applicable.
Cost-Effectiveness of Breast Cancer Interventions •
S85
use patterns to estimate the total costs per patient treated.All unit costs are presented for the regions of Africa, NorthAmerica, and Asia in Appendix B.
Program-Level Costs
We based estimated quantities ofresources required to start up and maintain each inter-vention for 10 years (e.g., personnel, materials and sup-plies, media, transport, maintenance, utilities, and capital)at national, provincial, and district levels on a series ofevaluations made by regional costing teams in the dif-ferent WHO regions and validated against the literature(26). We obtained unit cost estimates of program-levelresources (e.g., the salaries of central administrators, cap-ital costs of vehicles, storage, offices, and furniture) from areview of the literature, which was supplemented by pri-mary data from several countries (the full list of unit costestimates is available at http://www.who.int/choice). Theprocess and methodology for estimating program costsare described in detail elsewhere (26,27).
Sensitivity Analyses
To address uncertainty and determine the robustness ofthe model, we conducted both univariate and multivariatesensitivity analyses on key parameters. Specifically weassessed the effects of varying the stage distribution ofprevalent cases, the stage distribution of incident cases,and the case fatality rate of treated patients, individuallyand then collectively.
RESULTS
Intervention Effectiveness
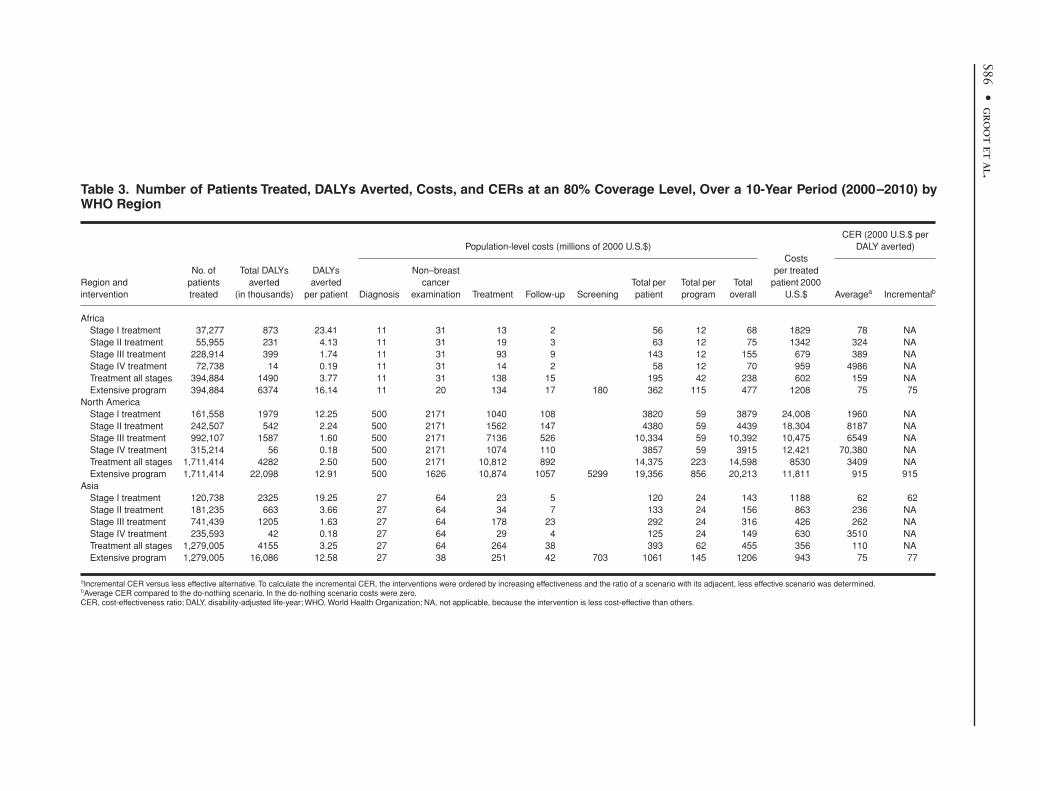
In Africa, the smallest group treated in the 10-yearperiod was women who had stage I breast cancer (Table3); of these 37,277 cases, 9604 were previously untreatedprevalent cases and 27,673 were new cases of breast cancer.Most of the treated women were those with stage III breastcancer (228,914; 58,978 prevalent and 169,936 incidentcases). In North America and Asia, the trends were thesame, although the absolute numbers of treated patientswere higher. The female population in North Americawas four times smaller than the female population in Asia,but the number of treated breast cancer patients wasone-third higher in North America. The population sizesin North America and Africa were similar, but thenumber of treated patients was four times larger in NorthAmerica.
Because of these differences between regions, the numberof DALYs averted for the total population or per treatedpatient in the 10-year period also varied considerably
(Table 3). For example, in Africa, treatment of stage Ipatients resulted in a total of 873,000 DALYs averted forthe total population and 23.41 DALYs averted per treatedpatient. Despite the greater number of treated patientswith stage II, III, or IV breast cancer, the total number ofDALYs averted was considerably less for each of thesestages. When all diagnosed cases were treated, 1,490,000DALYs were averted for the total population (3.77 pertreated patient). When an extensive breast cancer programwas assumed to exist in Africa, 6,374,000 DALYs wereaverted for the total population (16.14 per treated patient).
Costs and Cost-Effectiveness
The range in total costs per intervention over the 10-year period was considerable. For example, the total costsfor introducing stage I treatment was $68 million in Africa,$3879 million in North America, and $143 million inAsia (Table 3).
The costs of diagnosis were a fixed component in allintervention scenarios because cases must be diagnosedcorrectly before treatment can be initiated. This categoryalso accounted for the exclusion of women presentingwithout breast cancer. As a result, costs per treated patientwere lowest when all diagnosed cases were treated (Table3). In all three regions, the diagnostic costs for patientswith stage I breast cancer constituted 62–68% of the totalcosts, whereas the diagnostic costs for all patients made up17–20% of the total costs.
The costs per treated patient with stage I disease were$1829 in Africa, $24,008 in North America, and $1188in Asia (Table 3). The costs of treatment represented16–27% of the total costs in each region.
In the extensive program, different cost items accountedfor widely varying proportions of the total costs (Table 3).In Africa, the patient-level costs of screening and associ-ated diagnostic examination of false-positive screens($180 million) were 38% of the total costs; in NorthAmerica, these costs ($5299 million) constituted only26% of the total costs; and in Asia, these costs ($703 mil-lion) made up 58% of the total costs.
In each of the six intervention scenarios, the total pro-gram costs accounted for 8–24% of the total costs inAfrica and Asia, but only 1–4% of the total costs in NorthAmerica (Table 3).
When we compared the intervention scenarios with theno-intervention scenario, treatment of stage I patients andthe extensive breast cancer program were the mostcost-effective interventions, with average CERs for stageI treatment and extensive programs, respectively, of $78and $75 per DALY averted in Africa, $1960 and $915 per
S86
•
GR
OO
T
ET
AL
.
Table 3. Number of Patients Treated, DALYs Averted, Costs, and CERs at an 80% Coverage Level, Over a 10-Year Period (2000–2010) byWHO Region
Region and intervention
No. of patients treated
Total DALYs averted
(in thousands)
DALYs averted
per patient
Population-level costs (millions of 2000 U.S.$)Costs
per treated patient 2000
U.S.$
CER (2000 U.S.$ per DALY averted)
Diagnosis
Non–breast cancer
examination Treatment Follow-up ScreeningTotal per patient
Total per program
Total overall Average
a
Incremental
b
AfricaStage I treatment 37,277 873 23.41 11 31 13 2 56 12 68 1829 78 NAStage II treatment 55,955 231 4.13 11 31 19 3 63 12 75 1342 324 NAStage III treatment 228,914 399 1.74 11 31 93 9 143 12 155 679 389 NAStage IV treatment 72,738 14 0.19 11 31 14 2 58 12 70 959 4986 NATreatment all stages 394,884 1490 3.77 11 31 138 15 195 42 238 602 159 NAExtensive program 394,884 6374 16.14 11 20 134 17 180 362 115 477 1208 75 75
North AmericaStage I treatment 161,558 1979 12.25 500 2171 1040 108 3820 59 3879 24,008 1960 NAStage II treatment 242,507 542 2.24 500 2171 1562 147 4380 59 4439 18,304 8187 NAStage III treatment 992,107 1587 1.60 500 2171 7136 526 10,334 59 10,392 10,475 6549 NAStage IV treatment 315,214 56 0.18 500 2171 1074 110 3857 59 3915 12,421 70,380 NATreatment all stages 1,711,414 4282 2.50 500 2171 10,812 892 14,375 223 14,598 8530 3409 NAExtensive program 1,711,414 22,098 12.91 500 1626 10,874 1057 5299 19,356 856 20,213 11,811 915 915
AsiaStage I treatment 120,738 2325 19.25 27 64 23 5 120 24 143 1188 62 62Stage II treatment 181,235 663 3.66 27 64 34 7 133 24 156 863 236 NAStage III treatment 741,439 1205 1.63 27 64 178 23 292 24 316 426 262 NAStage IV treatment 235,593 42 0.18 27 64 29 4 125 24 149 630 3510 NATreatment all stages 1,279,005 4155 3.25 27 64 264 38 393 62 455 356 110 NAExtensive program 1,279,005 16,086 12.58 27 38 251 42 703 1061 145 1206 943 75 77
a
Incremental CER versus less effective alternative. To calculate the incremental CER, the interventions were ordered by increasing effectiveness and the ratio of a scenario with its adjacent, less effective scenario was determined.
b
Average CER compared to the do-nothing scenario. In the do-nothing scenario costs were zero.CER, cost-effectiveness ratio; DALY, disability-adjusted life-year; WHO, World Health Organization; NA, not applicable, because the intervention is less cost-effective than others.
Cost-Effectiveness of Breast Cancer Interventions •
S87
DALY averted in North America, and $62 and $75 perDALY averted in Asia (Table 3). The least cost-effectiveoption was stage IV treatment (average CERs of $4986,$70,380, and $3510 per DALY averted in Africa, NorthAmerica, and Asia, respectively).
Incremental CERs revealed that in Africa and NorthAmerica, the optimal breast cancer program was the mostcost-effective intervention scenario ($75 and $915 perDALY averted, respectively) (Table 3). In Asia, the mostcost-effective options were stage I treatment ($62 per DALYaverted) and then the optimal breast cancer program ($77per DALY averted).
The order in which interventions should be introducedaccording to the cost-effectiveness results (i.e., the “expansionpath;” for more details on expansion paths, see Tan-TorresEdejer et al. (10)) is illustrated for Asia in Figure 2. StageI treatment would be introduced first. With more resources,an optimal breast cancer program would be established.
Sensitivity Analyses
In the first two univariate sensitivity analyses, it wasassumed that cancers were diagnosed earlier comparedwith the base case analysis (i.e., more stage I and II cancersand fewer stage III and IV cancers). This assumption pro-duces a more favorable distribution, with the sole excep-tion of the prevalent cases in North America, where thedistribution becomes less favorable. Applying these alter-native stage distributions for prevalent and incident breastcancer cases resulted in lower average CERs for stage Itreatment and for treatment of all stages in Africa, NorthAmerica, and Asia because more stage I patients receivedtreatment, which was associated with lower case fatalityrates (Table 4 shows results for Asia as an example). For
stage III and IV treatment, the average CERs increasedbecause fewer cases were diagnosed at these stages. Becausethe shift in distribution of incident cases of stage II breastcancer decreased the overall mortality in the no-interventionscenario, the average CERs for stage II treatment and theextensive program also increased.
In a third univariate analysis, the assumption of a 50%reduction in treatment effect on case fatality rates (i.e.,higher case fatality rates of treated cases than those usedin the base case analysis) increased the average CERs ofeach of the six interventions in Africa, North America,and Asia (Table 4 shows results for Asia as an example).
Combining all three univariate sensitivity analyses in amultivariate analysis resulted in a further increase in theaverage CERs for stage II, III, and IV treatment and theextensive program (Table 4). The average CERs for stageI treatment and treatment of all stages were between theCERs calculated in the individual sensitivity analyses.
Table 4. Results of Univariate and Multivariate Sensitivity Analyses for Asiaa
Intervention
Univariate analyses
Alternative stage distribution of prevalent casesb
Alternative stage distribution of incident casesb,c
Alternative case fatality ratesd Multivariate analysise
Average Incrementalf Average Incrementalf Average Incrementalf Average Incrementalf
Stage I treatment 45 45 48 48 162 NA 107 107Stage II treatment 224 NA 261 NA 609 NA 618 NAStage III treatment 283 NA 390 NA 642 NA 1186 NAStage IV treatment 4103 NA 4888 NA 5175 NA 8875 NATreatment all stages 79 NA 84 NA 255 NA 178 NAExtensive program 73 82 127 182 113 113 216 274
aData are presented as cost-effectiveness ratios, calculated as cost (in 2000 U.S.$) per DALY (disability-adjusted life-year) averted.bStage distribution: stage I, 29%; stage II, 26%; stage III, 33%; and stage IV, 12%.cIn the absence of an extensive breast cancer program.dCase fatality rates of treated patients: stage I, 0.013; stage II, 0.053; stage III, 0.122; and stage IV, 0.288.eAll adjustments in the three univariate sensitivity analyses were implemented simultaneously.fIncremental cost-effectiveness ratio versus lesser effective alternative.NA, not applicable, because the intervention is less cost-effective than others.
Figure 2. Expansion path for the Asian region.
S88
•
GROOT
ET
AL
.
DISCUSSION
Our analyses showed that treating early stage breastcancer is more cost-effective than treating late-stagedisease. In Africa and Asia, treatment of stage I, II, or IIIdisease costs less than $390 per DALY averted, whereastreatment of stage IV disease costs more than $3500 perDALY averted; in North America, the respective valueswere $6550 and $70,400. For comparison, we can usebenchmarks suggested by other researchers to assesswhether a health intervention is cost-effective: cost perDALY averted or life-year gained equal to the per capitaincome (28), twice per capita income (29), or three timesper capita income (30) (low-income countries are definedas having per capita incomes of $765 or less per year, andhigh-income countries are defined as having per capitaincomes of more than $9386 per year). According to thesebenchmarks, all interventions except treatment of stage IVdisease were cost effective in all three regions.
The incremental CERs indicated that priorities innational breast cancer control programs would be treat-ment of stage I disease or implementation of an extensivecancer control program (including breast cancer aware-ness campaigns and active mammographic screening).
Although the extensive cancer control program reflectsthe economic attractiveness of diagnosing breast cancer atan earlier stage, many developing countries may not beable to meet the total costs of such a program (includingthe required infrastructure, logistics, and expertise). Giventhe limited available resources, priorities are probablybest directed at treatment of early stage disease and atdeveloping a less expensive means of early diagnosis. Wedid not evaluate clinical breast examination or breast self-examination because currently there is no consensus ontheir value alone or in addition to mammography. Never-theless, together with other ways of raising awareness,clinical breast examination and breast self-examinationcould be a cost-effective means by which to diagnosebreast cancer earlier in resource-poor settings.
A number of our study limitations have to be addressed.We used data on stage distribution and case fatality ratesfrom a sample of developing countries to reflect theabsence of breast cancer control interventions. For thesame variables, we used data from U.S. cancer registries toreflect intervention effectiveness. Whether these data areaccurate can be assessed only when studies on the effec-tiveness of breast cancer interventions in developingcountries become available.
We did not include stage 0 disease (i.e., ductal carci-noma in situ) in our model because very little information
is available on this type of breast cancer in developingregions. Furthermore, the WHO Global Burden ofDisease study provides information only on the prevalenceand incidence of palpable breast cancer. From the NCDB,it is clear that through screening, the proportion of diseasediagnosed at stage 0 increased substantially in the UnitedStates (15). Although not all stage 0 breast cancer will resultin breast cancer-related death if not treated, and overtreat-ment (with its associated costs) will likely be introduced,including stage 0 disease in the model will probably rein-force our conclusion that treating earlier stages of breastcancer is the most cost-effective intervention.
We estimated program costs for breast cancer interven-tions that are not yet in place on this scale in developingcountries and therefore cannot be validated. However, anextensive cancer control program was estimated to cost$50 million for 95% geographic coverage in The Nether-lands; this value compares well with the costs of breastcancer screening in that country, which were $49 millionin 2003 (31).
Our simplified cost-effectiveness model is appropriateto use for broadly assessing the relative economic attrac-tiveness of breast cancer interventions and for comparinginterventions among regions. Our analysis shows thatthere is a broad variation in epidemiology between regionsand that there are large differences in cost structure aswell. In contrast to North America, where personnel is themajor cost component, the costs of personnel are only asmall part of the total costs in developing regions (Africaand Asia). Therefore, while the pattern of most cost-effectiveinterventions is the same, there are substantial differencesbetween interventions across regions and likely within aregion. A more detailed country-level analysis, using localcost and resource estimates and epidemiologic information,could be useful for testing whether our model assumptionshold and for obtaining more specific information on theimpact of interventions on budgets, especially when thereis competition for scarce resources with interventions thatare more intensive with respect to either personnel time orresource use. We developed the cost-effectiveness modelin such a way that these country-specific adaptations canbe performed easily.
For reasons of comparability, we were unable to includemany of the elements of breast cancer care that are con-sidered standard in developed countries. A few examplesare sentinel lymph node biopsy, breast reconstruction aftersurgery, and variations in surgical treatment of breastcancer within the same stage. Furthermore, we assumedthe use of only one type of chemotherapy and one type ofhormonal therapy. These issues can be addressed in a
Cost-Effectiveness of Breast Cancer Interventions •
S89
more tailor-made country-level analysis using the model’sframework.
Finally, we are aware of the current debate surroundingthe relative effect of breast cancer screening on reducingmortality rates. This debate focuses on the overtreatmentand overdiagnosis that are said to be underappreciatedharms of screening (32). In our analysis, we assumed thatthe introduction of an extensive breast cancer programwould cause a shift in stage distribution that would resultin reduced mortality rates for all patients, and this assump-tion probably led to an overestimation of the impact ofsuch a program. Sensitivity analyses showed that varyingmodel assumptions did affect the cost-effectiveness of theinterventions, but not our principal study conclusion.
We conclude that both treatment of early stage breastcancer and interventions for down-staging disease at diag-nosis are among the most valuable interventions in breastcancer control.
Acknowledgments
The authors gratefully acknowledge the advice of Dr.Sharon Giordano and the editorial assistance of ElizabethL. Hess and Susan London. This study was supported inpart by a grant from the World Health Organization,which had no involvement in the study, and was presentedin part at the second biennial Global Summit ConsensusConference on International Breast Health Care, Bethesda,MD, January 12–15, 2005.
REFERENCES
1. Stewart B, Kleihues PE.
World Cancer Report.
Lyon, France:IARC Press, 2003.
2. Ferlay J, Bray F, Pisani P, Parkin DM. GLOBOCAN 2002:cancer incidence, mortality and prevalence worldwide [CD-ROM].IARC CancerBase no. 5, version 2.0. Lyon, France: IARC Press, 2004.
3. International Agency for Research on Cancer Working Groupon the Evaluation of Cancer-Preventive Strategies.
Handbooks ofCancer Prevention
, vol. 7,
Breast Cancer Screening.
Lyon, France: IARCPress, 2002.
4. World Health Organization. Fifty-eighth World Health Assem-bly, resolution WHA58.22, Cancer Prevention and Control. Geneva,Switzerland: World Health Organization, May 25, 2005.
5. Radice D, Redaelli A. Breast cancer management: quality-of-lifeand cost considerations.
Pharmacoeconomics
2003;21:383–96.6. Murray CJ, Lauer JA, Hutubessy RC,
et al.
Effectiveness andcosts of interventions to lower systolic blood pressure and cholesterol: aglobal and regional analysis on reduction of cardiovascular-disease risk.
Lancet
2003;361:717–25.7. Shibuya K, Ciecierski C, Guindon E, Bettcher DW, Evans DB,
Murray CJ. WHO Framework Convention on Tobacco Control:development of an evidence based global public health treaty.
BMJ
2003;327:154–57.8. Dziekan G, Chisholm D, Johns B, Rovira J, Hutin YJ. The cost-
effectiveness of policies for the safe and appropriate use of injection inhealthcare settings.
Bull World Health Org
2003;81:277–85.
9. Baltussen R, Sylla M, Mariotti SP. Cost-effectiveness analysis ofcataract surgery: a global and regional analysis.
Bull World Health Org
2004;82:338–45.10. Tan-Torres Edejer T, Baltussen R, Adam T,
et al.
MakingChoices in Health: WHO Guide to Cost-Effectiveness Analysis.
Geneva,Switzerland: World Health Organization, 2003.
11. Gold MR, Siegel JE, Russell LB, Weinstein MC.
Cost-Effectiveness in Health and Medicine.
New York: Oxford UniversityPress, 1996:425.
12. American Joint Commission on Cancer.
AJCC Cancer StagingManual
, 6th ed. New York: Springer-Verlag, 2002.13. Shibuya K, Mathers CD, Boschi-Pinto C, Lopez AD, Murray
CJ. Global and regional estimates of cancer mortality and incidence bysite: II. Results for the global burden of disease 2000.
BMC Cancer
2002;2:37.14. Engel J, Eckel R, Kerr J,
et al.
The process of metastasisation forbreast cancer.
Eur J Cancer
2003;39:1794–806.15. Bland KI, Menck HR, Scott-Conner CE, Morrow M, Winchester
DJ, Winchester DP. The National Cancer Data Base 10-year survey ofbreast carcinoma treatment at hospitals in the United States.
Cancer
1998;83:1262–73.16. Sankaranarayanan R, Black RJ, Parkin DM.
Cancer Survival inDeveloping Countries.
Lyon, France: International Agency for Researchon Cancer, 1998:173.
17. Murray CJL, Lopez AD.
Global Burden of Disease and Injury
,vol. 1,
The Global Burden of Disease: A Comprehensive Assessment ofMortality and Disability From Diseases, Injuries, and Risk Factors in1990 and Projected to 2020.
Cambridge, MA: Harvard School of PublicHealth, 1996.
18. Norum J. Breast cancer screening by mammography in Norway:is it cost-effective?
Ann Oncol
1999;10:197–203.19. Launois R, Reboul-Marty J, Henry B, Bonneterre J. A cost-utility
analysis of second-line chemotherapy in metastatic breast cancer:docetaxel versus paclitaxel versus vinorelbine.
Pharmacoeconomics
1996;10:504–21.20. de Koning HJ, van Ineveld BM, van Oortmarssen GJ,
et al.
Breast cancer screening and cost-effectiveness; policy alternatives, qualityof life considerations and the possible impact of uncertain factors.
Int J Cancer
1991;49:531–37.21. National Comprehensive Cancer Network.
Clinical PracticeGuidelines in Oncology, version 1, Breast Cancer
[guideline]. Jenkintown,PA: National Comprehensive Cancer Network, 2004 [updated March 19,2004]. Available at http://www.nccn.org/professionals/physician_gls/PDF/breast.pdf; accessed January 20, 2005.
22. MD Anderson Cancer Center.
Clinical Practice Guideline of theM.D. Anderson Cancer Center, Breast Cancer
[guideline]. Houston, TX:MD Anderson Cancer Center, 2004 [updated September 2, 2003].Available at http://utm-ext01a.mdacc.tmc.edu/mda/cm/CWTGuide.nsf/0/e0377163611243e3862563c3007c3703/$FILE/Br%20Noninvasive%20Group%20V5.pdf; accessed January 20, 2005.
23. Flobbe K, van der Linden ES, Kessels AG, van Engelshoven JM.Diagnostic value of radiological breast imaging in a non-screeningpopulation.
Int J Cancer
2001;92:616–18.24. World Health Organization, Department of Essential Health
Technologies. Essential Health Care Technology Package (EHTP) [Webpage]. Geneva, Switzerland: World Health Organization, 2005. Availableat http://www.who.int/medical_devices/appropriate_use/en/; accessedJanuary 20, 2005.
25. Adam T, Evans DB, Murray CJ. Econometric estimation ofcountry-specific hospital costs.
Cost Eff Resour Alloc
2003;1:3.26. Johns B, Baltussen R. Accounting for the cost of scaling-up
health interventions.
Health Econ
2004;13:1117–24.27. Johns B, Baltussen R, Hutubessy R. Programme costs in the
economic evaluation of health interventions.
Cost Eff Resour Alloc
2003;1:1.
S90
•
GROOT
ET
AL
.
28. Murray CJ, Salomon JA. Expanding the WHO tuberculosiscontrol strategy: rethinking the role of active case-finding.
Int J TubercLung Dis
1998;2:S9–15.29. Garber AM, Phelps CE. Economic foundations of cost-
effectiveness analysis.
J Health Econ
1997;16:1–31.30. World Health Organization.
The World Health Report 2002:Reducing Risks, Promoting Healthy Life.
Geneva, Switzerland: WorldHealth Organization, 2002.
31. National Evaluation Team for Breast Cancer Screening in the
Netherlands.
Interim Report NETB. Main Results Breast CancerScreening Programme 2001 and 2002 in the Netherlands.
Rotterdam,The Netherlands: Department of Public Health, 2004.
32. Schwartz LM, Woloshin S, Fowler FJ Jr, Welch HG. Enthusiasmfor cancer screening in the United States.
JAMA
2004;291:71–78.33. Blamey RW. The British Association of Surgical Oncology
Guidelines for surgeons in the management of symptomatic breast dis-ease in the UK (1998 revision). BASO Breast Specialty Group.
Eur J SurgOncol
1998;24:464–76.
Appendix A. Epidemiologic Regions as Applied in WHO Generalized CEA (10)
Appendix B. Unit Costs and Total Costs per Patient (in 2000 U.S. Dollars) by WHO Region
a
WHO region Mortality stratum
a
WHO member states
Africa E Botswana, Burundi, Central African Republic, Congo, Côte d’Ivoire, Democratic Republic Congo, Eritrea, Ethiopia, Kenya, Lesotho, Malawi, Mozambique, Namibia, Rwanda, South Africa, Swaziland, Uganda, United Republic of Tanzania, Zambia, Zimbabwe
North America A Canada, Cuba, United States of AmericaAsia D Bangladesh, Bhutan, Democratic People's Republic of Korea, India, Maldives, Myanmar, Nepal
a
A, have very low rates of adult and child mortality; D, have high adult and child mortality; E, have very high adult and high child mortality.WHO, World Health Organization; CEA, cost-effectiveness analysis.
Resource or intervention Africa North America Asia
Unit costsOutpatient visit 0.82 24.05 0.53Hospitalization 4.65 203.35 3.75Lumpectomy 34.00 414.72 23.54Mastectomy 34.56 417.01 24.01Radiotherapy 323.43 6465.55 173.20(Neo)adjuvant chemotherapy 75.96 852.72 54.87Endocrine therapy 0.01 0.04 0.01Bilateral mammography 3.57 48.36 2.60Fine needle aspiration biopsy 8.22 51.42 6.47Chest radiograph 3.05 31.76 2.26Bone scan 15.96 107.79 13.06Electrocardiography 1.58 28.47 0.91Pelvic examination 1.22 20.44 0.70Ultrasonography of the liver 3.61 66.10 2.12Complete blood count 2.68 35.10 1.97Total bilirubin assay 2.23 36.83 1.51Alkaline phosphatase assay 4.70 46.76 3.59
Total costs per patientDiagnosis 30.96 300.23 17.32Non-breast cancer examination 5.57 91.94 3.85Stage I treatment 367.54 7311.01 204.77Stage II treatment 367.54 7311.01 204.77Stage III treatment 444.06 8166.03 260.11Stage IV treatment 86.08 1283.47 62.89Follow-up year 1–5 31.95 547.31 22.75Follow-up year 6–10 24.26 378.69 17.51Screening 4.46 62.60 3.15
a
All unit costs are derived from a South African database (24).WHO, World Health Organization.