Costs and benefits of capturing urban runoff with competitive bidding for decentralized best...
12
Costs and benefits of capturing urban runoff with competitive bidding for decentralized best management practices W. Bowman Cutter, 1 Kenneth A. Baerenklau, 1 Autumn DeWoody, 1 Ritu Sharma, 1 and Joong Gwang Lee 2 Received 12 July 2007; revised 5 May 2008; accepted 2 June 2008; published 6 September 2008. [1] Urban storm water runoff is both a source of pollution and a potentially valuable resource. Centralized facilities traditionally have been used to manage runoff. Decentralized best management practice (BMP) options may be able to avoid the costs of purchasing expensive urban land needed for centralized facilities. We investigate the cost effectiveness of implementing BMPs in a Los Angeles area watershed with two voluntary incentive mechanisms: competitive bidding and a fixed subsidy. The subsidy mechanism has lower BMP placement costs but generates relatively large excess profits for landowners. The bidding mechanism has higher BMP placement costs but generates smaller excess profits and tends to be more cost effective for the regulator, particularly at higher runoff capture levels. We also compare the costs of bidding and centralized alternatives and find that the bidding alternative is significantly less costly than a centralized alternative for a range of storm water capture goals. Finally, we examine the value of infiltrated storm water and find that it is up to 38% of total BMP costs. Citation: Cutter, W. B., K. A. Baerenklau, A. DeWoody, R. Sharma, and J. G. Lee (2008), Costs and benefits of capturing urban runoff with competitive bidding for decentralized best management practices, Water Resour. Res., 44, W09410, doi:10.1029/2007WR006343. 1. Introduction [2] Urban storm water runoff is both a significant pollu- tion problem as well as a potential resource. The pollution problem results from the ‘‘urban sludge’’ (heavy metals, petroleum residue, salts, solid waste, etc.) that is carried off impermeable surfaces by storm events and washed into receiving water bodies where it damages ecological and recreational resources [Arnold and Gibbons, 1996]. If these pollutants can be effectively removed from storm water then runoff also represents a potentially beneficial resource. Without urban development more of this runoff would naturally infiltrate and replenish groundwater stocks, but instead it is treated as a waste and disposed of accordingly [Ferguson, 1994]. Groundwater supplies in urban regions thus remain lower than they might be otherwise, which seems especially inefficient in arid regions such as the U.S. desert southwest. In light of recent predictions of increased likeli- hood of long-term drought in such areas [Intergovernmental Panel on Climate Change, 2007; Seager et al., 2007], it is imperative to investigate cost-effective ways to capture, clean, and infiltrate more of this potential resource. [3] The dominant paradigm in storm water management has been to avoid flooding by quickly conveying runoff to a receiving water body [Ferguson, 1998]. For this purpose, conveyance structures that centralize runoff are essential. Local storm water agencies have continued to emphasize centralized solutions even as the emphasis on water quality in receiving waters has grown. These centralized facilities (such as detention pond, infiltration pits and trenches, artificial wetland, etc.) have the advantage of economies of scale where large capacities are cheap on a per-unit capacity basis. However, in order to use that capacity, such facilities must drain a large area. In dense urban areas it is often difficult to achieve this goal without impinging on private land, purchasing contiguous land parcels, or signif- icantly redesigning redevelopment to accommodate central- ized facilities. [4] Recent work has focused on the use of decentralized parcel-level best management practices (BMPs) for manag- ing runoff or improving runoff quality across a larger area of a landscape. Arabi et al. [2006] uses a genetic algorithm approach to find the most cost-effective approach to imple- menting BMPs to control pollutants in agricultural runoff. Similar papers that use an optimization approach to find the best placement of parcel-level BMPs include Bekele and Nicklow [2005], Muleta and Nicklow [2005], and Srivastava et al. [2003]. Perez-Pedini et al. [2005] examines optimal placement of infiltration BMPs in a watershed to control peak runoff. [5] Although decentralized BMPs cannot provide the same scale economies as centralized facilities, they do not require large contiguous land areas. Furthermore they can be placed on parcels with relatively low marginal land use value thus effectively reducing the total installation cost. This is particularly beneficial in dense urban areas where 1 Department of Environmental Sciences, University of California, Riverside, California, USA. 2 Tetra Tech, Inc., Boulder, Colorado, USA. Copyright 2008 by the American Geophysical Union. 0043-1397/08/2007WR006343 W09410 WATER RESOURCES RESEARCH, VOL. 44, W09410, doi:10.1029/2007WR006343, 2008 1 of 12
-
Upload
independent -
Category
Documents
-
view
1 -
download
0
Transcript of Costs and benefits of capturing urban runoff with competitive bidding for decentralized best...

Costs and benefits of capturing urban runoff
with competitive bidding for decentralized
best management practices
W. Bowman Cutter,1 Kenneth A. Baerenklau,1 Autumn DeWoody,1 Ritu Sharma,1
and Joong Gwang Lee2
Received 12 July 2007; revised 5 May 2008; accepted 2 June 2008; published 6 September 2008.
[1] Urban storm water runoff is both a source of pollution and a potentially valuableresource. Centralized facilities traditionally have been used to manage runoff.Decentralized best management practice (BMP) options may be able to avoid thecosts of purchasing expensive urban land needed for centralized facilities. We investigatethe cost effectiveness of implementing BMPs in a Los Angeles area watershed withtwo voluntary incentive mechanisms: competitive bidding and a fixed subsidy. Thesubsidy mechanism has lower BMP placement costs but generates relatively large excessprofits for landowners. The bidding mechanism has higher BMP placement costs butgenerates smaller excess profits and tends to be more cost effective for the regulator,particularly at higher runoff capture levels. We also compare the costs of bidding andcentralized alternatives and find that the bidding alternative is significantly less costly thana centralized alternative for a range of storm water capture goals. Finally, we examine thevalue of infiltrated storm water and find that it is up to 38% of total BMP costs.
Citation: Cutter, W. B., K. A. Baerenklau, A. DeWoody, R. Sharma, and J. G. Lee (2008), Costs and benefits of capturing urban
runoff with competitive bidding for decentralized best management practices, Water Resour. Res., 44, W09410,
doi:10.1029/2007WR006343.
1. Introduction
[2] Urban storm water runoff is both a significant pollu-tion problem as well as a potential resource. The pollutionproblem results from the ‘‘urban sludge’’ (heavy metals,petroleum residue, salts, solid waste, etc.) that is carried offimpermeable surfaces by storm events and washed intoreceiving water bodies where it damages ecological andrecreational resources [Arnold and Gibbons, 1996]. If thesepollutants can be effectively removed from storm water thenrunoff also represents a potentially beneficial resource.Without urban development more of this runoff wouldnaturally infiltrate and replenish groundwater stocks, butinstead it is treated as a waste and disposed of accordingly[Ferguson, 1994]. Groundwater supplies in urban regionsthus remain lower than they might be otherwise, which seemsespecially inefficient in arid regions such as the U.S. desertsouthwest. In light of recent predictions of increased likeli-hood of long-term drought in such areas [IntergovernmentalPanel on Climate Change, 2007; Seager et al., 2007], it isimperative to investigate cost-effective ways to capture,clean, and infiltrate more of this potential resource.[3] The dominant paradigm in storm water management
has been to avoid flooding by quickly conveying runoff to areceiving water body [Ferguson, 1998]. For this purpose,
conveyance structures that centralize runoff are essential.Local storm water agencies have continued to emphasizecentralized solutions even as the emphasis on water qualityin receiving waters has grown. These centralized facilities(such as detention pond, infiltration pits and trenches,artificial wetland, etc.) have the advantage of economiesof scale where large capacities are cheap on a per-unitcapacity basis. However, in order to use that capacity, suchfacilities must drain a large area. In dense urban areas it isoften difficult to achieve this goal without impinging onprivate land, purchasing contiguous land parcels, or signif-icantly redesigning redevelopment to accommodate central-ized facilities.[4] Recent work has focused on the use of decentralized
parcel-level best management practices (BMPs) for manag-ing runoff or improving runoff quality across a larger area ofa landscape. Arabi et al. [2006] uses a genetic algorithmapproach to find the most cost-effective approach to imple-menting BMPs to control pollutants in agricultural runoff.Similar papers that use an optimization approach to find thebest placement of parcel-level BMPs include Bekele andNicklow [2005],Muleta and Nicklow [2005], and Srivastavaet al. [2003]. Perez-Pedini et al. [2005] examines optimalplacement of infiltration BMPs in a watershed to controlpeak runoff.[5] Although decentralized BMPs cannot provide the
same scale economies as centralized facilities, they do notrequire large contiguous land areas. Furthermore they canbe placed on parcels with relatively low marginal land usevalue thus effectively reducing the total installation cost.This is particularly beneficial in dense urban areas where
1Department of Environmental Sciences, University of California,Riverside, California, USA.
2Tetra Tech, Inc., Boulder, Colorado, USA.
Copyright 2008 by the American Geophysical Union.0043-1397/08/2007WR006343
W09410
WATER RESOURCES RESEARCH, VOL. 44, W09410, doi:10.1029/2007WR006343, 2008
1 of 12

land values can be in the millions of dollars per acre. It istherefore an empirical question whether centralized ordecentralized runoff control is more cost effective.[6] In order to exploit their potential cost advantage,
decentralized BMPs must be targeted at parcels with rela-tively lower costs of converting land to BMP area. If aregulatory agency oversees relatively few parcels, has goodinformation about costs, and has the authority to order BMPinstallations, then it may be relatively straightforward forthe agency to impose the least cost placement of BMPs.However, with many parcels, limited information, and/orlimited authority, the agency may not be able to implementthis approach in practice. Instead the agency can employrelatively simple economic incentive policies to encourageBMP installations by private landowners.[7] At least two types of incentives have been examined
previously: a fee/rebate system [Thurston, 2006] and atradable allowance system [Thurston et al., 2003; Thurston,2006]. Both of these approaches involve both mandatoryand voluntary components: the fee/rebate system includes amandatory storm water fee and a voluntary rebate; thetradable allowance system involves a mandatory ‘‘cap’’ ontotal runoff and voluntary trading of runoff allowances. Inaddition, both applications involve assignment of BMPtypes to parcels on the basis of soil types, rather thanallowing endogenous selection of BMP types by land-owners. Purely voluntary competitive bidding also has beenproposed in the recent literature [e.g., Roy et al., 2006], butto our knowledge its cost effectiveness has not yet beenevaluated.[8] Our research extends this work in several ways. First,
the incentives we examine are purely voluntary and thusapply to regulatory agencies with limited authority tocompel landowners to modify their properties to achieverunoff capture goals. In this scenario regulatory alternativesare limited and economic incentives must provide the entiremotivation for landowner participation in the regulatoryprogram. We believe this is more relevant for existingdevelopments than new developments where BMP require-ments can be more easily built into the permitting process.The storm water fee rebates used by several cities [Doll etal., 1999] are similar to the decentralized, incentive-basedsystems we propose in that they give financial incentives foron-site storm water management. These incentives arestructured as discounts on storm water runoff charges andare based on retention or detention capacity. However, theserebates have incentive structures that do not appear to bedesigned to minimize storm water capture costs.[9] Second, in keeping with the voluntary nature of our
mechanisms, we allow each landowner to endogenouslyselect the BMP type and capacity for each parcel, ratherthan assigning BMP types to parcels on the basis of soiltypes or other characteristics. Third, we incorporate ahedonic analysis of land costs for our heterogeneous studyarea which shows substantial variability in land costs acrossparcels. Fourth, we explicitly model the economies of scaleinherent in decentralized BMPs which previous studiestypically have overlooked in favor of a constant marginalcost schedule.[10] We use this framework to estimate costs for two
approaches to storm water runoff reduction in our SouthernCalifornia study area: a fixed subsidy paid per unit of runoff
captured by decentralized BMPs, and a competitive biddingprocess designed to reduce total agency costs (i.e., budget-ary costs for the regulatory agency) below those of thesubsidy mechanism. We also estimate the cost for anequivalent amount of centralized treatment. Our baselineresults show that competitive bidding is more cost effectivethan either centralized treatment or a fixed subsidy for arange of storm water capture goals. A sensitivity analysisfurther demonstrates this result is robust to various combi-nations of plausible parameter values. Finally we estimatethe value of infiltrated water and find that it represents asignificant fraction of total BMP costs.
2. Methodology
[11] Our approach posits a constrained cost minimizationproblem for the regulator: minimize the present value ofland, construction, and maintenance costs while achieving adesired level of runoff capture. For the two decentralizedmechanisms, we assume landowners act as profit max-imizers when faced with regulatory incentives. We limitour attention to two infiltration BMP options: infiltrationpits and porous pavement. Infiltration BMPs are likely thebest approach when trying to meet a broad array of waterquality, supply, and ecological goals [Ferguson, 1994]. Wealso have good local cost data for these devices. We do notconsider infiltration basins because evidence from SantaMonica City’s storm water program indicates that land-owners rarely choose to install this option [DeWoody, 2007].We do not consider swales because Heaney et al. [2002]states that swales are not usually suitable for commercial/industrial and heavily urban areas similar to our study site.Future research should examine other BMPs; however, it isimportant to note that more BMP choices could only lowerthe costs or increase the effectiveness of the incentive-basedapproach.[12] This study considers the commercial, industrial,
retail, and multifamily use parcels in the Sun Valleywatershed near Los Angeles, California (918 parcels withsufficient information, see Figure 1 for a map of the area).The entire watershed is 4.4 square miles situated on alluvialrock and gravel soils. Industrial and commercial uses makeup 59% of the watershed, residential 35%, and open space5% of the entire watershed [County of Los Angeles, 2004].The watershed is approximately 63.3% impervious. Thisvery heterogeneous watershed is representative of problem-atic runoff-generating urban landscapes. We exclude single-family houses from the parcels we consider because webelieve that they are relatively poor candidates for financialincentives in mixed-use areas because it would be relativelydifficult to monitor single-family houses to ensure BMPmaintenance (because of the number of parcels that mightbe enrolled) and because economies of scale would berelatively limited on these smaller parcels. We first simulaterunoff and capture for a wide array of parcel characteristicsand BMP types and sizes for the Sun Valley precipitationrecord. Using these results, we construct reduced-formrelationships between parcel characteristics, BMP capacity,and runoff capture for each infiltration rate. We use thereduced form equations to model the fixed subsidy mech-anism and determine the optimal location and sizing ofinfiltration capacity across the watershed. We then construct
2 of 12
W09410 CUTTER ET AL.: CAPTURING URBAN RUNOFF W09410

the competitive bidding mechanisms intending to approxi-mate the optimal mix of BMP types and capacities.
2.1. Runoff and BMP Modeling
[13] We model runoff and BMP capture at the parcel levelusing the spreadsheet-based STORM (SS STORM) runoffand BMP modeling approach. SS STORM is a massbalance–based area-normalized storm water flow routingand water quality simulation model [Lee et al., 2005]. Thismodel originated from STORM (Storage, Treatment, Over-flow, Runoff Model) which has been used to find the bestmix of storm water storage and release control strategiesover an extended period [Hydrologic Engineering Center,1977]. This model can work with parcel level data onparking, roof, and permeable area. Standard local roll parceldata does not contain this information. In order to estimatethese areas we obtained real estate sales data with thebuilding footprint or roof area and the number of parkingspaces on the property and matched the real estate parcelssales data to the local roll data for 550 parcels in and aroundSun Valley. We used a regression approach to estimate therelationship between plot characteristics and pervious, roof-top, and parking area. We use these estimates of parking,roof, and impermeable area for runoff and land cost esti-mates in the optimization modeling. The procedure ispresented as supporting material at http://www.envisci.ucr.edu/faculty/baerenklau.html. Table 1 lists the estimatesfor the 918 non-single-family parcels in the Sun Valley area.
[14] We customize SS STORM to the Sun Valley area byincorporating a 5-year hourly rain file from the nearby LaTuna Canyon rain station. In addition, we assume a numberof other parameter values summarized in Table 2. In order tomake the optimization modeling tractable, we use regres-sion analysis to find reduced form specifications that matchthe simulation models. However, before reporting ourresults we take the BMP capacities generated by theoptimization process and simulate runoff capture with SSSTORM. Therefore all runoff capture results presented inthe paper are derived from SS STORM simulations.
Figure 1. Map of Sun Valley watershed (34�1306.6400N, 118�22023.3100W).
Table 1. Estimated Parcel Characteristics for Sun Valley Study
Areaa
Land Use
Mean Area (m2) Proportion of Area
ObservedParking Roof Other Total Parking Roof Other
Duplex 136 165 283 584 0.23 0.28 0.49 51Triplex 162 206 284 651 0.25 0.32 0.44 21Quadplex 195 219 238 652 0.30 0.34 0.37 36Quintplex 478 1,430 184 2,092 0.23 0.68 0.09 139Commercial 1 761 251 266 1,278 0.60 0.20 0.21 122Commercial 2 799 380 427 1,606 0.50 0.24 0.27 125Industrial 888 846 2,038 3,773 0.24 0.22 0.54 424Total 712 715 1,094 2,521 0.38 0.36 0.26 918
aNon-single-family parcels only.
W09410 CUTTER ET AL.: CAPTURING URBAN RUNOFF
3 of 12
W09410

[15] Centralized BMP runoff capture is modeled by usingSS STORM to find the capacities necessary to capture agiven proportion of runoff from the 231 ha area (see Table 3for the parameters). We assume the same roof, grass, andpavement proportions, infiltration rates, and precipitationdata as in the decentralized runs. The modeling is approx-imate and does not consider conveyance travel times;therefore cost comparisons for an actual application shouldimplement a more detailed flow-routing model.
2.2. Land, Construction, and Maintenance Costs
[16] When landowners dedicate a portion of their parcelto a BMP, they likely forgo other potentially more valuableuses of that land. Losing the opportunity to otherwiseemploy that land area has a cost, but it is likely less thanthe cost of buying land because the owner does not lose alluses of the land. We assume that it would be prohibitivelyexpensive to tear down buildings to replace them withBMPs. That leaves parking and permeable areas as areathat could be used for BMPs. We assume the owner valuesarea devoted to infiltration pits as permeable area and thearea devoted to porous pavement as parking. Becauseparking is more valuable than permeable area in our sample,land costs are incurred only when infiltration pits displaceexisting parking area.[17] We use a three step process to estimate this land use
cost that is explained in detail by DeWoody [2007]. First, weestimate a hedonic regression equation that relates propertyvalues to variables including parking and permeable area.For this step we use real estate data covering the sales ofnon-single-family residential parcels from 1996 to 2005over most of Los Angeles county. Next, we use thisregression equation to estimate property values for eacheligible Sun Valley parcel. Then we simulate the net cost ofreplacing parking area with permeable area by decreasing
the parking area and increasing the permeable area by equalamounts and using the regression equation to predict a newproperty value. The difference in estimated property valuesbetween the original property and the modified propertydivided by the change in area is our estimate of theopportunity cost of converting parking area to infiltrationpit area. Table 4 shows the summary statistics for theestimated opportunity costs of parking in the study areaby land use. The unit land values are high enough so thatonly a few properties at the highest capture percentagesincur land costs by converting parking area to infiltrationpits. At these land prices, parking area is essentially fixed soin the interest of conserving space the hedonic regressionsare not included in this paper.[18] Centralized BMPs also occupy land which, whether
it is land that is explicitly purchased for the BMP or existingpublic land, will likely have an opportunity cost similar tothe market value of land. For these land costs we use dataon 1,398 land sales in the area from 2003 to 2005 from theCOSTAR real estate database. Table 5 shows the medianprice per square meter for vacant land zoned for retail,commercial, or residential uses and for different areas ofLos Angeles County. For the comparisons in this paper weuse the $696/m2 value that is the mean for the San FernandoValley area where Sun Valley is located. Comparison ofTables 4 and 5 shows the estimated average parking usevalues for the parcels in Sun Valley are significantly lessexpensive than vacant land in the same geographic area.[19] Detailed descriptions of our construction and main-
tenance cost calculations are provided by DeWoody [2007].Here we summarize the cost functions used for our baseline
Table 2. Baseline Parameter Values for SS STORM
Parameter Value Units
Infiltration rate 76.2a mm/hInfiltration pit depth 1.524 mInfiltration pit void proportion 0.4b -Porous pavement depth 0.3048 mPorous pavement void proportion 0.22c -Depression storage roof 2.7 mmDepression storage pavement 10 mmDepression storage permeable 13.5 mm
aBased on sandy soil of the site.bFerguson [1994].cRange of .15– .25 given at www.cncement.org.
Table 3. Baseline Centralized Facility Parameters for SS STORM
Parameter Value Units
Infiltration rate 76.2a mm/hInfiltration trench depth 1.524 mInfiltration trench void proportion 0.4 -Infiltration basin depth 0.762 mInfiltration basin void proportion 1 -Depression storage roof 2.7 mmDepression storage pavement 10 mmDepression storage permeable 13.5 mm
aBased on sandy soil of the site.
Table 4. Estimated Parking Land Use Costs for Sun Valley
Parcelsa
Land Use Mean Median
Duplex 0.65 0.00Triplex 7.86 0.00Quadplex 32.08 31.75Quintplex 330.56 315.60Commercial 1 251.23 126.69Commercial 2 296.44 130.57Industrial 272.00 244.77Total 250.91 203.22
aGiven in dollars per square meter.
Table 5. Costs for Vacant Land in Los Angeles
Land Typea
TotalCommercial Industrial Residential
Southwest Los Angeles CountyCost ($/m2) 1,344 493 1,801 1,385Observations 3,100 1,033 2,519 6,652
San Fernando west of PasadenaCost ($/m2) 717 348 747 696Observations 721 226 1,270 2,217
San Gabriel areaCost ($/m2) 637 280 659 580Observations 1,518 517 861 2,895
TotalCost ($/m2) 1,058 413 1,301 1,057Observations 5,339 1,776 4,650 11,765
aVacant land sales listed in the Costar sales database from 2003 to 2005,adjusted to 2005 dollars.
4 of 12
W09410 CUTTER ET AL.: CAPTURING URBAN RUNOFF W09410

results. (See http://www.envisci.ucr.edu/faculty/baerenklau.html for a description of the cost ranges used for oursensitivity analysis.) Construction costs for infiltration pitsare estimated using the following equation which waschosen on the basis of goodness of fit with available data:
cost ¼ g1 capacityð Þg2 exp g3 þ g4�g5 þ ln capacity½ �2
�h iþ g6 þ g7 ln g8 þ eg9capacity
� �ð1Þ
where capacity (m3) = area (m2)� depth (m)� void fraction;g1 = 1665.46; g2 = 1.33; g3 = 1.55; g4 = 0.049; g5 = 5.58;g6 = 5622.60; g7 = 1464.29; g8 = 47.67; and g9 = 0.074.The second two terms keep marginal costs in a narrow rangefor relatively large capacities where DeWoody [2007] haslittle data. For maintenance costs we use estimates from theSoutheastern Wisconsin Regional Planning Commission[Southeastern Wisconsin Regional Planning Commission,1991] updated to 2005 dollars using the Engineering NewsRecord [2007] Los Angeles construction cost index. Fromthis we derive a maintenance cost for infiltration pits of$1.89E-04/m3 of void capacity per year. We also add 1.13%of capital costs per year to reflect periodic rehabilitationcosts [EPA, 1999].[20] The construction cost for porous pavement (specifi-
cally, porous concrete) has been estimated between $48.44/m2
for large installations with porous soils and $96.88/m2 forsmall installations with poor soils where existing asphaltmust first be removed (A. Youngs, California CementCouncil, verbal communication, 2006). We use an estimateof $86.11/m2 in our baseline simulations that is appropriatefor small installations with well-drained soils. We deriveporous pavement maintenance cost estimates from South-eastern Wisconsin Regional Planning Commission [1991]updated to 2005 dollars using the Los Angeles EngineeringNews Record construction cost index. This gives an annualmaintenance cost for the Los Angeles area of $0.0753/m2 ofporous pavement.[21] For construction and maintenance cost data on
centralized alternatives we use information contained inworks by Los Angeles Regional Water Quality Control Board(RWQCB-LA) [2005], Caltrans Environmental Program[2001], U.S. Environmental Protection Agency (EPA)[1999], and Federal Highway Administration (FHA)[2003]. We restrict our attention to two designs proposedby local regulators [RWQCB-LA, 2005]: infiltration trenchesand infiltrations basins. We concentrate on these twodesigns because they are the key infiltration technologiesidentified as possible centralized devices by Los Angelesarea water quality regulators [RWQCB-LA, 2005]. Sinceeconomies of scale are a critical part of the comparisonbetween centralized facilities and decentralized BMPs itwould not be useful to examine centralized facilities forwhich this information is not available. The cost forinfiltration trenches is based on FHA [2003], inflated to2005 dollars using Engineering News Record (ENR) costindices:
cost ¼ 1661:7capacity0:63 ð2Þ
where capacity is measured in cubic meters. EPA [1999]estimates the annual maintenance cost are between 5 and
10% of the construction cost; we use 7.5% as our baselinevalue. We add an additional 1.13% of capital costs per yearfor rehabilitation costs on the basis of periodic rehabilitation[EPA, 1999] for a total maintenance and rehabilitation costof 8.63% of capital costs per year.[22] FHA [2003] also estimates the construction cost of
infiltration basins. These may be more cost-effective alter-natives than infiltration trenches or sand filters for largerdrainages [FHA, 2003]. After adjusting the costs to 2005dollars, construction costs are
cost ¼ 205:16capacity0:69 ð3Þ
where capacity is measured in cubic meters. FHA does notestimate maintenance costs for this BMP, so we use anannual value of 5% of construction costs which is at thelower end of the range of the other centralized alternatives.We add an additional 1.72% of capital costs per year forrehabilitation costs on the basis of periodic rehabilitation[FHA, 2003] for a total maintenance and rehabilitation costof 6.72% of capital costs per year.
2.3. Enforcement and Monitoring Costs
[23] For the comparison between centralized and decen-tralized systems it is not the level of enforcement andmonitoring costs that matter, but the difference betweendecentralized and centralized costs. The enforcement, mon-itoring, and other transaction costs for an incentive-basedsystem are difficult to determine. The limited evidence thatexists suggests that these costs are high for residentialproperties. Only one of the cities in Doll et al.’s [1999] listof cities that implement incentives for BMP adoption allowsresidential owners to be eligible for the credits. This datalends further support to our decision to not include resi-dences among the property types eligible for incentives.[24] It seems likely that the transaction costs for moni-
toring many small BMPs will be larger than for a few largerBMPs. However, centralized infrastructure, especially whenplaced in multiple-use open space such as parks, also needsregular monitoring and upkeep agreements. Though thesecosts may be lower than the enforcement and monitoringcosts of a decentralized approach, they will still be signif-icant. The cost difference in enforcement and monitoring isan open question for future research.
2.4. Optimal Placement and Sizing of DecentralizedBMPs
[25] We define ‘‘optimal’’ decentralized BMP implemen-tation as the combination of BMP types, sizes, and locationsthat minimizes the present value of land, construction, andmaintenance costs (which we call the ‘‘BMP placementcost’’) for all parcels while achieving the desired level ofrunoff capture. This ideal cost-minimizing solution may notbe attainable in practice, but it provides a useful best-casescenario against which practical second-best solutions maybe compared.[26] Any decentralized solution potentially involves
many parcels. An important aspect of our specific problemis that parcels can be treated independently from oneanother. Runoff from any parcel enters directly into streets,gutters, and other conveyances where it flows to an eventualoutfall (the Los Angeles River) without flowing back acrossany other parcels where it might be captured by other
W09410 CUTTER ET AL.: CAPTURING URBAN RUNOFF
5 of 12
W09410

BMPs. This means there is no parcel-to-parcel runoff andtherefore runoff capture on any parcel does not affectcapture on any other parcels (L. Merrill, personal commu-nication, 16 October 2007). This is a common situation inurban and suburban areas, especially with non-single-familyparcels and where parcel-to-parcel runoff is prohibited bylaw, which differentiates urban from rural and agriculturalareas where parcel-to-parcel runoff is more common andthus parcels cannot be treated independently [Arabi et al.,2006]. Furthermore, shallow groundwater mounding andlateral flow also is not an issue because of a very lowgroundwater table. Therefore infiltration at any parcel is notaffected by infiltration at any other parcel.[27] Parcel independence also allows us to solve a sim-
pler set of ‘‘dual’’ unconstrained profit maximization prob-lems instead of the more complicated ‘‘primal’’ constrainedcost minimization problem mentioned earlier [Silberberg,1990]. The solution to the primal would require solving ahigh-dimensional problem with 3672 variables: a binaryvariable for each BMP type and a continuous variable foreach BMP size at each of 918 parcels. This solution wouldgenerate optimal BMP locations and sizes. It also wouldallow us to calculate the marginal cost of capture ($/unit) ateach parcel. A necessary condition for the cost-minimizingsolution is that the marginal cost of capture is equal acrossall parcels with BMPs. We can use this condition to insteadsolve a set of ‘‘dual’’ problems in which we find the lowestcommon payment (subsidy) per unit of capture that inducesindependent profit-maximizing landowners to build enoughBMP capacity to achieve the desired amount of runoffcapture. Each of these 918 independent problems involvesonly 4 variables (2 binary and 2 continuous variables perparcel) and thus is much easier to solve than the primalproblem. A simple grid search finds the optimal payment.[28] A potential problem with the dual approach is related
to the shape of the marginal cost of capture function. Asdiscussed previously, we find that the marginal cost ofcapture at the parcel level often decreases for small BMPsizes (low levels of capture) because of economies of scale,but eventually increases for larger BMP sizes (high levels ofcapture) because of the relative infrequency of large storms.
Thus the marginal cost of capture is U shaped (Figure 2). Ifthe marginal cost of capture were strictly increasing (and ifcertain other mathematical conditions are satisfied, includ-ing continuous differentiability of the cost function andconvexity of the feasible solution set), offering landownersa fixed subsidy per unit of capture could achieve the optimalBMP placement and sizing as described in the dual problemabove. But when marginal cost is U shaped, a subsidy maynot achieve the optimal result. This is because the subsidyinduces each landowner with a U-shaped marginal costcurve to build either no capacity or a relatively largecapacity (associated with the upward sloping part of themarginal cost curve). But it may be optimal for a landownerto build a relatively small capacity (associated with thedownward sloping part of the curve) that also has theappropriate marginal cost. However, the optimal solutionto our primal problem necessarily involves at most only onelandowner building a capacity associated with the down-ward sloping part of his/her marginal cost curve; otherwisetotal cost can be reduced by increasing capture at one parceland decreasing it at the other. Because we have hundreds oflandowners, if one builds a suboptimal capacity this will nothave a significant effect on either the total BMP placementcost or the total runoff capture. Therefore we can be assuredthat a fixed subsidy per unit of runoff capture will result inBMP locations and capacities that are arbitrarily close tothe optimal solution to our constrained cost minimizationproblem.
2.5. Policy Options: Subsidy and Bidding Mechanisms
[29] A practical problem with offering a fixed per-unitsubsidy to encourage voluntary BMP installation is thatlandowners who choose to install BMPs do so because it isprofitable. That is, their subsidy revenue exceeds their BMPplacement cost, and therefore the agency cost (the presentvalue of all the payments made to landowners) exceeds theBMP placement cost, possibly by a significant amount. Oneway to reduce the agency cost, relative to the subsidy case,is to utilize a competitive bidding process. Competitivebidding can reduce the total agency cost by creating anincentive for bidders to lower their offer prices, therebyeffectively giving up some of the excess profit (defined hereas the economic rent received from ownership of privateinformation) they would earn in the subsidy case. Theincentive is inherent in the competition among landownerswho do not know how other landowners will bid: a higherprice reduces the chance that a bid will be accepted, inwhich case the landowner earns no excess profit; whereas alower price increases the chance that it will be accepted, inwhich case the landowner earns a positive excess profit.Thus each landowner tends to offer a lower price in hopesof earning at least some excess profit. The upshot is that iflandowners can be induced to offer (bid) to install BMPcapacities that are similar to those they would install in thesubsidy case, a well-designed bidding process should re-duce the total agency cost below that for the subsidy case.[30] In light of the preceding, we investigate the cost
effectiveness of both subsidy and bidding instruments forinducing voluntary installations of decentralized BMPs thatachieve various annual aggregate runoff capture targets forthe Sun Valley watershed. For the subsidy mechanism, ourgoal is to find the smallest annual per-unit payment thatachieves the desired level of (estimated annual long-run
Figure 2. U-shaped marginal cost.
6 of 12
W09410 CUTTER ET AL.: CAPTURING URBAN RUNOFF W09410

average) runoff capture. Runoff capture is determined bythe BMP capacity installed by each landowner, as deter-mined by SS STORM. The capacity installed by eachlandowner is given by the solution to a parcel-level opti-mization problem whereby the landowner selects the BMPtypes and capacities that generate the most excess profitgiven the subsidy level being offered.[31] The subsidy mechanism compensates each partici-
pating landowner with an annual payment throughout theuseful life of the BMP in exchange for incurring land andconstruction costs initially and maintenance costs periodi-cally (other opportunity costs of participating in the pro-gram, such as acquiring information, submitting anapplication, and maintaining records, are not explicitlymodeled here). Thus each landowner faces a problem nodifferent from that of investing in a financial instrument thatwill pay a fixed annual dividend in the future. Eachlandowner also faces a strong incentive to remain in theprogram for the entire duration because early exit (i.e.,removing the BMP or failing to perform required mainte-nance) from this payment schedule reduces the effective rateof return below the minimum acceptable rate. Therefore weassume each landowner acts to maximize the net presentvalue of participating in the BMP subsidy scheme as thoughit were a financial instrument. In our baseline scenario wespecify a time horizon of 30 years and a discount rate of 8%for the present value calculation. We select 30 years becauseit is a common time horizon for long-term investments (e.g.,treasury bills, fixed mortgages). We select an 8% discountrate to reflect the opportunity cost of ‘‘investing’’ in theBMP rather than in other available low-risk investmentssuch as government bonds. Therefore, if there is no com-bination of BMP types and capacities that can generate atleast an 8% before-tax rate of return over a 30-year timeperiod, we assume the landowner will choose not toparticipate in the subsidy program and will instead investelsewhere. Later we conduct a sensitivity analysis of thediscount rate.[32] Mathematically, each landowner’s optimization
problem under the subsidy mechanism is expressed as
maxfI ;Pg
"X30t¼1
s � PCPT I þ Pð Þ � R mI I mPP
1þ rð Þt� �
CI Ið Þ CP Pð Þ L Ið Þ#
ð4Þ
where I is the installed capacity of infiltration pits and P isthe installed capacity of porous pavement; t is timemeasured in years; r is the annual discount rate; s is theper-unit subsidy; PCPT is percent capture averaged over the5-year hydrological record; R is estimated annual runoff;mI andmP are maintenance costs per unit of capacity for eachtype of BMP; CI and CP are construction costs for each typeof BMP (each a function of BMP capacity); and L is landcost for infiltration pits. We also impose upper and lowerconstraints on BMP capacity, both to prevent total BMParea from intruding into the building footprint (or exceedingthe total paved area, for porous pavement) and to precludeconstruction of very small BMPs (no less than 50 squarefeet for infiltration pits and 100 square feet for porouspavement, but sometimes larger for very large parcels).
[33] After converting this expression and the associatedfunctions and constraints into a form that is amenable tonumerical optimization, we end up with a mixed-integernonlinear programming problem that can be solved toobtain each landowner’s optimal response to any givensubsidy. We solve this problem using the GAMS program-ming language and the BARON commercial solver packageto find the globally optimal solution for each landowner. Itis then straightforward to add the subsidy payments andcalculate the present value of agency costs and to determinethe total capture. Since all costs reported in the paper arefrom the agency’s point of view, a discount rate of 5% wasused to calculate present values because this is in the middleof the range of values used by public agencies [Kohyama,2006]. This is consistent with the decision to evaluate allcosts from the public agency point of view. From a socialpoint of view all profits that accrue to landowners aretransfers and would not be counted as costs.[34] The bidding mechanism is largely based on the same
functions and parameter values presented above for thesubsidy mechanism. However, compared to the subsidyapproach, the bidding mechanism provides landowners withan additional degree of freedom: not only can they specifythe attributes of the BMPs, but they also can specify thepayments they would require. Therefore, without additionalstructure, there is no longer a well-defined solution to thelandowner’s optimization problem. Furthermore, biddingpotentially involves strategic behavior by landowners whoare competing to have their bids accepted into the program,but who also want to earn excess profit. Despite theincentive to submit lower bids, some landowners maystrategically bid above their true BMP placement costs inhopes of earning excess profit. Because the extent of such‘‘bid shading’’ would be driven by the subjective beliefs andrisk preferences of landowners, it is not obvious howlandowners will respond to a bidding program and thushow cost effective a bidding program will be without someadditional assumptions about bidding behavior.[35] There is a very large economics literature on mech-
anism design and auction theory. Latacz-Lohmann andSchilizzi [2006] provide an excellent survey focused onconservation auctions. The authors emphasize that auctiontheory offers little guidance for conservation auction designbecause of structural differences between conservationauctions and standard auctions that have been examinedin the literature. They also state that empirical studies haveproduced mixed results, thus highlighting the importance ofpractical implementation issues in auction design. Spacelimitations prevent a more complete discussion of therationale for our chosen bidding mechanism, but we notethat its characteristics largely reflect the authors’ conclu-sions. Future work will examine conservation auctiontheory in more detail.[36] In our baseline scenario we examine the best possi-
ble case where landowners do not attempt to ‘‘shade’’ theirbids (however later we relax this assumption and incorpo-rate bid shading in the sensitivity analysis of the discountrate). In other words, we assume competitive bidding drivesdown the rate of return from the BMP program to that of thebest alternative investment (8%), thus generating no excessprofit for bidders. (An 8% rate of return is high for safeinvestments, so it could also be regarded as combining a
W09410 CUTTER ET AL.: CAPTURING URBAN RUNOFF
7 of 12
W09410

lower rate of return requirement with some bid shading.)This allows us to specify that any bid must satisfy a zeroexcess profit condition when the net present value iscalculated at an 8% rate of return; however, it does not tellus which of many bids that satisfy this condition will bechosen by each bidder.[37] Therefore we must specify what constitutes a ‘‘good
bid’’ before we can model how bids are generated. If allbidders were submitting bids for a uniform amount of runoffcapture, then a good metric would be the bid price: thelower, the better. However, in this case landowners willsubmit bids for different BMPs based on the characteristicsof their land. Therefore we need to specify a metric forranking bids that involves different BMP capacities and bidprices. To do this, we define an ‘‘index function’’ thatconverts a bid of the form [infiltration pit capacity, porouspavement capacity, annual payment] into a numerical valuewith higher values corresponding to ‘‘better’’ bids. We thenassume that each landowner submits the bid that maximizesthis index function for his/her parcel subject to the zeroexcess profit condition, and that the regulator ranks all bidsby the index values and accepts bids in rank order until thecapture target is satisfied.[38] For any desired level of runoff capture, the ideal
index function would induce landowners to submit bidswith the same BMP capacities as would be induced by asubsidy that achieves the same level of capture and give upall excess profits that would be earned from the subsidymechanism (i.e., bid their true BMP placement cost). Thiswould allow placement of optimal BMP capacities at eachparcel at the lowest possible cost. However, designing andimplementing such an ideal index function generally is notpossible when the agency has incomplete information.Intuitively, for our case, this is because landowners mustbe compensated for revealing their private informationabout land costs. Therefore we implement a simpler indexfunction that encourages landowners to bid relatively largecapacities (which the results for our subsidy mechanismreveal to be desirable) and relatively low prices.[39] Each landowner’s optimization problem under the
bidding mechanism is expressed as
maxfI ;P;Sg
PCPT I þ Pð Þ � Rð Þa
S
�
s:t:X30t¼1
S mI I mPP
1þ rð Þt� �
CI Ið Þ CP Pð Þ L Ið Þ 0 ð5Þ
The term in square brackets is the index function: thenumerator is the total capture (with terms defined inequation (4)) raised to the power a; the denominator is thebid price (a total annual payment rather than per unit ofcapture as in the subsidy case). The second line is the zeroexcess profit condition which acts as a constraint. Setting upthe associated Lagrangian and deriving the first-orderconditions for a solution shows that a can be selected bythe agency to ‘‘tune’’ the index function for different capturegoals: a larger value tends to elicit bids for larger BMPcapacities and thus better approximates the outcome of arelatively large per-unit subsidy. However, because thisindex function is not ideal, it does not exactly replicate theoptimal BMP locations and capacities produced by the
subsidy mechanism; but it does provide an incentive forlandowners to reduce their bid prices. Therefore, asmodeled here, the agency faces a trade-off: departing fromthe optimal placement and sizing of BMPs tends to increaseBMP placement costs and thus increases total agency costs,but competition among bidders tends to reduce excessprofits and thus reduces total agency costs. The relative costeffectiveness of the decentralized incentives is thus anempirical question.
3. Results
[40] We analyze the cost and performance of both mech-anisms for our baseline estimates described above and for arange of plausible parameter values described in the sensi-tivity analysis below. In nearly all cases, the biddingmechanism achieves the desired capture level at consider-ably less cost than the fixed subsidy. We also comparecentralized and incentive-based alternatives and find that abidding alternative is almost always less expensive than thecentralized solution. Finally, we examine the value of runoffinfiltration and find that it is a significant proportion ofBMP costs.
3.1. Baseline Estimates
[41] Table 6 shows the relative performance of theincentive instruments for different proportions of totalrunoff capture (first column) assuming baseline parametervalues. The second column shows the minimum BMPplacement cost. The third column shows the agency costof achieving the capture proportion with a fixed subsidy.The subsidy is at least 35% more expensive than the lowestachievable cost. The difference between the first and secondcolumns represents excess profit earned by participatinglandowners. The difference shown is excess profit from theregulator’s perspective (discounted at 5%) rather than fromthe landowner’s perspective (discounted at 8%). Land-owners thus perceive the excess profit to be smaller. Thefourth through sixth columns give the agency cost ofachieving the given level of capture with the different bidindices (i.e., a = 1.0, 1.2, and 1.4, from left to right). Thebidding mechanisms have lower costs for the same captureproportion at every level of capture and tend to be substan-tially more cost effective at higher levels of capture: bid twois only 71% of the subsidy cost at 45% capture. This isbecause, in order to achieve a higher capture level, a subsidyprovides a higher per-unit payment for all participantswhereas a bidding approach raises the payment level onlyfor the marginal participant. Thus the bidding approachapproximates the aggregate cost curve better than thesubsidy approach, particularly at high capture levels.Among the bidding mechanisms, bid two has the lowestaverage cost across the three capture percentages and thus isarguably the most preferred if one had to select a singlemechanism for a range of capture values; therefore we use itbelow in our baseline comparison with a centralized approach.[42] The key issue in deciding when centralized or decen-
tralized alternatives perform better is whether the land costsavings of a decentralized approach outweigh the capacity costsavings due to the economies of scale of centralized facilities.Table 7 shows that the land cost savings of an incentive-basedsystem outweigh the economies of scale advantages of acentralized system. Bid two is significantly less expensive
8 of 12
W09410 CUTTER ET AL.: CAPTURING URBAN RUNOFF W09410

than either a centralized infiltration trench or infiltration basinfor capture levels between 10 and 45% of total runoff for thebaseline parameter values. The cost advantage is greatest atlower capture levels where bid two is less than half the cost ofan infiltration trench (the most cost-effective centralizedapproach). At higher capture levels the cost difference nar-rows, but even at 45% capture the bid two cost is only 61% ofthe costs of the infiltration trench. Of course it is unlikely that acentralized facility could drain 231 ha in the Los Angeles areaas is assumed in this analysis. For instance, the metals TMDLassumed that BMPs would be sized to drain an average of only2.02 ha each [RWQCB-LA, 2005]. This implies that the costadvantage of a decentralized system would generally begreater than this comparison implies.[43] The land costs savings are themajor factor inmaking an
incentive-based approach more cost effective. Table 7 showsthat construction and maintenance costs are much higher forbid two than the infiltration trench, as we expect given thegreater economies of scale for the centralized alternatives.However, the land cost savings more than make up thedifference. This implies that some sort of incentive-basedmechanism is crucial for deploying parcel-level, decentralizedBMPs. A traditional command-and-control regulatory ap-proach might force landowners to displace high-value landuses, which would eliminate the cost advantage of decentral-ized BMPs.[44] Net costs of infiltration approaches are further re-
duced if one considers the value of the infiltrated water. Ouranalysis considers a range of water values: (1) a low valueof $0.40/m3 from The Los Angeles Department of Water
and Power, (2) a midrange value of $0.65/m3 reflectinghistorical water supply risks from Cutter [2007], and (3) ahigh value of $0.81/m3 reflecting future drought risks due toclimate change [Seager et al., 2007]. For bid two, we thencalculate the present value of infiltrated water for a range ofcapture proportions using the average yearly infiltrationmodeled over the 2001–2006 precipitation record. At lowcapture levels and with the highest water values infiltrationbenefits are 38.5% of costs (see Table 8). This percentagedeclines with the capture percentage because of the increas-ing marginal cost of capture.
3.2. Sensitivity Analysis
[45] We construct plausible ranges for important param-eters to test the robustness of our finding that bidding ismore cost effective than a subsidy or a centralized facility.We use a quantile regression approach to equation (1) topredict the 25th and 75th percentile of construction costs forinfiltration pits. We also establish a likely range of costs forporous pavement in our study area: $70/m2 to $96.88/m2.For centralized alternatives we find that our baseline esti-mates in equations (2) and (3) are low compared to availableLos Angeles data, so we use multiples of these estimates toestablish midrange and high-cost estimates that better reflectthe Los Angeles data (note that this means our baseline costcomparison in Table 7 favors centralized treatment). Wealso determine a range of values for the required landownerrate of return (5% and 11%), with the higher value incor-porating our best estimate of the amount of bid shading wecould expect from landowners who would normally demand
Table 7. Cost Comparison of Bidding Incentive and Centralized BMP Approacha
BMPPercentCapture Construction Maintenance Subtotal
LandCost
OpportunityCostb
TotalCost
Infiltration trench 10 0.178 0.236 0.414 1.911 0.000 2.32525 0.342 0.453 0.795 5.386 0.000 6.18145 0.546 0.724 1.270 11.336 0.000 12.606
Infiltration basin 10 0.604 0.624 1.228 1.749 0.000 2.97725 1.252 1.293 2.546 5.028 0.000 7.57445 2.071 2.140 4.211 10.427 0.000 14.638
Bid 2 10 0.483 0.477 0.959 0.099 0.213 1.27125 1.881 1.220 3.101 0.099 0.670 3.87045 4.736 2.262 6.999 0.208 1.658 8.865
aCost is given in millions of dollars.bOpportunity cost represents payments to landowners in excess of construction, maintenance, and land costs needed to
achieve the required rate of return on investment (8%).
Table 6. Cost of Subsidy and Bid Incentives by Capture
Proportion for Baseline Parameter Valuesa
CapturePercentage
RegulatorMinimum
Cost
Public Costb
SubsidyBid 1
(a = 1.0)Bid 2
(a = 1.2)Bid 3
(a = 1.4)
10 0.99 1.34 1.17 1.27 1.2725 2.96 4.60 3.85 3.87 3.8645 6.61 12.47 9.15 8.82 8.87
aCost is given in million dollars.bThe public costs are not entirely up front but instead are a
present value calculated over a 30-year time horizon.
Table 8. Value of Infiltrating Runoff
CapturePercentage
Infiltration(m3/a)
Water Valuea
$0.405 $0.61 $0.81
Valueb
Value perPublicCost(%) Valueb
Value perPublicCost(%) Valueb
Value perPublicCost(%)
10 39,326 0.245 19.2 0.393 30.9 0.490 38.525 96,955 0.603 15.6 0.969 25.0 1.207 31.245 174,096 1.083 12.3 1.740 19.7 2.168 24.6
aWater value is given in million dollars per cubic meter.bValue of infiltrating runoff is given in millions of dollars.
W09410 CUTTER ET AL.: CAPTURING URBAN RUNOFF
9 of 12
W09410
an 8% return. And we consider a range of BMP infiltrationrates: 25.4 mm/h and 215.9 mm/h. A more detailed expla-nation and justification for each of these ranges is availableat http://www.envisci.ucr.edu/faculty/baerenklau.html.[46] For each of three capture levels, we calculate agency
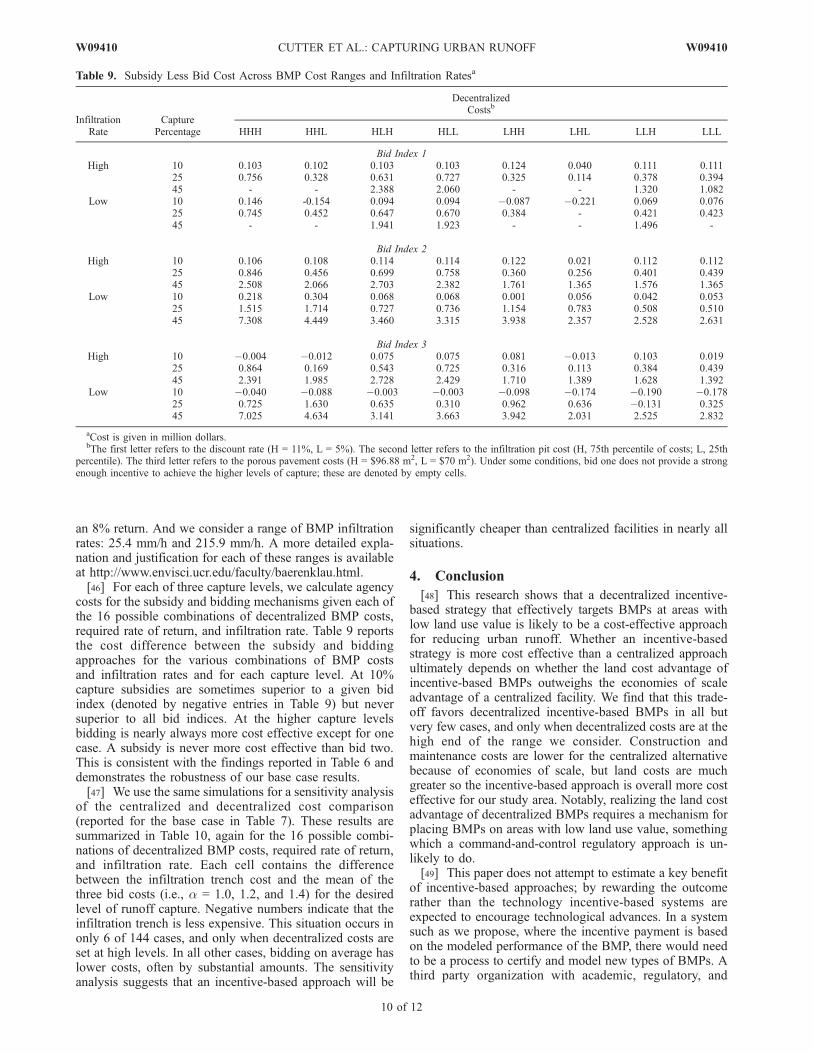
costs for the subsidy and bidding mechanisms given each ofthe 16 possible combinations of decentralized BMP costs,required rate of return, and infiltration rate. Table 9 reportsthe cost difference between the subsidy and biddingapproaches for the various combinations of BMP costsand infiltration rates and for each capture level. At 10%capture subsidies are sometimes superior to a given bidindex (denoted by negative entries in Table 9) but neversuperior to all bid indices. At the higher capture levelsbidding is nearly always more cost effective except for onecase. A subsidy is never more cost effective than bid two.This is consistent with the findings reported in Table 6 anddemonstrates the robustness of our base case results.[47] We use the same simulations for a sensitivity analysis
of the centralized and decentralized cost comparison(reported for the base case in Table 7). These results aresummarized in Table 10, again for the 16 possible combi-nations of decentralized BMP costs, required rate of return,and infiltration rate. Each cell contains the differencebetween the infiltration trench cost and the mean of thethree bid costs (i.e., a = 1.0, 1.2, and 1.4) for the desiredlevel of runoff capture. Negative numbers indicate that theinfiltration trench is less expensive. This situation occurs inonly 6 of 144 cases, and only when decentralized costs areset at high levels. In all other cases, bidding on average haslower costs, often by substantial amounts. The sensitivityanalysis suggests that an incentive-based approach will be
significantly cheaper than centralized facilities in nearly allsituations.
4. Conclusion
[48] This research shows that a decentralized incentive-based strategy that effectively targets BMPs at areas withlow land use value is likely to be a cost-effective approachfor reducing urban runoff. Whether an incentive-basedstrategy is more cost effective than a centralized approachultimately depends on whether the land cost advantage ofincentive-based BMPs outweighs the economies of scaleadvantage of a centralized facility. We find that this trade-off favors decentralized incentive-based BMPs in all butvery few cases, and only when decentralized costs are at thehigh end of the range we consider. Construction andmaintenance costs are lower for the centralized alternativebecause of economies of scale, but land costs are muchgreater so the incentive-based approach is overall more costeffective for our study area. Notably, realizing the land costadvantage of decentralized BMPs requires a mechanism forplacing BMPs on areas with low land use value, somethingwhich a command-and-control regulatory approach is un-likely to do.[49] This paper does not attempt to estimate a key benefit
of incentive-based approaches; by rewarding the outcomerather than the technology incentive-based systems areexpected to encourage technological advances. In a systemsuch as we propose, where the incentive payment is basedon the modeled performance of the BMP, there would needto be a process to certify and model new types of BMPs. Athird party organization with academic, regulatory, and
Table 9. Subsidy Less Bid Cost Across BMP Cost Ranges and Infiltration Ratesa
InfiltrationRate
CapturePercentage
DecentralizedCostsb
HHH HHL HLH HLL LHH LHL LLH LLL
Bid Index 1High 10 0.103 0.102 0.103 0.103 0.124 0.040 0.111 0.111
25 0.756 0.328 0.631 0.727 0.325 0.114 0.378 0.39445 - - 2.388 2.060 - - 1.320 1.082
Low 10 0.146 -0.154 0.094 0.094 0.087 0.221 0.069 0.07625 0.745 0.452 0.647 0.670 0.384 - 0.421 0.42345 - - 1.941 1.923 - - 1.496 -
Bid Index 2High 10 0.106 0.108 0.114 0.114 0.122 0.021 0.112 0.112
25 0.846 0.456 0.699 0.758 0.360 0.256 0.401 0.43945 2.508 2.066 2.703 2.382 1.761 1.365 1.576 1.365
Low 10 0.218 0.304 0.068 0.068 0.001 0.056 0.042 0.05325 1.515 1.714 0.727 0.736 1.154 0.783 0.508 0.51045 7.308 4.449 3.460 3.315 3.938 2.357 2.528 2.631
Bid Index 3High 10 0.004 0.012 0.075 0.075 0.081 0.013 0.103 0.019
25 0.864 0.169 0.543 0.725 0.316 0.113 0.384 0.43945 2.391 1.985 2.728 2.429 1.710 1.389 1.628 1.392
Low 10 0.040 0.088 0.003 0.003 0.098 0.174 0.190 0.17825 0.725 1.630 0.635 0.310 0.962 0.636 0.131 0.32545 7.025 4.634 3.141 3.663 3.942 2.031 2.525 2.832
aCost is given in million dollars.bThe first letter refers to the discount rate (H = 11%, L = 5%). The second letter refers to the infiltration pit cost (H, 75th percentile of costs; L, 25th
percentile). The third letter refers to the porous pavement costs (H = $96.88 m2, L = $70 m2). Under some conditions, bid one does not provide a strongenough incentive to achieve the higher levels of capture; these are denoted by empty cells.
10 of 12
W09410 CUTTER ET AL.: CAPTURING URBAN RUNOFF W09410

storm water consulting firm representatives could performthis function. Also, our methodology does not fully capturethe information benefits of a bidding system. In particularwe do not directly model the landowner’s opportunity costof time and the greater the heterogeneity in this cost themore cost effective bidding is likely to be relative to asubsidy.[50] We also compare bidding and subsidy approaches to
implementing a decentralized, incentive-based system. Asubsidy system implements the optimal BMP placement,but allows for excess profits by landowners. A bid systemeliminates the excess profits at the cost of nonoptimal BMPplacement. We find that a well-designed bid index (e.g., bidtwo) is always more cost effective than subsidies, and thatthe cost advantage grows with the capture percentage. Thisoccurs because the bidding approach achieves greater cap-ture by increasing payment to the marginal participant whilethe subsidy approach raises the capture level by increasingthe payment to all participants. The analysis suggests thatbidding is a better approach when the policy aim is tocapture a significant portion of runoff.[51] There are costs of centralized and incentive-based
systems that are not included in this analysis. Monitoringand enforcement costs may be higher with a decentralizedalternative but we cannot estimate the cost differential. Thecost curves for centralized infrastructure assume that thelocal government could purchase large undeveloped parcelsin a location that could drain a large area without the needfor additional conveyance infrastructure. It is unlikely thatall of these conditions could be fulfilled in many areas inLos Angeles or any other heavily urbanized area. A survey
of possible infiltration locations and characteristics in LosAngeles could give more realistic estimates of drainageareas and conveyance costs but such work is beyond thescope of this article.[52] Incentive-based BMPs will not provide a solution to
many runoff problems. They are likely not cost effective forsingle-family houses because of very limited economies ofscale and the expense of monitoring and enforcement acrossthe large number of parcels this would entail. Also, on-parcel BMPs do not capture precipitation which fallsdirectly on streets. Because single-family parcels and trans-portation corridors occupy significant portions of total landarea, an incentive-based approach would necessarily com-plement centralized facilities that would still manage runofffrom a large area.[53] However, it does appear that incentive-based BMPs
would be a cost-effective way to either reduce the size ofcentralized facilities or eliminate the need for them inheavily commercial, industrial, or retail areas. An evaluationof the optimal mix of centralized and incentive-based,decentralized approaches is an interesting topic that isbeyond the scope of this paper but will be an avenue forfuture research.
Notation
g1, . . ., g9 constant for infiltration pit cost equation.I installed capacity of infiltration pits, m3.P installed capacity of porous pavement, m3.t time period, years.r annual discount rate.s subsidy per unit of expected annual runoff
capture (fixed subsidy mechanism), $/m3.
Table 10. Cost Comparison of Bidding Incentive and Centralized BMP Approacha
InfiltrationRate
CapturePercentage
Decentralized Costsb
HHH HHL HLH HLL LHH LHL LLH LLL
Low Centralized CostsHigh 10 0.02 0.07 0.76 0.76 0.43 0.48 0.85 0.82
25 0.55 0.16 1.51 1.53 0.79 1.13 1.91 1.9445 1.49 0.18 2.15 2.31 1.52 2.44 3.31 3.49
Low 10 0.85 0.76 2.85 2.85 1.86 1.82 3.06 3.0625 1.41 1.55 7.48 7.36 4.76 5.04 8.17 8.3245 0.83 2.27 12.83 13.04 8.68 9.92 15.34 15.86
Middle Centralized CostsHigh 10 0.28 0.33 1.02 1.02 0.70 0.75 1.11 1.09
25 0.05 0.34 2.02 2.03 1.29 1.64 2.42 2.4545 0.69 0.62 2.95 3.11 2.32 3.24 4.11 4.29
Low 10 1.46 1.37 3.46 3.46 2.47 2.43 3.67 3.6725 2.61 2.75 8.68 8.56 5.95 6.24 9.36 9.5245 2.73 4.17 14.73 14.94 10.58 11.81 17.24 17.76
High Centralized CostsHigh 10 1.27 1.32 2.01 2.01 1.69 1.74 2.10 2.08
25 1.84 2.23 3.90 3.92 3.18 3.52 4.30 4.3345 2.32 3.63 5.96 6.12 5.34 6.25 7.12 7.30
Low 10 3.75 3.66 5.75 5.75 4.76 4.72 5.96 5.9625 7.09 7.23 13.16 13.04 10.44 10.72 13.85 14.0045 9.84 11.28 21.83 22.04 17.68 18.92 24.34 24.86
aMean of infiltration trench less bid costs. Cost is given in million dollars.bThe first letter refers to the discount rate (H = 11%, L = 5%). The second letter refers to the infiltration pit cost (H, 75th percentile of costs; L, 25th
percentile). The third letter refers to the porous pavement costs (H = $96.88 m2, L = $70 m2). Under some conditions, bid one does not provide a strongenough incentive to achieve the higher levels of capture; these are denoted by empty cells.
W09410 CUTTER ET AL.: CAPTURING URBAN RUNOFF
11 of 12
W09410

PCPT expected percentage of annual runoff capture.R expected annual runoff, m3.mI expected annual maintenance cost per unit of
capacity for infiltration pits, $/m3.mP expected annual maintenance cost per unit of
capacity for porous pavement, $/m3.CI construction cost for infiltration pits, $.CP construction cost for porous pavement, $.L land cost for infiltration pits, $.S annual BMP payment (bidding mechanism),
$.a parameter selected by the agency to influence
bid types.
[54] Acknowledgments. This research is generously supported byEPA grant CP-96950701-0 and the City of Los Angeles. We also thankXavier Swamikannu for his assistance and support.
ReferencesArabi, M., R. S. Govindaraju, and M. M. Hantush (2006), Cost-effectiveallocation of watershed management practices using a genetic algorithm,Water Resour. Res., 42, W10429, doi:10.1029/2006WR004931.
Arnold, C. L., and C. J. Gibbons (1996), Impervious surface coverage-Theemergence of a key environmental indicator, J. Am. Plann. Assoc., 62(2),243–258, doi:10.1080/01944369608975688.
Bekele, E. G., and J. W. Nicklow (2005), Multiobjective management ofecosystem services by integrative watershed modeling and evolutionaryalgori thms, Water Resour. Res. , 41 , W10406, doi:10.1029/2005WR004090.
Caltrans Environmental Program (2001), Third party BMP retrofit pilotstudy cost Off. of Environ. Eng., Sacramento, Calif.
County of Los Angeles (2004), Sun Valley watershed management plan,Dep. of Public Works, Alhambra, Calif.
Cutter, W. B. (2007), Valuing groundwater recharge in an urban context,Land Econ., 83(2), 234–252.
DeWoody, A. E. (2007), Determining net social benefits from optimalparcel-level infiltration of urban runoff: A Los Angeles analysis, M.S.thesis, Univ. of Calif., Riverside.
Doll, A., P. F. Scodari, and G. Lindsey (1999), Credits as economic incen-tives for on-site stormwater management: Issues and examples, in Pro-ceedings of the U.S. Environmental Protection Agency NationalConference on Retrofit Opportunities for Water Resource Protection inUrban Environments, Rep. EPA/625/R-99/002, edited by A. Everson etal., pp. 13–117, U.S. Environ. Prot. Agency, Washington, D. C.
Engineering News Record (2007), First quarterly cost report, 47 pp.,McGraw Hill Constr., New York.
Federal Highway Administration (FHA) (2003), Storm water best manage-ment practices in an ultra-urban setting: Selection and monitoring,Washington, D. C.
Ferguson, B. K. (1994), Stormwater Infiltration, Lewis, Boca Raton, Fla.Ferguson, B. K. (1998), Introduction to Stormwater: Concept, Purpose,Design, John Wiley, New York.
Heaney, J. P., D. Sample, and L. Wright (2002), Costs of urban stormwatercontrol, Rep. EPA/600/R-02/021, Off. of Res. and Dev., U.S. Environ.Prot. Agency, Washington, D. C.
Hydrologic Engineering Center (1977), STORM-Storage, Treatment, Over-flow, Runoff Model: User’s manual, pp. 1–178, U.S. Army Corps ofEng., Davis, Calif.
Intergovernmental Panel on Climate Change (2007), Climate Change2007: Impacts, Adaptation, and Vulnerability, edited by M. Parry etal., Cambridge Univ. Press, Cambridge, U. K.
Kohyama, H. (2006), Selecting discount rates for budgetary purposes, paperpresented at Federal Budget Policy Seminar, Harvard Univ., Cambridge,Mass., 22 May.
Latacz-Lohmann, U., and S. Schilizzi (2006), Auctions for conservationcontracts: A review of the theoretical and empirical literature, report, Scott.Executive Environ. and Rural Affairs Dep., Edinburgh, U. K., 15 October.
Lee, J. G., J. P. Heaney, and F. H. Lai (2005), Optimization of integratedurban wet-weather control strategies, J. Water Resour. Plann. Manage.,131(4), 307–315, doi:10.1061/(ASCE)0733-9496(2005)131:4(307).
Los Angeles Regional Water Quality Control Board (RWQCB-LA) (2005),Total maximum daily loads for metals: Los Angeles River and tributaries,Los Angeles, Calif.
Muleta, M. K., and J. W. Nicklow (2005), Decision support for watershedmanagement using evolutionary algorithms, J. Water Resour. Plann.Manage., 131(1), 35–44, doi:10.1061/(ASCE)0733-9496(2005)131:(35).
Perez-Pedini, C., J. F. Limbrunner, and R. M. Vogel (2005), Optimal loca-tion of infiltration-based best management practices for storm watermanagement, J. Water Resour. Plann. Manage., 131(6), 441 –448,doi:10.1061/(ASCE)0733-9496(2005)131:6(441).
Roy, A., M. Clagett, T. Hoagland, M. Morrison, W. Shuster, J. Templeton,H. Thurston, and H. Cabezas (2006), Decentralized stormwater manage-ment: Retrofitting homes, restoring watersheds, paper presented atScience Forum, U.S. Environ. Prot. Agency, Washington, D. C., 16–18 May.
Seager, R., et al. (2007), Model projections of an imminent transition to amore arid climate in southwestern North America, Science, 316(5828),1181–1184, doi:10.1126/science.1139601.
Silberberg, E. (1990), The Structure of Economics: A Mathematical Ana-lysis, McGraw-Hill, New York.
Southeastern Wisconsin Regional Planning Commission (1991), Costs of ur-ban nonpoint water pollution control measures, Tech. Rep. 31, Waukesha,Wis.
Srivastava, P., J. M. Hamlett, and P. D. Robillard (2003), Watershed opti-mization of agricultural best management practices: Continuous simula-tion versus design storms, J. Am. Water Resour. Assoc., 39(5), 1043–1054, doi:10.1111/j.1752-1688.2003.tb03691.x.
Thurston, H. W. (2006), Opportunity costs of residential best managementpractices for stormwater runoff control, J. Water Resour. Plann. Manage.,132(2), 89–96, doi:10.1061/(ASCE)0733-9496(2006)132:2(89).
Thurston, H. W., H. C. Goddard, D. Szlag, and B. Lemberg (2003), Con-trolling storm-water runoff with tradable allowances for impervious sur-faces, J. Water Resour. Plann. Manage., 129(5), 409–418, doi:10.1061/(ASCE)0733-9496(2003)129:5(409).
U.S. Environmental Protection Agency (EPA) (1999), Stormwater technologyfact sheet, Rep. EPA 832-F-99-019, Washington, D. C.
K. A. Baerenklau, W. B. Cutter, A. DeWoody, and R. Sharma,
Department of Environmental Sciences, University of California, Riverside,CA 92521, USA. ([email protected])
J. G. Lee, Tetra Tech, Inc., Boulder, CO 80304, USA.
12 of 12
W09410 CUTTER ET AL.: CAPTURING URBAN RUNOFF W09410