MICRO PERSPECTIVES FOR DECENTRALIZED ... - CORE
309
Martina Schäfer, Noara Kebir, Daniel Philipp (editors) organized by MICRO PERSPECTIVES FOR DECENTRALIZED ENERGY SUPPLY Proceedings of the International Conference Technische Universität Berlin, 7th-8th of April 2011 Promotionskolleg Mikroenergie-Systeme
-
Upload
khangminh22 -
Category
Documents
-
view
0 -
download
0
Transcript of MICRO PERSPECTIVES FOR DECENTRALIZED ... - CORE

Martina Schäfer, Noara Kebir, Daniel Philipp (editors)
organized by
funded by
supported by
ISBN 978-3-7983-2319-3 (Druckausgabe)ISBN 978-3-7983-2320-9 (Online-Version)
MICRO PERSPECTIVES FOR DECENTRALIZED ENERGY SUPPLY
Proceedings of the International Conference
Technische Universität Berlin, 7th-8th of April 2011
of th
e In
tern
atio
nal
Con
fere
nce
Berlin 2011
MIC
RO P
ERSP
ECTI
VES
FOR
D
ECEN
TRA
LIZED
EN
ERG
Y SU
PPLY
PR
OC
EE
DIN
GS
Promotionskolleg Mikroenergie-Systeme

MICRO PERSPECTIVES FOR DECENTRALIZED ENERGY SUPPLY
Proceedings of the International Conference Technische Universität Berlin, 7th-8th of April 2011
Edited byMartina Schäfer, Noara Kebir, Daniel Philipp

Scientific Committee:
• Prof. Lucienne Blessing, University of Luxembourg, Luxembourg • Prof. Amaresh Chakrabarti, Indian Institute of Science Bangalore, India • Prof. Patrick Devine-Wright, University of Exeter, United Kingdom • Dr. Tatang Hernas Soerawidjaja, Institut Teknoloi Bandung, Indonesia • Dr. Cuthbert Kimambo, University of Dar es Salaam, Tanzania • Prof. Johann Köppel, Technische Universität Berlin, Germany• Prof. Ellen Morris, Columbia University; USA• Prof. Michael Narodoslawsky, Technische Universität Graz; Austria • Prof. Tunde Oladiran, University of Botswana, Botswana • PD Dr. Izael Pereira Da Silva, Makerere University, Uganda • Prof. Gisela Prasad,University of Cape Town, South Africa • Prof. Tomohiko Sakao, Linköping University, Sweden • Prof. Martina Schäfer, Technische Universität Berlin, Germany • Prof. Petra Schweizer-Ries,Otto-von-Guericke-Universität Magdeburg, Germany • Prof. George Tsatsaronis, Technische Universität Berlin, Germany • Prof. Jan Douwe van der Ploeg, Wageningen University, Netherlands• Timon Wehnert, Institute for Future Studies and Technology Assessment, Germany
Steering Committee:
• Dipl.-Ing. Anke Bischoff, Postgraduate Program, Technische Universität Berlin • Dipl.-Ing. Mirco Gaul, Postgraduate Program, Technische Universität Berlin • Dipl.-Ing. Zoe Hagen, Postgraduate Program, Technische Universität Berlin • Dipl.-ing. Noara Kebir, Postgraduate Program, Technische Universität Berlin • Dipl.-Pol. Dino Laufer, Postgraduate Program, Technische Universität Berlin • Dipl.-Ing. Daniel Philipp, Postgraduate Program, Technische Universität Berlin • Prof. Martina Schäfer, Center of Technology and Society, Technische Universität Berlin • Jonas van der Straeten, Postgraduate Program, Technische Universität Berlin• Dipl.-Psych. Annika Tillmans, Postgraduate Program, Otto-von-Guericke-Universität Magdeburg
Additional Reviewers:
• Dr. Kristina Dietz, Freie Universität Berlin • Prof. Dr. Manfred Nitsch, Freie Universität Berlin • Dr. Dörte Ohlhorst, Technische Universität Berlin • Prof. Dr. Michael Rode, Leibniz Universität Hannover • PD Dr. Anna Öhrwall Rönnbäck, Linköping University, Sweden • Prof. Dr. Markus Schermer, Universität Innsbruck, Austria • Dr. Joachim Spangenberg, Sustainable Europe Research Institute • Prof. Kai Strunz , Technische Universität Berlin • PD Dr. Heike Walk, Technische Universität Berlin

Table of Content
I Scientific Papers
Technology
Renewables in residential development: An integrated GIS-based multicriteria approach for decentralized micro renewable energy production in new settlement development.Palmas, C., Abis, E., von Haaren, C., Lovett, A.
1
Optimisation of off-grid energy systems by combined use of renewable energy and storage devicesHuneke, F., Henkel, J. Erdmann, G.
12
Decentralized electricity production from renewable sources as a chance for local economic development? Qualitative study of two pioneer regions in GermanyKlagge, B., Brocke, T.
21
An Analytical Model for Small-Scale Rural Bioenergy SystemsGaul, M.
27
Reality Check: Biomass as a Fuel for Small-Scale Electricity Supply in Developing CountriesDimpl v.L., E., Blunck, M.
39
Influential Factors for the Implementation of Biogas Plants in Rural Areas of Burkina Faso Aschaber, A.
47
Policy and regulatory framework conditions for small hydro power in Sub-Saharan AfricaKölling, F., Gaul, M., Schroeder, M.
56
Current status of village level hydropower in eastern and southern AfricaJonker-Klunne, W.
66
Water Desalination in Micro Grids Based on Renewable EnergiesBognar, K., Behrendt, F.
73

Implementation and Business Models
The Internal Sphere of Influence of Peasant Family Farms in Using Biogas Plants as Part of Sustainable Development in Rural Areas of Germany Bischoff, A.
82
A basic design for a multicriteria approach to efficient bioenergy production at regional levelHagen, Z.
94
Ecological and economical evaluation of biogas feedstock from intercropsNiemetz, N., Kettl, K.-H., Narodoslawsky, M.
108
Energy recovery from sisal residues: A sustainable option for Tanzania? Pfaff, J.C., Fischedick, M., Monheim, H.
114
Opportunities and challenges for solar home systems in Tanzania for rural electrificationJohn, P.J., Mkumbwa, M.
124
The Contribution of Microenergy Systems towards Poverty Reduction:Case Study of an Implementation Strategy for Solar Home Systems in Sri LankaLaufer, D., Schäfer, M.
133
Regulation
Multi Criteria Analysis for Sustainability Assessments of Electricity Generation Systems in a Rural Community in South AfricaAmigun, B., Musango, J.K., Mehlwana, M., Brent, A.C.
141
Comparative Analysis between Grid Extension and Decentralized Solutions for Rural Electrification - Case study: Sofala Province in MozambiqueGraf, J., Le Fol, Y., Donnay, A., Chatzipoulidis, I., Mozumder, Z., Zampouki, M., Carlson, A., Boje Blarke, M.
151
A Mathematical Approach for the Analysis of Energy Scenarios for Production in IndiaFügenschuh, A., Gausemeiner, P., McFarland, R., Seliger, G.
162
User Experience
Changing Behaviour: Individual Energy Use, Strategic Behavioural Niche Management and Decentralised Energy Generation in the UKTheiss, D.S.
173

Local Acceptance of Wind Energy: A Comparison Between Germany, Argentina and SpainJimeno, M.
185
Rural Electrification in Developing Countries: Social Acceptance of Small Photovoltaic Lanterns in EthiopiaMüggenberg, H., Raabe, T., Schweizer-Ries, P., Tillmans, A.
189
Taking the User’s Perspective Regarding Knowledge on Solar Home Systems in UgandaTillmans, A., Schweizer-Ries, P.
197
Micro-energy systems in low-income countries: learning to articulate the solar home system niche in TanzaniaByrne, R.
207
Quality Issues in the Market Based Dissemination of Solar Home SystemsLindner, K.
220
II Contributions from Practitioners
Technology
Introducing Integrated Food-Energy Systems that Work for People and ClimateBogdanski, A.
230
Development of adaptive technologies in the Project Biogas Support for Tanzania ‘BiogaST’Becker, P.
236
Hydrothermal carbonization as innovative technology in sustainable sanitation in TanzaniaKrause, A.
238
Small Hydropower in Rural UgandaAbbo, M.S.
241
Presenting Automatic Demand Control (ADC) as a new frequency control method in Smart GridsAmeli, M.T., Mobarhani, A.
243

Implementation and Business Models
Capitalizing on the asset nature of Micro Energy Systems to promote social transformation in economically marginalized and structurally neglected rural areas of KenyaMutsaers, R.
250
Developing Microfinance Models to Facilitate Adoption of Biogas Systems in Rural Northwest ChinaHarris, G.
258
Microfinancing decentralized solar energy systems in India: Experiences of rural banks and the way forwardPillarisetti, S.
260
Energy Access for Climate Change Mitigation and Adaptation: The ‘Micro Renewable’ SolutionKumar, A.
262
Solar Lighting Systems Delivery Models for Rural Areas in Developing CountriesKoirala, B. P., Modi. A., Mathur, J., Kafle, N.
268
Regulation
Energy Delivery Model Tool for Understanding and Scaling Up Decentralised Energy SupplyBloomfield, E.
280
A Sustainable Solar Market Package to Increase Electricity Access in Disadvantaged RegionsWulandari, E.
282
User Experience
Technical Monitoring and Economical Assessment of the Micro-financed Solar Program in BangladeshWiese, R., Steidl, M.
286
Implementation of Triple Helix Clusters Procedure in the sub-Sahara Africa Energy SectorDa Silva, I., Wassler, S.
291
Waste to Energy – Making charcoal fines useable Tumwesige, V.
297

Foreword
When we started planning the conference “Micro Perspectives for Decentralized Energy Supply“ at the beginning of 2010, we didn’t know that future scenarios for global energy supply would be the domi-nating topic of spring 2011, spurred by the nuclear catastrophe in Japan. Climate change and limited fossil energy resources were reasons enough to discuss the “end of the fossil fuel era”, which includes the accelerated provision of renewable energy capacities and efforts towards increasing energy ef-ficiency. The catastrophe in Japan, however, sheds additional light on the vulnerability of centralized energy supply systems and high-risk technologies. The international conference, taking place in Berlin in April 2011, focuses on questions of decentral-ized energy supply in Northern and Southern countries: issues which might gain greater relevance due to the current discussion and reorientation processes regarding questions of future energy supply. The starting point for dealing with these questions at the Technische Universität Berlin (TUB) is the inter-disciplinary postgraduate program “Microenergy Systems for Decentralized, Sustainable Energy Sup-ply in Structurally Weak Areas”, which has been funded since 2007. The idea for this program, which takes up questions beyond mainstream research agendas, originated amongst young postgraduates who were dedicated to providing solutions for those 1.4 billion people, mainly in Africa and Asia, who still today do not have access to clean and safe energy supply. The availability of modern energy services worldwide is regarded as being a necessary requirement for reaching the Millennium Devel-opment Goals of reducing world poverty by half by 2015 (UNDP 2005). Meanwhile, forms of decentralized energy supply also have been playing an important role in North-ern countries in the context of searching out alternatives for fossil and nuclear energy supplies. Solar, wind and biogas plants have experienced a boom in some European countries during the last two decades. With the expansion of the renewable energy sector, new questions have arisen concerning conflicting environmental goals (biodiversity versus reduction of CO2 emissions), land use conflicts (food versus biomass production) and acceptance by local populations.The similarity of questions concerning the design and implementation of innovative technologies that serve users’ needs while conserving the environment in both North and South has led to the initiation of the postgraduate program at TUB. The Hans Böckler Foundation has proved to be a partner that is strongly interested in the social and ecological aspects of decentralized energy supply. Research activities in this area have quickly shown that much valuable experience exists all over the world. Innovative technical solutions as well as financing, implementation and regulation strategies are being tried out around the globe, but often practitioners and researchers dealing with these topics are unaware of each other. The response to the Call for Papers has confirmed the necessity for more intense exchange – there are many experiences that have been had and lessons learnt that others can benefit from! The international conference in Berlin wants to facilitate interaction between people who are dedicated to micro and meso solutions for renewable decentralized energy supply. It is expected to be a starting point for future research activities and intercultural as well as interdisciplinary dialogue.We want to thank all institutions which have helped us in realizing this conference: First of all the Hans Böckler Foundation but also the Heidehof Foundation, the German Academic Exchange Service (DAAD) and the Innovation Center Energy at TUB.We are looking forward to fruitful exchange regarding technical solutions that do not put humankind or the environment at risk, but rather contribute towards a more sustainable future.
The Editors: Martina Schäfer, Noara Kebir and Daniel Philipp

I. Scientific PapersTechnology
1
PROCEEDINGS Conference MPDES 2011
Renewables in residential development: An integrated GIS-based multicriteria approach for decentralized micro renewable energy production in new settlement
development. A case study of the eastern metropolitan area of Cagliari, Sardinia, Italy.
Claudia Palmas ([email protected])
Department of Land Engineering Cagliari University, Italy
Emanuela Abis ([email protected])
Department of Architecture Cagliari University, Italy
Christina von Haaren ([email protected])
Department of Environmental Planning Leibniz University of Hannover, Germany
Andrew Lovett ([email protected])
School of Environmental Sciences University of East Anglia, Norwich, United Kingdom
Abstract
In recent years there has been an increasing interest in using micro renewable energy sources to heat and power homes. However, planning has not yet developed methodological approaches for integrating such objectives of optimized energy efficiency with other environmental requirements and concerns of sustainable residential development. This study addresses such integration by first presenting an approach to assess the different potentials of the landscape for generating renewable energy (solar, wind, geothermic, biomass). Subsequently, optimized locations for residential development according to other sustainability criteria are identified and the two sets of results integrated by systematic GIS operations.
The methodological approach for evaluating spatial variations in energy potential and producing the energy potential maps was based on existing methods for assessing the energy potential of the landscape which were adapted to the local scale and data availability. In the case of bioenergy potential a new method was developed. Other environmental criteria for deciding about sustainable locations for residential areas with different types of micro generation were identified through a survey of more than 100 expert respondents. This survey involved pairwise comparisons of relevant factors, which were then translated using the Analytical Hierarchy Process into relative weights. Subsequently these weights were applied to factor maps in a GIS via a weighted linear combination method to obtain suitable areas for new settlements and preferred locations for micro renewable technologies in the eastern metropolitan area of Cagliari, Sardinia.
Keywords: micro renewable energy potentials; multi-criteria analysis; Analytical Hierarchy Process; pairwise comparison methods; weighted linear combination.
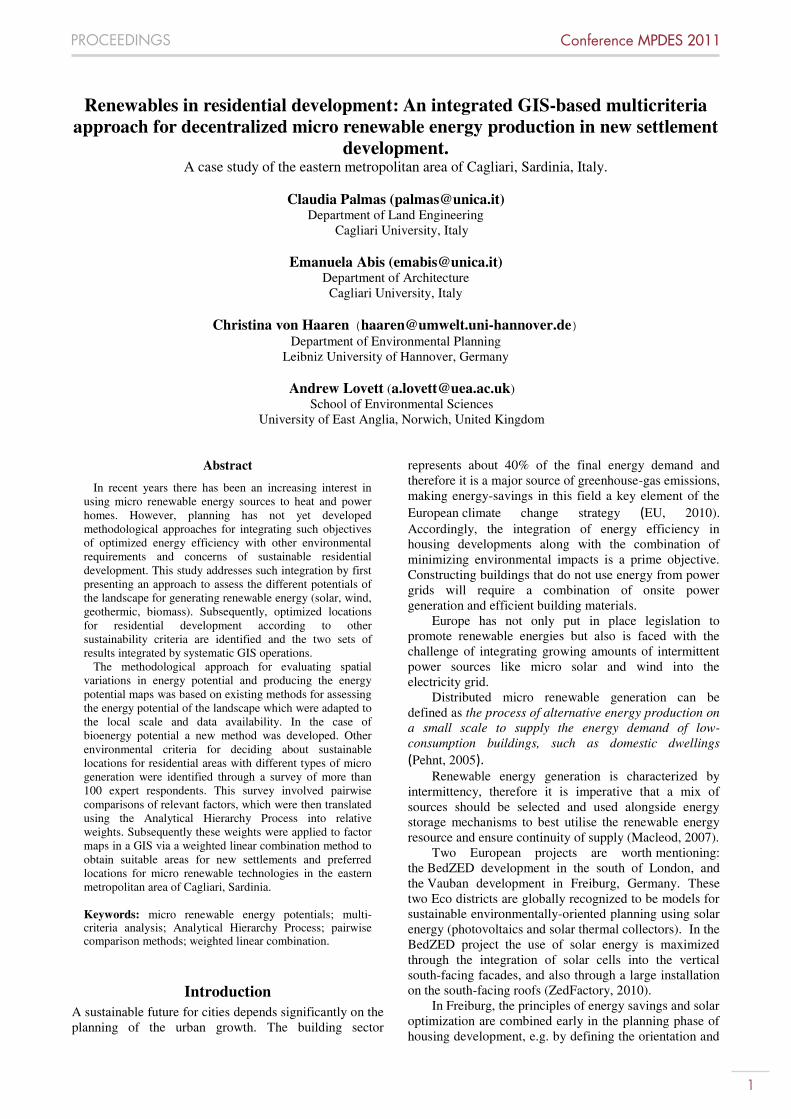
Introduction A sustainable future for cities depends significantly on the planning of the urban growth. The building sector
represents about 40% of the final energy demand and therefore it is a major source of greenhouse-gas emissions, making energy-savings in this field a key element of the European climate change strategy (EU, 2010). Accordingly, the integration of energy efficiency in housing developments along with the combination of minimizing environmental impacts is a prime objective. Constructing buildings that do not use energy from power grids will require a combination of onsite power generation and efficient building materials.
Europe has not only put in place legislation to promote renewable energies but also is faced with the challenge of integrating growing amounts of intermittent power sources like micro solar and wind into the electricity grid.
Distributed micro renewable generation can be defined as the process of alternative energy production on a small scale to supply the energy demand of low-consumption buildings, such as domestic dwellings (Pehnt, 2005).
Renewable energy generation is characterized by intermittency, therefore it is imperative that a mix of sources should be selected and used alongside energy storage mechanisms to best utilise the renewable energy resource and ensure continuity of supply (Macleod, 2007).
Two European projects are worth mentioning: the BedZED development in the south of London, and the Vauban development in Freiburg, Germany. These two Eco districts are globally recognized to be models for sustainable environmentally-oriented planning using solar energy (photovoltaics and solar thermal collectors). In the BedZED project the use of solar energy is maximized through the integration of solar cells into the vertical south-facing facades, and also through a large installation on the south-facing roofs (ZedFactory, 2010).
In Freiburg, the principles of energy savings and solar optimization are combined early in the planning phase of housing development, e.g. by defining the orientation and

2
PROCEEDINGS Conference MPDES 2011
position of buildings or by obligatory low-energy construction requirements (Delleske, 2010). These urban multi-residential housing developments are models not only for energy saving, but also they take into account social and economical aspects.
However, the geographical distribution of micro renewable energy potential is rarely considered or estimated in the planning of new residential areas (Jenks & Dempsey, 2005; Droege, 2007). Also in selecting the location, environmental criteria in combination with micro renewable potentials are still neglected.
The distributed micro renewable energy potential estimation - except for solar energy generation- should take into account single house or districts energy requirements, which are different from the planning of centralized facilities, such as coal, nuclear and gas power plants. As an example, the National Italian Law N. 239/2004 art.85 defines the distributed micro generation as a production and energy transportation system based on the integration into electricity grid of micro generators with total power of less than 1 MW using renewable power sources.
The state of the art in the field of energy efficiency (Brookes, 2004; Linden et al., 2006), thus may be enhanced by combining different energy sources in new housing development which are located by estimating the energy potential available for the whole area under consideration. Renewable energy supply is site specific and variable (IEA, 2007). A restriction on secure supplies from single renewable energy sources is their output variability. This can be minimized by demand variability, especially where this correlates with times of high energy output by renewables, better predictability of their generation output and the complementarities of different power sources. Also the combination of different renewable energy sources can increase supply security.
In recent years several renewable energy potential mapping methodologies have been developed (e.g. solar irradiation and wind estimation, geothermal and biomass energy) (Maxwell & Renne, 1994; Ivanov et al., 1996; Schneidera et al., 2006). These methods can be used as a building block in enhancing urban planning approaches. However, the methodologies have been developed for very small scales and cannot be applied unmodified for selecting new housing locations (Vettorato & Zambelli, 2009). Therefore it is necessary to either adapt existing methodologies or develop new ones.
Considerations of energy efficiency should be integrated at the start of the land use planning process in order to guide future development to the sites with the best potential for using renewable micro generation. These potentials can be developed in a sustainable way by using multicriteria evaluation methods in a GIS to help optimize new settlements in terms of multi-functionality. There is a history of research using such techniques to support collaborative decision-making processes by providing a framework where stakeholder groups can explore, understand and redefine decision problems with respect to housing location (Jankowski & Nyerges, 2001; Malczewski, 2006).
Research Objectives The development and testing of a methodology for an integrated approach to energy efficient residential development planning is the main objective of the research presented here. Both sustainably locating new housing developments and optimizing the mix of micro renewables need to be facilitated, with the intention of improving regional land use and/or local development plans. The main research questions addressed are:
How to calculate the geographic distribution of the energy potentials? How to produce energy potential maps? Which criteria and algorithms are needed for identifying the theoretical energy potential for different energy sources?
How to support decision makers or planning, in the task of including multiple further criteria into housing development decisions?
Which environmental and landscape criteria are considered most relevant for the assessment of new housing development with micro renewable technologies?
Accordingly, this paper describes: - Methodologies (existing, adapted or newly
developed) to estimate micro renewable energy potentials in a spatially explicit manner.
- Methodologies for identifying suitable areas for sustainable new settlements with micro-renewable technologies.
The results of testing these methods are presented for the region of Cagliari in Sardinia.
Methods
General methodological approach Part of the methodological approach is based on existing methods for energy potential assessment, which were pretested in the Hannover region (by master students and the lead author in cooperation with the State Office for Mining, Energy and Geology (LBEG) and under the supervision of Prof. Christina von Haaren and Prof. Michael Rode, Leibniz Universität Hannover, Germany; Bredemeier et al., 2009) as well as in the Cagliari test region. In addition, the methods were adapted to local/regional scale planning. This resulted in assessments of the theoretical potential supply, but because of existing technical, ecological, economic and social restrictions, such theoretical amounts can be exploited only up to a certain percentage (Rode et al. 2005, Steinbach 2002).
Expert preferences were used to weight multiple assessment criteria for housing developments. These preferences were obtained through a survey conducted with students, academic planners, regional planners and public authorities in Italy, Germany and United Kingdom. This expert-based approach was chosen because in most European countries no clear cut standards exist about the suitability of micro generation in residential areas (in contrast e.g. to emission standards) so expert opinions were a simple way of priority setting in such complex decisions. In addition, such a method allows the consequences of different preferences to be modeled and

3
PROCEEDINGS Conference MPDES 2011
for the inclusion of local or regional stakeholder opinions and interests .
The energy potentials and expert preferences were ultimately combined in a GIS-based analysis to identify the most appropriate housing sites at a regional scale. This analysis made use of multicriteria evaluation (MCE) techniques which are one of the most common GIS-based tools that have been used to integrate decision making on complex problems such as site selection, land suitability analysis, resource evaluation and land allocation (Voogd, 1983; Nijkamp, 1986; Eastman et al. 1993; Malczewski, 1999; Geneletti, 2005). Over the last two decades several MCE methods have been implemented in a GIS environment including weighted linear combination (WLC) and its variants (Janssen & Rietveld, 1990; Eastman et al., 1998), analytical hierarchy process (Banai, 1993; Eastman et al., 1998), concordance-discordance analysis (Carver, 1991; Joerin et al., 2001) and ideal point methods (Pereira & Duckstein 1993; Jankowski, 1995). Among these procedures, WLC and Boolean overlay operations, such as intersection (AND) and union (OR), are the most widely used (Malczewski, 1999; 2006) and were adopted in this research.
Adaptation of an existing methodology for identifying spatial solar energy potential to local scale conditions The solar potential raster maps were calculated from the r.sun model. The pvgis database, derived from the Photovoltaic Geographical Information System- Interactive Maps (Joint Research Center of the European Commission 2009), was used to validate the data. The algorithm used to calculate the solar irradiation was implemented in the Open Source GIS software GRASS, where the beam irradiance normal to the solar beam B0c [W·m-2] is attenuated by cloudiness atmosphere and calculated in the model as in the formula (1) (JRC 2010): B0c = G0 exp {-0.8662 TLK m dR(m)} (1) where: G0 is the extraterrestrial irradiance normal to the solar beam [W/m2] -0.8662 TLK is the atmospheric turbidity factor ; m is the “optical air mass”; dR(m) is the “Rayleigh optical thickness at air mass m”
The r.sun model operates in two modes. In mode 1 the model calculate for the instant time [sec] raster maps of chosen components (beam, diffuse and reflected) of solar irradiance [W/m-2] and solar incident angle [degrees]. In mode 2, the raster maps of daily sum of solar irradiation [Wh/m2/day1] are computed as integration of irradiance values that are calculated within a set day. In this study mode 2 was used because we needed to calculate raster maps representing the annual average of daily sums of global irradiation for horizontal surfaces.
To compute the irradiation raster maps r.sun requires only a few mandatory input parameters – digital terrain model (elevation, slope, aspect – elevin, slopein, aspin), day number (for mode 2), and additionally a local solar
time time (for mode 1). The other input parameters are either internally computed (solar declination) or the values can be set to fit the specific user needs: Linke atmospheric turbidity, ground albedo, beam and diffuse components of clear-sky index, time step used for calculation of all-day irradiation (Súri & Hofierka 2004).
Adaptation of an existing methodology for identifying spatial wind energy potential The wind speeds were calculated in accordance with the following formula (2) (TOUMA 1977, COUNIHAN 1975), which is sufficient for many engineering tasks: v = v ref (z / z ref )
α (2) v = wind speed at height z above ground level. v ref = reference speed, i.e. a wind speed we already know at height z ref . z = height above ground level for the desired velocity, v. z ref = reference height, i.e. the height where the wind speed is measured v ref . The exponent α is an empirically derived coefficient that varies according to the stability of the atmosphere. For neutral stability conditions, α is approximately 0.143.
Adaptation of an existing methodology for identifying spatial geothermal energy potential The geothermal energy potential maps were generated by considering the physical rock properties for the estimation of the specific heat extraction values. That for vertical loops followed KALTSCHMITT et al. (1999) where the geological stratification of rocks to 100 m is derived from a regional geological map and the specific heat extraction is obtained from the following formula:
PEWS = (13 · λ) + 10 (3)
PEWS = specific heat extraction capacity λ = heat conductivity of the rock. To obtain the specific heat extraction values the geology was divided in two homogeneous layers: unconsolidated and solid rocks. Further information on the geological stratification for vertical loops and soil characteristics for horizontal loops was obtained from Dott. Geol. Fausto Pani, freelance and Prof. Giovanni Barrocu, Cagliari University.
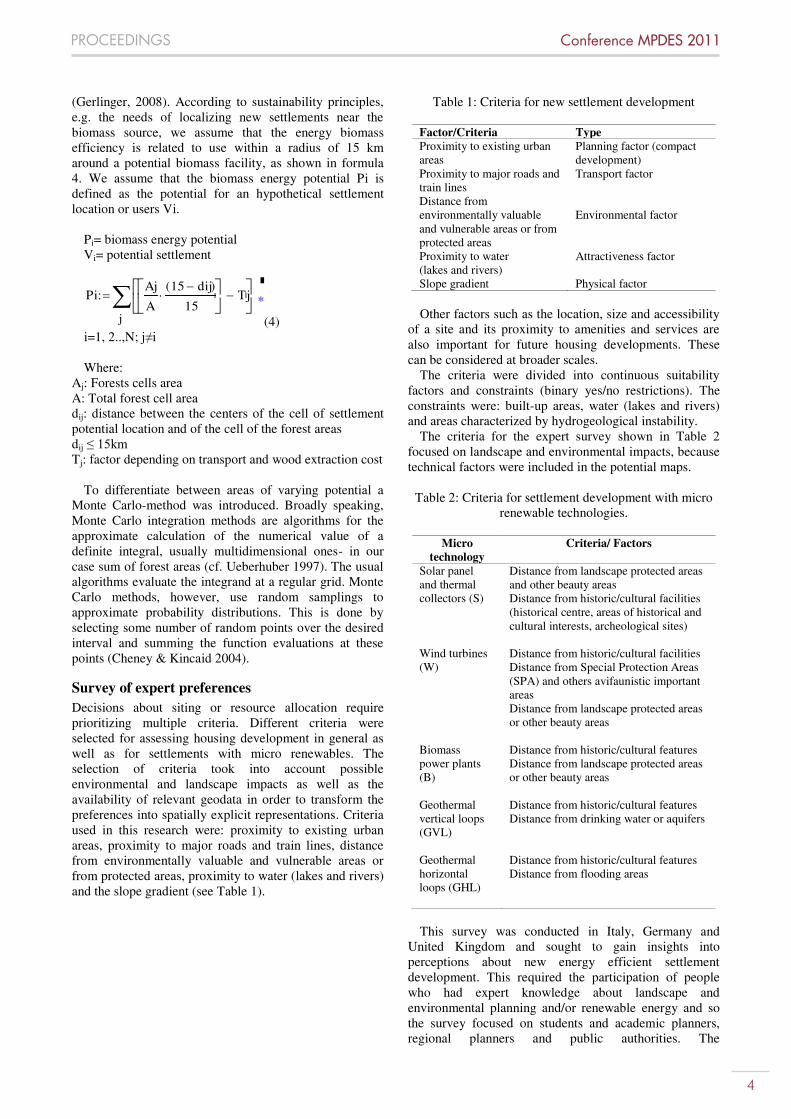
Developing a methodology for identifying the spatial biomass energy potential Given the focus on housing development not every type of biomass is relevant. Attention was focused on wooden biomass which is suitable for producing heat and electricity in residential areas with the installation of a cogeneration system. Important criteria for identifying the potential include the distance of the source of wood from the settlement and the capacity of the forest in terms of the wood reservoir. From an economic perspective the energy efficient use of biomass can be defined as use within a radius of 30 km around a potential biomass facility
4
PROCEEDINGS Conference MPDES 2011
(Gerlinger, 2008). According to sustainability principles, e.g. the needs of localizing new settlements near the biomass source, we assume that the energy biomass efficiency is related to use within a radius of 15 km around a potential biomass facility, as shown in formula 4. We assume that the biomass energy potential Pi is defined as the potential for an hypothetical settlement location or users Vi.
Pi= biomass energy potential Vi= potential settlement
Pi
j
Aj
A
15 dij( )
15
Tj
*
(4) i=1, 2..,N; j≠i Where:
Aj: Forests cells area A: Total forest cell area dij: distance between the centers of the cell of settlement potential location and of the cell of the forest areas dij ≤ 15km Tj: factor depending on transport and wood extraction cost
To differentiate between areas of varying potential a Monte Carlo-method was introduced. Broadly speaking, Monte Carlo integration methods are algorithms for the approximate calculation of the numerical value of a definite integral, usually multidimensional ones- in our case sum of forest areas (cf. Ueberhuber 1997). The usual algorithms evaluate the integrand at a regular grid. Monte Carlo methods, however, use random samplings to approximate probability distributions. This is done by selecting some number of random points over the desired interval and summing the function evaluations at these points (Cheney & Kincaid 2004).
Survey of expert preferences Decisions about siting or resource allocation require prioritizing multiple criteria. Different criteria were selected for assessing housing development in general as well as for settlements with micro renewables. The selection of criteria took into account possible environmental and landscape impacts as well as the availability of relevant geodata in order to transform the preferences into spatially explicit representations. Criteria used in this research were: proximity to existing urban areas, proximity to major roads and train lines, distance from environmentally valuable and vulnerable areas or from protected areas, proximity to water (lakes and rivers) and the slope gradient (see Table 1).
Table 1: Criteria for new settlement development
Factor/Criteria Type Proximity to existing urban areas Proximity to major roads and train lines Distance from environmentally valuable and vulnerable areas or from protected areas Proximity to water (lakes and rivers)
Planning factor (compact development) Transport factor Environmental factor Attractiveness factor
Slope gradient Physical factor
Other factors such as the location, size and accessibility of a site and its proximity to amenities and services are also important for future housing developments. These can be considered at broader scales.
The criteria were divided into continuous suitability factors and constraints (binary yes/no restrictions). The constraints were: built-up areas, water (lakes and rivers) and areas characterized by hydrogeological instability.
The criteria for the expert survey shown in Table 2 focused on landscape and environmental impacts, because technical factors were included in the potential maps.
Table 2: Criteria for settlement development with micro renewable technologies.
Micro
technology Criteria/ Factors
Solar panel and thermal collectors (S) Wind turbines (W) Biomass power plants (B) Geothermal vertical loops (GVL) Geothermal horizontal loops (GHL)
Distance from landscape protected areas and other beauty areas Distance from historic/cultural facilities (historical centre, areas of historical and cultural interests, archeological sites) Distance from historic/cultural facilities Distance from Special Protection Areas (SPA) and others avifaunistic important areas Distance from landscape protected areas or other beauty areas Distance from historic/cultural features Distance from landscape protected areas or other beauty areas Distance from historic/cultural features Distance from drinking water or aquifers Distance from historic/cultural features Distance from flooding areas
This survey was conducted in Italy, Germany and United Kingdom and sought to gain insights into perceptions about new energy efficient settlement development. This required the participation of people who had expert knowledge about landscape and environmental planning and/or renewable energy and so the survey focused on students and academic planners, regional planners and public authorities. The

5
PROCEEDINGS Conference MPDES 2011
questionnaire was distributed in person and by email, with participants returning the completed surveys in the same ways.
The expert preferences were converted into values using pairwise comparisons methods, a procedure in the Analytical Hierarchy Process (AHP) (Saaty, 1980). As input, the method takes the pairwise comparisons of the different criteria and produces their relative weights as output. According to the relative importance, the weights, which were assigned to different criteria, were calculated using MathCAD, an engineering calculation software. Consistency Ratios (CR) were also calculated to assess the reliability of the pairwise comparisons (Saaty, 1980).
The output maps were generated using a Boolean approach and a Weighted Linear Combination method (WLC) (Malczewski 1999). The Boolean approach is based on reclassification operation and specified cutoffs. WLC was used to produce suitability raster maps for housing development and micro renewable preferences with respect to environmental and landscape impacts. The suitability maps were generated as shown by formula (5).
Suitability Map = Σ [ factor map (cn) * weight(wn) * constraint(b0/1)] (5)
Where, cn = standardised raster cell, wn = weight derived from AHP pairwise comparison b0/1 = Boolean map with values 0 or 1 n= number of raster cell To identify the optimal sites for new residential areas
with micro renewables the three GIS layers (energy potentials, suitability for new settlement development, suitability for new settlement with micro-generators) were overlaid. This integration was conducted using Spatial Analyst functions available in ArcGIS 9.x (ESRI, 2010).
Data
Case study area The eastern
metropolitan area of Cagliari (Figure 1) is covers 591 km2 in the south of Sardinia and has a population of 322.392
inhabitants (ISTAT DATA, 2010). Cagliari is the capital of Sardinia, situated at the southern shore of the island and has 157.222 inhabitants (ibid.)
Figure 1: Eastern Metropolitan Area of Cagliari.
The region is characterized by rural areas around the cities with a large amount of agricultural land (around 46.72%). Other uses, such as residential, commercial and industrial areas cover about 40 % (land use data, Region of Sardinia).
Table 4 lists the main geographical data sources used for the regional assessment. These were supplemented by shapefiles from the Landscape plan of Sardinia, scale 1:10.000.
Table 4: Input data for the energy potential estimation
Data Scale/unit Data origin Digital Elevation Model DEM 90 Wind speeds at 25 m Geological Map Land use
90x90 m CGIAR Consortium for Spatial Information m/s Aeolic Italian Atlas 1: 200.000 Earth Science Department (Cagliari University) 1:25.000 Region of Sardinia
Irrigation map 1:25.000 R Region of Sardinia
Results
Solar energy potential Parameters such as the albedo (0.2) and the Linke turbidity (3.0) were assumed constant across the region as a first approximation. The clear –sky indexes were not available. The influence of terrain shadowing was taken into account by setting the -s flag. After validation of the data, the output raster map showed the annual average of daily sums of global irradiation for horizontal surfaces [Wh/m2/day] (see Figure 2).
Figure 2: Annual average of daily sums of global irradiation for horizontal surfaces [Wh/m2/day].
Wind energy potential To create the wind energy potential maps speeds at 25 m above the ground with 1 km resolution were used. The data were derived from the Italian Atlas Wind Energy (“Atlante eolico italiano” 2002) developed by the Genoa University and the CESI research centre. Formula (2) was applied to obtain a final average wind speeds raster map (at 10 m above the ground) with a resolution of 90 m (see Figure 3).

6
PROCEEDINGS Conference MPDES 2011
Figure 3: Wind energy potential
Geothermal energy potential For the unconsolidated rocks there were some data limitations so the thickness was sometimes only a rough estimate. The data for solid rocks were more accurate. The information about ground water flow component was not considered according to VDI 3640 German directive.
Geothermal vertical loops The geological map of the region of Sardinia, scale 1:200.000, was consulted to evaluate the specific heat extraction capacities, which were combined by values from the literature with regard to specific heat conductivity (cf. VDI 4640). The resulting map was classified into three categories (see Figure 4). The unsuitable areas are not suitable for economic reasons.
Figure 4: Geothermal energy potential for geothermal vertical loops
Geothermal horizontal loops The geological map, the map for irrigation and the land use map (scale 1:25.000) were considered to select the suitable and unsuitable areas for the installation of horizontal loops. Given the variety of soil conditions (e.g. evapotraspiration) and characteristics (e.g. presence of
aquifers), soil types and the absence of quantitative data about all these factors (ARU ET AL. 1991) it was only possible at this scale to give a qualitative potential estimation for the use of horizontal loops, as shown in Figure 5.
Figure 5: Geothermal energy potential for horizontal loops.
Biomass energy potential The study did not take into account the factor Tj in formula (4) which depends on road-types and –states as well as variable factors like fuel prices for wood transportation and extraction costs, because the necessary data were not available. These factors can be better considered in a more detailed local view.
A grid with a 250 m spacing was overlaid over a larger section of the eastern metropolitan area of Cagliari. A total of 5,000 random points were used giving an average density of around 1 point in 250 m2. After application of the Monte Carlo-integration to existing data the following biomass potential map was generated (Figure 6).
Figure 6: Biomass energy potential.

7
PROCEEDINGS Conference MPDES 2011
Survey results A total of 120 questionnaires were completed, but only 108 were considered further (consistency ratio <0.1). As shown in Table 5, for each category of experts we had a minimum of 15 valid questionnaires.
Table 5: Total evaluated questionnaires for each country
for students and academic planners (S.&AP.) and regional planners and public authorities (P.&PA.)
Experts Total Evaluated
questionnaire with consistency ratio <0.1
S.&AP. DE 19 IT 16 UK 15 P.&PA. DE 15 IT 28 UK 15
English experts preferred a compact development
close to the built-up areas (S. & AP.: weight 0.29; RP. & PA.: weight 0.35).The German experts give the same weight for a urban development near roads and train lines (0.22). In terms of the distance from environmentally valuable and vulnerable areas, Italian and German students and academic planners expressed a similar preference (0.34; 0.31), as well as the Italian and German regional planners and public authorities (0.23; 0.24). The Italian experts preferred a development that is close to lakes and rivers for attractiveness reasons (0.15; 0.17). German and Italian regional planners and public authorities give the same consideration for the slope gradient (0.15).
Table 6 shows the weights for each criteria regarding new housing development from students and academic planners (S. & AP.) and regional planners and public authorities (RP. & PA.) from each nationality. The weights sum to 1 with a higher value corresponding to more emphasis on the relevant criteria.
Table 6: Weighting for settlement development for
students and academic planners (S. & AP.) and regional planners and public authorities (RP. & PA.)
Criteria/ Factors Experts Weights Proximity to existing urban areas Proximity to major roads and train lines Distance from environmentally valuable areas Proximity to water Slope gradient
S.&AP. DE 0.20 IT 0.26 UK 0.29 P.&PA. DE 0.26 IT 0.25 UK 0.35 S.&AP. DE 0.22 IT 0.16 UK 0.26 P.&PA. DE 0.22 IT 0.20 UK 0.22 S.&AP. DE 0.31 IT 0.34 UK 0.21 P.&PA. DE 0.24 IT 0.23 UK 0.19 S.&AP. DE 0.14 IT 0.15 UK 0.11 P.&PA. DE 0.14 IT 0.17 UK 0.12 S.&AP. DE 0.13 IT 0.10 UK 0.12 P.&PA. DE 0.15 IT 0.15 UK 0.13
Table 7 shows the average of the Standard Deviation
expressed as a % of the mean for the different expert groups and nationalities. These results show some variation in weighting but do not exceed 100% so the variations are not too great.
Table 7: Average of standard deviation in percentage of the mean for housing development
Experts Average of the SD in
% of the mean S.&AP. DE 65.74 IT 79.62 UK 49.78 P.&PA. DE 48.02 IT 66.83 UK 40.50
The final suitability maps were identified through the
experts survey localizing the new settlement with renewable energy. The German students and academic planners (weight: 0.54) and regional planners and public authorities (weight: 0.60) gave more consideration to the visual impact caused by solar panels and solar thermal collectors on the cultural heritage. Italian academic (0.58) and environmental planners (0.54) and English academic (0.54) and environmental planners (0.54) by contrast considered more intrusive the solar power plants near landscape protected areas and other beautiful areas.
German experts paid more attention to the environmental impact represented by the distance of wind turbines from avifaunistic important areas (respectively weights S. & AP.: 0.50 and RP. & PA. : 0.44). On the contrary Italian experts expressed their preferences to the visual impact near historical and cultural facilities (S. & AP.: 0.35; RP. & PA.0.40) while English experts assigned almost equal weights to all three criteria including the visual impact to landscape evaluable areas.
All experts, in particular the Italian regional planners and public authorities (0.71) and the German students and academic planners (0.70), assigned the highest weight to the criteria “Distance from drinking water or aquifers” for geothermal vertical loops. Similarly, the experts, except for the English regional planners and public authorities (0.32), were in agreement regarding the importance of “Distance from flooding areas” (average 0.63).
However, Italian experts assigned similar weight about the visual impact of additional chimney for a single power plant or a central biomass power plant near cultural/historical areas (0.48; 0.47) and landscape areas (0.52; 0.53).

8
PROCEEDINGS Conference MPDES 2011
Table 8 shows the weights for housing development with micro generation for the different expert groups.
Table 8: Weighting for housing development with micro-
renewable technologies Criteria/ Factors Experts Weights
Distance from landscape protected areas and other beauty areas (S) Distance from historic/ cultural facilities (S) Distance from historic/ cultural facilities (W) Distance from Special Protection Areas (SPA) and avifaunistic important areas (W) Distance from landscape protected areas or other beauty areas (W) Distance from historic/ cultural features (B) Distance from landscape protected areas or other beauty areas (B) Distance from historic/ cultural features (GVL) Proximity to drinking water or aquifers (GVL) Distance from historic/ cultural features (GHL) Distance from flooding areas (GHL)
S.&AP. DE 0.46 IT 0.58 UK 0.54 P.&PA. DE 0.40 IT 0.54 UK 0.54 S.&AP. DE 0.54 IT 0.43 UK 0.46 P.&PA. DE 0.60 IT 0.46 UK 0.46 S.&AP. DE 0.26 IT 0.35 UK 0.30 P.&PA. DE 0.31 IT 0.40 UK 0.35 S.&AP. DE 0.50 IT 0.45 UK 0.39 P.&PA. DE 0.44 IT 0.30 UK 0.38 S.&AP. DE 0.25 IT 0.19 UK 0.31 P.&PA. DE 0.25 IT 0.30 UK 0.28 S.&AP. DE 0.30 IT 0.38 UK 0.34 P.&PA. DE 0.35 IT 0.47 UK 0.39 S.&AP. DE 0.70 IT 0.62 UK 0.66 P.&PA. DE 0.65 IT 0.53 UK 0.61 S.&AP. DE 0.31 IT 0.45 UK 0.36 P.&PA. DE 0.37 IT 0.29 UK 0.68 S.&AP. DE 0.69 IT 0.55 UK 0.64 P.&PA. DE 0.63 IT 0.71 UK 0.32 S.&AP. DE 0.43 IT 0.48 UK 0.39 P.&PA. DE 0.42 IT 0.54 UK 0.53 S.&AP. DE 0.57 IT 0.52 UK 0.61 P.&PA. DE 0.38 IT 0.46 UK 0.47
The results of the survey showed similarities and
differences between stakeholder group preferences from the three countries. This outcome stems from differences in the planning systems and on the confidence/acceptance for micro renewables. However, here we give only a brief overview of the final results.
After the calculation of the weights for new settlements development and for new settlements with micro generators, both suitability maps were overlaid with the energy potential for each micro renewable technology and for each expert group.
The suitability maps, identified through the experts survey, were compared with the micro energy potentials. It is interesting to see that there were many areas where the energy potential was high and also according to the experts preferences new settlement with renewable energies should be localized.
The solar irradiation is high (almost similar) for the whole case study area. Nevertheless, areas where the potential is relatively lower (areas in blue) because of the terrain aspect and slope, should be excluded. The wind potential varies over the Cagliari region. In that case it
would be also possible in addition to take into account micro wind turbine models and costs to include also technical and economical consideration for the plan of new residential areas with micro wind turbines.
With respect to geothermal vertical loops all experts assigned the highest weight to the criteria “Distance from drinking water or aquifers”. Geothermal vertical loops should be buried up to 100 m and in some cases can modify the groundwater flow with consequences on the new settlements (cf. Sass et al. 2009) and on the water quality and temperature. This has to be taken into account when planning new urban settlements.
The geothermal energy potential map for geothermal horizontal loops and the suitability map of the experts groups showed no compliance. This is indicating, that conflicts could arise if geothermally powered settlements will be planned. For this reason it may be important to make decisions according to others criteria or needs.
Only few areas located in the East of the metropolitan area showed a good biomass potential and were at the same time suitable according to the expert preferences. Consequently other energy sources should be chosen in most of the areas far away from any forests. In figure 7, we show the three layers for solar energy. The combined result is in Figure 8 which shows the optimum sites for new settlements development according to energy potentials and experts preferences.
Figure 7: Overlaying of the three GIS-layers (energy potential, settlement development and settlement
development with micro generators).

9
PROCEEDINGS Conference MPDES 2011
Figure 8: Suitability map for housing location with micro
solar power plants and energy potential.
Discussion The need to reduce oil consumption and to produce renewable energy favours the integration of micro renewable energy generation into housing development. Urban and regional planning can optimize this integration by selecting the best suited areas with the highest energy potential and least environmental impacts as well as by choosing the best mix of renewables for each individual residential site. This paper suggest a method for finding the best locations for new housing developments which use micro renewable technologies. Decisions about the best energy mix for the different residential areas can be supported by the results; however, this interpretation has not been presented here. The proposed approach is based on assessment of the energy potential and an assessment of other relevant criteria which have been weighted by expert preferences.
The accuracy in finding the most and least technical suitable locations is dependent on the reliability of the input data. The data used in this study stem from different sources with different levels of accuracy. Therefore the resulting maps are less accurate than the least accurate layer used in their composition. As the methods have been tested under German as well as Italian data conditions successfully, it may be assumed that they can be applied in many European countries.
The calculation of the solar energy potential estimation depends on the application of r.sun model and on the pvgis data, therefore it can be applied in every region. However, the accuracy depends on input data (DEM) and on pvgis data availability.
Data of wind speeds are also available in every country. The only difference between the German and the Italian wind speeds was that Italian data are calculated at 25 m height and the German ones at 10 m height, a height which better suits the requirements of microgeneration.
Wind speeds give a good approximation about the wind energy potential, but for the planning of new settlements simulation of the wind flow would be more useful.
The accuracy of geothermal energy estimation is dependent on data availability (e.g. profiles) about the rocks layers under the ground. The study demonstrated that even if no data on stratification and soil characteristics already exist, the information needed can be generated by the assistance of geologists with local knowledge. Nevertheless, it should be restricted at producing suitability maps for the use of horizontal loops.
For more precision it will be necessary to conduct further specific studies. It will be also important to have more detailed data about the groundwater level and movement to estimate the geothermal energy potential using the groundwater flow.
The biomass potential estimates can be calculated in every region. Only data about forested areas which are available for biomass use or short rotation coppice are required. The next step will be to estimate the wood extraction capacity and transportation costs.
Expert weighting of criteria about locating energy efficient residential development in combination with the use of GIS and multi-criteria analysis were useful for supporting the complex planning process. Various experts independently came to a considerable degree of agreement about their general preferences. The proposed method offers some advantages over classical site suitability analysis techniques: First, it provides a structured approach to derive the suitability by “decomposing” a complex problem into three levels (energy potentials, experts preferences for housing development, expert preferences for housing development with micro generation technologies). This allows planners and public authorities to focus on a systematic analysis of the factors for each level. A disadvantage is that the criteria are less differentiated than in a conventional environmental impact or suitability assessment. Also supplementing with new criteria needs considerable effort. Second, this method allows to incorporate criteria, which differ in nature. Furthermore, the method is a suitable way to weight different criteria if no democratic legalized standards are available as a basis for weighting and decision making. Third, the approach gives an opportunity to decision makers to enter their own judgments. However, for a transparent practical application, the general expert preferences, which substitute legal valuation and assessment standards, have to be presented separately from preferences of local politicians and stakeholders. Fourth, the general preference and not a special site specific individual interest is relevant, which may help at the same time to support rational decisions especially in local development and achieve a good acceptance of the results. Fifth, if regional /local stakeholder preferences are taken as a basis the methods can be used in order to model the probable future expansion of housing development according to local interests. If mandatory zoning is weak or non-existent, land use planning can use this information for strategy building.
In the future, more concrete legal standards and priorities for decisions about energy efficient housing and the environment may more strongly confine the importance of the expert preferences. In that case more predefined priorities can be included in the method as well as a combination with conventional impact assessment.
Environmental planners and public authorities often make complex decisions within a short period of time when they must take into account sustainable development and participation. A set of land-use suitability maps (e.g. as part of a landscape plan) would be very useful for supporting fast decisions. Once the maps are available, land planners can analyze any new

10
PROCEEDINGS Conference MPDES 2011
project by using simple operations such as map overlay or statistical analysis on a given area.
Clearly, the criteria selected for housing development and for micro-renewable preferences need to be combined along with other criteria, which depend on analysis conducted at smaller scale. In this context, it will be interesting to compare the landscape plan of Sardinia and the land use plans of the municipalities with the results obtained in this work to identify benefits and limitations.
The next step for further research and implementation will be to collect feedback from regional planners and local authorities 1) if they have no access to GIS databases and results; 2) if they would taken into account the GIS results for selecting select new residential settlements with micro renewable technologies or if other characteristics will be needed, e.g. soil fertility for agricultural use. The regional planners will also be asked about their opinion whether this type of a positive planning is suitable for supporting land use planning in Sardinia.
References Aru, A., Baldaccini, P. &Vacca, A., (1991). Nota
illustrativa alla carta dei suoli della Sardegna (Explanatory note to the soil map of Sardinia). Regione Autonoma della Sardegna, Università degli Studi di Cagliari (Region of Sardinia, Cagliari University).
Bredemeier, B., Dandova, M., Jähnchen, I., König, T., Liang, X., Palmas, C., Peschel, I., Stegemann, J. (2009). Mikrogeneration erneuerbarer Energien. Energiepotenziale in der Region Hannover (Micro generation from renewables. Energy potential in the Region of Hannover).Master project. Department for environmental planning. Faculty of Architecture. Hannover University.
Banai, R. (1993). Fuzziness in geographic information systems: contributions from the analytic hierarchy process. International Journal of Geographical Information Systems, 7(4), 315–329.
Brookes, L. (2004). Energy efficiency fallacies-a postscript. Energy Policy 32, 945–947.
Carver, S. J. (1991). Integrating multicriteria evaluation with geographical information systems. International Journal of Geographical Information Systems, 5, 321–339.
Cheney, W. & Kincaid, D. (2004). Numerical Mathematics and Computing. Fifth Edition. Belmont, Thomson Learning.
Counihan, J. (1975). Adiabatic atmospheric boundary layers: A review and analysis of data from the period 1880-1972, Atmospheric Environment, Vol.79, 871-905.
Deleske, A. (2010). Stadtteil Vauban, Freiburg. http://www.vauban.de/. (last visit: September 2010)
Droege, P. (2007). The Renewable City: A comprehensive guide to an urban revolution, Wiley, Chichester, UK.
Eastman, J. R., Kyem, P.A. K., and Toledano, J. (1993). GIS and decision making. Geneva, UNITAR.
Eastman J. R., Jiang H. and Toledano J. (1998). Multi- criteria and multi-objective decision making for land allocation using GIS. In: Beinat E. And Nijkamp P.
(Eds.), Multicriteria Analysis for Land- Use Management. Kluwer Academic Publishers, Dordrecht, pp. 227–251.
EU (2010) . Renewable energy: White Paper laying down a Community strategy and action plan. http://europa.eu/legislation_summaries/other/l27023_en.htm (last visit: September 2010).
Geneletti, D. (2005). Formalising expert’s opinion through multi-attribute value functions. An application in landscape ecology. J. Environ. Manage., 76, 255-262
Gerlinger, E. (2008): oral. Biokompakt. www.biokompakt.com
International Energy Agency (IEA) 2007. Key world energy statistics. http://www.iea.org/textbase/nppdf/ free/2007/key_stats_2007.pdf
Ivanov, P., St. Lingova, L. Trifonova, D. Renne, and Ohi J.. (1996). An investigation of renewable resources and renewable technology applications in Bulgaria. Environmental Management, 20(Suppl 1):583–593.
ISTAT (2010). Dati demografici (demographic data). http://www.istat.it/ (last visit: september 2010)
Jankowski, P. (1995). Integrating geographical information systems and multiple criteria decision making methods. International Journal of Geographical Information Systems, 9(3), pp. 251– 273.
Jankowski, P. & Nyerges, T. (2001). Geographic Information Systems for Group Decision Making, Taylor & Francis: London. March, 2001. equal contribution; eight chapters synthesizing research 1995-2000, .
Janssen, R. & Rietveld, P.(1990). Multicriteria analysis and geographical information systems: an application to agricultural land-use in the Netherlands. In: Scholten, H.J., Stillwell, J.C.H. (Eds.), Geographical Information System for Urban and Regional planning, Kluwer Academic Publishers, Dordrecht, 129-139.
Jenks, M. & Dempsey, N., (2005). Future Forms and Design for Sustainable Cities, Elsevier/Architectural Press, Oxford.
Joerin, F., Theriault, M. and Musy, A. (2001). Using GIS and outranking multicriteria analysis for landuse suitability assessment. International Journal of Geographical Information Science, 15(2), pp. 153–174.
JRC, Joint Research Center, UE (2010) a. Solar Model r.sun, http://re.jrc.ec.europa.eu/pvgis/solres/ solmod3.htm(last visit: January 2009)
Kaltschmitt, M. & Huenges, E., (1999). Energie aus Erdwärme. Deutscher Verlag für Grundstoffindustrie, Stuttgart, 265 .
Landesamt für Natur und Umwelt des Landes Schleswig- Holstein, (2006). Leitfaden für oberflächennahe Erdwärmeanlagen. Pirwitz Druck & Design, Kiel.
Linden, A-L., Carlsson-Kanyama, A., Eriksson, B. (2006). Efficient and inefficient aspects of residential energy behaviour: what are the policy instruments for change?. Energy Policy 34 (14), 1918–1927.
Macleod, A. (2007): Using the microclimate to optimize renewable energy installation in: Renewable
Energy 33 (2008), 1.804-1.813. Malczewski, J. (1999). GIS and Multicriteria Decision Analysis, Wiley, New York. Malczewski, J. (2006). GIS-based multicriteria decision

11
PROCEEDINGS Conference MPDES 2011
analysis: a survey of the literature. International Journal of Geographical Information Science 20(7), pp. 703–726.
Maxwell, E. L. & Renne, D. S. (1994). Measures of renewable energy resources. NREL/MP-463-6254, National Renewable Energy Laboratory, Golden, Colorado.
National Italian Law N. 239/2004. Reorganizing the energy sector, as well as' delegation to the government to restructure the existing legislation on energy ("Riordino del settore energetico, nonche' delega al Governo per il riassetto delle disposizioni vigenti in materia di energia").
Nijkamp P., Voogd H. (1986). A survey of Qualitative Multiple Criteria Choice Models, In Measuring the Unmeasurable, Nijkamp P., Leitner H. and Wringley N. (eds.), Kluwer/Nijhoff, Dordrecht.
Pehnt, M., Cames, M., Fischer, C., Praetorius, B., Schneider, L., Schumacher, K., Voß, J.P. (2005). Microcogeneration. Towards a decentralized energy supply. Springer, Heidelberg.
Pereira, J.M.C. & Duckstein L. (1993). A multiple criteria decision-making approach to GIS based land suitability evaluation. International Journal of Geographical Information Systems, 7(5), pp. 407–424.
Rode, M., Schneider, K., Ketelhake, G. & Reisshauer, D. (2005). Naturschutzverträgliche Erzeugung und Nutzung von Biomasse zur Wärme- und Stromgewinnung. Ergebnisse aus dem F+E-Vorhaben 80283040 des Bundesamtes für Naturschutz. Bundesamt für Naturschutz.
Sass, I., Burbaum , U., Petrat L., 2009. Staufen im Breisgau: Artesisches Grundwasser, Anhydrit und Karst im Konflikt mit geothermischen Bohrungen. 17. Tagung für Ingenieurgeologie, Zittau.
Saaty, T.L. (1980). The Analytic Hierarchy Process, third ed., McGraw-Hill, New York.
Schneidera, D.R., Neven, D. & Željko B. (2006). Mapping the potential for decentralized energy generation based on renewable energy sources in the Republic of Croatia. Energy Volume 32, Issue 9, September 2007, 1731-1744.
Suri, M. & Hofierka, J. (2004). A New GIS-based Solar Radiation Model and Its Application for Photovoltaic Assessments. Transactions in GIS, 8(2), 175-190.
Touma, J.S. (1977). Dependence of the wind profile power law on stability for various locations, Air Pollution Control Association, Vol. 27, 863-866.
Ueberhuber, C. W. (1997). Monte Carlo Techniques. §12.4.4 in Numerical Computation 2: Methods, Software, and Analysis. Berlin: Springer-Verlag, 124-125 and 132-138.
VDI (2001) – Directive 4640. Verein Deutscher Ingenieure.
Vettorato, D. & Zambelli, P. (2009). Estimation of energy sustainability at local scale. 45th ISOCARP Congress 2009.
Voogd, H. (1983). Multicriteria evaluation for urban and regional planning. London, Pion.
ZedFactory (2010). Projects. http://www.zedfactory.com/about.html (last visit: September 2010)

12
PROCEEDINGS Conference MPDES 2011
Optimisation of off-grid energy systems by combined use of renewable energy and storage devices
Huneke, Fabian ([email protected])
Henkel, Johannes ([email protected]) Erdmann, Georg ([email protected])
Technische Universität Berlin Institute of Energy Technology, Department of Energy Systems
Einsteinufer 25 (TA8), 10587 Berlin, Germany
Abstract In this study, a general model of an energy system is developed, which can be adjusted to reflect real conditions, to achieve economical and ecological optimisation of off-grid energy systems. With respect to energy supply, the exogenous parameters are meteorological data, specific costs of fuel and of an alternative link to the national electricity grid. In addition to this on the demand side the load curve of the energy system is necessary. Thereby this study focuses on the demand for electrical power. Using linear programming methods in General Algebraic Modeling System (GAMS), the optimal configuration of the electrical power supply system was found following different restrictions of the model (i.e. the permanent security of the energy supply and the technologies’ capacities). From this model, the optimal mix of solar and wind based power generators combined with storage devices and a diesel generator set (as back-up device), was formed. The optimisation of this model took place under the requirement of minimising the cost of energy. Though this study aimed to create a general model, the results of a real off-grid energy system (i.e. a cluster of villages in India) was provided as well. It was found that with respect to small off-grid energy systems, renewable energy and electrical storage devices help to reduce the cost of energy compared to stand-alone diesel generator sets. Also observed was that the distance to the national grid was a significant and binding constraint. As both, photovoltaic (PV) and wind energy require energy storage they share the cost of the battery and complement each other. Lastly, though the capacity of the diesel generator remains nearly constant, only its usage is substituted by other technologies. Keywords: Off-grid; Energy System; Electrification; Energy Storage.
Introduction One major issue attached to the challenge of the world’s increasing demand for energy will be the electrification of about two billion people (Bassam & Maegaard, 2004, p. 251) in developing countries that do not currently have access to electricity yet. Most of the overall expected population growth will take place in developing countries and emerging nations - up to about nine billion people in total population by 2050 (Bassam & Maegaard, 2004, p. 1). Additionally, policies in emerging nations are concerned with increasing the supply of energy, as energy consumption per capita has become one of the major indicators for the development progress of a country. These two factors mainly determine the growth in energy demand.
Many of the places without or with only an insufficient link to the national grid are rural communities. The question is how to provide these off-grid energy systems? A common solution for off-grid power supply in small and medium sized energy systems is a fuel generator set (Niez, 2010); however, the following current developments have sought to improve the competitiveness and desirability of alternative off-grid energy systems: Steeply decreasing production costs of renewable
energy technologies like solar, wind and biomass has caused a boom of the respective technologies in developed countries,
The increased research in electric storage devices provoked by the plans of several countries to use electric vehicles in the future,
The sensitization for environmental concerns and especially for the climate change provoked by CO2-emissions produced by the combustion of fossil fuels and,
Increasing operation costs for fuel generator sets because of rising oil prices.
In (Bassam & Maegaard, 2004), integrated energy farms, which aim to bring power and food to rural communities, are discussed. The supply of electricity is integrated in an independent and decentralised energy supply concept under consideration of a sustainable development of remote areas by empowering the residents to take care of their own needs. Nfah, Ngundam, Vandenbergh, and Schmid (2008) are concerned with the optimisation of off-grid energy systems at rural communities in Cameroon and thereby focus on hydro and solar resources. Another more general steady-state modelling approach is done in (Gupta, Saini, & Sharma, 2010) under consideration of hybrid energy systems consisting of a micro-hydro, a biogas, a biomass, a back-up diesel generator and a photovoltaic (PV) array. The optimal dispatch strategy, as well as the optimal sizing, especially of the PV array is calculated simultaneously by linear programming. The performance of another type of hybrid energy system is the object of investigation in (Bowen, Cowie, & Zakay, 2001). Here the interaction between an existing wind/diesel energy system and a lead-acid battery bank is examined. The optimal sizing of such a wind-diesel hybrid energy is discussed in (Kaldellis, Kondili, & Filios, 2006) under consideration of the minimum long term electricity production cost. In (Koner, Dutta, & Chopra, 2000), the life cycle cost of stand-alone diesel generator sets is compared to that of PV and a battery. The benefit from linking different solar home

13
PROCEEDINGS Conference MPDES 2011
systems by installing an off-grid mini-grid is analysed in (Sebitosi & P. Pillay, 2006). This study aims to develop a general model for hybrid energy systems consisting of a PV array, a wind turbine, a diesel generator and a lead-acid battery. Both, a dispatch and a capacity optimisation will be done simultaneously considering weather and load data of a whole design year. The results of the model are displayed by means of real site conditions.
Proposed Energy System The energy system for off-grid remote areas proposed in this study is shown in Figure 1. A three phase AC-bus1 configured grid solution has four major advantages compared to other solutions: It is the most easily extendible grid in a modular way, Many of the wind turbines and diesel generator sets
are developed for three phase grid use, large electrical machines will need a three phase grid,
The most common electrical devices are designed for AC current, i.e. refrigerators, pumps and,
The frequency of the mini-grid is a valueable signal for: o Current load demand and power generation, o Generation scheduling, a suitable dispatch
strategy and, o Demand side management.2
Power Generation Options for Off-Grid Energy Systems In this paper the three considered power generation units are PV, a wind turbine and a diesel generator set. Unlike microhydro, natural gas, biogas, biomass and other possibilities for off-grid power generation wind and solar energy use has the substantial problem of possible temporal inequalities of power supply and demand. This is why their interaction with a diesel generator set as the most common off-grid solution and a energy storage device has to be examined in detail when analysing their suitability for off-grid energy supply.
Photovoltaic The direct transformation of solar radiation into electric power is booming. In the second quarter of 2006 the initial cost of up to 100kWp PV modules in Germany was 5000 , in the second quarter of 2010 it already sunk to 2912 (Bundesverband Solarwirtschaft, 2010).
As the cost of energy in an off-grid energy system is generally higher than in a national grid, an off-grid energy system is where PV reaches grid parity first. According to Koner et al. (2000) the life cycle unit cost of PV energy in India was cheaper or comparable to that of a diesel generator in 1999 at a diesel price of 0.31 PV is modular in nature and consequently easy to scale and expand. These are two essential qualities for off-grid utilisation. A very common solution for the off-grid use of PV are Solar
1 Alternate current, in contrast to direct current or hybrid solutions. 2 It gives information to the grid manager about when there is what kind of demand for energy, so for example the operation of energy-intensive facilities can be planned.
Home Systems (SHS). They consist of a PV array and a battery and meet only basic electric demands as they mostly use direct current. Contrary to SHS the energy system introduced in Figure 1 has a AC-Bus configuration whereas PV panels provide DC. Thus inverters are essential for the implementation of PV into the energy system. The inverters reduce the efficiency of PV from about 11-12 % by about 5 % to 11.4-10.5 % (Gupta et al., 2010), (Nfah et al., 2008).
Wind power Just like solar energy, wind energy undergoes a profound reduction of production cost. But in contrast to PV arrays which can be scaled flexible, there was a trend of upscaling the wind-turbines’ capacities in the wind energy market until 2010.3 In 2008 worldwide 38:7MW small scale wind-turbines have been installed, which is an increase of 53 % compared to 2007 (Otter & Pehnt, 2009). In Germany the market for small scale wind-turbines below 100kWr is comparably small.
Small wind-turbines play an important role in decentralised energy systems. As Kaldellis et al. (2006) shows, wind-diesel hybrid energy systems can reduce costs of energy drastically compared to diesel only solutions. The two sites in Greece presented in that study with 10 and 6 average wind speeds show cost reductions of 60 and 20% respectively over 20 years. Klus (2009) gives examples for 30 islands independent from the respective national grid, many of them working with small wind-turbines. The economic benefit from these solutions is emphasized in comparison to diesel generator sets. Wind diesel hybrid energy systems for islands are considered as well in Iken (2009), whereby a minimum average wind velocity of 5 is proposed.
However Otter and Pehnt (2009) as well as Bowen et al. (2001) indicate that small scale wind-turbines do not show an entirely good technical performance. This becomes obvious when comparing the power output curve given by the manufacturer to the measured real output in (Otter & Pehnt, 2009, p. 23), which displays a considerable smaller real capacity. Additionally within this study it is emphasized that horizontal small scale wind-turbines all in all perform better than vertical ones. The predicted annual production of electric power of 30,000 kWh to the actual field data of 12,355 kWh in Bowen et al. (2001, p. 435) for a 10 kWr wind-turbine at 7.9 average wind speed shows the mentioned performance problems as well.
3 At least for onshore wind-turbines the average installed capacity per wind-turbine seems to stabilize at about 2 MW (Neddermann, 2010, p. 6).

14
PROCEEDINGS Conference MPDES 2011
Figure 1: Remote area energy system design
Diesel Generator Set Being the technology with the least initial cost, diesel generator sets remain the most commonly used technology for the electrification of dispersed people. Unless current sustainability considerations favour cleaner technologies including alternative combustion engines based on biofuels, the following reasons account for the attraction of diesel generators for the off-grid use: The suitability for hybrid energy systems through its
controllability, The worldwide availability of diesel fuel and, The widespread and typically easy to maintain
technology.
Battery The key to facing the fundamental problems of temporal inequalities of solar or wind power and electric power demand is an energy storage device. Today, the known crucial technical solutions in this context are: 1. Mechanical energy storages:
pump storage hydro power plant, compressed air store, flywheel and
2. Electrochemical energy storages: lead-acid, nickel metal hydride and lithium-ion
cells, high temperature traction batteries, fuel cells and flow batteries.
The lowest capacity cost, the reliability and (with about
3000 to 5000 no. of cycles over life) the comparatively long durability of lead-acid batteries are the three main reasons, why today this is the default solution for off-grid
energy storage. Also, they can be discharged fast, which means they can serve peak load for a short time. Their energy density is 20 to 30 , which is relatively small. The efficiency can be estimated at about = 85%. The performance of lead-acid batteries suffers from temperatures below 0 oC and above 60 oC (Jossen & Weydanz, 2006, p. 33-61).The depth of discharge is limited to 20 to 50 % of the overall battery capacity; otherwise irreversible processes within the lead-acid battery would damage it and shorten its durability.
There are two other energy storage technologies that should be considered in the context of off-grid energy systems:
1. According to Iken (2009) the flywheel can perform well in interaction with wind energy, as it can perfectly absorb peak loads aroused by short but high wind velocities and serve peak load demands,
2. High temperature traction batteries have the potential to serve as centralised storage devices for midi and big offgrid systems, their interaction with solar and wind energy is simulated by Younicos in Berlin, Adlershof by means of a 1 MW sodium-sulfur battery.
In order to reduce the complexity of the energy system model in this study only lead-acid batteries have been used.
Load Demand Typically the load demand this energy system model is designed for, has a peak load demand of 10 to 150kW and an annual energy consumption of 40,000 to 400,000kWh. This demand is generated by household, commercial, industrial and community load. To meet the energy needs of rural communities it is of utmost importance to

15
PROCEEDINGS Conference MPDES 2011
consider the increase or decrease of its population as well as the local changes of energy consumption per capita.
Modelling When optimising an off-grid energy system, modelling the technologies, the economic performance and the site data is the crucial issue. The optimisation process is realised with the General Algebraic Modeling System (GAMS) using linear programming methods. The simultaneous optimisation of the dispatch strategy and of the capacities of the considered technologies account for the following assumptions:
Steady-state of the system and all technical and economical parameters,
The available load data are representative for the whole year,
The applied weather data of a design year and in parts also of a design region are representative,
Weather and load data are constant within each one-hour time step,
Maintenance and operation costs depend on the installed capacity only,
Maintenance and breakdown interruptions are not considered,
The applied technologies remain available throughout the planning horizon,
The total PV energy production is estimated by applying full load hours while only the global horizontal solar radiation has an influence on the hourly PV power output,
The power generation of the wind turbine depends on the actual wind velocity by means of a load curve,
The diesel generator set has a static efficiency of 40%,
There is no self-discharge of the lead-acid battery and,
A technology for dump load and its cost are not considered in this model, whereas dumped energy is allowed.
The objective function below sums the annualised specific capital, operation and maintenance costs.
4 The minimisation of tc in equation (1) is done under the
capacity restrictions5
4 All symbols are given in Table 4 on page 8. 5 A power output restriction for the battery is not considered to be relevant, as lead-acid batteries are designed for operation with high output. However, if discharged at high ouputs, the battery’s capacity will diminish.
Technologies The capacity factor c f j,t which appears in the capacity restrictions (2), (3) and (4) indicates what fraction of the installed capacity is available at time segment t. The capacity factor for the diesel generator set is 16 and 0.27 for battery charging and discharging respectively and depends on the radiation for PV and on the wind velocity for the wind-turbine.
Photovoltaic Usually the annual output of a PV array is calculated by the full load hours at a specific site. In order to optimize the dispatch strategy the information when this energy is generated is essential. Thus the global horizontal solar radiation at every single one of the 8760 hours of a design year at a reference region is necessary. Hence the PV capacity factor is calculated as follows:
Consequently the required site data are the expected full
load hours and the hourly direct solar radiation of a reference region, as usually the radiation data at the specific site are not available. The assumption concerning PV mentioned in section mainly neglects the influence of the temperature on the efficiency of PV modules. This will cause errors at sites, that go through high variations in temperature seasonally.
Wind-turbine The output of a wind-turbine mainly depends on the wind velocity and the air density. While the kinetic energy of wind increases proportionally to the cube of the wind velocity this is not the case for the windturbine’s output at every operating point. This is why the wind-turbine’s load curve is estimated by means of an averaged manufacturer’s power output curve from Otter and Pehnt (2009, p. 23) instead of the wind’s kinetic energy and the efficiency. The cut-in and furling wind speed are set to 3 and 20 respectively, within this range the load curve is estimated as follows:
6 This is an effect of the assumption of uninterruptible service mentioned in section 7 This is an effect of the maximum depth of discharge for leadacid batteries

16
PROCEEDINGS Conference MPDES 2011
In order to estimate the mean wind speed the required
sitedata are the annual mean wind speed at the site in a height of 30 to 50m and the hourly wind speed at a reference region, if these wind data are not available at the precise site. Consequently the hourly wind speed is estimated by
Lead-acid Battery As equation (3) and (4) show the usage of the battery depends on the capacity factor and the battery status bst . Equation (11) shows how the battery status is calculated depending on charging or discharging operation mode.
The charging and discharging of the battery has been split up into two variables in order to be able to simultaneously separate the capacity restrictions in equations (3) and (4) and to apply the different efficiencies for each operation mode. Charging efficiency is set to 90 % and discharging efficiency to 95 %, which leads to a round trip efficiency of 85.5 %.
Economic Parameters In order to include the whole life-cycle into the cost consideration, the annuity method is applied. All economic parameters are summarized in Table 1. The costs are specific net cost and investment cost, which includes acquisition and installation costs. The diesel fuel price is calculated by considering the lower heating value and includes a price increase of 40% at local markets in consequence of the transportation to the remote area.
Case Study: Narendra Nagar Narendra Nagar block of district Tehri Garhwal, Uttarakhand State in India consists of nine villages without access to electricity. It is a major hilly remote area and electrification by grid-extension has been considered to not be economically viable (Gupta et al., 2010, p. 528).
In addition to the data given in Table 1 the site conditions are estimated with the parameters in Table 2.
Some of the results of the simulation are displayed in Table 3 while Figure 2 demonstrates the results for the variation of the average wind speed and Figure 3 shows the effects of varying the diesel price. In order to examine the dispatch strategy of the respective technology and the interaction of all four technologies Figure 4 shows the contribution of each technology to serve the load demand for a exemplary day and an elevated average wind speed of 7.5 .
As the results in Table 3 indicate, the optimal energy system mainly consists of a diesel generator assisted by PV and a small lead-acid battery. The optimal capacity of the generator is smaller than the peak load demand, and the battery acts as a peak shaving facility. Wind energy is not viable for the given wind velocities. For an average wind speed above 6 wind energy does play a role, cf. Figure 2. An elevated diesel price increases the contribution of PV to the energy system as Figure 3 shows.
Discussion The calculated off-grid cost of electricity of 27,5 is in the range of 15.07 to 40.13 for the cost of energy for the diesel generator stand alone solution given in (The World Bank Group, 2006, p. 55). It is more expensive than the solution proposed in (Gupta et al., 2010), that includes more technologies. The break-even grid distance of 113km is a strong restriction for an off-grid energy system, although the assumed levelled cost of grid extension in The World Bank Group (2006, p. B-5) is averaged over normal terrain in India and will be higher at hilly sites.
Figure 2 reveals three dependencies: 1. The higher the average wind speed, the more wind
energy is used, therefore the good performance of wind-diesel hybrid energy systems discussed in (Kaldellis et al., 2006) and (Bowen et al., 2001) for average wind speeds of 7.5 are clearly realistic,
2. The diesel generator set is still at high capacity to serve peak loads but its annual contribution to the power supply is diminished disproportional to the capacity,
3. The increasing battery capacity aroused by high wind energy utilisation is an advantage for PV as well as its optimal capacity nearly doubles from 28.44 to 58.66kW.

17
PROCEEDINGS Conference MPDES 2011

18
PROCEEDINGS Conference MPDES 2011
According to 3. under certain circumstances wind energy and PV in off-grid energy systems can positively interact. Both technologies depend on the lead-acid battery bank and they can use it separately to some extent.
In Figure 3 the vast diesel price sensitivity of the energy system is displayed: Doubling the diesel price completely turns the energy system upside down and the diesel generator is used as a peak shaving facility only. Hereby the demand for battery capacity grows disproportionately to that of PV. Thus the cost rises just as well and for a diesel price of 12 and 17 the cost of electricity grows to 31.1 and 37.2 respectively.
The dispatch strategy that causes Figure 4 is optimal concerning the utilisation of the battery but at 8 and 13 o’clock the diesel generator is not running smooth, as there are too many start-stop cycles. However the battery is charged when PV or the wind-turbine produces more energy than demanded and is discharged when the opposite is true.

19
PROCEEDINGS Conference MPDES 2011
Figure 4: Exemplary optimal dispatch strategy for an elevated wind speed
Table 4: List of Symbols

20
PROCEEDINGS Conference MPDES 2011
References Bassam, N. E., & Maegaard, P. (2004). An analysis of off
grid electrical systems in rural sub-saharan africa. Amsterdam, Netherlands: Elsevier BV.
Bowen, A., Cowie, M., & Zakay, N. (2001). The performance of a remote wind–diesel power system. Renewable Energy, Elsevier, 22, 429–445.
Bundesverband Solarwirtschaft. (2010). Preisindex Photovoltaik Quartal 3, 2010 (Tech. Rep.). http://www.solarwirtschaft.de/preisindex. (Retrieved on 14th December 2010.
Gupta, A., Saini, R., & Sharma, M. (2010). Steady-state modelling of hybrid energy system for off grid electrification of cluster of villages. Renewable Energy, Elsevier, 35, 520–535.
Iken, J. (2009). Dieselstrom mit Rückenwind. Sonne, Wind und Wärme, 16, 52–55.
Jossen, A., & Weydanz, W. (2006). Moderne Akkumulatoren richtig einsetzen. München, Germany: Reichhardt Verlag.
Kaldellis, J., Kondili, E., & Filios, A. (2006). Sizing a hybrid wind-diesel stand-alone system on the basis of minimum long-term electricity production cost. Applied Energy, Elsevier, 83, 1384–1403.
Klus, L. (2009). Doppelt unabhängig. Sonne, Wind und Wärme, 16, 56–57.
Koner, P., Dutta, V., & Chopra, K. (2000). A comparative life cycle energy cost analysis of photovoltaic and fuel generator for load shedding application. Solar Energy Materials and Solar Cells, Elsevier, 60, 309–322.
Neddermann, B. (2010, June). Status der Windenergienutzung in Deutschland (Tech. Rep.). (http://www.wind-energie.de/de/statistiken/ fileadmin/dokumente/statistiken/WEdf, Retrieved on 16th December 2010.
Nfah, E., Ngundam, J., Vandenbergh, M., & Schmid, J. (2008). Simulation of off-grid generation options for remote villages in cameroon. Renewable Energy, Elsevier, 33, 1064–1072.
Niez, A. (2010). Comparative study on rural electrification policies in emerging economies (Tech. Rep.). IEA Energy Technology Policy Division. (http://www.iea.org/publications/free new Desc.asp?PUBS ID=2213, Retrieved on 22nd December 2010)
Otter, P., & Pehnt, M. (2009). Arbeitspaket Marktanalyse Kleine Windkraft, in: Pilotstudie zur Akzeptanz vertikaler Windenergieanlagen (Tech. Rep.). ifeu - Institut f¨ur Energie- und Umweltforschung Heidelberg GmbH. ([German ref.])
Sebitosi, A., & P. Pillay, M. K. (2006). An analysis of off grid electrical systems in rural sub-saharan africa. Energy Conversion and Management, Elsevier, 47, 1113–1123.
The World Bank Group. (2006). Technical and economic assessment of off-grid, mini-grid and grid electrification technologies annexes (Tech. Rep.).
Energy Unit - Energy Transport and Water Department. (http://energyaccess.wikispaces. com/file/view/WBElectrificationAssessment17May07.pdf, Retrieved on 22nd December 2010)
U.S. Department of Energy, Energy Efficiency and Renewable Energy. (1990). Weather data of energyplus energy simulation software (Tech. Rep.). (http://apps1.eere.energy.gov/buildings/energyplus/weatherdata about.cfm, Retrieved on 20th December 2010)

21
PROCEEDINGS Conference MPDES 2011
Decentralized electricity production from renewable sources as a chance for local economic development? Qualitative study of two pioneer regions in Germany
Britta Klagge ([email protected]) Tobias Brocke ([email protected])
University of Osnabrück Institut für Geographie
Seminarstraße 19ab, D- 49076 Osnabrück, Germany
Abstract Whereas the conflicts surrounding decentralized electricity production from renewable sources have been an important topic for field research for some time, empirical research on the economic effects associated with decentralized electricity production at the local level has only just started. So far, most studies focus on quantifying economic value added and job creation and neglect the conditions and constellations which support and enable local economic development based on renewable energies. This, however, is the focus of our paper which looks at these issues employing the value chain concept in combination with a governance perspective. In two regional case studies we analyze both actors directly involved in the value chain and institutional context, the latter including the role of indirectly involved actors from politics, administration and civil society. As case studies we chose two pioneer regions, in which decentralized electricity production from renewable sources has developed very dynamically. The case study regions are Soltau with a special focus on biogas production and Emden, where wind energy plays a special role. Based on the early activities of some pioneers, these regions have developed specific organizational structures and entered development paths in which renewable energies became an important economic factor. For our case studies which were part of a two-year research project on decentralized electricity production in Northern Germany, we, in addition to the analysis of secondary data, press and internet information, conducted several expert interviews. Keywords: electricity production, renewable energies, economic effects, governance, local economic development.
Introduction: research questions, objectives and methods
With the change of German energy and environmental politics, decentralized electricity production has grown in importance especially since the 1990s (Brücher, 2009). A major part of decentralized electricity production is achieved from renewable sources and mainly located in rural regions. This is especially the case for biogas and wind technologies, whereas renewable electricity production in urban areas so far is mainly restricted to solar, especially photovoltaic, technologies and combined heat and power plants (CHP) using biomass (Porsche, 2010). Whereas the conflicts surrounding decentralized electricity production have been an important topic for field research for some time, empirical research on the economic effects associated with decentralized electricity production at the local level has only just started. A recent study commissioned by the Agentur für Erneuerbare
Energien (AGEE) and conducted by the Institut für Ökologische Wirtschaftsforschung (IÖW) and others provides concrete data on both value-added and employment effects of renewable electricity production at the local level by focusing on net profits of firms, net income of employees and taxes (Hirschl et al., 2010). The results of this, but also other studies (e.g. O’Sullivan et al, 2010) show the potential for local gains from renewable electricity production. They also indicate that there are extra gains for those localities where in addition to electricity production itself we find firms specialized in supplying equipment or services for renewable electricity production, i.e. where inputs to several stages of the value chain are provided locally (cp. Fig. 1).
Figure 1: Renewable energies value chain. In contrast to other studies which focus on quantifying
economic value added and job creation, our paper analyses the institutional conditions and actor constellations which support and enable the development of such firms and thus local economic development based on renewable energies. The argument we put forward is that those localities which had an early start in decentralized electricity production from renewable sources are most likely to realize extra gains, especially when the development has been supported by cooperative governance structures at the local level.
Governance here refers to institutions, actor constellations and their modes of coordination with respect to the organization and (possibly) promotion of decentralized electricity production. The focus is on both business actors directly involved in the value chain and institutional context. Business actors include the heterogeneous group of plant operators,1 but also grid operators and suppliers of equipment, services and – in the case of biogas – raw materials. According to our
1 The most important are private individuals and farmers,
project developers and financial service providers, industrial firms and various types of utilities (Briese, 2010).

22
PROCEEDINGS Conference MPDES 2011
governance focus we additionally look at actors and institutions which (can) influence the development of renewable electricity production indirectly, i.e. actors from politics, administration and civil society as well as institutions in the form of laws and other formal as well as informal regulations and modes of interaction.
Actors and institutions in renewable electricity production can be associated with different spatial levels from local to national or even international (George et al., 2009) – thus requiring a multi-level governance perspective. The key national institution responsible for the proliferation of renewable electricity production in Germany is the Renewable Energies Act (Erneuerbare Energien Gesetz, EEG) from 2000, with major amendments in 2004 and 2008. It guarantees a feed-in compensation for electricity produced from renewable sources and thus provides incentives and a certain degree of security for investors. It has been heavily criticized by some as an inefficient tool to both curb greenhouse gases and generate positive economic effects (e.g. Frondel et al., 2010), whereas others praise it for its positive impact on job creation and climate protection (e.g. AGEE, 2010). It is unanimously agreed, however, that the EEG has been the main trigger for the fast growth of renewable electricity production in Germany in the last decade – and thus for economic effects at the local as well as other levels.
Important institutions also include planning regulations at various levels which can enable or prevent the installation and operation of renewable energy facilities in certain locations or types of locations. In addition, public-private cooperation or, more generally, the ways in which business and other actors interact at the local level are also important characteristics of governance constellations which can support local economic development based on renewable energies.
In our analysis we take a qualitative approach with two regional case studies. As case studies we chose two pioneer regions, in which decentralized electricity production from renewable sources has developed very dynamically. We will show that, based on the early activities of some pioneers, these regions have developed very specific organizational structures and entered development paths in which renewable energies are now an important economic factor. The paper specifically analyses the conditions and constellations which have supported and enabled this development. The case study regions are Soltau with a special focus on biogas production and Emden, where electricity production from wind plays a special role. For the case studies which were part of a two-year research project on decentralized electricity production in Northern Germany at the University of Osnabrück, we, in addition to the analysis of secondary data, press and internet information, conducted several expert interviews, mainly with local actors in the case study regions. These included representatives of utilities/grid operators, local politics and administration, civil society as well as from plant operators and other businesses involved in the renewable energies value chain.
Case study of Emden: Focus on wind energy The case study area The sea port city of Emden in the rural Northwest of Lower Saxony has ca. 51,000 inhabitants and was chosen as a case study for an early implementation of decentralized electricity production from wind. Emden exhibits one of the largest agglomerations of wind turbines in Germany and has become known for innovative wind projects. Furthermore, Emden is the location of branch plants for two large wind turbine producers. Enercon produces concrete parts in Emden which are then shipped to various sites worldwide, and BARD has a production facility for offshore turbines in Emden’s port area. In addition to automobile production and port activities, the wind industry has developed into one of the most important sectors of Emden’s economy (NLS, 2007: 237 f.).
There are three different distribution grid operators active in Emden. The Stadtwerke Emden GmbH (SWE) covers most of the city’s area and is 100 % publicly owned by the city. Lower Saxony’s N-Ports is responsible for the port area and EWE NETZ GmbH for the remaining (fringe) areas. As the port is a specific case, SWE and EWE NETZ are those grid operators relevant for decentralized electricity production. Whereas EWE NETZ is a pure (unbundled) grid operator and a subsidiary of the regional and 5th largest German utility EWE, SWE is an integrated utility or energy company which has both its own grid in Emden and various power plants.
In Emden we find both centralized and decentralized electricity production facilities. The central facilities include a gas and a biomass plant which both feed into Tennet’s (formerly EON’s) transmission grid. Decentralized electricity production in Emden uses various sources including renewables. At the time of analysis these included 120 photovoltaic systems with a total capacity of ca. 1 MW, several CHP using fossil fuels as well as one sewer-gas plant (cp. SWE, 2007, 2009). Most important, however, is decentralized electricity production from wind which added up to 143 MW from 75 turbines (Stadt Emden, 2008). There are several turbines which were installed and are managed by farmers, but most turbines are part of four wind parks. These parks are managed by SWE, EWE, two specialized operating companies founded by Emden citizens and land owners respectively as well as by research-oriented actors and groups. The latter include Enercon and BARD as turbine producers as well as the Arge Emden-West, a consortium of Enercon, SWE, EWE and the Ingenieurgesellschaft für Energieprojekte (IfE). Altogether electricity production from renewable sources (incl. the central biomass plant) provides roughly 100 % of Emden’s electricity demand.
Actors, value-chain context and governance structures The spectrum of actors involved in wind energy production in Emden is very broad and includes, among others, two utilities/grid operators (SWE, EWE/EWE NETZ) and two turbine producers (Enercon, BARD). Very important is also the significant amount of private

23
PROCEEDINGS Conference MPDES 2011
engagement, especially of farmers and land owners. The economic effects of electricity production from wind in Emden, however, reach far beyond these actors. They also include consultancy and planning bureaus, firms in the construction industry, the electrician trade as well as others which are contracted in various stages of the value chain (cp. Fig. 1). Several Emden wind projects were planned and realized by Emden-based IfE, and many other tasks are sourced from local firms with the explicit aim to generate local gains. The cooperation of the various actors involved in planning and managing wind parks is rooted in a closely-knit network of local actors and characterized by the joint implementation of innovations. Most business relations have a long history and include informal exchange and cooperation and thus go far beyond purely contract-related activities.
The success of Emden in the area of electricity production from wind, however, is not only based on the fruitful and intensive cooperation of the involved firms. In addition, the positive development has profited from the support of (semi-)public and civil-society actors. Already in the 1980s, long before the first wind park was realized, these actors were interested in and dealt with wind energy. When a 1994 regulation of the Land (LROP = Landesraumordnungsprogramm) required the localization of wind energy preference areas in land use plans, the city of Emden established the formal institutional framework in the same year and thus paved the path for a controlled development of electricity production from wind in its jurisdiction. In addition, the city actively supported this development politically through its leverage as 100 % owner of SWE and via its local climate protection policy. Specifically, the city mandated SWE to realize Emden’s first wind park and thus became a pioneer and major actor of decentralized electricity production.
As chair of the supervisory board of SWE, the mayor of Emden provided the necessary political backing for the wind as well as other renewable activities of SWE. From the early 1990s on, the practical side was managed by the CEO of SWE and was supported by an SWE employee who prepared the concept for the first wind park. This employee has become a key actor for wind energy development in Emden, especially after he left his job at SWE and founded IfE, an engineering firm specialized in wind energy projects (see above). Since its foundation in 1994, IfE has not only been dealing with wind (incl. repowering) projects in Emden and its surroundings, but also ventured into planning and developing photovoltaic systems.
In sum, there were three main actors whose cooperation originally initiated and still shapes the development of wind energy in Emden: first the mayor, second the CEO of SWE and third his employee and later CEO of IfE. The chosen development path has thus been decisively influenced by (semi-)public actors and organisations and is to a large degree a result of their commitment. They were bolstered by civil-society and other semi-public actors. Various initiatives, including e.g. Lokale Agenda 21 and Ökowerk, have been and still are a vehicle to integrate interested individuals into the process. Together with the city administration and SWE who actively supported these initiatives, they advanced the acceptance
of wind energy by Emden’s residents and have helped to overcome protests by nature protection activists.
Results and interpretation In the last decades, Emden has developed into one of the most successful locations of electricity production from wind in Germany. This development – originally triggered by a regulation of the Land (LROP 1994) – has mainly been promoted and shaped by local actors, but would not have been possible without the favorable framework of the EEG. In the course of this development a network of local business and other actors emerged which is characterized by close and cooperative relationships. This network includes operators of wind turbines and parks, equipment producers, utilities as well as construction, electrician-trade and various service companies which have been working together for a long time in various projects and in some cases jointly developed and/or manage wind parks. Furthermore a variety of additional actors that are not part of the value chain has had an impact on Emden’s wind development. Public actors created the formal institutional framework and supported the development of semi-public and civil-society initiatives. Together (semi-)public and civil-society actors were important in sensitizing and convincing Emden’s residents.
It is against this background that Emden developed into one of the most successful and also innovative locations for electricity production from wind. In our opinion, this success is mainly due to the early and broadly based efforts to reconcile business, public and other interests in a governance process at the local level. It is worth highlighting that in this governance process, public and semi-public actors, especially the mayor and SWE, played a significant role as (pro-)active promoters of wind energy in Emden.
Case study of Soltau: Focus on biogas production The case study area Soltau in the centre of Lower Saxony was chosen as a case study because the city of Soltau as well as its surroundings exhibit a relatively high concentration of biogas plants (Land Niedersachsen, 2009). A city of roughly 22,000 inhabitants, Soltau is located 75 km south of Hamburg in the Lüneburger Heide, a rural region whose economy shows a (relative) strength in agriculture and in tourism (Rohr-Zänker et al., 2003).
There is only one grid operator in the city of Soltau, which is the Stadtwerke Soltau, an integrated utility owned by the city of Soltau (50,5 %) and Stadtwerke Bremen (49,5%) (Stadtwerke Soltau, 2007). There are both centralized and decentralized electricity production facilities. The first are 16 wind turbines with a capacity of 23,6 MW which feed into the Tennet’s (formerly EON’s) transmission grid (EPURON, 2009). Decentralized electricity production at time of field research included both conventional, i.e. fossil-fuelled CHP and electricity production from renewable sources, namely sewer gas, wind, solar (photovoltaic) and biomass, adding up to a total electric capacity of 19 MW. In 2007, decentralized electricity production in the city area added up to 85 % of

24
PROCEEDINGS Conference MPDES 2011
local demand with more than two-thirds of this (57 % of toal demand) from biomass (cp. Stadtwerke Soltau, 2008). This electricity production from biomass took place in 13 biogas plants with a total capacity of 10 MW (in 2008). These plants vary in type and size, and include three large plants with capacities of more than 1 MW each. Most plants are located on still operating or former farmsteads in the outskirt area of Soltau; a notable exception is a large industrial plant located in an enterprise zone. Seven out of the 13 plants went into operation in 1996 and 1997, whereas the remaining ones were installed after the Renewable Energies Act (EEG) was amended in 2004. Hence, the situation today is the result of a perennial process which started in the mid-1990s.
Actors, value-chain context and governance structures The development of electricity production from biogas in the Soltau region was initiated by farmers in the region, who in the mid-1990s started to build biogas fermenters on their farmsteads. In order to acquire relevant technical, biological, business and organizational knowledge and to learn from each other they established a biogas working group in 1995. In the context of this working group, joint activities regarding e.g. research on and sourcing of input materials and the management of materials flows were organized. These activitities constituted an important basis for the development of specialized equipment and service providers in the region.
The expansion of biogas production triggered a considerable local demand for agricultural goods and services – and thus a steady income source for farmers, machinery syndicates and other agricultural organizations in the region. Agricultural actors actively pursued strategies to capture the value-added and employment opportunities associated with biogas production. Whereas the provision of input materials only replaces other crop production and thus cannot count as an extra gain (Hirschl et al., 2010), this is different for the engagement of machinery syndicates (Maschinenringe) in the field of managing, i.e. organizing and coordinating, biogas production and its various material flows.
At the same time and as a reaction to the local, and increasingly also national, demand, non-agricultural businesses in the region were founded to serve or shifted their business focus to the needs of biogas production (e.g. in heating technology, electrical engineering, motor production, steel and container construction). Today, value-added is generated locally at all stages of the value chain ranging from specialized equipment production and service provision over more generic construction, development and management activities to the supply with raw materials. While some firms in the Soltau biogas scene now also serve national or even international markets, there are also strictly local employment effects, especially in the operation and management of the plants which in some cases includes hiring one or more staff members.
There are differences between the plants in the degree to which certain tasks are performed internally or sourced externally from specialized suppliers. Most agricultural biogas fermenters are relatively small and in addition to using own resources (incl. labor), personal contacts and
informal arrangements with other farmers are important for securing (additional) inputs, especially raw input materials. As there is a high demand for raw materials in the Soltau region, it is an advantage to be able to make use of good relations with neighbors and colleagues and thus avoid long(er) transport distances and higher transport costs. In contrast to most agricultural fermenters, large and/or industrial biogas plants usually source their inputs, both materials and labor, externally and in formally fixed contracts. In addition to these structures, many operators of biogas fermenters contract the service(s) of machinery syndicates and similar organisations as intermediators and coordinators and thus benefit from their specialized expertise and from lower transaction costs due to economies of scale.
Generally, the cooperation of plant operators with their contractors and suppliers, but also among themselves, is characterized by personal long-term and trustful relationships and cooperation. Over the years, a network based on a long-standing division of labor and stabilized by mutual recommendation has emerged. This “reputation network” (cp. Glückler, 2004) originates in the first biogas activities and cooperation of farmers in the 1990s and has gradually become larger and more diversified, now also including suppliers of equipment and services. In sum, the biogas scene in the Soltau region exhibits typical network characteristics which were important in developing new skills and technologies and thus enabled some specialized suppliers to serve markets beyond the Soltau region and grow into nationally or even internationally active service providers.
In contrast to Emden, (semi-)public and civil-society actors beyond the value-chain were less crucial for the biogas development in Soltau, although there is one important organization, the local (integrated) utility Stadtwerke Soltau. As grid operator Stadtwerke Soltau is in regular contact with all plant operators and maintains stable and cooperative relationships with actors from the biogas scene. Unlike Emden, however, the Stadtwerke do not play a (pro-)active role in the promotion of electricity production from renewable energies. The same is the case for local politics and administration which have enabled the growth of biogas production in the context of their planning competences, but do not actively promote renewable energies. Civil-society’s role is also negligible today, but this was different in the past when there was a wave of protests about odor emission which even reached the former regional government level. After this problem, which originated in the utilization of a specific (cofermentation) technology, was solved protests and more generally civil-society influence waned.
Results and interpretation The electricity production from biomass in Soltau, and also in its surroundings, was initiated by agricultural actors, namely some innovative farmers. By establishing a biogas working group and investing into biogas technology they established the starting point for the dynamic development of biogas plants in the Soltau region since the 1990s. Today, the large number and variety of firms in the biogas sector, both with agricultural and commercial or industrial roots, is one of the

25
PROCEEDINGS Conference MPDES 2011
outstanding characteristics of the Soltau region and an important element in its dynamic biogas scene.
There are various factors behind this development. Maybe most important, the early local demand for biogas equipment and services in Soltau as well as a lack of specialized suppliers in this young industry more generally, provided a window of opportunity for business actors in the region. The fact that this opportunity was taken has a lot to do with the cooperative network approach that characterizes Soltau’s biogas development and which had its starting point in the biogas working group established by some farmers. Cooperation and trustful relationships were important for the proliferation of biogas activities in the first place, and then also facilitated technical and other innovations, thus advancing the competitiveness of local firms in the biogas value chain.
In addition, a few actors not directly involved in the value chain have been supportive of the Soltau biogas development. This includes the Stadtwerke Soltau as grid operator, but also city politics and administration who established favorable planning conditions, but both have not played a pro-active role. Public agencies at other scales or citizens and civil-society organizations do not play an important role (any more). In sum, the Soltau biogas scene and development is characterized by a predominantly local governance context in which agricultural and other business actors play a key role whereas political and especially civil-society actors are much less important than, for example, in Emden.
Discussion The analysis of two pioneer regions shows that decentralized electricity production from renewable sources can become an important economic activity and factor in rural regions and their urban centers. Associated with the expansion of decentralized electricity production from renewable sources, source-specific (wind, biogas) local production contexts have evolved in our case-study regions. In both Emden and Soltau this includes the development of new firms as well as the specialization and/or growth of existing firms operating at various stages of the value chain. The two case studies thus provide examples of regions in which extra gains from equipment production and specialized services are realized at the local level (cp. Fig. 1).
However, our analysis also shows that, with the geographical proliferation of electricity production from renewable sources, specialized firms and suppliers responsible for those extra gains tend to detach themselves from local contexts. Pioneer regions with an early dynamic development of renewable energies, such as Emden or Soltau, therefore possess first-mover advantages in comparison with late-comers – if local (pioneer) firms take up the business challenges associated with renewable energies and are successful in entering not only local, but also national or even international markets.
The analysis of our case-study regions also points to the importance of trustful and cooperative relationships among business actors at the local level for such a development. Stable local production networks which are
characterized by such relationships can provide a basis for sharing and jointly developing knowledge and innovations and thus for creating competitive advantage for (some) firms in the value chain.
Furthermore, the two case studies also highlight the importance of institutional context and supportive governance structures for an early advancement of decentralized electricity production from renewable sources in the first place and then also for the development of local production networks. From a multi-level governance perspective the key role of local actors and local governance constellations is – within the supportive EEG framework at the national level – especially notable. Although in the case of Emden, and wind energy more generally, regional institutions (regional planning) and multinational actors (turbine producers) are also important, the early development of renewable electricity production in both case-study regions must mainly be attributed to local actors and their inititative.
It is also noteworthy that in both case-study regions individuals – from local utilities, local politics or administration (Emden), from business or agriculture (Soltau) – played key roles in entering local development paths in which renewable energies have become an important economic factor locally.2 Based on their initiatives and activities, specific organizational and institutional structures were established which then served as a starting point for the development of local production networks.
While our case-study results confirm our assumptions regarding the significance of institutional context and governance, especially at the local level, the analysis of two successful pioneer regions does have its limitations. It needs to be complemented by research in other types of regions as well as by geographical research on industry development. Especially to confirm our argument regarding the advantages of pioneer regions we need studies which take a long-term perspective and focus on the interaction of and division of labor between producers, suppliers and their customers in different locations both nationally and internationally.
Acknowledgements We thank the Ministry for Science and Culture (MWK) in Lower Saxony, Germany, which provided financial support for this research through its PRO*Niedersachsen program, as well as our interview partners in the two case-study regions.
References AGEE (2010). Der volle Durchblick in Sachen
Erneuerbare Energien - Kosten und Nutzen. Berlin: Agentur für erneuerbare Energien. Availabe on
2 Interestingly, chambers of commerce and industry as well as
other business-related associations at the local or regional level are not very engaged in supporting such networks – despite the by-now obvious potential for value-added and employment.

26
PROCEEDINGS Conference MPDES 2011
www.unendlich-viel-energie.de/uploads/media/ Durchblick Kosten Nutzen.pdf
Briese, D. (2010). Erneuerbare Energien-Anlagen in Deutschland: Anteile einzelner Marktakteure. Energiewirtschaftliche Tagesfragen, 60, 8, 28-30.
Brücher, W. (2009). Energiegeographie. Wechselwirkungen zwischen Ressourcen, Raum und Politik. Berlin: Bornträger.
EPURON (2009). Windenergie: Unsere Referenzen. From www.epuron.de/desktopdefault.aspx/tabid-976/
Frondel, M., Ritter, N., Schmidt, C.M., & Vance, C. (2010). Economic impacts from the promotion of renewable energy technologies: The German experience. Energy Policy, 38, 4048-4056.
George, W., Bonow, M., Hoppenbrock, C., & Moser, P. (2009). Regionale Energieerzeugung. Chance für eine zukunftsfähige Ziel- und Ressourcensteuerung in der Energiewirtschaft. Standort. Zeitschrift für Angewandte Geographie, 33, 13-21.
Glückler, J. (2004). Reputationsnetze. Zur Internationalisierung von Unternehmensberatern. Eine relationale Theorie. Bielefeld: transcript
Hirschl, B., Aretz, A., Prahl, A., Böther, T., Heinbach, K., & Pick, D. et al., (2010). Kommunale Wertschöpfung durch Erneuerbare Energien. Schriftenreihe des IÖW 196/10. Berlin: Institut für Ökologische Wirtschaftsforschung.
Land Niedersachsen (2009). Biogasanlagen in Niedersachsen. Stand der Entwicklung und Perspektiven. Hannover: Niedersächsisches Ministerium für Umwelt und Klimaschutz. From www.umwelt.niedersachsen.de/master/C1153082_N1242216_L20_D0_I598.html
NLS (2007). Niedersachsen. Das Land und seine Regionen. Land, Bezirke, Landkreise, Kreisfreie Städte. Hannover: Niedersächsisches Landesamt für Statistik, Niedersächsisches Institut für Historische Regionalforschung e.V.
O’Sullivan, M., Edler, D., Ottmüller, M., & Lehr, U. (2010). Bruttobeschäftigung durch erneuerbare Energien in Deutschland im Jahr 2009 – eine erste Abschätzung. Berlin: BMU Available on www.bmu.de/files/pdfs/allgemein/application/pdf/ee_beschaeftigung_2009.pdf
Porsche, L. (2010). Stadtentwicklung voller erneuerbarer Energie. Informationen zur Raumentwicklung, 9, 665-673.
Rohr-Zänker, R., Müller, W., & Fuchs, O. (2003). Regionales Entwicklungskonzept für den Landkreis Soltau-Fallingbostel (IES-Projektbericht 103/03). Hannover: Institut für Entwicklungsplanung und Strukturforschung GmbH an der Universität Hannover.
Stadtwerke Soltau (2008). EEG-Netzeinspeisung 2006 und 2007. From www.sw-soltau-net-ze.de/featureGips/Gips?Anwendung=EnWGKnotenAnzeigen&PrimaryId=7717&Mandantkuerzel=SW-Soltau&Navigation=J (14.10.2008)
SWE (2007). EEG im Netz 2007. Emden: Stadtwerke Emden. Leaflet handed out during an interview.
SWE (2009). Regenerative Energien. From www.stadtwerke-emden.de/index.php?page=reg_ energien (18.05.2009)
Stadt Emden (2008). Standorte mit Leistungsangabe von Windkraftanlagen im Stadtgebiet Emden (Stand 15.05.2008) (Anfrage der Fraktion „DIE LINKE“ vom 05. April 2008). Emden: Stadt Emden.
Stadtwerke Soltau (2007). Geschäftsbericht 2006. Soltau: Stadtwerke Soltau.
27
PROCEEDINGS Conference MPDES 2011
An Analytical Model for Small-Scale Rural Bioenergy Systems
Mirco Gaul ([email protected]) Technische Universität Berlin
Institute for Energy Engineering and Centre for Technology and Society, Sekr. WF 1. Fasanenstr. 90, D - 10623 Berlin, Germany
Abstract The strong international growth of agrofuels in the last decade brought the interest in bioenergy back on the agenda. While rural areas are typically highly dependent on bioenergy and have at the same time the largest biomass potentials, most approaches focus on large-scale production and processing of biomass for the energy demand of urban areas. This paper presents an analytical model for rural bioenergy supply pathways, which supports a simplified and manageable small-scale bioenergy planning. To this aim, different supply pathways are quantitatively compared by their conversion and cost efficiency to analyse technological feasibility and economical viability. The focus lies on the three basic rural service categories of lighting, cooking and motive power. Additionally, a set of criteria is developed to qualitatively discuss other effects on rural livelihood. The methodology is applied to a Jatropha project on the Indonesian island Sumbawa. Results of the quantitative and qualitative analysis are combined to evaluate different energy supply pathways. The paper concludes with a discussion of the proposed methodology. Keywords: Rural energy supply, energy analysis, cost analysis, livelihood impacts, lighting, cooking, motive power, Jatropha, Indonesia
Introduction Rural energy supply in developing countries remains a major challenge for both electrical and non-electrical energy services. Latest data confirm the slow decrease of the number of people without access to electricity from 1.6 billion in 2002 to 1.4 billion today and an expected 1.2 billion in 2030 while the number of people relying on the traditional use of biomass for cooking, heating and lighting is still increasing together with the global population from 2.4 billion in 2002 to 2.7 billion today and an expected 2.8 billion in 2030 (IEA, 2002 & 2010). In any case, there remains a substantial gap between the objective to reach universal energy access by 2030 (AEGCC, 2010) and the business as usual scenario of the IEA. Due to the population increase, particularly in developing countries, the share of bioenergy in the continuously growing global energy demand remained stable at 10% in the past decade. Of this global bioenergy consumption, the share of so-called “modern bioenergy and biofuels” is only 10%, while the remaining 90% comprise traditional use in rural areas where bioenergy often makes up over 90% of the total energy demand (WBGU, 2009). These rural areas are typically characterized by a weak infrastructure set-up in terms of health care, education, sanitation, transportation, etc. Alongside firewood and dung, kerosene and candles are traditional fuels for cooking and lighting, whereas liquefied petroleum gas (LPG) and electricity are often unavailable or cost-prohibitive for most of the rural
population. The burden of firewood and dung collection for cooking rests mainly on women and female children, who at the same time are most affected by the indoor air pollution caused by inefficient stoves and open cooking fires. Worldwide, almost two million deaths annually from pneumonia, chronic lung disease, and lung cancer are associated with exposure to indoor air pollution resulting from cooking with biomass and coal. Of these deaths, 99 % occur in developing countries (Legros et al., 2009).
As it is widely accepted, that even for the coming decades large parts of rural population will not be connected to central power grids or fossil fuel logistic chains (Reiche et al., 2000), the development of decentralized rural energy systems using local renewable resources has come into greater focus. Renewable energy technologies (RET), increasingly employed in the rural context, include small and micro hydro power turbines, solar home systems (SHS), biogas digester, and improved stoves (Sawin, 2010). Biomass remains the primary energy source for cooking and heating in rural as well as many urban areas. Due to growing populations and the subsequent rise in land, water and energy demand, urban and rural settlements and their energy systems have in many areas increased the pressure on local resources. While natural firewood resources diminish with growing speed, the regions concerned are now faced with varying degrees of environmental stress. Although wood clearance for new agricultural land (and not for firewood) is in many areas the driving factor for deforestation, soil erosion and desertification, the growing firewood demand can often not be fulfilled with the shrinking wood resources (WEC/FAO, 1999). The ongoing debate on how to improve traditional biomass use and strategically develop bioenergy potential in developing countries (Meyer, 2001) (Karekezi et al., 2004) has been further sharpened in the last decade when the demand for bioenergy and biomass increased globally as a consequence of public policies of industrialised countries in the context of climate change and energy security (Sagar, 2007).
Modern energy supply is often considered an enabling factor for regional development, especially in rural areas were the missing access to efficient energy services is seen as a bottleneck to enhance services in basic infrastructure, education and health, as well as to increase productivity and local value creation (ESMAP, 2003; Modi et al., 2006; Practical Action, 2010). However, in reverse it can be stated that energy has no value in itself but that the value rather depends largely on its integration into rural livelihood frameworks and activities (WEC/FAO, 1999).

28
PROCEEDINGS Conference MPDES 2011
Research ObjectivesThe present research analyses how specific local energy supply pathways can be methodically analysed to optimize the energy conversion and cost efficiency without losing track of other important livelihood impacts. The technical and financial feasibility of a complete small-scale Jatropha System1 for the local energy demand on the Indonesian island Sumbawa has been selected as a case study. Interviews were conducted during a project visit in February 2010, both with experts from government and the private sector, as well as with farmer groups in 10 villages that grow and process Jatropha seeds. The aim of the research is to analyse and compare the Jatropha-based supply pathways with existing or realistic alternatives. To that end, first a baseline scenario and a competitive RET scenario were defined as benchmarks. Then, three different Jatropha scenarios were developed, focussing on the household, village or region as scale and production unit. All five scenarios are first evaluated and compared regarding their energy and cost efficiencies2 before other external effects and livelihood impacts are discussed.
Methods The present analysis follows a life cycle approach and uses the life cycle analysis programme and database GEMIS 4.6 (Oeko Institut, 2010). However, following the ISO 14040 terminology, only a life cycle inventory analysis (LCI) is conducted in the quantitative analysis focussing on energy and costs without covering environmental aspects or conducting a full life cycle impact assessment (LCIA). In a second step, externalized effects of the energy supply pathways will be qualitatively discussed with respect to their impact on rural sustainable livelihood. Subsequently, the approach and proceeding will be presented in detail.
System definition For the conceptual definition of a rural bioenergy system, the built infrastructure system model of Vanek (2008) is combined with a general energy system and energy supply sector model (Nakicenovic, 1996) as shown in figure 1. The model distinguishes between an institutional (the energy service delivery model) and a technical (the energy
1 The expression Jatropha System has been introduced
beside others by R. Henning (2004) based on experiences made in the early 90ies in Mali. Even though Jatropha has already been planted as oil producing scrub a century ago, systematic research has just started during the last two decades and got momentum only in the last two years. WorldCat lists a current number of 1495 scientific journal articles on Jatropha of which only one third has been published before 2007 while 729 articles have been published only in 2009 and 2010 (WorldCat.org, 2010). Heller (1996), Gübitz et al. (1997) and Jongschaap (2007) provide good overviews on plant characteristics, cropping and processing, while the GEXSI study of 2008 collects global data on Jatropha projects and activities. The Dutch FACT foundation (FACT 2010) serves as a network for research and project activities on small-scale Jatropha development.
2 The LCA analysis will be presented in detail at the Third International Conference on Applied Energy, 16-18 May 2011 in Perugia, Italy, therefore only the results are introduced.
conversion pathway) dimension and separates the latter into four core sub-systems: (1) the extraction/production of a primary energy carrier, (2) the conversion to a secondary energy carrier, (3) the distribution of the final energy and (4) the end-use of the useful energy. At the institutional level, all technical sub-systems require appropriate delivery models covering ownership, management, financing, operation and maintenance (O&M), etc. Inputs of this system are all kinds of physical resources and information required for the energy transformation process. The outputs are the energy services, which again consist of physical and informational goods and services. The system boundaries are narrowed for the energy and cost analysis (as shown with the dotted line in figure 1), taking the primary energy carrier as input and the useful energy as output. For the discussion of livelihood impacts the system boundaries cover both the energy supply pathway and the service delivery model as the institutional model3 influences the livelihood impacts as discussed in chapter 4.2 on external effects. The analysis follows a service perspective based on the assumption that despite the high complexity and diversity of rural settlements, the energy service demand and the related end-use in remote rural areas follows a clear pattern of three main service categories:
(1) lighting, (2) cooking, and (3) motive power for machines and transport4. To evaluate the efficiency of bioenergy use, a comparative approach is followed which includes a baseline scenario and a competitive RET scenario. Efficiency and cost indicators are levelized to the useful energy output which is, in the case of lighting, the luminous flux; in the case of cooking the heat that enters the cooking pot; and in the case of motive power, the power on the shaft. Table 1 provides an overview of the selected end-use technologies of the analysis.
LCA for agrofuels in general and for Jatropha in particular, mainly focus on the sole production of liquid fuels, possible by-products and the related land-use impact and GHG emissions(UNEP, 2009) (Reinhardt, 2007). The present analysis compares Jatropha-based and other local energy supply pathways by its energy and cost performance to provide useful energy in the three categories of lighting, cooking and motive power. The functional unit for this analysis is consequently the provided unit of useful energy that will be defined as one kilowatt hour (kWh) for cooking energy and motive power, and one kilolumen5 hour (kLmh) for lighting.
3 The issue of institutional service delivery models for
bioenergy cannot be fully addressed in this context. A good introduction and illustrating case studies have been provided by Practical Action (Practical Action Consulting, 2009a & 2009b), and by de Vries et al (2010).
4 The provision of electricity and electrically-powered information and communication technologies such as mobile phones or TVs are not addressed by this analysis approach.
5 Traditionally, the power of a light bulb has been specified using the unit 'watt' to describe the total radiant flux (light and heat combined), but not its performance as light source. Recently, the luminous flux (measured by the unit lumen) is increasingly used as it describes only the visible share of the radiation of a light source.

29
PROCEEDINGS Conference MPDES 2011
Figure 1: Definition of the balance area
Table 1: End-use oriented framework of supply pathways
Scenario Cooking Lighting Motive power
Baseline Wood stove Kerosene lamp Diesel motor
Jatropha Plant oil & biogas cooker Plant oil & biogas lamp Plant oil, biodiesel & biogas motor
Alternative RET Solar & improved wood stove LED solar lamp Hydro turbine
Energy analysis The present analysis uses four parameters to characterize the energy system. In a first step, the cumulated fossil and non-fossil energy demand (CED) for the provision of one unit of useful energy is calculated. In figure 1, the CED is divided into the primary energy input EPri and the required amount of auxiliary energy EAux, typically in the form of electricity or fuels. In a second step, building on the levelized unit of useful energy output EUse, the Gross (GER) and Net Energy Ratio (NER) as well as the Net Energy Balance (NEB) are defined as shown in figure 1 and formulas 1-3.
GER=EUse
EPri+EAux (1) NEB= EFin− EAux ⋅ηUse (2)
NER= NEBEPri (3) The GER describes the efficiency of a conversion
process, but does not reflect the different qualities of the primary energy input and the auxiliary energy. The NEB provides the difference of energy output and auxiliary energy and therefore reflects the fact that the auxiliary energy needs to be provided additionally (again causing losses in the conversion from primary energy). Because the compared systems provide different types of useful energy, for the calculation of the NEB, the auxiliary energy EAux is subtracted from the final energy EFin instead of the useful energy output. The difference is then multiplied by the efficiency of the end-use appliance (formula 2). As a combination of both approaches, the NER can be calculated as a ratio of NEB to energy input and reflects the real energy efficiency of the conversion process.
Cost analysis To simplify the cost analysis it is assumed that the whole investment is done in the year zero and both annual costs and supplied useful energy per year can be assumed to be stable over the project life time. In this case the NEC can be directly calculated by dividing the capital, fuel, transport, input, and labour costs by the annually supplied useful energy (formula 4 and 5):
NEC=CCap+CFuel+CTra+C Inp+CLab
EUa (4)
CCap=CInv⋅d1+d n
1+d n− 1 (5) In rural areas, one of the most controversial costs are
labour costs for a population that lives from subsistence farming, some cash crops, and occasional daily labour. At the same time labour cost represents the largest cost-share in labour intensive process chains in rural areas. For the present analysis typical local salaries for rural daily workers have been identified in interviews to be approx 1.95€ per man-day (md) and cross checked with statistical data on the rural poverty line of Sumbawa Island (about 12,83€ per person and month in 2009 (BPS, 2009)). Considering the average household size of 3.95 person in rural Sumbawa and the fact that only one family member is working, the required daily income (with 25 working days per month) would be 2.03€ just to reach the poverty line6. The assumed labour cost of 1.95€ per man-day therefore seems already in the lower range and a
6 The current data for rural Sumbawa in 2010 has not
been available, but if the general increase of the rural poverty line of Indonesia of about 7% compared to 2009 (BPS, 2010) is also applied to Sumbawa, the required income per man-day for 2010 would increase to 2.17€.

30
PROCEEDINGS Conference MPDES 2011
calculation with lower values would risk a negative development impact.
However, as an alternative, the return on labour (ROL) of an energy supply pathway is defined as the difference between the annual net energy costs without labour costs (ANECExL) and the annual NEC of the baseline scenario (ANECBase), divided by the annual labour demand (ALD) in man-days as shown in formula 6.
ROL=ANECBase− ANECExL
ALD (6) The ROL shows in how far the savings of the bioenergy
supply pathway justify the labour investment for the rural farmer in comparison to the energy baseline system.
External effects The quantitative analysis focuses only on energy and costs of a narrowed balance area of the local energy system. Other effects have thus far been 'externalized'. There is an ongoing debate on social and environmental standards for agrofuels mainly in the context of international trade (Fritsche et al., 2006) and e.g. European countries are obligated by the EU regulation 2009/28/EC to implement sustainability standards for the promotion of bioenergy. The evaluation of direct and indirect land use effects remains a major issue in this context. For the present approach, all occurring externalized effects are separated into the following three groups (compare also with figure 1):
1. Downstream impacts from the energy services such as lighting, cooking or motive power are not evaluated as it is assumed that they will equally occur for all levelized energy service units. In other words, for the impact of cooking on the local nutrition level, for example, it does not matter if the heat in the pot is provided by a wood, kerosene or solar stove as long as services are equally reliable.
2. Upstream impacts are caused by resource extraction and production of primary energy carriers that can have both positive and negative economical, social and environmental effects. Most prominently in this context, is the aspect of resource competition, of which two types need to be distinguished: (a) resource competition for land, water, capital etc. and (b) resource competition for the identified biomass potential and its use as food, fodder, fibre, feed, fertili e r, fuel, or for finance (the “7Fs”proposed by osillo Call ( osillo Call , 2007)). The evaluation of upstream impacts needs an interdisciplinary and multi-sectoral approach and has to be conducted in addition to the analysis of the energy supply pathways.
3. Process effects occurring during the energy conversion, distribution or end-use that are not quantified as cost or energy value. These effects include many aspects like comfort and safety, health impacts, etc. and strongly influence the viability of a technological energy supply pathway.
For the present analysis, only the last group of process effects will be included in the analysis model because the
case study consists of an extensive Jatropha cultivation kept as living fences without any direct or indirect land use competition and without the use of any agrochemicals. The criteria shown in table 2 therefore represent only aspects relevant for externalized effects of the conversion, distribution, and end-use.Studying impacts of small-scale bioenergy systems, the direct impacts on the rural livelihood are the main focus. The Sustainable Livelihood Framework (SLF) has been introduced by Chambers and Conway (Chambers & Conway, 1992) and further developed (DFID, 2003) to act as a conceptual framework for rural development strategies and activities. It has also been used in the context of rural energy supply (IDS, 2003; Bates et al., 2009). For a systematic collection of livelihood impacts, the five livelihood capitals (listed in the first column of table 2) of the SLF are used as main categories to identify positive and negative impact categories and criteria. The criteria have been used during interviews and field visits to structure the observed livelihood impacts.
Results The five different scenarios describe three baseline pathways (3-stone fire, kerosene lamp, and diesel motor) and four alternative RET pathways (solar stove and improved stove, solar LED lamp, and hydro power turbine) as shown in table 3.
The three Jatropha scenarios on household (HH), village (VI) and regional (RE) level together define 13 pathway configurations (for plant oil and biogas stoves, lamps, and motors).
In figures 2-6 the results for both the present case and for a 'best case' are summarized. The present case is characterized by the specific Indonesian rural framework conditions: high capital costs (interest rate of 16.8%7), low costs for subsidized fossil fuels (0.43-0.62€ per l), low efficiency of manual Jatropha harvest and pressing (30 kg picked fruits or 2 litre plant oil per 8h labour input), as well as of the end-use appliances (stoves, lamps and motors). For the best case, an interest rate of 5% and fuel prices of about 1€ per litre kerosene and diesel have been assumed, while the harvest and pressing rates have been doubled and the efficiency of stoves and motors has been increased. The present case is indicated in the figures with grey bars, while the best case is indicated by black bars.
7 It is difficult to define a 'rural' interest rate. The value
of 16.8% is corrected for inflation and calculated as an average of rural and national interest rates for different sectors that are published on a monthly basis by the Bank of Indonesia (Bank of Indonesia, 2010).

31
PROCEEDINGS Conference MPDES 2011
Table 2: Criteria for process-related livelihood impacts
Livelihood asset Category Criteria
Human capital HC 1. Health HC 2. Safety HC 3. Comfort HC 4. Work skills
HC 1.1 (Indoor) air pollution caused by lighting and cooking fuels HC 2.1 Extraction and conversion machines and processes HC 2.2 Fuel transport and distribution grids HC 2.3 End-use appliances (lamps, stoves, and machines) HC 3.1 Ease of use, drudgery; time saving HC 4.1 Creation or loss of qualified jobs
Financial capital FC 1. Income and savings FC 2. Credit
FC 1.1 Increase/decrease of value adding, income and costs FC 1.2 Increase/decrease of savings and costs FC 2.1 Credit barrier and investment risk
Natural capital NC 1. Emissions and waste
NC 1.1 Emissions during operation NC 1.2 Waste disposal from machines and appliances
Physical capital PC 1. Local infrastructure PC 1.1 Increase in assets/infrastructure like machines
Social capital SC 1. Networks, organizations, relationships
SC 1.1 Increased/decreased sense of community SC 1.2 Increased organizational and institutional capacity
Table 3: The 20 analysed energy supply pathways
Scenario Cooking (7 pathways)
Lighting (5 pathways)
Motive power (8 pathways)
Baseline (3 pathways) (1) Wood stove (1) Kerosene lamp (1) Diesel motor
Jatropha (13 pathways)
(2) Plant oil stove (HH, VI) (2) Biogas stove (HH)
(2) Plant oil lamp (HH, VI) (1) Biogas lamp (HH)
(3) Biodiesel motor (HH, VI, RE) (1) Plant oil motor (VI)
(2) Biogas motor (VI, RE)
Alternative RET (4 pathways)
(1) Solar stove (1) Improved wood stove (1) LED solar lamp (1) Hydro turbine
Energy and cost analysis In figure 2, the Cumulated Energy Demand is displayed (kWh/kLmh in the case of lighting). The four baseline scenarios have a CED between 3 kWh (kerosene stove), 5 kWh (3-stone fire), and 8.8 kWh (diesel motor) per supplied kWh useful energy, and 11.7 kWh (kerosene lamp) per supplied kLmh light. While the CED of the 3-stone-fire can be considered as renewable (as long as the wood resources are sustainably used) the kerosene and diesel CED are almost 100% fossil. Comparing the supply pathways of the baseline with the three Jatropha scenarios, the steep increase of CED is the most obvious difference. The total CED of the Jatropha supply pathways for cooking is 3-4 times higher compared to the 3-stone fire and 4-7 times higher compared to the kerosene stove. This ratio increases to 6-8 in cases of motive power, while in the category of lighting only the plant oil lamp has a roughly 7 times higher CED than the kerosene lamp, while biogas lamps remain slightly below the baseline. If only the fossil CED is considered, the picture changes in favour of the Jatropha supply pathways. However, all four competitive RET pathways show significant lower values
for both renewable and fossil CED than the Jatropha-based pathways. The increased fuel demand for machines and transports accumulates to significant fossil CED values, especially for biodiesel production where the fossil CED reaches 5.7 kWh, which is 64% of the diesel motor baseline value.
In figure 3, the NEB is displayed in kWh (kLmh in the case of lighting). Analysing the NEB values, we can see that these high values of fossil CED are especially of concern because they represent a high share of auxiliary energy and consequently reduce the NEB. The kerosene and diesel-based baseline pathways still have a NEB of about 0.85 (while the 3-stone fire has a NEB of 1 as no auxiliary energy is involved in the manual wood-fuel chain). We can see that with plant oil-based supply pathways the NEB can be further increased if the processing is mainly manual (HH and VI), while the regional and especially the biodiesel pathways have a lower NEB. Biogas has a lower NEB than comparable plant oil pathways, because of the cumulated auxiliary energy demand of the concrete digester, even though the NEB of biogas is reduced due to the allocation of plant oil as by-product.

32
PROCEEDINGS Conference MPDES 2011
Figure 2: Cumulative energy demand
Figure 3: Net Energy Balance
In the 'best case' the CED for cooking and motive power is decreased, while there is little impact on the NEB. In the following figure 4 the Net Energy Ratios of the 20 pathway configurations are displayed in kWh/kWh (kLmh/kWh in the case of lighting). The gross energy ratio has not been displayed as it shows a similar characteristic with only slightly higher values. The baseline pathways have NER of 0.2, 0.08, and 0.11 for cooking, lighting and motive power respectively. All Jatropha-based supply pathways have very low NER even compared to the already low baseline values. The single exception is the use of biogas for lighting, caused by the 7.5 times higher luminous efficiency of biogas lamps compared to kerosene wick lamps. Because a high efficient LED has a 1000 or 133 times higher luminous
efficiency as a kerosene wick lamp or biogas lamp respectively, the NER in kLmh/kWh of the solar LED lamp is therefore as high 9.6. The results are not significantly changed in the 'best case'.
In figure 5 the NEC is presented in €/kWh (€/kLmh in the case of lighting). Energy costs per year and per kWh are proportional as longs as the annual supply is levelized. However, due to technological constrains not all pathways can provide equal supply. In the category of cooking all stoves provide 1500 kWh/a “heat in the pot”, while the solar stove provides only 365 kWh/a. The kerosene and plant oil lamps provide 88 kLmh/a, while the solar LED and the biogas lamp provide 185 and 1480 kLmh respectively.

33
PROCEEDINGS Conference MPDES 2011
Figure 4: Net Energy Ratio
Figure 5: Net energy costs
In most cases Jatropha-based supply pathways more than double the costs compared to the baseline. Only biogas-based lighting shows a cost-saving potential per kLmh, while - due to the sixteen times higher luminous flux compared to kerosene lamps - the annual costs are also ten times higher and far above the baseline. For plant oil and biogas motors the increase of the specific costs is still in the range of 50% and might be compensated by increasing diesel prices in the near future. The alternative RET supply scenarios all have lower NEC per kWh.
All presented NEC include labour costs of 1.95€ per man-day8. In figure 6 the return on labour is shown for all supply pathways in €/md. The OL for lighting and motive power are calculated based on the avoided ANEC
8 For qualified labour (e.g. at the biodiesel factory) the
salary is doubled to 3.90 €/md.
of the kerosene lamp and diesel motor respectively, while for cooking the avoided ANEC of a kerosene stove is used instead of the 3-stone fire (which has no costs besides labour). As the kerosene stove is used only by a small fraction of the rural population, the results of ROL have to be interpreted with care. Of the Jatropha-based supply pathways only the biogas lamps have a ROL above the benchmark of 1.95€/md. Of the other pathways only the plant oil and biogas motor pathways reach at least 50-75% of the benchmark. It can be seen that especially the labour intensive pathways HH have a very low return on labour. In the category cooking, the improved stove shows the highest ROL, while for lighting and motive power the alternative RET pathways of solar LED lamp and hydro

34
PROCEEDINGS Conference MPDES 2011
Figure 6: Return on labour
power have no or a negligible labour intensity and consequently no ROL.
In the 'best case' the NEC decreases strongly resulting in a significant increase of ROL. The strongest impact can be observed in the category of lighting, where now even the plant oil lamp can compete with the kerosene baseline. However, the solar LED lamp remains by far the most attractive alternative for lighting. In the category of cooking, the village based plant oil pathway VI becomes competitive compared to a kerosene stove, but not to wood cooking. Moreover, both solar and improved stoves remain the most attractive options in this category. In the category of motive power all village and region-based Jatropha pathways become competitive compared to the baseline both in NEC and ROL. However, hydro power is the more attractive option if available and the high CED remains a problem, especially for the biodiesel pathways with NEB below 0.5.
External effects Subsequently, the external process effects of the different energy supply pathways are qualitatively discussed based on observations and results of the conducted interviews and field visits. The impact on the developed livelihood criteria are marked for their influence on rural livelihood in table 4.
Human capital The main impact in the category health (HC 1) can be attributed to indoor air pollution (IAP), which has been identified by the WHO as one of the main drivers of respiratory diseases that cause about 2 million deaths in developing countries annually. IAP is mainly caused by solid fuels that are burned incompletely and without a chimney (3-stone fire) causing high concentration of carbon monoxide and particulate matter. These emissions can be reduced by more than a factor of five by the appropriate use of an improved stove (MacCarty, 2010)9.
9 MacCarty also shows that many stove designs in use
does not reach such positive reduction factors.
The emissions of kerosene or plant oil stoves are far less researched. They can be assumed to be significantly lower than for solid stoves, even though particularly for kerosene wick stoves relevant emissions of particulate matter can be expected. Biogas stoves have the lowest emissions of the fuel burning stoves, while the solar stove produces no emissions at all.
Considering the safety of extraction/conversion (HC 2.1), distribution (HC 2.2) and end-use HC 2.3, the fossil fuel chain bears a risk to workers on oil platforms, tank ships and trucks or filling stations, while the firewood processing can be considered as relatively safe. However, open cook-fires are major causes of household accidents, but this can be improved by the stove design. For Jatropha the manual and local processing bears a low risk of accidents, while a regional model includes more transport and mechanised processing, and in case of biodiesel conversion the handling of large machines and chemicals such as methanol. Solar stoves show high safety, while for solar LED lamps only the production (and disposal) of solar cells and accumulators can be considered as potentially harmful industries. Micro hydro power plants without dams show comparable low safety risks.
The category comfort (HC 3) combines aspects such as the ease of use of appliances, the reduction of drudgery, and time saving. The advantage of kerosene stoves compared to wood cooking (especially during raining season) has often been stated in interviews. An improved stove can reduce the firewood demand and increase the comfort, but it can also increase the labour for wood processing, as often smaller wood pieces are required. The labour intensity of Jatropha harvest and processing exceeds the required labour for wood cooking in case of the household scenario. On the other hand, the more mechanised processing of the village or regional scenarios is transformed into an income generating activity, even though the income for Jatropha harvest remains low. The use of plant oil and biogas cookers is equally comfortable as kerosene cooking. A solar LED lamp shows a high degree of comfort, while a solar stove requires a complete adaptation of cooking habits. The hydro power turbine

35
PROCEEDINGS Conference MPDES 2011
also shows a high potential for reduction of drudgery and time saving.
Regarding work skills (HC 4), most energy supply pathways have little impact on the creation or loss of qualified jobs (the downstream impacts of productive use are not included here). The largest impact can be expected from the village-based Jatropha scenario, as many farmers are involved in the local value-adding process.
Financial capital In the category income and savings (FC 1), most supply pathways have low value creation or income potentials, while the labour intensive wood fuel and household-based Jatropha pathways can be considered as negative. This is, because they claim labour time that could be invested in other activities, while only the village-based Jatropha scenario provides local value adding potential for a significant share of the farmers. Only the alternative RET pathways can significantly reduce the energy costs, but also require higher initial investments that pose serious credit barriers and risks (FC 2.1) especially in case of hydro power and village-based Jatropha processing. At the same time, increases the successful management of present credit risks also the future access to further financing.
Natural capital Emissions (NC 1.1) that occur during the operation are mainly relevant in their GHG potential or other negative impacts on air, water and soil quality. While fossil fuels have a clear negative impact, all alternative RET pathways show no direct emissions at all. In the case of Jatropha-based scenarios it depends on in how far fossil fuels are involved in the processing (not for the HH, but increasingly for the VI and RE scenarios) and what emission flows exist during processing (negligible for HH scenarios, but significant in the case of waste water from biodiesel production). Waste disposal of used machines and appliances (NC 1.2) is mainly an issue for the more industrialised fossil fuels and the biodiesel production. However, the solar LED lamp and the solar stove also contain problematic materials for accumulators or insulation.
Physical capital The impact of energy supply pathways on local infrastructure (PC 1) is difficult to grasp. In the present context, mainly the local increase in capital-intensive motive power machines is considered a qualitative impact on local infrastructure.
Social capital While most supply pathways and appliances are household-based, only the hydro power turbine and the village-based Jatropha scenario are community-oriented and, regardless which type of business model is applied, require a certain degree of social cooperation. A positive impact on the sense of community (SC 1.1) and the institutional capacity (SC 1.2) can mainly be observed for
these supply pathways10. On the other hand, the selected dissemination of household-based end-use appliances can increase the relative sense of poverty for households that cannot participate in this process. Subsequently, table 4 shows a ranking with the values positive (+), neutral (o), and negative (-) for the selected livelihood impact criteria.
Discussion The presented results of the energy and cost analysis paint a sobering picture of the technical and financial feasibility of a small-scale Jatropha-based energy system for rural areas. A low energy efficiency of the Jatropha supply chain, together with high labour intensities, result in high costs and a low return on labour for many of the studied supply pathways. Jatropha-based supply chains therefore cannot compete with wood-based cooking as long as the supply of firewood can be covered locally. In the case of lighting, some Jatropha supply pathways can compete with kerosene lighting, but current developments in LED lighting show a far higher potential in terms of energy and cost efficiency. Only Jatropha-based motive power shows a potential in the energy and cost analyses, especially in areas with insufficient hydro power potential. While the household-based Jatropha pathways fail the economic analysis because of a prohibitive low return on labour, regionally- and biodiesel-oriented pathways show a low energy performance as the NEB is significantly reduced with growing auxiliary energy input. Village-based Jatropha pathways might be an energy and cost efficient strategy, but a careful analysis and design of the supply pathways is required in any case to avoid inefficient configurations.
The analysis of externalised effects shows negative impacts on different livelihood capitals for both baseline pathways; for the fossil fuels mainly on financial and natural capital and for the 3-stone fire mainly on human capital. For Jatropha-based energy supply pathways, the household scenario mainly fails in financial and comfort aspects with little scope for improvement. The regional biodiesel scenario fails for environmental impacts in terms of emissions and waste, the first of which could be improved by the use of biofuels as auxiliary energy (significantly increasing the CED), while the latter could be addressed by improved waste management that would also increase the costs. The main drawback of the village-oriented scenario is the credit barrier and the risk of such a high investment that needs to be carefully addressed with the institutional delivery model design. All alternative RET pathways show equally good results, but also some characteristic negative impacts as the waste
10 In the case study on Sumbawa, which currently
represents the regionally-oriented Jatropha scenario, a local cooperative for the organisation of seed sales to the biodiesel factory has been set up. This cooperative surely signifies an increase of the social capital of the farmers, even though this impact would strongly increase if the cooperative would also manage a village-based Jatropha supply pathway.

36
PROCEEDINGS Conference MPDES 2011
Table 4: Overview on livelihood impacts
Livelihood Baseline Jatropha system Alternative RET
Criteria Fossil fuel
Wood fire
HH VI RE Solar LED
Solar stove
Improved stove
Hydro power
HC 1.1 Indoor air pollution o - o o o + + o +
HC 2.1 Safety of extraction/conversion HC 2.2 Safety of distribution HC 2.3 Safety of end-use
o o o
+ + -
+ + o
+ + o
o o o
o + +
+ + +
+ + o
+ + +
HC 3.1 Ease of use, drudgery, time saving + - - o o + - - +
HC 4.1 Creation or loss of qualified jobs o o o + o o o o o
FC 1.1 Value adding, income FC 1.2 Energy costs
o -
- +
- -
+ o
o -
o +
o +
- +
o +
FC 2.1 Credit barrier and risk + + o - o o o o -
NC 1.1 Emissions NC 1.2 Waste
- -
+ +
+ +
o o
- -
+ -
+ -
+ +
+ +
PC 1.1 Increase in assets/infrastructure + o o + o o o o +
SC 1.1 Sense of community SC 1.2 Increased institutional capacity
o o
o o
o o
+ +
o o
o o
o o
o o
+ +
disposal for the solar technologies, limited comfort for solar and improved stove and the high credit barrier and investment risk for hydro power.
Conclusion The two step analysis of energy and cost efficiency and livelihood impacts revealed some serious weaknesses of Jatropha-based energy supply pathways but also showed the direction for possible improvement. Village-oriented Jatropha processing for the provision of plant oil and biogas for local use in motors could become an energy and and cost-efficient as well as a sustainable energy supply option. However, a careful further investigation of Jatropha energy supply pathway design and alternatives, including also institutional aspects, has to be conducted. The applied methodology has been adequate to provide a primary assessment of optional
pathway configuration without becoming prohibitively cost and time consuming. However, the first analysis in a given country framework remains demanding as especially fossil supply chains are complex to assess. The replication for a similar project can then be done far more easily. For a more in depth investigation of a specific supply pathway, can the disaggregated LCI can also provide important insights into the sub-systems of the supply pathways. For a more comprehensive analysis of livelihood impacts, the upstream effects of resource extraction should be included, building on preceding multi-sectoral assessments. A weighting and prioritisation of the livelihood analysis (using approaches such as multi criteria decision analysis (Diakoulaki et al., 2005)) could be the next step in a participatory planning process.
NomenclatureAGECC: Advisory Group on Energy and Climate Change ALD: Annual labour demand [md/a] ANECBase: Annual net energy costs of the baseline [€/a] ANECExL: Annual net energy costs without labour [€/a] CBA: Cost-Benefit Analysis CED: Cumulated Energy Demand CCap: Annual capital costs [€/a] CFuel: Annual fuel costs [€/a] CInp: Annual input costs [€/a] CInv: Initial investment costs [€] CLab: Annual labour costs [€/a] CTra: Annual transport costs [€/a] d: Real discount rate (corrected for inflation) [%] EAux: Total auxiliary energy input [kWh] EFin: Supplied final energy to the end-use process [kWh] EPri: Total primary energy input [kWh] EUse: Levelized useful energy output [1 kWh or 1 kLmh] EUa: Annual supplied useful energy [kWh/a] GER: Gross Energy Ratio [kWh/kWh or kWh/kLmh]
GHG: Green House Gases IDR: Indonesian rupiah IEA: International Energy Agency kLmh: Kilolumen hour, unit for the luminous flux kWh: Kilowatt hour, unit to measure power LCA: Life Cycle Assessment LCIA: Life Cycle Impact Assessment LCI: Life Cycle Inventory Analysis LED: Light Emitting Diode LPG: Liquefied Petroleum Gas md: Man-day, unit for the labour demand (approx. 8h) n: lifetime of the project [a] NEB: Net energy balance [kWh or kLmh] NEC: Net Energy Cost [€/kWh] NER: Net Energy Ratio [kWh/kWh or kWh/kLmh] RET: Renewable Energy Technology ROL: eturn on Labour [€/md] SHS: Solar Home System ηUse: Efficiency of the end-use appliance

37
PROCEEDINGS Conference MPDES 2011
Acknowledgements The research presented was supported by a grant from the Hans Böckler Foundation, Germany and was carried out within the postgraduate school „Micro-Energy Systems for the Decentralized, Sustainable Energy Supply in Structurally Weak Areas‟ hosted at the Centre for Technology and Society, Technische Universität Berlin.
The case study has been conducted in February 2010 on Sumbawa, Indonesia with the kind support of Dr. Tatang H Soerawidjaja of the Institut Teknologi Bandung and Mr. Ibrahim Syaharuddin, the project owner.
References AEGCC. (2010). Energy for a sustainable future:
summary report and recommendations. Vienna: Secretary-General's Advisory Group on Energy and Climate Change (United Nations).
Bank of Indonesia. (2010). The Indonesian Banking Statistics (SPI) - February 2010. Retrieved from http://www.bi.go.id/web/en/Statistik/Statistik+Perbankan/Statistik+Perbankan+Indonesia/spi_0210.htm
Bates, L., Hunt, S., Khennas, S., & Sastrawinata, N. (2009). Expanding Energy Access in Developing Countries - The Role of Mechanical Power. Warwickshire: Practical Action Publishing Ltd.
BPS. (2009). Trends of the Selected Socio-Economic Indicators of Indonesia (No. 03230.0902). Jakarta: Badan Pusat Statistik – Indonesia. Retrieved from http://www.bps.go.id
BPS. (2010). BPS-Statistics Indonesia - Strategic Data 2010 (No. 03220.1002). Jakarta: Badan Pusat Statistik – Indonesia. Retrieved from http://www.bps.go.id
Chambers, R., & Conway, G. (1992). Sustainable rural livelihoods: practical concepts for the 21st century. Discussion Paper 296. Brighton: Institute of Development Studies. University of Sussex.
DFID. (2003). Sustainable livelihoods: guidance sheets. London: Department for International Development.
Diakoulaki, D., Antunes, C. H., & Martins, A. G. (2005). MCDA and energy planning. In Multiple Criteria Decision Analysis: State of the Art Surveys (pp. 859-898). New York: Springer Science Business Media Inc.
ESMAP. (2003). Energy and Poverty: How can Modern Energy Services Contribute to Poverty Reduction? Energy Sector Management Program. Retrieved from www.worldbank.org/external/default/WDSContentServer/WDSP/IB/2004/07/21/000009486_20040721162559/Rendered/PDF/ESM266.pdf
FACT. (2010). FACT - Fuels from Agriculture in Communal Technology - website. Retrieved December 27, 2010, from http://www.fact-foundation.com
Fritsche, U. R., Hünecke, K., Hermann, A., Schulze, F., & Wiegmann, K. (2006). Sustainability Standards for Bioenergy. Frankfurt am Main: WWF Germany.
GEXSI. (2008). Global Market Study on Jatropha. London: GEXSI LLP. Retrieved from http://www.jatropha-platform.org
G bit , G., i ttelbach, . , Trabi, . (1997). Biofuels and industrial products from Jatropha curcas. Gra Austria: Dbv-Verlag f r die Technische Universit t G ra .
Heller, J. (1996). Physic nut - Jatropha curcas L. Rome Italy: International Plant Genetic Resources Institute.
Henning, R. K. (2004). The Jatropha System – Economy & Dissemination Strategy. Presented at the International Conference for Renewable Energies 2004, Bonn Germany.
IDS. (2003). Energy, Poverty, and Gender - A Review of the Evidence and Case Studies in Rural China. Washington, D.C.: The Institute of Development Studies, University of Sussex for the World Bank Group. Asia Alternative Energy Program,
IEA. (2002). World energy outlook 2002. Paris: International Energy Agency (IEA); Organisation for Economic Co-operation and Development (OECD).
IEA. (2010). World Energy Outlook 2010. International Energy Agency (IEA); Organisation for Economic Co-operation and Development (OECD).
Jongschaap, R. (2007). Claims and facts on Jatropha curcas L. - Global Jatropha curcas evaluation, breeding and propagation programme. Wageningen: Plant Research International.
Karekezi, S., Kusum, L., & Coelho, S. T. (2004). Traditional Biomass Energy - Improving its Use and Moving to Modern Energy Use (Thematic Background Paper). Bonn, Germany: Secretariat of the International Conference for Renewable Energies. Retrieved from www.renewables2004.de/pdf/tbp/TBP11-biomass.pdf
Legros, G., Havet, I., Bruce, N., & Bonjour, S. (2009). The Energy Access Situation in Developing Countries. United Nations Development Programme. Retrieved from http://content.undp.org/go/cms-service/download/asset/?asset_id=2199031
MacCarty, N. (2010). Fuel use and emissions performance of fifty cooking stoves in the laboratory and related benchmarks of performance. Energy for Sustainable Development, 14(3), 161-171.
Meyer, R. (2001). - . Berlin: TAB.
Modi, V., McDade, S., Lallement, D., & Saghir, J. (2006). Energy and the Millennium Development Goals. New York: Energy Sector Management Assistance Programme, United Nations Development Programme, UN Millennium Project, and World Bank. Retrieved from http://www.unmillenniumproject.org/reports/rp_energy.htm
Nakicenovic, N. (1996). Energy Primer. In IPCC second assessment, climate change 1995., Scientific-technical analyses of impacts, adaptations, and mitigation of climate change, Impacts, adaptations, and mitigation (pp. 75-92). Cambridge: Cambridge University Press.

38
PROCEEDINGS Conference MPDES 2011
Oeko Institut. (2010). Global Emission Model for Integrated Systems (GEMIS) Version 4.6. Retrieved from http://www.oeko.de/service/gemis/en/
Practical Action. (2010). p ’ y O 2010. Rugby, UK. Retrieved from www.practicalaction.org/ppeo2010
Practical Action Consulting. (2009a). Energy Delivery Model Tool - web tool. Retrieved from http://practicalaction.org/consulting/pisces/
Practical Action Consulting. (2009b). Small-Scale Bioenergy Initiatives: Brief description and preliminary lessons on livelihood impacts from case studies in Asia, Latin America and Africa. Prepared for PISCES and FAO by Practical Action Consulting. Retrieved from http://www.fao.org/bioenergy/home/en/
Reiche, K., Covarrubias, A., & Martinot, E. (2000). Expanding Electricity Access to Remote Areas: Off-Grid Rural Electrification in Developing Countries. In WorldPower 2000 (pp. 52-60). London: Isherwood Production Ltd. Retrieved from http://www.martinot.info/Reiche_et_al_WP2000.pdf
Reinhardt, G. (2007). Screening Life Cycle Assessment of Jatropha Biodiesel. Heidelberg Germany: IFEU - Institute for Energy and Environmental Research Heidelberg GmbH. Retrieved from http://www.ifeu.de/english/index.php?bereich=lan&seite=jatropha
osillo Call , F. (2007). The biomass assessment handbook: bioenergy for a sustainable environment. London: Earthscan.
Sagar, A. (2007). Bioenergy and Sustainable Development? Annual review of environment and resources., 32, 131.
Sawin, J. (2010). Renewables 2010: global status report. Paris: Renewable Energy Policy Network for the 21st Century.
UNEP. (2009). Towards sustainable production and use of resources : assessing biofuels. Paris: United Nations Environment Programme.
Vanek, F. (2008). Energy systems engineering: evaluation and implementation. New York: McGraw-Hill.
de Vries, M., Flink, T., Kauw, K., van der Vleuten, F., & Mulder, T. (2010). Business Models for Energy Access. Leunden: ETC Foundation.
WBGU. (2009). Bioenergie und nachhaltige Landnutzung. Berlin: Wissenschaftlicher Beirat der Bundesregierung Globale Umweltveränderungen.
WEC/FAO. (1999). The Challenge of Rural Energy Poverty in Developing Countries, World Energy Council (WEC) and Food and Agriculture Organization of the United Nations (FAO). Retrieved from www.worldenergy.org/publications/314.asp
WorldCat.org. (2010). Results for 'jatropha' in category 'journals'. WorldCat.org. Retrieved December 27, 2010, from http://www.worldcat.org

39
PROCEEDINGS Conference MPDES 2011
Reality Check: Biomass as a Fuel for Small-Scale Electricity Supply in Developing Countries
Elmar Dimpl v.L. ([email protected])
Freelance consultant Markgrafenstrasse 15, D-60487 Frankfurt, Germany
Michael Blunck ([email protected])
Project officer GIZ, Dag-Hammarskjold Weg 1-5, Eschborn, Germany
Abstract Following all the hype and frustrations over a global bio-fuel market, today’s expectations regarding biomass energy focus on local power generation in rural areas of developing countries. Private manufacturers, international organisations and donors advocate wood gasification, biogas, and vegetable oil as sustainable sources for decentralised power supply. In practice, however, actual successes appear to be less numerous than the stories surrounding them. As a government-owned development organisation, GIZ (former GTZ) is obliged to advocate only promising and sustainable approaches. Hence, on behalf of the GIZ Programme on Poverty-Oriented Basic Energy Services (HERA), a survey was conducted on practical, operational experience with power generation from small-scale biomass gasification, biogas and vegetable oil. Following an analysis of the literature and, in particular, numerous direct inquiries with local experts, the survey not only revealed a considerable number of projects and approaches but also as many obstacles. Very few of the subject technologies are in day-to-day productive and commercial use. The gasification technology basically lacks reliable equipment and standardisation of processes. The biogas process comprises a highly complex management chain. The production of vegetable oil falls short of the expected yields. In addition, the prevailing political framework often emerges as an inhibiting factor for local power generation. After documenting the lessons learned, the survey identifies key challenges, future tasks and research needs to be added to the agenda of relevant actors within the next few years.
Keywords: Biomass electrification, project reality, R&D needs, biofuel, gasification
Introduction Renewable energy from photovoltaic, wind turbines and small hydro power plants is highly suitable for off-grid electricity supply and has been successfully introduced in countless cases in developing countries. The application of biomass as a sustainable electricity source also seems promising. In order to generate electricity, biomass can be combusted, gasified, biologically digested or fermented, or converted to liquid fuels for generators. Several research institutions (Mahapatra, Chanakya, & Dasappa, 2009) and international agencies, the ESMAP programme administered by the World Bank (ESMAP, 2007) for example, rate biomass as one of the cheapest available renewable energy sources for power generation. Furthermore, conversion from biomass to electricity is a
low-carbon process, as the resulting CO2 is absorbed by plant regrowth. In contrast with solar PV or wind power, biomass power technology can generate electricity on demand at any time, as long as a sufficient supply of biomass feedstock is assured. Many agricultural and forest product residues can provide feedstock for energy conversion without increasing land requirements. Local farmers can generate additional income by providing biomass fuels for small local power plants.
However, despite the apparent benefits, there has been little experience documented of implementing small electricity-generating biomass plants in off-grid areas of developing countries for decentralised village electrification.
In this paper, the term “biomass” is employed for any biological feedstock serving to generate energy. This can be wood, vegetable oil, agricultural residues, animal manure, or slaughterhouse waste, etc.. The term biofuel is used for liquid straight vegetable oils (SVO) as well as for biogas and generator gas.
Research Objectives As a governmental development agency, GIZ is obliged to advocate only promising and sustainable approaches. Hence, the GIZ programme “Poverty-oriented Basic Energy Services” (HERA), focussing on the provision of basic energy services from renewable energy sources in developing countries, commissioned an assessment of the lessons learned from pilot activities and thus identified the most important potentials of and obstacles to different biomass power technologies. This assessment puts focus on sustainable solutions to provide access to basic energy services in rural areas. It refers only to small-scale applications, i.e. considerably smaller than 100 kW, and focuses on the respective potentials for basic energy services for rural households and small businesses.
Biomass gasification, anaerobic fermentation to biogas and the use of vegetable oils as fuel were identified and examined as the most promising technologies. Direct combustion and ethanol production were not considered, as those technologies are more appropriate for a larger industrial scale. The main points of this assessment were
to identify the potentials of biomass use for decentralised rural electrification in developing countries

40
PROCEEDINGS Conference MPDES 2011
to identify biomass-based solutions applicable for this purpose
and, as it became clear that there are many obstacles to their immediate application, the identification of challenges and the need for further research and development came into closer focus.
Methods The initial concept was geared to analysing the operational data of ongoing projects and to developing general conclusions and recommendations out of the operational experience. However, as will become clear further down, genuine operational data are extremely rare. It is very hard to obtain reliable, detailed data, in particular concerning long-term operation. Manufacturers promote their plants with performance figures. However, these rarely appear to be based on practical operation. The projects that use the biomass plants publish their implementation as success stories, but they apparently only rarely collect and document reliable long-term data. Actually, only little long-term operational experience can be analysed anyway, because little such data exist.
The results presented here are based on a desk study. No project could be visited on-site. However, it is based on direct information on the current status of several installations. Following an analysis of the literature and of relevant press releases and project reports, several projects of apparent interest were identified. In a second step, several inquiries focussing on practical operational experience were carried out among experts in Africa, Latin America and Asia who were personally contacted by email, phone or in direct conversation.
It was therefore possible to compile direct information on the status of 29 projects with small-scale gasifiers, biogas power plants or generators designed for straight vegetable oil (SVO) as fuel. In some cases, the information came from the project executing agency, but in most cases, the information was provided by people who had recently been in contact with the project or visited it as advisor, co-operator, evaluator or competitor. Information was collected in an informal way. Some of it is based on comprehensive reports, and some on just a sentence or two of a personal commentary. Part of the information was given confidentially and is not publicly available in detail. Hence, the methodology bears a closer resemblance to journalistic research than to a scientific approach. Most of this assessment is documented in detail in a three-part series of papers on “Small-scale Electricity Generation from Biomass” covering biomass gasification (Dimpl, & Blunck 2010), biogas (Dimpl, 2010), and plant oil (Dimpl, 2011) for electric power generation. This text is an interpretive summary of those findings.
Results The technological principles Electricity generation process Theoretically, biomass or the extracted combustible gas or liquid can be converted to electricity by various kinds of technical equipment, for example by a combustion unit in combination with a boiler and a steam turbine or a steam engine, by a gas turbine, a Stirling motor, or even a fuel cell. In actual practice, though, almost all electric generators employed for the kind of small-scale applications discussed here are powered by internal combustion piston engines. Apart from some minor modifications, such generator sets are more or less identical to those used with conventional fuels. Both spark ignition “Otto” engines and compression ignition “diesel” engines can be fuelled with generator gas or biogas. While spark ignition engines can be operated on gas alone, diesel engines generally need co-fuelling with conventional diesel fuel. Diesel engines are the right choice for the use of straight vegetable oil.
However, internal combustion engines have severe fuel purity requirements. Too much particulate matter and tar in the generator gas, sulphur in the biogas or acid in the vegetable oil considerably shortens the lifetime of internal-combustion engines.
The more advanced the engine technology, the more complicated or limited the use of the subject biofuels. Hence, for use in modern cars with direct-injection engines, the conversion of SVO to biodiesel is mandatory. However, most of the robust stationary diesel engines commonly used in generator sets or pump stations are quite tolerant versus bio-fuels of high quality and can be modified with reasonable effort. Special engines for SVO or biogas fuel are also available.
Biomass gasification Biomass gasification is basically the conversion of dry solid fuels like wood and agricultural residues into a combustible gas mixture. The gasifier is essentially a chemical reactor that uses wood chips, charcoal, coal or some similar carbonaceous material as fuel and burns them incompletely due to a limited air supply. Products of this gasification process are solid ashes, partially oxidized products like soot (which have to be removed periodically from the gasifier) and the so-called generator gas. This generator gas, which contains flammable components such as carbon monoxide (CO), hydrogen (H2), and methane (CH4), can be used as fuel for a combustion engine to drive an electric generator.
There are different gasification methods in use. But the downdraft fixed-bed technology is the only one principally well suited for small power plants in the range between 10 kW and 100 kW or more. According to various sources, appropriate gasifier systems with internal combustion engines can produce 1kWh of electricity from 1.1 – 1.5 kg of wood, 0.7 – 1.3 kg of charcoal or 1.8 – 3.6 kg of rice husks.
The main technological challenge is to achieve high purity of the producer gas and to avoid the formation and accumulation of tar and soot with resultant damage to the generator set. The three main strategies to address this are
41
PROCEEDINGS Conference MPDES 2011
the use of an extensive gas cleaning system, optimisation of the pyrolysis or combustion process itself and the limitation of the fuel in use to very clean-burning feedstock such as dry wood blocks and sticks, dry coconut shells and - in specially designed systems - rice husks.
Biogas Biogas is gas obtained from an anaerobic digestion process. A biogas plant can convert animal manure, green plants, agro-industrial residues and waste from slaughterhouses (offal) into combustible gas. Since the process takes place in a humid environment, it is the appropriate technology for feedstock with a high water content. Today, biogas plants and the fermentation process are well known everywhere in the world.
Biogas consists of 50-75% methane, 25-45% carbon dioxide, 2-8% water vapour and traces of O2 N2, NH3 H2 and H2S. A high methane component is desirable due to its useful energy content. A certain carbon dioxide and water vapour content is unavoidable, but the sulphur content must be minimised - particularly for use in engines. Biogas can be used in ways similar to those of natural gas, i.e. in gas stoves and lamps or as fuel for engines. Electricity generation out of biogas is quite common in Germany and other industrialised countries but rarely encountered in developing countries, where biogas is generally used directly for fuelling stoves, boilers and lamps.
Biogas-based power generation can be a very efficient means of recovering energy renewable sources. However, this applies only if the heat emerging from the power generator can be used in an economically and ecologically sound way. The average calorific value of biogas is about 21-23.5 MJ/m³, meaning that 1 m³ of biogas corresponds to 0.5-0.6 l diesel fuel or an energy content of about 6 kWh. Albeit, due to conversion losses, 1m³ of biogas actually only yields around 1.7 kWhel. (FNR, 2009).
The biogas yield of a plant depends not only on the type of feedstock, but also on the plant’s design, fermentation temperature and retention time. Maize silage for example - a common feedstock in Germany - yields about 8 times more biogas per tonne than cow manure.
In Germany, cow manure and energy crops are the main forms of feedstock. About 2 livestock units (corresponding to about 2 cows or 12 rearing pigs) plus 1 ha of maize and grass are expected to yield a constant output of about 2 kWel (48kWhel per day).
In the South Asian context, ESMAP calculates a typical specific input-output ratio of about 14 kg of fresh cattle dung (the approximate production of one cow on one day) plus 0.06 l diesel fuel for producing 1kWh of electricity. (ESMAP, 2007)
Vegetable oil Vegetable oil can be used to fuel diesel engines either as straight vegetable oil (SVO) or, following conversion, as biodiesel. For robust stationary (non-vehicle) engines, the use of pure SVO is the most attractive option. This way, the additional and somewhat hazardous (due to some highly inflammable components) biodiesel conversion process can be avoided; furthermore, the energy yield per
gallon of vegetable oil is higher when used directly as SVO. This paper will therefore generally focus on the direct use of SVOs.
The potential benefits of SVOs as fuel for power generation in rural areas are:
SVOs are liquid, hardly evaporative and thus easy to handle,, store and transport
SVOs are neither flammable nor explosive, and they do not release toxic gases
SVOs do not cause major damage if accidentally spilt
Almost all vegetable oils have a calorific value very similar to that of diesel fuel. However, the viscosity of vegetable oil is on the order of 10 – 20 times higher than that of diesel. And oil characteristics can differ considerably between different types of SVO, as their composition of fatty acids varies. This can lead to plugging and gumming of lines, filters and injectors, and can cause a build-up of deposits inside the motor and/or excessive engine wear.
Long-term experience, in particular with regard to rapeseed oil in Europe, left no doubt that it is relatively easy and reliable to use in diesel engines. Other oils like Jatropha, palm oil, sunflower, soybean, coconut and cotton oil have also been in use to fuel motors. SVOs can be used as the sole (main) fuel, in a blend with diesel or in alternating use with diesel. For economic long-term service, all machines need clean, homogeneous oil with specific characteristics.
Some engines are specially designed to run on vegetable oil, while others are simply robust and tolerant - like the Lister-type stationary diesel engines produced in England or India that are very common in developing countries all over the world. Also, special sets are available for converting tractor or truck engines for fuelling with SVOs. “An How-to Guide for Small Stationary Engines” published by the World Bank (World Bank, 2009) gives a good overview on the technical details for quality SVO production and as well as necessary properties for the respective modification of engines.
Potentials Appropriate feedstock for electricity generation in biogas or gasification plants is available in sufficient quantities in many countries and regions. Small and medium-size biogas and gasifier plants could provide a considerable contribution to rural electricity generation in such countries. Also, plant species providing oil appropriate for use as fuel can be found thriving in nearly all countries. However, for the generation of significant quantities of electricity, the oil-bearing plants have to be either cultivated or extracted from a semi-wild environment.
The conversion of biomass to electricity is theoretically an attractive option for rural development. Feasibility studies and project reports promise:
a renewable, sustainable source of locally available fuel for local energy supply
local value chains with income generation for the stakeholders involved in supply, pre-processing of the fuel and operation of the power plant

42
PROCEEDINGS Conference MPDES 2011
incentives for reforestation in the case of gasification and reduction of sanitation problems in the case of anaerobic fermentation.
a perfect, nearly CO2-neutral, renewable energy source, assuming, of course, that the biomass originates from renewable production – regardless of whether planned production and forestation or natural regeneration.
All three technologies are principally well suited for small power plants in the range between 10 kW and beyond 100 kW and, as such, appropriate for mini-grids and independent local power supply systems. Even though in the case of gasification and anaerobic fermentation (biogas) bigger units appear to be more appropriate, due to their complexity and the necessary know-how for operation and maintenance.
The general features of the technology are indeed promising: In contrast to a photovoltaic system or a wind generator, electricity can be produced at any desired time given the availability of the required biomass. A generator in the range between 10 and 100 kW provides sufficient energy, not only for household lighting but as well for, refrigerators and the operation of small machinery (especially useful for small businesses).
The project reality However, in contrast to these promising perspectives, the research this text is based on revealed that it is very difficult to find examples in which rural small-grid electrification based on biomass actually is in continuous operation in a near-commercial manner. Hence operational data is rare and instead it has come to light that most such projects are struggling with numerous difficulties.
The gasification technology is relatively well known in southern Asia, especially India. One of the most important manufacturers of gasifiers is an Indian company based in Gujarat. However, many small gasifier plants were taken out of operation just a few years after their installation and, apparently, almost none of the identified projects ever became fully commercial. In contrast, only due to significant subsidies have some of the examined gasification projects been of some benefit to the users and could perform for a longer time.
Biogas plants are widespread in Asia, from small plants at the household level to big, modern plants in agro-industrial settings. However, electricity generation from biogas is quite rare, and examples of small-scale power generation for village electrification are hard to find. Obviously, a number of hurdles are inhibiting the diffusion of this technology.
There are numerous press releases to be found concerning electricity generation for remote hospitals, villages etc. based on SVOs, especially Jatropha oil. Jatropha is but one of thousands of oil-bearing plants, but in recent years so many hopes and expectations have been concentrated on this plant that it has nearly become a synonym for SVOs. Nevertheless, this research shows that most “SVO generators” are still relying mainly on fossil diesel as fuel.
Which main obstacles and difficulties are these approaches still struggling with?
Technological challenges All of the studied electrification systems were not standardised but unique, custom-built setups that needed considerable outside know-how and professional support due to various technological challenges. Hence, they have only been able to stay in operation as long as such support is assured in a stable way.
In particular the small-scale gasification plants proved unreliable and expensive. Steady operation could be achieved only in cases with extraordinarily motivated, committed management and operation and in which speedy, reliable, expert backstopping and spare parts supply were available. Dry chopped wood and rice husk were successfully used as fuel. The often desired use of other raw materials as fuel (peanut shells, straw etc.) is fraught with problems and requires co-firing of considerable amounts of other (fossil) fuel.
The main challenge was to achieve high purity of the producer gas to avoid the formation and accumulation of tar and soot. This requires clean, dry, homogeneous feedstock of very specific quality and a sophisticated gas filtration system. The filters increased the cost, required frequent cleaning, and often produced considerable quantities of carcinogenic waste. In addition, the CO, as one component of the generator gas, can constitute a serious threat in the event of leakage or improper management. Cases of at least minor CO intoxication have been reported.
Similar to the findings of a World Bank study dating from the 1990s (Stassen, 1995), none of the generating plants toured during GTZ visits were found to have been taking adequate measures in dealing with the toxic condensates; and none of the operators dealing with them even wore protective clothing or gloves.
By way of comparison, the technological challenges regarding biogas are relatively marginal. There is mature, reliable, high quality technology available on the global market. Different methods of desulphurisation have been successfully established, and biogas-tolerant internal-combustion engines of proven durability are likewise available. Finally, adequate know-how for planning and constructing reliable biogas power plants is also accessible in numerous countries.
Until now, though, most biogas plants in developing countries were installed for sanitation purposes, and the gas is being used directly for cooking, heating and/or lighting purposes. In contrast, very little on-the-ground experience with electricity generation from small biogas plants in developing countries has yet been accumulated. All projects with small biogas power plants analysed to date were individually designed pilot projects with specially engineered components, many of which were imported from industrialised countries and therefore involved accordingly high costs. The most important challenges for biogas technology lie in the costs, in the organisation of biogas power system operation and maintenance as a whole, and in the commercialisation of the power output.

43
PROCEEDINGS Conference MPDES 2011
Regarding the use of SVOs, the provision of sufficient oil of adequate quality at affordable cost and with low environmental and social burdens emerged as the main technical challenge. All reports from SVO projects cited the low availability of oil seed as the main inhibiting factor. The following reasons for the low availability of SVO were named:
Most approaches have concentrated on Jatropha. Hence, over the past few years of biofuel hype, oil seed especially from Jatropha, became too expensive for use in oil production and were instead used as seed for establishing new cultures.
Field experience and research revealed that, in many cases, yields have been considerably lower than expected, especially regarding Jatropha.
Jatropha and several other oil-bearing trees are still undomesticated plants, and it will take extensive breeding efforts to turn them into productive, reliable oil crops.
In summary, it must be noted that no reliable, affordable, complete set of standard (= off-the-shelf) technology for biomass-based electricity generation in appropriate rural small-scale applications is yet readily available.
Costs Several feasibility studies and initial project reports state that electricity generated from these renewable biofuels is cheaper than fossil fuels or at least has a similar price, and that its provision is more reliable. However the revealed operating problems of the biomass-based electrification systems raise suspicion that the actual cost may be higher than expected.
As initially stated, reliable operating data is very rare. Hence, this assessment is based on indirect indicators and suppositions instead of clear figures.
As already mentioned, nearly all of the studied plants were individually designed pilot installations, and high professional know-how input was necessary in all cases, at least during the installation and initial operation phase, and in many cases for maintenance, as well. These costs are extremely high, especially in remote areas, and are generally not documented.
None of the plants under study here could have been installed without external, in most cases international, technical and financial support. Consequently, most cost calculations published do not reflect the real costs of the actual systems but are merely projections for a theoretical future situation. The figures vary significantly and are often contradictory or inconsistent.
The figures calculated by GTZ experts for medium-size and large biogas plants in Kenya (>50kW) appear to be quite realistic: They anticipate plant payback periods of 6 to 9 years. However, they were calculated according to a proposed - and as yet unimplemented - tariff scheme with a price of ~0.15 US$/kWh (GTZ, 2010).
Other studies come to the conclusion that biogas power plants are not commercially viable without subsidies or guaranteed high prices (~0.20 US$/kWh) for their outputs, similar to the feed-in tariffs that have been introduced in Germany and many other industrialised countries.
Cost figures for gasifiers are often in a similar range, but as long as the technological problems remain unsolved, they do not seem to be realistic. The high outlays for technical support are seldom documented but generally persist over long periods and have often been an important reason for abandoning the plant or process.
In the case of SVOs installation costs are not considerably higher than for common diesel gensets. However, oil production has proved to be much more arduous and costly than expected. Clear figures on costs could not be obtained, as none of the plants really runs continuously on SVOs, but the reported behaviour of the farmers indicate that the anticipated fuel costs did not corresponded to reality: after a few years, they abandoned the cultivation of Jatropha. And a GTZ study (GTZ, 2009) based on the experience of different plantations in Kenya came to the conclusion that the cultivation of Jatropha in monoculture or as an intercrop had a negative economic balance.
Not only the cultivation and collection of the oil fruits are challenging. It proved far more complicated and costly than expected to build up a complete, local electricity supply system. Especially the upstream part with logistics for collection, transport, processing and storage of the oil fruits or fuel turned out to be very difficult. In many cases, growers were geographically dispersed and yet had to produce sufficient quantities of seeds to achieve the economies of scale that are necessary for efficient biofuel processing.
The most promising reports come from the Southern Pacific Islands, where imported diesel fuel is quite expensive due to high transportation costs and an abundance of underutilised coconut trees provides high potential as a local SVO source (Cloin, 2007). However, despite several attempts, no commercial power plant is yet in continuous operation. Nevertheless, studies indicate the cost of the coconut “biofuel” to be about 10% below the retail price for fossil diesel in Fiji. Additionally, other products made from coconut oil are being promoted as soaps, body oils and lotions and copra meal in order to increase both income generation and profitability (Vukikomoala, 2010).
In sum, it is evident that none of the technologies can provide electricity at a price that could compete with actual national grid prices. In rural areas, though, the calculation is different, because there, SVOs have to compete with local solutions generally involving small diesel generators as the only, or frequently necessary, back-up energy supply. The cost of the electricity produced by those generators is considerably higher than the common grid price, often about twice as high. Compared to these relatively expensive solutions, biogas plants in particular look potentially competitive.
This is especially the case if not all investment costs have to be carried by the electricity production unit but can be covered in part by other by-products or services of the systems. The economic feasibility of a biogas plant depends on the economic value of its entire range of outputs.
One by-product of all three technologies is the heat being co-generated by the combustion engine. In Germany, it is crucial for the profitability of biogas plants

44
PROCEEDINGS Conference MPDES 2011
that the heat can be profitably marketed. In tropical countries, though, there is much less demand for heat in general, and then only for a few industrial processes. In none of the studied small-scale cases could any considerable amount of exhaust heat be used in a profitable way.
On the other hand, biogas plants in particular have some valuable additional services to offer. The few studied small-scale biogas power plants that are actually in operation run under very special conditions: They are located on sisal, cattle or chicken farms or at slaughterhouses and have an important sanitation function. In these agro-industrial settings, the plants’ secondary outputs can be even more valuable than the electricity or mechanical power they produce: biogas that can also be used as fuel for other processes; the sanitation effect with COD and BOD (chemical and biological oxygen demand) reduction in the runoff; and use of the slurry as fertiliser. In some cases, the value of these by-products was higher than that of the electricity.
Hence, the perspectives for biogas technology as a base for village electrification are quite good if it can be properly integrated into such agro-industrial settings.
For oil bearing trees as Jatropha, too, only scenarios with a cumulative return through valuable multipurpose function appear as profitable options for farmers (GTZ, 2009). For example, its cultivation in the form of fences has the additional benefit of protecting valuable plantation crops from trespassing wildlife and people instead of reducing food production.
Energy balance The question of input-output balance regarding energy production is not merely one of investments and running costs over economic outcomes, but also a comparison between energy inputs and energetic outputs. In the case of wood collection for cooking purposes, the typical rural family clearly draws a positive balance between invested effort and energy services gained. In the case of oil seeds, however, the necessary effort for production is far higher.
A study in Thailand compared energy inputs with energy outputs of intensive Jatropha plantations. Based on experiments rather than fieldwork, the study revealed that the overall energy balance is frequently negative. Clearly positive energy balances were only achieved when the energy content of all Jatropha products (including e.g. pruned wood and seed cake), not only that of the oil, were taken into consideration. Taking merely the energy content of the oil into account led to a negative or, at best, a slightly positive energy balance. Only when the much higher energy content of the pruned wood and the seed cake was factored in did the energy gains outstrip the invested energy (Prueksakorn, Gheewala, Malakul, & Bonnet, 2010).
Necessary Framework Conditions Beside the technological and economic considerations, there are also many other barriers to market penetration and development of biomass based rural electrification. The reports from the projects name:
lack of awareness of the opportunities and potentials;
high upfront costs for potential assessments and feasibility studies;
lack of access to finance; lack of local capacity for project design,
construction, operation and maintenance; legal framework conditions that complicate
alternative energy production and commercialisation: for example, the right to sell electricity at local level has to be in place.
Especially the last point inhibits the local delivery of electricity to neighbouring households or villages, even in those cases where a plant is actually in operation.
Conclusion: Research and Development Needs The following recommendations, like the entire text, apply only to small-scale applications with the objective of village electrification in remote areas not connected to the national grid.
The technologies’ continuing need for long-term professional support for their proper operation, together with their relatively high costs, still constitutes a major barrier to their commercial-scale utilization for village electrification. Hence, electricity generation from biomass cannot yet be recommended as a standard solution for projects with the single objective of rural electrification.
However, in principle, the practicability of the technologies has been proven, and the costs are no longer very far from being competitive. Hence, more pilot applications with a certain research component are needed:
for developing the technology from custom-made, individual solutions to standardised systems with standard components;
for raising awareness of the potentials of these technologies;
for developing a legally and politically supportive environment for mini-grids based on biomass;
for developing local know-how and capacities for the installation, maintenance and operation of such plants.
In order to implement successful pilot systems, the
“lowest hanging fruits” should be identified to start with. The indispensable preconditions for such promising settings include:
high and constant availability of cheap and appropriate biomass fuel;
major obstacles (economic or environmental) to the use of other fuels (fossil or renewable) or other forms of energy;
commitment of an experienced manufacturer and availability of high-quality components and spare parts;
continuous availability of specialised know-how for maintenance and adjustments that does not have to be financed out of operational profits during a prolonged initial phase (possible, for example, in co-operation with research projects);
low labour costs for the operation;

45
PROCEEDINGS Conference MPDES 2011
favourable legal and political conditions for the potential local sale of generated electricity, including appropriate tariffs and long-term support structures;
sufficient economic potential on the part of the future clients (the electricity users) to cover at least the cost of operation.
Promising situations in this sense are locations where small diesel generators already exist and are in operation, so that the initially high cost of electricity has already been paid in the past, and enough purchasing power is available for the operation of a biomass-powered plant. In general, these are locations with rural industry or public services.
Additional conducive conditions would be: opportunity to sell or otherwise profitably
employ not just the electricity, but also heat or other by-products of the system;
such positive side effects as improved sanitation, incentives for re-forestation, reduction of GHG emissions etc., hence justifying considerable subsidies.
This proposed concentration on low-hanging fruits seems to be contradictory to the overall goal of village electrification and the provision of electricity to poor families. However, in most poor villages there is not enough purchasing power to support the continuous operation of such a small - but still expensive - power plant. Considerable supporting measures and complementary services would be necessary for a number of years to increase income generation to such a level, that the costs for this electricity could be covered. Through further development of the systems under favourable conditions, their costs must first be reduced and then their reliability increased.
Challenges for R&D regarding biomass gasification Up to now, steady operation of gasifier plants could only be achieved in cases with extraordinarily motivated and committed management and operators, in addition to and speedy and reliable, expert backstopping and spare parts supply. This applies to plants in India as well as in Germany. Hence, the technological challenge is to substitute these continuous engineering efforts for improvement and adaptation during the operation phase by one-time engineering efforts for a proper plant design and construction. The main design goals are:
reliability and low maintenance requirements of the plants;
tolerance of the plants towards the fuel quality and usability of such non-wood fuels as straw, peanut husks, etc.;
high purity of the producer gas; safe working conditions for the operators; low levels of toxic waste and solutions for their
safe disposal As the gasification technology is quite old and progress in plant design appears to be slow, the prospects for soon achieving considerable improvement do not look very promising for this technology.
Challenges for R&D regarding anaerobic digestion / biogas The use of biogas technology for power generation is probably the most promising of the technologies being discussed here. In most studied cases, the installation is part of an agro-industrial setting and has a dual benefit: sanitation and electricity generation. Bigger plants with capacities from 100 to 500 kW are in successful commercial operation. The main challenge remains to develop and make available small, standardized systems with appropriately reliable but affordable components. This applies to the digester, the gas cleaning system and, of course, the combustion engine of the generator set. It applies as well to the entire feedstock system. Knowing how to design and organize a continuous flow of appropriate feedstock is very important for the gas quality.
Challenges for R&D regarding SVOs as fuel The quest for appropriate, locally produced SVO fuel should not focus solely on one plant species such as Jatropha, but also take into consideration all possible oil sources and their flexible use. Besides Jatropha, there are numerous wild or semi-wild species, in general trees like Croton, Pongamia or Acrocomia. Also, edible oil might be used as fuel in case of excess supply and very low prices. For farmers, it is advantageous to produce multi-purpose oil that can be sold to different markets. In any case, the balance between food and cash crop has to be taken into account.
The disappointing results with Jatropha show that there is still too little know-how concerning the profitable utilization of such wild or semi-wild species. Productive varieties need to be identified and selected, and appropriate production systems have to be developed.
The quest for locally available energy from oil plants should not focus exclusively on their oil. Most of the biomass energy produced by oil plants is not fixed in the oil but in its woody parts. Hence, an integrated energetic use of the plants, including their woody parts, could lead to profitability and to a more positive energy balance for local energy generation. Appropriate livelihood systems for the integrated use of oil-bearing energy plants have to be studied and concepts for the beneficial utilisation of plants as a whole developed.
General challenges for R&D regarding biomass-based electrification in small grids. Of course, all the challenges regarding small grids apply to biomass energy grids, too. Examples include concessions/legal options for energy provision, appropriate feed-in tariffs, ownership, etc. - but all that cannot be discussed here in detail.
Local biomass energy-based systems have considerable potential for driving environmental and social improvement. However, international donors and implementation agencies must be conscious of their own responsibility concerning potential hazards to health, environment and social balance as side effects of such biomass power plants. Hence, strict standards for implementation and operation have to be guaranteed. Several international standards for sustainable biofuel

46
PROCEEDINGS Conference MPDES 2011
production have been developed or are under discussion. Most of them focus on biofuel production for the international market. Similar minimum standards for sustainability also have to be developed for the local use of biomass energy. Such standards and related indicators must not only be effective and transparent but also easily applicable and practicable in rural environments with large groups of smallholders. One example of such an approach is the Dutch “Testing Framework for Sustainable Biomass” that was tested in Mozambique within the context of the Dutch-German Partnership “Energising Development” (GTZ, April 2009). Further development of this kind is necessary. Important issues for such minimum standards include:
competition between energy crops and food crops, or energetic use with potential for alimentation;
management and safe disposal of toxic waste and on-the-job safety, especially in the case of biomass gasification;
energy balance of the entire bioenergy systems.
References Cloin, J. , (2007). Liquid biofuels in Pacific island
countries. SOPAC Miscellaneous Report 628. South Pacific Applied Geoscience Commission, Suva, Fiji.
Dimpl, E. (2010). Small-scale Electricity Generation from Biomass Part II: Biogas. GTZ-HERA – Poverty-oriented Basic Energy Service. Eschborn.
Dimpl, E. & Blunck, M. (2010). Biomass gasification - is it a practical option for rural electrification? In Appropriate Technology Vol. 37:2 (June 2010), 18-22.
Dimpl, E. (2011). Small-scale Electricity Generation from Biomass Part III: Vegetable Oil. GIZ-HERA – Poverty-oriented Basic Energy Service. Eschborn.
ESMAP (2007). Technical and Economic Assessment of Off-grid, Mini-grid and Grid Electrification Technologies. ESMAP Technical Paper 121/07. Energy Sector Management Assistance Program (ESMAP), World Bank Washington, DC.
FNR, (2009). Biogas Basisdaten Deutschland – Stand: Oktober 2008. Fachagentur Nachwachsende Rohstoffe e.V.
GTZ, (April 2009). Testing Framework for Sustainable Biomass - Field Evaluation Analysis in Mozambique & Enabling Framework for Implementation. Eschborn.
GTZ (2009). Jatropha Reality Check - A field assessment of the agronomic and economic viability of Jatropha and other oilseed crops in Kenya. Study conducted by Endelevu Energy
World Agroforestry Centre on behalf of GTZ - Regional Energy Advisory Platform East Africa. Nairobi.
GTZ (2010). Agro-Industrial Biogas in Kenya – Potentials, Estimates for Tariffs, Policy and Business Recommendations. Study of Deutsches Biomasse Forschungs Zentrum (DBFZ) on behalf of GTZ, Renewable Energy Project Development Programme East Africa. Nairobi.
Mahapatra, S., Chanakya, H. N., & Dasappa, S. (2009). Evaluation of various energy devices for domestic lighting in India: Technology, economics and CO2
emissions, In: Energy for Sustainable Development 13, 271-279.
Prueksakorn, K., Gheewala, S. H., Malakul, P., & Bonnet, S. (2010). Energy analysis of jatropha plantation systems for biodiesel production in Thailand. In Energy for Sustainable Development 14, 1-5.
Stassen, H. E. (1995). Small-Scale Biomass Gasifiers for Heat and Power. A Global Review. World Bank Technical Paper 296. Washington, D.C.
Vukikomoala, Frank, (2010). Coconut oil - combining energy supply and income diversification. In: Rural 21 - 06/2010, 29-31.
World Bank (2009). Pacific Islands - Coconut Oil Power generation: A how-to guide for small stationary engines. Asia Sustainable and Alternative Energy Program. Fiji.
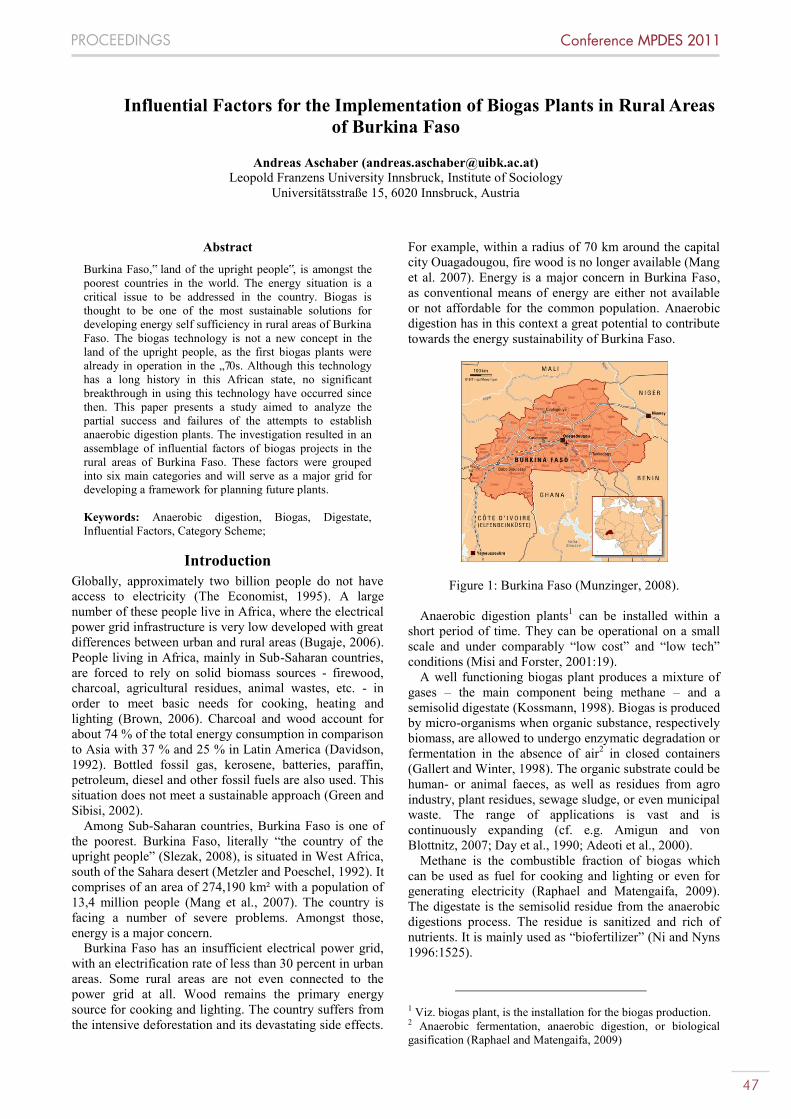
47
PROCEEDINGS Conference MPDES 2011
Influential Factors for the Implementation of Biogas Plants in Rural Areas of Burkina Faso
Andreas Aschaber ([email protected])
Leopold Franzens University Innsbruck, Institute of Sociology Universitätsstraße 15, 6020 Innsbruck, Austria
Abstract Burkina Faso,‟ land of the upright people‟, is amongst the poorest countries in the world. The energy situation is a critical issue to be addressed in the country. Biogas is thought to be one of the most sustainable solutions for developing energy self sufficiency in rural areas of Burkina Faso. The biogas technology is not a new concept in the land of the upright people, as the first biogas plants were already in operation in the „70s. Although this technology has a long history in this African state, no significant breakthrough in using this technology have occurred since then. This paper presents a study aimed to analyze the partial success and failures of the attempts to establish anaerobic digestion plants. The investigation resulted in an assemblage of influential factors of biogas projects in the rural areas of Burkina Faso. These factors were grouped into six main categories and will serve as a major grid for developing a framework for planning future plants. Keywords: Anaerobic digestion, Biogas, Digestate, Influential Factors, Category Scheme;
Introduction Globally, approximately two billion people do not have access to electricity (The Economist, 1995). A large number of these people live in Africa, where the electrical power grid infrastructure is very low developed with great differences between urban and rural areas (Bugaje, 2006). People living in Africa, mainly in Sub-Saharan countries, are forced to rely on solid biomass sources - firewood, charcoal, agricultural residues, animal wastes, etc. - in order to meet basic needs for cooking, heating and lighting (Brown, 2006). Charcoal and wood account for about 74 % of the total energy consumption in comparison to Asia with 37 % and 25 % in Latin America (Davidson, 1992). Bottled fossil gas, kerosene, batteries, paraffin, petroleum, diesel and other fossil fuels are also used. This situation does not meet a sustainable approach (Green and Sibisi, 2002).
Among Sub-Saharan countries, Burkina Faso is one of the poorest. Burkina Faso, literally “the country of the upright people” (Slezak, 2008), is situated in West Africa, south of the Sahara desert (Metzler and Poeschel, 1992). It comprises of an area of 274,190 km² with a population of 13,4 million people (Mang et al., 2007). The country is facing a number of severe problems. Amongst those, energy is a major concern.
Burkina Faso has an insufficient electrical power grid, with an electrification rate of less than 30 percent in urban areas. Some rural areas are not even connected to the power grid at all. Wood remains the primary energy source for cooking and lighting. The country suffers from the intensive deforestation and its devastating side effects.
For example, within a radius of 70 km around the capital city Ouagadougou, fire wood is no longer available (Mang et al. 2007). Energy is a major concern in Burkina Faso, as conventional means of energy are either not available or not affordable for the common population. Anaerobic digestion has in this context a great potential to contribute towards the energy sustainability of Burkina Faso.
Figure 1: Burkina Faso (Munzinger, 2008).
Anaerobic digestion plants1 can be installed within a short period of time. They can be operational on a small scale and under comparably “low cost” and “low tech” conditions (Misi and Forster, 2001:19).
A well functioning biogas plant produces a mixture of gases – the main component being methane – and a semisolid digestate (Kossmann, 1998). Biogas is produced by micro-organisms when organic substance, respectively biomass, are allowed to undergo enzymatic degradation or fermentation in the absence of air2 in closed containers (Gallert and Winter, 1998). The organic substrate could be human- or animal faeces, as well as residues from agro industry, plant residues, sewage sludge, or even municipal waste. The range of applications is vast and is continuously expanding (cf. e.g. Amigun and von Blottnitz, 2007; Day et al., 1990; Adeoti et al., 2000).
Methane is the combustible fraction of biogas which can be used as fuel for cooking and lighting or even for generating electricity (Raphael and Matengaifa, 2009). The digestate is the semisolid residue from the anaerobic digestions process. The residue is sanitized and rich of nutrients. It is mainly used as “biofertilizer” (Ni and Nyns 1996:1525).
1 Viz. biogas plant, is the installation for the biogas production. 2 Anaerobic fermentation, anaerobic digestion, or biological gasification (Raphael and Matengaifa, 2009)

48
PROCEEDINGS Conference MPDES 2011
Biogas offers a good choice for adapting economic growth to sustainable development and will meet human needs while preserving and guaranteeing ecological well-being (Zhang et al., 2009). It provides remote rural places with energy and empowers people by providing decentralized energy (Karekezi, 2002). A downside of biogas technology is the way it can change social systems. A technical innovation is always connected to a social component where it is hard to anticipate what will happen. Methane can be very beneficial for the users when it is used under perfect conditions but it is also a very strong green house gas. If methane evaporates into the air it contributes to the greenhouse effect.
Biogas in Burkina Faso Biogas has a comparatively long history in Burkina Faso. Biogas prototypes were first installed in Burkina Faso in the mid 1970. As early as 1976, the Comité Interafricain d’Études Hydrauliques CIEH and the Institut de Recherche Agronomique Tropicale IRAT started a research and experimentation program on the valorization of organic waste by producing compost and biogas. The Association Internationale du Développement Rural AIDR installed several biogas plants from 1978 onwards (Mang et al., 2007). Since then the Institut de Recherche en Sciences Appliquées et Technologies IRSAT installed a number of biogas plants in: Farakobâ, Koudougou, Gaoua, Fada, Pô, Ziniaré, Pabré, Matourkou, Boromo, Tenkodogo, Yako, Kamboinsé, Kombissiri, Bogandé, Diébougou, Banfora, Polgo, Ouagadougou, Saaba, and Zorgho; Le Centre Régional pour l'Eau Potable et l'Assainissement à faible coût CREPA built in 2009 a composition of three biogas plants, à 50m³ (Oumar, 2008).
IRSAT is a governmental research institution and is taking place in the national biogas program as part of an African wide initiative “Biogas for better life” B4B (Nes van and Nhete, 2007). The construction of several new digesters is ongoing. CREPA is an institution with nongovernmental organization NGO characteristics, dealing with biogas since 2005. It aims to install another six digesters in the near future (Oumar, 2008). According to the chief researcher of CREPA, the Office National de l'Eau et de l'Assainissement ONEA in decision to get involved in biogas in Burkina Faso as well. The Dutch volunteer service SNV, technical implementation and HIVOS, financial management - are Dutch NGOs which are executing the “Biogas for a better life” program in Burkina Faso. They intend to install 2 million biogas plants in selected African countries (Nes van and Nhete, 2007).
Research objectives According to a recent feasibility study of GTZ, (Mang et al., 2007) biogas is thought to be one of the most sustainable solutions for developing energy self sufficiency in rural areas of Burkina Faso. This statement has to be seen in a more critical light. Biogas is not a new concept in Burkina Faso, as the first biogas plants were already installed in the „70s. Until now, various NGOs and a recently started national biogas program are
supporting the biogas technology in the country. Around 30 biogas plants have been installed (Mashandete, 2009: 117). Although biogas has a long history in Burkina Faso, no significant breakthrough of this technology has happened so far. None of the biogas plants built during the last 40 years have been recently operational (Oumar, 2008).
So what went wrong with the biogas idea in Burkina Faso? This paper intends to reveal what factors influence the operating ability of biogas plants in Burkina Faso and how to structure these factors in a comprehensive way. In the past most of the research in this field was approached from a technical point of view. But real life experience showed that failures of biogas plant projects were mainly due to non technical reasons (Ni and Nyns, 1996). Human agency influences technology and vice versa. Society and technology stand in reciprocal relation to each other. They co-evolve and produce options which can be utilized or ignored. A technical artifact achives social importance once it is utilized and the benefits are exploited (Weyer, 2008). A technical artifact becomes utilized by a society if it corresponds to the social practice. Social practices do prerequisite a consonance between the social habitus and the technology field a (Gotschi, Hunger and Zapotoczky, 2007). The habitus is regarded as the internalized world view which is composed of thinking, perception and action schemata of a social actor. It is socially accrued from historical processes. The habitus cannot be inhered, it is deeply embedded and belongs to a social actor (Bourdieu and Schmid, 2001). The field is interpreted as the fighting-, respectively the play ground becoming objectified in things and institutions (Engler, 2003). According to Bourdieu (2001:41) “the field is an autonomous microcosm within social macrocosm.” Each field has its own rules and assessment criteria (Bourdieu and Schmid, 2001). Hence the biogas plant technology and its components determine the field, while the habitus is entrenched within the rural biogas users of Burkina Faso. The habitus will become visible when the field and habitus do not coherently fit (Bourdieu, 1981; Bourdieu, 1985). A misfit between habitus and field leads to improper utilization of the biogas technology. The main gool of this paper is to summarize factors in a systematic way which influence the dissemination of biogas technology in the rural areas of Burkina Faso. This categorization is used to analyze the disparities between the field of biogas, its social setting and the contextual environment building on the above elaborated theoretical approach.
This paper aims to contribute towards the sustainability discussion on biogas in Burkina Faso. So far, it is the first disquisition which summarizes factors that influence the implementation of biogas plant focusing on Burkina Faso. Furthermore, the paper delivers a refined category scheme, in order to increase the comprehensiveness. It delivers a sound decision base for further biogas projects in Burkina Faso. It should encourage its academic community to participate in the national biogas discourse.

49
PROCEEDINGS Conference MPDES 2011
Towards an category scheme for Influential Factors To date, several digesters have been installed in different African countries but only a small number are operational. Most of them have been installed in schools, health clinics and mission hospitals and small-scale farms, mostly by NGOs (cf. e.g. Parawira, 2009; Bhat, Chanakya and Ravindranath, 2001). Problems and obstacles connected to the implementation of biogas in African-, respectively Sub-Saharan countries, can be classified according to Ni and Nyns (1995) into four groups: Technical constraints, Institutional constraints, Socio-economic constraints and Financial constraints (Ni and Nyns, 1996:1526). Pandjaitan (1990) developed a similar categorization and Akinbami et al. (2001) distinguished technical, economic and socio-cultural factors (Akinbami et al., 2001; Pandjaitan and Hutapea, 1990). Parawira (2009) extended and redefined these to political, social-cultural, financial, informational, institutional, technical and training constraints. It was attempted by the authors to classify factors which influence the implementation of biogas in African countries. These classifications are based on biogas project observations in selected African states. The result being a summary of factors across Africa regardless to national differences.
The influential factors of biogas plants were generalized for Africa. It was assumed that each African country faces the same context conditions. In fact, the context of each African country is different. So do the factors which influence biogas implementation. In order to understand the manifold reasons why biogas projects work and do not work, one has to look at each country individually. Hence the category scheme suggested by literature is imprecise for this specific task. The factors influencing biogas projects are vast and need a more comprehensive and refined category scheme for Burkina Faso.
Material and Methods An exclusively qualitative approach was applied for this work. The basic category scheme of Parawira (2009) was used as an orientation for gathering the empirical data. The empirical data was retrieved during two field trips in Burkina Faso, and delivered the base for the incremental refinement for the category scheme. Four sites of existing biogas plants were visited. Seven interviews with experts and three focus groups with potential users were conducted.
Interviews were carried out with experts, these included the chief researchers of IRSAT, and CREPA, two kitchen chefs, the headmaster of a Lyceè, the representative of an NGO implementing biogas, in Burkina Faso and a governmental representative of the Ministry of Livestock Resources - responsible for biogas - in Burkina Faso. The focus group interviews were conducted in the village, where a biogas plant is planned to be built. One focus group was composed of villagers (operators). The second focus group was composed of nomadic herders (deliverer of substrate). The third focus group consisted of pupils in a primary school who will be the benefitionaries of a projected biogas plant. The focus was on the occurring problems when operating a biogas plant as well as the
fear, needs, and concerns connected to the new technology. All focus groups were moderated by a local researcher.
The systemic approach, including technical as well as socioeconomic aspects, yielded a wealth of factors, which can potentially influence the success of biogas projects in rural areas of Burkina Faso. Furthermore the empirical data was enhanced by data from the open participatory observation. The focus group and the expert interviews were conducted on the basis of guidelines following the design of Helfferich (2004).
For the analysis, the open character of the grounded theory as well as the qualitative content analysis according to Mayring (2002) was used. Through the use of Computer Assisted Qualitative Data Analysis CAQ-DAS it was possible to unite the advantages of both rationales. The dictate of material was based on the grounded theory (Corbin and Holt, 2006), while data was structured into categories according to the method of Mayring. It is notable to remark, although computer and software were used to process the data, these were only used as an assistant tool for this work (Kuckartz, 2004).
Methodological Challenges During the whole period of the field studies, I was aware of the influential factor of my cultural background. During all stages of the research process, I reflected the potential of, my Eurocentric mindset to influence my research activities. As a “cultural outsider” it is difficult to feel, perceive and see things the same way as people do in Burkina Faso. The fact that I am a Toubabu3, granted me superior respect amongst locals, which was facilitated by the fact that I am a male. This of course influenced the content of information I got. On the one hand it became apparent that I was told more information than the respondents would tell to affiliates in the village. On the other hand, it was clear that certain kind of information is highly confidential, e.g. the number of cows that a cow farmer owns.
The language barrier was a clear hindering issue. The local language is hard to translate. The context needs to be known very well in order to get the full meaning. Due to the help of a highly skilled interpreter, losses in translation were kept to a minimum.
With reference to Eriksen (1995) I sometimes trespassed a hidden border, or broke a cultural law, but I am confident that such errors in were not repeated.
Results Category Scheme The fieldwork delivered overwhelmingly dense information. In order to grasp all the influential factors, the necessity for a category scheme was given. It was not possible to fit this into an existing normative category scheme. It has however emerged that it is necessary to utilize an adapted, expanded and more detailed category scheme.
3 The word in Jula for foreigner

50
PROCEEDINGS Conference MPDES 2011
In this work, basically technical and non technical problems are distinguished. The methodological data interpretation approach, according to Mayring (2002) revealed the relevance to categorize technical problems in two categories - planning construction choice of technology and technological aspects of operation. The non technical problems were categorized in socio-cultural setting, institutional/ infrastructure, economic, and availability of natural resources.
Categories In the following it will be elaborated on the six categories divided into technical and non technical factors.
Technical factors Planning, construction and choice of technology Technology can only be as good as the nature and quality of the supporting mechanisms, viz. context conditions in place (Mulugetta, 2008). Following this, site planning is an important factor. This comprises design issues concerning the construction, the gas distribution system, the feedstock storage, and as well as the utilization of by-products and the appropriate location (Akinbami et al., 2001). This impression was supported by the evaluation of a currently operational biogas plant in Burkina Faso where the digester and the water supply were inconveniently situated and the latrines were not connected to the digester.
The size of the biogas plant has to be suitable for the context. If the plant is over dimensioned, the economical efficiency of the biogas plant decreases and the microbiological activity is low (Amigun and von Blottnitz, 2007).
Examination of failed biogas projects during the field trips confrimed that poor, imprecise construction techniques, poor choice of materials, due to inexperienced contractors and consultants (Day et al., 1990), and unsatisfactory technology in combination with inadequate repairs and maintenance, were reasons for the malfunction of biogas plants (Bhat, Chanakya and Ravindranath, 2001). Interviews and observations have revealed that special care was given to the quality of construction and the used materials in the last few years by IRSAT and CREPA. This has resulted in reduced breakdowns. IRSAT employed highly skilled personnel for the construction work, while the representative of IRSAT commented that “Burkina Faso is lacking expertise in producing highly sophisticated materials”.
Currently, the Chinese fixed dome type or the Indian floating dome type have been the prime reactor designs installed in Burkina Faso. These reactor types are named after their origins. The fix dome type is mainly made out of bricks. As seen in detail in figure 2. It has typically a cylindrical shape with a manhole on top and an inlet and an outlet (Amigun and von Blottnitz, 2007). This type is cheaper compared to the floating dome since it uses locally available materials and needs less maintenance, but it is more vulnerable to gas tightness problems (Akinbami et al., 2001). The Indian floating dome type has a cylindrical or cubic form for the top part. This so called gasholder
Figure 2: Fixed dome type (Fraenkel, 1986)
could be made out of metal, fibre glass or any similar material. The gasholder is floating on top of the digester tank and rises and falls with gas production and usage. This has the positive effect of a nearly constant gas pressure (Day et al., 1990). Furthermore, it allows a visual monitoring of the gas production and consumption (Sendegeya and Silva, 2000). This type, is in general, more expensive compared to the fixed dome since it uses more industrial advanced materials, which are not locally available. Due to the comparable high tech materials, the digester needs more maintenance (Akinbami et al., 2001).
Figure 3: Floating dome type (Fraenkel, 1986)
The time of construction depends on the condition of the underground material. If for example rocky ground it would take longer to dig the hole. The chief researcher of IRSAT commented “Once the hole was dug, the plant was finished very fast”. Under favorable conditions, the construction can take between one to two months up to more than a year. This shows that the time of construction plays an important role. The expert interviews and the focus group interviews showed that long construction times have a negative effect on public opinion and increases costs.
Amigun and Blottnitz (2007) suggest that the success of a biogas project also depends on the location for the intended site. It is important to stay away from water sources in order not to pollute them. I also observed that regular bush fires could endanger the safe operation of plants. Climatic conditions are also important, as the production of the biogas varies with temperature and water content (Kaltschmitt, 2001).
51
PROCEEDINGS Conference MPDES 2011
Technological aspects of operation According to the interview with the chief researcher at IRSAT, the lack of maintenance is a common factor influencing the success of an installed biogas plant in Burkina Faso. The lack of spare parts is unfortunately a very common problem (Bugaje, 2006). The chief researcher of IRSAT reported, that often spare parts cannot be purchased due to weak financial capacities or even due to unavailability of spare parts in the country. The responsible operators sometimes underestimate the work and time efforts in operating and maintaining a digester (Parawira et al., 2009). This results in slackness of feeding the digester, as well as observing and breaking the scum on top of the digestate (Mwakaje, 2008). The experience of IRSAT showed that people who are operating the biogas plant are not aware of the work load. The literacy skills which are needed in order to control and monitor the digester, are sometimes not met by the rural population (Bhat, Chanakya and Ravindranath 2001).
As observed, discontinued production and use of gas (e.g. caused due to school holidays or personnel fluctuation), may lead to process breakdowns. Once the fermentation process is stopped it needs a considerable amount of time (minimum 35 days) to restart. Therefore, during operation special attention has to be given to the needed milieu conditions: oxygen content, water content, substrate structure, nutrients, temperature, pH–value, loading rate, retention time, mixing, scum control, and inhibiting substances which influence the plant efficiency to a great extend (Kaltschmitt, 2001).
The technical factors, comprising of aspects of operation and planning and construction and Choice of technology did not have any particular consequence of the dissonance between the field of biogas and the habitus of the society in Burkina Faso. The interfering elements are rather rigid and can be regarded as fixed external determinate. These factors are well known and are usually taken into consideration in biogas projects.
Non technical factors Socio-Cultural setting The focus group revealed that the choice of substrate (whether it be animal manure or human faeces) seems to be a very crucial factor in biogas projects in Burkina Faso. In some cultures a socio-cultural stigmatization exists towards dealing with human faeces which led to a complete refusal of the technology by the population (Taelea, Gopinathana and Mokhuts‟oane, 2007). This goes along with the observed doubts of a kitchen chef who said “it would be strange to use gas produced from human feaces - the food could smell like toilet”. The results from the focus group discussion with the children revealed similar results. They do not have any concerns when animal feaces are used for biogas production. However human faeces were generally rejected by the pupils and regarded as filthy.
Some cultures refuse pig manure due to religious reasons (Sendegeya and Silva, 2000). According to the chief researcher of IRSAT there are problems with the
solid fraction of human faeces, while there is hardly any resistance using human urine.
Akinbami et al. (2001) recognized the importance of wood fire for the taste of the traditional food. One kitchen chef remarked that To4 tastes better when cooked with wood while for other kinds of food, it does not matter. Also the cooking time plays an important role. It was said that “the time is important because the food needs to be cooked over a very long time in order to taste good”.
It was observed that the cooking convenience is also an influential factor. This includes the time needed for cooking the food, as well as the number of stoves which are in operation. I found out that a minimum of two stoves (ideally three) are needed for cooking in a convenient way. It takes longer to cook with biogas than with conventional fuels (Mang et al., 2007). Therefore people tend to prefer conventional fuels for cooking.
Public awareness of biogas processes is an important social driver which influences the adoption of biogas technology. Participants, who were not confronted with biogas before, improved their knowledge about biogas through the focus group interviews. The increased understanding of biogas, with its advantages and disadvantages, resulted in an increased acceptance of biogas technology among the focus group participants.
Key facilitators play an important role whether a new technology will be accepted or not in a village. The interviewed representative of IRSAT quoted:”If you find one person who likes the technology, it solves a basic problem and the others will accept it”. It was observed that in the villages the Notables du village, board of elders, play the main role as key facilitators. The term key facilitator also includes partners who hold a key role, influencing the dissemination of biogas in Burkina Faso.
Ownership of biogas plant installations is a crucial factor. Due to the high investment cost the construction needs to be financed by foreign institutions. According to the personal information by an expert of CREPA, technological installations that are completely subsidized without any contributions from the target group, tend to be left alone after completing construction. Biogas users who are inadequately informed, fail to distinguish between the raw animal manure and the highly valuable digestate (Srinivasan, 2008). It is vital that the target group, especially women who are in charge of firewood collection in Sahalian communities, feel the short, medium and long term economic, ecological and social benefits of the biogas plant. Furthermore, it is also important that people perceive the effects on their increased living standards (Almoustapha,et al., 2009). Therefore the level of ownership is a strong influential factor for the adoption of biogas technology in Burkina Faso.
Projects intending to introduce new energy technologies in Africa have shown, in many cases, shortcomings of proper understanding of the needs, problems, capabilities and priorities of the target users (Parawira, 2009). Many of the introduced biogas plants in Africa, based on technology and knowledge from India and China, are not
4 Local food, main component millet
52
PROCEEDINGS Conference MPDES 2011
functional as national interests and individual family/community interests are colliding. Hence, biogas technology depends on individual interests and may not totally respond to those on a national level (Ni and Nyns, 1996).
The socio-cultural factors are mainly a result of the differences between field and habitus. The research showed that utilizing biogas, with its corresponding appliances, is not part of the social practice of the rural society of Burkina Faso. The habitus came to the fore since cultural and social practices did not comply with the field of biogas technology.
Institutional and Infrastructure Proper social, cultural, political and economical institutions form a base for supporting adoption, dissemination and appropriate contextual innovation of the biogas technology (Murphy, 2001). Currently, the government of Burkina Faso is taking part in the national biogas program Biogas for Better Life (B4B), initiated by a Dutch NGO - SNV. It strives to improve the dissemination of biogas in Burkina Faso. The strategy for the B4B program in Burkina Faso is to involve the government (respectively Ministry for Environment and Livelihood, Ministry of Mines and Energy, Ministry of Agriculture and Water Resources, and Ministry of Livestock Resources) (Mang et al., 2007). This was underpinned by a SNV representative involved in the B4B project. It was noted, that the expected activities of B4B will also have effects on the legislation and erode the legal und bureaucratic barriers, while empowering new policy makers.
In Burkina Faso, three levels of institutions which influence the implementation of biogas, can be distinguished. These are the national level, the interregional or regional level (districts or departments), and the local level (villages or groups within the village). As stated in the interview with the representative of the Ministry of Livestock Resources, the intensity of coordination among these three layers, determines the efficiency of biogas implementations in Burkina Faso.
Unfortunately, there are currently hardly any academic institutions dealing with biogas in Burkina Faso (Oumar, 2008). It is a prerequisite for the further dissemination of the biogas technology that local researchers dedicate their investigations to biogas.
In the past, there was a partial absence of academic, bureaucratic, legislative and commercial infrastructure in the country. Therefore, not enough support was given and some projects were dismissed, due to these shortcomings (Parawira, 2009). In this respect, the bureaucratic and legislative infrastructure supporting biogas projects in Burkina Faso has improved in the last couple of years. Such effects are mainly due to the B4B project. But still there is no real target group on biogas in Burkina Faso with a governmental status. So far, there are no laboratories which are equipped for analyzing biogas plants on a full scale.
In the past, there was hardly any commercial infrastructure allowing biogas installations, but according to the interview with the representatives of CREPA and IRSAT, materials are now becoming more available and
construction companies have started to specialize in biogas constructions.
The habitus of the social, cultural, political, academic, and economical institutions in Burkina Faso does comply fully with the field of biogas. Most institutions have not yet developed a proper way to integrate biogas technology into their structure. Universities, for example have not yet started to investigate in biogas. Construction companies do not offer the construction of a biogas plant on a professional level. The government does act in favor of the new technology, with assistance of the donor community.
Economic Parawria (2009) used the term “financial factors” which refers mainly to monetary aspects. In this study the term economic was a much broader definition. By using the term “economic”, it is intended to extend this category with non monetary aspects. It is referred to the set of capital factors commonly used in the sustainability discourse by Goodwin (2003), which allows a more holistic approach in this category.
Lack of money for operation and maintenance is a common problem in any biogas program in Africa. According to the interview with the chief researcher of IRSAT, many plants have closed operation in Burkina Faso due to this reason. Without a proper financial long term support a continuous biogas production does not seems to be possible. The monetary benefits for the local community are moderate. In most cases there are only very limited income generating opportunities stemming from the sale of biogas and fertilizer (Adeoti et al., 2000).
The overall cost benefit ratio depends strongly on the topography of the area, agricultural productivity, labor cost at the site location, community participation, learning curve, technology, cost of substrate, use of the biogas product, potential for selling the (by-) products, markets for inputs and outputs, and system of organization, just to name the most important issues (Amigun and von Blottnitz, 2007; Parawira, 2009).
Each new biogas plant connotes changes in the socioeconomic equilibrium of the affected society. In the past, it was hardly considered to compare the social cost and the social benefits. My observations revealed that the labor input and the necessary adaptations of the social system involved in a biogas plant may, be higher than the benefit.
The input, in terms of work, needs to be measured against the benefits of utilizing biogas. During the field research, one example of a biogas project was critically observed. In order to supply a school kitchen with some biogas for cooking, it would need the co-operation of the entire village and the nomadic cow herders. One has to ask if this is still socially maintainable? Is it really worthwhile mobilizing a bunch of people who need to put a lot of work, time and other resources in this project for acquiring just enough gas for cooking?
Another crucial issue for adopting biogas technology is the labor effort and the financial costs for switching to biogas, compared to conventional fuels. Several biogas projects in Africa have experienced that the rural population finds it much easier to burn biomass directly,

53
PROCEEDINGS Conference MPDES 2011
instead of operating a work intensive biogas plant (Taelea, Gopinathana and Mokhuts‟oane, 2007). In contrast, the increasing costs for traditional fuels (kerosene, wood, etc.) are facilitating the adoption of biogas technology (Walekhwa, Mugisha and Drake, 2009). The interviews with the kitchen chefs showed that price, followed by the handling convenience of the fuel type, determines which energy source is used. Energy from biogas always needs to be compared with conventional energy sources available in the rural areas of Burkina Faso. This presupposes the evaluation of current energy needs, and energy consumption patterns in the intended project area, in order to estimate the potential of the competing energy technologies. According to Taelea et al. (2007) in some cases it is far less effort to stick to conventional fuels, primary wood.
The environmental impact has to be compared with the environmental benefit of biogas plants as well. It is true that the operation of biogas plants reduce the pressure on wood resources, what reduces CO² emissions. But when the biogas plant does not work properly, methane could evaporate into the atmosphere and magnifies the green house effect.
These discussed issues have found little attention in past literature, but observations during this project underpin the importance of these issues.
The economic factor is indirectly connected to the field habitus dissonance of the socio-cultural aspects. Since biogas is not a part of the social practice, people are not really prepared to invest money, work or time. In this context it is very important to consider the ratio of monetary- and social cost and benefits, as well as the ratio of environmental impacts and environment protection.
Availability of natural resources On site, two main factors are influencing the effective operation of a biogas plant. Primarily, the availability of the process water and secondly, the availability of substrate on site are crucial. Water scarcity led in certain areas in Burkina Faso to the breakdown of the digestion process. This can be either rendered by a priority shift of water usage to e.g. irrigation, drinking water or by the labor intensive activity of fetching the water and transporting it to the biogas plant (Abbey, 2005; Akinbami et al., 2001). Water scarcity is a crucial problem in Burkina Faso, influencing the effective operating ability of biogas plants (Krings, 2006).
Additionally, it can be difficult to make substrate available on site (Bhat, et al., 2001). One main reason is frequently the lack of sufficient domestic animals (Karekezi, 2002). This can be caused by nomadic or semi-nomadic herding systems or by the fact that it is against the cultural habit for settled farmers to practice extensive cattle herding. This is the most common observed reason for the lack of substrate in Burkina Faso. Cattle thefts in Lesotho have been found to be minor reasons for stock reduction, followed by a shortage of substrate (Taelea, Gopinathana and Mokhuts‟oane, 2007). Cattle theft happens in the east of Burkina Faso on a regular base and has a considerable influence on the manure availability (Oumar,2008). Nomadic and semi-nomadic behavior makes dung collection difficult since the manure is
scattered around in the Savanna. Additionally it was observed by Berglund and Borjesson (2006), that the energy balance is negative when transport distances for substrates exceed. As observed during the field trips, this is a serious problem in the visited biogas plants. In some places, the manure has to be delivered by a truck. A truck, if available at all, is a luxurious commodity that consumes expensive fuel, therefore offsetting the advantages of the biogas plant.
Water and substrate are needed in equal ratios. They could contain some process inhibiting substances, e.g. antibiotics, pollutants or micro-pollutants e.g. hormones which create operation difficulties (Kaltschmitt, 2001). Previously no distinct attention was given to the input materials as a limiting factor for biogas projects.
The natural resources factor is partly a result of the field habitus divergence. The social habitus of the herders, incorporates a nomadic herding system. This stands in opposition with the biogas technology. People do use and value water for other purposes other than operating a biogas plant.
Figure 4: Overview influential factors
Conclusion The study revealed six broad categories of factors influencing the adoption and use of biogas technology. These factors have been, grouped into technical and non technical factors.
The study showed that the non technical factors influence the operating ability of a biogas plant in Burkina Faso to a great extend. This stems from a dissonance of the social habitus of the society and the field of biogas technology. It can be seen as one explanation for the poor success of biogas programs in Sub-Saharan countries, although the same programs are successfully running in India, China and Vietnam (Oumar, 2008; Parawira, 2009).
The presented assemblage of factors should provide a sound base for better management of future biogas projects in rural areas of Burkina Faso. Furthermore, it
Influncial Factors
Technical
Planning, construction,
technology choice
Technological aspects of operation
Non - technical
Socio-Cultural setting
Institutional/ Infrastructure
Economic
Availability of natural
resources
54
PROCEEDINGS Conference MPDES 2011
will provide a categorization-grid to develop a framework for what is needed to be considered when implementing a biogas plant in Burkina Faso. The analysis underlines the problems with biogas plants in Burkina Faso also have a non technical aspect. This should strongly encourage investigations in the socio-cultural, environmental and economical factors in the future. However, this will require interdisciplinary co-operation of experts in the different disciplines, in order to overcome the monistic technical approach to biogas technology investigations.
References Abbey, A.T. (2005). Biogas in Uganda: a new experience.
LEISA 21:13–15. Adeoti, O., M.O. Ilori, T.O. Oyebisi, and L.O. Adekoya
(2000). Engineering design and economic evaluation of a family-sized biogas project in Nigeria. Technovation 20:103–108.
Akinbami, J-FK, M.O. Ilori, T.O. Oyebisi, I.O. Akinwuni, and O. Adeoti (2001). Biogas energy use in Nigeria. current status, future prospects and policy implications. Renewable & Sustainable Energy Reviews 2001:97–112.
Almoustapha, O., S. Kenfack, and R. Millogo-Rasolodimby (2009). Biogas production using water hyacinths to meet collective energy needs in a Sahalian country. Field Actions Scientific Report. 2:27–32.
Amigun, B and H von Blottnitz (2007). Investigation of scale economies for African biogas installations. Energy Conversion & Management. 48:3090–3094.
Anpabli, C.K. and S. Gyasi (1997). Biogas energy production in Ghana: environmental pollution analysis. Ghana J. Chemical 3:1–6.
Banglapedia. National encyclopedia of Bangladesh (2005). http://banglapedia.search.com.bd/HT/ B_0520.htm (05 Apr 2009).
Berglund, M. and P. Borjesson (2006). Assessment of energy performance in the life-cycle of biogas production. Biomass Bioenergy 30:254–266.
Bhat, P.R., H.N. Chanakya, and N.H. Ravindranath (2001). Biogas plant dissemination: success story of Sirsi, India. Centre for Application of Science and Technology for Rural Areas (ASTRA) and Centre for Ecological Sciences Indian Institute of Science, Bangalore 560 012, India. Energy for Sustainable Development 1:39–46.
Bourdieu, Pierre (1985). Espace social et genèse de "classe". Sozialer Raum und "Klassen", Frankfurt am Main: Suhrkamp.
Bourdieu, Pierre (1981). Klassenschicksal, individuelles Handeln und das Gesetz der Wahrscheinlichkeit. p 169-226 in: Ders. et al.: Titel und Stelle. Über die Reproduktion sozialer Macht. Frankfurt a. M.: Europäische Verlagsanstalt.
Bourdieu, Pierre and Roswitha Schmid (2001). Das politische Feld. Zur Kritik der politischen Vernunft, Konstanz: UVK.
Brown, V.J. (2006). Biogas a Bright Idea for Africa. Environmental Health Perspectives 114:301–303.
Bugaje, I.M. (2006). Renewable energy for sustainable development in Africa: a review. Renewable & Sustainable Energy Reviews 10:603–612.
Corbin, J. and N.L. Holt. (2006). Grounded Theory. In: B. Somekh and C. Lewin (ed.) Research methods in the social sciences, London: Sage.
Coulibaly, A. (2006). Burkina Faso. Competition regimes in the world - A Civil Society Report. competitionregimes.com/pdf/Book/Africa/40-Burkina%20Faso.pdf. (25 Apr 2009).
Davidson, O.R. (1992). Energy issues in sub-saharan Africa: future directions. Annual Review of Environment and Resources 17:359–403.
Day, D.L., T.H. Chen, J.C. Anderson, and M.P. Steinberg (1990). Biogas Plants for Small Farms in Kenya. Biomass 21:83–99.
Economist The (1995). The future of energy. the battle for world power The Economist 337:23.
Engler, S. (2003). Habitus, Feld und sozialer Raum. Piere Bourdies Theorie des Sozialen, Probleme und Perspektiven;. Zur Nutzung der Konzepte Pierre Bourdies in der Frauen- und Geschlechterforschung. In :Theorie und Methode Sozialwissenschaften, Pierre Bourdieus Theorie des Sozialen. Probleme und Perspektiven. Konstanz: UVK Verl.-Ges.
Eriksen, T.H. (1995). Small places, large issues. An introduction to social anthropology, London: Pluto Press.
Fraenkel, P.L. (1986). Water lifting devices. FAO Irrigation and Drainage Papers 43:311
Gallert, C. and J. Winter (1998). Mikrobiologie anaerober Gärprozesse. DECHEMA Fachgespräche Umwelt: Technik anaerober Prozesse :19-34, In: DECHEMA e.V. Trametes versicolor under non-sterile conditions. Bioprocess Engineering 21:5-12, 1999.
Green, J.M. and N.T. Sibisi (2002). Domestic biogas digester - a comperative study. Community Resources, University of Natal, Pietermaritzburg. Domestic use of Energy Conference 2002.
Goodwin, Neva R. Jannuary (2003). Five Kinds of Capital: Useful Concepts for Sustainable Development, Medford.
Gotschi, Elisabeth, Andreas Hunger, and Klaus Zapotoczky. (2007). Politik - Programme - Projekte. Menschenorientierte Entwicklungszusammenarbeit im Sinne von Bourdieu. Vol. 10, Linz: Trauner.
Helfferich, C. (2004). Die Qualität qualitativer Daten. Manual für die Durchführung qualitativer Interviews ; [Lehrbuch], Wiesbaden: VS Verl. für Sozialwissenwiss.
Kaltschmitt, M. (2001). Energie aus Biomasse. Grundlagen, Techniken und Verfahren mit 124 Tabellen, Berlin: Springer.
Karekezi, S. (2002). Renewables in Africa. meeting the energy needs of the poor. Energy Policy: 1059–1069.
Kossmann, W., U. Pönitz, S. Habermehl, T. Hoerz, P. Krämer, B. Klingler, C. Kellner, T. Wittur, F. Klopotek, A. Krieg, and A. Euler (1998). Biogas Digest. Volume I - Biogas Basics, Eschborn.
Krings, T. (2006). Sahelländer. Mauretanien, Senegal, Gambia, Mali, Burkina Faso, Niger ; mit 13 Tabellen; Geographie, Geschichte, Wirtschaft, Politik. Darmstadt: Wiss. Buchges.

55
PROCEEDINGS Conference MPDES 2011
Kuckartz, U. (2004). Qualitative Datenanalyse. computergestützt. Methodische Hintergründe und Beispiele aus der Forschungspraxis., Wiesbaden: VS Verl. für Sozialwiss.
Mang, H. P., E.-M. Huba, A. Papa, S. Oumar, K. Gombila, and P. Bracken (2007). Feasibility Study of a National Domestic Biogas Programme in Burkina Faso, Eschborn.
Mashandete, A.M. and W. Parawira (2009). Biogas technology research in selcted sub-Saharan African countries. A review. African Journal of Biotechnology 8:116–125.
Mayring, P. (2002). Einführung in die qualitative Sozialforschung. Eine Anleitung zu qualitativem Denken, Weinheim: Beltz-Verl; Beltz-Verl.
Metzler, J.B. and C.E. Poeschel (1992). Länderbericht: Burkina Faso 1992. Burkina Faso 1992, Stuttgart: Hermann Leins GmbH & Co.KG; Metzler-Poeschel.
Misi, S.N. and C.F. Forster (2001). Batch co-digestion of multi-component agro-wastes Bioresource Technology 80:19–28.
Mulugetta, Y. (2008). Human capacity and institutional development towards a sustainable energy future in Ethiopia. Renewable & Sustainable Energy Reviews. 12:1453-1450.
Munzinger, E. (2008). Burkina Faso - gesamt, Ravensburg: Munzinger-Archiv GmbH.
Murphy, J.T. (2001). Making the energy transition in rural East Africa: Is leapfrogging an alternative? Technological Forecasting and Social Change 68:173–193.
Mwakaje, A. G. (2008). Dairy farming and biogas use in Rungwe district, South-west Tanzania: A study of opportunities and constraints. Renewable & Sustainable Energy Reviews 12:2240–2252.
Nes, W.J., van and T. D. Nhete (2007). Biogas for a better life. An African initiative. Renewable Energy World:184–187.
Ni, JI-QIN and E.-J. Nyns (1996). New concepts for the evaluation of rural biogasmanagement in developing countries. Energy Conversion & Management 37:1525–1534.
Oumar, S. (2008). Dissemination of improved stoves and biogas experiences in Burkina Faso. South-South cooperation in the field of Biomass energy - Challenge and opportunities, Ouagadougou: IRSAT.
Pandjaitan, M.H. and M. Hutapea (1990). The implementation of biogas technologies in Indonesia. In: Int. Conf. Biogas Technol. Implementation Strategies, Bremen: BORDA.
Parawira, W. (2009). Biogas technology in sub-Saharan Africa. status, prospects and constraints. Reviews in Environmental Science and Bio/Technology 8:187–200.
Raphael, M.J. and R. Matengaifa (2009). Optimization of biogas production by anaerobic digestion for sustainable energy development in Zimbabwe. Renewable & Sustainable Energy Reviews 13:1116–1120.
Sendegeya, A.-M. and I. P. Silva (2000). Benefits of uisng biogas in housholds. Experinces from a user in Uganda, Makerere University.www:active.cput.ac.za/energy/web/due/papers/…/027A_Sendegeya.pdf. (26 May 2009).
Slezak, G. (2008). République Démocratique du Burkina Faso. Länderinformation. http://www.oefse.at/publikationen/laender/burkina.htm (07 Mar 2009).
Srinivasan, S. (2008). Positive externalities of domestic biogas initiatives. Implications for financing. Renewable & Sustainable Energy Reviews 12:1476–1484.
Taelea, B.M., K.K. Gopinathana, and L Mokhuts‟oane (2007). The potential of renewable energy technologies for rural development in Lesotho. Renewable Energy 32:509–522.
Walekhwa, P.N., J. Mugisha, and L. Drake (2009). Biogas energy from family-sized digesters in Uganda. Critical factors and policy implications. Energy Policy 37:2754–2762.
Weyer, Johannes (2008). Techniksoziologie. Genese, Gestaltung und Steuerung sozio-technischer Systeme, Weinheim: Juventa Verl.
Zhang, P.D., Y.L. Yang, J. Shi, Y.H. Zheng, L.S. Wang, and X.R. Li (2009). Opportunities and challenges for renewable energy policy in China. Renewable & Sustainable Energy Reviews. 13:439–449.

56
PROCEEDINGS Conference MPDES 2011
Policy and regulatory framework conditions for small hydro power in Sub-Saharan Africa
Fritz Kölling ([email protected])
Sustainable Energy & Environment Resedenweg 70, 76199 Karlsruhe, Germany
Mirco Gaul ([email protected])
Miriam Schroeder ([email protected]) SiNERGi Consultancy for Renewable Energies Mahlower Str. 23-24, 12049 Berlin, Germany
Abstract The vast potential of mini and micro hydro power (MHP) in Sub-Saharan African countries is one promising option to cover increasing energy demand and to enable electricity access for remote rural communities. Based on the analysis of 6 African countries (Ethiopia, Kenya, Mozambique, Nigeria, Rwanda, South Africa), this study sheds light on some of the main barriers on the level of political and regulatory framework conditions which include gap between the national-level policies and regulations and local MHP project implementation, lack of financing and limited capacities for project planning, building and operation. The paper also identifies some promising practices employed in several SSA countries of how to overcome these barriers and concludes with recommendations of how to create positive feed-backs between ambitious policies and regulations and MHP financing and capacity development needs in order to scale up MHP deployment and MHP sector development. Keywords: micro hydro power, Sub-Saharan Africa, sector development
Introduction: Why dealing with small hydro power in Sub-Saharan Africa
Access to modern energy services is one of the basic preconditions for economic and social development and thus an important requirement for poverty reduction. It is therefore substantially interrelated to most of the Millennium Development Goals (MDGs). The increased use of renewable energies sources in the supply system also helps to reduce CO2 emissions and thereby contributes to the global fight against climate change.
In Sub-Saharan Africa1, biomass energy is still predominant in the national energy balances, with 625 Mio people (83%) relying on solid biomass for cooking and heating (UNDP/WHO, 2009). Still 560 Mio people (74 %) live without access to electricity – Sub-Saharan Africa (SSA) is the region with lowest coverage in the world. Electrification rates are particularly low in rural
1 By UNDP definition Sub-Saharan Africa comprises 45
countries, of which 31 are currently classified as Least Developed Countries (LDCs) by the UN ECOSOC. The total population of SSA has been 759 Mio in 2007.
areas (with the exception of South Africa); in most of the countries below 10%. In most Sub-Sahara African countries electrification is not only hindered by the high costs of extending the grid, but also by limited generation capacities and a dependence on imported fossil fuels. Renewable energy technologies have a high potential to contribute to a modern rural energy supply. Amongst them, small hydro power is one of the most feasible options wherever the geographical conditions permit the use of the hydrological potential. It does not only provide electricity for lighting and communication (as solar PV does), but can deliver enough capacity to supply mini-grids and thus constitute the basis for various forms of productive use of electricity including small industrial applications. Therefore this paper aims to analyse the policy and regulatory framework conditions under which small hydropower can be developed in Sub-Saharan Africa.
The paper first outlines the potential of micro hydro power (MHP) and its current positioning in terms of existing and planned MHP projects in Sub-Saharan Africa. As a second step, the main barriers for MHP sector development are briefly described and wherever possible underlined with some examples from the field. For each main barrier, several potential and existing mitigating strategies are outlined and good practices are identified. The paper concludes with some preliminary recommendations of how the gap between existing top-down regulation and regulatory needs of MHP projects can be overcome in order to deploy MHP in Sub-Saharan Africa on a larger scale.
Relevance of small hydro power in Sub-Saharan Africa Relevance for energy supply: Big potential untapped 12 % of the world’s hydro potential is found in Africa – and due to geographical conditions most of it is located in the Sub-Saharan part. But in no other continent the gap between actual hydropower generation and the technologically exploitable potential is bigger than in Africa, where only 5 % of the potential is currently tapped (ESHA, 2006). Looking at small and micro hydro schemes, the gap is probably even bigger, but there are no estimations about the potential. There are different

57
PROCEEDINGS Conference MPDES 2011
classifications of small hydropower2: This paper focuses mainly on MHP below 200 kW and to a smaller extend also includes mini hydro plants (below 1 MW). This size is suited to furnish insular grids providing electricity to rural villages (which is a main focus of technical cooperation) but also to feed into public grids. Bigger plants are in most cases out of the range of technical cooperation and require a much longer planning period and different constructive characteristics such as dams etc.3
Small and micro-hydro power plants have a long tradition in Africa, but never reached a massive dissemination, although the geographical conditions in some regions are favourable. While China alone has developed more than 45,000 plants below 10 MW, in the whole of Africa there are not more than a few hundred MHP plants in operation4. There are some early electrification projects comparable to European development (e.g. in 1895, in Cape Town the first South African hydropower station was constructed), consisting of hydro systems which powered large farms and industries and a number of plants operated by church missions as well as mechanical mills. In most of the countries the existing MHP plants were funded by international donors or NGOs and remained isolated projects, which are rarely well documented and were never scaled up. In addition to electricity generation, mechanical water mills are commonly used in some countries such as Mozambique and Uganda.
In the last decade, however, some countries have made progress in promoting MHP more systematically, moving away from demonstration and pilot programs to large-scale initiatives. In most of these countries, amongst them Rwanda, Kenya, Ethiopia and South Africa, decentralized renewable technologies such as MHP have been mainstreamed in regional and national policy documents. Incentives like tax reductions and feed-in tariffs have been established or are at least in discussion. In Rwanda, small hydro is contributing a significant portion to the installed capacity, and even micro hydro is becoming a significant contribution. Key to the Rwandan success has been a sector wide approach (SWAp) by various donors, lead by a strong Ministry for Infrastructure who sets clear targets and provides a policy framework and own budgets for the electrification of the country. While governments and donors in some countries bundle their efforts to push electrification, also private project developers are taking an increasing interest in decentralized renewable technologies. The pioneers have given way to larger, more sophisticated companies with strong links to international players. The European Small Hydro Power Association considers Uganda and Kenya as countries with promising
2 Most common is the classification: pico: < 5-10kW, micro:
10 – 100 kW, mini: 100 kW – 1 MW, small: 1 – 10 MW (ESHA/IT-Power, 2006).
3 The remaining paper will refer to micro-hydro power (MHP) sector development, even if this partly incorporates small-hydro and mini-hydro power sector development.
4 In a desk survey conducted for 15 SSA countries, the authors could identify a total of 218 existing small hydro power plants (below 10 MW) and 600 – 1000 mechanical water mills (see annex for the referenced documents).
short-term MHP markets, while countries such as Mozambique, Zambia and Rwanda offer good medium-term perspectives (ESHA-IT 2006).
Small hydropower offers a chance to tackle the three major challenges of the African energy sector development by
Helping to increase rural electrification rates Installing additional capacity for the national and
local grids, independent from imported fuels Promoting productive use of energy in
structurally underdeveloped areas
Unfortunately there is not much evidence regarding impacts of MHP in Sub-Saharan Africa. As in other countries, productive uses of energy in rural areas can only be expected if complementing measures are included in the project design, such as micro-credits for machines, better linkage to markets and small and medium enterprise (SME) promotion.
Existing plants and small hydro projects: scattered information It is difficult to elaborate a baseline for small hydro development in Africa, as information is found in scattered form and only for some countries. This is valid even more for mini and micro hydro sites, which are documented only in a few well-known cases. Furthermore, different sources of information provide inconsistent data about exiting plants. Even where detailed baselines studies have been elaborated (like in South Africa), there are no reliable figures about exiting plants.

58
PROCEEDINGS Conference MPDES 2011
In many countries, e.g. Tanzania, most of the existing plants still date back to colonial times; many of them were implemented by church missions. For example in Tanzania, more than 16 small systems were installed by church missions in the 1960s and 1970s. In Kenya, MHP plants from the 1950s are still in operation. On the other hand, in South Africa alone there are hundreds of de-commissioned plants, waiting for rehabilitation, while only a few new plants have been constructed in the last years. Many of the old sites mentioned in historic reports are forgotten and cannot even be located today. Figures about recent projects are easier to obtain because government action plans and information of ongoing donor funded projects allow for more accurate estimations. For example, in Rwanda, currently 15 MHP plants are under construction and another 21 are planned.
The estimated potential is mainly based on a rough analysis of water catchment areas and does often not consider whether there are potential consumers nearby or possibilities to feed in existing grids. Another proxy for the micro and pico hydro power potential of a country is the availability of mechanical hydro mills. These sites often allow an upgrading for power generation, as the people are already experienced with the use of hydro power. Examples are found in Ethiopia, where this technology was introduced by Arabs some hundred years ago, and other examples can be also found in Mozambique and Tanzania.
The following table shows potential and existing sites / capacity based on a desk research and interviews. 11 experts working in SHP projects in Tanzania, Kenya, Madagascar, Mozambique, Rwanda, Ethiopia and South Africa have been interviewed in May 2010.
One of the early non-governmental promoters of MHP in Africa is the British NGO Practical Action, who presented in 2000 some of the few well documented pilot projects5. At the moment they are implementing a regional
5 Tunga Karibi (Kenya), 4 projects in Zimbabwe and
Mozambique
micro hydro project with 15 installations in Malawi, Mozambique and Zimbabwe (Klunne, 2010). In Kenya, for example, over the past 3 – 4 years 60 MHP plants have been installed in the Mt. Kenya region, following a pilot project.
Main barriers and good practices for MHP development Although progress has been made in certain areas, the low number of existing MHP shows that there are still many barriers hampering the dissemination of this technology. In general, the lack of supportive policies, funding and payment abilities restrict investment incentives for private companies in the MHP sector (Hankins, 2008). The following barriers have been mentioned in interviews and in other reports: Policy and regulatory framework: Partly related to the
lack of financing and capacities is the inadequate regulatory framework for the MHP sector in many countries. In many cases, sufficient policies and regulations governing MHP development simply do not exist. MHP development is either not regulated at all or it is part of a broader regulatory framework made for rural electrification which, however, leaves many aspects relevant for MHP unclear and in-transparent. This insufficient regulatory framework leads to situations in which e.g. MHP project developers often do not know which requirements apply and work in an unreliable grey area of regulation.
Financing: The lack of funds for MHP projects has been mentioned as one of the most severe barriers to sector development. So far, most of the MHP projects have to rely on donor funding, which will only be able to finance a small portion of the available hydro power potential. To become less dependent on public funding, the big challenge for further MHP sector development is therefore to tap other sources of financing, especially
Table 1: Current situation of MHP development in selected SSA countries Source: WEC 2007, GTZ Regional Reports 2009, interviews
Hydro power Ethiopia Kenya* Mozambique Nigeria* Rwanda South Africa*
Total installed capacity 662 MW 677 MW 2136 MW 1983 MW 27 MW 653 MW
MHP potential > 600
sites1
3000 MW Unclear 277 sites,
734 MW
333 sites,
96 MW
5.5 MW
(< 1 MW)
Existing MHP plants / installed capacity
Unclear 3 - 60
(1-80 kW)
6
(10-80 kW)
7
(1-10 MW)
6 45 - 96 MHP1
8 - 35 MW
(< 1 MW)
MHP plants under construction
5
(7-200 kW)
Unclear None Unclear 15 Unclear
MHP plants planned None 20 3 (23-600 kW) Unclear 21 Unclear

59
PROCEEDINGS Conference MPDES 2011
from the private venture capitalists and local banks, and ultimately to bring down MHP costs (currently costs are approx. 3,000 US$/kW).
Capacity to plan, build and operate MHP plants: Another serious challenge is the missing knowledge and awareness on MHP potentials for rural electrification; political decision-makers still tend to go for the “modern” and visible large hydro power schemes; political institutions from ministries via regulatory authorities to district administrations often posses only minimal capacity to design, implement and revise MHP supportive policies and regulations; and at a technical level, local capacity is often missing to plan, build and run MHP projects. The lack of a ready supply of affordable turbine parts and the lack of domestic manufacturing capacity for hydro systems of all sizes also poses a barrier to a swift and cost-effective MHP project development.6 For a sustainable and long-term MHP sector development, much effort has to be made to increase MHP-relevant capacities in Sub-Saharan African countries in order to reduce the dependence on foreign assistance.
Data on hydro resources: As politicians and the power utility often lack interest in MHP deployment and also lack the appropriate capacities and budgets, public data on potential MHP sites is often not available. Such a lack of sound basic data (e.g. on mid-to long-term hydrological, geographic, geologic data and figures on the current and future demand for electricity and social infrastructure, but especially on effects of seasonal and long-term river flow variations), poses a major barrier for private investors in MHP. Increasing climate variability and the destruction of rainfall catchment areas are making investment in hydropower systems a risky venture7.
Policies and strategies: progress in the last decade Clear targets and transparent planning A clear energy strategy with a strong focus on rural electrification is an important precondition for a significant dissemination of small hydro power. Besides a long-term vision, such a strategy should set concrete targets and include strategies for key areas as well as implementation plans with budget allocations, not only for the national investments but also incorporating the main international donors. There are, however, only a few notable rural electrification strategies that put a special focus on renewable energy deployment. For example, in Rwanda, a sector wide approach (SWAp) of all donors, based on a national energy policy with clear targets and poverty orientation, could mobilize US$ 400 million to increase the electrification rate from 6 % in 2005 to 16 % in 2012.
6 See various reports (e.g. Klunne, 2007), Goverment of
Kenya etc. 7 In Kenya, the estimated hydro potential has already
decreased due to deforestation and reduced precipitation (GTZ Regional Report, 2009).
Almost all Sub-Saharan African countries now have rural electrification plans but mainly focus on grid extension and hardly focus on renewable energies or even MHP deployment. For example, the Master Plan for Electrification of Mozambique aims to achieve an access ratio of 20% by 2020. Out of the US$ 850 million, US$ 200 million are earmarked for rural electrification projects. Although the rural electrification agency FUNAE has renewable energies in its portfolio, there are so far only three MHP plants in the pipeline. Some countries experience problems with the reliability of rural electrification plans. The availability of long-term grid extension plans enables the MHP investor to assess financial project viability. These plans provide useful information on whether a locality will soon enjoy grid extension or whether the set-up of an independent (MHP) mini-grid makes sense. There are, however, some countries like Ethiopia in which existing off-grid electrification plans are being revised almost on a yearly basis due to political reasons which severely diminishes their reliability for investors.8
In other countries rural electrification is often neglected in energy sector reforms, and adequate regulations for small and independent power producers are not in place. In this situation, MHP projects have to rely on site-specific funding by foreign donors, creating project islands which are difficult to scale up (and many times not even financially self- sustainable).
Incentives and promotion Generally, there are different policy options for the promotion of renewable energies, which are shown in the figure below. In the case of MHP in Sub-Saharan Africa, so far only some have been applied (highlighted in bold letters). Most incentives are given on the supply side, based on the installed capacity. Besides direct subsidies on the installation of plants, in some countries, e.g. in Mozambique, fiscal measures enhance the purchase and imports of certain equipments. Guarantees are only applied in one case in Rwanda, where a donor funded project promotes the financing of MHP through local banks. Most prominent generation based instrument to promote the use of renewable energies are feed-in tariffs, which have recently been introduced in some SSA countries, e.g. in South Africa and Kenya.
Quota obligations which force utilities and/or the demand side to deploy a certain percentage of renewable energy technologies have so far been introduced only in five countries (Australia, UK, Thailand, Poland, Japan), but not in Africa.
Most of the existing MHP in SSA have been subsidized either by donor agencies or public funds. If local governments are given the mandate and the budget, they are more prone to experiment with small-scale and cost-effective solutions like MHP than the planners in national-level agencies who like to “think big”. However, even if
8 In one example, after finalising the planning period for a
MHP, the grid was extended to this particular village. Fortunately, the on-grid generation is now a viable option. In countries without this option, e.g. in Tibet, large numbers of MHP have been shut down when the grid reached the area.

60
PROCEEDINGS Conference MPDES 2011
local governments decide to pilot MHP schemes, they often lack capacity and experience in choosing the appropriate contracting partner and in supervising the MHP deployment process. This linkage between rural electrification and decentralization is often not acknowledged - only South Africa, Madagascar and Sudan explicitly refer to energy issues in their decentralization process.
Supportive regulation and institutions for MHP development In many African countries, a general legal framework for renewable energy deployment is in place. The opening up of electricity markets to independent power producers has been an important step. However, the regulatory system is in most of the cases not adequate to promote decentralized solutions such as MHP. In many countries, it was established to regulate one or more large utilities. To be compatible with MHP, the system would have to be adjusted to regulate a large number of different entities, including small private power producers and community based cooperatives. In Kenya, for example, a MHP project (Thunga Kabiri) was at first not allowed to supply electricity directly to households due to legal requirements (although this problem could later be resolved). Another example is Ghana, were three different institutions have to give their permission to independent power producers to allow them to generate and distribute electricity. Based on the experiences made, the following paragraphs identify the main regulatory challenges in relation to MHP.
Setting of clear institutional arrangements A supportive institutional arrangement is crucial for MHP sector development. Due to the World Bank driven reorganization of the energy sectors, most of the Sub-Saharan African countries have a similar institutional set-up (see figure 2):
While the overall energy policy is made by the Ministry for Energy, often an additional regulatory body exists (sometimes even independent from the Ministry) in order to watch over the implementation of energy laws and regulations. Additionally, a rural electrification agency (REA) has the mandate to plan and implement smaller off-grid electrification projects. In some cases, the REA also manages a Rural Electrification Fund for off-grid electrification projects.
The utility, either as a vertically integrated public unit or already unbundled and partially privatized as several independent service companies for generation, transmission and distribution, usually remains responsible for grid extension. Small scale generation and mini-grids are implemented either by private companies, municipalities or community cooperatives.
Figure 1: Relevant institutions for MHP Sector
development
In many countries large, usually monopolist power utilities (either still state-owned or already privatized) hamper instead of support the dissemination of decentralized technologies. A 2008 study of the Southern African power sector by market researcher Frost & Sullivan, found out that national power utilities showed only limited interest in developing such projects. Where funds are available - and South Africa's Eskom is the utility most actively raising capital - investment is usually geared towards large-scale projects which promise to deliver power at a lower short-term cost per unit. As most countries follow this approach, off-grid MHP plants have to be shut down as soon as grid extension reaches their local mini-grids, instead of being allowed to feed power into the grid. Even in countries where feed-in-tariffs exist which oblige the utility to connect independent power producers (IPPs) to the grid, there are examples, e.g. from Uganda, where IPPs still need to negotiate conditions with the utility.
In opposition to Asia, were the number of small private service providers (SPSPs) in the energy and water sector has doubled between 1995 and 2005, SPSP activity in Africa was taking place on a much smaller scale due to their limited access to financial markets, high transaction costs and monopolistic structures of national utilities. Within Sub-Saharan Africa, a World Bank study identified only Kenya as a country with high incidence of SPSP (approx. 500,000 or 21 % of all households were electrified through a SPSP), but identified also an increasing trend of SPSP activities for Mozambique, Ethiopia and Uganda. There are also some countries like Senegal or South Africa, where SPSPs play hardly any role in offering electrification services (Kariuki 2005). A progress in the sector reforms might boost their number in the future and make them important intermediaries in the efforts of MHP dissemination. Successful small private hydro programs are mostly based on a Build-Own-Operate (BOO) concept, i.e. there is no transfer of the asset to the state at the end of a specified contract period or water use concession.
Setting of tariff levels and structures Guaranteed favourable tariffs for independent power producers to feed in public grids is the most common policy instrument to promote renewable energies in

61
PROCEEDINGS Conference MPDES 2011
industrialized countries. But there are also encouraging examples in developing countries: in Mauritius feed-in tariffs were the key drivers for increased bagasse cogeneration. In Sri Lanka feed-in tariffs boosted MHP plant rehabilitation and development of new plants in the last decade (AFREPREN, 2009).
In some SSA countries, it is now also possible to feed independently generated electricity into an isolated or public grid. South Africa, Kenya, Tanzania and Uganda are the first countries which have established feed-in tariffs; others are just starting to draft respective schemes. However, in most SSA countries IPPs still have to negotiate individual power purchase agreements (PPA) with the utility. Because most utilities are not obliged to buy electricity from IPPs, they either oppose power purchase right away (especially from small installations) or come up with tedious PPAs which in some countries have to be renewed annually. Under such conditions, MHP project development is not profitable for small sites. For Tanzania it is yet too early to evaluate the impacts of the new law. In Kenya and Uganda, the feed-in-tariffs don’t seem to be effective, because – at least in Kenya – the feed-in-tariff is only a ministerial-level policy and not an Act of Parliament, so that enforcement is restricted. Utilities often do not feel obliged to grant the specified tariffs to the IPPs, so that tariffs still need to be negotiated for each individual site. Many countries such as Rwanda and Ethiopia are already in the drafting process for feed-in-tariffs for renewable energies and it remains to be seen whether these also incorporate tariffs especially set for small-scale renewable energies or MHP in particular.
Setting of quality-of-service standards A similar situation exists in most countries in regard to quality-of-service requirements, which are often too tedious for MHP projects because e.g. large-scale and small-scale hydro power projects have to abide to the same regulation. This undifferentiated rule application pushes requirements for MHP projects unrealistically high. There are also countries which have no standardization of quality requirements at all or where its applicability for MHP is unclear.
Setting of entry requirements In many Sub-Saharan African countries, MHP project site developers are faced with an unclear and in-transparent regulation concerning MHP requirements. In order to get permission for the set up of a MHP project, developers usually have to acquire land and water usage rights, conduct an environmental impact assessment, and they often have to obtain industrial permits and permissions from the local government authorities. Furthermore, generation concessions and feed-in contracts or distribution concessions are required. In countries where requirements are not clear, project developers often prefer to “not wake a sleeping dog” and to go ahead with project development without inquiring about actual requirements. While such a strategy seems to work out for individual projects which are backed politically, a large-scale MHP sector development cannot rely on such an in-transparent system. A streamlining of requirements and a differentiation of requirements according to project type
and size (like in feed-in-tariffs) is therefore recommended. One positive example can be found in Tanzania, where requirements are differentiated for MHP plants larger than 1 MW (which then need a concession from the regulatory authority) and plants smaller than 1 MW (which only have to inform the regulatory authority). In Madagascar, the ministry issues permits for plants larger than 1 MW and smaller plants are handled by the Rural Electrification Agency.
Setting of requirements for subsidies or other incentives High import duties and value-added taxation can also be cumbersome for MHP sector development. If import duties and taxes are too high, MHP projects will not be able to import good quality turbines and other equipment, which can lead to project closure in countries where local alternatives are not available. One example for such a situation is Mozambique, which still has high import duties on turbines, but which also has a capacity bottleneck in-country to produce turbines other than simple cross-flow turbines. Some countries give import duty exonerations for equipment for development-oriented projects. MHP projects in these countries can choose among local or international turbine manufacturers. This freedom of choice enables project implementers to choose e.g. turbines from more advanced developing countries, which are of good quality but still less expensive than European models. Interesting to note in this context is also an attempt for South-South technology transfer between Indonesia and Ethiopia in the field of cross-flow turbines, supported by a project of German Technical Cooperation (GTZ) in order to enable the set-up of a local turbine production site.
Financing MHP: private investment needed The fact that MHP requires high initial investments underlines the importance of adequate and accessible funding schemes. The specific investment costs of MHP varies, ranging from 1,000 to more than 10,000 US$ per kW. Costs depend on the site conditions, availability and quality of equipment and construction and the mode of operation (off-grid or grid-connected). Local contributions can reduce these costs significantly.
In Sub-Saharan Africa, MHP projects today rely mainly on public and donor funding. As the demand is high and public budget in most of the countries very much limited, a sustainable long-term sector development must involve increased private sector investment. Public and especially donor-based funding of entire MHP schemes should be complemented by creating conditions which make MHP projects attractive to private investors, including financial incentives and smart subsidies. This way the public funds can develop a leverage effect for private investment.
However, especially in remote rural areas, electrification rarely is a profitable market (as rural consumption is low and connection costs are higher than in urban centres). Comparable to the primary set-up of transmission and distribution grids which require public funding, the development of MHP-fed mini-grids in rural areas also depends on a certain degree of public support. Current experiences with off-grid MHP show that it is

62
PROCEEDINGS Conference MPDES 2011
very difficult to develop schemes with less than at least 50% public funding (considering investment and labour cost but excluding the technical assistance!). For a viable scaling-up approach for MHP, there are the following possible good practices of diversifying funding sources and bringing down costs.
Public funding should mainly support the primary investments in non-local components of mini-grids and infrastructure, while costs for local material, labour and all operation and maintenance costs should be covered by a local business model. One option to increase the availability of government funds for such kind of support is to impose a levy on on-grid electrification prices for larger consumers. The additional revenues gained can then be earmarked for rural electrification. The new energy law in Kenya includes such a cross-subsidy scheme by asking a 5% levy on the electricity sold to finance the rural electrification fund. Madagascar has a comparable scheme in which electricity consumers with a consumption of more than 20 kWh per month have to pay a levy into a rural electrification fund which is administered by the Rural Electrification Agency.
Most of the Sub-Saharan countries are currently undergoing a decentralization process. In the (still few) cases in which the central government transfers budget allocations to the local government, these funds can also be used to develop energy infrastructure including MHP at the district level. While there is so far little evidence that energy has been prominently included in official decentralization policies and documents (UNDP, 2009), there are examples e.g. in Mozambique, where local governments show a strong interest to start activities in the energy sector.
Although local banks are not yet knowledgeable about the technical aspects and financial viability of MHP projects and thus lack interest and sufficient insight to provide loans on favorable conditions, there are some promising pilot projects aiming to raise local banks' interest in MHP. For example, the GTZ Private Sector Promotion (PSP) Hydro project in Rwanda shows that the local private and financial sector can contribute significantly to the financing of MHP (Pigaht, 2009). In this arrangement, private banks are asked to finance MHP at competitive conditions, using the electro-mechanical equipment as guarantee, combined with guarantee facilities of multilateral development banks. However, the GTZ program provides still 30 – 50 % investment subsidy, technical assistance and business support. Probably the best argument in this dialogue is to showcase the projects’ profitability by referring to successful MHP demonstration projects in the country.
Bringing down costs is another option of making MHP projects more attractive for private investors. One potential good practice is to set up MHP projects with an integrated ownership model: a private investor is responsible for the upfront-capital, the set up and the technical O&M of the MHP plant; the community is, however, involved in collecting payments, dealing with payment delay, theft and in organizing community contributions. Having a community committee or cooperative responsible for tariff setting can also help to ensure that a tariff system is set up which allows for
enough income to cover costs, maintenance and repairs, to offer reliable revenues for the private investor and to ensure that tariffs are still within the local range of willingness and ability to pay. If MHP systems are grid-connected, a reliable and attractive feed-in-tariff is the best option to ensure the long-term financial viability of a MHP system.
Other sources for MHP investment A large number of small hydropower projects have globally been financed under the Clean Development Mechanism (CDM). While hydro power projects make up the majority of project types of the large CDM markets in China and India, SSA countries have so far only been able to develop 12 out of the currently 1436 hydro power CDM projects in the pipeline (UNDP Risoe Center 2010). None of the 12 CDM projects falls into the category of MHP, but they have installed capacities between 1.5 MW and 262 MW. One major barrier to the further usage of CDM capital for MHP projects development are the limited structures and experiences of SSA countries to promote CDM projects at large scale. Although the global future of CDM after 2012 is still unclear, there are several donor-financed programmes that address the lack of CDM capacity in SSA countries.
A new climate-related source for financing has recently been set-up with the program on Scaling-Up Renewable Energy in Low Income Countries (SREP), of the Strategic Climate Fund (SCF), within the framework of the Climate Investment Funds (CIF) that is implemented by the multilateral development banks. The SREP shall stimulate economic growth through the scaled-up development of renewable energy solutions.9
Building of local capacities: at all levels An important factor for the sustainable dissemination of MHP is the local capacity to plan, build and operate the plants. Without feasibility studies of good quality there will be no investment, and without a proper maintenance and the capability to repair and replace broken parts the life span of a plant will be reduced. Project developers play a crucial role in undertaking various forms of intermediation to involve the different local stakeholders. Locally-manufactured components can contribute to reduce the initial costs of a MHP (as is the case e.g. in Indonesia) but usually requires long-term commitment and does not necessarily lead to short-term results. In the detailed analysis of 4 African MHP plants, Barnett and Khennas pointed out that the lack of knowledge about financial management and utilization of electricity to generate revenues is a main deficit for a successful operation in SSA (Khennas, 2000).
Due to the lack of specific projects in Sub-Saharan Africa, few people have knowledge – and particularly practical experience – with MHP technology. In the frame of some internationally-funded pilot projects, local engineers and technicians have been trained, but few countries can count on good consultants who are able to carry out feasibility studies or build and operate plants. There are four approaches to address this deficit:
9 www.climateinvestmentfunds.org/cif/srep

63
PROCEEDINGS Conference MPDES 2011
1) Establish international or regional knowledge networks and induce foreign expertise by training local technicians. In 2006, UNIDO and the International Network for Small Hydropower (IN-SHP) established the Regional Centre for Small Hydro Power in Abuja, Nigeria. The aim is to build local capacity in the ECOWAS region. So far more than 50 technicians have participated in 40 days courses in MHP related subjects. Earlier efforts to establish a knowledge network, like the African Microhydro Knowledge Network which was established in 2004 by 10 countries with the support of UNDP-GEF, UNIDO and AfDB, have not survived.
2) Strengthen technical schools and science institutes to build up local capacity. In Rwanda, for example, new vocational training courses at colleges are offered. In most of the countries, R&D facilities like the Kigali Institute for Science and Technology (KIST) in Rwanda or the CSIR in South Africa are counting on some researchers who work on the subject of micro hydro.
3) Project-driven approach, involving local engineers in the planning and implementation of projects and at the same time building up their skills. Most of the few “experts” in micro hydro in a country have been somehow involved in the history of the first pilot projects. Good examples are the ITDG-implemented MHP in Kenya and Zimbabwe.
4) Technology transfer. In Ethiopia, first attempts have been made to set up local companies to produce MHP equipment. A transfer of knowledge from Indonesia, supported by GTZ, has started two years ago. But still most of the installed turbines and generators used are imported from abroad.
Besides the lack of technical capacities, MHP sector development in Sub-Saharan African countries is also severely hampered by the lack of governance capacity. This incorporates the ability of rule-making and rule-enforcement for MHP project development. There are several examples, e.g. there exists a feed-in-tariff in Uganda, but PPAs still need to be (re-)negotiated with the utility; in Rwanda, requests for MHP permissions are simply given by the regulatory authority (RURA) without any cross-checking, as there is not enough capacity for proper project evaluations; and in Mozambique communication and coordination between ministries and national- and local-level government is sometimes lacking leading to e.g. a situation where a school project received energy appliances from three different government institutions.
One possible good practice of how to increase governance capacity and coordination between different government institutions is to support the set up of local energy plans. By including the local governments in the energy infrastructure planning process, awareness, capacities, and accountability for successful implementation of energy policies can be strengthened. There are several countries which are launching such local energy plans on a pilot scheme. In Madagascar, the rural electrification agency is currently developing local energy plans in 4 out of 22 regions and will have covered the whole country by the end of 2010. In Uganda, energy officers are going to be trained for 5 pilot provinces. Their mandate will be to be the focal point of the local
government for energy issues, including energy demand and supply planning for their area. Also in Mozambique, there are initiatives at the district level governments to set up energy plans. Their purpose would be to identify potential sites, use these plans to apply for a corresponding budget and thereby to create more ownership among the district governments for rural electrification issues. Another strategy to develop local capacities is to keep well-qualified people at the local level by raising the attractiveness of their jobs, e.g. in Mozambique, the rural electrification fund and the utility provide good salaries so that well-skilled local people are motivated to work at such institutions.
Conclusion The vast potential of small hydro power in Sub-Saharan African countries is one promising option to cover increasing energy demand and to enable electricity access for remote rural communities. This opportunity has only recently been acknowledged and awareness among political decision-makers is still weak. MHP sector development is therefore only slowly taking up speed and is still facing a broad range of challenges. This paper has shed light on some of the main barriers for MHP sector development, but has also identified some promising practices employed in several Sub-Saharan African countries of how to overcome these barriers. Also some successful MHP demonstration projects exist that can be the foundation for up-scaling initiatives.
Closing the gap Due to the small-scale character of MHP projects, MHP sector development relies not only on good national-level policies, regulations, capacities and financing schemes, but needs to incorporate the local level. This is likewise a chance and a challenge as the national and the local framework conditions have to match each other in order to create an enabling environment for the MHP sector (see figure 2).
Figure 2: The role of policy and regulation for MHP sector development
The MHP situation in most countries is characterized by a gap between the national-level policies and regulations and local MHP project implementation. As long as this gap exists, framework conditions for MHP sector development will persist to be unclear and unreliable and therefore hinder a dynamic development of MHP

64
PROCEEDINGS Conference MPDES 2011
dissemination. Experience from OECD countries reveals that closing the gap can take decades and requires a continuous negotiation process between government institutions, private companies, communities and consumers.
Addressing the interfaces of regulation and sector development An effective policy for the promotion of MHP should not only focus on the legal framework. It must also address the need for capacity building and financing at all levels: “There is a need to support renewable energy champions and to target education and awareness-raising among power companies, consumers, regulators, government, and renewable industries. Policy makers require assistance developing regulatory structures and incentives. Those implementing projects require technical training, and assistance in project planning and financing” (Hankins, 2008).
While an inappropriate regulation can pose a serious barrier to MHP dissemination - a smart and integrated policy and regulative framework can support MHP sector development on all levels. In this context, the cooperative and communicative aspects of regulation need to be understood and highlighted. As shown in figure 3, there are many linkages and feedback loops which can be strategically used but which can only have an effect if the stakeholders and institutions involved cooperate with each other and continuously adjust their strategies and activities.
Figure 3: Addressing the demand for capacity and financing with regulative measures
In order to achieve a significant scaling up, the creation of a “critical mass” of MHP deployment is necessary and to this end the private sector should be more involved: “Once frameworks are in place and legal obstacles are removed, private sector partnerships between local and international companies can result in profitable ventures that are good for African economies (Hankins, 2008)”. As shown in the figure above, rather than relying only on direct subsidies for investment costs, profitability of MHP systems can be more adequately achieved with an enabling environment which guarantees access to resources, to the required licenses and to long-term
financing, grants exemption from customs duties, VAT and income tax, and capacity building – all important steps in attracting private investors. However, due to the remote areas and the limited ability to pay of the communities where electrification by MHP takes place, it cannot be expected that private investors can profitably finance the set-up of rural MHP mini-grids without at least some public support for the initial investments.
In Sub-Saharan-Africa – as elsewhere in the world - the “golden rules” of regulation should be considered: “…Regulation is a means to an end – what matters is the outcome in terms of supplied household…The benefits of regulation must exceed the costs. (Reiche et al., 2006)” Good policies and regulations usually reflect the public interest (e.g. rural electrification) but also take up the concerns of private investors (e.g. streamlining permit requirements). It has therefore turned out to be conducive for policy making if regulators “delegate” certain tasks to more operative institutions, such as rural electrification agencies or funds, because they normally know better the requirements of the involved actors. In addition, regulations should consider the character of the entities which are regulated. In rural electrification a “one size fits all” approach is not suitable.
Acknowledgements The research for this article has been conducted on behalf of the Deutsche Gesellschaft für Internationale Zusammenarbeit (GIZ) GmbH. We thank all interview partners and the colleagues at GIZ for their valuable time and helpful inputs and comments.
References AFREPREN & FWD (2009). The Role of Feed-in Tariff
Policy in Renewable Energy Development in Developing Countries: A Toolkit for Parliamentarians. Kenya. Online available at: www.e-parl.net/eparlimages/general/pdf/ 090911FITDevCountries.pdf [accessed on 03/05/2010]
Bajaj et al. (2007). Grid-connected Small Hydropower (SHP) Development: Regulatory Issues and Challenges. International Conference on Small Hydropower - Hydro Sri Lanka. 22-24 October 2007.
Bakker, P. (2006). More power for small hydro in East Africa! In ADB FINESSE Africa newsletter, April 2006.
Cuvilas, C.A. & Jirjis, R. & Lucas, C. (2010). Energy situation in Mozambique: A review. In Renewable and Sustainable Energy Reviews 14:7, 2139-2146.
Department of Mines and Energy (DoME) (2002). Baseline Study – Hydropower in South Africa. Copenhagen: COWI / DANIDA report.
ESHA/IT-Power (2006). Small Hydropower for Developing Countries. Belgium: European Small Hydropower Association.
Feibel, Hedi (2003). An Interdisciplinary Approach to the Dissemination of Mini and Micro Hydropower - the Case of Ethiopia. PhD thesis at the Technical University Darmstadt.
GTZ (2009). Regional Reports on Renewable Energies, 30 Country Analysis on Potential Markets in West Africa, East Africa and Central Asia. Eschborn: GTZ.
Discussion The research described in this paper aimed at providing information on the current status of village level hydropower in the eastern and southern regions of Africa, as this lack of information is seen as a major stumbling block towards larger uptake of the technology. Precisely this lack of information did hamper the research as the knowledge base on village level hydro is not well documented and does feature internal inconsistencies.
The research did find a large number of promising activities in the region that can bring village level hydropower the needed impulse.
The research does clearly indicate interest in the region for village level hydropower, but also highlights the embryonic stage of the development of sustainable implementation models. Which is surprising seen the maturity of the technology involved.
It is recommended that further research is done towards removing the barriers towards larger uptake of the technology and into implementation models that ensure sustainable operation once the physical infrastructure has been established.
References Barta, B. (2002). Capacity building in energy efficiency
and renewable energy. baseline study - hydropower in south africa. Pretoria:
DFID. (2002). Energy for the poor, underpinning the millennium development goals. London:
ERA. (2010). Uganda renewable energy feed-in tariff (REFIT) phase 2 approved guidelines for 2011-2012. Kampala: Electricity Regulatory Authority.
ESHA, I. P. (2006). Small hydropower for developing countries. Brussels: European Small Hydropower Association.
Fraenkel, P., Paish, O., Bokalders, V., Harvey, A., Brown, A., & Edwards, R. (1991). Micro-hydro power, a guide for development workers. London: Intermediate Technology Publications Ltd.
Gaul, M., Kölling, F., & Schröder, M. (2010). Policy and regulatory framework conditions for small hydro power in sub-saharan africa. Eschborn: EUEI PDF.
IEA. (2003). Renewables for power generations. status & prospects. Paris: IEA.
IEA. (2008). The electricity access database. Retrieved March, 7, 2011, from http://www.worldenergyoutlook.org/database_electricity/electricity_access_database.htm
Jonker Klunne, W., & Michael, E. G. (2009). Increasing sustainability of rural community electricity schemes – case study of small hydropower in tanzania. SET2009 8th International Conference on Sustainable Energy Technologies, Aachen, Germany, August 31 - September 2009,
Khennas, S., & Barnett, A. (2000). Best practices for sustainable development of micro hydro power in developing countries. Washington:
Klunne, W. (1993). Hydro-power end-uses at svinurayi co-operative (cashel valley, eastern highlands, zimbabwe). University of Twente, Enschede, the Netherlands).
Krause, M., & Nordstrom, S. (2004). Solar photovoltaics in africa. experiences with financing and delivery models. New York: UNDP.
Maher, P., Smith, N. P. A., & Williams, A. A. (2003). Assessment of pico hydro as an option for off-grid electrification in kenya. Renewable Energy, 28(9), 1357-1369. doi:DOI: 10.1016/S0960-1481(02)00216-1
Michael, E. G. (2008). Institutional design and practices for sustainable decentralised energy systems development for rural electrification. the case of isolated mini-hydro power systems developed by catholic church mission, njombe diocese, tanzania. University of Twente, Enschede, the Netherlands). , 122.
microhydropower.net. (2011). Horseshoe hydropower plant (sabie). Retrieved March, 9, 2011, from http://microhydropower.net/rsa/horseshoe.php
Mika, L. (2009). Village hydro in malawi, mozambique and zimbabwe. Hydro Africa 2009 Conference, 28 & 29 July 2009, Johannesburg, Johannesburg.
Min Conf Water for Agriculture and Energy in Africa. (2008). Hydropower resource assessment of africa. Sirte: Water for Agriculture and Energy: the challanges of climate change.
Ministry of Energy Kenya. (2010). Feed-in-tariffs policy for wind, biomass, small hydros, geothermal, biogas and solar,1st revision, jan 2010. Nairobi: Ministry of Energy Kenya.
Mtalo, F. (2005). Small scale hydropower for rural developmentNile Basin Capacity Building Network NBCBN Research cluster.
Mutubuki-Makuyana, C. S. (2010). Financial and ownership models for micro-hydro schemes in southern africa. Boiling Point, (58), 40.
NERSA. (2009). NERSA decision on renewable energy feed-in tariff (REFIT). Pretoria: NERSA.
Pigaht, M., & van der Plas, R. J. (2009). Innovative private micro-hydro power development in rwanda. Energy Policy, 37(11), 4753-4760. doi:DOI: 10.1016/j.enpol.2009.06.039
UNDP. (2005). Achieving the millennium development goals: The role of energy services. case studies from brazil, mali and the philippines. New York: Retrieved Available on http://www.undp.org/energy/docs/achievemdg.pdf
UNDP RISOE. (2011). CDM pipeline. Retrieved March, 9, 2011, from http://cdmpipeline.org/
World Bank. (2010). Energy strategy approach paper. Washington: World Bank Group / Sustainable Development Network.

65
PROCEEDINGS Conference MPDES 2011
Khennas, S. & Barnett, A. (2000). Best Practices for Sustainable Development of Microhydropower in Developing Countries. ITDG report, UK.
Hankins, M. (2008). Taking A Fresh Look: Why Africa Is Re-Examining Renewables. In Renewable Energy World International Magazine, Sept./Oct. 2008, Volume 11 Issue 5.
Kariuki et al. (2005). Small-Scale Private Service Providers of Water Supply and Electricity. In World Bank Policy Research Working Paper 3727. The World Bank: Washington, DC.
Klunne, Wim Jonker (2010). Sustainable implementation of microhydro to eradicate poverty in Africa. Unpublished thesis.
Mulder, P. & Tembe, J. (2008). Rural electrification in an imperfect world: A case study from Mozambique. In Energy Policy 36, 2785– 2794.
Muriithi, J. (2006). Developing small hydropower infrastructure in Kenya. 2nd Small Hydropower For Today Conference IN-SHP, Hangzhou, China on 22-25 April, 2006. Online available at: http://www.unido.org/file-storage/download/ ?file_id=52403 [accessed on 28 April 2010]
Pigaht, M. & Van der Plas, R. (2009). Innovative private micro-hydro power development in Rwanda. In Energy Policy. 37:11, 4753-4760.
Reiche et al. (2006). Electrification and Regulation: Principles and a Model Law. In Energy and Mining Sector Board Discussion Paper No. 18. Washington, DC: The World Bank.
UNDP (2009). Energy in National Decentralization Policies: A Review Focusing on Least Developed Countries and Sub-Saharan Africa. New York: United Nation Development Programme.
Legros et al. (2009). The Energy Access Situation in Developing Countries. New York: United Nation Development Programme.
UNEP (2006). Kenya: Integrated assessment of the Energy Policy - With focus on the transport and household energy sectors. Online available at: www.unep.ch/etb/areas/pdf/Kenya ReportFINAL.pdf [accessed on 03 May 2010]
WEC (2007). 2007 Survey of Energy Resources - Promoting the sustainable supply and use of energy for the greatest benefit of all. London: World Energy Council.
World Bank (2010). “Open Data initiative”. Data base to to over 2,000 indicators from World Bank data sources. Online available at: http://data.worldbank.org/country [accessed on 05 May 2010].

66
PROCEEDINGS Conference MPDES 2011
Current status of village level hydropower in eastern and southern Africa
Wim Jonker-Klunne ([email protected]) Council for Scientific and Industrial Research (CSIR)
PO Box 395, Pretoria 0001, South Africa
Abstract Decentralised, village level hydropower stations can play an important role in energising rural areas in Africa, particular those areas remote from the national electricity grid. This article describes the current status of village level hydropower in eastern and southern Africa, including an analysis of the current barriers towards large scale uptake of the technology. Although the technical aspects of hydropower are well understood, the number of hydro projects implemented does not reflect the enormous potential that exists in Africa. This suggests that other barriers than the technology itself are still persistent. One of these barriers is the limited information available on successfully implemented projects. This article is a contribution to enlarging the knowledge base on village level hydropower in Africa in order to provide a basis for the development of best practices around the implementation of this technology. Keywords: hydropower; Africa.
Introduction Approximately 10% of the world’s hydropower potential is found in Africa, most of which is located in the Sub-Saharan part of the continent. However, in no other continent the gap between actual hydropower generation and the technical exploitable potential is larger than in Africa where only 5% of the potential been exploited (ESHA, 2006; Min Conf Water for Agriculture and Energy in Africa, 2008). For the small and micro scale hydropower the gap between the potential and the actually developed sites is most probably even bigger, although no proper statistics are available. To indicate the low rate of development of small hydropower on the African continent, Gaul et al. (2010) compare the 45,000 plants below 10 MW in China with a total of a few hundred developed sites in the whole of Africa. While the European Small Hydropower Association (2006)is even referring to 100,000 units in the micro spectrum as installed in China!
Figure 1: Hydropower potential worldwide (IEA, 2003)
The role of small hydropower in energizing rural areas in Africa Sustainable energy provision is regarded as a major challenge, especially in Africa where large proportions of (rural) population do lack access to (basic) energy services. On the continent nearly 600 million people do not have access to electricity. This translates to two thirds of the population, while in rural areas up to 92% of the population lives without electricity. Although the electrification rates do differ per country, rural areas in general lack access to adequate, affordable, and reliable energy services. It has generally been agreed that providing access to energy is an absolute necessity in order to reach the Millennium Development Goals (DFID, 2002; UNDP, 2005).
The lack of access to modern energy services is particularly prominent in Sub Saharan Africa (see Table 1) and has prompted several donors and multilateral organizations to pay specific attention to improving this situation. In most instances the possible role of small scale hydropower has been recognized, as in the new draft energy strategy for the World Bank that does specifically highlight small scale hydropower as an important component of future World Bank activities in Africa (World Bank, 2010)
The traditional way of providing electricity to rural areas through the extension of the national electricity grid becomes prohibitively expensive due to geographical barriers (distance and terrain) and due to initial low demand for electricity. A viable alternative for grid extension is provided by renewable energy sources that use local resources.

67
PROCEEDINGS Conference MPDES 2011
Table 1: Electricity access Africa (IEA, 2008)
Population without
electricity
millions
Electrification rate %
Natio- nal Urban Rural
Africa 589 40.0 66.8 22.7
North Africa 2 98.9 99.6 98.2
SSA 587 28.5 57.5 11.9
Developing Asia 809 77.2 93.5 67.2
China & East Asia 195 90.2 96.2 85.5
South Asia 614 60.2 88.4 48.4
Latin America 34 92.7 98.7 70.2
Middle East 21 89.1 98.5 70.6
Developing countries 1 453 72.0 90.0 58.4
Transition economies & OECD
3 99.8 100.0 99.5
World 1 456 78.2 93.4 63.2
Substantial numbers of projects and programmes have been implemented in Africa providing solar systems to rural populations. However, it has become clear that the costs of photo-voltaic systems are very high and that they do not provide households with the level van energy services they aspire (Krause & Nordstrom, 2004).
Micro scale hydropower, often implemented through local isolated mini grids, is able to offer a higher level of energy services than solar PV. In the case of Kenya, research by Maher et all (2003) revealed that hydro stations in the pico range are able to supply electricity to households at a fraction of the cost to the end-user compared with solar PV or using car battery charged at grid connected charging stations.
Particular in rural areas far away from the national electricity grid that will not be reached by the grid in the near future, stand alone micro scale hydropower plants can play an important role. Through local mini grids microhydro plants can serve local business and households with electricity essential for their economic development.
The large knowledge base on technical aspects of microhydro in general does suggest a proper understanding of the technology. However, the relatively small number of village hydropower projects implemented in Africa does not reflect the enormous potential for the technology on the continent, suggesting that other barriers than the technology itself are still persistent.
Although village level hydropower projects have been implemented in several countries on the continent, information on the current state of affairs is scattered and incomplete. To a (very) limited extend information is available on technical details of implemented projects, however, information on implementation models followed and their successfulness is not available in most cases
(Michael, 2008; Pigaht & van der Plas, 2009). Basic technical information on existing hydrostations might be available, but is definitely not complete nor consistent over the different information sources. This lack of information does severely hamper the possibility to learn from past experiences and is a barrier to large uptake of village level hydro in the region and on the continent (Gaul et al., 2010).
Objectives The objective of this article is to get a better understanding of the status of village level hydropower in eastern and southern Africa and in that way contribute to enlarging the knowledge base on the technology. The article will give an overview of important aspects hampering the uptake of the technology and identify areas for attention. It will also identify possible areas that need further research in order to establish guidelines for successful implementation of such projects.
Defining village level hydropower At this stage no internationally agreed definitions of the different hydro sizes exist. A generic distinction though is between “large” hydro and “small” hydro. The most generally accepted definition of “small” has been set by the World Commission on Dams, which set the upper limit for small hydro at 10 MW of installed capacity, although large countries as China and India tend to put the limit higher at 50 MW and 25 MW respectively. Recently some international donors seem to use a maximum capacity of 15 MW when referring to small hydro.
Within the range of small hydro, distinction can be made between mini hydro (often limited to an installed capacity of maximum 1 MW), micro hydro (below 300 or 100 kW depending on the definition) and pico hydro (below 20, 10 or 5 kW), each with its own specific technical characteristics. Micro and pico hydro installations are mostly found in developing countries for energy provision to isolated communities where the national electricity grid is not available, whereas mini hydro tends to be grid connected. Micro and pico hydro can also differ from mini hydro due to the extended possibility of using local materials and labour in the case of first two, while mini hydro typically involves more traditional engineering approaches and will usually need for example heavy access roads for delivery of materials and electro-mechanical equipment.
As indicated above, no uniform definitions exist in the mini, micro and pico hydro ranges. In this article the term villagehydro is used to refer to hydro installations which are typically used for village electrification using a local distribution network and that typically are not connected to the national electricity grid. Although no strict upper limit of installed capacity has been applied, in general it can be assumed, in line with the definition used by Fraenkel et all (1991) for micro hydropower, that village hydroplants have an installed capacity below 300 kW.

68
PROCEEDINGS Conference MPDES 2011
Village level hydropower in Africa There is enormous exploitable hydropower potential on the African continent, but despite this massive potential for large and small scale hydropower, Africa has one of the lowest hydropower utilisation rates. While large-scale hydropower development is becoming a challenge due to environmental and socio-economic concerns, and more recently its vulnerability to changing climates and hence water availability in the main water bodies, micro hydropower development continues to be an attractive resource especially in remote parts of Africa. The fact that microhydro installations tend to use only part of the available water in rivers makes them less vulnerable to changes in water quantities due to climate change.
Microhydro is a proven technology that can adequately contribute to the electricity needs of African countries.
Micro scale hydropower has a long history in general, but also in Africa. For example the first system in South Africa was a 300 kW station on the slopes of Table Mountain, which was inaugurated in 1895 (Barta, 2002). All over Africa church missions were particularly active in implementing small scale hydropower installations. In Tanzania, more than 16 small hydropower systems were installed by church missions in the 60’s and 70’s of last century that are still operating (Mtalo, 2005), while in Zimbabwe for example large scale commercial farmers in the Eastern Highlands of the country installed hydro stations as early as the 1930’s (Klunne, 1993).
Many countries in Africa do have a rich history of small scale hydropower, but over time large numbers of these stations have fallen in disrepair. Some because the national grid reached their location but others because of lack of maintenance or pure neglect.
Recently initiatives have seen the light in a number of countries in Africa to revive the hydropower sector, either through international development agencies or through private sector led initiatives. Particular in Central Africa (Rwanda), East Africa (Kenya and Tanzania) as well as Southern Africa (Malawi, Mozambique and Zimbabwe) new initiatives are focusing on implementing small scale hydropower projects.
Barriers Although several projects and programmes have seen the light in recent years, the low number of existing hydropower stations shows that there are still many barriers hampering the dissemination of this technology.
The challenges facing micro hydropower exploitation in general are many and most of them are part of the larger picture of general barriers for the uptake of renewable energy and independent power producers. These generic barriers can be summarised into the lack of clear-cut policies on renewable energy and associated requisite budgetary allocations to create an enabling environment for mobilising resources and encouraging private sector investment, and the absence of lost-cost, long-term financing models to provide renewables to customers at affordable prices while ensuring that the industry remains sustainable.
Specifically for small hydro, large scale implementation is hindered by:
Policy and regulatory framework: the policies and regulations needed to govern the development of (small) hydropower do not exist. Sometimes hydropower developments are either not regulated at all or are part of a broader regulatory framework made for rural electrification in general. Generic frameworks might lack clarity on a number of hydropower specific issues like access to water and associated payments.
Financing: the lack of funds for hydro developments is a major bottleneck. Currently most of the hydro projects in Africa are relating in one form or the other on donor financing. Tapping into alternative funding sources is needed to upscale the uptake of hydropower.
Capacity to plan, build and operate hydropower plants: another serious challenge is the missing knowledge and awareness on small hydro potential for rural electrification. This includes knowledge at political, government and regulatory entities, as well as knowledge on local production of parts and components.
Data on hydro resources: linked to the limited knowledge about the technology is the lack of proper resource data on which hydro developments can be based.
Regulatory and legislative frameworks Policies and strategies that are in support of small scale renewable energy development are a clear prerequisite for the uptake of small hydropower. Such strategies should show long-term vision, as well as concrete targets and implementation plans with associated budgetary allocations. Preferably they include coordination efforts on support by international donors.
Unfortunately very few countries in Africa have been able to develop such strategies and policies. Almost all Sub-Saharan African countries now have rural electrification plans but mainly focus on grid extension and hardly focus on renewable energies, let alone specifically support small hydropower deployment. An example in case is the Mozambican rural electrification agency FUNAE, which has renewable energies in its portfolio but so far only three hydroplants in the pipeline. Another important issue is the availability of rural electrification plans. The availability of long-term grid extension plans enables the small hydro investor to assess financial project viability. These plans provide useful information on whether a locality will soon enjoy grid extension or whether the set-up of an independent mini-grid makes sense. More often than not the national electricity grid reaching an isolated small hydroplant has resulted in the hydroplant being decommissioned and the community being connected to the national grid. Only very few examples exist where an existing small hydro station is being integrated in the national grid or is able to operate in parallel to it.

69
PROCEEDINGS Conference MPDES 2011
Funding of hydropower schemes Funding of small hydropower developments in the eastern and southern African region can be distinguished in three broad categories:
1. Private funding for systems that serve one household / farm with or without commercial activities attached to it. These systems tend to be designed to supply a small load consisting of domestic energy use and more power demanding applications like milling or grinding and typically are not designed to harness as much energy as possible at their specific site. As these systems do typically not supply outside entities their existence is quite often not publicly know and information is rather difficult to get. Funding of these systems normally does not involve external parties. A typical example is the Horseshoe falls system in Sabie in South Africa, which was designed and build by farmer Pieter Weber in the 1960s and operated till 1990 when the national grid reached the farm (microhydropower.net, 2011).
2. Public funding, often through the national or municipal power company, for grid connected systems. This typically involves larger systems like the 2 MW Mantsonyane plant in Lesotho.
3. Systems funded by bilateral donors (e.g. from Austria, Belgium, China, Germany, Japan, Netherlands, UK and Sweden) and multilateral donors (World Bank, AfDB, GEF, UNDP, etc). These systems will often form part of a national programme on energy access / rural electrification.
Financial incentives for hydropower systems can be provided through generation based incentives or capacity based incentives.
A good example of the first is a renewable energy feed-in tariff paying the owner of the system a premium based electricity tariff. In the eastern and southern African region only Kenya, South Africa and Uganda do have specific feed in tariffs for hydropower. The feed-in tariff in South Africa is a flat ZAR 0.98 / kWh (approx. US$ 0.14) (NERSA, 2009) for hydro stations in the 1 – 10 MW range, while Kenya has a feed in tariff for hydropower that is depending on the size (see Table 2)
Table 2: Hydropower feed in tariffs Kenya (Ministry of Energy Kenya, 2010)
Plant capacity (MW)
Max firm power tariff
Max non-firm power tariff
0.5 – 0.99 0.12 US$/kWh 0.10 US$/kWh 1 – 5 0.10 US$/kWh 0.08 US$/kWh 5.1 – 10 0.08 US$/kWh 0.06 US$/kWh
Also Uganda has announced a hydro feed in tariff depending on the plant size. Between 500 kW and 1 MW of installed capacity a tariff of US$ 0.109 / kWh will be paid. For installations between 9 and 20 MW a tariff of US$ 0.073 / kWh is applicable, while in between 1 and 8
MW a linear tariff as displayed in Figure 2 will be used (ERA, 2010).
Figure 2: Uganda feed in tariff for hydropower (ERA,
2010) Capacity based incentives do provide up front funding
to offset the high investment needed for hydropower and are typically modelled as once-off investment subsidies. Particularly for off-grid systems capital investment support is considered a preferred form of support as long as it is supplemented by a business model to operate the facility in a sustainable way.
A specific form of financing is provided by the Clean Development Mechanism (CDM) under the Kyoto protocol. Most of the hydropower projects world-wide that benefit from CDM funding related to avoided carbon emissions are in Asia (India and China) while very few can be found in Africa (see Table 3). The uncertainties around the CDM funding after the end of the Kyoto protocol in 2012 make investors hesitant to follow this route. Coupled with a general lack of CDM project development capacity in Africa it is not likely that the list of CDM funded projects will increase dramatically in the (near) future.
Capacity building Essential towards the successful operation of small hydropower in countries in Africa is the establishment of local capacity to plan, design, build, operate and maintain hydroplants. Without proper resource assessments and associated feasibility studies no project will be developed. Similar, without proper maintenance and technical capabilities to repair systems, sustainable operation will not be possible.
National and regional capacity to plan and design systems has been and currently is being build by (international) NGOs funded by development assistance funds from developed countries. Also local production of turbines and other components of hydroplants have been piloted by in particular Practical Action, but with the limit regional market these efforts have not seen the wide spread of local production.
In an analysis of best practices on microhydro developments, including detailed descriptions of four installations on the African continent, Khennas and Barnett (2000) pointed out that the lack of knowledge about financial management and utilisation of electricity to generate revenues is a main deficit for a successful operation in Sub-Saharan Africa.

70
PROCEEDINGS Conference MPDES 2011
The limited number of microhydro projects in the eastern and southern African region have resulted in few people with practical experience in the technologies involved. Gaul et al. (2010) identify four approaches to address this deficit:
1. Establish international or regional knowledge networks and induce foreign expertise by training local technicians.
2. Strengthen technical schools and science institutes to build up local capacity.
3. Project-driven approach, involving local engineers in the planning and implementation of projects and at the same time building up their skills.
4. Technology transfer either north – south or south – south. Particular the small hydro expertise in countries like Nepal and Indonesia could be targeted for technology transfer.
Table 3: CDM hydropower projects in eastern and southern Africa (UNDP RISOE, 2011)
Country Name of project Sub-type MW Status
Kenya
Redevelopment of Tana Hydro Power Station Project
Existing dam 19.6 At Validation
Optimisation of Kiambere Hydro Power Project
Existing dam 20.0 At Validation
Sondu Miriu Hydro Power Project. Run of river 60.0 Validation negative Madagascar Small-Scale Hydropower Project
Sahanivotry in Madagascar Run of river 15.0 Registered
South Africa Clanwilliam Hydro Electric Power Scheme
Existing dam 1.5 At Validation
Bethlehem Hydroelectric project Run of river 7.0 Registered Tanzania LUIGA Hydropower Project in
Mufindi District, Tanzania Run of river 3.0 At Validation
Uganda
West Nile Electrification Project (WNEP)
Run of river 3.5 Registered
Bugoye 13.0 MW run-of-river Hydropower project
Run of river 13.0 Registered
Ishasha 6.6 MW Small Hydropower project
Run of river 6.6 At Validation
Buseruka Mini Hydro Power Plant Run of river 9.0 At Validation Bujagali Hydropower Project Run of river 250.0 At Validation
Table 4: Overview of current initiatives on small hydro in eastern and southern Africa
Implementing agent
Project name Country / region
Description Important component
UNEP/GEF Greening the tea industry
East Africa Development of small hydroplants at tea factories, including rural electrification component
Linking rural electrification with existing industrial activity
GTZ Energizing Development
Rwanda Support to private sector to develop hydroplants
Need to incorporate requirements of financial sector
Practical Action / EU
Catalysing Modern Energy Service Delivery to Marginal Communities in Southern Africa
Malawi. Mozambique, Zimbabwe
Rehabilitating existing systems, development of local/regional capacity
Inclusion of capacity building component
Practical Action / UNDP/GEF-SGP
Tungu-Kabiri hydro project
Kenya Community owned system to power micro enterprises centre
Legislative framework prohibited connection of households

71
PROCEEDINGS Conference MPDES 2011
Current initiatives At the moment several initiatives are ongoing to assist developing small hydropower in eastern and southern Africa. Table 4 does give an overview of these initiatives, while detailed descriptions follow below.
A number of UN agencies like UNDP, UNEP and UNIDO are active in support programmes to remove barriers to the harnessing of the large small hydropotential, small hydro support centres are established or in the process of being established in a number of countries and a number of national rural electrification programs does include electricity generation by small hydro. Also bilateral donors and NGOs have embraced small hydropower as a means to provide energy to rural areas.
The United Nations Industrial Development Organisation (UNIDO) is active in a number of African countries in the field of hydropower. In 2007 UNIDO and the Chinese International Centre for Hydropower did organise a conference around the theme “Lighting up Rural Africa”. The aim was to set up a South-South Cooperation to scale-up small hydro development in Africa through the development and production of 100 projects in the next 3 years. The current status of this initiative is unknown.
In 2005 the UNIDO Regional Centre for SHP (RC-SHP) was established in Abuja, Nigeria with the mandate to provide technical assistance to countries within the region. The centre did host a number of conferences and seminars but seems to be less active nowadays.
UNIDO is currently running a number of pilot projects on small scale hydropower in countries such as Tanzania (75 kW), Nigeria (34 kW), Madagascar, Uganda (250 kW) etc. (Min Conf Water for Agriculture and Energy in Africa, 2008).
Linked to the UNIDO Regional Centre for SHP was an UNDP/GEF initiative on small hydropower in 10 countries in West Africa. A network was launched at a high level meeting in Vienna, but unfortunately it has not resulted in substantial developments in the region, highlighting the challenges in the sector.
The United Nations Environment Programme (UNEP) is implementing a Global Environment Facility (GEF) funded project that looks at the possibilities of applying small hydro at tea estates to generate electricity in the Eastern Africa region. Starting from the premises that tea does need altitude and water to grow, which incidentally are requirements for hydropower as well, a collaboration of the East African Tea Trade Association (EATTA), UNEP, the African Development Bank and the GEF has set up a facility to accelerate the uptake of hydropower. The project received huge interest by the tea estates due to the current unreliable power supply from the national electricity grids. The project aims to establish 6 small hydro power demonstration projects in at least 3 of the EATTA member countries, preferably with an attached rural electrification component, as well as to prepare additional pre-feasibility studies. Both studies and planned installations will serve as training grounds for the entire tea sector in the region. The project includes a special financing window to assist individual tea
processing plants to move into “green power generation”. A key feature of this Greening the Tea Industry in East Africa project is linking the energy requirements of the tea industry with the available hydro resources and using this as a basis to develop viable projects that preferably do include a rural electrification component.
Under the header of the EU funded project “Catalysing Modern Energy Service Delivery to Marginal Communities in Southern Africa”, the British NGO Practical Action is implementing a regional micro hydro project in Malawi, Mozambique and Zimbabwe. The project seeks to promote the use of renewable energy through creating micro hydro expertise in poor communities by equipping community members with micro hydro scheme management skills, such as installations, fabrication of equipment, etc. The project aims at the installation of 15 micro hydro units in the three countries concerned. The project is in the initial phases of its implementation and currently supports three hydro systems in different phases of implementation. The project does look into the development of a regional pool of microhydro expertise, including local manufacturing, quality standards and work on removing of political barriers. Also management and ownership models will be tested and evaluated under the project (Mika, 2009). At this stage three different financial models are being implemented and will be evaluated on their merits. In the “ShareD” financial model, as is implemented in Chipendeke in Zimbabwe, local community members do provide sweat equity to the project that will be converted in shares in the commercial enterprise that will be running the hydro plant. The “generator model” as implemented by Practical Action together with their Mozambican counterpart Kwaedza Sumukai Manica (KSM) is build around a private entrepreneur generating electricity for the community. In this model the local transmission and distribution infrastructure will be owned by the community. Thirdly Practical Action is applying an adapted version of Build, Operate and Transfer model (BOT) to have a smooth transition towards community ownership of the installation (Mutubuki-Makuyana, 2010).
A recent evaluation of existing micro hydro systems in Tanzania (Jonker Klunne & Michael, 2009) looked at the cases of three isolated mini grids in Tanzania using microhydro technology to serve a total of 1100 households, 32 institutions and 84 commercial loads with electricity. Careful planning procedures catering for technical capacity, good institutional arrangements, managerial capacity and economic considerations, as well as multi-stakeholder involvement from the planning phase onwards, have resulted in the sustainable operation of the three hydro plants. The analysis does suggest that village level scale hydrostations are best managed in a business-like fashion, although it also concludes that community engagement/involvement is crucial in all phases of the hydro site development.

72
PROCEEDINGS Conference MPDES 2011
Discussion The research described in this paper aimed at providing information on the current status of village level hydropower in the eastern and southern regions of Africa, as this lack of information is seen as a major stumbling block towards larger uptake of the technology. Precisely this lack of information did hamper the research as the knowledge base on village level hydro is not well documented and does feature internal inconsistencies.
The research did find a large number of promising activities in the region that can bring village level hydropower the needed impulse.
The research does clearly indicate interest in the region for village level hydropower, but also highlights the embryonic stage of the development of sustainable implementation models. Which is surprising seen the maturity of the technology involved.
It is recommended that further research is done towards removing the barriers towards larger uptake of the technology and into implementation models that ensure sustainable operation once the physical infrastructure has been established.
References Barta, B. (2002). Capacity building in energy efficiency
and renewable energy. baseline study - hydropower in south africa. Pretoria:
DFID. (2002). Energy for the poor, underpinning the millennium development goals. London:
ERA. (2010). Uganda renewable energy feed-in tariff (REFIT) phase 2 approved guidelines for 2011-2012. Kampala: Electricity Regulatory Authority.
ESHA, I. P. (2006). Small hydropower for developing countries. Brussels: European Small Hydropower Association.
Fraenkel, P., Paish, O., Bokalders, V., Harvey, A., Brown, A., & Edwards, R. (1991). Micro-hydro power, a guide for development workers. London: Intermediate Technology Publications Ltd.
Gaul, M., Kölling, F., & Schröder, M. (2010). Policy and regulatory framework conditions for small hydro power in sub-saharan africa. Eschborn: EUEI PDF.
IEA. (2003). Renewables for power generations. status & prospects. Paris: IEA.
IEA. (2008). The electricity access database. Retrieved March, 7, 2011, from http://www.worldenergyoutlook.org/database_electricity/electricity_access_database.htm
Jonker Klunne, W., & Michael, E. G. (2009). Increasing sustainability of rural community electricity schemes – case study of small hydropower in tanzania. SET2009 8th International Conference on Sustainable Energy Technologies, Aachen, Germany, August 31 - September 2009,
Khennas, S., & Barnett, A. (2000). Best practices for sustainable development of micro hydro power in developing countries. Washington:
Klunne, W. (1993). Hydro-power end-uses at svinurayi co-operative (cashel valley, eastern highlands, zimbabwe). University of Twente, Enschede, the Netherlands).
Krause, M., & Nordstrom, S. (2004). Solar photovoltaics in africa. experiences with financing and delivery models. New York: UNDP.
Maher, P., Smith, N. P. A., & Williams, A. A. (2003). Assessment of pico hydro as an option for off-grid electrification in kenya. Renewable Energy, 28(9), 1357-1369. doi:DOI: 10.1016/S0960-1481(02)00216-1
Michael, E. G. (2008). Institutional design and practices for sustainable decentralised energy systems development for rural electrification. the case of isolated mini-hydro power systems developed by catholic church mission, njombe diocese, tanzania. University of Twente, Enschede, the Netherlands). , 122.
microhydropower.net. (2011). Horseshoe hydropower plant (sabie). Retrieved March, 9, 2011, from http://microhydropower.net/rsa/horseshoe.php
Mika, L. (2009). Village hydro in malawi, mozambique and zimbabwe. Hydro Africa 2009 Conference, 28 & 29 July 2009, Johannesburg, Johannesburg.
Min Conf Water for Agriculture and Energy in Africa. (2008). Hydropower resource assessment of africa. Sirte: Water for Agriculture and Energy: the challanges of climate change.
Ministry of Energy Kenya. (2010). Feed-in-tariffs policy for wind, biomass, small hydros, geothermal, biogas and solar,1st revision, jan 2010. Nairobi: Ministry of Energy Kenya.
Mtalo, F. (2005). Small scale hydropower for rural developmentNile Basin Capacity Building Network NBCBN Research cluster.
Mutubuki-Makuyana, C. S. (2010). Financial and ownership models for micro-hydro schemes in southern africa. Boiling Point, (58), 40.
NERSA. (2009). NERSA decision on renewable energy feed-in tariff (REFIT). Pretoria: NERSA.
Pigaht, M., & van der Plas, R. J. (2009). Innovative private micro-hydro power development in rwanda. Energy Policy, 37(11), 4753-4760. doi:DOI: 10.1016/j.enpol.2009.06.039
UNDP. (2005). Achieving the millennium development goals: The role of energy services. case studies from brazil, mali and the philippines. New York: Retrieved Available on http://www.undp.org/energy/docs/achievemdg.pdf
UNDP RISOE. (2011). CDM pipeline. Retrieved March, 9, 2011, from http://cdmpipeline.org/
World Bank. (2010). Energy strategy approach paper. Washington: World Bank Group / Sustainable Development Network.

73
PROCEEDINGS Conference MPDES 2011
Water Desalination in Micro Grids Based on Renewable Energies
Kristina Bognar ([email protected]) Frank Behrendt ([email protected])
Technische Universität Berlin, Berlin Institute of Technology, Department of Energy Engineering
Fasanenstrasse 89, 10623 Berlin, Germany
Abstract Fossil fuels and the CO2 emissions related to their use in combustion processes are the main drivers behind the anticipated climate change. Globally islands will be the first regions being affected by the repercussions of this change, e.g. by a rising sea level. Islands often depend on the import of fossil fuels for electricity production. Due to the combined effect of high oil prices and transportation costs, energy supply systems based on renewable energies are able to compete successfully with fossil-fuel systems in these regions in many cases. In tropical, dry and even Mediterranean regions not only an autonomous energy supply is a challenge but also the implementation of a reliable water supply system. A promising option of replacing shipments of freshwater is seawater desalination. Desalination - being extremely energy-intensive - has to be addressed in the planning process of the overall energy-supply system for such islands. Desalination processes could be considered as flexible energy sinks besides conventional energy storage systems whenever a surplus of energy generated by renewable sources is given. This paper presents numerical simulations of flows of energy and clean water on a typical island demonstrating options to match the demand for both by using renewable energy sources like wind and solar energy including energy storage options depending on wind velocity and prices of diesel fuel. For a given scenario a deferrable load is integrated into the system simulating the required energy demand of seawater desalination. The results of this technical simulation highlight ecological and economical options for the considered island. Keywords: Micro grid; renewable energy sources; seawater desalination
Introduction Globally islands depend on the import of fossil fuels for energy production. Due to the combined effect of transportation costs and high oil prices (often being two or three times higher than onshore market prices (AOSIS, 2001)), energy supply systems based on renewable energies are already able to compete successfully with fossil-fuel based supply systems under some conditions (Weisser, 2004; Mitra, 2006).
In tropical, dry and also some moderate climate zones like the Mediterranean the main energy form needed is electricity, heating services are hardly required. Cooling services and refrigeration demand is usually met by electricity. Since thermal energy is easier to store than electricity, it can reduce the need for power generation. If possible, a shift towards thermal energy systems is always reasonable, especially if renewable energy sources are being integrated, for instance applicable as solar cooling devices.
In arid regions without access to clean freshwater meeting the water demand is a huge challenge. In the long-term global desertification and the excessive usage of natural freshwater reservoirs diminish the accessible water stocks. On islands the unlimited usage of groundwater results in an inflow of seawater from nearby coastlines leading to increased salt levels making the previous freshwater unfit for human consumption and other applications.
Many islands depend highly on freshwater shipments. Shipping companies often ask for humongous prices for freshwater. Ecological friendly seawater desalination could provide a promising alternative offering reliable and in many cases less expensive water supply (Garcia-Rodriguez, Romero-Ternero, & Gomez-Camacho, 2001; Kaldellis & Kondili, 2007).
As desalination proves to be an extremely energy-intensive process, it has to be addressed in some detail within the energy supply system planning. Depending on the technical process used, either thermal (distillation) or electrical (membrane-based filtration) energy is needed. Developing standard solutions for desalting seawater by renewable energies is a widespread goal (Tzen & Morris, 2003; Kalogirou, 2005; Garcia-Rodriguez, 2003; Mathioulakis, Belessiotis, & Delyannis, 2007).
Desalination processes usually require a continuous energy supply for constant water flow. Some processes though are able to run discontinuously without damaging the distillation equipment or membranes in reverse osmosis systems (Witte & Siegfriedsen, 2003; Paulsen & Hensel, 2007; TerraWater, 2010). This makes them very attractive as dynamic load for energy supply systems and helps to match the consumer induced load curves with the stochastically fluctuating supply of energy from renewable energy sources. Besides conventional energy storage technologies desalination units could be considered as flexible energy sinks whenever a surplus of energy generated by wind or sun is given.

74
PROCEEDINGS Conference MPDES 2011
Figure 1: Monthly Averages of Electricity Demand
Possible ecological and economical benefits of
combining power generation with the coproduction of freshwater should be identified (Livengood, Sim-Sim, Ioakimidis, & Larson, 2010; Kaldellis, Kavadias,& Kondili, 2006). A calculation within this paper is done for a dry Greek island in the Aegean Sea. Due to various research programs in that area relevant data are available and first results are discussed (Voivontas, Yannopoulos, Rados, Zervos, & Assimacopoulos, 1999; Ntziachristos, Kouridis, Samaras, & Pattas, 2005).
Research Objectives Thank to the greek Public Power Corporation (Kos, 2010) we received energy demand data of an island in the Aegean Sea. The island is not going to be named.
About 1,000-1,500 inhabitants live on the given island all year round, in the summer (June to September) many tourists visit the island increasing the overall population with about 500 in the whole summer period (Caralis & Emmanouilidis, 2009). Creating of value is mainly based on fishery and tourism.
Current supply with electricity Accordingly to the data from PPC the peak-load on the island is 2.3 MW with an overall demand of 18 MWh/d. The load curve is available in one-hour steps for one year (2008). For monthly values see Fig. 1. Since 2005 three MITSUBISHI S16R-PTA with a nominal power of 1600 kW are installed and supply the island with electricity.
The development of the oil price over the last years and the current delivery prices of diesel on Greek islands ( € 1,40- 1,45/L (Kos, 2010; Agency, 2010)) motivate the decision makers of the islands to look into alternative energy supply systems.
The high potential of solar and wind energy sources could make it feasible to replace the fossil fuel based energy supply. The usage of ocean power (wave power, ocean thermal energy conversion, tidal energy), geothermal energy (Garcia-Rodriguez, 2003) and thermal energy provided by waste incineration processes (Udono & Sitte, 2008) are not feasible for this island.
Due to the small size of the island and the climatic and topographic conditions, even including organic waste, the potential of electricity generation from biomass is negligible. Solar thermal elements are widely in use for water heating purposes in a decentralized fashion only.
Current water supply situation The water demand on the given island is about 160,000 m3 per year. The critical months with the highest population density are in the hot summer period when the water demand is naturally higher than in the winter period. Since tourists use typically more water then locals and the hotels operate swimming pools and offer frequent laundry service etc. the water demand of a tourist is calculated as twice as high than of a local. This assumption leads to an average daily water demand on the island out-of-season (Oct-May) of 360 m3/d and in-season (June-Sep) of 600 m3/d.
These numbers are on the high side compared to other cases with similar conditions, since saving potentials like sewage water reuse, e. g. for irrigation, or the repair, replacement and maintenance of existing pipes, cartridge seals etc. are not considered here.
If no natural water resources like rainfall, surface water or ground water are available, islands depend on freshwater imports. At present dry islands in the Aegean Sea import freshwater by shipment from the mainland, Santorini or Rhodes for a tremendous price of € 9.80/m3 plus 11 % VAT (Agency, 2010).
The only alternative to importing water is the production of freshwater by desalination. There are two main desalination processes: thermal distillation and membrane-based filtration, cf. e.g. (Bruggen & Vandecasteele, 2002). Within this paper a reverse osmosis plant is considered, since it requires only electrical energy. Only surplus electrical energy is being examined here.
Methods - Modeling and Simulation Renewable energy concepts are mainly planned, developed and dispatched by supporting tools like INSEL, TRNSYS, Ebsilon, RETscreen, HYBRID2, HOMER and other programs.
The simulation of the sample island’s energy supply is done with the HOMER Energy simulation program developed by the U.S. National Renewable Energy Laboratory. Compared to other simulation programs HOMER has a very user friendly interface. It is improved continuously and up to date whereas other programs did not undergo further development in the last years. Since worldwide many urban developers, utilities and consultancies use HOMER for micro grid modeling this package is used for a first approach towards a sustainable energy supply (HOMER, 2010).

75
PROCEEDINGS Conference MPDES 2011
Simulation Input On the given island the load curve was measured for one year in one-hour steps. The solar radiation data were derived from the METEONORM database (Meteonorm, 2010), the wind velocity data from the NASA database (Kusterer, 2010). For an accurate dispatching strategy and frequency stability the given data would not suffice. System layouts based on hourly data sets are commonly used though. Energy control and management systems and short term energy storage systems as flywheels can guarantee a reliable electricity supply within an hour, but are not within the scope of this paper.
Considered energy-conversion technologies are diesel generators, wind converters, PV systems, and batteries. If available, excess electrical and thermal energy could be used for deferrable loads representing desalination systems.
HOMER uses US$ as currency. In this paper e1 is equivalent to US$ 1.3. Over the project lifetime the annual interest rate is fixed at 6% for all simulations.
Diesel Generator Within the simulation the three already existing MITSUBISHI S16R PTA engines are considered with a nominal power of 1600 kW. Assumed initial investment costs are € 650/kW (MAN, 2010).
With a determined lifetime of minimum 20 years (180,000 h) and one revision in 20 years, the costs of operation and maintenance (O&M) are US$ 6/MWh.
Fuel consumption depends on the humidity, pressure and density of the air. For the given circumstances these variables are negligible. The fuel consumption of the engine is 175-185 g/kWh. Usually 80-90 % of the costs of electricity generation are caused by fuel costs.
Photovoltaics The monthly arithmetic mean of the solar radiation on the considered island is derived from METEONORM (Meteonorm, 2010). Data for one year in onehour steps are generated by HOMER.
Photovoltaics (PV) will be assumed as roof-top system without tracking. The initial cost for a photovoltaic plant including converter and installation is about € 2,800/kWp on the mainland.
Considering the cost-increasing factor of an island installation and high administrative and bureaucratic costs in Greece, initial investment costs of € 3,500/kWp are used, not taking feed-in tariffs into consideration (based on a new law in Greece € 0.55/kWh for up to 10 kWp and € 0.42/kWh about 100 kWp and higher). The O&M costs are about 2 % of the investment costs every year resulting in US$ 91/year (BSWSolar, 2010).
The lifetime of the PV arrays is set to 20 years. According to the guarantee of most PV producers, the derating factor is set to 80 %. The efficiency for polycrystalline silicon cells is taken as 13 %.
As the exact position of possibly implemented PV arrays is not known, additional information including the Azimuth, the slope and the ground reflection are ignored. The temperature effects are not considered within the simulation.
Wind The wind velocity was derived from the NASA database (Kusterer, 2010) in three-hour steps. Data for one year in one-hour steps are generated by HOMER.
On islands only small-scale wind energy converter can be set up. One reason is the relatively low peak demand, the other one is the difficult shipment -due to small harbors- and installation of heavy and big size equipment. In the simulation wind turbines from Fuhrländer with 250 kW are considered. This wind turbine was developed specifically for small islands. Alternatively the E30 from ENERCON could have been used as well. The influence of the surface roughness on the used wind velocity is considered.
The investment costs for wind turbines onshore are between € 900/kW and € 1,200/kW. Regarding the difficult installation conditions on small islands like Astypalaia and the small scale a price of € 1,200/kW is used for the simulation. The total investment cost for each Fuhrländer 250 kW system is US$ 390.000. The O&M can be calculated with 5 % of the investment costs (US$ 19,500/year and turbine) (BWE, 2010).
Storage Within the hybrid energy supply system various storage technologies could be implemented (Kaldellis & Zafirakis, 2007), but they are not discussed within this paper. A robust, flexible applicable and relatively cheap battery is chosen. The Surrette Deep Cycle Industrial Flooded Battery with a capacity of 4 V x 1900 Ah = 7.6 kWh can be purchased for about US$ 1,300 per battery.
Desalination Unit Desalination processes require either thermal or
electrical energy. Most thermal processes use some electrical energy for pumps within the desalination unit as well. Thermal processes in use are mainly Multi-Stage-Flash (MSF) and Multi-Effect Distillation (MED) for largescale and Multiple Effect Humidification (MEH) and Membrane Distillation (MD) for small-scale applications. These processes are usually cogeneration plants, using the waste heat from power generation plants.
Since in the present simulation only electrical energy is provided by renewables, reverse osmosis processes are considered. Using electrical energy out of surplus renewable production it needs to be considered, that RO membranes are very sensitive for discontinuous water flows. Processes in use today usually require a continuous water input. There are solutions to overcome this technological challenge (Paulsen & Hensel, 2007), which are not addressed within this paper though. A robust system without vulnerability to a discontinuous water flow is presumed.
Generally spoken thermal processes require high initial investment costs but less operational costs, where membranebased filtration processes are less expensive in installation but create much higher operational and maintenance costs.

76
PROCEEDINGS Conference MPDES 2011
Table 1: Costs of reverse osmosis plants depending on capacity installed
The cost of desalting water by a reverse osmosis plant
strongly depends on the capacity installed. Interviewing various market players three categories of plant capacities and costs could be derived, cf. Tab. 1. Further cost structures and economical analysis of desalination systems using renewables energy sources can be found in related publications (WIP-Renewable-Energies, 2010; Kaldellis & Kondili, 2007; Karagiannis & Soldatos, 2008; Garcia-Rodriguez et al., 2001; Viovontas, Arampatzis, Manoli, Karavitis, & Assimakopoulos, 2003).
The overall production costs of one m3 freshwater in Tab. 1 are all under € 4 with € 0.1/kWh. Since surplus electricity is examined within this case even lower water production costs about € 2/m³ can be reached. Compared to water shipments for about €10/m³ desalination is reasonable alternative.
Results Part 1: Energy-supply only The simulations are performed depending on wind velocity and fuel price. Since the average wind velocity derived from the NASA is 6.06 m/s compared to a locally measured average on the considered island of about 10 m/s, both at the height of 50 meters, a sensitivity analysis with respect to the wind velocity is performed.
Diesel prices of 0.5, 1.0, 1.5 and 2.0 US$/L are considered for the simulation. The current diesel price on Greek islands is € 1.45/L (US$ 1.89/L).
No minimum share of renewable energy is set, the present energy supply system based on diesel generators could be an optimal solution for the system configuration, if the total net present cost (NPC) was the lowest.
In HOMER, the best possible, or optimal, system configuration is the one that satisfies the user-specified constraints at the lowest total NPC. Finding the optimal system configuration may involve deciding on the mix of components that the system should contain, the size or quantity of each component, and the dispatch strategy the system should use (Lambert, Gilman, & Lilienthal, 2006).
A comparison of the optimal power supply systems on the modeled island depending on the wind velocity and fuel price is shown in Fig. 2 (see next page). Considering 20 years the total net present cost of the given optimal solution is shown within the figure. Although it is not visualized within Fig. 2, due to the power curve, the wind turbines are not able to generate sufficient electricity if the wind has a velocity of less than 4 m/s. For a higher diesel price than 0.5 US$/L and a wind velocity of 4 m/s the optimization shows, that
even with low wind velocities implementing a relatively high amount of wind converters and photovoltaics can be less expensive than operating diesel generators, cf. Tab. 2 (see next page).
With decreasing wind velocities though the share of PV increases and becomes cost efficient for all diesel prices.
Figure 2 shows very clearly that a wind/diesel hybrid system is economically the best solution for wind velocities of 6 m/s and higher and low diesel prices of about 1 - 1.3 US$/L. For higher diesel prices hybrid systems including wind, PV and diesel generators (named ”Label” in Fig. 2) are the optimal solution.
Based on the NPC the electricity supply by diesel generators only is much more expensive then a hybrid system including wind energy converters. Even if initial investment costs of the generators are not considered, since they are already operated on the island, the optimal system configuration does not differ from the results shown in Fig. 2 and Tab. 2.
Since on the given island average wind velocity is determined as 6.06 m/s by the NASA and the diesel price is 1.50-2.0 US$/L a technology mix of wind and PV combined with the existing diesel generators is the most attractive solution. For further discussion of options for surplus electricity usage only the scenario with 6 m/s and 1.50 US$/L is considered.
Part 2 - Interplay of Energy and Water Supply Based on the most cost effective system configuration for a wind velocity of 6 m/s and a diesel price of 1.50 US$/L determined before (see Fig. 3), the surplus electricity is 3.46 GWh in a year, 32 % of the overall supplied and demanded electricity.
Figure 3: Electricity production from the most cost effective system configuration in MWh (wind elocity of
6 m/s; diesel price 1.5 US$/L)
In order to determine how much surplus electricity generated exclusively by renewables (not by diesel generators) can be used for water desalination over a year, external calculations were integrated into the optimization approach. The hourly data sets were exported from HOMER to allow a systematic onitoring of surplus electricity.

77
PROCEEDINGS Conference MPDES 2011
Figure 2: Optimal Energy Mix depending on wind velocity and diesel price
Table 2: Optimal solution: Mix of generation technologies depending on wind velocity and the price of diesel fuel (COE means cost of electricity)
A usual reverse-osmosis plant requires 3-6 kWh
electrical energy for the production of 1 m³ freshwater. For this simulation a relatively high energy demand of 5.5 kWh/m³ is considered. Due to dimensional and technological constrains of the desalination plant, the hourly water flow is limited and not all surplus electricity can be applied to water production.
Considering the demand of 360 m³/d in off-season and 600 m³/d in season into account, a dimensioning of 50m³/h seems to be a reasonable for the given system. The dimension of a cost effective and implementable desalination plant though would probably need to be downsized. Areal and topographical constraints of the island itself are not considered here.
A further constraint is the capacity of water storage. The benefit of producing freshwater at the time when surplus electricity is generated is the possibility to store water less expensive than electricity. In most arid regions no open water storage options are given. On the given island a water storage tank already exists and can supply the islands inhabitants autonomously with freshwater up to four days. Water storage tanks exist on islands with water shortage problems, because freshwater is being delivered by shipment once or twice a week. Investment costs for water storage are not considered within the calculation.

78
PROCEEDINGS Conference MPDES 2011
Figure 4: Water demand and production potentials
Calculating the potential of producing freshwater per
hour, day and week including all mentioned constraints depending on the appropriate diesel prices, water surplus and shortage can be determined. Figure 4 highlights the potential of water production on the island. The red line displays the overall water demand during one week for the given island. The dark blue columns show the desalination potential based on surplus electricity without considering technological constraints of the desalination plant. The light blue columns symbolize the amount of freshwater that can be supplied considering the capacity constraints of the desalination plant.
Figure 4 shows that most of the time sufficient surplus electricity produced by renewables is available. It also proves though that with solar and wind energy only, dimensioned for the given technology mix and nominal capacities, a continuous and reliable water supply is not possible the whole year.
If a week is marked with shortage, all water storage capacities are emptied and consequently no shifting from periods before is possible. Since the demand for freshwater is very inelastic, especially in the summer months when water is needed the most, there are different ways to guarantee a continuous supply.
If autonomy and independence from monopolistic water prices has high priority, falling back to shipments should be avoided. Since in the present calculation only surplus electricity generated by sun and wind was serving the desalination plant, applying the generators can solve the water shortage.
HOMER possesses the tool to integrate a deferrable load into the system. Although this function is not very flexible and difficult to adapt to the given situation, an approximation is being done. The integration of additional generator sources could eventually change the optimal system configuration, since not only the primary but also the deferrable load is met completely.
For the deferrable load an average load of 1,980 kWh/d (5.5 kWh/m³ for 360 m³ water) is assumed for the off-season months October to May and 3,300 kWh/d for the remaining summer months.
Calculating with a water storage capacity of about 1,820 m³, which equals a 10,000 kWh electrical storage
capacity, and a peak load of 300 kW (corresponding to 5.5 kWh/m³ for maximum capacity of 50 m³/h of the desalination unit) the system configuration is ideal in terms of the NPC optimization by HOMER. A representative wind velocity of 6 m/s and a diesel price of 1.50 US$/L is considered, cf. Tab. 3.
In Tab. 3 the total NPC of result 1, discussed first without integrated water purification, and result 2, considering the energy demand of desalination, are presented. Comparing the two systems it is obvious that the costs of energy supply system 2 including water purification increase about 4 million US$. The same time the need for electrical storage capacity shrinks. The installation of four additional wind turbines is suggested by HOMER and the diesel generators would need to operate more hours using higher amounts of fuel, what is the reason for the high increase of total NPC over 20 years.
The simulation shows, that considering desalination within an electricity grid can contribute to a cost efficient supply of power and water, but requires additional investments and cannot be met just by surplus energy on the given island. Despite the additional investment costs for a desalination plant, the highest fraction of the total costs, namely the energy costs, can be minimized and make a co-production of freshwater not only environmentally but also economically attractive.
The question an island’s government or supplier needs to answer is, what is more valuable for them, electricity or water at the required time. Due to the much higher water demand in the summer months, meeting the water demand would mean a much larger capacity layout of a desalination plant, which requires higher investments. Especially on Greek islands though it can be an interesting approach to dimension an electricity and water supply grid not focused on the electricity but on the water demand: In Greece the electricity costs are fixed at about 0.1 e/kWh, no matter if mainland or island. Water prices though are not standardized. Utilities could invest € 0.5-0.6 for the production of 1 m³ of freshwater and sell it for e.g. € 4-8. This could be an attractive business model.

79
PROCEEDINGS Conference MPDES 2011
Table 3: Optimal Solution: Mix of generation technologies without and with deferrable load (wind velocity of 6 m/s; diesel price 1.5 US$/L)
Discussion, Conclusion and Outlook It is economically feasible to integrate renewables into the micro grid on a island as shown in this paper. Electricity can be generated less expensive with an energy generation mix than it is today by diesel generators only.
A significant amount of surplus electricity provided by wind turbines and PV could be used if an appropriate type of electrical storage was available for a reasonable price - which is not the case today. The type of battery used within the simulations would be of limited use in day-to-day operations resulting in the need for another, more effective solution.
Especially remote regions in tropical, dry or even moderate climate zones often face not only the need for a reliable electricity source but also for clean water. The available data for the island under consideration were used representatively to show the potential of water coproduction by seawater desalination using surplus electricity from renewable sources.
The environmental friendly surplus electricity from wind and sun is sufficient for a continuous water supply for a significant part of the year.
For weeks with a water deficit the missing amount of freshwater would need to be produced by diesel generators or transported to the island by ship.
A complete other set of options becomes available when desalination technologies based on thermal processes (distillation) are considered in the overall system. Here the inclusion of heat from waste incineration systems is an example. This aspect is beyond the scope of this paper.
Further research is required for a more accurate optimization integrating desalination as a deferrable load into a given micro grid. Additional aspects of the complex cost and technological structure of real-world systems need to be included. Moreover additional renewable energy forms and desalination technologies should be integrated in future work.
Acknowledgment We want to thank Philipp Blechinger for his precious contribution.
References Agency, I. A. E. (2010). www.aegean-energy.gr/en/
strategy.htm. ([online, accessed 10-November-2010])
AOSIS. (2001). In Report of the third alliance of small island states. Available on www.sidsnet.org/
docshare/energy/FinalRptCyprus.doc ([Online; accessed: 20-December-2010])
Bruggen, B. V. der, & Vandecasteele, C. (2002). Distillation vs. membrane filtration: overview of process evolutions in seawater desalination. Desalination, 143, 207 - 218.
BSW-Solar. (2010). www.en.solarwirtschaft.de. ([online; accessed 19-December-2010])
BWE. (2010). www.wind-energie.de/en/. ([online, accessed 20-October-2010])
Caralis, G., & Emmanouilidis, G. (2009). Ios - aegean energy agency, executive summary of the work done on energy planning (work package 3). Available from www.aegean-energy.gr/en/pdf/executive-summary.pdf
Garcia-Rodriguez, L. (2003). Renewable energy applications in desalination: state of the art. Solar Energy, 75, 381-393.
Garcia-Rodriguez, L., Romero-Ternero, V., & Gomez-Camacho, C. (2001). Economic analysis of wind-powered desalination. Desalination, 137, 259–265.
HOMER. (2010). www.homerenergy.com. ([online, accessed 20-October-2010])
Kaldellis, J. K., Kavadias, K. A., & Kondili, E. (2006). Energy and clean water coproduction in remote islands to face the intermittent character of wind energy. International Journal of Global Energy Issues, 34.
Kaldellis, J. K., & Kondili, E. M. (2007). The water shortage problem in the aegean archipelago islands: cost-effective desalination prospects. Desalination, 216, 123–138.
Kaldellis, J. K.,&Zafirakis, D. (2007). Optimum energy storage techniques for the improvement of renewable energy sources-based electricity generation economic efficiency. Energy, 32, 2295–2305.
Kalogirou, S. A. (2005). Seawater desalination using renewable energy sources. Progress in Energy and Combustion Science, 31, 242–281.
Karagiannis, I. C., & Soldatos, P. G. (2008). Water desalination cost literature: review and assessment. Desalination, 223, 448–456.
Kos, P. D. (2010). www.dei.gr/Default.aspxid =29882&nt=18&lang=1. ([online, accessed 10-November-2010])
Kusterer, J. M. (2010). Nasa surface meteorology and solar energy. Available on http://eosweb. larc.nasa.gov/cgi-bin/sse/grid.cgi?email=na ([online; accessed:17-November-2010])
Lambert, T., Gilman, P., & Lilienthal, P. (2006). Micropower system modeling with homer. In
80
PROCEEDINGS Conference MPDES 2011
Integration of alternative sources of energy (pp. 379–418). Hoboken, New Jersey: IEEE, Wiley-Interscience.
Livengood, D., Sim-Sim, F. C., Ioakimidis, C. S., & Larson, R. (2010). Responsive demand in isolated energy systems. In Island sustainablity (Vol. 130, pp. 197–207). Southhampton, UK: WIT Press.
MAN. (2010). Mathioulakis, E., Belessiotis, V., & Delyannis, E.
(2007). Desalination by using alternative energy: Review and stateof-the-art. Desalination, 203, 346–365.
Meteonorm. (2010). www.meteonorm.com. ([online, accessed 20-October-2010])
Mitra, I. (2006). A renewable island life: Electricity from renewables on small islands. Refocus, 7(6), 38–41. Available on http://www.sciencedirect.com /science/article/B73D8-4MJJDG7-11/2/05e63be07af98c7056065b67bad4ffbc
Ntziachristos, L., Kouridis, C., Samaras, Z., & Pattas, K. (2005). A wind-power fuel-cell hybrid system study on the non-interconnected aegean islands grid. Renewable Energy, 30, 1471–1487.
Paulsen, K., & Hensel, F. (2007). Design of an autarkic water and energy supply driven by renewable energy using commercially available components. Desalination, 203, 455–462.
TerraWater. (2010). www.terrawater.de. Kiel, Germany. ([online; accessed 19-December-2010])
Tzen, E., & Morris, R. (2003). Renewable energy sources for desalination. Solar Energy, 75, 375–379.
Udono, K., & Sitte, R. (2008). Modeling seawater desalination powered by waste incineration using a dynamic systems approach. Desalination, 229, 302–317.
Viovontas, D., Arampatzis, G., Manoli, E., Karavitis, C., & Assimakopoulos, D. (2003). Water supply modeling towards sustainable environmental management in small islands: The case of paros, greece. Desalination, 156, 127-135.
Voivontas, D., Yannopoulos, K., Rados, K., Zervos, A., &Assimacopoulos, D. (1999). Market potential of renewable energy powered desalination systems in greece. Desalination, 121, 159–172.
Weisser, D. (2004). On the economics of electricity consumption in small island developing states: a role for renewable energy technologies? Energy Policy, 32, 127–140.
WIP-Renewable-Energies. (2010). www.prodes-project .org. ([online, accessed 10-November-2010])
Witte, T., & Siegfriedsen, S. (2003). Winddesalter technology, direct use of wind energy for seawater desalination by vapour compression or reverse osmosis. Desalination, 156, 275–279.

I. Scientific PapersImplementation and Business Models

82
PROCEEDINGS Conference MPDES 2011
The Internal Sphere of Influence of Peasant Family Farms in Using Biogas Plants as Part of Sustainable Development in Rural Areas of Germany
Anke Bischoff ([email protected])
Technische Universität Berlin, Postgraduate Program Microenergy Systems
Sekr. ER 2-2 Hardenbergstr. 36 A 10 623 Berlin, Germany
Abstract Within the last decade the biogas branch has become an important economic sector in Germany. It consists of several hundred companies, including manufacturers and providers of plant components and entire plants as well as service providers, operators, etc.. Many arguments are used to support a further and rapid expansion of biogas plants in Germany. They are centered around the many potentials of biogas plants, among them the biogas plants’ capability to support sustainable development processes, especially in rural areas. The major challenge in realizing such aims partly springs from the several unwelcome side effects which accompany the fast and steady growth of biogas plants in both quantity and capacity. The presented PhD project shows the actions and significance of family farms in Germany in order to successfully master the complex challenge of using the operation of biogas plants for multilayered sustainable development processes in rural areas. The internal sphere of influence family farms use to do so comprises of inter alia deciding factors of action such as unfolding synergies, mobilizing endogenous resources as well as sustaining self-determined innovativeness. Furthermore it includes making use of a farm’s ability to self-regulate. In this way the surveyed family farms pursue strategies which reflect a regrounding in a peasant type of agriculture - a development which has been observed as a current repeasantization world-wide. The PhD project is methodologically based on holistic approaches using a sample of family farm case studies.
Keywords: biogas plant; family farm; peasant type of agriculture; sustainable development; self-regulation.
Introduction An ongoing expansion of biogas1 plants can be observed in Germany, from 139 in 1992, 1050 in 2000 to about 6000 at the end of 2010. Between 2000 and 2010 the installed capacity has increased from 65 MWel to about 2279 MWel and the average electrical capacity of newly installed plants from 75 KWel to 380 KWel (Fachverband Biogas, 2010). Within the last ten years the biogas branch has become an important economic sector which stands out for having achieved market-leadership on a global scale (Pellmeyer, 2008). It consists of several hundred companies, including manufacturers and providers of plant components and entire plants as well as service providers, operators, etc.. Political documents on strategy, such as the National Biomass Action Plan, support the pursuit of a further expansion in order to reveal the
1 Biogas in Germany is mainly produced from agricultural
biomass. The two main input materials are animal excrement (41%) and energy crops (47%) (FNR & BMELV, 2009).
manifold associated potentials of biogas2 plants. A major potential of biogas plants is seen, for example, in their ability to function as a building block in a transitional process of energy supply from fossil fuels to renewable energy. Furthermore they are intended to function as a major pillar of sustainable development strategies. Biogas plants’ ability to contribute to aims such as creating added value and closing resource cycles in their surroundings, as well as improving the efficiency of national energy supply structures are both further arguments in their favor (BMU & BMELV, 2010). Huge efforts are being made in development and research processes to realize these viewed potentials.
Observing Germany’s countryside highlights the complex challenge of realizing the manifold potentials of biogas plant operation. This is due, for example, to the several side effects which accompany the fast and steady growth of biogas plants in both quantity and capacity.
One such side effect is the continuing interwovenness of the sector’s growth on a highly fossil fuel-intensive type of agriculture, demonstrated by the significance of corn cropped in monocultures for substrata supply (Anspach & Möller, 2008). Many production units are solely cultivating corn as energy crop, because of its excellent ratios of cost input to energy output. All in all corn accounts for about 48 %, measured in mass fraction, of all substrata utilized in biogas plants since 2004 (Weiland, 2009). Between 2005 and 2010 the area for cultivating corn as energy crop increased nearly eightfold from 70,000 ha to 525,000 ha (c.f. DMK, 2010).
Another side effect is the difficulty of achieving efficiency within the whole life-cycle of the converted resources. The most notable aspect of this is the relatively low level of typical heat utilization of biogas plants, with which heat-power cogeneration is coupled, on average below 50% (Weiland, 2009). Just 10 % of all operators who started after the 2004 amendment of the German Renewable Energy Law utilize more than 50% of the available heat (ibid.).
Recently the regional contribution of biogas plant operation to the growing pressures on cultivated land has become a source of increasingly heated debate. Reasons for this are, on the one hand, comparative analyses of studies which highlight the theoretical energy potential of all given livestock manure in Germany with studies which test the practical feasibility of such theoretical energy potential within the boundaries of the requisite
2 Biogas is one of several bioenergies the National Biomass
Action Plan is pursuing.

83
PROCEEDINGS Conference MPDES 2011
agricultural land. These comparisons show a wide gap3. On the other hand, more and more studies reveal regional developments of notably rising rents due to the payment reserves of biogas plant operators which considerably benefit from some of the bonuses the Renewable Energy Law is granting (e.g. Thiering & Bahrs, 2010). Financially influential investors from outside the farming sector with a vested interest in operating a variety of biogas plants in power ranges above average seem in particular to be gaining rapid influence (Brendel, 2011).
A variety of political and economical conditions as well as advances in technical progress are laying the groundwork for the further development of Germany’s biogas production and utilization. Nevertheless, actively using biogas plants for supporting overall sustainable development is challenging every operator in a very specific and complex way. The range of actions an operator takes in this regard delineates his or her internal sphere of influence. The individual experiences of the personal internal sphere of influence might differ widely. To investigate its capabilities, a group is chosen for whom it is strategic to use their internal sphere of influence to a large extent in order to construct and maintain a self-controlled resource base. This group is peasant family farms (cf. Ploeg, 2008). It is the same group from which Germany’s pioneers originated, pioneers who began operating biogas plants for reasons such as reintegrating energy supply tasks into a farm’s self-controlled resource base, long before the Renewable Energy Law began providing financial support.
The presented PhD project researches the integrated micro perspectives of peasant family farms’ in using biogas plants for supporting sustainable development processes in rural areas.
Research Objectives The objective of the presented PhD project is to engage with the challenge of scientifically visualizing the potential of peasant family farms in using biogas plants for supporting sustainable development processes in rural areas. To do so the PhD project aims to look at family farms as an integrated whole by using inter- and transdisciplinary approaches.
Research Questions What constitutes the internal sphere of influence of
family farms in Germany with regards to applying biogas plants in a sustainable manner?
How can the family farms’ internal sphere of influence be strengthened by focusing on supportive plant equipment and service?
3 Thierung and Bahrs (2010) delineate a requirement of 80%
of Germany’s available farmland in order to realize the theoretical potential of 3,5 billion m³ methane out of Germany’s annual amounts of principally available slurry an manure. They assume an average mixture in fermented mass fraction of 35% manure/ slurry and 65% energy crops in order to realistically realize a plant’s economic efficiency.
Family Farm Within this project a family farm is defined as a living organism in the format of a unit of household, business and ecosystem and embedded in a network called a region (Figure 1).
Figure 1: Family farm in the format of a unit of
houshold, business and ecosystem, embedded in the surrounding region.
Following this understanding of the family farm as a living organism/ system (c.f. Kanatschnig, 1992; Kanatschnig, 2009; Ripl et al., 1996; Ulrich & Probst, 1991) its main attributes are: 1. Complexity as a result of multilayered interactions and relationships within the system as well as a high degree of variety in system behavior, which cannot be clearly predicted. 2. Openness of the system which is expressed in its manifold interactions with its surroundings in transfer of energy, mass flow and information. 3. Dynamic structures whose stability is dependent on continuous change. 4. The ability to internally develop and to transform the system’s behavior.
Characteristics particular to a family farm (c.f. Mandl, 2008; Ploeg, 2008) include: 1. The primary provision of labor by the family. 2. Decision-making power over the considerable part of farm assets being held by the family. 3. Household and enterprise being intrinsically tied together, e.g. a shared use of resources between household and business. Sustainable Manner of Biogas Plant Application A sustainable manner of biogas plant application is defined here as one that reflects itself in a sustainable development of the family farm as a whole with the potential of extending towards sustainable development processes of the surrounding region as well.
The following terms are used to delineate a family farm’s sustainable development: 1. The target of viability in contrast to that of a continuous growth in scale (c.f. Kanatschnig, 1992; Kanatschnig, 2009; Meadows, 2007; Ripl et al., 1996; Ulrich & Probst, 1991; Vester, 1999), 2. A basic degree of decentralised autonomy in function in contrast to that of primarily externalised supply and disposal structures (c.f. Kanatschnig, 1992; Ostrom, 2009; Paech, 2009; Ploeg, 2008; Ripl et al., 1996), 3. A multifunctionality in system roles and functions in contrast to that of a strong specialism (c.f. IAASTD, 2009; Ploeg, 2008).
The represented terms have been empirically observed as intrinsic within self-sustaining living systems, both in

84
PROCEEDINGS Conference MPDES 2011
ecosystems and socio-economic systems. They have been also observed as intrinsic to those farms which are following a peasant type of farming (Ploeg, 2008).
Methods The first half of the research project was of a rather exploratory and preparatory character. Scientific literature from different disciplines was used to analyse and explore holistic approaches in theory and practise to coping with sustainable development processes in the countryside. Parallels have been extracted between the general principles of sustainable development of complex living systems on the one hand and the peasant type of agriculture on the other. To gain insight into the practical aspects of operating biogas plants within family farms in Germany several have been visited, some for a number of days in order to get involved in the daily work flow.
The second half of the research project is to realize the empirical part with the extended case study method. The main reason to choose this method was to investigate the internal sphere of influence of family farms in its real-life context. Further reasons include ensuring an evolving research process as well as managing the interdisciplinary research question through rotating phases of investigation and evaluation in a cyclical process. How the extended case study method, which has its origins in anthropology, is applied within the presented research project is described as follows.
Case Selection Each case must satisfy criteria which are categorized into two groups: essential and variable. The essential criteria are further categorized into “hard” and “soft”. The hard criteria first verify the status of a family farm as well as several aspects of the biogas plant itself, such as a minimum previous operational life of five years. The soft criteria are used to verify the case’s interest in a course of action orientated on viability, decentralized circuits and multifunctionality, described above as representing terms of sustainable development processes. In order to focus on similar developments within those families farming conventionally and those farming organically, a sample of 50 % was selected for each group.
To find the most appropriate cases a two-step selection process was applied. In the first place, cases were preselected due to the assistance of third parties who are in direct contact to selected family farms such as the German Society for Sustainable Biogas and Bioenergy Utilization and the German Biogas Association. In the next step the preselected family farms were verified by a direct and selective standard interview based on the delineated criteria.
All in all, the selected sample comprises of about eight cases. Alongside its compliance to the necessary and variable criteria, the sample can be described by its specifications, some of which are delineated in Tab. 1.
Case Studies Following verification of each case’s appropriateness, an initial investigation was carried out. It focused on the main interactions between production areas within the farm as well as on the cooperation of the farm with stakeholders in the surrounding region, both in the context of the farm’s biogas plant operation. This was combined with a guided interview about the user’s experience of realizing sustainable development in the context of his or her biogas plant operation, the triggers for development and practical constraints. In the next phase, similarities and differences between the cases were evaluated. A comparison between the empirical outcomes and the state of current research led to the definition of a common pattern for the second phase of investigation.
The second phase of the investigation was used to substantiate the extracted outcomes from the first phase. To ensure a coherent starting point, a short presentation of the specific outcomes of the first investigation was used. All of the second stage investigations have been transcribed. Every single case was evaluated based on the transcription and with reference to the common pattern extracted beforehand. Each family farm receives a copy of the resulting individual reports and is asked to review the accuracy of the results.
The final phase of the investigation will focus on a quantification of all the extracted criteria which determine a farm’s internal sphere of influence, regarding their subjective evaluation and realization through the family farms.
Interim Results The description of the research project’s interim results is divided in four sections. The first two elaborate the main aspects which constitute the internal sphere of family farms’ influence in using biogas plants in a sustainable manner: their way of acting as well as their way of self-regulation. This is followed by a section on the family farms’ common experiences with their individual plant equipment and service. A conclusion finalizes the description of the research projects interim results.
Tab. 1: Specifications from the sample concerning the biogas plant operation
Specifications Sample Initial operation Beginning of 1990s to 2005 Initial costs Ranging between 1500 €/KWel to
4000 €/KWel Plant capacity 20 KWel to 600 KWel Fermentation All: wet and standing, some use a
mesophilic and some a thermophilic digestion
Substrata Slurry, manure and biomass Operated cogeneration plants
Both gas and pilot injection engines
Location of biogas plant
Between 40 m and 500 m to the residential building of the farms

85
PROCEEDINGS Conference MPDES 2011
Factors of Action Three deciding factors of action proved to be particularly relevant in delineating the internal sphere of influence in family farms which are using biogas plants as part of sustainable development processes. Their commonalities include: 1. The creation of added value in the short-, middle- and long-term. 2. The fact that they can generally be found and realized on several levels, e.g. social, ecological, economical and technical.
Unfolding Synergies Synergies are understood here as concurrences between different areas of production and stakeholders which hold a high and/or multilayered benefit such as reinforcing, stabilizing and complementing each other (following e.g. Friedrich, Malik, & Seiwert, 2009; Ploeg, 2008; Ulrich & Probst, 1991).
Synergies were observed between the operation of the biogas plant and almost every defined area of production. Those which could be found most often4 are those shown in Figure 2. Some of those found to be very common are described beneath.
Figure 2: Correlated areas of production with energy
and mass flow in both directions within the family farm.
A very strong synergy is demonstrated between dairy farming and the biogas plant, for example due to the utilization of slurry as substrate. Slurry is a substrate of value and almost free of charge. The value5 of this substrate is founded on its stabilizing effect on the whole fermentation process due to the bacteria the animal excrement contains. At the same time the transport is managed with a minimum of energetic or financial effort by using short distances, on average less than 60 m and often through pipelines using gravity. Through fermentation the usefulness of the slurry as organic fertilizer is preserved – multiple utilizations are therefore possible. On the other hand, having examined the supply chain of the biogas plants and the cows, a number of similarities arise which are used by the peasants in a well-directed manner. An example of this is the similarities between both processes of methane production. By building upon prior knowledge and experiences gained
4 Further ones have been found in the interaction with areas
such as market gardening, guesthouse and farm shop operation. 5 Its energy output is rather small compared to that of corn
silage which is about eight times as high.
from years of dairy farming, similar conclusions are drawn and applied. Furthermore, work steps are easily combined e.g. within the feeding procedures of cows and biogas plants, such as a combined use of the telehoist load lugger. To give an example of a synergy which reflects a rather particular situation: A peasant uses self-generated heat in order to maintain a frost-free milking parlor which, in turn, improves the comfort in the cowshed for both the cows and the working people as well.
The interaction of biogas plant operation on the one hand and crop production and grassland utilization on the other is another area in which several different synergies can unfold. The starting position in all cases is that the family farms produce at least half of the silage needed as substrata themselves from energy crops such as grass, clover grass and corn grown on their own cultivated land few kilometers away. Thus they minimize the logistic and transaction costs which are thereby incurred. At the same time, they benefit from the space for experimenting with new crops or cultivating methods for substrata production. All farmers experience benefits in the process of fertilizing their fields with the fermented product of digestate. A better handling of the digestate due to its improved consistency is just one example. The production of substrata and the application of digestate on the fields can easily be achieved by drawing upon already available farm machinery and established working steps.
Some general synergies concern an increased significance of the repair shop, being able to use a lot of the existing equipment. One peasant who is operating a 300 KW biogas plant reported that he only spent around 100 € for extra equipment in total even though he is using his working shop for all kind of frequent maintenance. To maintain his oldest co-generator from 2006 the most important purchase for him was buying a new inch wrench set because the metric wrenches did not fit.
Almost all of the surveyed family farms used their step towards operation of a biogas plant as a step towards regional cooperation, whether starting, expanding or strengthening such involvement. Figure 3 delineates some of the cooperations which give an impression of synergies often experienced.
Figure 3: Cooperation initialized by the surveyed family farms with a mutual high or multilayer use within the
region.
All surveyed family farms which use energy crops as substrata initiated cooperation in the field of substrata

86
PROCEEDINGS Conference MPDES 2011
supply with farms nearby. Synergies that could be observed in several cases include, for example, an activation of regional value chains, a relationship of trust among the cooperating family farms, a contribution to their mutual income, maintenance relief in periods of work peaks - during harvest for example - and a stabilization of regional rents for farmland. The surveyed family farms started the cooperation by implementing cornerstones such as systematically purchasing substrata instead of leasing or buying new arable land in the area, using a minimum contractual bond and maximizing fair pricing - for example by paying higher than average prices in years of slumped prices within the international market of agricultural commodities or via a fee release for digestate on a pick-up basis.
Another area of observed synergies is the cooperation between the family farms and businesses based in the region. This covers a diverse range e.g. energy providers, renewable energy providers, providers of equipment, assemblers, contractors, etc.. Some of the very common synergies are improvements in regional value chains with benefits for both parties involved. Many further synergies found in this field are quite specific depending on the particular regional situation.
Mobilizing Endogenous Resources Endogenous resources are understood here as those which are internally available and hold a high potential of being internally improved and reused (following e.g. Ploeg, 2008; Stuiver, Leeuwis, & Ploeg, 2004). Those which were most frequently found are shown in Figure 4.
Figure 4: Endogenous resources/ internal capital of a
family farm.
Ecological capital, here defined as the peculiar functions and assets of nature which the farming families knowingly draw upon: Those which were referred to most in the context of operating their biogas plant comprise of substrata, soil fertility, organic fertilizer and energy carriers.
Substrata: Part of it is an increased differentiation of resources providing basic forage and substrata, both produced within the farm. A very common example is the differentiation of grassland or clover-grass cuts according to different needs and demands in quality for either the milk cows or the biogas plant. Since silage with a low standard of quality is neither adequate for feeding the
cows nor the biogas plant, the family farms make sure an overall high quality is maintained. At the same time, the biogas plant can utilize silage of reduced quality easier. So whenever a reduction of quality of fodder silage is accidentally caused the biogas plant can function as a buffer. Another example is the effective use of manure, which includes inter alia the conversion of volatile carbon. The utilization of given residual matters as substrata, such as residual feed in the mangers, is mostly minimal but still an important piece in the farmers efforts to reduce waste to zero. Experimenting with crops and cropping methods that improve the ratio of effort to reward in producing substrata is strategic to all farms.
Soil fertility: Within all surveyed family farms an intense and multilayered examination of, experimentation in and engagement in sustaining soil fertility could be observed in the context of operating the biogas plant. Examples given include a systematic increase of the humus content in cultivated soils with the help of digestate separation. While the solid fraction is then used for cropland, the fluid fraction is applied to grassland. Concerning implemented or strengthened cropping systems which actively protect or build up soil fertility, examples found ranged from intercropping, undersown cropping, no tillage farming and cultivation of legumes for nitrogen fixation. The cultivation of corn as the central energy crop was mostly seen as critical from a soil fertility point of view and combined with an active experimentation6 with alternatives. Several surveyed farms are simultaneously in a process of actively reducing corn in cultivation and as substrata.
Organic fertilizer: By using digestate as a fertilizer, all the family farms experienced an increase in value compared to the former use of slurry. Alongside an increased effectiveness of the fertilizer, the digestate is valued due to reasons such as easier handling, gentler application and less smell. Particularly those farmers who are using a thermophile fermentation process described a very helpful reduction in the germination capacity of weed seeds.
Energy carrier: Last but not least, all the family farms valued their biogas plant implementation as a step towards independence in heat and power supply, even those who sell the entirety of their produced power for financial reasons and rebuy it. Besides benefiting from a further source of income which is regarded as crucial, common reasons for this are, for example, the fact that they have begun to deal proactively with shortages in fossil fuels and have improved the options within the farm for creating extra value and being part of upcoming value chains in the surrounding area. Especially those who are actively embedded in a local heating infrastructure highlight a rise in collective awareness towards the challenges of future energy supply as well as a strengthening of local community spirit. Human Capital, defined here as the combined skills and knowledge system of the cooperating people within the
6 Especially the conventional farmers showed an
unprecedented experimentation in the process of building up humus actively with the objective of having an energy rich substrata like corn at their disposal in the long run.

87
PROCEEDINGS Conference MPDES 2011
family farm: in the context of operating the biogas plant, those which were referred to most frequently comprise of an internal knowledge system, technical skills, short distances and social skills.
Internal knowledge system: By consciously using the internal knowledge system, the farming families refer to knowledge which can be characterized as contextual, experimental and integrated (following e.g. Stuiver, Leeuwis & Ploeg, 2004). Contextual knowledge is founded on recognized and applied uniqueness of the time-spatial settings of the particular biogas plant and its operation, for example when a decision about which kind of recommended energy crops and cropping system should be implemented at a height of 850 m above sea level. Experimental knowledge describes knowledge which is bound to practical skills. Its relevance has already been revealed in the family farms’ descriptions of their plant planning process. Thus visiting colleagues who operate biogas plants beforehand has been rated as one of the most important ways of becoming informed. One farmer alone made 50 visits. Integrated knowledge is mainly concerned with the ability to take an overview of and to coordinate complex situations, such as the interaction of the biogas plant operation with other areas of production within the family farm, not least to unfold synergies. In the process of operating their biogas plant these types of knowledge were relevant within the whole work flow. They were considered very necessary, especially when making use of external knowledge such as expert recommendations referring to the plant process.
Technical skills: Almost all family farms rated technical skills as crucial, comprising of a basic understanding of technical interrelations as well as an affinity with technology. Their relevance is demonstrated whenever handling disturbances in the technical work flow need to be assessed. At least for quickly carrying out minor repairs and regular maintenance work themselves, as well as always ensuring the system operation, it is considered very important.
Short distances: Taking account of short distances is another aspect valued in different ways. Minimizing transportation routes is seen as very important as a means of economizing one’s working steps. The average distance for transporting substrata as well as digestate is 2 to 3 kilometers. Most of the family farms also value their average distance of 60 meters between the residential building and biogas plant for purposes of inspection walkways. Besides daily regular inspections, it has a lot to do with taking sights spontaneously like, for example, casually looking at the gas hood.
Last but not least, social skills are considered as a very important aspect of the quality of labor in the context of operating the biogas plant. The key skills within the context of supporting the work flow of biogas plant operation varied between specific cases. In one family farm, which had expanded its activities in regional value chains of energy supply, the significance of the skill to communicate directly with colleagues, neighbors etc. and either preventing or quickly solving upcoming conflicts was made clear. Another family farm is benefiting from having very reliable and flexible cooperation partners, for example in coping with technical repairs of the biogas
plant, proved to use its capacity to recognize and to integrate individual and shared specificities into enjoying work.
Cultural Capital, defined here as the regionally grown specialties of, for example, the regionally-grown circuits and networks that link the family farm to specific stakeholders e.g. consumers within the region.
The importance of cultural capital was not seen as great as the importance of ecological and human capital by most family farms. Nevertheless, several forms of networks with a particular focus on advancing in general renewable energies or organic farming had experienced support as a means of strengthening their own plan of action. Sustaining Self-Determined Innovativeness Innovativeness is immanent in family farms. It has its source in the intrinsic necessity to change continuously in the course of a seasonal rhythm, breaks in the weather, amendments in societal guidelines or technical progress. Sustaining self-determined innovativeness, particularly with regard to interactions between novelties and innovations, is considered to be essential.
A novelty is here defined as an innovation within the farm which originates in the needs and expertise of the farming family. Thus the definition follows Ploeg et al. (2004) who describes novelties as “a modification of, and sometimes a break with, existing routines” and further as a “new insight into an existing practice or might consist of a new practice” or a new or evolved artifact. Novelties are founded “through complex cycles of careful observation, interpretation, re-organization and evaluation”. In order to create them, it is of crucial importance to act within day-to-day business in a very flexible and spontaneous way. Observing the creation of novelties within a certain period of time, their interwovenness appears as a web of novelties (Figure 5). As such it expresses how specific novelties are built upon each other and sometimes even complement each other (Ploeg, 2008).
Figure 5: A virtual web of novelties, symbolizing their interwovenness (following Ploeg, 2008).
An innovation is defined here in contrast to a novelty (following e.g. Ploeg et al., 2004). It comprises of new practices or artifacts which are primary founded on knowledge and expertise of external specialists in technology and science. An innovation can be bought as a
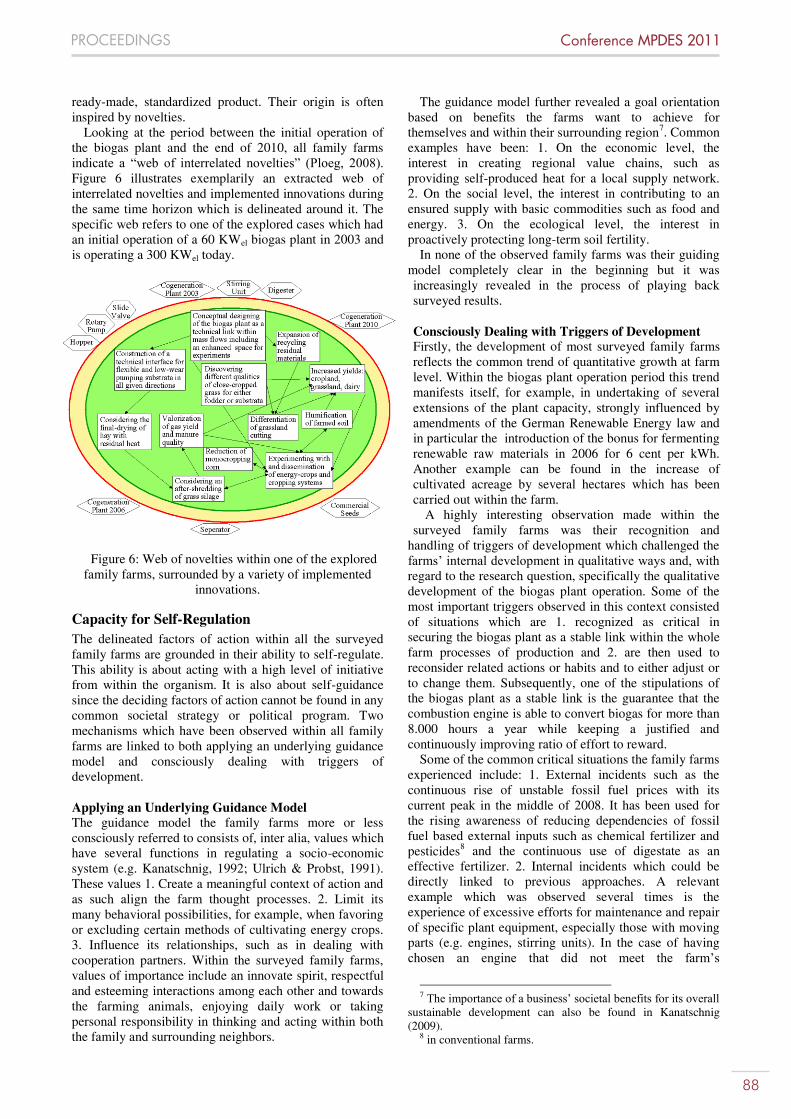
88
PROCEEDINGS Conference MPDES 2011
ready-made, standardized product. Their origin is often inspired by novelties.
Looking at the period between the initial operation of the biogas plant and the end of 2010, all family farms indicate a “web of interrelated novelties” (Ploeg, 2008). Figure 6 illustrates exemplarily an extracted web of interrelated novelties and implemented innovations during the same time horizon which is delineated around it. The specific web refers to one of the explored cases which had an initial operation of a 60 KWel biogas plant in 2003 and is operating a 300 KWel today.
Figure 6: Web of novelties within one of the explored
family farms, surrounded by a variety of implemented innovations.
Capacity for Self-Regulation The delineated factors of action within all the surveyed family farms are grounded in their ability to self-regulate. This ability is about acting with a high level of initiative from within the organism. It is also about self-guidance since the deciding factors of action cannot be found in any common societal strategy or political program. Two mechanisms which have been observed within all family farms are linked to both applying an underlying guidance model and consciously dealing with triggers of development.
Applying an Underlying Guidance Model The guidance model the family farms more or less consciously referred to consists of, inter alia, values which have several functions in regulating a socio-economic system (e.g. Kanatschnig, 1992; Ulrich & Probst, 1991). These values 1. Create a meaningful context of action and as such align the farm thought processes. 2. Limit its many behavioral possibilities, for example, when favoring or excluding certain methods of cultivating energy crops. 3. Influence its relationships, such as in dealing with cooperation partners. Within the surveyed family farms, values of importance include an innovate spirit, respectful and esteeming interactions among each other and towards the farming animals, enjoying daily work or taking personal responsibility in thinking and acting within both the family and surrounding neighbors.
The guidance model further revealed a goal orientation based on benefits the farms want to achieve for themselves and within their surrounding region7. Common examples have been: 1. On the economic level, the interest in creating regional value chains, such as providing self-produced heat for a local supply network. 2. On the social level, the interest in contributing to an ensured supply with basic commodities such as food and energy. 3. On the ecological level, the interest in proactively protecting long-term soil fertility.
In none of the observed family farms was their guiding model completely clear in the beginning but it was increasingly revealed in the process of playing back surveyed results.
Consciously Dealing with Triggers of Development Firstly, the development of most surveyed family farms reflects the common trend of quantitative growth at farm level. Within the biogas plant operation period this trend manifests itself, for example, in undertaking of several extensions of the plant capacity, strongly influenced by amendments of the German Renewable Energy law and in particular the introduction of the bonus for fermenting renewable raw materials in 2006 for 6 cent per kWh. Another example can be found in the increase of cultivated acreage by several hectares which has been carried out within the farm.
A highly interesting observation made within the surveyed family farms was their recognition and
handling of triggers of development which challenged the farms’ internal development in qualitative ways and, with regard to the research question, specifically the qualitative development of the biogas plant operation. Some of the most important triggers observed in this context consisted of situations which are 1. recognized as critical in securing the biogas plant as a stable link within the whole farm processes of production and 2. are then used to reconsider related actions or habits and to either adjust or to change them. Subsequently, one of the stipulations of the biogas plant as a stable link is the guarantee that the combustion engine is able to convert biogas for more than 8.000 hours a year while keeping a justified and continuously improving ratio of effort to reward.
Some of the common critical situations the family farms experienced include: 1. External incidents such as the continuous rise of unstable fossil fuel prices with its current peak in the middle of 2008. It has been used for the rising awareness of reducing dependencies of fossil fuel based external inputs such as chemical fertilizer and pesticides8 and the continuous use of digestate as an effective fertilizer. 2. Internal incidents which could be directly linked to previous approaches. A relevant example which was observed several times is the experience of excessive efforts for maintenance and repair of specific plant equipment, especially those with moving parts (e.g. engines, stirring units). In the case of having chosen an engine that did not meet the farm’s
7 The importance of a business’ societal benefits for its overall
sustainable development can also be found in Kanatschnig (2009).
8 in conventional farms.

89
PROCEEDINGS Conference MPDES 2011
expectations, this experience was used to enhance awareness with regard to the suitability of equipment to the farm’s needs as well as their technical maturity and quality of service. In the case of having equipment severely strained, efforts in technical fine tuning have been improved, such as decreasing the speed of the stirring units. 3. Internal incidents which could not be directly linked to specific previous procedures. A common example of this was disturbances which occurred at inconvenient times. This refers to time frames which have been reserved for resting or which make it difficult to receive assistance, such as the beginning of the weekend or holidays like Christmas or Easter for example. In many cases this experience led to improvements of the internal repair shop, as well as the development of internal technical skills.
All in all, the farms’ enlargements in scale followed a step-by-step growth. The delineated triggers of development thus have been used for consciously applying phases with an explicit focus on qualitative growth.
Triggers for development are accompanied by constraints on development. All the surveyed family farms experienced external constraints, such as licensing requirements, which are deemed to be at times arbitrary and a hindrance to the effective working of the farm. Not all but many of the surveyed farms experienced internal constraints as well. Examples observed include a work overload which led to a lack of time to pause and reflect upon internal development processes. Another example reveals personal doubts in the ability to cope with the perceived pressure to continuously increase the scale of the farm in long-term, for example in the means of handling the situation of continuously reduced farms in the surrounding regions which are seen as very important cooperation partners.
Specific Experiences with Plant Equipment and Service Elaborated upon below is how and by which means the family farms experienced integrated plant equipment and service as a means of support for their sustainable development. Most of the criteria experienced are generally valid among the family farms regardless of the level of responsibility they hold with regard to continuously functioning plant operation.
Criteria for Good and Supportive Equipment A criterion of crucial importance is, firstly, the combination of capacity and robustness. It is primarily expressed in the longevity of equipment as well as a lowered interference (fault liability) of moving parts such as the cogeneration plant or the stirring units. Another aspect has also proven to be relevant with regards to the stirring units. In particular, it affects their ability to stir different substrata to a certain extent.
Another significant criterion is the combination of internally manageable equipment and its repair friendliness. The scale of manageability ranges from being internally able to localize and fix the source of any disturbance to being able to classify any disturbance and
fix it as far as possible – depending on the respective maintenance and service contract. The significance of repair friendliness is related to the ability to perform repairs as easily as possible on the basis of given technical skills within the family farm. These skills normally comprise of a general understanding of technical interrelations for solving mechanical problems. These skills generally do not comprise of the ability to solve the problems technical experts do in fields such as electrical engineering or circuitry, both increasing fields in the context of developing high tech biogas plants.
To summarize, supporting equipment can be described as skill-orientated equipment (following e.g. Ploeg, 2008). The aforementioned criteria appeared to be most relevant for those family farms which focus on a do-it-yourself strategy in repairing and maintaining their plant equipment and use a minimum of service contracts. Criteria for Good and Supportive Service Utilizing service in the context of operating the biogas plant ranges among the family farms from a full-maintenance-service contract for 15 years to service and maintenance contracts limited to the cogeneration unit and a short period of time. What they have in common is first of all a huge interest in always having quickly accessible service as well as the expertise of service e.g. in being able to quickly localize the source of a problem. Thus sources of disturbances are searched for instead of only fixing a symptom.
Furthermore, some family farms highlighted the point of respecting, keeping and possibly even strengthening one’s own sphere of competence. An example of this is the service contracts which can be adjusted to the particular needs of the family farm. To do so the willingness to learn is seen as necessary on both the family farms and the expert side.
Another accentuated criterion is the well-directed offer of service whenever the implemented equipment is considered useful but either still in development or exceeding the technical skills found within the family farm or.
Conclusions The interim results of the research project show that in order to reveal the manifold potentials of biogas plants for supporting sustainable development processes in rural areas it needs stakeholders who use and develop their internal sphere of influence. The research project confirms peasant family farms as such a group which acts in a very promising and consistent way:
Even though all of the family farms surveyed are more or less interwoven with a fossil fuel based type of agriculture, for example due to their high degree of mechanization, all of them proactively implement approaches to reduce associated dependencies and to intensify their linkages to a renewable resource base. Besides supplying their internal heat requirements by using at least 35% up to 100% of agricultural residues, mainly slurry and manure, examples include improved ratios of effort to reward in weed control due to reduced germination ability of weed seeds and in soil cultivation due to increases in the soil’s humus content.

90
PROCEEDINGS Conference MPDES 2011
They create and hold value for a significant addition to different levels: 1. Economic value, for example in terms of financial benefits due to yield increases resulting from the digestate’s improved effectiveness as a fertilizer or the sale of electricity as a high value product. Within their region, they create value for example by systematically building up value chains while purchasing substrata instead of leasing or buying new arable land around. 2. Ecologic value, for example in terms of experimenting with alternative crops and cropping methods to monocropping corn such as grass from grassland and clover-grass which has been integrated in existing crop rotation. Within the region, they create value for example by systematically building on regional mass flow cycles. 3. Social value, for example in terms of using and developing internal skills such as technical solutions for ensuring the biogas plants work flow which decisively contribute to enjoying daily work. Within their region, they create value for example by significantly contributing to a relationship of trust among cooperating family farms as a result of mutual economic strengthening.
They use their biogas plant to close resource cycles. Thus producing and reproducing activities within the farms are strongly tied together due to the strong linkages of biogas plant operation with further areas of production such as dairy farming or crop production and grassland utilization. The biogas plant’s digestate ensures the entire fertilizer requirements in most farms. Furthermore, all farms try to establish very tight mass flow cycles while cultivation their soils, for example by applying the more stable organic carbon which has not been converted within the fermentation process or due to applying rather small fertilizer amounts.
They take part in raising efficiencies in energy supply: 1. On the input side, for example by minimizing the transport routes for substrata as a raw material and by focusing electricity as a high-value product for transportation. 2. On the output side, for example by pushing for a reasonable utilization of their produced heat not only in the winter time where all farms achieve a utilization of 100% but in the summer time, as well as for purposes such as internal grain or hay drying or the external supply of the base load for local heating networks.
Many potentials of biogas plant operation are linked to a common whole and developed simultaneously.
The interim results of the research project furthermore reveal the practical realization of using biogas pants for overall sustainable development processes as a continuous work in progress. To keep orientated within this progress the family farms use an underlying guidance model. In doing so they are directly confronted with many obstacles which they have to solve in order to go on and to subsequently improve the overall farm development. Many such obstacles are shown to be ideas about using a biogas plant for overall sustainable development processes, ideas which still hold the potential to mature. By recognizing and using these potentials the family farms strengthen their internal sphere of influence by themselves. The research process did show that it is difficult to strictly divide triggers for internal
development from constraints. Thus there have been triggers, which some family farms experience as constraints and vis versa.
Raising the question of how the sustainable utilization of biogas plants in rural areas of Germany could be strengthened easily, the interim results of the research project suggest the proactive use of the hidden potential of family farms who are following a peasant type of agriculture. The case studies showed that their internal sustainable development as a whole has great potential to extend towards their surroundings. One starting point could be to use the family farms’ own suggestions on supportive plant equipment and service which are linked to and keep pace with their ability to unfold synergies, to mobilize endogenous resources and to sustain self-determined innovativeness.
Discussion The research project confirms peasant family farms as a group which uses and develops its internal spheres of influence in shaping sustainable development processes with biogas plants as a technical link in a very promising way, for example by their ability to simultaneously realize several potentials the technology holds. Within the cyclical research process of literature review and empirical field study, deciding factors of action and the mechanism of self-regulation were revealed as two main aspects of how peasant family farms take influence upon their sustainable development. Certain characteristics of technical plant equipment and service were demonstrated to be supportive for peasant family farms’ own work flow in biogas production and utilization processes.
The interim results of the research project resonate with a wide range of ongoing research which gives insight into holistic approaches of sustainable development, approaches to strengthen them as well as limiting constraints:
An important part of this research is the long-term empirical studies of the Wageningen University rural sociology group and the research of Prof. Jan Douwe van der Ploeg. In collaboration with his colleagues he makes very substantial insights into the grass-root processes in which peasant farming is a key driver of sustainable development in the countryside (Ploeg, Banks, & Long 2002; Wiskerke & Ploeg, 2004). The family farms surveyed within this field study thus represent a small piece in the large picture that he draws upon to show a world-wide process of “re-peasantization” 9 (Ploeg, 2008). Their significance can be further linked to many pieces of research which specifically look for solutions in farming which can cope with the rapid decline of fossil resources10 and the sustainability of so-called renewable resources (Giampietro & Mayumi 2009; Perfecto et al. 2009; Shiva, 2008).
9 Repeasantization implies a double movement, on the one
hand a quantitative increase of peasant farms in numbers as well as a qualitative shift towards increasing autonomy for farms.
10 According to the 2010 World Energy Outlook by the International Energy Agency, a rapid decline in crude oil producing fields started in 2009 (Tanaka, 2010).

91
PROCEEDINGS Conference MPDES 2011
Results which explore how to increase influence upon the shaping of sustainable development processes resonate with research which explored in depth the potential of exploiting living systems’ capacity of self-regulation for both ecosystems (Ripl et al., 1996) as well as socio-economic systems (Kanatschnig 1992; Kanatschnig 2009). An example of which can be found in both systems’ research refers to the significance of recognizing and using crucial points within living systems’ development curves which often represent necessary turning points from phases of quantitative to phases of qualitative growth. The specific role and impact of non-material factors such as values is currently being researched by Krämer (expected in 2011) in the context of proactively shaping family farms’ internal sphere of influence. The experiences of the family farms with technical plant equipment and service which supports their biogas production and utilization work flow resonates, for example, with research results which highlight the significance of skill orientated technologies (Ploeg, 2008) or the role of product service systems.
Specific results of the research project regarding the concrete action of how to use a biogas plant for a farm’s overall sustainable development pick up on research that focuses on linking biogas production and utilization with sustainable development processes in the countryside. Such research include approaches which focus on improving the ratio of effort to reward by cultivation of energy producing crops from cropping systems which utilize existing potentials and synergy effects (Birnstingl, 2010; Niemetz et al., 2011). The significance of regional energy supply tasks as triggers for overall regional development processes can be found in research with a focus on the development of bioenergy villages or bioregions (Groier, 2010; Ruppert et al., 2008). These pieces of research also show the impact of regional economic cycles and value chains built on endogenous resources.
The research project highlights peasant family farms’ general role as carrier of sustainable development in rural areas within the exemplary context of biogas production and utilization. A contrasting fact is that Germany’s family farms are declining rapidly. Many have been giving way to a structural change, which is leading towards continuously expanding units of production as part of an agricultural modernization concept spanning decades11. It is a trend which can be observed similarly on a global scale, accompanied by an ongoing double squeeze on agriculture which internally and externally squeezes total added value out of production units (Ploeg, 2008). This global trend is further accompanied with a degradation of natural resources on which the peasant type of agricultural production is based. Part of this is a constant loss of fertile soil (Bai et al,. 2008; Foley, 2005) and of intact cooling structures of vegetation on Earth (Ripl, 2003) – a development which is even a constricting
11 The agricultural workforce in Germany declined from 24 %
in 1950 to 2.5 % in 2000 (BMVEL, 2001). Germany’s farms have seen a steady decline since 2000 at a rate of 2.5 % per year, mostly in family farms which make up 93.5% of all farms in Germany (BMELV, 2010).
factor within the world-wide expansion of bioenergy production, precisely described by Giampietro and Mayumi (2009).
The influence of Germany’s growth of biogas plants in number and capacity on the development of peasant family farms is multi-faceted. Whether the promising approaches of individuals will extend to a national level remains to be seen12. In current political documents on strategy, such as Germany’s National Biomass Action Plan, bioenergy13 in Germany is regarded as a success story which shall be pursued, specifically by following a high tech strategy (BMU & BMELV, 2010). The action and role of peasant family farms in handling the complex challenge of using biogas plants for supporting overall sustainable development in rural areas seems, to date, to be considerably underestimated.
The main aim of the research project is to engage with the challenge of scientifically visualizing the potentials of peasant family farms’ use of biogas plants to support sustainable development processes in rural areas. To do so, many approaches taken from as of yet not directly linked disciplines have been brought together during the research process. The research project is of an explorative character. While focusing on a holistic perspective its limits are subsequently its theoretical and practical exactness in detail. Most of the results keep a qualitative level and have to get along without the support of quantitative substantiations. The outcome’s validity is limited to a number of eight cases. Furthermore, the holistic approach in looking at biogas production and utilization is reduced to a user’s perspective.
If some of the limits of the presented results were to be deepened in further research projects, this could considerably contribute to improvements within this young and interdisciplinary research field.
Acknowledgement To name just two groups of the many who made this
PhD project possible: I thank the Hans-Böckler-Foundation for the great support within the scholarship programme as well as the involved family farms for taking the time to share their experiences with me in a very open way.
References Ansbach, V., & Möller, D. (2008). Biogas - grünes Gold
vom Acker? In Der kritische Agrarbericht 2008, 129-134.
Bai, Z., Dent, D., Olsson, L., & Schaepman, M. (2008). Global Assessment of Land Degradation and Improvement. 2008 ISRIC - World Soil Information. Available on http://www.isric.org/ISRIC/webdocs/ docs/report%202008_01_glada%20international_rev_nov%202008.pdf
Birnstingl-Gottinger, B. (2010). Rohstoff-produktion für Biogas-Kleinstanlagen - ökonomische und ökologische Aspekte. Gehalten auf der Biogas-ExptertInnen-
12 A critical look at the current trend of Germany’s biogas
sector can be found in Trojecka (2007). 13 Biogas is seen as one of these bioenergies.

92
PROCEEDINGS Conference MPDES 2011
Stammtisch, Irdning. Available on http://noest.ecoundco.at/news/docs/27767_Einladung%20Biogas-ExpertInnen-Stammtisch.pdf
BMELV. (2010). Die Deutsche Landwirtschaft - Leistungen in Daten und Fakten. Berlin. Available on http://www.bmelv.de/cae/servlet/contentblob/430138/publicationFile/26477/DieDeutscheLandwirtschaft.pdf
BMU, & BMELV. (2010). Nationaler Biomasseaktions-plan für Deutschland - Beitrag der Biomasse für eine nachhaltige Energieversorgung. Berlin. Available on http://www.bmelv.de/SharedDocs/Downloads/Broschueren/BiomasseaktionsplanNational.pdf?__blob=publicationFile
BMVEL. (2001). Ein Jahrhundert Agrarentwicklung. In Statistisches Jahrbuch über Ernährung, Landwirtschaft und Forsten 2001 (Bd. 1-45, S. XXXVIII). Available on http://berichte.bmelv-statistik.de/SJT-0000100-2000.pdf
Brendel, F. (2011). Energie im großen Stiel - Auswirkungen des Biogas-Booms auf Umwelt, Artenvielfalt und Landwirtschaft. WWF. Available on http://www.wwf.de/fileadmin/fm-wwf/pdf_neu/ Studie%20_Biogas_Energie%20im%20gro%C3%9Fen%20Stiel.pdf
DMK. (2010). Europas Maisexperten: Zehn Prozent weniger Ertrag bei Silomais. Available on http://www.maiskomitee.de /web/intranet/ news.aspx?news=57711c1d-c56c-4d03-9d09-502c8d548a91
Fachverband Biogas. (2010). Biogas Branchenzahlen 2010. Available on http://www.biogas. org/edcom/webfvb.nsf/id/DE_Branchenzahlen/$file/11-01-07_Biogas%20Branchenzahlen%202010_erw.pdfs
FNR, & BMELV. (2009). Biogas - eine Einführung. Available on http://www.fnr-server.de/ftp/pdf/literatur/ pdf_175-fnr-%282009%29-biogas-eine-einfuehrung.pdf
Foley, J. (2005). Global Consequences of Land Use. Science., 309 (5734), 570.
Friedrich, K., Malik, F., & Seiwert, L. (2009). Das große 1x1 der Erfolgsstrategie EKS - Erfolg durch Spezialisierung (13. Aufl.). Offenbach: GABAL.
Giampietro, M., & Mayumi, K. (2009). The biofuel delusion: the fallacy of large-scale agro-biofuel production. London, Sterling VA: Earthscan.
Graß, R. (2008). Energie aus Biomasse im Ökolandbau. In Der kritische Agrarbericht 2008, 95-99.
Groier, M. (2010). Das Eigene stärken. In Der kritische Agrarbericht 2010, 99-103.
IAASTD. (2009). Agriculture at a Crossroads Synthesis Report. Washington, DC: International Assessment of Agricultural Knowledge, Science and Technology for Development.
Kanatschnig, D. (1992). Vorsorgeorientiertes Umweltmanagement: Grundlagen einer nachhaltigen Entwicklung von Gesellschaft und Wirtschaft. Wien: Springer.
Kanatschnig, D. (2009). Das Richtige soll wachsen! In F. Hinterberger, H. Hutterer, I. Omann, & E. Freytag (Eds.), Welches Wachstum ist nachhaltig? Ein Argumentarium. Mandelbaum, 82-86.
Krämer, D. (2011). Faktoren für den langfristigen Erfolg von Haushalts-Unternehmens-Komplexen am Beispiel
landwirtschaftlicher Familienunternehmen im deutschsprachigen Raum. Dissertation in progress. Rheinische Friedrich-Wilhelms-Universität, Bonn.
Mandl, I. (2008). Overview of Family Business Relevant Issues. Wien: Austrian Institute for SME Research. Available on http://ec.europa.eu/enterprise/policies/sme/files/craft/family_business/doc/familybusiness_study_en.pdf
Meadows, D. (2007). Grenzen des Wachstums: das 30-Jahre-Update Signal zum Kurswechsel (2. Aufl.). Stuttgart: Hirzel.
Niemetz, N., Kettl, K.-H. & Narodowlawsky, M. (2011). Ecological and economical evaluation of biogas feedstock from intercrops. International Conference on Micro Perspectives for Decentralized Energy Supply, 7-8 April. Berlin.
Ostrom, E. (2009). A general framework for analysing sustainability of social-ecological systems. Science., Vol 325 (5939), 419-422.
Paech, N. (2009). Die Postwachstumsökonomie als Voraussetzung für eine nachhaltige Entwicklung. In F. Hinterberger, H. Hutterer, I. Omann, & E. Freytag (Eds.), Welches Wachstum ist nachhaltig? Ein Argumentarium. Mandelbaum, 111-115.
Pellmeyer, J. (2008). Biogas - im Wandel der Zeit. In Multitalent Biogas, 4-5.
Perfecto, I., Vandermeer, J., & Wright, A. (2009). Nature's matrix: linking agriculture, conservation and food sovereignty (1. Aufl.). London; Sterling VA: Earthscan.
Ploeg, J. D. van der (2008). The new peasantries: struggles for autonomy and sustainability in an era of empire and globalization. London; Sterling VA: Earthscan.
Ploeg, J. D. van der, Banks, J., & Long, A. (2002). Living Countrysides - rural development processes in Europe: the state of the art. Doetinchem: Elsevier.
Ploeg, J. D. van der, Bouma, J., Rip, A., Rijkenberg, F., Ventura, F., & Wiskerke, S. J. (2004). On Regimes, Novelties, Niches and Co-Production. In Wiskerke S. J., & Ploeg J. D. van der (eds.) Seeds of Transition - Essays on novelty production, niches and regimes in agriculture. Assen, The Netherlands: Royal van Gorcum, 1-30.
Ripl, W. (2003). Water: the bloodstream of the biosphere. Philosophical transactions of the Royal Society of London. Series B, Biological sciences, 358(1440), 1921-34.
Ripl, W., Trillitsch, F., Backhaus, R., Blume, H., Widmoser, P., Janssen, T., u. a. (1996). Entwicklung eines Land-Gewässer Bewirtschaftungskonzeptes zur Senkung von Stoffverlusten an Gewässer (Stör-Projekt I undII): Endbericht. Berlin.
Ruppert, H., & Fachagentur Nachwachsende Rohstoffe. (2008). Wege zum Bioenergiedorf Leitfaden für eine eigenständige Wärme- und Stromversorgung auf Basis von Biomasse im ländlichen Raum (1. Aufl.). Gülzow: FNR.
Shiva, V. (2008). Soil not Oil: Environmental justice in a time of climate crisis. Cambridge Mass.: South End Press.

93
PROCEEDINGS Conference MPDES 2011
Stuiver, M., Leeuwis, C., & Ploeg, J. D. van der (2004). The Power of Experience: Farmers' Knowledge and Sustainable Innovations in Agriculture. In Wiskerke S. J., & Ploeg J. D. van der (eds.) Seeds of Transition - Essays on novelty production, niches and regimes in agriculture. Assen The Netherlands: Royal Van Gorcum, 93-118.
Tanaka, N. (2010). World Energy Outlook 2010. Canberry, Australia. Available on http://www.iea.org/speech/2010/tanaka/AustraliaTanakaWEO2010.pdf
Thiering, J., & Bahrs, E. (2010). Umwelt- und Fördereffekte des EEG - eine Betrachtung des Güllebonus im Rahmen der Biogasproduktion. Zeitschrift für Umweltpolitik und Umweltrecht, 33(1), 109-131.
Trojecka, A. (2008). Landwirte als Energiewirte? Bedingungen einer ökologischen Modernisierung der Landwirtschaft am Beispiel der Biogaserzeugung (Dissertation). Available on http://deposit.ddb.de/cgibin/dokserv?idn=990364283&dok_var=d1&dok_ext=pdf&filename=990364283.pdf
Ulrich, H., & Probst, G. (1991). Anleitung zum ganzheitlichen Denken und Handeln: ein Brevier für Führungskräfte. Bern: Haupt.
Vester, F. (1999). Neuland des Denkens: vom technokratischen zum kybernetischen Zeitalter (11. Aufl.). München: Dt. Taschenbuch-Verl.
Weiland, P. (2009). Ergebnisse aus dem aktuellen Biogas-Messprogramm II. In Tagungsband "Biogas in der Landwirtschaft - Stand und Perspektiven" (Bd. 1-32, S. 14-25). Gülzow: FNR. Available on http://www. fnrserver. de /ftp/pdf/literatur/pdf_400-gfg32_biogas-kongress.pdf
Wiskerke, J., & Ploeg, J. D. van der (2004). Seeds of Transition - Essays on novelty production, niches and regimes in agriculture. Assen The Netherlands: Royal Van Gorcum.

94
PROCEEDINGS Conference MPDES 2011
1
A basic design for a multicriteria approach to efficient bioenergy production at regional level
Zoë Hagen ([email protected])
Technische Universität Berlin, Environmental Assessment and Policy Research Group, Sekr. EB 5
Straße des 17. Juni 145, D-10623 Berlin, Germany
Abstract In Germany, the economic influence created by government policy to push the growth of renewable energies leads to a rapid increase in energy crop cultivation. Possible conflicts between sustainability goals in the area of nature and soil conservation, as well as water pollution control on the one hand and goals associated with the development of renewable energies (such as greenhouse gas (GHG) reduction and the securing of energy supplies) on the other are rarely considered in the planning procedure. This article looks at different approaches to assessment and planning methods on a site-specific level. It then explains the methodology of the project “Efficient Bio- Energy in the Perspective of Nature Conservation- Assessment and recommendations to protect biodiversity and climate”, which aims to establish a prerequisite for a sustainable and efficient assessment of energy crop cultivation for decentralized energy production in Germany. An integrated methodology was developed, taking into account the three main requirements of agricultural profitability, GHG efficiency, and environmental sustainability of energy crop cultivation for decentralized energy production on a small-scale level Using ArcGIS, the results can be displayed and regional aspects can be considered by overlaying and intersecting the individual output of all three requirements. This allows the definition of “no-go” areas as well as the overall estimation of maximum sustainable production capacity for each energy crop/ energy path in a specific region. It enables an estimation of the profitability and GHG efficiency of energy crop cultivation at regional or communal level under consideration of environmental sustainability. The article ends with the discussion of its possible contribution to the estimation of suitability and unsuitability of landscape areas for energy production paths and provides suggestions for the planning system and policies. Keywords: Sustainable biomass use, assessment methodology, biogas use, agricultural profitability, climate efficiency.
Introduction Aided by pressure from climate and energy policies and flanked by efficient measures such as the Renewable Energy Sources Act (EEG), the biofuel quota law and similar driving forces have resulted in an increase of energy crop cultivation in Germany in the last few years. The active expansion of renewable energy sources has resulted in an additional need for land allocation for bioenergy production. The federal government’s expansion and production goals regarding bioenergy are accompanied by questions about land capacity limitations, above all in terms of land as a balanced ecosystem that
can act as a habitat for flora and fauna, a cultivated landscape, or production grounds for animal feed and foodstuffs. The impact on the environment and natural scenery, as well as on the climate and the agricultural production against the backdrop of supply guarantees and their governance, continue to be the subject of intense discussion.
Bioenergy production can make an important contribution to the reduction of greenhouse gases (GHG) and thus to the realization of Germany’s climate protection goals (Faulstich & Greiff, 2008). Most relevant to the environment is not only the organization of the bioenergy facilities themselves, but the cultivation of the crops that feed them. Current subsidy policies lead to higher shares of certain energy crops such as maize and rapeseed (Schuette 2007). This is dependent on and strengthened by the broad effects of the EEG, which rewards a facility’s energy output and thus implicitly supports certain substrates. Farmers have generally viewed this positively and have proposed continued expansion (such as the increase in Brandenburg from the current 4% to up to 22%; Hagen 2009). Such an expansion would certainly result in increased pressure on the land as well as an increase in cultivation (which is explicitly supported politically) that would, according to the National Biomass Action Plan, result in higher productivity (BMU, BMELV 2011). Criteria for environmental sustainability play a secondary role both in political discussions and calculations of biomass potential (Bruns et al. 2010, Hagen et al. 2010). In addition, energy crop cultivation largely avoids the policy regulations wished for under this point of view.
The cultivation of various crops according to the stated goals does not automatically have a positive effect. This can lead to a negative breakdown in the balance of greenhouse gases if, for example, the growing of energy crops results in certain direct or indirect changes in land use (Saathoff & v. Haaren 2010, Hagen et al. 2010).
Even other protected goods such as biological diversity, soil, and water can be negatively affected by inadequate cultivation (cf. the results of Strauss et al. 2008, SRU 2007, Glemnitz et al. 2010 a.o.). Further effects include changes in species composition or even extinction, a problematic result of increased pressure on the land in terms of biodiversity because it can, for instance, change a habitat’s structure (Nufnagel et al. 2007, Glemnitz et al. 2009).
In many cases, this results in a conflict of goals between sustainability in the areas of nature, soil, and water protection, and the acceptance of affected inhabitants or tourists, mainly in the course of facility approval (Bruns et

95
PROCEEDINGS Conference MPDES 2011
2
al. 2010). These conflicting poles entail partially competing goals:
The necessity of the highest possible GHG efficiency (reduction of greenhouse gases),
ensuring the environmental sustainability of cultivation and the absolute avoidance of indirect damages such as the loss of biological diversity, the introduction of invasive species, the erosion of the landscape, or a lack of acceptance,
the maximization of space efficiency and the resulting economic yield.
Due to its position between the state and communal levels, the appropriate point of contact to synchronize these various goals is at regional level (compare discussion p. 6). It is possible to transform a state’s energy production goals regarding achieved production output and to translate these demands to different regions. But a means of control is not possible because of the lack of integrated assessment approaches, above all an approach that would allow for an environmental assessment.
This article will therefore discuss regional requirements on the assessment of energy crop cultivation. Using approaches developed through research, it will put forward a new methodology for more precisely assessing its impact at regional level, and will discuss its adequacy with respect to the central demands and opportunities for governance under the current planning syste in Germany.
Field of Research For the assessment of energy crop cultivation regarding its impact on environmental goods for use in the preparatory governance of the cultivation of crops, studies on the output potential as well as GIS1-based approaches exist. This article will only focus on the latter since it is primarily concerned with the assessment of biomass cultivation for energy use on the regional level and not with an account of the maximal yield2. There are currently – as far as we know3 – four GIS-supported “implementation or test” methods for regional criteria with differing emphases.
The approach of the Fraunhofer Institute4 (Jandewerth 2009) focuses on the area of logistics and technical perspectives. The GIS’ capabilities should identify
1 GIS: Geographic Information Systems 2 There are already concepts of conducting a GIS-supported
assessment of environmental sustainability and cost-effectiveness for plant cultures on an operational level. These include MANUELA (Management System of Environmental Protection for Sustainable Agriculture, Leibniz University, Hannover), REPRO (Institute for Agricultural Science, MLU Halle-Wittenberg), and KUL (Criteria for Environmentally Sustainable Land Management, LfL Agroecology). None of these are dealt with here due to the focus at regional level.
3 As of 2009 4 The Fraunhofer Institute for Environmental, Safety and
Energy Technology (UMSICHT) is presently conducting a joint study with the BMBF called: The elimination of technical, legal, and economic constraints on the feed-in of biogenic gases to the natural gas network and toward the reduction of emissions through the construction and application of a geo-referenced database – Strategy development for political and techno-economic implementation (abbreviated title: Biogas Feed-In).
potential biomass production sites, and constraints on the production, preparation, and distribution of biogas over the natural gas network, and the development of new approaches to overcome problems. Possible sites for biomass crop cultivation will be determined by a process of excluding legally-protected areas and overlapping with logistical feed-in facilities, thus helping to identify optimal locations for bioenergy production (Jandewerth 2008).
The Technische Universität Berlin’s approach (Schultze et al. 2008a) focuses on a particular assessment of the environmental impact of bioenergy crop cultivation at regional level. As far as we know, only the RELU Project (see below) is as meticulous. Using ecological risk analyses, established energy crops are assessed on a culture-specific basis. The results are measured by a three-level scale and spatially defined. Overlapping the actual/planned amount of bioenergy facilities helps to identify areas that put at risk environmentally.
In the UK there is an ongoing interdisciplinary research project5 that aims to assess the impact of multiyear crops on the landscape, the economy, and environmental goods (mainly multiyear cultures and KUP).
This also includes basic research such as impact on soil, biological diversity, and water regimes in a physical model (JULES) through the cultivation of miscanthus, willow, and multiyear crops. Tourism and socio-economic effects are also assessed according to participation. GIS is also used here as a tool to describe changes in land use. In addition, GIS-based 3D visualization makes it possible for stakeholder’s to participate more actively in landscape projects.
The University of Applied Sciences in Eberswalde has developed a model6 that uses a top-down approach to illustrate the economic output of different types of energy crops at community level within the framework of the Baltic Sea Project (Brozio et al. 2006). For the appraisal of biomass output, the biomass-yield-model is used (bym) (Brozio et al. 2009 and 2009a). It determines the yearly biomass revenues for regionally established and site-specific crop rotations. Precipitation rates and soil quality determine the suitability and quality of energy crops, which appear to be too limited in terms of environmental sustainability. The model focuses on estimates of biomass potentials at regional - or county - level, or even in the immediate surroundings of bioenergy facilities (Brozio 2010, oral interview). However, this is based on the approach “Landsize x potential average output” and focuses on classic substrates like silage maize and liquid manure – thus failing to give a regionally-specific assessment of environmental sustainability.
For a sustainable expansion of bioenergy use at regional level, the above-mentioned goals regarding the reduction of greenhouse gases to climate protection, agricultural efficiency, and environmental sustainability, must be equally taken into account. To date, an integrated
5 Further information available at: www.relu-biomass.org.uk 6 Further information available at: http://www.fh-
eberswalde.de/Projekte/Bioenergie/Aktuelle- Projekte/Potenzialstudie-Biomasse/Bioenergie-aus-der- Landwirtschaft-K755.htm

96
PROCEEDINGS Conference MPDES 2011
3
approach does not exist. The chosen methodologies are each concerned with single aspects of these goals, which should be considered at regional level during the course of planning.
Site-specific assessments on cumulative effects and risk avoidance during further expansion of biomass production are thus indispensable. In the following approach, an assessment method will be formulated that will seek to integrate criteria and scientific demands on the assessment of agricultural efficiency, climate efficiancy, and environmental sustainability in a shared methodology.
Leading research questions of the following approach focus on issues such as whether all of this is compatible and whether they make sense in terms of political goals, as well as whether synergy results from an integrated view and how such an approach can prove its value in the current planning system. The often-requested site-orientation in assessment and governance (Schultze & Koeppel 2007, Saathoff & v. Haaren 2010) can be properly and graphically grasped by the GIS methodology, which is why the following methodological approach also uses GIS.
Methodology of land efficient biomass use from an environmental protection point of view This methodology7 is based on Schultze et al. (2008). Basic principles for a transferable systematic approach for land use in bioenergy production were developed in order to evaluate, combine, and spatially describe regionally-generated energy crops with regard to agricultural profitability (in terms of the most efficient use of land, carried out by Thueringer Landesanstalt fuer Landwirtschaft (TLL), GHG efficiency, carried out by the Institute for Energy and Environmental Research (ifeu), and environmental sustainability (Hagen et al. 2010) in two example regions (Saale-Holzlandkreis, Thueringen and Ostprignitz-Ruppin, Brandenburg). It aims at developing a foundation to assess the current cultivation scene, as well as to identify optimal cultivation systems respective to local scenarios. Combining of specific requirements Subsequent to the individual assessment from each respective discipline, the exemplary energy crops will be assessed and blended8 among each other without weighting the requirements (cf. Figure 1: Blending of criteria, transfer to land categories). The particular assessment methodologies for each requirement will be described in the following section. Agricultural profitability Agricultural profitability is important, since farmers make independent economic decisions; it is defined here as the
7 Under the leadership of Wolfgang Peters, Hagen et. al.
(2010) for the Federal Agency for Nature Conservation (BfN), to be published in 2011.
8 The assessment’s methodology was analogous to that of Schultze et al., 2008, and resulted in three land categories. Only a- and c-lands were pertinent for climate efficiency.
maximum yield per surface unit9. The assessment is conducted by the TLL. The selection of bioenergy crops spans the widest possible spectrum of annual oil plants (rapeseed) to sugar and starch plants (sugar beets, wheat, and rye) as well as biogas plants (clover grass, maize, rye/barley whole-plant silage (WPS), silphium perfoliatum and feeding rye + feeding millet) and includes permanent crops (poplar, miscanthus) that are used in decentralized agricultural plants on a small scale, such as at 190 kW el. biogas plants.
The energy efficiency of bioenergy plants and the return from the EEG represent the most important parameters on agricultural profitability, as well as strong regional parameters such as soil quality10, achieved output (market revenue) of a particular yield, direct costs (seeds, fertilizer, pesticides, soil preparation), operational costs (machines, maintenance, tax write-offs, labour costs), as well as the cost of the land (rent) (Beck in Hagen et al. 2010). These are transferred into a rating system with a three-stage evaluation scale which takes EEG compensation for biogas crops into consideration. The evaluation of nutrients was based on the withdrawal, in which a balanced nutrient content in the soil was assumed.
The results describe almost all of the cultures included in the evaluation as economically worthy of being cultivated from an agricultural perspective11. However, the financial yields differ so strongly that it is obvious that there are clear preferences for single cultures (cf. Fehler! Verweisquelle konnte nicht gefunden werden.). The results of biogas crops were, however, significantly influenced by EEG compensation and thus by the efficiency of electricity production. This is caused by the fact that, for example, maize used for animal feed has no market price, but is instead calculated by compensation in terms of what a plant operator can afford to pay. Costs for transport outside of farm ground are not taken into account. Since transport costs vary according to the energy density of a substrate, the evaluation could thereby change considerably.
Theoretically, this leaves considerable leeway for biodiversity, which offers a factually higher variability than the concentration of a crop such as maize for bioenergy paths. In Thueringen for example, the largest profit margin on medium soil was with silphium perfoliatum.
Crops for bioenergy use are privileged by compensation from the EEG, and the possibility of recirculation of fermentation rests and therefore spared fertilization costs within the agricultural economy. In order to evaluate the
9 The economic data applies exclusively to the observed sites
and the assumptions made here (microeconomic approach, property boundary system. Transferring this to other soil conditions and/or to other soil-climate sites is thus not possible.
10 A clarification of the economic effects of different soil classes can be observed in diesel fuel consumption (in liters per hour, l/h), which is 4.3 l/h for 34 kilowatt tractors (for soft soil) and 27.2 l/h for 216 kilowatt tractors (for hard soil, higher resistance).
11 In each case, only the primary soil class of each region was assessed.

97
PROCEEDINGS Conference MPDES 2011
4
crop species detached from the current funding system, such aspects have to be accounted for in the calculations.
The results show an economically sustainable spectrum within the variety of crop species. Through agricultural consulting and adaptation of funding conditions, cultivation could thus be optimized by respecting area peculiarities and local sensitivities regarding environmental sustainability and GHG efficiency, which is also in the interests of most farmers (ZALF/FNR 2009). GHG efficiency The assessment of GHG efficiency has been carried out by the IFEU using a life cycle assessment12 that compares the entire lifespan of bioenergy crops from cultivation and processing to energy use with the life cycle of fossil fuels. The additional demand of arable land to grow energy crops increases the pressure on land use. The resulting environmental impacts (such as greenhouse gas emissions) have to be considered in a life cycle assessment. This change or alternative use of land is called an agricultural reference system (Jungk & Reinhardt 2000).
The agricultural reference system also covers all changes in land use that are induced by the allocation of land for energy crops. Changes in land use result in a number of - mostly negative - environmental impacts, including increases in greenhouse gas emissions as a result of changes to the carbon stocks on affected areas (cf. Figure 4).
The biggest current challenge with regard to the balance of greenhouse gases lies in properly representing greenhouse gas emissions resulting from changes in land use within a life cycle assessment. Methodically speaking this is unproblematic, as Reinhardt (1993) and Jungk & Reinhardt (2000) showed for both direct and indirect changes in land use13, even if changes in land use were then subsumed under the term ”agricultural reference system“ (IFEU in Hagen et al. 2010). It is thus far more difficult to identify the level of carbon stock reduction for
Although there is a broad consensus regarding direct changes in land use and at most a discussion of the exact extent of original carbon stock change or write-off period, an adequate methodology for quantifying the associated impact on the land with regard to indirect changes in land use is, according to IFEU, still lacking (ibid.). None of the existing models is adequate at representing indirect land use changes properly (Fehrenbach et al. 2009). Within this study, such modeling cannot be developed, therefore only
12 Despite standardization, the results of the eco-balance
assessment varied considerably to some extent. This could be due to a number of causes: a) varying definitions of the goals and analysis frameworks in the study, including differing system boundaries (such as not considering changes in land use), b) different basic data (such as (N2O emission factors), or c) differences in the assessment of by-products (substitution and allocation respectively) (Ibid.)
13 Indirect changes in land use (iLUC) are referred to when energy crop cultivation does not directly lead to a loss of natural lands. This is the case for instance in Europe, where energy crop cultivation is replacing animal feed production (on pre-existing arable land).
certain exemplary mechanisms will be demonstrated for possible indirect land use change.
The actual analysis will combine energy crop species chosen by the TLL from the IFEU with different conversion technologies, energy uses, and bioenergy paths. The observed crop cultures will be analyzed using three agricultural reference systems (cultivation of energy crops on fallow land, cereal cultivation sites, and permanent grasslands) for both direct changes in land use (dLUC) and for direct and indirect changes in land use (iLUC).
Figure 5 outlines the results of greenhouse gas balance, with the “+“ and “-“ symbols indicating a positive or a negative balance respectively. Symbols in brackets mean that the results do not pertain to all bioenergy paths for the crop species in question. The following results can be deduced: The largest reduction of greenhouse gases occurs
from the stationary use of poplar and miscanthus. In the reference system “fallow ground,“ there is a
positive greenhouse gas balance for all bioenergy paths, in other words, it can lead to a reduction in greenhouse gases compared to non-renewable energy sources.
Biogas and biomethane from clover grass as well as bioethanol from poplar (poplar only in the OPR) show in the “cereal“ reference system that indirect land use changes have a negative greenhouse gas balance.
The “grassland“ reference system shows that all bioenergy sources - with the exception of electricity and heat from miscanthus in SHK - result in a negative greenhouse gas balance for indirect changes in land use. In contrast, the simple fact of ploughing grasslands on fen sites shows a clear negative balance for direct changes in land use.
The central result regarding climate protection is - and here one can see an important synergy with the goals of environmental conservation - that ploughing grasslands on organic soil appears to make absolutely no sense. The analysis shows that agricultural reference systems including direct and indirect land use changes have a significantly larger influence on the results than does the selection of crop species, the conversion technology, or the target product. With some distance, other parameters that determine the results are the cultivation methods as well as the conversion of biomass. GHG efficiency also clearly hinges upon regional factors, for instance on the question of whether fallow land is ploughed for energy crops or whether it displaces current food or animal feed production. Environmental Sustainability The environmental protection assessment is carried out with the help of an ecological risk analysis of landscape functions according to von Haaren (2004) for energy crop species determined by TLL.
Their risk classification at a particular site arises from the active intensity of the cultivated crop and the sensitivity of the habitat. This can mean that the risks of erosion for the growing of maize for example are

98
PROCEEDINGS Conference MPDES 2011
5
influenced by local constraints such as soil type, gradient, or even climate conditions. In order to ascertain the sensitivity of landscape functions, a number of linking rules can be drawn upon (for example from Marks et al. 1992 or NIBIS, in Müller 2004). Linking rules allow for estimates with the help of fewer, mostly readily available parameters.
Considering the possible conflicts between the impact of energy crop cultivation and the aims of environmental protection, the following environmental indicators were shown to be relevant for determining biomass potential (cf. Figure 6):
Soil: erosion sensitivity (water/ wind, sensitivity to densification, sensitivity to harmful substances;
Water: ground water supply, sensitivity vis-a-vis achieving the aims of the Water Framework Directive, retention function (water);
Biological diversity/biotope function from an environmental protection and legal point of view, and
Landscape: landscape scenery and recreation, loss of axes of view.
The results are provided in the form of sensitivity maps. The impact of the cultivation of particular cultures, as
juxtaposed to sensitivity, is determined with the help of expert surveys (Vogt et al. 2008) and complemented by current research results.
For the total area of a region, the impact intensity of cultivated crops and the sensitivity of sites brings about three different site categories leading to different recommendations of agricultural use. A decision tree helps determine which site categories relate to specific areas (cf.Fehler! Verweisquelle konnte nicht gefunden werden.).
By considering the entire arable agricultural land in a region, precise risk and suitability maps for specific energy crops can be generated. Risk maps can describe the root cause of damage (cf. Figure 8).
In the comprehensive survey, there is land for every crop to be grown in an environmentally-sustainable way. The results also show clear risk areas and alternative sites. Whether these areas, and above all their distribution conform to regional goals for the production of biomass for energy purposes - defined here by planned performance in biomass action plans - or the region’s amount of bioenergy facilities, is not reviewed here. Problematic is not only the quantity, but also the regional allocation, whose outcome and prospects cannot be adequately represented for all three criteria within this methodology.
Environmental sustainability resulted as the most site-dependent and therefore the most strongly-limiting requirement, since it excludes and/or limits due to defined areas for some crop species. It therefore has the strongest demand for regulation of the regional allotment of biomass cultivation.
The identification of the impact intensity of energy crops requires the knowledge of different cause-effect relationships that are currently the subject of intense fundamental research. Research findings from EVA
Projects I and II14 and SUNREG II and III15 on the impact of energy crop cultivation on landscape functions and biological diversity are available. Key findings on impact intensity and the characteristics of a number of crops are already available. They are however too broad to support the risk assessment, above all with regard to the cumulative effects of real life evidence.
The basis for evaluation of the sensitivity of the landscape scenery and biological diversity is only partially available. In this approach, for the area of biodiversity it would have been necessary to examine possible impacts properly under a modelization of crop rotation. In order to make the system boundaries compatible to the requirement of GHG efficiency and thus to guarantee a methodical blending, this modelization did not take place. For this purpose, a more feasible approach needs to be found in the future.
Two damage risks to landscape scenery have been identified: damage to visual axes that are site-specific and whose risk is well represented in the methodology, and the quantitative development and change in crop species and the accompanying risk of changes to the appearance of a region-specific cultural landscape. The latter can even affect the expectations of tourists as well as the locals’ sense of home, but the ability to observe this in a crop-specific way is limited. As with biodiversity, a cumulative view is missing here, which necessitates a discursive process, as well as monitoring the changes in terms of a reference scenario.
There is a more pressing need for research on the impact of agricultural cultivation on water quality according to the Water Framework Directive. A transferable evaluation method has yet to be developed here. Resumé By bringing together the requirements and assessment outcomes of agricultural profitability, GHG efficiency, and environmental sustainability, clear conflicts were observed in the model regions: e.g. for maize silage, whose impact intensity – compared to the referral crop winter rye – is evaluated as negative to considerably negative vis-a-vis all environmentally protected goods, with the exception of the habitat function of mammals. In contrast, a synergy effect can be observed for sugar beet. The methodical concept helps explain the particular limits relating to the cultivation of agriculturally efficient crops. This results in evidence for the expansion of determined bioenergy paths as well as policy measures and recommendations for action.
14 “The development and composition of optimal cultivation
systems for the production of energy crops according to local conditions in Germany” (EVA) I and II, joint research project of the Federal Ministry of Food, Agriculture and Consumer Protection (BMELV) and the Agency for Renewable Resources (FNR).
15 Joint project of the German Environmental Foundation, the Volkswagen Foundation, and the Lower Saxony Ministry for Rural Areas, Food, Agriculture and Consumer Protection, Leibniz University Hannover, Institute for Environmental Planning (IUP) / Leibniz Institute for Agricultural Engineering Potsdam-Bornim e.V. (ATB).

99
PROCEEDINGS Conference MPDES 2011
6
From the perspective of GHG efficiency, extensive synergy with environmental sustainability can be observed: The cultivation of energy crops on permanent grassland (on organic soil) is only partially suitable in relation to both requirements. Further synergy arises for sites and crop species that are recommended according to both requirements, such as the cultivation of poplar or miscanthus under certain conditions.
Methodological adequacy regarding operational aims and their application in the methodology The three central sustainability requirements for bioenergy use can be integrated satisfactorily into the methodological concept. It is therefore possible to identify economically reasonable, climate mitigating, and environmentally sustainable bioenergy systems and pathways, and to locate site-specific conflicts and potentials. A blending of the requirements into an overall assessment is possible and sensible, although system boundaries are not yet completely compatible. This is because the economic view of this project lies in a microeconomic approach in the form of a site-specific system assessment within farmland boundaries in order to represent individual levels of decision-making, while a cross-social approach is chosen for the requirements of GHG efficiency and environmental sustainability. Hence, in each case two of the three requirements can be combined, but not all three16. This would necessitate a comprehensive economic assessment that comprises transport and conversion.
Cumulative effects that affect habitat functions or the landscape scenery can only be described verbally today. The demonstration of areas of risk was made possible from the ranking of accumulated b-areas, which allowed for a risk assessment during the assessment of scenarios, e.g. regarding the change in crop cultivation structures.
Yet from the view of the three sustainability requirements, the methodical principles are adequately evaluated to serve as a well-founded planning scenario – fundamental for a sustainable expansion of bioenergy use – in order to roughly estimate the risks and opportunities of different scenarios and to visualize a discourse. This makes clear competing aims, as risks from a single requirement as well as from a comprehensive point of view can be precisely identified and located site-specifically. This allows for a transparent identification of which sites experienced negative effects to environmental or economic subjects and can help locate the cause of limiting recommendations and mitigation measures. Collectively, they initially allow themselves to indicate and spatially locate a region’s maximum economic and ecological limits, considering both actual and planned bioenergy plants. Perspectively, this could lead to an improvement and regionalization of good agricultural practice. In so doing, informal suggestions for the concretization of aims and measures regarding the planning and governance or regulation process, or for investment decisions (for large projects) could be derived.
16 Combining agricultural profitability and climate efficiency
was not possible for reasons of system compatibility.
One distinction between food and energy crops that occured here, if at all, is only sensible and necessary regarding the assessment of environmental sustainability, since their slightly different cultivation methods or schedules can impact habitats. In the overall view, a comprehensive assessment of agricultural production is more sensible than a distinction in food/ feed and bioenergy crops. The consequences on the crops have not been considered here and deserve to be developed further within the methodology.
The methodology is fundamentally transferable to other regions, its practical applicability is however generally limited because of regional data availability and data preparation, which is not yet oriented to the new demands of the landscape as energy supplier.
The cause-effect chains of varying cultivation methods in different areas requires further research, especially against the backdrop of increasing soil degradation in many regions (Glemnitz et al. 2009, Nehring & Vetter 2009, regional planning office of Prignitz- Oberhavel, 2009, oral interview).
Practicality and benefits: Opportunities for regulating the cultivation of energy crops As mentioned in the introduction, the eco-political goals of the expansion of renewable energy sources lie in the reduction of greenhouse gases during electricity generation and the avoidance or mitigation of negative impacts on the environment. With regards to biomass use for electricity production, the main goal is to maintain agricultural cost-effectiveness.
As shown, the biggest greenhouse gas factors emerge from conversion efficiency and the prior use of or indirect land use changes with subsequent displacement of use. This could be well described and evaluated by the further development of the methodology on a regional level to include all agricultural production. This also holds true for the assessment of environmental sustainability (Jessel 2009). Within the current planning system, impacts can only be regionally influenced indirectly and in line with different competence authorities.
Regional planning authority as a link between state and communal planning could substantiate the regional goals of environmental protection and landscape preservation so that goal and land categories are compatible with and implemented according to the guidelines of monetary and regulatory instruments. In accordance with this, regional planning could make an indirect yet goal-oriented governance of energy crop cultivation possible (BMVBS 2010). Differing time frames must be considered here. Agricultural cultivation is subject to short-term decision-making and can change annually. Regional plans help to establish long-term zoning plans and are difficult to adjust to scientific discoveries on production techniques and management as well as new breeds. A flexible solution must be found in order to prevent the region from being harmed by the integration of agricultural land use in regional planning (Mengel 2009, BMVBS 2010).

100
PROCEEDINGS Conference MPDES 2011
7
As a rule, regional planning is limited to informal propositions for regional governance, perhaps through the development of regional energy strategies.
Landscape planning is in principle the ideal instrument for localizing potential synergies and conflicts between environmental protection and energy crop cultivation, as well as for delivering technical information for the governance of sustainable energy crop cultivation. However, the instrument of landscape planning must be further developed or completed. The methodical concept developed here can help assess the impact cultivation has on certain species under current planning conditions. It thus illustrates sensitivity by means of sensitivity maps. These can provide regional planning authorities with a further foundation for agricultural consulting as well as a supplement for reports on regionally significant projects in the energy sector. It would be sensible to compile an additional map for the cultivation of energy crops.
For protected areas, potential provisional frameworks for the establishment of protected areas (instructions and prohibitions) should be utilized and qualified with a view toward management conditions. The methodical concept can help identify concrete site- specific demands that can assist in developing these agricultural management conditions. The selective designation of conservation areas and/or detailed definitions of existing land protection ordinances should lead to both proposals for environmentally sustainable areas for crop cultivation and clearly-formulated restrictions, especially in areas with highly-valued biological diversity, species protection, or protected landscape elements (BfN 2009). However, the formulation of goals within the regulation of protected areas is often not adequately tailored to the potential impact of energy crop production. In addition, the respecting of these rules is not adequately monitored, which hinders their protective effects. This is often due to a lack of personnel capacity in state agencies (MENGEL 2009, oral interview).
There are also indirect opportunities for the governance of energy crop cultivation at regional and local levels with respect to the planning and authorization of bioenergy facilities. This is due to the fact that they are subject to the discretion of farmers, in adherence to good agricultural practice. From a technical perspective, it makes fundamental sense to consider the potential effects of energy crop cultivation in building plans (land use planning, development planning) and authorization (building permits, emission control permits) of a facility. In addition – if necessary for corresponding conditions or for agricultural consulting about the conception and technical organization of a facility – the previously discussed methodology could have a positive influence on energy crop cultivation governance.
Since the introduction of the federal building code (EAG-Bau)17, biogas facilities are privileged when they have a regional-functional relationship with an agricultural factory that is affiliated with BHKW, and when they have a maximum capacity of 500 kWel or where at least 50 percent of the biomass comes from the
17 (from June 24, 2004, § 35 Paragraph 1 Nr. 6 BauGB)
factory itself or one nearby. Such facilities do not require a special assessment.
Non-privileged bioenergy facilities require a development plan before receiving authorization and are subject to environmental assessments. Here, a community has the opportunity to take the potential impacts of biomass preparation into consideration and to theoretically incorporate criteria for environmentally sustainable, climate efficient, and agricultural profitable biomass cultivation. Afterwards, communities can work towards binding facility operators to a legal contract that only allows them to use biomass produced according to these specific requirements. The indirect effects resulting from the cultivation of biomass are not the subject of the assessment, which also does not take land use change into consideration (IFEU et al. 2008).
Moreover, evidence suggests that obtaining these privileges is not site-specific. An assessment of the indirect impact on land use during licensing procedures is only partially possible. Authorizing a facility (depending on the size according to building law or the Federal Emmission Control Act) as a bound decision does not balance the interests of competing public issues vis-a-vis the facility and its impact on energy crop cultivation. Indeed, regional planning authorities are requested to report on large facilities. Indeed, this practically never occurs because of the absense of appropriate assessment instruments (Regionale Planungsstelle 2010, oral interview).
Bioenergy facilities, which are approved in accordance with the Federal Emmission Control Act, undergo an environmental sustainability assessment due to their size18. This does not include biomass cultivation since it is not requested by law. Indirect effects that can result from changes in agricultural land use during the operation of a facility, along with cumulative effects, are also not dealt with by other environmental assessments such as the flora-fauna-habitat impact assessments (IFEU et al. 2008).
Since planning regions or counties cannot put forward their own support programs, opportunities to influence on governance using monetary support instruments is generally quite limited. Funds from the second pillar of agricultural subsidies (ELER) serve country-specific programs such as KULAP or MELA. These programs are however partially financed (at least 50%) by the countries themselves – depending on political will and the financial infrastructure of the country, environmental protection goals can also be supported. In principle, opportunities exist here for supporting compensation for farmers who engage in the generation of environmentally sustainable biomass cultivation (Hagen et al. 2010). An integrated assessment of biomass-based energy generation paths with regard to the three demands of agricultural profitability, climate efficiency, and environmental sustainability, is strongly site-specific. A further demand for the governance of biomass cultivation would thus be the regionalization of the Renewable
18 According to the law referring to environmental
sustainability assessment (UVPG) in the draft announcement of June 25, 2005.

101
PROCEEDINGS Conference MPDES 2011
8
Energy Sources Act19 in order to optimize the strong monetary incentives that would occur under a modified bonus system for site-specific energy crops. This applies equally to all other instruments such as support, market-incentive, and investment assistance programs.
In this sense, all energy sources that are in line with societal goals such as the protection of biological diversity should be supported in both the mid- and long-term. Such a regionalization could be established using the methodology presented here. Above all, investment assistance programs taken up by countries in line with agricultural subsidies, as exist for newly constructed biogas facilities, could be tied to binding environmental requirements at the outset. This is already the case for biogas facilities in Schleswig-Holstein20 (Hagen et al. 2010).
According to IFEU & Partner (2008), the Cross Compliance Rules have resulted in considerable effects. Until now, this regulation has been used in a very limited way in Germany. The control mechanisms applied in the Cross Compliance Rules could be tied in with the Renewable Energy Sources Act. In order to do this however, demands must be more strongly regionalized. This type of specification could draw upon the criteria developed within this methodological concept.
Innovative cultivation systems and environmentally sustainable forms of diverse substrate production could be aided by the Agrarian Environmental Program (second pillar of agrarian support). The corresponding benefits would incentivize farmers to pursue new culture forms and cultivation methods that could be grown in a more environmentally-sustainable way or add to species diversity/preservation under the appropriate conditions at current locations. There are already many good examples of successful implementation of these programs (Hagen et al. 2010).
The governance of biomass cultivation is increasingly recommended by the informal governance sector within the framework of an energy concept. If one takes the entirety of agricultural production into account here, assessment concepts such as the one introduced here can make a valuable contribution to the optimization of cultivation systems. Results showed e.g. silphium perfoliatum to be more economically profitable than maize on medium soil in Thueringen. Such a methodology can detect and counteract risks that occur during the shift of the alignment of agricultural production. Until now, the consequences of these shifts can only be seen when facilities are operating.
The different requirements regarding energy crop cultivation and the partially convergent environmental goals have been examined here. The many stakeholders in
19 The necessity of the regionalization of good agricultural
practices and supporting fundings is supported by many experts (Schultze & Köppel 2007, Schultze et al. 2008b, BfN 2009, Saathoff & v. Haaren 2010, Jessel 2009, among others).
20 Bulletin: Additional criteria for the guidelines of promoting the utilization of energy from biomass in rural areas by the state of Schleswig-Holstein in accordance with the initiative “Biomass and Energy in the State of Schleswig-Holstein” (as of July 2008).
this complex process, with their individual aims in a conflicted political field, emphatically show that the methodology introduced here can only be a first step toward a truly harmonized process that consolidates all goals: agricultural profitability, climate efficiency, and environmental sustainability. In addition, it is clear that a number of scientific studies will be required. This could help steer the process more clearly towards the achievement of these goals and give the political framework a more solid scientific basis.
Acknowledgment With special thanks to: Nils Rettenmaier, Dr. Guido Reinhardt & Sven Gärtner (IFEU), Judith Beck, Dr. Katja Gödeke & Dr. Armin Vetter (TLL), Wolfgang Peters & Sven Schicketanz (Bosch & Partner), with whom I worked on the project “Flächeneffiziente Biomassenutzung aus Naturschutzsicht”. Results concerning the GHG- Efficiency have been conducted by the IFEU, and results regarding the agricultural efficiency have been elaborated by the TLL, mainly by Judith Beck, and are basically taken from our report.

102
PROCEEDINGS Conference MPDES 2011
9
Figures
Figure 1: Blending of criteria, transfer to land categories
Figure 2: Model overview and methodology for agricultural profitability, Beck in Hagen et al. 2010, redesigned)

103
PROCEEDINGS Conference MPDES 2011
10
Figure 3: Agricultural profitability of selected crops (Beck in Hagen et al. 2010, redesigned (green: profitable, light green: conditionally profitable, red: not profitable)
Figure 4: Energy crop cultivation with direct and indirect land use change, IFEU in Hagen et al. 2010, redesigned
Figure 5: Results of the climate balance of selected crops in reference scenarios (IFEU in Hagen et al. 2010, redesigned)
soils.

104
PROCEEDINGS Conference MPDES 2011
11
Figure 6: Relevant parameters and criteria for environmental sustainability
Figure 7: Decision tree on environmental sustainability
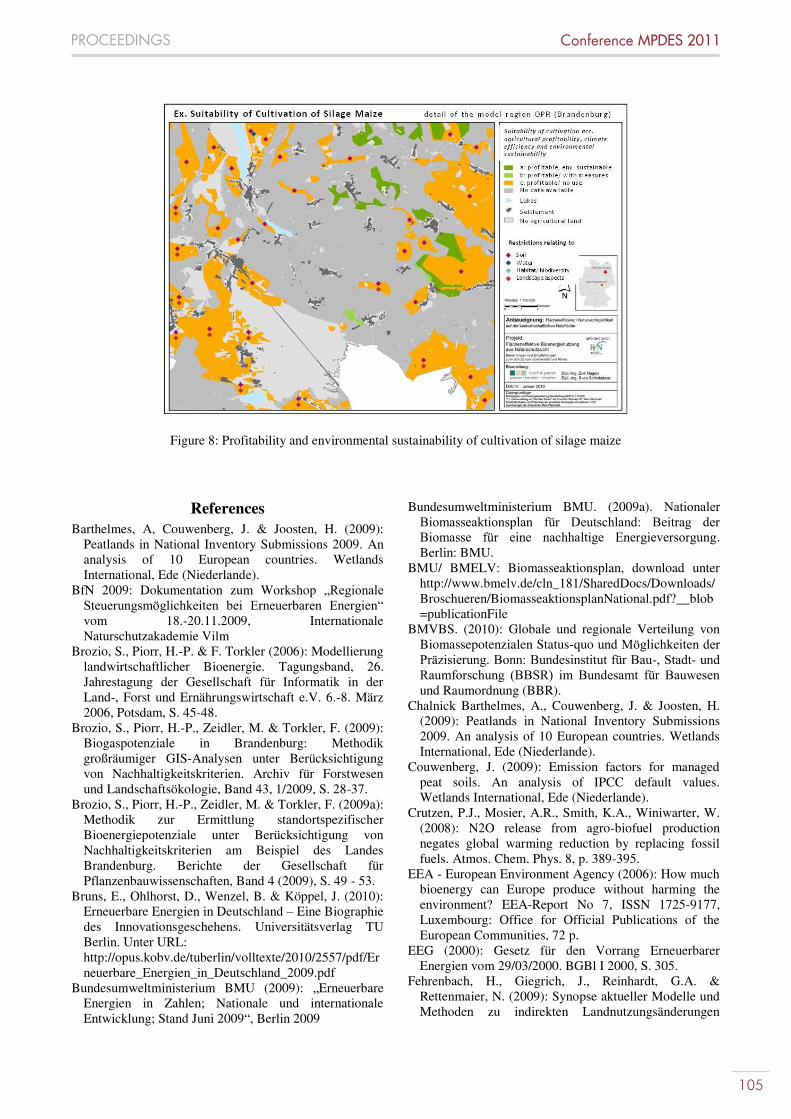
105
PROCEEDINGS Conference MPDES 2011
12
Figure 8: Profitability and environmental sustainability of cultivation of silage maize
References
Barthelmes, A, Couwenberg, J. & Joosten, H. (2009): Peatlands in National Inventory Submissions 2009. An analysis of 10 European countries. Wetlands International, Ede (Niederlande).
BfN 2009: Dokumentation zum Workshop „Regionale Steuerungsmöglichkeiten bei Erneuerbaren Energien“ vom 18.-20.11.2009, Internationale Naturschutzakademie Vilm
Brozio, S., Piorr, H.-P. & F. Torkler (2006): Modellierung landwirtschaftlicher Bioenergie. Tagungsband, 26. Jahrestagung der Gesellschaft für Informatik in der Land-, Forst und Ernährungswirtschaft e.V. 6.-8. März 2006, Potsdam, S. 45-48.
Brozio, S., Piorr, H.-P., Zeidler, M. & Torkler, F. (2009): Biogaspotenziale in Brandenburg: Methodik großräumiger GIS-Analysen unter Berücksichtigung von Nachhaltigkeitskriterien. Archiv für Forstwesen und Landschaftsökologie, Band 43, 1/2009, S. 28-37.
Brozio, S., Piorr, H.-P., Zeidler, M. & Torkler, F. (2009a): Methodik zur Ermittlung standortspezifischer Bioenergiepotenziale unter Berücksichtigung von Nachhaltigkeitskriterien am Beispiel des Landes Brandenburg. Berichte der Gesellschaft für Pflanzenbauwissenschaften, Band 4 (2009), S. 49 - 53.
Bruns, E., Ohlhorst, D., Wenzel, B. & Köppel, J. (2010): Erneuerbare Energien in Deutschland – Eine Biographie des Innovationsgeschehens. Universitätsverlag TU Berlin. Unter URL: http://opus.kobv.de/tuberlin/volltexte/2010/2557/pdf/Erneuerbare_Energien_in_Deutschland_2009.pdf
Bundesumweltministerium BMU (2009): „Erneuerbare Energien in Zahlen; Nationale und internationale Entwicklung; Stand Juni 2009“, Berlin 2009
Bundesumweltministerium BMU. (2009a). Nationaler Biomasseaktionsplan f r eutschland Beitrag der Biomasse f r eine nachhaltige Energieversorgung. Berlin: BMU.
BMU/ BMELV: Biomasseaktionsplan, download unter http://www.bmelv.de/cln_181/SharedDocs/Downloads/Broschueren/BiomasseaktionsplanNational.pdf?__blob=publicationFile
BMVBS. (2010): Globale und regionale Verteilung von Biomassepotenzialen Status-quo und öglichkeiten der r zisierung. Bonn Bundesinstitut f r Bau-, Stadt- und Raumforschung (BBSR) im Bundesamt f r Bauwesen und Raumordnung (BBR).
Chalnick Barthelmes, A., Couwenberg, J. & Joosten, H. (2009): Peatlands in National Inventory Submissions 2009. An analysis of 10 European countries. Wetlands International, Ede (Niederlande).
Couwenberg, J. (2009): Emission factors for managed peat soils. An analysis of IPCC default values. Wetlands International, Ede (Niederlande).
Crutzen, P.J., Mosier, A.R., Smith, K.A., Winiwarter, W. (2008): N2O release from agro-biofuel production negates global warming reduction by replacing fossil fuels. Atmos. Chem. Phys. 8, p. 389-395.
EEA - European Environment Agency (2006): How much bioenergy can Europe produce without harming the environment? EEA-Report No 7, ISSN 1725-9177, Luxembourg: Office for Official Publications of the European Communities, 72 p.
EEG (2000): Gesetz für den Vorrang Erneuerbarer Energien vom 29/03/2000. BGBl I 2000, S. 305.
Fehrenbach, H., Giegrich, J., Reinhardt, G.A. & Rettenmaier, N. (2009): Synopse aktueller Modelle und Methoden zu indirekten Landnutzungsänderungen

106
PROCEEDINGS Conference MPDES 2011
13
ILUC. Im Auftrag des Bundesverbands der deutschen Bioethanolwirtschaft e.V. (BDBe). IFEU, Heidelberg.
Faulstich, M., & Greiff, K. B. (2008). Klimaschutz durch Biomasse. Umweltwissenschaften und Schadstoff-Forschung, 20(3), 171-179. doi:10.1007/s12302-008-0008-2
Glemnitz, M., Hufnagel, J. & Willms, M. (2009): Ökologische Folgewirkungen des Energiepflanzen-anbaus – Schlussbericht zum Teilprojekt II des FNR-Projektes: Entwicklung und Vergleich von optimierten Anbausystemen für die landwirtschaftliche Produktion von Energiepflanzen unter den verschiedenen Standortbedingungen Deutschlands (EVA). Zentrum für Agrarlandschaftsforschung e.V. (Hrsg.)
Glemnitz, M., Platen, R. & Hufnagel, J., (2010): Auswirkungen des landwirtschaftlichen Anbaus von Energiepflanzen auf die Biodiversität – Optionen in der Anbaugestaltung in: Reich, M. & Rüter, S. (Hrsg.): Energiepflanzenanbau und Naturschutz, Umwelt und Raum, Band 1, Göttingen: Cuvellier 2010
Haaren, C. Von (2004): Landschaftsplanung, Stuttgart: Verlag Eugen Ulmer
Hagen et al. 2010: Bosch & Partner, Thüringer Landesanstalt für Landwirtschaft (TLL) & Institut für Energie- und Umweltforschung Heidelberg GmbH (IFEU): Flächeneffektive Bioenergienutzung aus Naturschutzsicht - Bewertungen und Empfehlungen zum Schutz von biologischer Vielfalt und Klima. F+E-Vorhaben im Auftrag des Bundesamtes für Naturschutz, FKZ 3508 83 0300, unveröffentlicht, Hauptbearbeiter: Zoë Hagen, Nils Rettenmaier, Judith Beck/ Katja Gödeke
Hagen, Z. (2009): Aktuelle Umsetzung von Bioenergie in Brandenburg: Biogasanlagen in landwirtschaftlichen Betrieben. In: ZALF (Hrsg.) 2009: Aktuelle Umsetzung von Bioenergie in Brandenburg – eine Befragung Brandenburger Landwirte. ZALF-FNR-Projekt, FKZ 22020305, Gülzow.
Hagen, Z. (2010): Entwicklung der Biogasanlagen in Brandenburg. Unveröffentlichtes Manuskript, TU Berlin.
Hufnagel, J., Glemnitz, M. & Willms, M. (2007): Ökologische Begleitforschung zum Energiepflanzen-anbau. In Schriftenreihe „Nachwachsende Rohstoffe“ – Symposium Energiepflanzen 2007 (Band 31) – der Fachagentur Nachwachsende Rohstoffe e.V. (FNR), Gelsenkirchen: Verlag TH Mann GmbH & Co KG.
IFEU et al. (2008): Optimierungen für einen nachhaltigen Ausbau der Biogaserzeugung und - nutzung in Deutschland. Endbericht. Verbundprojekt gefördert vom Bundesministerium für Umwelt, Naturschutz und Reaktorsicherheit (BMU), Forschungszentrum Jülich.
IPCC (2006): 2006 IPCC Guidelines for National Greenhouse Gas Inventories. Institute for Global Environmental Strategies (IGES), Hayama, Japan, on behalf of the Intergovernmental Panel on Climate Change (IPCC).
Jandewerth, M. (2008): GIS-gestützte Analyse der Biomasseproduktion im Raum - Analyse der Raumbedeutsamkeit von Flächennutzungsoptionen (Internationaler Workshop „Energie aus Biomasse -
Aufgaben f r die Raumplanung?“ 2008, Leipzig) In Energie aus Biomasse - Aufgaben für die Raumplanung?: aktuelle Situation, Entwicklungen und Instrumente. Internationaler Workshop 17./18. November 2008 Leipzig: Deutsches BiomasseForschungsZentrum gemeinnützige GmbH -DBFZ-, 2008, 23 S.
Jessel, B. (2009): Nachhaltige Nutzung von Biomasse – Synergien und Risiken im Hinblick auf den Landschafts- und Naturschutz in: DBFZ: Biomass in future landscapes, Proceeding of the Conference, 31th march until 1st April 2009, Berlin
Jungk, N. & Reinhardt, G.A. (2000): Landwirtschaftliche Referenzsysteme in ökologischen Bilanzierungen. Eine Basisanalyse. Gefördert durch das Bundesministerium für Landwirtschaft, Ernährung und Forsten (BML), FKZ 99NR009. IFEU, Heidelberg.
Landkreis Göttingen (2006): Merkblatt zu den Anforderungen für die Errichtung von Biogasanlagen. Dezernat für Bauen, Umwelt, Ordnung und Verkehr. Unter URL: http://www.goettingerland.de/downloads-leader/Merkblatt-Biogas.pdf
Marks, R., Müller, M. J., Leser, H. & Klink, H.-J. (1992): Anleitung zur Bewertung des Leistungsvermögens des Landschaftshaushaltes. Forschung zur deutschen Landeskunde. Band 229. Trier: Selbstverlag..
Müller, U. (2004): Auswertungsmethoden im Bodenschutz. Dokumentation zur Methodenbank des Niedersächsischen Bodeninformationssystems (NIBIS®). In: Niedersächsisches Landesamt für Bodenforschung (Hrsg.) (2004): Arbeitshefte Boden, Heft 2004/2. Hannover.
Nehring, A. & Vetter, A. (2009): Entwicklung und Optimierung von standortangepassten Anbausystemen für Energiepflanzen im Fruchtfolgeregime – Schlussbericht zum Teilprojekt I des FNR-Projektes: Entwicklung und Vergleich von optimierten Anbausystemen für die landwirtschaftliche Produktion von Energiepflanzen unter den verschiedenen Standortbedingungen Deutschlands (EVA). Thüringer Landesanstalt für Landwirtschaft (Hrsg.)
Reinhardt, G.A. (1993): Energie- und CO2-Bilanzierung nachwachsender Rohstoffe: Theoretische Grundlagen und Fallstudie Raps. Wiesbaden: Vieweg-Verlag.
Reinhardt, G.A. & Zemanek, G. (2000): Ökobilanz Bioenergieträger: Basisdaten, Ergebnisse, Bewertungen. Berlin: Erich Schmidt.
Reinhardt, G.A., Gärtner, S.O., Patyk, A., Rettenmaier, N. (2006): Ökobilanzen zu BTL: Eine ökologische Einschätzung. Gefördert durch das Bundesministerium für Ernährung, Landwirtschaft und Verbraucherschutz (BMELV), FKZ 2207104. IFEU, Heidelberg.
Rettenmaier, N., Münch, J., Gärtner. S.O. & Reinhardt, G.A. (2009): Ökologische Bewertung neuer Logistikkonzepte für Biobrennstoffe. Teilvorhaben 7 im Verbundvorhaben BioLog (Entwicklung, Erprobung und Demonstration neuer Logistikkonzepte für Biobrennstoffe). Im Auftrag der CUTEC-Institut GmbH, gefördert durch das Bundesministerium für Ernährung, Landwirtschaft und Verbraucherschutz (BMELV), FKZ 22031905. IFEU, Heidelberg.

107
PROCEEDINGS Conference MPDES 2011
14
Saathoff, W. & Haaren, C. Von (2010): Landwirtschaft und Klimaschutz: Relevanz der landwirtschaftlichen Flächennutzung für den Klimaschutz. In: Reich, M. & Rüter, S. (Hrsg.): Energiepflanzenanbau und Naturschutz, Umwelt und Raum, Band 1, Göttingen: Cuvellier 2010
Schultze, C. & Köppel, J. (2007): Gebietskulissen für den Energiepflanzenanbau. In: Naturschutz und Landschaftsplanung, 9/07, 39. Jahrgang, S. 269-272.
Schultze, C., Korte, B., Demmeler, M., Heißenhuber, A., Köppel, J.,. Kleinschmidt, B. & Förster, M. (2008a): Übertragbare Strategien zur naturverträglichen Biomassebereitstellung auf Landkreisebene – am Beispiel der Regionen Ostprignitz-Ruppin/ Brandenburg und Chiemgau/ Bayern – Endbericht des Forschungsvorhaben der Deutschen Bundesstiftung Umwelt, Osnabrück.
Schultze, C., Köppel, J., Hagen, Z., Demmeler, M., & Korte, B. (2008b): Planerische Ansätze für naturverträglichen Biomasseanbau. In: Wissenschaftsverbund Umwelt: Nutzungskonflikte bei nachwachsenden Rohstoffen. Rostock Univ. 79 S.
Schütte, A. (2007): Projektförderung als Beitrag zur Optimierung des Energiepflanzenanbaus. In: Schriftenreihe „Nachwachsende Rohstoffe“ – Symposium Energiepflanzen 2007 (Band 31) – der Fachagentur Nachwachsende Rohstoffe e.V. (FNR), Gelsenkirchen: Verlag TH Mann GmbH & Co KG
SRU – Sachverständigenrat für Umweltfragen (Hrsg.) (2007): Klimaschutz durch Biomasse, Sondergutachten. Berlin: Schmidt.
Strauß, C., Gödeke, K., Nehring, A. & Vetter, A. (2008): Entwicklung und Vergleich von optimierten Anbausystemen für die landwirtschaftliche Produktion von Energiepflanzen unter den verschiedenen Standortbedingungen Deutschlands (EVA). Ergebnisstand 2007 des Thüringer Ministerium für Landwirtschaft, Naturschutz und Umwelt.
Vogt, R., Gärtner, S.O., Münch, J., Reinhardt, G.A., Köppen, S. et al. (2008): Optimierungen für einen nachhaltigen Ausbau der Biogaserzeugung und -nutzung in Deutschland. Gefördert durch das Bundesministerium für Umwelt, Naturschutz und Reaktorsicherheit (BMU), FKZ 0327544. IFEU, Institut für Energetik und Umwelt, FHW Berlin, Öko-Institut, TU Berlin & Peters Umweltplanung. Heidelberg / Leipzig / Berlin / Darmstadt / Berlin / Berlin.
ZALF/FNR (2009): „Zustandsbericht zur aktuellen Umsetzung von Bioenergie auf landwirtschaftlichen Betrieben – eine Befragung Brandenburger Landwirte.“ Müncheberg.
Interviews/oral referenc Brozio, Sybille 2010, mdl.: Telefonat am 11.1.2010 Mengel (2009): Vortrag auf dem WS Steuerung auf Vilm,
Prof. Dr. Dr. Andreas Mengel: Titel des Vortrags: Steuerung des Ausbaus der Erneuerbaren Energien – Instrumente und Handlungsoptionen.
Euler, Landwirtschaftliche Rentenbank, Telefoninterview. vom 14.1.2009
Regionale Planungsstelle Prignitz-Oberhavel (2010), mdl.: Präsentation und Diskussion der Methodik durch Bosch & Partner vor Vertretern der Regionalen Planungsstelle Prignitz-Oberhavel und des Landkreises OPR am 25.1.2010.

108
PROCEEDINGS Conference MPDES 2011
Ecological and economical evaluation of biogas feedstock from intercrops
Nora Niemetz ([email protected]) Karl-Heinz Kettl ([email protected])
Michael Narodoslawsky ([email protected]) Graz University of Technology
Institute for Process- and Particle Engineering Inffeldgasse 21a, 8010 Graz, Austria
Abstract Biogas made from main crops (e.g. corn) is a common technology to produce electricity and heat. Instead of leaving agricultural fields unplanted for soil regeneration, intercrops can be used to increase biomass output per hectare. This additional biomass can be used for biogas production to avoid conflicts between food and energy production. Beside that, intercrops have the potential to increase nitrogen fixation which results in reduced amount of mineral fertilizer and emissions to water. Process Network Synthesis (PNS) is used to prove economical feasibility of planting intercrops. A case study situated in Upper Austria, is analysed for possible biogas production. Besides the evaluation of intercrops potential, biogas pipelines as a cheap alternative to district heating pipelines are considered. Out of a maximum structure which contains all possibilities (e.g. different transport situations, digester locations and substrate availability) an optimum structure is generated based on combinatorial rules. Different production scenarios can be used to help local authorities or stakeholders in their decision making. Ecological evaluation of the PNS optimization is carried out by Sustainable Process Index (SPI) which rates the impact based on ecological footprint evaluation. Out of the maximum structure the PNS optimum has the best profit though with higher ecological pressure than caused in the scenarios. Amongst others the study shows the importance of finding a middle course that achieves both needs from ecological and economical point of view.
Keywords: decentralized networks; biogas; intercrops; process network synthesis; sustainable process index
Introduction An alternative for sustainable biogas production from common feedstocks is using biomass from intercrops as resources. Intercrops are planted on fields during the main crop periods of e.g. wheat, corn or triticale. Typical crop rotation is to grow the winter type of main crops (e.g. wheat, rape, etc.) and after harvesting during the regeneration period intercrops will cover the fields. After the intercrop period the main crop period starts again.
The basic idea of planting intercrops for energy production is to use those types of biogenous feedstock which are strictly not in competition with food. A positive side-effect of planting intercrops can be seen in an increased yield per hectare as well as in the potential of these crops to improve soil quality by nitrogen fixation and humus rebuilding. With that the mineral fertilizer input can be reduced lowering the ecological pressure. In the case study, a spa town in upper Austria, the set-up of the supply chain is seen as key parameter. An important issue in this case are more decentralized networks for biogas production. This can be achieved e.g. with several
separated decentralized digesters that are linked by biogas pipelines to a single combined heat and power plant.
Methods In a first step a technology network is generated with Process Network Synthesis (PNS) (Friedler et. al., 1995). This method uses the p-graph method and works through energy and material flows. Available raw materials are turned into feasible products and services, while in- and outputs are unequivocally given by each implemented technology. Time dependencies like resource availability (e.g. harvesting of renewable resources) as well as product or service demand (e.g. varying heat demand for district heating over the year) are part of the optimization.
The input necessary for this optimization includes mass and energy balances, investment and operating costs for the technologies considered, costs for resources and utilities, prices for products and services as well as constraints regarding resource supply and product/service demand. All data came as an input from project partners and are specific for the considered region. First the so called maximum structure is generated linking resources with demands. From this starting point the optimization is carried out resulting in an optimum solution structure representing the most economical network.
The second step includes the ecological evaluation of the optimum PNS structure using the Sustainable Process Index (SPI) (Sandholzer et. al, 2005; Narodoslawsky et. al, 1995, 2008). The SPI, as a member of the ecological footprint family, represents as a result the area which is needed to embed all human activities needed to supply products or services into the ecosphere, following strict sustainability criteria.
Case Study
Point of Departure The case study is part of a project wherein intercrops were analysed in detail. With the data from the project the optimization could be carried out. In three field tests and on more than 50 hectare of arable land, different kinds of intercrops were cultivated to determine dry matter yields. In the field experiments the effects on ground water, soil and nutrient management were investigated. By means of lab scale biogas digester experiments the biogas potential was measured. The scope of work in the project involved:
- the cultivation of typical intercrops in three different areas in Austria,

109
PROCEEDINGS Conference MPDES 2011
- the scientific monitoring to evaluate biomass yields, to model the leaching into ground water and to describe the N and C-balancing,
- the measurement of biogas potential of intercrops biomass in the lab scale,
- testing biogas production from intercrops in farm scale and identifying obstacles for their widespread use and
- developing and comparing different designs of biogas production systems.
The optimization started by discussing basic conditions with the project partners as well as with decision makers of the region. It turned out that three decentralized locations would fit for biogas production. As there is a spa town located in the region it is impossible to contemplate a fourth, central location for digesters as it would infringe with the touristic activity there. The heat needed in the town could be either generated by a centrally placed CHP with biogas transported via pipelines or heat produced with decentralized CHPs could be used for digester heating and/or transported via pipelines to the town. Of note was to show how intercrops can affect networks from an ecological and economical point of view.
For the optimization three digester sizes (up to a capacity that serves a 250 kWel CHP) could be run with the amount of biogas produced. Four combined heat and power plant capacities (up to 500 kWel) were involved in the maximum structure. The digesters can be heated with by decentralized CHP or with a biomass furnace on site in case the biogas is transported to a central CHP. The fermentation can be run with different substrate feeds. Dependent on them digester sizes and costs differ as well as the exposure times. Seven different digesters were part of the PNS to find the most lucrative way of using the substrates. The feeds are shown in Table 1.
Table 1: Substrate Feeds for Fermentation
Feed [%]
Manure Corn Inter-crops
Grass
1 100 - - - 2 50 50 - - 3 75 25 - - 4 75 15 10 - 5 50 30 10 10 6 50 20 20 10 7 75 - 15 10
The available substrates for biogas production are manure, corn, grass and intercrops. For the optimization it is assumed that proportional to the availability of manure biomass in an amount of 18 % grass, 16 % corn silage and 34 % intercrops (referring to fresh weight) per livestock unit can be supplied. As there are several farmers in and around the considered region eight provider groups were defined. The substrate costs are the same for each group. The providers differ in the amount of available resources as well as in the distance to each possible digester location, which directly correlates with transport costs. Table 2 includes the distances of each group to the three locations that would be feasible for biogas production.
Table 2: Provider Distances to three locations in km
Group Location 1 Location 2 Location 3 1 1,6 3,4 0 2 3,3 4,7 4,0 3 2,7 4,6 1,2 4 1,9 1,4 3,3 5 0,3 2,1 2,1 6 1,5 2,9 3,0 7 3,1 3,0 2,4 8 3,8 1,9 3,7
Within the PNS optimization it is possible to find the best transport situation which is also desirable in respect of ecological decisions.
PNS – Maximum Structure The basic conditions that have to be included in the maximum structure for the PNS optimization were already discussed before. In table 3 the substrate parameters are described. The optimization is based on two different cost situations (maximum and minimum) for substrate provision.
Table 3: Substrate Parameters
Manure Corn Inter-
crops Grass
Dry Mass Content [%] 9 33 24 30
Substrate Costs* min. [€/t DM] 5 65 50 50
Substrate Costs* max. [€/t DM] 10 90 80 80
CH4-output [m³/ t DM] 200 340 300 300
* all costs decided by project partners
Figure 1 shows the so called maximum structure for the PNS optimization, which includes all input and output materials with energy and material flows with economical parameters like investment or operating costs and prices.
Figure 1: Maximum Structure for PNS Optimization
Transport costs include a fixed part for loading and unloading and a variable part depending on the distance

110
PROCEEDINGS Conference MPDES 2011
(including unloaded runs). For solid substrates it was calculated with fixed costs of 2 €/t fresh weight. Similarly, the conversion was made for the variable costs, which were assumed with 0.49 €/km. Fixed transport costs for manure were defined with 20 €/t dry mass with variable costs of 5 €/t dry mass per kilometer.
Transportation of heat and biogas can be achieved by pipeline networks. Network energy demands as well as losses caused by transporting were taken into account. Regarding heat it was assumed that the total amount produced can be used for district heating. As location 1 and 3 are in one line to the spa town the biogas pipeline could be used for two locations to transport the biogas to a central CHP. With that there would not be any additional costs for a biogas pipeline from location 1 to the town as soon as location 3, which is farther away, supplies the centre with biogas.
The biomass furnace that would be needed to provide the digester heat was not implemented as a separate technology in the maximum structure, but a price of 5ct/kWh heat was assumed (R. Wagner, 2008).
Produced electricity can be fed into the grid of electricity providers, thus benefiting from feed in tariffs according to the Austrian’s Eco-Electricity Act.
Results
PNS – Optimum Structure The PNS optimization shows that the technology network providing the most benefit for the region only includes location 1 for biogas generation, where biogas is produced with two different substrate feeds (6, 7). Therefore two digesters are part of the optimum structure. As table 1 shows both substrate feeds include intercrops. All provider groups can supply the digesters with at least one substrate. Figure 2 depicts the optimum structure for a situation with maximal substrate costs as listed in table 1.
Figure 2: Optimum Structure of a Technology Network generated with the PNS
Both digesters have a size to run a 250 kWel CHP. The one with the higher amount of intercrops in the feed (f6) runs full load, while the other one (f7) runs around 96 % of capacity. All together 1,116,000 m³ CH4 can be produced. The biogas generated with digester f6 is used in a decentralized 250 kWel CHP on site whereas the second digester supplies via biogas pipelines a CHP with same capacity like in location 1 in the center. Nearly forty percent of the heat produced locally is used for heating the digesters. The rest of about 1,365 MWh heat per year is sent to town to cover the heat demand for a price of
2.2 5 c t /kWh. In both cases the electricity is fed into the grid and feed in tariffs of 20.5 ct/kWh can be gained.
With this technology network taking a payout time of 15 years into account a total annual profit of around 240,300 € can be achieved (interest rates and personal costs are not included). The total material costs including electricity consumed from the grid add up to 236,000 €/a with additionally 68,170 € a year for transport. The investment costs for this solution would be around 2,771,000 € including district heating and biogas network as well as the costs for digesters and CHPs.
The optimization based on the same maximum structure (figure 1) with a minimum cost situation listed in table 1 results in the same optimum structure shown in figure 2. The costs for the substrates are 163,920 € per year. This effects the profit and increases it to about 312,420 €/a (without taking interest rates and personal costs into account). Table 4 gives an overview of the results for both cost situations (minimum and maximum, see table 3).
Table 4: Comparison of the Results for Minimum and Maximum Substrate Costs
Payout Period: 15 years min. max. Total Investment Costs [Mio. €] 2,771 2,771 Yearly Material Costs [1000 €/a] 164 236 Yearly Transport Costs [1000 €/a] 68.2 68.2 Price for District Heat [€/MWh] 22.5 22.5 Produced District Heat [MWh/a] 3,636 3,636 Feed in Tariff Electricity [€/MWh] 205 205 Produced Electricity [MWh/a] 3,819 3,819 Total profit [1000 €/a]* 312.4 240.3 * without interest rates and personal costs
PNS – Scenarios To prove the plausibility of the optimum structure and
two scenarios were carried out both for minimum as well as for maximum substrate cost situations. In the first case the maximum structure was reduced by the availability of corn. With that only two digester types can be used for biogas production. The second scenario was set up to get an idea of the benefits using substrate feeds that include solid feedstock as well. Therefore the only substrate that can be used is manure.
Scenario 1: A new maximum structure for the PNS was generated (based on figure 1) wherein corn was excluded. With that only two digesters can be used for biogas production. The biogas is produced at location 3 with a total amount of 751,000 m³ CH4 per year. As the digesters are only available up to a capacity to run a 250 kWel CHP a smaller biogas plant is installed in addition to the largest available type. With a locally 80 kWel CHP the heat demand for the biogas production can be covered. There is no district heating pipeline to the spa town. In the center a 250 kWel CHP can be run with biogas produced in the larger digester. As a result of the optimization figure 3 shows the optimum technology network for the new maximum structure in scenario 1.

111
PROCEEDINGS Conference MPDES 2011
Figure 3: Optimum structure Scenario 1 “No Corn” The optimum structure for scenario 1 where no corn is available with maximum substrate cost situation could gain in a payout time of 15 years a yearly profit of about 136,420 € (again excluding interest rates and personal costs). If substrate costs are set to minimum the structure does not change but the annual profit increases due to the lower material costs to 182,950 €/a. Table 5 compares minimum and maximum substrate cost situation for scenario 1.
Table 5: Scenario 1 - Comparison of the Results for
Minimum and Maximum Substrate Costs
Payout Period: 15 years min. max. Total Investment Costs [Mio. €] 2,013 2,013 Yearly Material Costs [1000 €/a] 96.2 142.7 Yearly Transport Costs [1000 €/a] 52.65 52.65 Price for District Heat [€/MWh] 22.5 22.5 Produced District Heat [MWh/a] 2,340 2,340 Feed in Tariff Electricity [€/MWh] 205 205 Produced Electricity [MWh/a] 2,574 2,574 Total profit [1000 €/a]* 183.0 136.4 * Without interest rates and personal costs
Scenario 2: The input materials in the maximum structure (figure 1) are dramatically changed. In Scenario 2 only manure is available as a substrate for biogas fermentation. With that the PNS can not choose between different feeds and only one digester can be taken to produce biogas.
As an outcome the optimization shows that one location (3) is feasible for biogas fermentation. There biogas can be produced in a digester with a capacity to run an 80kWel CHP. The produced biogas with an amount of 182,000m³ is completely sent via biogas pipelines to a central 80 kWel CHP situated in the town. There is no district heating pipeline to the spa town. The heat demand for the digester at location 3 is covered by a biomass furnace.
In this scenario when only manure is available with maximum substrate cost of 9 €/t dry mass no profit can be gained. The optimum structure for scenario 2 would have a yearly loss of about 3,100 € (still not including interest rates and personal costs) in a payout time of 15 years. If substrate costs are set to minimum the structure does not change but the annual loss decreases to 350 €/a.
SPI (Sustainable Process Index) Evaluation To measure the ecological impact of the structures described before an ecological footprint is generated by using the SPI method. With the results the structures can be compared regarding their environmental impact. The optimum structure of the PNS is not necessarily the
technology network with the lowest environmental effects. By comparing the different structures with both numbers, the economical value and the SPI, the overall best network can be found. This is an approach to provide broad information for decision making.
The results of SPI methodology are represented as areas. By referencing the footprint in this way material as well as energy demands are taken into account and expressed in an equivalent area within four different categories (area for: land use, renewable, non-renewable and, fossil resource provision). Emissions (to water, air and soil) are also taken into account in the overall ecological footprint for a product.
SPI – Results: Important for the SPI evaluation is to assess the system boundaries of observation. The evaluation for field crops starts with crop sowing. For cultivation different machines are necessary e.g. for sowing, fertilizing, plowing, etc. The infrastructure of the machineries is also included into the evaluation. Further fertilizers are needed to grow the plants. In case of manure the SPI has another approximation. It starts with the cow as a manure producer. The cow needs feed to produce meat, milk and manure. For this wheat and grass has to be grown, which also results in ecological pressure. As main product milk was assumed for calculating the SPI in this example. Therefore manure is a side product that has a certain price. Ecological pressure was assigned by price allocation for manure. A low footprint of manure is due to the fact that the manure prize is rather low (1 €/t) compared to the main product milk (288 €/t). As the case study is part of an ongoing project there were still some data e.g. for machinery use not available to calculate the SPI of intercrops. For the evaluation it was assumed that growing intercrops can be compared with grass silage production. In this case the SPI for intercrops is the same as for grass with only a small difference resulting from transport.
A main part of the ecological footprint is caused by transport. In the structures described before the transport situation differs. For the optimum structure the location for biogas plants is location 1 whereas in the two scenarios location 3 is preferred. As table 2 shows the provider distances differ dependent on the location. Thus the total kilometers for transport differ. Table 6 overviews the main parameters for the SPI evaluation.
Table 6: Main Parameters for SPI calculation
yearly Optimum Scen. 1 Scen. 2
Corn [t DM/a] 1,812 0 0 Corn SPI [m²/t] 86,216 86,216 86,216 Intercrops [t DM/a] 4,009 3,013 0 Intercrops SPI [m²/t] 50,531 50,531 50,531 Grass [t DM/a] 2,369 2,007 0 Grass SPI [m²/t] 50,533 50,533 50,533 Manure [t DM/a] 15,510 15,067 10,340 Manure SPI [m²/t] 236 236 236 Electricity [MWh/a] 230 154 37 Prod. Heat [MWh/a] 3,636 2,340 819 Prod. Electr. [MWh/a] 3,819 2,574 624 CHP capacity [kWel] 2 x 250 80; 250 80 SPI total [1.000 m²] 501,695 308,849 21,511
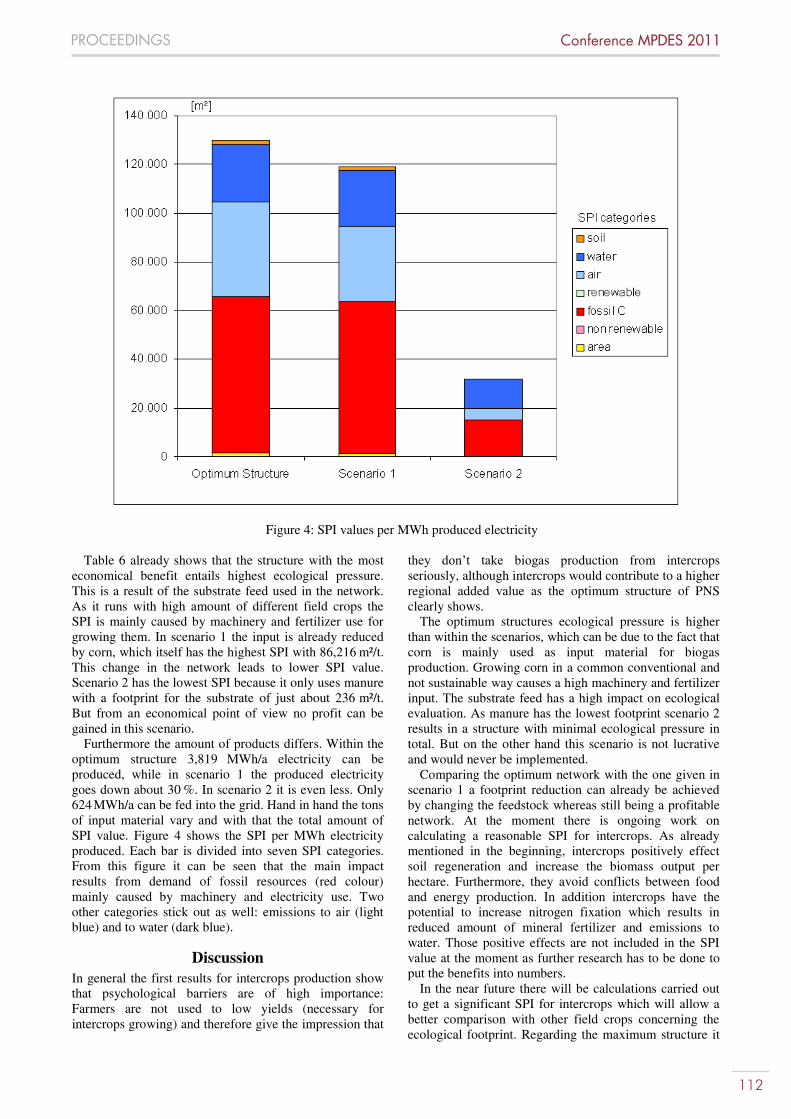
112
PROCEEDINGS Conference MPDES 2011
Figure 4: SPI values per MWh produced electricity Table 6 already shows that the structure with the most
economical benefit entails highest ecological pressure. This is a result of the substrate feed used in the network. As it runs with high amount of different field crops the SPI is mainly caused by machinery and fertilizer use for growing them. In scenario 1 the input is already reduced by corn, which itself has the highest SPI with 86,216 m²/t. This change in the network leads to lower SPI value. Scenario 2 has the lowest SPI because it only uses manure with a footprint for the substrate of just about 236 m²/t. But from an economical point of view no profit can be gained in this scenario.
Furthermore the amount of products differs. Within the optimum structure 3,819 MWh/a electricity can be produced, while in scenario 1 the produced electricity goes down about 30 %. In scenario 2 it is even less. Only 624 MWh/a can be fed into the grid. Hand in hand the tons of input material vary and with that the total amount of SPI value. Figure 4 shows the SPI per MWh electricity produced. Each bar is divided into seven SPI categories. From this figure it can be seen that the main impact results from demand of fossil resources (red colour) mainly caused by machinery and electricity use. Two other categories stick out as well: emissions to air (light blue) and to water (dark blue).
Discussion In general the first results for intercrops production show that psychological barriers are of high importance: Farmers are not used to low yields (necessary for intercrops growing) and therefore give the impression that
they don’t take biogas production from intercrops seriously, although intercrops would contribute to a higher regional added value as the optimum structure of PNS clearly shows.
The optimum structures ecological pressure is higher than within the scenarios, which can be due to the fact that corn is mainly used as input material for biogas production. Growing corn in a common conventional and not sustainable way causes a high machinery and fertilizer input. The substrate feed has a high impact on ecological evaluation. As manure has the lowest footprint scenario 2 results in a structure with minimal ecological pressure in total. But on the other hand this scenario is not lucrative and would never be implemented.
Comparing the optimum network with the one given in scenario 1 a footprint reduction can already be achieved by changing the feedstock whereas still being a profitable network. At the moment there is ongoing work on calculating a reasonable SPI for intercrops. As already mentioned in the beginning, intercrops positively effect soil regeneration and increase the biomass output per hectare. Furthermore, they avoid conflicts between food and energy production. In addition intercrops have the potential to increase nitrogen fixation which results in reduced amount of mineral fertilizer and emissions to water. Those positive effects are not included in the SPI value at the moment as further research has to be done to put the benefits into numbers.
In the near future there will be calculations carried out to get a significant SPI for intercrops which will allow a better comparison with other field crops concerning the ecological footprint. Regarding the maximum structure it

113
PROCEEDINGS Conference MPDES 2011
is planned to take other substrate feeds for the digesters into account that are mainly based on intercrops to minimize negative effects of corn production which has a quite high ecological pressure.
References Friedler F., Varga J.B., Fan L.T. (1995): Decision-
mapping: a tool for consistent and complete decisions in process synthesis. Chemical Engineering Science, Vol. 50, 1755-1768.
Narodoslawsky M., Niederl A., Halasz L. (2008): Utilising renewable resources economically: new challenges and chances for process development, Journal of Cleaner Production, Vol. 16 Issue 2, 164-170
Narodoslawsky M., Krotscheck Ch. (1995): The sustainable process index (SPI): evaluating processes according to environmental compatibility, Journal of Hazardous Materials, Vol. 41, 383-397.
Sandholzer D., Niederl A., Narodoslawsky M. (2005): SPIonExcel – fast and easy calculation of the Sustainable Process Index via computer, Chemical Engineering Transactions 7 (2), 443-446.
Wagner, R. (2008): Ökonomischer und energetischer Vergleich von Biogasleitungen mit Warmwasserleitun-gen zur besseren Wärmeverwertung, C.A.R.M.E.N.

114
PROCEEDINGS Conference MPDES 2011
Energy recovery from sisal residues: A sustainable option for Tanzania?
Julia C. Pfaff ([email protected]) University of Trier, Wuppertal Institute for Climate, Environment and Energy GmbH
Widdeshover Weg 26, 50769 Köln
Manfred Fischedick ([email protected]) Wuppertal Institute for Climate, Environment and Energy GmbH
P.O. Box 100480, 42004 Wuppertal, Germany
Heiner Monheim ([email protected]) University of Trier, Department of Applied Geography, Urban and Spatial Planning
54286 Trier, Germany
Abstract Energy plays a key role in achieving development, but many Sub-Saharan African countries struggle to satisfy the increasing electricity demand. In an agriculture-dependent country like Tanzania the available but underutilized potential of agricultural residues could be used to generate energy, thereby replacing unsustainable fuel sources and reducing the dependence on imported fossil fuels. But so far the energy potential of these residues in Tanzania has not been evaluated and quantified sufficiently. Moreover, the scientific basis for estimations of the sustainable potential of wastes and residues is still very limited. This paper presents an attempt to evaluate the theoretical and technical potential of residues from the sisal sector in Tanzania with regards to energy recovery through anaerobic digestion. The characteristics and availability of sisal residues are defined and a set of sustainability indicators with particular focus on environmental and socio-economic criteria is applied. Our analysis shows that electricity generation with sisal residues can be sustainable and have positive effects on the sustainability of sisal production itself. All sisal residues combined have an annual maximum electricity potential of 102 Gigawatt hours (GWh) in 2009, corresponding to up to 18.6 Megawatt (MW) of potential electric capacity installations. This estimated maximum potential is equivalent to about 3% of the country’s current power production. Utilizing these residues could contribute to meeting the growing electricity demand and offers an opportunity for decentralized electricity production in Tanzania. Keywords: agricultural residues, sisal, anaerobic digestion, electricity, heat, sustainability, Tanzania
Introduction In Tanzania, traditional biomass fuels are the
dominating energy source, accounting for over 90% of the total energy consumption. Commercial energy sources account for 10% of consumption, of which electricity accounts for only 2%. Accordingly, the levels of electricity consumption per capita are among the lowest worldwide. These numbers reflect not only insufficient availability but also lack of access to modern energy services. To date, only 14% of the population has access to electricity (Ministry of Energy and Minerals [MEM], 2010). The access rate in rural areas is with 2% significantly lower compared to urban areas, where 39% of the population has access to electricity (International Energy Agency [IEA], 2008). With an intended increase of electricity access combined with continuing growth in
the commercial, industrial, agricultural and residential sector, the Ministry of Energy and Minerals (2010) projects that the electricity demand in Tanzania will triple by 2020. This leap of electricity demand cannot be covered by the currently installed generation capacity of 1,219 MW, of which 561 MW are hydro-based and 658 MW are thermal-based (diesel and natural gas) (MEM, 2010). Moreover, the present demand for electricity already exceeds the installed generation capacity. Although the situation has improved after the country suffered its worst power shortage in 2006/2007, due to falling water levels in the hydroelectric dams caused by enduring droughts, blackouts still occur on a daily basis. New power rationings were announced in 2010 after the breakdown of four power generators. These shortcomings in the power sector not only affect households but also threaten Tanzania’s long-term economic growth and competitiveness. Companies have either to rely on expensive backup systems like diesel generators or to completely suspend their business activities during load sheddings. The World Bank (2010) estimates that the average cost of shortcomings in Africa are equivalent to 2.1% of the gross domestic product (GDP). Therewith, the question of how to stabilize, secure and increase the power supply is critical for Tanzania’s economic and social development.
Renewable energy sources are expected to play an important role in addressing these problems. In rural and peri-urban areas, where grid extensions are not feasible, renewable energies are regarded as a particularly promising option for decentralized electricity generation. With regard to the region’s high potential for producing biomass, one of the promoted strategies is the use of modern bioenergy technologies including liquid biofuel production (MEM, 2010). However, it is known that the use of biomass for energy applications can lead to land use competition, environmental degradation and put food security at risk. Bioenergy strategies must therefore be carefully chosen. Pathways that use biogenic wastes and agricultural residues entail far fewer risks of resource competition compared to those using food and energy crops to generate energy. But so far residues represent a still largely untapped energy potential worldwide (United Nations Environment Programme [UNEP], 2009). Accordingly, the energy potential of residues and wastes in Tanzania is not well documented. Nevertheless, agricultural residues from cash- and food crop production

115
PROCEEDINGS Conference MPDES 2011
have a high theoretical potential as feedstock for electricity conversion in an agriculture-dependent developing country like Tanzania.1
The Tanzanian economy depends heavily on agriculture, which accounts for approximately 25% of GDP, provides 85% of exports, and employs 80% of the workforce (Food and Agriculture Organization of the United Nations [FAO], 2010). The sector itself is dominated by subsistence farming and rain-fed crop production. Only one-fifth of agriculture production can be categorized as commercial. But considerable amounts of agricultural residues are mainly produced in regions with private estates and intensive commercial smallholders farming (German Technical Cooperation [GTZ], 2005). Consequently most concentrated amounts of agricultural residues are accumulated in the agro-industrial crop production. Therefore, the starting point of a holistic approach to use agriculture residues for electricity generation should be the utilization of residues from commercial crop production.
Tanzania’s major sources for agricultural residues are coffee, rice, sisal, sugar, cashew nut, maize, coconut, cotton and banana. Although these crops produce different types of residues, all crop residues can, for convenience, be divided into two main categories: field residues remaining on the fields after harvesting, and process residues resulting from crop processing. Process residues are particularly promising due to their large and localized availability, thus limiting the need for additional logistic structures. The utilization of most crop residues is still very limited in Tanzania, although wood fuel scarcity has lead to an increasing amount of residues directly used as cooking fuel. Traditionally, most of the agricultural crop residues are burnt or left on the fields or on the farms to facilitate the harvesting process, as pest control measures or simply because there is no other possibility to dispose them.
Considerable amounts of agricultural crop residues for cogeneration of electricity have so far only been used in the sugar sector. But the situation is slowly changing and the first biogas plant, which uses only sisal wastes as substrate to generate electricity, started operating in Hale, Tanzania in 2008. The plant is running successfully for two years now, proofing that sisal residues are a good quality substrate for anaerobic digestion. Plans are already in place to scale-up cogeneration of electricity from sisal wastes, demonstrating the growing interest in this specific energy source. Hence, the present study focuses on the estimation of the sisal residue potential for electricity generation and the associated environmental and socio-economic risks and opportunities.
1 Agricultural residues also include animal manure, but this
feedstock is not included in this paper. In Tanzania traditional small-scale farmers dominate the structure of keeping livestock. Approximately 99% of the livestock belongs to these traditional farmers, while commercial ranches and dairy farms constitute the remaining 1% (FAO & Livestock information, sector analysis and policy branch [AGAL], 2005). Most small-scale farmers keep their livestock free-range, which leaves the utilization of animal manure as feedstock a challenging task. Providing sufficient streams of preferably wet dung is in many cases neither practical nor feasible.
Research Objectives Several studies have highlighted the potential for bioenergy production on the African continent (Smeets et al., 2007; Smeets et al. 2004; Marrison & Larson, 1996). But more detailed country level and crop specific assessments are necessary to understand the practical prospects for future biomass energy production in Africa. The focus of this paper is to assess the theoretical and technical potential of cogenerating electricity and heat with agricultural crop residues in Tanzania’s sisal sector, with the following detailed objectives: (i) to estimate the theoretical available amount of sisal residues based on both aggregated and site-specific data; (ii) to evaluate the availability and technical realizable energy potential of sisal residues; (iii) to assess ecological and socio-economic effects of using these residues for energy generation.
Methods The following quantitative and qualitative methods were adopted to estimate the amount and energetic values of sisal residues theoretically available, and to assess how selected sustainability aspects would be influenced by the use of these residues.
(i) The amount of agricultural residues produced is estimated using the residue-to-product ratio (RPR). The necessary crop production data were derived from the Tanzania Sisal Board [TSB], the National Bureau of Statistics and FAOSTAT.
(ii) Structured interviews and consultations with key government and private sector stakeholders were conducted to gather qualitative information on projects, context, implementation, results and impacts. Furthermore, the predominant attitude regarding the use of agricultural residues for energy generation in the country was assessed through attendance of various stakeholder workshops.
(iii) A detailed study of available literature and scientific reports on the production, collection, disposal and other uses of residues was carried out to collect additional data and information.
Estimating the amount of crop residues The type and amount of agricultural residues available varies from crop to crop depending on the plant structure, seasonal availability, harvesting methods, irrigation practices, soil quality and other factors. But the amount of residues produced is directly related to the corresponding crop production. So if the crop production quantities at a particular time are known, it is possible to estimate the amounts of agricultural residues produced using the residue-to-product ratio (RPR) (Koopmans & Koppejan, 1998). This method has been widely applied to estimate the potential availability of agricultural residues for energy generation (Rosillo-Calle, 2007). Although this approach has its limitations as it does not include future developments and investments in the agricultural sector, it is suitable to estimate the current country-specific energy potential of residues. The general equation for estimating the agricultural residual biomass is as follows:

116
PROCEEDINGS Conference MPDES 2011
R = Cp * RPR (1)
where (R) is the total available agricultural residual biomass in tonnes per year, (Cp) the amount of crop production in tonnes per year and (RPR) the residue-to-product ratio in tonnes of residues per tonnes of product. While the RPR values for sugarcane are well known, the RPR for sisal residues must be estimated. Using the following equation the RPR can be predicted if the quantity of residues is known. Instead of production figures, data of the cultivated area and the average agricultural yields are used:
RPR = R (2) Y
where (RPR) is the residue-to-product ratio in tonnes of residues per tonnes of product, (R) the average available agricultural residual biomass in tonnes per hectare per year, and (Y) the yield of product in tonnes per hectare per year.
Estimating the energy potential The production of electricity and heat trough anaerobic digestions depends on the gas formation potential of the substrates used. The potential volumes of biogas and methane can be calculated if following factors are known: amount of residue per period of time, dry matter content of the residue, organic dry matter content, biogas potential and specific yield of methane for the substrate (Kaltschmitt et al., 2008). In the next step the heat and electricity output and the necessary capacity can be estimated from the potential amount of methane and the expected efficiency of the power plant. The conversion factors (see Table 1) used to calculate the technical biogas potential from sisal residues were assumed to be similar to those for Kenya (GTZ, 2010).
Table 1: Conversion factors and full load hours used for
the calculation of biogas potentials
Factor Value
Total energy [kWh /m3 methane] 9.971 Efficiency of heat generation [%]
min. 38 max. 42
Efficiency of electricity production [%]
min. 30 max. 36
Full load hours CHP [h/year] 7,000
kWh = kilowatt hour; CHP = Combined heat and power plant; h = hour
Assessing environmental and socio-economic risks and opportunities Besides determining the available biophysical potential of sisal residues for electricity generation, further aspects need to be considered. In particular, environmental and socio-economic factors define how and where the
potential can be utilized in a sustainable manner2. The evaluation of environmental and socio-economic risks and opportunities is based on a selection of sustainability criteria developed by the Roundtable on Sustainable Biofuels [RSB]. Altogether, the RSB defines twelve principles that focus on social and environmental sustainability (RSB, 2010). The following six principles have been identified as primary for the sisal sector and applied in this study: water use and quality, biodiversity, soil health, greenhouse gas (GHG) emissions, food security and social and rural development.
An important aspect of environmental sustainability in the case of sisal is the avoidance of methane emissions from the disposal of sisal pulp and wastewater at solid waste disposal sites. The calculation method proposed by the Intergovernmental Panel on Climate Change [IPCC] based on a first order decay model developed by the United Nations Framework Convention on Climate Change [UNFCCC] is used here to quantify the avoidance of methane emissions. The model differentiates between different types of waste with respectively different decay rates and different fractions of degradable organic carbon (UNFCCC, 2010). The parameters used for sisal disposal are based on Salum (2008).
Results The quantification of the theoretical potential of sisal residues for energy generation is derived from the physical supply of biomass sources and represents the theoretical upper limit of the available energy supply (German advisory council on global change [WBGU], 2009). The portion of this theoretical potential that is realizable with the current technical possibilities is referred to as technical potential.
Residue generation from sisal Tanzania is the third largest producer of sisal fibers after Brazil and China (FAO, 2009; TSB, 2009). The key cultivation areas are Tanga, Morogoro, Kilimanjaro, Arusha and Mara (Tanzania Agricultural Sample Census, 2003). Traditionally, the fiber is used to produce ropes, carpets and clothing, which are sold on the domestic and international markets.
Lately, sisal fibers have also been used in the automotive sector and for specialist paper manufacturing, which contributed to the worldwide increase in fiber demand during recent years. Likewise an upward trend in the fiber production in Tanzania has been observed from the late nineties until 2008. However, this development was reversed after 2008, when the sisal market and industry were negatively affected by the global economic downturn. The Tanzanian production dropped about one-third from 2008 to 2009 and the amount of residues generated decreased accordingly (Figure 1, based on data from TSB, 2010).
2 There is no universally accepted definition of sustainability.
In this paper the focus areas are socio-economic and environmental sustainability. Economic aspects require further research and will not be considered here, because the economics of biofuels depend on multiple site specific and outside factors and because biofuels are part of two of the most controlled and subsidized markets in the world (agriculture and energy),
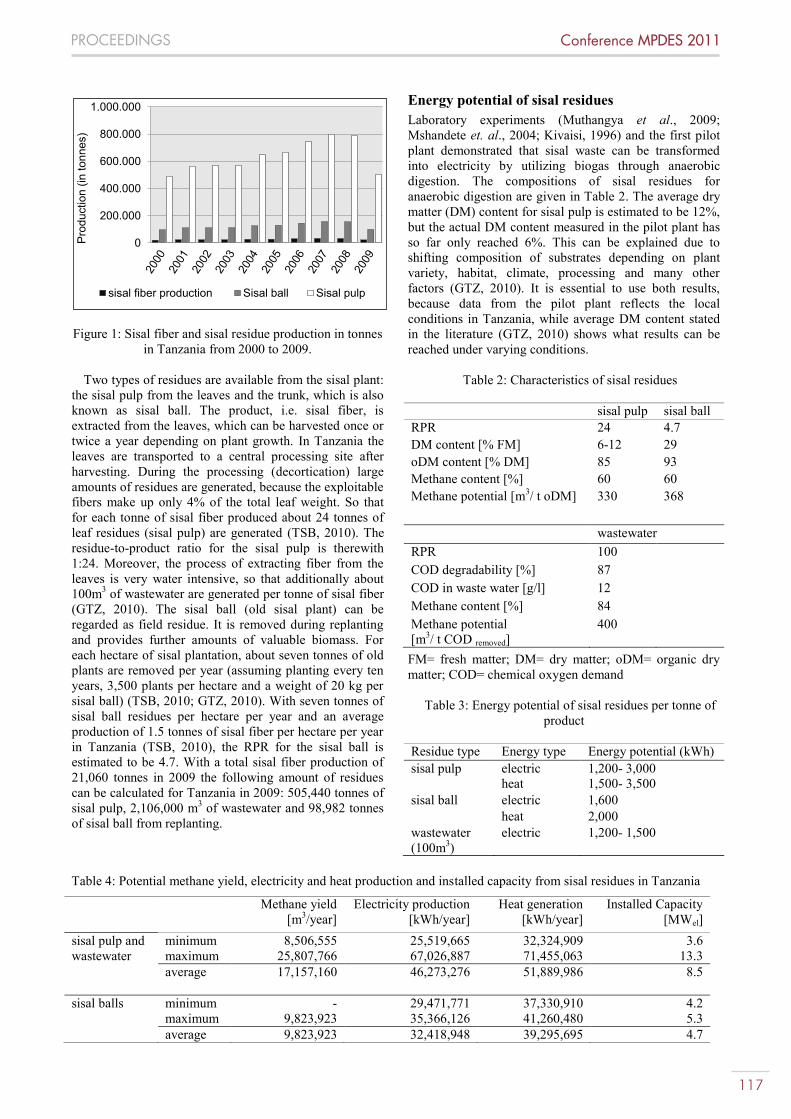
117
PROCEEDINGS Conference MPDES 2011
Table 4: Potential methane yield, electricity and heat production and installed capacity from sisal residues in Tanzania
Figure 1: Sisal fiber and sisal residue production in tonnes in Tanzania from 2000 to 2009.
Two types of residues are available from the sisal plant:
the sisal pulp from the leaves and the trunk, which is also known as sisal ball. The product, i.e. sisal fiber, is extracted from the leaves, which can be harvested once or twice a year depending on plant growth. In Tanzania the leaves are transported to a central processing site after harvesting. During the processing (decortication) large amounts of residues are generated, because the exploitable fibers make up only 4% of the total leaf weight. So that for each tonne of sisal fiber produced about 24 tonnes of leaf residues (sisal pulp) are generated (TSB, 2010). The residue-to-product ratio for the sisal pulp is therewith 1:24. Moreover, the process of extracting fiber from the leaves is very water intensive, so that additionally about 100m3 of wastewater are generated per tonne of sisal fiber (GTZ, 2010). The sisal ball (old sisal plant) can be regarded as field residue. It is removed during replanting and provides further amounts of valuable biomass. For each hectare of sisal plantation, about seven tonnes of old plants are removed per year (assuming planting every ten years, 3,500 plants per hectare and a weight of 20 kg per sisal ball) (TSB, 2010; GTZ, 2010). With seven tonnes of sisal ball residues per hectare per year and an average production of 1.5 tonnes of sisal fiber per hectare per year in Tanzania (TSB, 2010), the RPR for the sisal ball is estimated to be 4.7. With a total sisal fiber production of 21,060 tonnes in 2009 the following amount of residues can be calculated for Tanzania in 2009: 505,440 tonnes of sisal pulp, 2,106,000 m3 of wastewater and 98,982 tonnes of sisal ball from replanting.
Energy potential of sisal residues Laboratory experiments (Muthangya et al., 2009; Mshandete et. al., 2004; Kivaisi, 1996) and the first pilot plant demonstrated that sisal waste can be transformed into electricity by utilizing biogas through anaerobic digestion. The compositions of sisal residues for anaerobic digestion are given in Table 2. The average dry matter (DM) content for sisal pulp is estimated to be 12%, but the actual DM content measured in the pilot plant has so far only reached 6%. This can be explained due to shifting composition of substrates depending on plant variety, habitat, climate, processing and many other factors (GTZ, 2010). It is essential to use both results, because data from the pilot plant reflects the local conditions in Tanzania, while average DM content stated in the literature (GTZ, 2010) shows what results can be reached under varying conditions.
Table 2: Characteristics of sisal residues
sisal pulp sisal ball RPR 24 4.7 DM content [% FM] 6-12 29 oDM content [% DM] 85 93 Methane content [%] 60 60 Methane potential [m3/ t oDM] 330 368 wastewater RPR 100 COD degradability [%] 87 COD in waste water [g/l] 12 Methane content [%] 84 Methane potential [m3/ t COD removed]
400
FM= fresh matter; DM= dry matter; oDM= organic dry matter; COD= chemical oxygen demand
Table 3: Energy potential of sisal residues per tonne of
product
Residue type Energy type Energy potential (kWh) sisal pulp electric 1,200- 3,000 heat 1,500- 3,500 sisal ball electric 1,600 heat 2,000 wastewater (100m3)
electric 1,200- 1,500
0
200.000
400.000
600.000
800.000
1.000.000
sisal fiber production Sisal ball Sisal pulp
Pro
duct
ion
(in to
nnes
)
Methane yield [m3/year]
Electricity production [kWh/year]
Heat generation [kWh/year]
Installed Capacity [MWel]
sisal pulp and wastewater
minimum 8,506,555 25,519,665 32,324,909 3.6 maximum 25,807,766 67,026,887 71,455,063 13.3 average 17,157,160 46,273,276 51,889,986 8.5
sisal balls minimum - 29,471,771 37,330,910 4.2 maximum 9,823,923 35,366,126 41,260,480 5.3 average 9,823,923 32,418,948 39,295,695 4.7

118
PROCEEDINGS Conference MPDES 2011
Taking these different parameters into account, the electricity and heat potentials per tonne of produced sisal fiber was calculated (Table 3). It is shown that all three residue types comprise noteworthy energy potentials. The accumulated potential of methane and electricity generation from sisal pulp, wastewater and sisal balls and the potential capacities in Tanzania for 2009 is presented in Table 4. The results for the best and a worst case scenario deviate strongly because of differing values reported in literature and known from practice. This illustrates the wide margin of possible fluctuations and the interrelated risks that need to be considered when running biogas plants with sisal residues as substrate. In light of these results the viability of initiatives proposed by the private sector (UNEP Risoe Centre, 2009) i.e., to generate 5-10MW electricity in the next five to ten years using only a small portion of the country-wide sisal residue potential, might need careful reconsideration.
Current uses and availability of sisal residues In a country like Tanzania, were grass productivity is low and fertilizer costs are high, using crop residues as fodder or fertilizer has to be the priority and only surplus material ought to be converted into electricity. Sisal residues however, are not yet utilized for any purpose in Tanzania, besides the small amount of residues used for electricity generation in the biogas pilot plant. The liquid nature of the residues has so far been regarded as restriction for any other uses. But trials in Kenya showed that fresh sisal waste could possibly be fed to cattle as a supplement to natural pastures if the moisture content is reduced (United Nations Industrial Development Organization [UNIDO], 2005). If in the future sisal residues are to be used as animal fodder, the amount of residues available for sustainable electricity generation will be limited accordingly.
The actual available amount of sisal pulp and waste water depends on the fiber production levels, which touched bottom in Tanzania 2010. But with the economy recovering and the price for sisal fibers rising up to US$1,050-1,200 per tonne between September and November 2010 (TSB, 2010), it is possible that production levels will rise again in the coming years. A production increase would result in a higher amount of available residues. In addition, the amount of fibers and therewith residues, could also be increased by improving the farming habits. On most estates so far neither fertilizer is used nor is land preparation done in order to improve yields and quality. Sisal yields on well-prepared land are about two tonnes per hectare per year in Tanzania compared to only one tonne per hectare per year on unprepared land. The use of organic fertilizer, that could for instance be obtained as by-product from the biogas production process (UNIDO, 2005), could further improve soil fertility and increase sisal yields. Applying these options to increase productivity would result in an excess amount of sisal pulp available for electricity generation. Sisal balls are currently not available as feedstock for energy generation. If this residue type should be utilized it implicates additional logistic efforts and expenses, as the balls are field residues and so far not collected but burnt or broken down and plowed under.
Assessment of environmental risks and opportunities The use of agricultural residues for energy purposes has the advantage of avoiding direct land-use competition with existing land uses and greenhouse gas emissions from land-use changes. But emissions from current waste incineration and the amount of residues which could be sustainably removed from the fields remain a concern (WBGU, 2009; UNEP, 2009). Greenhouse gas emissions Sisal residues are currently not properly disposed in Tanzania, if waste disposal is defined as the management of waste for the duration of its biological and chemical activity to prevent negative effects on the environment. Sisal waste is left on the bare soil from where wastewater leaks out into the soil and close by water bodies. The residues decomposing in the open lead to the formation of methane (CH4) that is released into the atmosphere. Because methane is 25 times more potent has a GHG than carbon dioxide (CO2), it contributes heavily to atmospheric warming and the associated negative effects on our environment (Wesselak & Schabbach, 2009). The estimated 505,440 tonnes of sisal pulp produced in 2009 generate methane emission over the next ten years that are equivalent to 184,622 tonnes of CO2 emissions. By using anaerobic treatment inside a closed digester these emissions can be avoided or at least be reduced. This would significantly reduce lifecycle GHG emissions and contributing to climate change mitigation.
Water use and water quality Agricultural based economies like Tanzania require large amounts of water for irrigation and crop processing. Up to 90% of the total water withdrawals in Tanzania are accounted for by the agriculture sector of which the largest amount is used for irrigation purposes (FAO AQUASTAT, 2010). Growing sisal however, does not require irrigation, as the sisal plant is drought resistant and cultivated as rain fed crop. But the processing of sisal leaves is very water intensive and in average 100m3 of water are used to produce one tonne of fiber (GTZ, 2010). Reducing this amount of water would be beneficial in terms of environmental sustainability as well as in terms of energy generation. In particular in Tanzania where water is a scare resource, reducing the overall water use is an important requirement if the biomass production aims to be sustainable (RSB, 2010).
The utilization of sisal residues has the additional benefit that ground and surface water pollution is significantly reduced (Common Fund for Commodities [CFC], 2004). Because at present water from the sisal production is simply drawn off to nearby water sources, being the main origin of water pollution in regions with high sisal production. Utilizing and treating sisal pulp and wastewater therewith directly benefits the environment and helps to fulfill the sustainability requirement that biomass production, should not lead to contamination of water sources (RSB, 2010).

119
PROCEEDINGS Conference MPDES 2011
Biodiversity According to the RSB standards, biofuel operations shall avoid negative impacts on biodiversity, ecosystems, and other conservation values (RSB, 2010). Although the use of sisal residues has no direct effects on biodiversity, the cultivation of the sisal plant itself surely has.
The degree of biodiversity in agricultural ecosystems depends on the diversity of vegetation within and around the agro-ecosystem, permanence of crops and intensity of management (Southwood & Way, 1970). With regard to these factors, agricultural monocultures are known to significantly reduce biodiversity by replacing nature’s diversity with a small number of cultivated plants (Altieri & Nicholls, 2004). Most common shortcomings arising from monoculture cultivations include displacement of natural vegetation, nutrient losses, intensive use of fertilizer and pesticides. Today, sisal like most commercial crops in Africa is almost exclusively grown in monocultures. It dominates the scenery in the sisal growing regions in Tanzania. In Tanga, the main sisal growing region of Tanzania, 67% of the cultivated land is planted with sisal (Table 5). But compared to other cash crops sisal is grown rather extensively than intensively. Despite the fact that neither chemical fertilizer is applied nor pesticides are used, due to the absence of plant diseases that would affect fiber production, monoculture cultivations of sisal significantly reduced the biodiversity in the sisal growing regions of Tanzania. Risks of additional biodiversity loss exist, if expansion and intensification are undertaken to generate additional residues for energy purposes. However, the use of currently generated residues does not implicate further biodiversity losses.
Table 5: Indicators for biodiversity in agricultural
ecosystems
Indicator
Agricultural area per crop [ha] 188,1311 Average area per estate [ha] 34842 Number of plants per ha 3,000- 4,000 Land cultivated with sisal [% cultivated area]
Total: 3.7 (Regions: Tanga 67; Morogoro 23; Kili-
manjaro 6; Mara 4)2 Dominance of non-domesticated species to domesticated species
High in Tanga and Morogoro
Use of agricultural pesticides none Use of agricultural fertilizers none
1 (Tanzania Agriculture Sample Census 2003) 2 (TSB, 2010)
Soil health Agricultural residues contain nutrients and maintain soil carbon content and fertility. They also provide protection against erosion and can contribute to soil biodiversity (UNEP, 2009). Therefore, environ-mentally sustainable biomass operations should implement practices that seek to maintain soil health to and/or reverse soil degradation (RSB, 2010). In particular,
it needs to be carefully observed to what extent residues can be removed and what quantities have to remain on the field in order to maintain the nutrient cycle.
As mentioned before sisal is mainly grown on monoculture plantations. These plantations often exist for decades, continuous cultivating sisal without adding fertilizer. Although no soil pollution is caused from chemical fertilizer, this cultivation practice also implies that the soil is impoverished. Moreover, almost no residues are left on the field to provide nutrients. The only residues that remain on the field after a lifecycle of about 10 years are the sisal balls and these are often also burnt on the field. Hartemink (1996, 1997) studied the nutrient balance under monocropping sisal in the absence of fertilizers in Tanzania. He observed that both nutrient balance and soil nutrient contents showed a serious shortfall for each nutrient. The absolute largest decrease was found in the soil nitrogen content, resulting in decreasing yields per hectare. Using sisal residues to generate biogas could improve the nutrient regime, since the digestate from biogas generation can be used as organic fertilizer (Kaltschmitt et al. 2009). Trials on test fields in Tanzania have verified that using sisal digestate as fertilizer improves soil fertility and increases sisal yields. While in practice the logistics of distributing the digestate to the fields still constitute an obstacle. But theoretically the utilization of sisal residues for energy generation can contribute to improving the environmental sustainability and economic performance of sisal production.
Assessment of socio-economic risks and opportunities In producing and using bioenergy, a number of socio-economic factors need to be taken into account if the requirements for sustainable development are to be met (WBGU, 2009). These aspects need to be especially careful assessed in developing countries, where the agricultural sector plays a key role for economic and social progress. Although decentralized energy generation with agricultural residues has potential to provide the rural poor with multiple benefits, no guarantee exists that activities help to satisfy local development needs. The sustainable biomass principles therefore require that in regions of poverty, biofuel production shall contribute to social and economic development and ensure the human right to adequate food and livehood (RSB, 2010). Improved access to basic services Availability of clean and affordable energy is fundamental to reduce poverty and increase pro poor growth. Like in most developing countries the rural population in Tanzania has very limited access to modern energy services. Hence, agricultural residues that are primarily available in rural areas are a potential feedstock for decentralized energy generation.
Compared to the processing of crops, like sugarcane with five processing sites or coffee with four major processing sites, sisal processing is more decentralized with 35 processing sites operating in Tanzania in 2010 (TSB, 2010). In theory the available electricity potential from sisal pulp and wastewater residues is sufficient for

120
PROCEEDINGS Conference MPDES 2011
an installation of about 8.5MW capacity and can provide more than 10,000 rural households with electricity (estimating consumption to be 800kWh per person per year and six persons per household). But in practice it is not certain that access to electricity services will increase locally. Connecting the local population requires additional investments, because establishing mini-grids is cost intensive and collecting fees requires additional work efforts and increases costs. Even subsidies of US$500 for each newly establishes electricity connection are offered by the Rural Energy Agency of Tanzania (established by the Rural Energy Act 2005) to make mini-grids more attractive for private sector investments, most investors hesitate to invest in rural electrification. Consequently most involved stakeholders expect the more likely scenario to be, that power is primarily used to run factories and surplus electricity is fed into the grid, as the majority of processing sites already have a connection to the national grid. This development will be further enhanced by the Standardized Small Power Purchase Agreements (SPPA) coming into place in 2008. The agreement offers small independent power producers standardized contracts and fixed prices for electricity sales to the national electric supply company TANESCO, making the administrative process of feeding electricity into the national more simple. But even if electricity generation from sisal residues will most likely not directly improve access to energy services; it can contribute to reducing the constant power shortfalls in the country.
Income generating opportunities Bioenergy utilization is expected to benefit rural laborers by offering them employment in raising biomass or working at the bioenergy facility. However, the rural poor do not automatically benefit from these income opportunities. The question is, if the adoption of biogas technology in the sisal sector will result in additional local employment and capacity building.
The sisal industry in Tanzania is dominated by large scale plantations with recent developments towards outgrower schemes3. The gross of the workforce in the sisal sector can therefore be divided in two groups: plantation workers and outgrowers. Workers employed on the plantation do not own any resources so they do not directly benefit from value adding activities like power generation from the residues. Outgrowers sell the entire sisal leaves to the processing companies so they neither have a stake in the major residue, the sisal pulp. Yet they do own the sisal ball residues, but presumably this residue type will not be utilized until a later stage of biogas developments. So the only potential benefit for smallholder outgrowers in the near future might come from higher sisal prices due to the fact that residues become a valuable energy source.
However, this development is uncertain, because poor rural farmers typically operate in a buyer’s market with imperfect information. Awareness raising and information campaigns could help to enable outgrowers to participate
3 This Outgrower schemes can be defined as contract faming
with binding arrangements through which companies ensures their supply of agricultural products by individual or groups of farmers (Felgenhauer & Wolter 2008).
in the benefits electricity generation with residues offers to the sisal sector.
Compared to the limited new income opportunities for the rural population in sisal harvesting and processing, direct and permanent employment potential exists at the biogas facilities. Utilizing the technical realizable electricity potential of sisal residues could create between 65 to 764 new jobs in the decentralized rural areas of Tanzania (assuming biogas plants with 500kW capacity; operating 7,000 hours per year; running each plant with three work shifts per day and 3-7 workers per shift). Table 6 presents an overview of the possibilities and limitations of employment in biogas generation with sisal residues for the rural population.
Table 6: Selected indicators for income generating
opportunities in the context of biogas production with sisal residues in Tanzania
Indicator1
Jobs/€ million invested
[Assumption: 8.5 MW capacity; investment per kW €2,500 – 4,000; 65-764 jobs created]
2.4 – 27.8
Jobs/ 1000ha [Assumption: 188,131ha; 65-764 jobs created]
0.35 – 4
Seasonality operation all year round Accessibility to local laborers
mainly as unskilled labor, but technical training opportunities possible
Development of markets for local farm and non-farm products
no, most parts of equipment will be imported
Local recycling of revenue (through wages, local expenditures, taxes)
limited
1 (Domac, 2005)
In addition, temporary employment opportunities will be created in the fields of planning, manufacturing and construction of biogas facilities. Parts of the potential jobs require skilled labor forces. The acute shortage of trained technical professionals in the country could therefore prove to be a barrier for biogas development. The lack of skilled labour force also implicates that components are most likely imported and foreign experts are employed, reducing the profits and the benefits for the local population. Being aware of this problem a training center for biogas and biomass has been established in cooperation with private and public partners from Tanzania and Germany. So far one course for stakeholders was conducted rather than actual education of technicians that would be able to run biogas plants.

121
PROCEEDINGS Conference MPDES 2011
Land use competition and food security Biogas production based on agricultural residues like sisal has only small impact on domestic food availability and causes little competition with existing land uses. Energy pathways utilizing agricultural residues, including sisal residues, should therefore be given priority over food crop and energy crop cultivation for energy generation.
Risks of extensive expansion of sisal cultivation areas to use the residues for energy generation and, in turn, potential land-use competition, are limited. The land currently in use for sisal cultivation is only a fraction of that dedicated to growing sisal over the last decades. On many estates sufficient parts of this land lie fallow, so that sisal production could be expanded without negative effects on food security. Only a massive increase in production could lead to land-use competition, but so far there are no indications of such a development. Although it could be argued that the land currently used for cash crops like sisal should be converted into land for food production. But sisal grows on dry and by now infertile soils that are often unsuitable for other crops. Furthermore agriculture commodities like sisal are Tanzania’s most important export products providing a major source of capital income for the country. So the replacement of sisal would not add to environmental or socio-economic sustainability.
Overview of selected sustainability aspects relevant for energy generation with sisal residues Table 7 summarizes environmental and socio-economic sustainability aspects examined in this study. It is shown that electricity generation with sisal residues can be sustainable, if the right actions are taken. Moreover, if sisal residues are utilized for energy purposes, sustainability can be improved by reducing multiple environmental problems caused by the current form of sisal production in Tanzania. Only biodiversity is unlikely to increase as long as sisal is grown in monocultures. But initiated developments towards small holder sisal farming might in the future increase the amount of sisal grown in intercropping systems.
Table 7: Overview of effects on environmental and socio-economic sustainability in Tanzania
Sustainability criteria
Sisal fiber production – growing and processing
Using sisal residues for energy generation
Envi
ronm
enta
l
Greenhouse gas emissions ++
Water use & water quality -- +
Biodiversity -- Soil health -- +
Soci
o-ec
onom
ic
Improved access to basic services -/+
Income generating opportunities +
Land use competition & food security
++
++ very positive; + positive; +/- can have positive or negative effects depending on implementation; - negative; -- very negative.
Recommendations From this analysis it is evident that agricultural residues like sisal waste should be acknowledged as part of an alternative strategy to provide modern energy services to rural Tanzania. It is recommend that:
Bioenergy policy priorities in Tanzania that currently primarily focus on energy crops should be revised accordingly. Electricity and heat production from agricultural residues need to be recognized as sustainable, decentralized energy option.
To successfully adapt biogas technology in the sisal sector, it is necessary to built up local technical capacities. Skilled labor is not only needed to plan, built and manage but in particular to operate biogas plants. Local capacity building and knowledge transfer is a key component for sustainable development.
Further research on information, policy, financial and institutional barriers needs to be conducted. These factors are essential components on whether the demonstrated technical potential can be realized in praxis or not.
To ensure social sustainability of cogeneration with sisal residues it is necessary to explore options to use excess energy locally, such has mini-grids and direct biogas supply for cooking to neighboring rural households.
Discussion Generally, assessments of bioenergy potentials focus largely on environmental factors whereas social aspects are taken into account far less frequently. Within the environmental dimension, biodiversity and climate aspects are overrepresented while soil and water aspects

122
PROCEEDINGS Conference MPDES 2011
are often omitted (Smeets et al., 2009). With respect to these observations this study tries to extend the scope to social aspects as well as to the effects on soil and water.
Compared to other residues like bagasse from sugarcane, the country specific potential of sisal residues as energy source has not been studied with regards to sustainability and availability. Both Kivaisi (1996), who determined the methane yield and electricity potential, and Salum (2008), who evaluated the Clean Development Mechanism (CDM) potential of energy generation using sisal residues on four estates, indicated that a sufficient potential exists. But questions remain regarding the amount of different residue types and the sustainability of their use. Hence, the scope of this study was to conduct an independent assessment of the potential of sisal residues for electricity generation in Tanzania and to emphasize the multiple factors that influence availability and sustainability. In particular, the theoretical, technical and exploitable energy potentials have been differentiated and it has been found that sufficient amounts of sisal residues exist to generate electricity and heat. Even if initially only the available processing residues of sisal are used, if the dry matter content remains low and if the production levels continue to be low, the potential is adequate to generate 3.6MW electricity per year. These results are similar to the outcome of a technical potential assessment in Kenya (GTZ, 2010).
Utilizing this potential implies environmental and socio-economic risks as well as opportunities. If the energy generation from sisal residues aims to be sustainable, these factors need to be taken into consideration. The assessment of selected criteria’s showed that the use of sisal residues for electricity generation would lead to numerous opportunities and an improvement of the current situation with environmental and socio-economic risks being limited. The quantification of this sustainably available amount of residues for electricity generation and evaluating the economic sustainability go beyond the scope of this study. Because both aspects are strongly site specific and this study is limited to an overall assessment of the country specific potential, therefore it cannot reflect explicit local conditions. Further this study is limited to examining the biogas potential for anaerobic digestion of sisal residues as only substrate (mono-fermentation). Adding other substrates can improve biological and chemical conditions and lead to an increase of biogas yields and electricity output. Nevertheless, these results can serve as input for site specific sustainability assessments of locally available potential and help create awareness among potential investors and policy makers about the viability of biogas from sisal residues as a source for electricity generation.
References Altieri, M. A. & Nicholls C. I. (2004). Biodiversity and
pest management in agroecosystems.Binghamton, NY: Food Products Press.
CFC - Common Fund for Commodities. (2004). Product and market development of sisal and henequen. Kenya – Tanzania. January 1997 – December 2005. Vienna: United Nations Industrial Development Organization.
Domac, J. (2005). Socio-economic drivers in implementing bioenergy projects. Biomass and Bioenergy 28 (2005), 97–106.
FAO - Food and Agriculture Organization of the United Nations. (2010). Bioenergy and food security. The BEFS analysis for Tanzania. Environment and natural resources management working paper 35. Rome: The Bioenergy and Food Security Project/ Food and Agriculture Organization of the United Nations
FAO - Food and Agriculture Organization of the United Nations. (2009). FAO Fibres Statistical Bulletin 2009. Rome. Food and Agriculture Organization of the United Nations.
FAO & AGAL - Food and Agriculture Organization of the United Nations & Livestock Information, Sector Analysis and Policy Branch . (2005): Livestock sector brief. United republic of Tanzania. Rome: Food and Agriculture Organization of the United Nations.
FAO AQUASTAT - Food and Agriculture Organization of the United Nations Information System on Water and Agriculture. (2010): FAO's global information system on water and agriculture. Rome: Food and Agriculture Organization of the United Nations. Retrieved December 04, 2010, from: http://www.fao.org/nr/water/aquastat/main/index.stm.
FAOSTAT - Food and Agriculture Organization of the United Nations Statistical Information. (2010): Agriculture production. Rome: Food and Agriculture Organization of the United Nations. Retrieved December 04, 2010, from: http://faostat.fao.org/.
Felgenhauer, K. & Wolter, D. (2008). Outgrower Schemes – Why Big Multinationals Link up with African Smallholders. Paris: OECD. Retrieved December 04, 2010, from: http://www.oecd.org/dataoecd/47/27/41302136.pdf.
GTZ - German Technical Cooperation. (2010): Agro-industrial biogas in Kenya. Potentials, estimates for tariffs, policy and business recommendations. Berlin: German Technical Cooperation.
GTZ - German Technical Cooperation. (2005). Liquid biofuels for transportation in Tanzania. Potential and implications for sustainable agriculture and energy in the 21st century. Eschborn: German Technical Cooperation.
Hartemink, A. (1997). Input and output of major nutrients under monocropping sisal in Tanzania. Land degradation and development. 8, 305-310.
Hartemink , A. et al. (1996). Soil fertility decline and fallow effects in ferralsols and acrisols of sisal plantations in Tanzania. Expl. Agriculture, 32, 173-184.
IEA - International Energy Agency. (2008). World energy outlook 2009. Electricity access database (2008 data country-by-country). Paris: Organisation for Economic Co-operation and Development/ International Energy Agency.
Kaltschmitt, M. et al. (2008). Energie aus Biomasse. Grundlagen, Techniken und Verfahren. Heidelber, London, New York: Springer.
Kivaisi, A. K. (1996). The potential of agro-industrial residues for production of biogas and electricity. Renewable Energy (1-4), 917-921.
Koopmans, A. & Koppejan, J. (1998). Agricultural and foerest residues. Generation, utilization and availability.

123
PROCEEDINGS Conference MPDES 2011
Kuala Lumpur, Malaysia: Paper presented at the Regional Consultation on Modern Applications of Biomass Energy, 6-10 January 1997.
Marrison, I. & Larson, E. D. (1996). A preliminary estimate of the biomass energy production potential in Africa in 2025. Considering projected land needs for food production. Biomass and Bioenergy, 10, 337-351.
MEM – Ministry of Energy and Minerals Tanzania. (2010). Overview of energy sector 2010. Dar es salaam: Ministry of Energy and Minerals Tanzania.
Mshandete, A. M. et. al. (2004). Anaerobic batch co-digestion of sisal pulp and fish wastes. Bioresource Technology 95, 1, 2004, 19-24.
Muthangya, M. et al., (2009). Two-Stage fungal pre-treatment for improved biogas production from sisal leaf decortication residues. International Journal of molecular science. 10(11), 2009, 4805–4815.
Rosillo-Calle, F. (2007): The biomass assessment handbook. Bioenergy for a sustainable environment. London. Earthscan.
RSB - Roundtable on Sustainable Biofuels. (2010). Principles & criteria for sustainable biofuel production. Lausanne: Roundtable on Sustainable Biofuels.
Salum, A. (2008): Analysis of Possibility of CDM Through Biogas Production and Electricity Generation From Sisal Waste in Tanzania. Master's thesis. Aalborg University, Denmark.
Smeets, E. M. W. et al. (2009): A review and harmonization of biomass resource assessments. Hamburg, Germany: Proceedings, 17th European Biomass Conference and Exhibition - From Research to Industry and Markets, 29 June - 3 July 2009.
Smeets, E. M. W. et al. (2007). A bottom-up assessment and review of global bio-energy potentials to 2050. Progress in Energy and Combustion Science, 33, 56–106.
Smeets, E: M. W. et al. (2004) A quickscan of global bio-energy potentials to 2050. An analysis of the regional availability of biomass resources for export in relation to the underlying factors. Utrecht: Copernicus Institute - Department of Science, Technology and Society Utrecht University.
Southwood, R. E. & Way, M. J. (1970). Ecological background to pest management. In: Rabb, R. C. & Guthrie, F. E. (Eds.). Concepts of Pest Management. Raleigh, NC: North Carolina State University. 6–29.
Tanzania Agricultural Sample Census. (2003): National Sample Census of Agriculture 2002/ 2003. Crop sector national report. Dar es salaam: National Bureau of Statistics, Ministry of Agriculture and Food Security, Ministry of Water and Livestock Development, Ministry of Cooperatives and Marketing, Presidents Office, Regional Administration and Local Government, Ministry of Finance and Economic Affairs – Zanzibar.
TSB - Tanzania Sisal Board. (2010). Unpublished data. Tanga: Tanzania Sisal Board.
TSB - Tanzania Sisal Board. (2009). Statistics. Tanga: Tanzania Sisal Board. Retrieved December 04, 2010, from http://www.tsbtz.org/Statistics.html.
UNEP - United Nations Environment Programme. (2009). Towards sustainable production and use of resources –
Assessing Biofuels. Nairobi: United Nations Environment Programme
UNEP - United Nations Environment Programme- Risoe centre. (2009). CDM project portfolio – Tanzania. Retrieved March 11, 2011 from http://cd4cdm.org/sub-Saharan%20Africa/Tanzania/Portfolio/CDMprojectPortfolio_Tanzania.htm.
UNFCCC - United Nations Framework Convention on Climate Change. (2006): Methodological tool. Tool to determine methane emissions avoided from disposal of waste at a solid waste disposal site (Version 05). Retrieved December 04, 2010, from: http://cdm.unfccc.int/methodologies/PAmethodologies/tools/am-tool-04-v5.pdf
UNIDO - United Nations Industrial Development Organization. (2005). Electricity, Heat and Fertilizer from Sisal- Biogas and Waste. United Nations Industrial Development Organization. Vienne: Retrieved December 04, 2010, from http://www.unido.org/index.php?id=6464.
WBGU – German Advisory Council on Global Chnage. (2009). World in Transition – Future Bioenergy and Sustainable Land Use. London: Earthscan.
Wesselak, V. & Schabbach, T. (2009). Regenerative Energietechnik. Heidelberg, London, New York: Spinger.
World Bank. (2010). Energy in Africa: Overview. Washington, DC: The World Bank Group.

124
PROCEEDINGS Conference MPDES 2011
OPPORTUNITIES AND CHALLENGES FOR SOLAR HOME SYSTEMS IN TANZANIA FOR RURAL ELECTRIFICATION
The case of kondoa district
John P. John ([email protected]) Mbeya Institute of Science and Technology, Department of Electrical and Electronics Engineering
P. o. box 131, Tanzania
Moses Mkumbwa ([email protected]) University of Dar es Salaam, Department of Mechanical and Industrial Engineering
P. o. box 35131, Tanzania
Abstract The cost of delivering Energy from PV cells to a household is a fundamental characteristic in energy generation technologies. It can be influenced by the PV system design, performance, size, and the technology of the system components. The aim of this paper is to present opportunities and challenges identified on the study conducted for solar home systems (SHS). The study was conducted in Kondoa rural area where 7 out of 177 villages were considered with a total sample of 61 households. The research involved field visits, inspection of PV Systems, observation, interviewing end users and questionnaires. The study considered both economic and technical parameter influences. On the other hand economic viability of solar PV system was evaluated using replacement cost of kerosene, small petrol generators and disposable dry batteries. The life cycle cost (LCC) analysis of the components was employed as well as the effect of discount and inflation rate sensitivity analysis. The research findings show that kerosene is the most dominant source of energy for lighting in Kondoa rural area while electric energy use is characterized by low consumption. Wrong system sizing and installation was the major cause of poor performance. Nevertheless, comparison between solar PV systems with other mentioned alternatives indicated to be more cost effective than others at the smallest scale. This study revealed that not only economic parameters but also technical parameters have major impact on the viability and sustainability of SHS for rural electrification.
Keywords: Solar home systems (SHS); Economics; Rural electrification; Technical parameters.
Introduction Around two billion people, mostly in developing countries, have remained in the earlier stages of human development, therefore they still rely on fire wood, or kerosene lamps to light their paths and their homes at night (Luque & Hegedus, 2003). Worldwide it is approximated that about 2.6 billion people in rural areas do not have electricity (Terrado et al., 2008). Modern means of communication and entertainment are either not known to them or are a distant possibility. Illiteracy denies most of rural people any possibility of gaining access to better opportunities, like proper information about solar PV technology which could provide them with electricity hence improving their life standard.
The majority of people living in rural Tanzania do not have access to electricity. Grid connection in mainland Tanzania is 12% in urban area and only 2.5% in rural area (HBS, 2007). Electricity is still the most common source
of household energy for lighting in urban area, but kerosene use has increased (NBS, 2009). Electricity consumption per capita is still low, estimated at 85kWh per year compared with 432kWh and 2,176kWh for Sub-Saharan Africa and world averages respectively (PHDR, 2009). In rural areas, paraffin is the fuel used most often for lighting. About 83% of rural households use paraffin for lighting (HBS, 2007). Biomass is the main source of energy for cooking. About 95.8% of the population use firewood and charcoal, and among rural households, the use of charcoal for cooking is about 7% (PHDR, 2009).
Due to above prevailing situation, the Tanzania government is taking various measures to address rural electrification (URT, 2003). The most recent effort includes the preparation of Rural Electrification Master plan. Currently the government has founded the Rural Energy Agency (REA) which assumes the responsibility for promoting, stimulating, facilitating and improving modern energy access for productive use in order to stimulate rural economic and social development, by utilizing the Rural Energy Fund (REF) and other available source to finance eligible rural energy project. Along with the government rural electrification agenda there are a lot of efforts made by NGO’s such as TASEA, TaTEDO and international organisations such as UNDP, World Bank, and the Swedish International Development Agency (Sida) to support rural electrification by promoting renewable energy based-including solar PV programmes.
Besides all these effort, the utilization of solar energy technology has been slower in Tanzania due to some barriers. The major barriers include high initial cost of solar PV systems, low purchasing power of intended end users, and limited application of PV technology for powering enterprising activities (Kassenga, 2008; URT, 2003). Other barriers include lack of enough and appropriate technical support for installation and maintenance, and quality of technology (Importation of sub-standard solar home system components). However, the capital cost depends on the size, site and technology of the PV system components (Patel, 2006).
The most familiar delivery mechanism for electricity is the conventional power grid which consists of generation facilities, long-distance transmission lines, and local distribution equipment. Other energy sources such as PV systems, batteries, diesel/petrol engines, kerosene, candles, wood, and agricultural residues, have also been playing part in rural energy service provision.

125
PROCEEDINGS Conference MPDES 2011
The Tanzania national grid generation sources comprise mainly of hydropower, gas turbines and diesel generating plants (URT, 2003). Grid-based power is the least-cost option for large concentrations of household or productive loads. It offers substantial economies of scale, owing to the large fixed-cost investment in distribution lines and generation facilities. However, grid solutions require a minimum threshold level of electricity demand and certain load densities to achieve these economies of scale (Sørensen, 2004; Luque & Hegedus, 2003). On the other hand, deciding whether the grid or solar PV is the least-cost option for supplying electricity to rural areas requires attention to distance from grid, resource availability, equipment availability, community organization, income level, household service level, total number of households to be served, load density, productive loads and load growth ( Kalogirou, 2009; Patel, 2006 ).
Some Facts about Kondoa Kondoa district is located along latitude 4o 54’ 0 S, longitude 35o46’60 E and altitude 1405 meters.1 The district is characterized by semi-arid to sub-humid conditions. The mean maximum and minimum temperatures are 29° C and 16° C respectively which provide favorable conditions for solar module operation (Foster et al., 2010). Mean annual rainfall varies between 600 and 900 mm. Rainfall in Kondoa District is generally low and unreliable. There are two marked seasons namely the hot dry seasons (June to November), and the cool wet season (December to May). During the hot dry season, domestic and livestock water supplies in the district become so scarce that people must travel long distance in search of water. The district is frequently cited as a classic example of severely degraded land due to deforestation caused by tsetse fly eradication programmes, shifting cultivation, uncontrolled fires, wood fuel and overgrazing.
Kondoa district has a population of nearly 428,090 living in 91,500 households (NBS, 2002). About 87,500, or 95 percent, of these households are located in rural areas; the remaining 5 percent (roughly 4,000 households) are found in areas classified as peri-urban (Sonya et al., 2005). The district poverty rate is 24 percent; in other words, one quarter of the households has a consumption level below the basic needs poverty line (ibid). Poverty rate is significantly higher in rural than in peri-urban areas; while in rural areas the residents of 25 percent of households live under the basic needs poverty line, in peri-urban areas this proportion is only 6 percent (Sonya et al., 2005). The district has over ten ethnic groups with main activities ranging from crop production, livestock keeping, hunting and honey collection. Crop production and livestock keeping are the main economic activities. Various crops are grown both for subsistence and cash. The main crops are maize, finger millet, oil seeds, bulrush millet and sorghum. Other crops include beans, pigeon peas, sunflower, castor seeds, sesame, groundnuts and sugar cane with sweet potatoes mainly grown on alluvial fans and close to drainage lines. Only about 20% of the
1 http://www.fallingrain.com/world/TZ/0/Kondoa.html, 9/11/2009
farm produce is offered for sale. Food insecurity is a constant threat (Sida-MEM, 2009).
Institutions in Kondoa include 1 district hospital, 5 rural health centres, 67 dispensaries (14 are private), 218 primary schools, 9 out of 218 located in Kondoa town with 210 teachers and 209 in rural areas with 1705 teachers. The district has 57 secondary schools, 3 of them private and it is leading in terms of the numbers of secondary schools in Dodoma region. Most of these secondary schools are located in rural areas: 5 are located in towns with 213 teachers while 52 are in rural areas with 327 teachers. The district has two prisons centers, one located in Kondoa town and another in a rural area (King’ang’a), where there is no national electric grid. There is one teachers college and one technical college under Vocational Education Training Authority (VETA). Among 2,995 District Council employees, 2455 are teachers and 1918 out of 2455 are residing in rural areas. All these teachers and other government workers including government institutions residing in rural areas, where there is no electrical grid, are potential users of PV SHS and other stand alone renewable energy systems to substitute conventional sources of energy, especially for lighting and enabling the use of low power consuming appliances like radio, TV and mobile phone recharging.
Research Objectives Main Objective The main objective of this paper is to present the findings of a research conducted on economic evaluation of solar home systems for rural households in Tanzania, the case of Kondoa district in Dodoma Region (John, 2010).
Specific Objectives (i) To quantify available solar energy potential for
Kondoa. (ii) To study energy use patterns for rural residents
of Kondoa so as to characterize energy user needs and preferences.
(iii) To assess economic ability of rural inhabitants of Kondoa versus PV technology.
(iv) To plan and size solar PV systems suitable for Kondoa rural households.
Research Questions In this research work the following questions will be dealt with:
(i) What type of energy sources and appliances are found in rural areas?
(ii) Is PV power a cost –effective energy solution for rural households?
(iii) What are social-economic conditions that affect the use of solar PV systems for rural electrification in rural areas?
(iv) What sizes of solar PV systems are suitable for rural households?

126
PROCEEDINGS Conference MPDES 2011
Methods The study was conducted in Kondoa rural area where 7 out of 177 villages were considered with a total sample of 61 households. The study considered both economic and technical parameter influences. On the other hand economic viability of solar PV system was evaluated using replacement cost of kerosene, small petrol generators and disposable dry batteries. Life cycle cost (LCC) analysis of the components was carried out as well as discount and inflation rate sensitivity analysis.
Rural household Energy use pattern and characteristic data was obtained through interviews with the head of the relevant household or his/her representative. The questionnaires used in interviews provided information about the type of energy sources mostly used for lighting, quantity of fuel consumed, appliances mostly used, problems encountered related to the energy used and also people’s awareness of Solar PV technology. Secondary data was collected through visiting and reviewing various documents from government officials in the Ministry of Energy and Minerals, country offices of donor agencies, libraries, local and private dealers in Solar PV, the Tanzania Meteorological Agency and TANESCO.
The solar energy resource, load and system configuration data was used to size and evaluate system performance, energy output, and energy cost. Economic data was used to evaluate the economic viability of the system.
The rural households were categorized into low, medium and high income based on respondent’s annual energy consumption cost. The study obtained the number of households in each sampled village of Kondoa that are not electrified by grid and then determined the appropriate number of samples accordingly. A quasi-random or systematic sampling was employed (Kothari, 1990; Dawson, 2002). A total sample of 61 households was used in this study.
Criteria used to choose the case study area were; Low level of electrification, distance from the grid, rural communities with low family income, solar energy resource potentiality and data accessibility.
Results The following paragraphs summarize the results obtained from the research.
Kondoa Solar Energy Potential The result shows that Kondoa district has enough solar energy potential with annual average insolation of about 6.14kWh/m 2 /year (Figure 1). The available insolation can attract application of solar PV technology as an alternative for rural household’s electrification. The average solar energy potential in Tanzania is 4.0 – 4.5 kWh/m2/ day (Kimambo & Mwakabuta, 2005). The use of solar electricity seems to be an attractive option as the country enjoys the abundant sunlight. The amount of insolation influences the size of solar PV module, hence the balance of system components. For a given load energy demand, higher insolation will give small size of solar PV components and vice versa. Also the size of solar PV components will influence the initial investment
cost, for example 100W solar PV module will have high cost compared to 50W.
Figure 1: Kondoa Mean Monthly Solar Radiation for ten years (TMA, 2009)
Energy Resources and their Applications Energy resources mostly found in Kondoa rural area are biomass like wood and charcoal for cooking, kerosene for lighting, petrol for small generators and solar. Wind energy is used in small scale water pumps but it is not yet harvested for electricity generation. Also waste materials from animals and crops are not yet utilized for electricity generation using technology like biogas production.
Field data concerning the type of energy resources mostly used for lighting and powering low power consuming appliances found mostly in Kondoa rural households was analyzed by using Microsoft Excel software and results are shown in Figure 2. The results revealed that out of 61 respondents surveyed 82% use kerosene, 77.1% disposable dry batteries, 13.1% petrol and 11.5% SHS.
The results show that kerosene is the most dominant source of energy for lighting in the rural area of Kondoa followed by disposable dry batteries. This depicts the same result as previous studies (Cabraal et al., 1996, URT, 2003). The main reason is that kerosene and dry batteries are easily available in rural areas and well known by the people although their availability is sometimes affected by geographical factors and seasons which have direct impact on infrastructure, like roads for transportation. Over a short period of time the costs seem low but once evaluated over a long period of time and taking into considerations its effect for environment, it may not be cost effective.
The result shows that small petrol generators are more utilized by Kondoa rural households compared to solar PV system (Figure 2). High initial investment cost of solar PV system and lack of proper information about solar PV technology to rural people are among the major reasons for its low application (Amsalu et al., 2009). Because of their low investment cost, small petrol generators ranging from 650W to 800W capacity appear economically attractive. This small petrol generators cost between Tshs 130,000 and Tshs 160,000 (1$ = TShs 1500). However, calculating the lifetime cost shows that the expenses for

127
PROCEEDINGS Conference MPDES 2011
repair and maintenance of the generator and fuel costs add up to considerably high costs, leading to a situation in which photovoltaic very often is cost-competitive as it was revealed in economic analysis.
Figure 2: Types of Energy Source Used by Households.
Load Characteristics of Rural Households in Kondoa The result shows that lighting is the dominant load for rural residents of Kondoa. 59.77 % of appliances were for lighting followed by radios at 13.67%, mobile phone recharging at 12.89%, torch at 9.77% and TV at 3.91% (Figure 3).
Figure 3: Households Appliances Used in Kondoa Rural
Also sample data from TANESCO for December 2009
shows that electricity consumption for electrified rural areas in Kondoa was low compared to urban areas (Figure 4). This type of electricity consumption pattern represents good opportunity for employment of solar PV systems for rural households in rural area.
Figure 4: Electricity Units (Unit=1kWh) Consumed for December 2009 (TANESCO-Kondoa).
Data from TANESCO for electrified villages in Kondoa
shows that the consumption for individual households is very low to the extent of 8 units per month (Table 1). This electricity consumption pattern supports the argument that load energy demand for rural households is very low and can be supplied by other energy sources especially stand alone renewable energies. This type of load profile is suitable for solar PV systems application as a source of energy supply especially in Kondoa where average annual solar insolation is about 6.14 kWh/m2/year which can produce up to 0.43kWh per day for a PV system of 70W capacity.
Table 1 below shows data for six randomly selected individuals from different locations (n stands for a household).

128
PROCEEDINGS Conference MPDES 2011
Table 1: Electrical Energy Units Consumed by Households per Village for December 2010
Electrical energy consumed in kWh for eight villages in Kondoa n Kondoa Mondo Kelema Jenjeluse Goima Songolo Hamai Bolisa 1 123 63 24 16 55 46 33 74 2 103 70 36 85 23 33 34 15 3 96 53 26 44 43 11 42 31 4 172 53 49 8 64 18 35 24 5 140 42 25 15 22 91 42 44 6 103 81 15 17 30 39 65 11
Challenges Affecting the Use of Solar PV Systems in Kondoa Rural Area The following paragraphs summarize the challenges which hinder solar PV technology utilization in Kondoa.
Investment Costs High initial investment costs is one factor, which hinders solar PV application in Kondoa rural households. Respondents’ views on modes of payment for acquiring PV systems facilities which could be affordable indicate that the majority cannot afford lump sum payment (Figure 5). The study shows that 50% of respondents prefer two schedule payments, 33% prefer three schedule payments and 17% prefer lump sum payment. Low purchasing power of majority of rural people is the major cause for low utilization of the technology. Most of rural households are very poor to afford high up-front cost of solar PV systems.
Figure 5: Modes of Payment Preferred by Respondents for Solar PV Systems
Poor Performance Poor performance of installed solar PV systems is another factor which discourages prospective client to opt for solar PV system. Most of the installed SHS didn’t satisfy clients’ expectations (Figure 6). This would be due to wrong or lack of understanding or perception towards solar PV technology. Some of the consumers didn’t understand that a certain sized system is only meant for the specified load energy demand. Some technicians installing the systems do not give users basic information needed for them to take care of the system. There are only two trained technician in the district under Sida-MEM Solar PV project, sponsored by Swedish government in collaboration with Tanzania Ministry of Energy and Minerals . The rest did not have any training, but they
used experience they have in electrical installation. Due to this prevailing condition, many systems were not sized properly. Reliability and maintenance are crucial issues in remote areas owing to the difficulty, delay and high cost of technical support service provision. Concerns expressed by rural households include poor reliability, lack of maintenance support and insufficient education and training of users.
Figure 6: Respondents Views on Quality of Electricity Generated by SHS
Poor performance of solar PV systems was mainly due to poor installation as it is seen in (Figure 7a-7e). Poor workmanship, wrong size of cables and wrong wire run length which all together contribute to unnecessary system voltage drop and energy losses.
Figure 7a: Wrong cable size used for installation.

129
PROCEEDINGS Conference MPDES 2011
Figure 7b: Wrong wire run length, size and module mounted on wooden poles.
Figure 7c: Wrong wire run length, size and module mounted on wooden poles.
Figure 7d: Wrong wire run length and size of cable from solar module to charge controller
Figure 7e: Wrong size of flexible cable used for installation.
Economic Results The Economic analysis was done based on the assumptions that all competing alternatives technically perform the same function. Annual Interest Rate and inflation rate of 13% and 10.3% respectively (BOT, 2009). Life cycle of PV module was taken as comparative time for LCC analysis. For proper sized small SHS with components properly selected; maintenance costs are so small that they can be neglected. (Galloway, 2004), Annual operating cost for petrol generators and kerosene lamps was considered as the annual fuel cost, petrol, kerosene and disposable dry batteries (A4) prices were Tshs. 1,620 per litter, Tshs. 1,200 per litter and Tshs. 500 per battery respectively; as per market price in Kondoa December 2009.
From Table 2 below A, B and C represent low, medium and high income rural households categories respectively. The result revealed that for low income households who spend Tshs. 55,200 annually for kerosene and batteries their LCC for 10 years life time is Tshs. 434,081, while it is Tshs. 720,566 and Tshs. 4,065,687 for SHS and petrol generator respectively (Table 2).
The LCC result shows that for medium income rural households 40W solar PV system is cost effective compared to other alternatives. Also the LCC results for high income rural households show that solar PV option is cost effective (Table 2).

130
PROCEEDINGS Conference MPDES 2011
Table 2: Economic Results (1US$ =Tshs. 1,500)
Source Initial Costs (Tshs.) Annual Running Costs (Tshs.) LCC (Tshs.) PV A 516,000 - 720,600
PV B 1,081,500 - 2,060,800 PV C 1,892,500 - 3,989,000
Generator set A 130,000 487,200 4,065,700 Generator set B 160,000 681,600 11,717,900 Generator set C 160,000 973,200 16,477,400 Kerosene & Battery A - 55,200 434,100 Kerosene & Battery B - 131,350 2,143,900 Kerosene & Battery C - 340,800 5,562,500
Figure 8: Annual cost option B and its LCC vs LCC option A Results show that for low income categories, the
poorest group of respondents who spend below Tshs. 96,000 annually for kerosene and batteries can neither afford to opt for a 14W solar PV module which is the smallest SHS available in the market nor a small petrol generator. But those people who spend above Tshs. 96,000 annually, their best choice is SHS system (Figure 8).
The results concur with the result obtained in the study on Welfare Impact of Rural Electrification: A Reassessment of Costs and Benefits (IEG, 2007). Their result was that the immediate benefits of renewable energy seldom go to the poor. IEG’s analysis supports the finding that the poor are less likely to have access to electricity.
Discussion The study shows that Kondoa is located near the equator (latitude 4o 54’ 0 S) with annual average solar insolation of about 6.14kWh/m2/year, which indicates that the district has enough solar energy resource potential. In the presence of enough solar energy resources, adding the benefits of effective use of electrical energy and energy efficient appliances; deployment of PV systems can satisfactorily meet the energy needs of remote areas such as those in Kondoa rural area. Tanzania has abundant solar energy resources. Bringing this into account offers a huge potential for its economy in general and it’s evolving
solar sector in particular. Apart from supplying energy to private rural households, health centers and emerging huge number of rural secondary schools, the rural small and medium enterprises (SME’s) industry is a major growth sector for PV systems.
The study shows that households in Kondoa rural are characterized by low load energy demand. Energy is used mostly for lighting which accounts for 59.77% of 61 interviewed respondents. It has been shown that for grid electrified Kondoa rural, the load energy demand per household is as low as 8kWh per month. Individual SHS, providing electricity for lighting and low powered electrical appliances like radio, TV and mobile phone recharging, proved to be the least-cost option to provide such basic electricity services, especially for rural areas characterized by low energy demand. It should be noted that a huge population in developing countries, particularly in Tanzania, live in rural settlements in small and scattered households with a relatively small electricity load energy demand. Consequently, such small rural communities have no access to modern energy service. The lesson learned from this experience is that, solar PV-based electricity services bear great chances for such rural households.
Although LCC of SHS are lower than for conventional energy systems, their initial investment costs are high, hence the poorest low income rural households who spend less than Tshs 96,000 annually for energy could not afford even the minimum solar PV system which is 14W. The

131
PROCEEDINGS Conference MPDES 2011
poorest low income rural households may opt for solar lamps which are available at relatively cheap price, to avoid problems accompanied by kerosene lamps applications.
It has been shown that with an inflation rate and interest rate of 10.3% and 13% for petrol, kerosene and other equipment; 5, 10 and 25 years life span for petrol generator, amorphous and crystalline solar PV module respectively, at Tshs 1,200 kerosene and Tshs 1,620 petrol price per litter, an optimal and most cost effective SHS consist of 14W, 40W and 80W for low, medium and high income rural households respectively. On the other hand, increase of inflation rate and interest rate above 10.3% and 13% respectively would strongly favor SHS.
The Tanzania government, through TASEA (Now TAREA) and other appropriate agencies, has identified solar PV as a viable electricity alternative. In order to realize the full potential associated with the cost effectiveness of solar PV system being studied and assuring sustainability, the following are recommendations:
The government should support local manufacturing of some of solar PV system components like inverter, charge controller, batteries and local assembling of PV modules so as to reduce cost for the end user of solar PV systems. The government has been doing effort in creating conducive environments to attract international investors in other sectors like mining. Much effort could also be directed towards production of PV system components within the country by international as well as local companies to improve high –upfront cost. The high-upfront cost of the components is influenced by many factors including importation cost. It has been noted that the government decided to remove taxes on renewable energy equipment importation particularly solar technology equipment. However, for further improvement in removing high up-front capital costs barrier, the government and other stakeholders should device infrastructures for simple micro-credit facilities for end-users and dealers. The Tanzania National Electric Supply Company (TANESCO) offers tariff subsidies to rural electrified households, despite the fact that grid rural electrified covers only 2.5% of the rural population; which is about 80% of the Tanzania population. To realize full potential of SHS, the government through TANESCO should make sure that the offered tariff subsidies benefits the majority of rural households not covered by the grid.
Lessons learnt from the study were the importance of identifying local electricians and train them so that they can locally provide services to the systems. Currently there are efforts made by the government through its Ministry of Energy and Minerals, in collaboration with Swedish government via a project known as Sida-MEM solar PV project. Under this project they have been able to conduct training to few local technicians and raise awareness to rural people about solar PV technology. They also conducted training to local PV dealers. More effort is needed to make this project sustainable since the success of PV-based power generation depends on technical support. The situation is likely to lead to rejection of the use of SHS by rural communities in Tanzania if it is not dealt with as soon as possible. The
local technicians should be provided with skills in designing different PV applications, technical and quality standards, system range and services, topology of DC and AC systems, system design and sizing of components. Also the technicians should insisted in training users so that they are able to carry out simple basic maintenance of the PV system once they finish installations.
Field studies should be conducted to assess physical and operative condition of the Installed PV systems and also to analyse the degree of satisfaction of the users. Unfortunately few studies seem to have been carried out to assess the performance of SHS that are now in the field, in a systematic and comprehensive manner (John, 2010). At this stage of technology implementation, information from the field is vital as a feedback mechanism to gauge the efficiency of the PV solution; to improve the chances of overall success; and to assure long-term sustainability.
In depth studies should be conducted to assess domestic load demand of rural areas. This will serve as input data in the design of PV and other off-grid power solutions for rural household electrification systems. It will also assist the government in their rural electrification planning frame work.
Studies on appropriate micro-credit schemes for enhancing implementation of small renewable energy systems particularly SHS should be conducted. Since the majority of the targeted rural people live below the poverty line, studies on appropriate micro- credit schemes which are a prerequisite for accelerated deployment of small renewable energy systems should be conducted. It should be noted that solar PV-based power generations provides business opportunities for project developers, energy suppliers, manufactures of solar PV systems components and local system installers.
Acknowledgements I would like to acknowledge with sincere gratitude the financial support from German Heidehof Foundation.
References Amsalu, S.,Elmer, M.,Newman, R. and Gashie, W.
(2009). Rural Electrification with Photovoltaics, Stiftung Solarenergie-Solar Energy Foundation.
Cabraal, A., Cosgrove-Davies, M., Schaeffer, L. (1996). Best Practice for Photovoltaic Household Electrification Programs (Tech. Rep. World Bank). Washington, D. C 20433, U. S. A.
Dawson, C. (2002). Practical Research Method, How to Books Ltd, 3 Newtec Place, Magdalen Road, Oxford OX4 1RE, United Kingdom.
Galloway, R. T. (2004). Solar House: A Guide for the Solar Designer, Archtectural Press, An imprint of Elsevier Limited, Linacre House, Jordan Hill, Oxford.
IEG (Independent Evaluation Group), (2007), Welfare Impact of Rural Electrification: A Reassessment of Costs and Benefits. (Tech. Rep. World Bank). Washington, DC: go.worldbank.org/ZE4B692E10, Accessed on 3rd may 2009.
John, J. (2010). An Economic Evaluation of Solar PV Systems for Rural Households. The Case of Kondoa

132
PROCEEDINGS Conference MPDES 2011
District, Dodoma. Masters dissertation, Department of Mechanical and Industrial Engineering, University of Dar es Salaam.
Kalogirou, S. (2009), Solar Energy Engineering, Elsevier Inc. , Printed in the United States of America.
Kassenga, G. R, (2008). The Status and Constraints of
Solar Photovoltaic Development in Tanzania. Energy Sources, 4, 420-432.
Kimambo, C.Z.M., Mwakabuta, N. (2005). Transformation of Rural PV Market in Tanzania. Consultancy report on study of pricing structure of energy services and products. Ministry of Energy and Minerals and United Nations Development Programme
Kothari, C. R. (1990). Research Methodology: Methods and Techniques, second Edition, Willey Eastern Ltd., New Delhi.
Krutikov, S., Teddy, B.N, Cosmus, Z., De Weerdt, J. (2005). Kondoa district CWIQ baseline survey on poverty, welfare and services, EDI Ltd (Economic Development Initiatives), Tanzania.
Luque, A. & Hegedus, S. (Eds.) (2003). Handbook of photovoltaics, John Wiley & Sons Ltd, The Atrium, Southern Gate, Chichester, West Sussex PO19 8SQ, England.
National Bureau of Statistics (2002). Population Census, http://www.nbs.go.tz retrieved on Monday, 16th November, 2009
Patel, M. R. (2006). Wind and Solar power Systems: Design, Analysis, and Operation, Second Edition, CRC Press Taylor & Francis Group, Boca Raton London.
Sida-MEM, (2009). Dodoma PV systems market Assessments Report, Sida-MEM Solar PV Project.
S rensen, B. (2004). Renewable Energy its Physics, Engineering, Use, Environmental Impacts, Economy and Planning Aspects, 3rd Edition, Elsevier Science.
Terrado, E., Cabraal, A., and Mukherjee, I. (2008). Designing Sustainable Off-grid Rural Electrification Projects: Principles and Practices, (Tech. Rep. World Bank).
United Republic of Tanzania (2003). National Energy Policy 2003, Ministry of Energy and Mineral.
United Republic of Tanzania (2009). Poverty and Human Development Report. Research on Poverty Alleviation (REPOA).
United Republic of Tanzania (2007). Household Budget Survey Report. Research on Poverty Alleviation (REPOA).

133
PROCEEDINGS Conference MPDES 2011
The Contribution of Microenergy Systems towards Poverty Reduction: Case Study of an Implementation Strategy for Solar Home Systems in Sri Lanka
Dino Laufer ([email protected])
Technische Universität Berlin Postgraduate Program in Microenergy Systems
Center for Technology and Society, Sekr. WF 1, Fasanenstr. 90, D - 10623 Berlin, Germany
Martina Schäfer ([email protected])
Technische Universität Berlin Center for Technology and Society
Sekr. WF 1. Fasanenstr. 90, D - 10623 Berlin, Germany
Abstract Off-grid Solar Photovoltaic Systems which are owned by single households have gained importance in those areas of developing and emerging countries without centralized energy supply. The introduction of this technology in remote rural areas is often linked to political objectives such as reducing poverty. This paper focuses on the dissemination process and use of Solar Home Systems (SHS) in Sri Lanka. The analysis is based on interviews with the main implementation actors in this field (e.g. the financing institution, developing engineers) as well as with 40 users. Based on the outcomes of the analysis, recommendations are given regarding to what extent these technical systems offer opportunities for poverty mitigation for different types of users. Functioning technologies as well as adequate maintenance strategies to implement energy provision for people in remote areas is a pre-condition for poverty alleviation. If SHS are expected to contribute towards poverty alleviation, accompanying institutional arrangements are necessary and are also discussed in the paper. Keywords: Off-grid sector, Microenergy Systems, user types, poverty mitigation, recommendations for poverty alleviation
Introduction Around 1.4 billion people worldwide have no access to modern and reliable energy supply; 85 percent of these people live in the rural areas of developing countries. Without specific international programs and measures, the number will only drop to 1.2 billion people by 2030 (IEA/UNDP/UNIDO 2010: 7). Consequently, over one billion people will continue to have no access to electrical light, modern information and communication media, or adequate energy supply for their domestic and economic activities. At the same time, around 2.7 billion people presently rely on traditional use of biomass in the forms of wood, charcoal and dung for cooking and heating purposes. The World Health Organisation (WHO) estimates the early death of 1.6 million people per year because of indoor air pollution, with mainly women and children being affected (WHO 2005).
While absolute poverty concepts such as the international poverty line of the World Bank focus on access to (monetary) resources – defining an income level of $1.25 per person and day as “very poor” – other
concepts concentrate on aspects of “well being” and availability of capabilities to live a self-determined life (Dietz 1997: 83). The Capability Approach of Amartya Sen defines poverty as “capability deprivation”, characterising capability as a type of freedom that enables people to choose the lifestyle they want to live (Sen 1999). This approach thus focuses on the availability of capabilities in the form of “substantive freedoms”. In this vein, Sen highlights the importance of elementary education and health services (Sen 2002: 135). The Sustainable Livelihoods Approach supplements this approach by targeting improvement of the livelihoods of poor people and their access to different forms of capital (Chambers & Conway 1991).
On the international political level, at the Millennium Summit of the United Nation in 2000, world leaders agreed on achieving eight Millennium Development Goals (MDGs) by 2015. The major target is to reduce the rate of world poverty by half, according to the base line of 1990 and an absolute definition of poverty (income of less than $ 1 per person and day), with eight of the MDGs being broken down into 21 quantifiable targets, measured by 60 indicators (UNDP 2010). The availability of modern energy services worldwide is regarded as being necessary to reach the MDGs by 2015 (UNDP 2005: 4-5; Modi 2005: 7, Modi et. al. 2006: 2). There is a strong belief that access to these services will have multiple positive effects, including increasing productivity in the agricultural, industrial and tertiary sectors (DFID 2002: 27-28; UNDP/ESMAP 2003 und UNDP 2004: 14). The United Nations Development Program (UNDP) has announced that
energy is central to sustainable development and poverty reduction efforts. It affects all aspects of development – social, economic and environmental – including livelihoods, access to water, agricultural productivity, health, population levels, education, and gender-related issues. None of the Millennium Development Goals (MDGs) can be met without major improvements in the quality and quantity of energy services in developing countries. (UNDP 2009)
Remote rural areas of developing and emerging countries are often characterised by households and

134
PROCEEDINGS Conference MPDES 2011
businesses which do not have access to central electric, gas or fuel infrastructure. Despite their relatively low energy demand, due to long transport distances and intermediate trade the costs for meeting daily energy needs in these areas are proportionally larger in comparison to areas with access to central electric and gas infrastructure. Especially poor people, who must spend a large share of their income and time allocating fuels for inefficient lighting and cooking purposes, need to be targeted for supply of affordable, clean and modern energy services. There is a strong expectation that such people will save a significant amount of fuel, money and time with more efficient energy systems (UNDP/ESMAP 2003).
Due to the high costs of grid extension, off-grid electrification can offer an alternative solution for many low-demand users in non-electrified regions of developing countries (Saghir 2005: 13). Several international actors – such as the World Bank Group with its Energy Sector Management Assistance Program (ESMAP), the UNDP and the Global Environment Facility (GEF) – offer support for energy implementation programs in the off-grid sectors of developing countries (Reiche et al. 2000: 52). For off-grid supply of energy in rural areas, different technologies, such as solar systems, small hydropower plants or gasifier systems, are combined with different implementation and operating strategies. Depending on the technologies employed, energy can be provided either on a household level, as with Solar Home Systems (SHS) or energy efficient stoves, or on the level of villages or communities. Hydro systems, for example, are mostly disseminated on a community level (ibid.: 54).
The authors of this paper are members of the post graduate program “Microenergy Systems for Decentralized, Sustainable Energy Supply in Structurally Weak Areas” at “Technische Universität Berlin”. This program defined “Microenergy Systems (MES)” as decentralised energy systems based on “Microenergy Plants” and offering energy supply for households, small and medium sized enterprises and farms. “Microenergy Plants” are decentrally applicable energy conversion units allowing the local coupling of energy demand, transformation and supply. MES can operate either on the basis of local renewable energy resources – such as sun, water, biomass or wind – or fossil fuels. They transform this primary energy into electricity, heat, light, and driving or other forms of power. These energy systems offer possibilities for decentralised governance of energy resources and for the development of regional economic cycles and corporations (Graduiertenkolleg Mikroenergie-Systeme 2009: 4-5).
Research Objectives The aim of the research project was to analyse different MES in terms of implementation strategies and their potential contributions towards poverty alleviation in rural areas of developing countries. This paper concentrates on the implementation strategy of SHS in Sri Lanka. Based on the empirical analysis, recommendations are provided regarding the implementation process and strategies to reduce poverty using these technical systems.
Methods A literature review on the significance of energy supply for poverty reduction in developing countries was the basis for the empirical survey carried out in Sri Lanka in 2008. Sri Lanka was chosen for empirical research because it has a high rate of SHS dissemination, with more than 100,000 households receiving their electricity via SHS (RERED 2010), mostly financed through micro loans of the microfinancing institution “Sarvodaya Economic Enterprise Development Services (SEEDS)”. The national program “Renewable Energy for Rural Economic Development (RERED)”1 is the coordinating agent for electrification projects in rural areas of Sri Lanka.
Background information on energy and poverty policies in Sri Lanka, as well as on the main actors in this field, was acquired through interviews with representatives of SEEDS, RERED, and scientists in the field of national energy policy and rural development. Interviews with engineers of solar companies were also carried out.
Representatives of 40 households with electricity supply generated via SHS in one of the poorest districts of Sri Lanka, a rural area named Moneragala, were interviewed according to the principles of focused interviews (see. Merton & Kendall 1946: 541-557; Witzel, 2000) and based on a semi structured interview guideline. Two young scientists of the University of Moratuwa in Sri Lanka with experience in field research conducted the interviews and translated the questions from English into Sinhala and the given answers back into English. To analyse the interviews the terms of coding included for example living conditions, strategies of securing livelihood, motivations to buy the SHS, the capability to refinance the loan for the system, information about the use of the electricity and the satisfaction with the electricity supply by SHS. Moneragala was chosen because, on the one hand, it has a high percentage of poor households; yet, on the other hand, it also exhibits a very high rate of SHS dissemination (13,000 households) (RERED 2010). It can also be observed that, especially in this district, SEEDS is confronted with a very high rate of loan defaults. Regarding the sample, data from the regional departments of SEEDS was used. The monetary indicator was the official poverty line of Sri Lanka for the year 2008: around 25 USD per person a month. The households had different main sources of income, with the majority generating income through farming activities, followed by households with members who worked as day labourers. As it was very difficult for these households to calculate their monthly income, the economic situation was also estimated on the basis of the “housing index” used by microfinancing institutions (Henry, C. et. al.: 172). Every house was rated with regard to its size; materials used for the floor, walls and roof; and its general condition.
1 RERED is an independent department of the DFCC Bank in
Colombo, Sri Lanka and mainly financed by the World Bank and the Global Environment Facility.
135
PROCEEDINGS Conference MPDES 2011
Results In general, governmental programmes and institutions in the field of energy supply for the rural areas of Sri Lanka focus mainly on electricity supply. Strategies for implementing more efficient energy conversion technologies for biomass, motive power and thermal energy supply (especially for cooking purposes) receive limited attention from national energy policies and are not integrated into national overall energy strategies (UNDP 2007: 7).
Microfinancing schemes which support users in financing renewable self-generated energy supply are often seen as “the answer to the problem of financial access” (UNDP 2007: 26). The World Bank Group has implemented a number of projects for off-grid rural electrification with the specific target of building sustainable local markets in this sector. These projects are supposed to overcome barriers on both the demand and supply sides and are combined with financing schemes like microfinance and consumer credits. But Reiche et al. propose that “balance[ing] maximum private sector participation with minimal subsidies is a main challenge for new rural service delivery mechanisms” (Reiche et al. 2000: 54).
Through the interviews with representatives of the microfinancing institutions SEEDS and RERED and the involved solar firms it was possible to reconstruct the socio-technical network and its influence on the arrangement of SHS technology in Sri Lanka. The following sections give an overview of the empirical results.
Implementation strategy in Sri Lanka and its influence on the functional capability of SHS Since the 1990s, the government of Sri Lanka has wanted to force electrification schemes on non-electrified rural areas of the country. Together with the World Bank and the Global Environment Facility, in 1997 the government established the “Energy Services Delivery Programme (ESD, renamed RERED in 2002)”. The first idea was that participating solar companies should also be responsible for the extension of loans. However, the solar firms refused to be responsible for the financing program. As a result, SEEDS was asked to take over the financing part of the program in 2004, because it already had experience in the micro credit sector. In this network, different actors with different interests came together. The World Bank wanted to support the development of infrastructure in rural areas with the goal of reducing poverty. SEEDS agreed to this target, but wanted to establish a new business-credit segment. The government of Sri Lanka had the interest of developing infrastructure in structurally underprivileged regions with a market-oriented approach. The solar firms had the fundamental interest of gaining new markets for their products. The network agreed to the strategy of implementing SHS in rural areas of Sri Lanka by selling them through salesmen from the solar companies. As the purchasing price of such systems is quite high, accompanying strategies like “buy down” grants from the government and micro loans were integrated into the dissemination model. Therefore, it was
necessary to create a technical system which could be financed by a three-year micro loan.
Technological design of SHS Due to the given price limit determined by the political and financial arrangements, the SHS received a specific design: without deep-cycle batteries2 and with a limited warranty on batteries. The batteries used in this design can store electricity for only around 4 hours a day, depending on electricity consumption. They have an average lifespan of only 2 ½ years (Mawatha 2005: 25) and, thus, usually do not last until the end of the loan duration of 3 years. The direct-current (DC) based technology needs special applications or inverters. Further, old and inefficient appliances predominant in the area have led to depth discharge of batteries. Electrical wiring can be fragile in houses built of clay, and during the rainy season people have to deal with a very low capacity for electricity generation.
Financing strategy The households pay 15 percent of the purchase price for an SHS directly to the solar company, while SEEDS gives a micro credit on 80 percent of the price. As collateral, SEEDS keeps 5 percent of the purchase price. This constellation of factors has results on the whole implementation model, as the “buy down” subsidies of the government and the income of SHS customers have been too low to refinance their loans within the three-year payment period. Moreover, local governments in Sri Lanka often decide spontaneously to connect rural regions to the national grid, so that SHS users in these areas have no incentive to continue payment for their systems. Very often households refuse to pay their loans when their systems become inoperable – especially due to batteries wearing out and the resulting need to use kerosene lamps – or they feel that the service of solar companies is not satisfactory. In such cases of non-payment, SEEDS takes the SHS as collateral and puts it into storage.
Dissemination strategy To sell SHS in remote and non electrified regions, solar firms who assemble SHS send salesmen to offer these technical systems to households. If a potential customer is interested, the salesman starts a loan enquiry at the local branch of SEEDS. When acceptance has been received, the microfinancing institution concludes a loan contract with the SHS owner via the salesman and pays the purchasing price to the solar company. After the customer arranges a down payment to the solar company, the SHS will be installed. The contract of sale is combined with a warranty offer. The income of the solar salesmen depends on their sales figures; consequently, they do not adequately point out the limitations of the SHS. For the customers, it is accidental which company salesman comes along, so that they often cannot compare the offers of different solar firms. While a ten-year warranty is given
2 A deep-cycle or lead acid battery can be regularly
discharged to most of its capacity. In contrast, starter batteries (e.g. most automotive batteries) deliver sporadic, high current for starting an engine and designed to be frequently discharged of only a part of their capacity (Linden, Reddy 2002: 23-44).

136
PROCEEDINGS Conference MPDES 2011
for the solar panel, the warranty on batteries is mostly limited to two years. In cases of an inoperable battery, customers will not get a new one; instead they can only expect to receive a used battery, which will usually last just up to the end of the warranty period.
Instead of integrating the needs and local knowledge of users into the process of developing and implementing this technology, the SHS implementation strategy in Sri Lanka has been focusing on a marketing and sales policy for a standardized and existing product.
User experiences with SHS Our discussion of user experiences is divided in terms of technological design, the financing strategy and impacts concerning poverty alleviation and income generation. During the field research, it became obvious that, based on their initial economic and social positions, different users have different possibilities for dealing with the above-presented limitations and restrictions of the SHS implementation strategy in Sri Lanka. Therefore, we have categorized different types of users according to their levels of income, housing conditions and strategies for using and financing SHS. Information about the previous energy supply usage and costs was collected, since the potential for possible energy cost savings to contribute towards financing the new electricity supply by SHS is important. Moreover, users were questioned about their strategies to ensure their livelihoods and their motivation for integrating SHS into the economic and/or domestic activities of their households. The realized impacts and degrees of satisfaction were compared with the original intentions for buying an SHS. Finally user perspectives and their necessity for receiving subsidies and microfinancing offers were documented. Different types of households and their ability to handle and use SHS The majority of investigated households in Sri Lanka consist of 4 to 5 family members, with most families having 2 or 3 children. Sometimes the grandparents (mostly of the husband) are living in the household as well, so that at an average of 7 family members live in one household. User Type 1: The household businesses This type of household using SHS receives its income from small businesses in the form of tea shops or household supply stores as well as additional monetary income earned by other household members (mostly by the head of the household). The interviewees themselves evaluated their incomes as sufficient to secure their livelihoods and to have an adequate standard of living. With previous use of kerosene lamps and car batteries for electricity supply, this group has a high potential to substitute former energy costs. The motivation to buy an SHS is mostly driven by economic interests such as expanding opening hours and being able to offer “entertainment facilities” such as TV or radio. It is expected that customers will stay a longer time in the shop and can be stimulated to consume more. Reduction of previous energy costs, prevention of health hazards and creation of better conditions for the school work of their
children are additional objectives. These households are capable of buying SHS without subsidies and micro loans, because either they can save money in advance or they could qualify to receive an ordinary bank loan.
User Type 2: Households with regular income The second type of household with SHS receives regular monetary income out of the employment of members of the household (mostly by the head of the household). The income is often not sufficient to secure the livelihood of the whole family, so that additional subsistence economy (e.g. growing of rice or corn) is necessary. The intention to buy an SHS is combined with a wish to have higher flexibility for domestic activities, reduce health hazards and improve conditions for children to learn for school. Moreover, they hope to reduce energy supply costs. With the savings on previous energy cost expenditures, this group is mostly able to finance SHS loans out of their monetary monthly incomes, but a lot of households are facing difficulties in financing additional batteries to replace inoperable ones. In general, strategies to use SHS for domestic and not for economic activities are dominant in this group. The availability of micro loans and subsidies for this group is important, because otherwise they would not be able to finance the whole purchasing price in advance. User Type 3: Households with irregular income The third type is characterized by households with irregular and precarious monthly income: either through agricultural activities or as daily labourers. Whereas a very small amount of households with irregular monthly income from agricultural activities use their electrical systems for economic purposes (e. g. using light for the processing of agricultural products), a productive use of SHS was not observed within the group of day labourers at all. The irregular income of this type is generally not sufficient to pay the monthly loan instalments on time and the early wearing out of batteries often leads to a breakdown of the whole system. Very often members of this group have no overview concerning their monthly income and only know the monthly loan rate for their SHS. Problems with the technical design Despite the fact that RERED has introduced quality management for SHS batteries in Sri Lanka, it has been obvious that battery weakness is very often a problem for SHS households. In more than half of the forty interviewed households in the district of Monaragala, the battery wore out in less than three years. While the households with regular and sufficient monetary income were able to replace the inoperable batteries, the low income households with irregular earnings have faced great difficulties doing so. During the rainy season, households experience cumulative black outs, because batteries cannot be recharged adequately. In general, however, people are not satisfied regarding the limited duration of electricity supply (around 4 hours a day) and the need for special DC appliances, which they often cannot afford. As there is no local knowledge available regarding repair services for such systems in remote areas

137
PROCEEDINGS Conference MPDES 2011
of Sri Lanka, the customers are dependent on the after-sales service of solar firms, which from the point of view of SHS users often is not satisfactory. Problems in refinancing an SHS In most cases of the third household type, monetary income is too irregular and insufficient to pay the monthly installments for the loan. Due to the very limited economic use of SHS within this group, additional monetary income to finance SHS is not available. In comparison to the first and second household types, the potential to substitute previous energy costs in the third household type has been low, as they did not use car batteries prior to SHS electrification. As there has been no graduated subsidy available according income level, financial assistance from the government has not been sufficient for low income households, but has rather had a bandwagon effect on well-off households. Contribution towards poverty alleviation and income generation for different types of users All interviewees of the poor area in the district of Moneragala stated that electrical light is an important advancement for their lives. Children can learn much better for school, domestic work can be done more flexibly in the evening hours and security is improved, because an open flame is no longer needed. Furthermore, improved communication (charging of mobile phones) and social participation opportunities were mentioned, for example watching news on TV.
But, in contrast to households which could integrate SHS into their livelihoods (e. g. for income generating activities) or who were able to finance the SHS out of their existing income, the households of the third type had major problems with refinancing. Especially as these households rely on irregular and precarious incomes, they are not able to take over the accountability for making monthly repayments. In cases of early breakdown of an important part of the technical system (i.e., batteries), already the second type of households can be faced with difficulties in financing a replacement. For the low income households of type three, this was nearly impossible. The majority of this group could not receive an additional loan from SEEDS, as they had not paid their monthly installments properly. This appears to be the case in most of the investigated households, as the SHS turns into an additional burden, especially when they have to finance kerosene oil for lamps to make up for the no longer functioning electrical system, prompting them to stop loan payments. Moreover, many representatives of this group explained in the interviews that it is very depressing to return to the poor light quality of a kerosene lamp, after having had the experience of a bright electrical light.
Discussion We have shown that the interrelation between humans and the SHS technology is different, depending on available capital or monetary income of SHS users and their available schemes for financing the SHS. First, the influence of the functionality of the technology varies
according to whether users have the financial means to replace inoperable equipment whenever necessary. Moreover, the availability of different energy conversion technologies or energy consuming appliances characterises status on the “energy ladder”, with low status being regarded as an indicator of poverty (Pachauri & Spreng 2003). In comparison to financially extreme poor households, the well-off households spent a higher amount of money for their previous energy supply and have been able to use the savings from the SHS to finance it. In contrast, the group with irregular and precarious income has enormous difficulties in financing the SHS via micro loans, as the savings from previous energy costs are not adequate for paying the loan installments. This group often has no clear picture of their monthly income and is largely incapable of assuming a regular financial burden. Beside lacking monetary capital such households are missing social and cultural capital (Bourdieu & Passeron 1990) that would help them to get an overview of their real potential to finance SHS and to calculate their risk in case of failure.
Most investigated households in Monaragala used the electricity from SHS for consumption purposes (lighting, TV, radio, charging of mobile phones). According to Amartya Sen’s Capability Approach, this kind of usage offers new opportunities to increase the quality of life of people in rural areas, based on long-term considerations. Furthermore, aspects of education and health are being addressed, because children have much better conditions to study for school with electrical light, and indoor air pollution from smoky kerosene lamps can be avoided.
Generally the majority of the interviewed in Sri Lanka declared that the new energy supply has improved their quality of life and contributed towards poverty alleviation, but has not led to an increase of income. Further case studies, like the case study of Gisela Prasad regarding SHS dissemination strategies in South Africa (Prasad 2007: 12), confirm these findings. With regard to primarily market-oriented approaches, where even poor users have to pay the major costs of the energy infrastructure, this situation can easily lead to intensified poverty due to inability to pay off debt. In the context of the Sustainable Rural Livelihood Approach, SHS dissemination strategies for poor customers need to be adapted to enhancing their necessary assets and the activities required for securing their livelihoods. The strategy of financing applications for consumptive use only does not fit into this approach.
In addition, in Sri Lanka the needs and local knowledge of different users are not being integrated into the strategies of developing, implementing and maintaining SHS there. But, according to Akrich, “the success or failure of innovations frequently depends on their ability to cope with dissimilar users possessing widely differing skills and aspirations” (Akrich 1995: 167). Users play an important role in the conception and dissemination of an innovation, whereas entrepreneurs mainly concentrate on the production of equipment (Von Hippel 1976). The SHS implementation model now being employed in Sri Lanka focuses mainly on the distribution of a technological product through enlargement of the solar market and complementing the available SHS offerings with, for

138
PROCEEDINGS Conference MPDES 2011
instance, microfinancing schemes. In the context of the Constructive Technology Assessement (CTA) approach, different forms of user representation are of critical importance for modulating technological modifications (Akrich 1995: 168) as well as changes in the implementation process.
Our empirical survey in Moneragala, Sri Lanka revealed that entrepreneurs such as solar firms and the representatives of the existing solar loan program from the microfinancing institution perceive the first and second type of households as representative users of SHS. As a result, no adequate strategies to finance the replacement of inoperable parts of the technical system or accompanying measures to better finance the whole SHS with the poorer layers in mind have been integrated into the implementation process.
The expectation that access to energy necessarily leads to better productivity, especially for economically poor households, has not been verified empirically by our research. Only with additional measures such as socially differentiated subsidies, needs-oriented access to different forms of energy, strategies for creating energy-based entrepreneurial opportunities and the strengthening of regional economic cycles will improved access to modern energy provision contribute to the achievement of the Millennium Development Goals.
The microfinancing institution – itself part of the established socio-technical network in Sri Lanka – would be a perfect actor to take over the role of an intermediary agency: bridging the gap between the intentions of very poor households of the third type to improve their life conditions and their inability to refinance the system by integrating new or additional strategies to secure livelihoods. The examples of poor households who use SHS, for instance, to process agricultural products, could be used as a model for an accompanying economic capacity building program. Adjusted saving schemes would help to replace malfunctioning SHS parts, and maintaining close contact with SHS suppliers could be used by the microfinancing institution to enforce prolonged warranties as well as the integration of better-quality technical appliances into the SHS, like deep-cycle or tubular-plate batteries.
To encourage advances in education and to close the “digital gap” between industrialised and developing countries, further public facilities or infrastructural developments are needed. Meaningful improvements in education and infrastructure are the kind of long-term investments which cannot primarily be financed by poor people in rural areas.
References Akrich, M. (1995). User Representations: Practices,
Methods and Sociology. In: Rip, A.; Misa, T. J.; Schot, J.,: Managing Technology in Society. The Approach of Constructive Technology Assessment. (pp. 167-184), London.
Bordieu, P. & Passeron, J.-C. (1990). Reproduction in Education, Society and Culture. Paris.
Chambers, R. & Conway, G.R. (1991). Sustainable Rural Livelihoods: Practical Concepts for the 21st Century. Institut of Development Studies, Brighton.
Department for Census and Statistics Sri Lanka (2007). Poverty in Sri Lanka. Survey based on Household Income and Expenditure Survey – 2006/07. Available on http://www.statistics.gov.lk/poverty/reportnew-Final.pdf, accessed on the 8th of November 2010 at 5:45 p.m.
Department for Census and Statistics Sri Lanka (2002). Headcount Index and Population Below Poverty Line by DS Division – Sri Lanka 2002. Colombo.
DfID (2002). Energy for the poor – Underpinning the Millennium Development Goals. Department for International Development, London.
Dietz, B. (1997). Soziologie der Armut. Eine Einführung. Frankfurt/Main.
Graduiertenkolleg Mikroenergie-Systeme (2009). Interdisziplinärer Forschungsansatz zur Analyse von Mikroenergie-Systemen. Redaktion: Daniel Philipp, Martina Schäfer. Technische Universität, Berlin.
Henry, C. & Sharma, M. & Lapenu, C. & Zeller, M. (2003). Microfinance Poverty Assessment Tool. CGAP/The International Bank for Reconstruction and Development (The World Bank), Washington.
International Energy Agency – IEA & United Nations Developent Programme – UNDP & United Nations Industrial Development Organization - UNIDO (2010). Energy Poverty - How to make energy access universal? Special early excerpt of the World Energy Outlook 2010 for the UN General Assembly on the Millennium Development Goals. OECD/IEA, Paris.
Linden, D. & Reddy, T. B. (Eds.) (2002). Handbook Of Batteries, 3rd Ed. New York.
Mawatha, M. (2005). Survey of Batteries used in Solar Home Systems in Sri Lanka. Final Report submitted to RERED Project at the DFCC Bank by Sri Lanka Business Development Centre, Colombo.
Available on http://www.energyservices.lk/pdf/reports/BatterySurvey_FinalReport.pdf, accessed on the 22nd of November 2010 at 6:27 p.m. Merton, R. K. & Kendall P. L. (1946). The Focused
Interview. American Journal of Sociology, No. 51, New York.
Modi, V. & McDade, S. & Lallement, D. & Saghir, J. (2006). Energy and the Millennium Development Goals. Energy Sector Management Assistance Programme, United Nations Development Programme, UN Millennium Project and World Bank, New York.
Modi, V. (2005). Energy service for the poor. Earth Institute and Department of Mechanical, Colombia University, New York.
Pachauri, S. & Spreng, D. (2006). Energy use and energy access in relation to poverty. Centre for Energy Policy and Economics, Swiss Federal Institutes of Technology, Working Paper Nr. 25, June 2003, Zürich.
Prasad, G. (2007). Electricity from solar home systems in South Africa. Work package 2: Historical and recent attitudes of stakeholders. Cultural Influences on Renewable Energy Acceptance and Tools for the development of communication strategies to promote
139
PROCEEDINGS Conference MPDES 2011
ACCEPTANCE among key actor groups. Energy Research Center, University of Cape Town. Available on http://www.erc.uct.ac.za/Research/publications/07Prasad%20Electricity%20from%20SHSsl.pdf, accessed on the 2nd of November 2010 at 9:50 a.m.
Reiche, K. & Covarrubias, A. & Martinot, E. (2000). Expanding Electricity Access to Remote Areas: Off-Grid Rural Electrification in Developing Countries. (pp 52-60). WorldPower 2000, London. Available on http://users.tkk.fi/~apoudyal/Session%2020%20Reading%20Reiche_et_al_WP2000.pdf, accessed on the 3rd of November 2010 at 9:15 a.m.
Saghir, J. (2005). Energy and Poverty: Myths, Links, and Policy Issues. Energy Working Notes No. 4. Energy and Mining Sector Board of the World Bank Group, Washington.
Sen, A. (2002). Ökonomie für den Menschen. Wege zu Gerechtigkeit und Solidarität in der Marktwirtschaft. 2. Auflage, März 2002, München.
Sen, A. (1999): Development as Freedom, New York. United Nation Development Programme - UNDP (2007).
Energy and Poverty in Sri Lanka: Challenges and the Way Forward. Report for the Regional Energy Programme for Poverty Reduction of the UNDP Regional Centre in Bangkok, Bangkok. Available on http://asia-pacific.undp.org/practices/energy_env/rep-por/documents/GAP_Reports/Sri_Lanka.pdf, accessed on the 5th of October 2008 at 1:50 a.m.
United Nation Development Programme - UNDP (2005). Achieving the Millennium Goals: The Role of Energy Services. Case Studies from Brazil, Mali and the Phillipines, New York.
United Nation Development Programme - UNDP (2004). Gender & Energy for Sustainable Development, A Toolkit and Resource Guide. UNDP Bureau for Development Policy, New York.
United Nation Development Program – UNDP & Energy Sector Management Assistance Program - ESMAP (2003). Energy and Poverty: How can Modern Energy Services Contribute to Poverty Reduction? Proceedings of a multi-sector workshop, Addis Abeba.
Von Hippel, E. (1976). The Dominant Role of Users in the Scientific Instrument Innovation Process. (pp 212-239). In: Research Policy, Vol. 5.
World Energy Council – WEC & Food and Agricultural Organisation- FAO (1999). The Challenge of Rural Energy Poverty in Developing Countries. World Energy Council, London.
World Health Organization – WHO (2005). Indoor Air Polution and Health. Media Centre, Fact Sheet No. 292, Geneva. Available on http://www.who.int/mediacentre/factsheets/fs292/en/index.html, accessed on the 22nd of October 2010 at 9.15 a.m.
Further Internet links: Renewable Energy for Rural Economic Development -
RERED (2010). Solar Home Systems installed under RERED & RERED-Additional Financing as at 30 Sep 2010. Available on
http://www.energyservices.lk/statistics/details_shs1.htm, accessed on the the 4th of November 2010 at 4:45 p.m.
United Nation Development Programme - UNDP (2010). Millennium Development Goals. Available on http://www.undp.org/mdg/basics.shtml, accessed on the 2nd of November 2010 at 9:25 a.m.
United Nation Development Programme – UNDP (2009). Environment and Energy. Available on http://www.undp.org/energy/, accessed on the 4th of November 2010 at 5:32 p.m.
Witzel, A. (2000). Das problemzentrierte Interview. In: Forum Qualitative Sozialforschung/ Forum: Qualitative Resarch, 1 (1), Art. 22. Available on http:// www.qualitative-research.net/index.php/fqs/article/ viewArticle/1132/2519, accessed on the 14 of June 2008, 1:45 p.m.

I. Scientific PapersRegulation

141
PROCEEDINGS Conference MPDES 2011
Multi Criteria Analysis for Sustainability Assessments of Electricity Generation Systems in a Rural Community in South Africa
B. Amigun (corresponding author: [email protected])
Sustainable Energy Futures, Natural Resources and the Environment, Council for Scientific and Industrial Research, Pretoria, South Africa.
J.K. Musango ([email protected])
Department of Energy (DoE) Arcadia 0007, Pretoria, South Africa
M. Mehlwana ([email protected])
Sustainable Energy Futures, Natural Resources and the Environment, Council for Scientific and Industrial Research, Pretoria, South Africa.
A.C. Brent ([email protected]) Centre for Renewable and Sustainable Energy Studies, School of Public Leadership,
Stellenbosch University, South Africa
Abstract One of the key challenges of the energy policy in South Africa is to ensure that rural areas have access to electricity. This is reflected in the key energy policy documents (the 1998 Energy White Paper and the 2002 Renewable Energy White Paper). Both these documents identified renewable energy resources as immediate alternatives to grid electricity in especially remote rural communities that are characterised by low population densities. Centralised energy generation and transmission is very costly and inefficient in these areas due to greater transmission and distribution losses. While the cost of electricity in South Africa is relatively cheaper, it is not accessible for many rural households. There are still over two million households in rural areas without access to electricity. This paper presents a multi-criteria decision analysis (MCDA) using the Analytical Hierarchy Process (AHP) technique to compare various electricity technologies (mainly renewables) in a specific rural community of South Africa using social, economic, environment and technical indicators. These technologies were then ranked against each indicator assuming that the high-level criteria have equal importance for sustainable development. It is demonstrated that energy from wind is the most sustainable, followed by photovoltaic, anaerobic digestion (biogas), and then gasification. A sensitivity analysis was also performed to verify the stability of the priority ranking. The outcome of this study will specifically assist energy planners and decision-makers to choose the best alternative from a range of technology alternatives in a milieu of conflicting and competing criteria. Keywords: Sustainability; Technology options; Electricity generation; Multi-criteria decision analysis; South Africa
Introduction The advent of democracy in South Africa in 1994 brought also the institutional reforms that were vital for dealing with the socioeconomic and developmental challenges. The reforms were part of an overall process of democratic transformation that prioritised the delivery of basic services to previously underserviced communities
(Khumalo et al., 2003). Increasing electricity access is the cornerstone for socio-economic development and provides vital services that improve the quality of life. There is a discrepancy between population groups and areas in terms of access to electricity. The majority of unelectrified households are situated in rural areas. Access to electricity in urban areas is more than 90%, while only about 45% of rural households have access to the grid.
In South Africa, the greatest challenge is how to guarantee sufficient electricity supply in the context of growing electricity demand as the result of the growing economy. The national utility, Eskom, which generates about 95% of electricity, has been battling with electricity shortage since January 2008. This is mainly due to a lack of investment in new generation capacity and with lack of proper maintenance of existing energy infrastructure. The National Energy Regulator of South Africa (NERSA) has allowed Eskom to increase the nominal electricity price by 27.5% in 2008 in order to generate funds for future expansion. In 2010, NERSA approved an additional annual electricity price of about 25% for the next three years; up to 2013 (Lana, 2010). These price increases have caused further strains on disposable household incomes.
Many remote rural South African communities are characterised by low population densities. These characteristics make centralised energy generation and transmission prohibitively costly and inefficient due to greater transmission and distribution losses. However, most rural areas are endowed with renewable energy resources that can be transformed into usable energy. Centralised state utilities that focus on economies of scale can easily overlook an alternative model of decentralised and modular electricity generation, which is on a smaller scale and closer to the demand. In a decentralised electricity generation model, higher costs of electricity generation may be offset by reduced transmission losses and the capital costs of transmission lines that are saved. In addition, such a model may possibly increase the

142
PROCEEDINGS Conference MPDES 2011
reliability of electricity supply. Achieving a secure and sustainable energy future requires overcoming a rich set of interconnected technological, social, environmental, economic, political and regulatory challenges. The transition to sustainable energy future also requires the development and use of interdisciplinary and comprehensive methods and tools that will assist the decision-makers and planners to choose among many alternatives.
Objective and scope The goal of this paper is to undertake a sustainability assessment of all realistically available technology options to generate electricity in the rural and remote locations in South Africa. For this purpose, the Multiple Criteria Decision Analysis (MCDA) approach, which builds on quantified indicators measuring social, economic, technical and environmental performances of various renewable energy conversion systems, and allows for the explicit allocation of weights or preferences to these indicators, was used. The MCDA is increasingly being used to aid decisions involving several actions compared along multiple competing criteria (Belton and Stewart, 2002). This paper demonstrates how energy planners and decision makers may be assisted to choose the best alternative from a range of technology alternatives in a milieu of conflicting and competing criteria, using the MCDA approach. This could provide useful insights to the policy evaluation process, and to serve as a vehicle for
determining alternative future developments and the implications of policy actions.
Overview of the energy policy environment in South Africa The custodian of South Africa’s Energy Policy is the Department of Energy (DoE). The key objectives of the energy policy are to attain universal access to energy by 2014; provide accessible, affordable and reliable energy, especially for the poor; diversifying primary energy sources and reducing dependency on coal; encourage good governance, which facilitates and encourages private-sector investments in the energy sector; and ensure the environmentally responsible energy provision (DME, 1998). The South African energy policy priorities have always reflected the prevailing political economy. Until 1990, the focus was on independence from international energy imports, and the energy economy was mainly based on the exploitation of large coal reserves for electricity generation and synthetic fuels production. Since then, the energy policy of South Africa has undergone significant changes. It currently focuses on energy for development. A multi-stakeholder consultation process to redefine priorities and objectives ended with the publishing of a White Paper on the energy policy in South Africa in December 1998 (IISD, 2009). The sequential framework, in relation to clean energy policies in South Africa, is summarised in Table 1.
Table 1: Clean energy policy and regulatory frameworks in South Africa (IISD, 2009)
Name of instrument
Date of issue Administering authorities
Authorities created
White Paper on Energy Policy of the Republic of South Africa
December 1998
DME None
White Paper on Renewable Energy Policy of the Republic of South Africa
July 2003 DME None
Electricity Regulation Act
January 2006 DME; NERSA Powers of NERSA laid out
Biofuels Industrial Strategy
December 2007
DME None
White Paper on Sustainable Energy for the Western Cape Province
October 2008 Western Cape government
None
National Energy Act December 2008
DME SANEDI
REFIT Consultation Paper December 2008
NERSA Eskom as Single Point Purchaser; NERSA entrusted with operations, review and also issuer of generation license
Draft Independent Power Producer Regulations
January 2009 DME (now DoE)
Buyer Office working under the auspices of the DME

143
PROCEEDINGS Conference MPDES 2011
Figure 1: Map of the Eastern Cape Province of South Africa indicating the study locations (Amigun et al., 2010)
The policy position of South Africa highlights access to affordable energy services for the disadvantaged communities, and delivering sustainable energy services for the national development process. It also provides direction to the restructuring of the fragmented and ineffective electricity distribution industry in order to introduce more competition to the sector. To this end, long-winded stakeholder processes were implemented, some of which are still under way (IISD, 2009).
The population of South Africa will continue to grow for several decades to come; and the energy supply will increase to meet the escalating demand. There are diverging opinions as to whether the energy demand will continue to be served predominantly by extensive grid systems, or whether there will be a strong trend to distributed, or decentralised, generation that is close to the point of use. This is an important policy question but, regardless, it will not preclude the need for more large-scale grid supplied power, most especially in urbanised locations, over the next several decades.
Study context The Eastern Cape is the second largest province of South Africa with proportionally large rural populations; in the order of 62% of the total population. A large part of the Eastern Cape Province (see Figure 1) is from the former homelands of South Africa, where there are high levels of poverty. South Africa’s GDP per capita is $2,500 while the Eastern Cape Province’s is $432.
The case study locations (see Figure 1) belong to the previously underserviced and rural communities in South Africa, with significant natural renewable resources. In addition, like other remote areas of the South Africa, it contains many settlements, mainly hamlets and isolated, ‘sparse’ dwellings, with strong socioeconomic drivers for community energy schemes, due to the lack of grid electricity supply. An initial renewable energy feasibility assessment was conducted in July 2009 by the Council for Scientific and Industrial Research (CSIR) in association with the local communities. The feasibility assessment indicates that small-scale wind turbines, solar PV, and biomass (woodfuel and anaerobic digestion) could serve as a source of energy supply. The analysis of this paper is based on this assessment. The technology options considered for the conversion of renewable resources to electricity in this study are described in Table 2.
Table 2: Electricity generation technology options, corresponding end-uses and status
Conversion technology
Resource Type
Examples of fuels
Product End-use Technology Status
Photovoltaic Solar (sun) Solar (sun) Heat & electricity Heat, Electricity Commercial
Gasification Mainly solid biomass
Wood chips and pellets, agricultural Residues
Product gas Heat (boiler), Electricity (engine, gas turbine, fuel cell, combined cycles), Transport fuels (methanol, hydrogen)
Demonstration/ Early commercial
Anaerobic Digestion
Wet Biomass
Manure, sewage Sludge
Biogas + by-products
Heat (boiler), Electricity (engine, gas turbine, fuel cell), Transport fuel
Commercial
Wind Wind Wind Heat & electricity Heat, Electricity Commercial

144
PROCEEDINGS Conference MPDES 2011
MCDA methodology Expert Choice 2000TM, a multi-attribute decision support software tool based on the analytic hierarchy process (AHP) method, developed by Saaty (1980), was used to choose the most suitable alternative from a range of renewable energy technology for electricity generation in the rural Eastern Cape of South Africa. This methodology was chosen because it has been employed widely in environmental and other decision-making contexts. AHP is a mathematically rigorous, proven process for prioritization and decision-making. It is one of the most suitable techniques for decision making because of its simplicity, flexibility, intuitive appeal and its ability to handle both quantitative and qualitative criteria in the same framework (Ramanathan and Ganesh, 1997). The MCDA development procedure in this study was conducted with the involvement of diverse audience of stakeholders (environmental NGOs, local community including focus group, and community leaders, municipality officials and other relevant government bodies). Participation of the stakeholders at the pre-decision stage is crucial to get a richer understanding of the problem at hand. This includes defining the range of alternatives that need to be considered and /or identifying major points of view and other key concerns that should be taken into account. They further contributed to the measurement and scaling of the defined criteria.
Despite the popularity of the AHP, many authors have expressed concern over certain issues in the AHP methodology. According to Ramanathan and Ganesh (1995), the main disadvantage is that AHP is very time consuming when the number of alternatives and/or criteria is large, as is often the case in energy problems. Specifically, with AHP, the decision problem is decomposed into a number of subsystems, within which and between which a substantial number of pairwise comparisons need to be completed. This approach has the disadvantage that the number of pairwise comparisons to be made, may become very large (n(n−1)/2), and thus become a lengthy task (Macharis et al., 2004). Another, often criticised problem with the AHP method is the conversion from verbal to numerical judgments given by the fundamental scale, a special ratio scale developed by Saaty (1980, 1996) and depicted in Table 3
Table 3: Fundamental scale
1 Equally preferred
3 Weak preference
5 Strong preference
7 Very strong or demonstrated preference
9 Extreme importance
2,4,6,8 Intermediate values
The mathematical procedure that is used to calculate the
overall ranking is quite complex (more details can be found for instance in Saaty, 1980; Saaty, 1985; Saaty,
1996), and the procedure is, therefore, normally carried out with specialised designed computer programs.
Result and discussion Sustainability has a number of dimensions. The sustainability criteria and indicators that were employed in this study represent economic, environmental, social and technical sustainability. These dimensions are not independent and therefore, for the purpose of this study, equal importance was assumed for the high-level criteria for sustainable development. Their relative magnitudes for the different electricity generation technologies are allotted based on the published information, stakeholder and expert contributions. This is summarised in Table 4.
The outcome of the analysis is illustrated in Figures 3. The Figure suggests that electricity production from wind is the highest ranking substitute for conventional electricity supply due to its overall performance. This is followed by photovoltaic and then anaerobic digestion. Gasification was found to rank the lowest from the four renewable energy technologies. In the social sustainability, one of the concerns with anaerobic digestion and gasification is the competing use of available resources. A major concern in the case study areas is the competition of biomass energy systems with the present use of biomass resources, such as animal dung, agricultural residues and grasses, in applications such as soil maintenance and fertilisation, animal feed and bedding, and construction materials.
This is of higher priority to the rural populations, as alternatives do not exist. A detailed and participatory resource evaluation (mapping) of renewable energy technology therefore need to be carried out before commencing action on bioenergy systems that use existing resources. Wind technology has the lowest external costs (global warming) of all the renewable energy technologies investigated

145
PROCEEDINGS Conference MPDES 2011
Table 4: Sustainability criteria used in the study1
Source: Agama Energy, 2003 (see reference); Begic´ and Afgan, 2007 (see reference); Evans et al., 2009 (see
reference); Evans et al., 2010 (see reference); van den Broek et al., 2000 (see reference); Walla, C., Schneeberger, W. 2008 (see references); http://www.dme.gov.za/pdfs/energy/cabeere/case_eastern_cape.pdf; http://www.ler.esalq.usp.br/disciplinas/Romanelli/LER%20244/Material_Extra/ACV_LCA_of_renewable_energy_for_electricity.pdf http://www.earthlife.org.za/wordpress/wp-content/uploads/2009/02/se-2-employment-potential-of-re.pdf
1 *Photovoltaic efficiency is highly variable due to the large range of cell types available, with an ideal cell efficiency of 30%
*Wind efficiency is also wide ranging due to the wide variation in quality of wind resources at different locations. A good wind resource, with location carefully selected will give greater than 40% efficiency.
*The average greenhousegas emissions from biogas plant depend on the composition of biogas and combustion efficiency.
Sustainability indicator
Units Indicator Name PV Solar
Wind Anaerobic digestion
Gasification
Economic indicator
US$/KW Investment indicator 4900 2400 2750 2950
USc/KWh Median cost of electricity
24 6.6 6.0 6.9
Resource availability
Dmnl Resources availability and competing use (security of supply)
High High Medium Medium
Environmental indicator
gCO2/KWh average greenhouse gas emissions expressed as CO2 equivalent
90 25 68 75
Social indicator Person.yr/MW.yr Job creation 35.4 16 5 32 Efficiency
% Efficiency of electricity generated
30
40
31
35
Safety Hazard level Safety Low Low Medium Medium Visual impact Dmnl Aesthetic Medium High Low Low Impact on ecology
Dmnl
Impact on birds and terrestrial ecosystem
Low
Medium
Low
Low
Community preference
Dmnl Societal/community acceptance
High High Medium Low
Water consumption
Dmnl Water consumption Medium Low High High
Security risk Dmnl Risk of vandalisation High High Low Low Technology maturity
Dmnl Technology maturity and local technology provider availability
High Medium
High Medium

146
PROCEEDINGS Conference MPDES 2011
However, overall, gasification outperformed wind and anaerobic digestion on the social criterion. This is due mainly to higher socio-economic benefits from job creation. Anaerobic digestion has the least overall ranking in social criterion. This use of human and animal wastes for biogas production and the subsequent digested sludge as a source of fertiliser faces cultural and health resistant from the community. On the environmental sustainability, wind technology suffers from visual impact (aesthetic). However, some of the stakeholders argued that wind technology executed with thoughtfulness, will blend in seamlessly with its surroundings and could be viewed as a sculptural element of the landscape. It was generally accepted that wind technologies are better neighbours than traditional energy sources and provide power generation with zero to low carbon emissions. On the impact on birds and terrestrial ecosystem, the impact from wind technology is very small compared to buildings, communication towers and transmission towers. Today’s tubular tower design gives no reason for birds to be attracted for nesting as the older scaffold design had been. Proper siting of the technology is however the most important aspect to reduce risk to birds and terrestrial ecosystem. Sites should be studied to determine the migratory and local avian patterns for sustainable development. The largest barrier for PV’s extensive utilization is its high cost. Despite the fact the cost has decreased over the years as newer technologies and advancements dictates a more economic viability for broader use, the overall cost is still unaffordable for most of the Eastern Cape rural communities.
A head-to-head comparison between photovoltaic and wind, shown in Figure 4, revealed that wind technology is both environmentally and economically more sustainable than photovoltaic.
Photovoltaic on the other hand is more socially and technically sustainable than wind. From the social sustainability point of view, some of the concerns raised by the community include opportunities for local employment arising from the manufacture, installation and operation due to the specialised knowledge or equipment required for wind technology and the fact that wind prospecting is still in its infancy in South Africa. The technical sustainability which entails using best practice products, services, work practices and institutional arrangements, as well as the fostering of appropriate innovation in hardware, software and institutional framework, with an appropriate balance of self-sufficiency objectives at local, regional and national levels favours the application of photovoltaic technology. This is primarily due to the locally available technology and experience with this technology. South Africa has over 20 years experience in the manufacture and distribution of PV systems. The bulk of the companies produce Balance of System (BOS) component for use as electrical controls and power storage device (GTZ, 2010). However, the mean price of electricity generated from PV is higher than wind technology.
A head-to-head comparison between photovoltaic and anaerobic digestion is illustrated in Figure 5. The Figure revealed that photovoltaic is socially, environmentally and technically more sustainable, while anaerobic digestion is
more economically sustainable. A central feature of both biogas and photovoltaic technology is that almost all expenses need to be financed upfront, with very low operating expenses thereafter (Amigun and von Blottnitz, 2007). This is problematic where poverty is endemic. Anaerobic digestion is economically sustainable compared to photovoltaic because the technology is constructed with locally available materials such as cement, stones, and a mixture of quicklime, sand and clay and no industrially advanced materials.
A sensitivity analysis was carried out to explore the stability of the alternative priority structure. Specifically, the aim was to explore the sensitivity of decision-making processes to simultaneous variations of the preference parameters. The consequence of these preferential uncertainties on the results of the analysis could then be ascertained. Figure 6 show the overall performance scores of the alternatives when the weight of the criterion under consideration is varied from 0 to 1. The vertical axis in Figure 6 represents the overall value of the alternatives and the horizontal axis represents the variation scale of the weight-from zero to one- for each criterion. The point where an alternative line intersects such a vertical line, as read from the axis on the right (labelled Alt%) indicates the priority the alternative received on that criterion.
The overall priority of each alternative is where it intersects the rightmost axis. It was found that the overall ranking of PV solar was the highest when the weight of the social criterion was changed from the initial 25% to 46% while, keeping the proportions among the remaining weights unchanged. This is followed by wind, gasification and lastly anaerobic digestion technology. When the weight of the technical criterion was changed to 93% from the initial 25%, wind technology moves to the second position and photovoltaic becomes the preferred electricity generation technology option. A change in the weight of the environmental criterion to 46% will only make gasification technology the third preferred technology after wind and solar PV. The change in weight to 100% does not have any significant impact on the ranking of the wind and solar PV technologies. Economic criterion has a significant impact on the order of technology ranking. Increasing the weight from the initial 25% to 31% will push anaerobic digestion to the second place after wind technology. At 33% increase, PV solar was the least ranking after wind, anaerobic digestion and gasification. The sensitivity analysis indicated that economic criterion has the highest impact, followed by social criterion.

147
PROCEEDINGS Conference MPDES 2011
Figure 3: AHP assessment of electricity generation technologies with respect to four main criteria.
Figure 4: Weighted head-to-head comparison between photovoltaic and wind technology
Figure 5. Weighted head-to-head comparison between photovoltaic and anaerobic digestion
Wind PV Solar
PV Solar Anaerobic digestion

148
PROCEEDINGS Conference MPDES 2011
Figure 6. Sensitivity analysis (alternatives priorities changing with change at social criterion weight)
Conclusion This paper discussed a systematic approach to an electricity technology assessment problem for sustainable development in a rural community in South Africa, using the AHP technique. The paper focused on social, environmental, economic and technical assessments of different electricity generation technologies using multiple stakeholders and expert judgements to rate renewable energy technologies on a set of indicators that were generated in a discursive and consultative process. The indicators were used to rank the renewable energy technologies against the relative performance of each competing alternative assuming equal importance of the four main criteria of sustainable development. The priority structure that has been developed through the study suggests that the wind alternative obtains the highest ranking, followed by photovoltaic, anaerobic digestion (biogas) and lastly gasification. A sensitivity analysis revealed that it is possible to change the rank of options by recalibrating the scoring scales for the criteria thereby minimising the need for treating uncertainties in the criteria weighting and the thresholds values explicitly in a post-evaluation phase and serve as a tool to pinpoint areas where more deliberation may be required. Displaying trade-offs among performance criteria could assist policy makers and energy to understand the relative advantages and disadvantages of management options. With the knowledge of uncertainty, the decision maker and energy (electricity) planner can gauge how much confidence they want to place in the model output for use as a reference in prioritising the renewable energy technology for electricity generation. The study also revealed that stakeholder inclusion is beneficial as participants can be the source of relevant local and social knowledge. MCDA requires a blend of technical knowledge, combined with a clear understanding of the
larger context of social, economic and political concerns that influence the problem situation.
While this research focused on the comparative assessment of renewable energy technologies for electricity generation, it should be noted that technologies are not always in a situation of pure competition; they are partly complementary, and partly competing due to seasonal and diurnal characteristics. Future technology rankings should thus focus on comparing bundles of technologies, or a hybrid configuration, such as combined wind and PV (see Figure 9), rather than individual technologies.

149
PROCEEDINGS Conference MPDES 2011
Figure 9. A mini-hybrid off-grid electricity system (PV and wind) at Lucingweni Village, South Africa (adapted from Rogers, 2009)
Acknowledgments
The authors would like to thank to Greg Forsyth and David Le Maitre of the South African Council for Scientific and Industrial Research for their contributions.
References Agama Energy. (2003). Employment Potential of
Renewable Energy in South Africa. Cape Town: Agama Energy.
Amigun, B., & von Blottnitz, H. (2007). Investigation of scale economies for African biogas installations. Energy Conversion and Management 48, 3093-3094.
Amigun, B, Görgens, J., & Knoetze J.H. (2010). Biomethanol production from gasification of non-woody plant in South Africa: optimum scale and economic performance. Energy Policy 38, 312–322
Amigun, B., Musango J.K ., & Brent, A.C. (2010). Community perspectives on the introduction of biodiesel production in the Eastern Cape province of South Africa. Paper submitted to Renewable Energy (Manuscript number RENE-D-10-00975).
Begic´, F., & Afgan, N.H. (2007). Sustainability assessment tool for the decision making in selection of energy system—Bosnian case. Energy 32,1979–1985
Belton, V., & Stewart, T.J. (2002). Multiple Criteria Decision Analysis – An Integrated Approach. Boston/Dordrecht/London: Kluwer Academic Publishers, Dordrecht.
Brent, A.C., & Rogers, D.E.C. (2010). Renewable rural electrification: Sustainability assessment of mini-hybrid off-grid technological systems in the African context. Renewable Energy, 35, 257-265.
Bridgwater, A.V. (Eds.), 2001. Progress in Thermochemical Biomass Conversion. Blackwell, Oxford, UK.
Carrera, C.G, & Mack, A. (2010). Sustainability assessement of energy technologies via social indicators: result of a survey among European energy experts. Energy Policy 36, 1030-1039
Council for Scientific and Industrial Research (CSIR), South Africa. (2010). Study on photovoltaic technologies in South Africa. A Report Prepared for
German Development Cooperation (GTZ). Document reference number: 06000/ONRDE/JZSEN01
Department of Minerals and Energy (DME). (1998). White Paper on the Energy Policy, December 1998. South Africa (1998). Accessed from http://www.dme.gov.za
Dinh, L.T.T, Guo, Y., & Mannan, M.S. (2009). Sustainability evaluation of biodiesel production using Multicriteria decision –making. Environmental Progress and Sustainable Energy 28(1), 38-46.
DME, (2002). White Paper on the Promotion of Renewable Energy and Clean Energy Development. Part One.Pretoria, Republic of South Africa.
Elghali, L., Clift, R., Sinclair, P., Panoutsou, C., & Bauen, A., (2007). Developing a sustainability framework for the assessment of bioenergy systems. Energy Policy 35, 6075-6083.Department of mineral and energy, 2005. http://www.dme.gov.za/pdfs/energy/cabeere/case_eastern_cape.pdf
Evans, A, Strezov, V., & Evans, T.J. (2009). Assessement of sustainability indicators for renewable energy technologies 13, 1082-1088
Evans, A, Strezov, V., & Evans, T.J. (2010). Sustainability consideration for electricity generation from biomass 14(5), 1419-1427
Foster-Pedley J., & Hertzog H. (2006) Financing strategies for growth in renewable energy industry in South Africa, Journal of Energy in Southern Africa 17 ( 4), 57–64.
Greening, L.A., & Bernow, S. (2004). Design of coordinated energy and environmental policies: use of multi-criteria decision-making. Energ Policy 2004 32(6),721–35.
Huizingh, E.K.R.E., & Vrolijk, H.C.J. (1997). A comparison of verbal and numerical judgments in the analytic hierarchy process. Organ Behav Human Decision Process 70(3), 237–47.
Haralambopoulos, D.A., & Polatidis, H. (2003). Renewable energy projects: structuring a multi-criteria group decisionmaking framework. Renewable Energy 28(6), 961–73.

150
PROCEEDINGS Conference MPDES 2011
International Institute for Sustainable Development (IISD) (2009). Clean energy investment in developing countries: Domestic barriers and opportunities in South Africa South Africa Institute for International Affairs. Draft Discussion paper.
Keeney, R.L., & Raiffa, H. (1976). Decisions with multiple objectives: preferences and value tradeoffs. Wiley, New York, USA
Khumalo,G., Ntlokonkulu, L., & Rapoo, T. (2003). Alternative service delivery arrangements at municipal level in South Africa: assessing the impact of electricity service delivery and customer satisfaction in Johannesburg. Social Policy Series. Research Report 100. Online available at http://www.cps.org.za/cps%20pdf/RR102.pdf (accesed July, 2010).
Lana, (2010). Electricity price hike in South Africa. http://www.southafricaweb.co.za/article/electricity-price-hike-south-africa [accessed 2 March 2010]
Macharis, C., Springael J., De Brucker, K., & Verbeke, A. (2004). Promethee and AHP: The design of operational synergies in multicriteria analysis. Strengthening Promethee with ideas of AHP. European Journal of Operational Research 153, 307−317.
May, J.R., & Brennan, D.J. (2006). Sustainability assessment of Australian electricity generation. Institution of Chemical Engineers, Trans IChmE, Part B 84(B2), 131-142.
Mhkize, M.W. (2010). An investigation into the application of a Multi Criteria Decision Analysis (MCDA). Technique to assess renewable energy technologies. M.Sc Thesis. Department Of Engineering and Technology Management. University of Pretoria.
Modi, V., McDade, S., Lallement, D., & Saghir, J. (2005). Energy services for the Millenium Development Goals. UN Millennium Project, UNDP, The World bank and ESAMAP.
Munda, G. (2005). Multi-Criteria Decision Analysis and Sustainable Development, in J. Figueira, S. Greco and M.Ehrgott (eds.) –Multiple-criteria decision analysis. State of the art surveys, Springer International Series in Operations Research and Management Science, New York, 953-986.
Munda, G., Nijkamp, P., & Rietveld, P. (1994a). Multicriteria Evaluation in Environmental Management: Why and How? In: Paruccini, M. (ed.): Applying Multiple Criteria Aid for Decision to Environmental Management. Dordrecht: Kluwer Academic Publishers.
Munda, G., Nijkamp, P., & Rietveld, P. (1994b). Qualitative multicriteria evaluation for environmental management. Ecological Economics 10(2), 97-112
New Partnership for African Development (NEPAD) (2001). Conference report, Abuja, online available at http://www.uneca.org/eca-resources/conferencereport/ NEPAD.html (accessed March 2005).
Ramanathan, R., & Ganesh, L.S. (1995). Energy resource allocation incorporating qualitative and quantitative
criteria: an integrated model using goal programming and AHP. Socio-Econ Plan Sci 29(3),197–218.
Republic of South Africa. (2009). South Africa yearbook 2009/2010, Pretoria, South Africa, gcis.
Rogers, D. (2009). Is renewable electricity a sustainable solution for rural South Africa? Sciencescope 4(1), 36-38.Online available at http://www.csir.co.za/publications/pdfs/june_scope.pdf (accessed July 2010).
Saaty, T. L.(1980). The Analytic Hierarchy Process, McGrawHill, New York, USA
Saaty, T. L. (1985). Decision Making for Leaders, Belmont, California: Lifetime Leaning Publication, 1985
Saaty, T. L. (1986). Axiomatic Foundation of the Analytic Hierarchy Process, Management Science 32(7), 841-855.
Saaty, TL. (1996). Decision making with dependence and feedback: the analytic network process; the organization and prioritization of complexity. Pittsburgh, PA: RWS Publications.
Smeets, E. (2008). Possibilities and limitations for sustainable bioenergy production systems. PhD Thesis. Utrecht University. The Neitherlands.
Buchholz , T., Rametsteiner, E., Volk, T.A., & Luzadis, V. (2009). Multi Criteria Analysis for bioenergy systems assessments. Energy Policy 37, 484–495.
van den Broek, R., van den Burg, T., van Wjk, A., & Turkenburg, W. (2000). Electricity generation from eucalyptus and bagasse by sugar mills in Nicaragua: a comparison with fuel oil electricity generation on the basis of costs, macroeconomic impacts and environmental emissions. Biomass Bioenergy
Vindis, P., Mursec, B., Rozman, C., & Cus, F. (2009). A multi-criteria assessement of energy crops for biogas production. Journal of Mechanical Engineering 56 (1) 63-70.
Walla, C., & Schneeberger, W. (2008). The optimal size for biogas plants. Biomass and Bioenergy 32, 551 – 557

151
PROCEEDINGS Conference MPDES 2011
1
Comparative Analysis between Grid Extension and Decentralized Solutions for Rural Electrification - Case study: SofalaProvince in Mozambique
Jakob Graf, Yoann Le Fol, Adrian Donnay, Ioannis Chatzipoulidis, Md Zahangir Mozumder, Maria
Zampouki, Ph.D. Fellow Anna Carlson, Assist. Prof. Morten Boje Blarke ([email protected])
MSc Sustainable Energy Planning and Management Department of Development and Planning.
Aalborg University, Fibigerstraede 13, Aalborg, DK 9220 Denmark.
Abstract
A special early excerpt of the IEA’s World Energy Outlook 2010 focusing on energy poverty indicates that 1.4 billion people don’t have access to electricity, 85 % of which live in rural areas. The social, economic and local environmental benefits from having access to electricity are well-known, including less indoor pollution, less spending on fuel, less stress on the local eco-system, expansion of the productive and social hours of the day, cooling for food and medicine, and enabling education in the evening hours. This study examines options for rural electrification in Mozambique, where 89 % of the population doesn’t have access to electricity. Conventional and alternative options are compared with respect to energy, environmental, and economic consequences. The research methodology follows a knowledge-based approach, which allows for a comprehensive and holistic evaluation of how different rural electrification options affect the society in general, and the economy in particular. The paper presents an innovative techno-economic model for Mozambique that evaluates how different stakeholders and economic sectors are influenced by conventional and alternativeoptions for rural electrification. The study offers new qualitative and quantitative empirical data, which support a significantly better understanding of how different rural electrification strategies are impacting society. Keywords:Rural Electrification; Mozambique; Techno-economic model; Sustainable energy.
Introduction Electrification supports development Mozambique is one of the poorest countries in the world, with 11.9 million people living below the poverty line (Cuvilas et al., 2010). The main objective of the Government of Mozambique (GoM) is to reduce the levels of absolute poverty to less than 50% by the end of 2010 (Tvedten et al., 2010).
The achievement of this goal within rural areas of the country is correlated with access to electricity (Silva & Nakata, 2009).
Access to modern energy sources is linked with the strategy undertaken by the GoM towards the eradication of poverty and the elimination of regional imbalances in socio-economic development, focusing on the poorest segments of the rural population (Tvedten et al., 2010). Access to electricity in remote areas, where 63% of Mozambicans live, is essential because it widens opportunities for initiatives and activities by which people can improve their standard of living in terms of improved
quality of education, health services and rural empowerment (INE, 2007).
Electricity will create new business opportunities, prolong productive hours and allocate more time for education and social activities, particularly in the evening hours.
In the context of health, it will increase the ability to operate diagnostic apparatus, improve hygienic standards through better sterilization processes, store and cool vaccines and medicine, thus providing better treatment to patients.
Considering rural empowerment, access to electricity can be seen as an important feature in boosting the structural institutional changes necessary for sustainable economic development (OECD/DAC, 2010), as the agricultural sector accounts for 40% of Mozambique’s Net National Product (NNP) and employs 95% of the households in rural areas (Bias & Donovan, 2003).
Traditional biomass (firewood in its raw form, charcoal and straw) is still the predominant energy source in marginalized communities with an average annual consumption of 1.0 m3 per capita (GRNB, 2008). The inefficient combustion of biomass for cooking paired with the use of kerosene for lighting, contributes to indoor pollution with severe consequences to health, especially of women and children. It is estimated that access to electricity can reduce the mortality of those 1,428 per million people who now die every year from indoor and outdoor pollution related to the combustion of biomass fuels (Klugman, 2010). However, the introduction of electricity for lighting can only contribute little to solve this problem since inefficient combustion of biomass for cooking will remain the main source of indoor pollution until the introduction of electric stoves.
GoM’s long term plan is aiming to increase the current electrification rate from 2% to 15% by 2020 (Mulder & Bucuane, 2006) in Mozambique.
Currently the national grid in Mozambique distributes the majority of electricity consumption. Despite the fact that there are plans to increase isolated grids in rural areas, extending the national grid is considered the first priority. The reason for this is the hydro potential, which is characterized by low costs (Mulder & Tembe, 2008). The current electrification master plan has the goal to supply the major cities using conventional three-phase technology (Holland & Meyer, 2009).

152
PROCEEDINGS Conference MPDES 2011
2
Failure to Electrify Rural Communities Despite large-scale government programs for rural electrification in the past (PARPA, 2002), a mere 2% of rural population have access to electricity (AIM, 2008), which is mainly provided through diesel generators (Cuvilas et al., 2010).
Three main reasons for the failure of successful electrification have been identified: (a) rural populations usually live in dispersed settlements, which are often difficult to access with inadequate basic infrastructure, requiring long rural feeder expansion; (Chambal, 2010, Zerriffi, 2011) (b) huge costs of installing an energy grid paired with an inability of the utilities to mobilize sufficient investment. In Mozambique, the distribution cost per household is US$800 national average (Chambal, 2010) and US$2,500 in rural areas (Mulder, 2007). The low returns on investment, due to low consumption and low ability of the rural population to pay, makes recovering costs from centralized grid expansion difficult (Zerriffi, 2011). These technical difficulties and poor return expectations, paired with a (c) lack of political will lead to a non-interest for rural electrification on the utility’s part (Foley, 1992). In the Mozambican example, the small sized and modestly budgeted government organization National Energy Fund (FUNAE) is responsible for managing all technical, financial and societal aspects of off-grid electrification. Whether this institution is capable of handling such a wide range of activities effectively is being questioned (Chambal, 2010). According to Electricidade de Moçambique’s (EdM) Annual Statistic Yearbook 2002, based on historic performance, the utility has added an average of 11,000 customers to the grid per year. However, this increase is
off-set by a population growth of 1.2%, meaning that in real terms access levels are decreasing (Nhete, 2005).
Considering these obstacles and reasons for the low
electrification rate in rural Mozambique, it becomes clear that the conventional approach has failed to deliver the desired result and cannot be expected to do so in the foreseeable future.
Research Objective This paper analyses the challenge of electrification in the case of the central Mozambican province of Sofala. It follows a comparative approach regarding to economic, technological and societal aspects of rural electrification, comparing the conventional approach with what is called the alternative approach. Moreover, it highlights the correlation between the access to electricity and the benefits for the rural community of Sofala by analyzing the comparative benefits that these two electrification approaches offer.
Methodology The paper conducts a comparative techno-economic analysis in combination with a comparative planning framework analysis that identifies the characteristics of different electrification approaches. The techno-economic analysis examines approaches with respect to energy planning and investment.
The empirical data used in this paper were collected through literature review and expert consultancy, allowing for a critical analysis of available technical options for rural electrification.
Model
Figure 1: Benefits of Technology Adaptation Model.
Figure 1 illustrates the model developed in this paper as an analysis of the social, political, environmental and economic circumstances for technological change in
Mozambique. It is intended as a tool, which enables planners to identify which technology is most suitable and therefore most likely to deliver a desired product under

153
PROCEEDINGS Conference MPDES 2011
3
certain framework conditions. It consists of four steps: analysis, perspective, determination and development.
Analysis As a first step, the desired requirements (Rt) of the
eventual product (Pr) are defined. This is done under consideration of economic (Ec), political (Po.), societal (So.) and environmental (En) aspects of the overall environment/society (framework) for which the final product is aimed.
For electrification in rural Mozambique the following requirements (Rt) were identified: (a) reliable provision of electricity, available at any time; (b) effective and efficient electrification with distribution ability; (c) electrification for individuals as well as community purposes.
Perspective In a second step, possible technologies are identified.
Although they have very different characteristics they can equally deliver the desired results.
In the Mozambican context both the alternative approach (T1) and the conventional (T2) approach could provide the desired service.
Determination In a third step, the identified technologies are evaluated
according to Müller’s concept for identifying the most suitable technology (Müller, 2010).
According to Müller, any technology embraces a combination of four constituents: technique, knowledge, organization, and product (represented in the inner puzzle). The technology itself is shaped by (a) a social relation of production, (b) the overall socio-political setting, (c) the natural resources & environment and (d) the historical and cultural background, which is represented by the outer puzzle.
In his work on technology transfer to developing countries, Müller (2010) argues that there are three options to implement any new technique from one social setting to another. Option 1 is that the technology being implemented is fully adapted to the social settings of the receiver. This approach that any technology introduced to developing countries should be appropriated for local conditions was very popular in the 1970’s. However, it has turned out that this approach is leading nowhere since any technology that is totally appropriate would already be there. Option 2 is that the social setting of the receiver is fully adapted to match the technology provided. This option is obviously neither feasible nor desirable, as it would take a very long lifespan to change the social conditions of a developing country to become fully equal to that of a developed country. A third option is when the technology implemented and the social settings of the receiver are changed to fit each other. Instead of fully adapting either the social settings of the receiver to fit the technology, or vice versa, both the technology and the social settings have to match for a sustainable assimilation process.
Applying Müller’s concept to the case of rural electrification in Mozambique it allows identification of a suitable technology under the consideration of local social, political, economical and environmental conditions.
Development In the final step, the determined technology from step
three is taken to create a product (Pr), which fulfills the requirements analyzed in step one. This product will then eventually deliver the benefits (B) to society.
It is important to note that the possible benefits of both technologies are likely to be the same to some extent. The crucial point, however, is that only the suitable technology will be able to deliver the product and therefore the benefits.
Analysis A Comparative Approach Two electrification approaches are analyzed. The expansion of a central national grid in combination with large-scale central supply technologies has been the predominantly, traditional view of electrification around the world, and is referred to as the conventional approach. The alternative approach refers to electrification with microgrids and small-scale distributed power generation (DG) technologies.
The conventional approach is characterized by centralized electricity production through large power plants with long, high voltage 2-3 wire transmission and distribution (T&D) lines (Zerriffi, 2011). The implementation of this approach requires expertise in electricity production and distribution, as well as high capital investment and a well-developed infrastructure. This technical centralization is mirrored in the regulatory institutions, which often lay within the utility itself with strong governmental links. Since the economic feasibility of this approach relies on a high density of customers with a high demand for electricity and an ability to pay, this option is limited to urban or industry-intensive areas. Nevertheless, this is still the predominant approach to electrify rural areas due to a combination of regulations, historical path dependence and deep-seated norms (Zerriffi, 2011).
The alternative approach is characterized by decentralized electricity production using photovoltaics (PV) and biomass, and direct distribution through microgrids, using the SWER (Single Wire Earth Return) technology. The simple design of SWER makes it cost effective and does not require high expertise for installation and maintenance, since it has already been used for transmission and distribution of electricity in Mozambique (Holland & Meyer, 2009). The small-scale characteristic of microgrids also favors transparency, allowing for the active involvement of local stakeholders, and customized designs according to region and community (Silva & Nakata, 2009, Zerriffi, 2011). Moreover, a commonly operated microgrid strengthens the social structures of a community and tends to decrease the gap between the rich and poor members of a community (Philipp & Schäfer, 2009).
A detailed description of the characteristics of both approaches is shown in Table 2.
Framework of Sofala Study The distribution network of Mozambique is divided into a northern, a southern and a central sector (EDM, 2006), with the latter crossing Sofala from Beira sea port in the

154
PROCEEDINGS Conference MPDES 2011
4
east to Zimbabwe in the west, making up the Central Mozambique Grid (CMG) (Arthur et al, 2010). This so-called ‘Beira Corridor’ is 100 km wide, leaving the vast majority of the dispersed villages unelectrified (Figure 2).
Figure 2: Sofala population and electricity distribution.
The electricity for the CMG comes partly from the
hydro stations Mavuzi & Chicamba, contributing 182.5 GWh of the 426.9 GWh total production in 2006. The remaining 240.9 GWh were purchased from Hidroelectrica De Cahora Bassa (HCB) (EDM, 2006). However, high transmission and distribution losses (24%) reduced the available electricity to 313.6 GWh.
Furthermore, 9 diesel-generated microgrids provide electricity in rural Sofala (Mulder, 2007). According to a FUNAE study, one isolated grid supplies 73 customers on average, with each household consisting of 4 or 5 people (Mulder, 2007). The GoM has a long term plan aiming to increase the current electrification rate from 2% to 15% by 2020 in Mozambique (Mulder & Bucune, 2006). The paper does not follow the objectives of GoM, which refer to the whole population (urban & rural). Its focus is on rural content where the electrification growth is lower. Hence, the techno-economic analysis studies the cost to electrify 15% (290,000 people) of the Sofala rural population, by 2031, under the following assumptions:
100 five-person households per microgrid with an
average annual 300 kWh consumption per household (lighting: 3-4 light bulbs, video, fan and several low consumption appliances (Karhammar et al., 2006)).
An additional 500 kWh per year for common equipment like refrigerator, water pumps and street lights. Consequently, one microgrid’s average consumption is 30,500 kWh of electricity per year.
Technical Description of Conventional and alternative Approach A technical description of the two approaches is illustrated in Figure 3. The conventional approach relies on CMG. Electricity is distributed from hydro dams and power plants using fossil fuels, while the rest is imported electricity from border cities. The alternativeapproach uses SWER as the means of delivering electricity, generated by renewable energy systems (RES), in this case biomass plants (wood-based gasifiers) and photovoltaic plants.
Such systems are preferred for rural electrification in developing countries for three reasons: (a) the investment in a RES-based system can be adjusted to the demand, (b) end-users in remote locations can be supplied independently of the main grid and (c) electricity demand in rural areas is low (Lemaire, 2009).
Figure 3: Energy plan approaches.

155
PROCEEDINGS Conference MPDES 2011
5
Description DG-technologies SWER systems are used for low-cost rural electrification and serve as an economic alternative to three-phase distribution systems (Mandeno, 1947). SWER is used in sparsely populated, remote areas to supply scattered, small-customer loads (Hosseinzadeh et al., 2010). A SWER line consists of a single conductor distributing single-phase medium-voltage power and using the ground for the return path, thus enabling cost reduction by long single line spans with minimal pole-top hardware (Karhammar et al., 2006). Power is supplied from a 22 kV three-phase feeder to the SWER line (12.7 kV or 19.1 kV line to earth) via a 22/12.7 kV or 22/19.1 kV isolating transformer (Hosseinzadeh et al., 2010). Its main advantages are reduced initial capital cost, ease of construction, design simplicity, low maintenance costs and lower bush fire hazard (Karhammar et al., 2006), while the disadvantages include earth resistivity issues and voltage drop (Anderson, 2002).
A PV-based microgridgenerates electricity, stores it in a centrally located battery bank and inverts it to AC current (ESMA, 2000). Lead acid batteries have proven to be an appropriate storage technology, as they are the cheapest option in relation to the power quality they offer for microgrid applications (Beurskens et al., 2003). Mozambique has an average solar radiation of 5.6 kWh per m2 per day(Photovoltaic Geographical Information System (PVGIS)).
The capacity of the biomass-based microgrid depends on the availability of biomass as an energy resource (REEEP & UNIDO, 2010). In Mozambique it is estimated that a production capacity up to 6.7 EJ/year (higher heating value) of biomass can be realized, still fulfilling strict sustainability criteria (Batidzirai et al., 2006). In this analysis, a wood-based gasifier is used. Although gasification is a simple technology widely used in rural communities of the developing countries and also cost efficient in Mozambique, it is characterized by the time consuming process of collecting fuelwood, and by polluting emissions, such as particulates (flying ash) and gaseous pollutants (i.e. CO2, SO2, NOx, COS), especially if the gasification process is not safely controlled (Androutsopoulos & Hatzilyberis, 2002). The analysis is based on an energy mix of 70% solar PV and 30% biomass.
Dimensioning Calculation For the conventional approach, it is assumed that Mozambique’s current energy capacity could supply the demand growth. Solar PV and biomass plant are dimensioned according to the microgrid demand and the resource availability.
Solar PV dimensioning is made with PVGIS. The storage system which accompanies each solar PV plant allows for three days (D) of autonomy and has various characteristics like inverter efficiency, charge/discharge efficiency and maximum depth of discharge (MDoD). Methods from Chaurey & Kandpal (2010) are utilized in order to define storage system size.
MDoDVECDNAhbankBattery
batteryechinverter
arg
)(
N is the number of households per microgrid, ŋ the
efficiencies and V the battery voltage. EC represents the daily household’s consumption (Wh).
Microgrids, supplied by biomass, are designed according to demand and capacity factor (CF). CF represents the quantity of energy produced by a power plant during one calendar period divided by the theoretical maximum quantity of energy produced during that period.
CFECkWplantonGasificati
8760
)(
Gasification capacity dimension is overestimated
because of the specific load curve. Biomass resource availability is not taken into account in this analysis. Nevertheless, in order to evaluate fuelwood consumption, the conversion efficiency of the gasifier (ŋ gasifier) is applied.
gasifier
ECkWhnconsumptioFuelwood
)(
Distribution design For both approaches a detailed mapping of the grid is not performed. Various parameters are based on a case study to evaluate grid extension, which was conducted in the Nampula province of Mozambique (Mulder & Tembe, 2008). In the case study, the grid was expanded by 160 km in two years (1999-00) and brought electricity to 1,600 inhabitants by 2005. The total investment of this project amounted to US$4 million. By comparison with the distribution of population in Sofala, it is posited that Nampula observations are suitable for this analysis. From main grid lines, situated in Beira Corridor, it is possible to reach all remote areas with a scale comparable to the Nampula project.
The total average length of each microgrid is estimated to be 30 km, which means that the electrification of each household requires 300 m of SWER power line on average.

156
PROCEEDINGS Conference MPDES 2011
6
Table 1: Main techno-economic features of conventional and alternative approaches
.
Figure 4: Electrification development and grid network planning.
Figure 5: RES development for alternativeapproach.

157
PROCEEDINGS Conference MPDES 2011
7
Figure 6: Costs evaluation of both. Cost Analysis Calculations This analysis considers the cost of the different approaches; however financing options and tariff schemes are not considered. It is nevertheless accepted that a household’s ability to pay for electricity has consequences on energy planning. The population’s income helps the feasibility of transitioning from the usage of low-grade energy (charcoal, kerosene, wood) to electricity (Arthur et al., 2010).
In the alternative approach, the analysis calculates costs for PV, battery storage, gasification plants and SWER. In the conventional approach the analysis calculates costs for electricity generation and grid extension.
Given that 99% of power in the CMG is generated from hydro resources (HCB, Mavuzi, Chicamba), only hydropower sales price is integrated into the conventional approach cost calculation (EDM, 2006). The analysis focuses on three types of cost, namely investment, fuel and operation and maintenance (O&M). A discount rate of 10% is applied.
Technical and economic assumptions are presented in Table 1.
Results Techno-economic Results According to INE, Sofala’s rural population will grow linearly to reach 1.95 million inhabitants by 2031. Assuming an electrification goal of 15%, it is implied that 290,000 people would gain access to electricity.
The energy distribution design determines the total grid length for both approaches and measures microgrid development for the alternative approach. According to calculations, 570 microgrids or 25,000 km of national grid extension are needed to meet the electrification goal (Figure 4).
In the alternative approach, capacities for biomass and solar PV should increase drastically (Figure 5). In order to fit the electricity demand, solar PV and biomass microgrids are designed with 30 kW plant capacity. By 2031, following the alternative electrification plan, total RES capacity will exceed 16MW.
The techno-economic analysis shows that the alternative and conventional approaches are quite similar in terms of total costs. The alternative approach is 5% more expensive than the conventional approach and sums up to a total of US$162 million. In the alternative approach, the cost of SWER distribution equals 50% of the total investment. Moreover, the SWER grid cost is 45% less expensive than the grid extension cost (Figure 6). This situation is well-known when comparing SWER and extension grid lines costs (Karhammar et al., 2006). The difference between the grid costs is essential and makes the two approaches economically comparable. RES investment (US$78 million) bridges the gap between the two distribution grid costs. In other words, cost reduction due to SWER distribution allows to plan RES generation, allowing it to be economically competitive with conventional electrification.
Table of Comparison of Conventional and alternative Approach This study does not imply that conventional approaches to access modern energy should be discredited from the energy access equation. It is true that extension of the grid will serve more potential end-users, particularly in urban or peri-urban areas where high population density is a reality. The results show that conventional modalities have yet to reach the majority of marginalized communities, and therefore suggest decentralized microgrids as the most appropriate way to provide electricity to rural areas of Mozambique. Reasons for this decision include the following main characteristics of the alternative approach: (a) a simple design and technique allowing customized-, small scale-implementation and ‘low-skilled’ maintenance, (b) a decentralized electricity production and distribution using locally available renewable resources, (c) it creates private business opportunities and jobs in rural areas, keeping the value added chain in Mozambique and reduces foreign dependency.
Furthermore, the application of Müller’s concept offers a possible explanation for the failure to deliver electricity through the conventional approach, since the chosen technology doesn’t adapt to the local framework

158
PROCEEDINGS Conference MPDES 2011
8
conditions. Instead, the technical design remains exactly the same, even though it has been developed for a very different overall framework, i.e. industrialized countries.
The outcome of the article is in accordance with relevant measures and reforms in the Energy Sector adopted by the government of Mozambique, i.e. the Energy Management Strategy (2008-12). The alternative approach provides an option to reach many of the concluded targets, such as increased sustainable access to electricity, the promotion of new and renewable sources of energy, diversification of the energy matrix and the joint planning and integration of energy initiatives with development plans (Chambal, 2010). It also has the potential to enable FUNAE to effectively progress with its efforts to meet off-grid demand. Furthermore, rural electrification has been identified as one of the key factors to stimulate economic activity and is therefore an essential part of the GoM’s Action Plan for the Reduction of Absolute Poverty (PARPA). In a broader context, access to modern energy is crucial to achieve the UN- Millennium Development Goals (MDG),. Even though energy indicators were not included explicitly when the MDG were created, electrification will be necessary to meet many of the goals, whether it is through refrigeration of vaccines (MDG4: Reduce Child Mortality) or lighting to improve evening study conditions (MDG2: Achieve Universal Primary Education).
Despite all the benefits of electrification listed throughout the paper, whether through grid extension or microgrids, electrification alone cannot achieve these benefits but requires the presence of other enabling conditions (Barnes & Floor, 1996; Elias & Victor, 2005). These enabling conditions primarily include having trained health and educational professionals to gain full
advantages of the potential that modern energy forms offer.
Discussion This study examines the appropriateness of utilizing available RES in Mozambique, namely PV systems and biomass. The dimension of the challenge to provide electricity in rural areas is appreciated and is emphasized on adequate responses for low-income people.
It will be important for the GoM to diligently monitor the integration of RES in its energy agenda. The model enables energy planners and policy makers to comprehend the advantages of decentralized renewable technologies and promote more sustainable, secure, efficient and affordable energy access in rural Mozambique. However, it is necessary to highlight that this study is based on a few assumptions, thus caution should be taken in using the results for a specific location. Field studies and raw data collection are recommended in order to ensure the desired outcomes in further studies. It has to be noted that this study does not include the financing of the implementation, nor the environmental aspects.
Acknowledgements The authors would like to thank the NGO named OVE (The Danish Organization for Renewable Energy) for their support and also Peter Mulder, Assistant professor, Department of Spatial Economics, VU University, Amsterdam, Netherland for giving the Mozambique database. The authors also wish to thank Poul Alberg Østergaard, Assistant professor, Department of Development and Planning, Aalborg University, Aalborg, Denmark for his technical discussion.

159
PROCEEDINGS Conference MPDES 2011
9
Table 2: Comparison of conventional and alternative approach.
Conventional Approach State of the art / approach Characteristics Consequences Technical:
National Grid extension 2-3 wire high voltage
transmission Large-scale centralized electricity
production
Centralized Complex techniquerequire expert knowledge Long distance distribution network required Favor electricity export to neighboring countries
Very slow electrification rate (0.5% in 2004) Excludes majority of people Few expert jobs No local resources used, hardly any local job
creation Higher electricity prices due to re-import
Political: Top-down approach Centralized ‘Master-planned’
electrification programs
Lack of democratic decision making process, control & transparency Strong links between government and EDM & weak regulation institution Favors corruption and nepotism
Higher prices through corruption Disenchantment with politics
Social: Non-existing electrification; approach has failed so far. 98% is without electricity in rural Mozambique
Use of alternative energy sources Lack of basic electrical appliances (communication technologies/light/cooling)
Hazardous & dangerous (indoor pollution) Expensive (diesel/kerosene) Educational & health constraints Rural exodus/brain drain No broad participation
Economical Government controlled Reliance on foreign donors & foreign loans State owned utility companies
Lack of private sector Centralized planed market Increase of foreign debt No competition Partly foreign controlled energy market
Few jobs, mostly in urban areas No business opportunities Exclusion of rural population The gap of incomes & development is becoming wider
Environmental: Low CO2 per kWh (largely hydro) Env. impact through dams Plans for coal fired power station
Use largely renewable resource Kerosene and diesel use for light and electricity in rural areas
Possibly resettlement for new dams No significant environmental impact for people from electricity production
alternative Approach State of the art / approach Characteristics Consequences Technical:
SWER-microgrids Solar Home System (SHS) Conventional & SWER
Infinite renewable energy resource Small scale implementation Decentralized production &distribution Cost effective, simple design & technique ‘Low skilled’ maintenance Bigger voltage fluctuation
Effective electrification Customized solutions
Political: Bottom-up approach NGO involvement
Local decision process increased transparency, local governance
Active involvement in planning & decision making Self-determined
Social: Effective and prompt electrification, compared to conventional approach
Provision of small DC appliances (SHS) like light, TV, radio Provision of advanced AC applications (microgrid) like cooling, street light, machinery Strengthen of community life
Increased incentives to live in rural areas Ease rural life Access to modern energy and its benefits
Economical Create new energy market sector Private economic approach Reformation of existing structures
Increase off-grid demand, create competition Reduce foreign dependency Cost effective and efficient rural electrification Tax generation Increased transparency Value added chain in Mozambique
Private business opportunities New finance & lending opportunities Job creation in rural areas in many fields Economic development Increase in wealth
Environmental: Small scale renewable energy supply Locally emission free energy generation
No emission during electricity production but during manufacturing (energy pay back ratio) No dependence on fossil fuel Climate friendly
No local environmental impact of electricity production

160
PROCEEDINGS Conference MPDES 2011
10
Nomenclature
Part Description AC Alternating Current Ah Battery Bank Size (Ampere Hours) CF Capacity Factor CMG Central Mozambique Grid D Days DC Direct Current DG Decentralized Generator Ec Economic EC Daily Household’s Consumption EDM Mozambique Electricity En Environmental FUNAE National Energy Fund GoM Government of Mozambique INE Instituto Nacional de Estatística LCRE Low Cost Rural Electrification MDG Millennium Development Goal MDoD Maximum Depth of Discharge N Number of Households NGO Non-governmental Organization NNP Net National Product OP Operational Period OVE The Danish Organization for Renewable
Energy PARPA
Action Plan for the Reduction of Absolute Poverty
Po Political Pr Product PV Photovoltaic PVGIS Photovoltaic Geographical Information
System RES Renewable Energy Source Rt Requirements SHS Solar Home System So Societal SWER Single Wire Earth Return T&D Transmission and Distribution
References AIM. (2008). Mozambique News Agency: AIM Reports
report No 354. Available: http://www.poptel.org.uk/mozambiquenews/newsletter/aim354.html.
Anderson, G. O. (2002). Rural electrification in Botswana – A single wire earth return approach. Pakistan Journal of Information and Technology, 1(2), (pp. 202-207).
Androutsopoulos, G. P, & Hatzilyberis K.S. (2001). Electricity generation and atmospheric pollution: The role of solid fuels gasification. The Global Nest: the International Journal, 3(3), 171-178.
Arthur, M. de F. S. R., Zahran, S., & Bucini G. (2010). On the adoption of electricity as a domestic source by Mozambican households. In Energy Policy, 38, 7235-7249.
Barnes D. F., & Floor W. M. (1996). Rural energy in developing countries: A challenge for economic development. Annu Rev Energy Env, 21, 497–530.
Batidzirai, B., Faaij, A. P. C., & Smeets, E. (2006). Biomass and bioenergy supply from Mozambique. Energy for Sustainable Development, 10, pp 51–81.
Beurskens, L. W. M., de Noord, M., & Wals, A. F. (2003). Analysis in the framework of the investire network. Economic performance of storage technologies, (pp. 40). ECN-C--03-132.
Bias, C., & Donovan, C. (2003). Gaps and opportunities for agricultural sector development in Mozambique (Research report no. 54E). Maputo, Mozambique.
Buchholz, T., Da Silva, I., Volk, T., & Tennigkeit, T. (2007). Economics of a gasification based mini grid — A Case study of a 10 kW unit in Uganda. Proceedings of the Industrial and Commercial Use of Energy Conference (pp. 125–9). Cape Town, South Africa.
Chambal, H. (2010). Energy security in Mozambique. In Series on Trade and Energy Security –Policy Report 3 (p-8). International Institute for Sustainable Development, Winnipeg, Manitoba, Canada.
Chaurey, A., & Kandpal, T. C. (2010). A techno-economic comparison of rural electrification based on solar home systems and PV microgrids. Energy Policy, 38, 3118-3129.
Cuvilas, C. A., Jirjis, R., & Lucas, C. (2010), Energy situation in Mozambique: A review. Renewable and Sustainable Energy Review, 14, pp 2139-2146.
EDM. (2006). Statistical annual report 2006. p-26. Elias R. J., & Victor D. G. (2005). Energy transitions in
developing countries: a review of concepts and literature, PESD Working Papers. Program on Energy and Sustainable Development, Stanford University, Stanford, p 38.
ESMAP. (2000). Mini-grid design manual. (Technical Paper 007/00, 21364). Washington, DC, USA: The International Bank for Reconstruction and Development /THE WORLD BANK.
Foley, G. (1992) Rural electrification: The institutional dimension. In Utilities Policy 2(4), 283-289.
GRNB. (2008). Avaliaçao dos níveios de consumo da energia de biomassa nas provincias de Tete. Nampula, Zambézia, Sofala, Gaza e Maputo.
Holland, C., & Meyer, H. (2009). Power to the people. Transmission & Distribution World.
<http://tdworld.com/overhead_distribution/low-cost-electricity-rural-Mozambique-200901/index.html>.
Hosseinzadeh, N., Mayer, J. E., & Wolfs, P. J. (2010). Rural single wire earth return distribution networks-Associated problems and cost-effective solutions. International Journal of Electrical Power and Energy Systems.
Instituto Nacional de Estatistica (INE). The Country; (2007), www.ine.gov.mz.
Karhammar, R., Sanghvi, A., Fernstrom, E., Aissa, M., Arthur, J., Tulloch, J., Davies, I., Bergman, S., & Mathur, S. (2006). ESMAP (Technical Paper 104/06). Sub-Saharan Africa: Introducing low-cost methods in electricity distribution networks. Washington, DC, USA: The International Bank for Reconstruction and Development/THE WORLD BANK.

161
PROCEEDINGS Conference MPDES 2011
11
Klugman, J. (2010). The real wealth of nations: Pathways to human development (Human development report 2010). 20th Anniversary Ed., UNDP.
Lemaire, X. (2009). Fee-for-service companies for rural electrification with photovoltaic systems: The case of Zambia. Energy for Sustainable Development, 13, 18-23.
Mandeno, L. (1947). Rural power supply especially in back country areas. Proceedings of the New Zealand institute of engineers, 33 (pp. 234-71). Wellington, Ferguson and Osborn Printers.
Mulder, P. & Bucuane, A. (2006). Financing the Electrification of Mozambique. International Energy Workshop, p-5. Cape Town.
Mulder, P. (2007). Energy outlook for Mozambique (DNEAP Discussion Paper No.53E, p-7). Maputo: Ministry of Planning and Development.
Mulder, P., & Tembe, J. (2008). Rural electrification in an imperfect world: A case study from Mozambique. Energy Policy, 36, 2785-2794.
Müller, J. (2010). Befit for change – Social construction of endogenous technology in the south. Paper for FAU Conference. Djursland, Denmark.
Nhete, T. (2005). Electricity sector reform in Mozambique: A projection into the poverty and social impacts. In Journal of Cleaner Production, 15 (2007), 190-202.
OECD/DAC. (2010). Aid Statistics, Paris: OECD Development Assistance Committee. www.oecd.org.
PARPA. (2002). Action Plan for the Reduction of Absolute Poverty (2001-2005). Strategy document for the reduction of poverty and promotion of economic growth.
Perrin, M., Saint-Drenan, Y.M., Mattera, F., & Malbranche, P. (2005). Lead–acid batteries in stationary applications: competitors and new markets for large penetration of renewable energies. Journal of Power Sources, 144, 402–410.
Philipp, D., & Schäfer, M. (2009). Interdisziplinärer Forschungsansatz zu Analyse von Microenergie-Systemen (pp-12). Graduiertenkolleg Mikroenergie-Systeme.
REEEP, & UNIDO. (2010). Sustainable Energy Regulation and Policymaking for Africa: Distributed generation: options and approaches. <africa-toolkit.reeep.org/modules/Module11.pdf>.
Siemons, R. V. (2001). Identifying a role for biomass gasification in rural electrification in developing countries: the economic perspective. Biomass and Bioenergy, 20, 271–285.
Silva, D., & Nakata, T. (2009). Multi-objective assessment of rural electrification in remote areas with poverty considerations. In Energy Policy, 37, 3096-3108.
Tvedten, I., Paulo, M., & Rosário, C., (2010), Assessing the implications of PARPA II in rural Northern Mozambique 2006-2009. CHR Michelsen Institute.
Zerriffi, H. (2011). Rethinking rural electrification. In Rural electrification–Strategies for distributed generation (pp.1-23). Springer Science+Business Media B. V.

162
PROCEEDINGS Conference MPDES 2011
A Mathematical Approach for the Analysis of Energy Scenarios for Production in India
Armin Fügenschuh ([email protected])
Konrad-Zuse Zentrum f¨ur Informationstechnik Berlin (ZIB), Abteilung Optimierung,
Takustraße 7, D-14195 Berlin, Germany
Pia Gausemeier ([email protected]) Randy McFarland ([email protected])
Günther Seliger ([email protected]) Technische Universität Berlin,
Institut für Werkzeugmaschinen und Fabrikbetrieb (IWF), Fachgebiet Montagetechnik und Fabrikbetrieb,
Pascalstr. 8-9, 10587 Berlin, Germany
Abstract The earth’s resources are limited. The emerging and developing nations are closing the gap on the lifestyle of the few industrialized countries and their dominating technologies. The unlimited expansion of these technologies and their usage would exceed every accountable ecologic and social bound. The producing industry requires a paradigm change in order to ensure the sustainability of its products and services. Renewable resources should no longer be used faster than they can be regenerated and non-renewable resources must consequently be introduced into cycle economies. New technologies are required in order to implement this manufacturing philosophy. Production technology solutions must meet the requirements of the individual environments in which they are to be applied, in order to ensure this applicability. Therefore, it is vital to gain an understanding of these prospective surrounding fields and their framework conditions. In principle the scenario technique is an appropriate tool for this purpose. Energy is examined as a central aspect of our living environment. It shapes the demands posed on production technology just as the demand for its use, availability and quality is influenced by the predominating technologies. As India is one of the most populated countries in the world and exhibits the characteristics of an emerging country, it is used here as an example for the development of scenarios for energy supply in production. The scenario technique is not only used as a tool, but is also adapted to the complex object of investigation and to aspects of sustainability, where mathematical optimization methods are used. Keywords: Energy systems; sustainability; scenario technique; mathematical optimization.
Introduction The earth’s resources are limited. With a current world population of about 6.9 billion people - 9.2 billion are prognosed for 2050 - merely one billion people belong currently to the so called industrialized world in Europe, North America, Japan, Australia and a few other islands of wealth. India, for example with a current population of 1.1 billion people, and other countries as well are focused on closing the existing gap to the industrialized countries. If the lifestyle of the industrialized world, and its predominant technologies, is to be adopted by the
emerging countries, then resource consumption will exceed every accountable economical, ecological and social limit (Seliger, 2007).
Considering the fact that the majority of the world population doesn’t live in the industrialized world, it is insufficient to examine technological solutions alone for the highest level of development. It is rather of vital importance to adapt technologies to the level of development in which they are to be utilized, in order to secure this utilization (Sachs, 2005).
Energy, as a primary condition for production and an area of living which significantly shapes our lives, is the core consideration of this work. Approximately 34% of the primary energy resources world wide are consumed for applications in the production industry when transformation losses are excluded (Seliger, 2010). This makes production as such a focal point for perspective developments in the energy sector. India serves as an exemplary emerging nation, significantly shaped by its enormous population and further characteristics of its emergence. In order to develop technologies which meet the specific demands of production in India, an understanding of the surrounding environment and the different levels of development must be gained.
The scenario technique provides a useful tool for illustrating the prospective framework conditions on energy supply in production as well as the interdependencies between factors and therefore for gaining an understanding of systemic behavior (Kosow & Gaßner, 2008). The resulting views of the future (scenarios) facilitate the derivation of options for strategic action and the development of technology paths at an early stage.
Research Objectives The goal of the presented approach is to illustrate different scenarios of energy supply for the producing industry in India, in order to gain an understanding of the prospective surrounding fields and the resulting framework conditions, using the scenario technique as a tool for this purpose.
Within this approach, the method is adapted to the demands of the complex aspects of sustainability. A need

163
PROCEEDINGS Conference MPDES 2011
for adaptation results as the scenario technique originates from the field of strategic enterprise planning, and as the problems examined here are significantly more complex. The scenario technique and it’s sub-methods for determining key factors take sustainability into consideration only as much as that influence factors can be chosen, which refer to aspects of sustainability. The selection of key factors is not carried out depending on their relevance to the economic, ecologic and social dimension of sustainability. Although a binary evaluation of the relevance to the object of examination takes place, it cannot be determined which factors contribute to the fulfillment of which sustainability dimensions. This information could be later used to derive strategic options in respect to economical, ecological and social sustainability using those factors, which have a great relevance to sustainability.
Furthermore, an additional development to the method has been undergone. This development serves to reduce the information loss, which occurs when reducing the scope of influence factors to a smaller number of key factors. This is achieved by aggregating the influence factors using mathematical optimization methods.
The reference to the three dimensions of sustainability is also created in the consistency analysis, which serves to cluster individual development possibilities to scenarios. The prospective developments are prescribed with a degree of fulfillment for each sustainability dimension. This degree is observed along with the evaluated consistency of the developments in clustering them.
Methods The scenarios for the prospective energy field for production in India have been created using the five step model according to (Gausemeier, Plass, & Wenzelmann, 2009). The method has been adapted in the influence and consistency analysis phases in order to observe economic, environmental and social sustainability perspectives (Figure 1). The further adaptation of the method using mathematical optimization methods allows both the selection of factors according to their relevance to sustainability as well as the evaluation of the resulting scenarios according to the three sustainability dimensions.
In the primary phase, the core problem is initially defined and the business field is structured. Categories - so called fields of influence - of the general and specific scenario field are created. Influence factors are then searched for within these categories.
Due to the complexity of their systemic interdependence, the amount of influence factors is reduced to a smaller number of key factors in the second phase. This reduction is conventionally performed based on an influence analysis supported by an influence matrix and a relevance analysis. Factors with the highest systemic integration can be determined in the influence analysis. These are factors with a strong influence on as well as those which are strongly influenced by the remaining factors. A significant amount of information is lost in the reduction of the influence factors to the key factors in the conventional method. For this reason, a method for aggregating influence factors is used. The
relevance evaluation of the influence factors was undertaken here based on economical, ecological and social sustainability dimensions. In the third phase, the perspective developments of the identified key factors are described. Several possible developments (3-5) are thereby observed for each key factor. This phase is often referred to as the heart of the scenario technique, as the future horizon is introduce here through the creation of projections. The projections are evaluated in a matrix according to their compatibility with each other in the consistency analysis. In the conventional approach, the projections are bundled to scenarios by a software using an enumeration algorithm. In the approach described here, the projections are additionally evaluated according to their degree of fulfillment in the respective sustainability dimensions. Both the evaluation in the consistency matrix as well as the sustainability evaluation are integrated in the bundling to scenarios in this approach. In the final stage of the scenario technique, the resulting rough scenarios are to be coherently described, based on the resulting table form.
Sustainability Evaluation of the Projections The prospective developments of the key factors have been illustrated by their possible projections. The sustainability relevance of each factor has been previously determined in the influence analysis. Goal of the sustainability evaluation of the projections is to describe the development - or projection - in terms of the three sustainability dimensions. Ultimately the resulting scenarios will be spanned in the three-dimensional space of these dimension as a reference point for the overall sustainability of the scenario. For this purpose a binary analysis of the projections is individually performed for the dimension economic, ecologic and social sustainability (see Figure 2). The binary analysis is primarily restricted to the evaluation of the projections of an individual factor and is repeated for each factor in each dimension. The result is a ranking of the projections. This ranking is then weighted according to the individual sustainability relevance divided by the maximum relevance from the influence analysis. The overall result is a quantitative representation of the projection in each dimension.
Mathematical Optimization Two of the following steps, namely the aggregation of influence factors and the consistent scenario generation, are formulated as mathematical optimization problem. To solve these problems we apply techniques from the field of mixedinteger linear programming, namely branch-and-cut methods that base on linear relaxations and Dantzig’s simplex method for solving linear optimization problems (Dantzig & Thapa, 1997).
The problems have the following general form

164
PROCEEDINGS Conference MPDES 2011
is a matrix, called constraint matrix, and is a vector called right-hand side, and The system is called the constraint system. For p > 1 such problems (1) are called (mixed) integer linear programs. Solving problem (1) means to compute a global optimal solution, that is a vector and In general such problems are difficult to solve. Theoretical, their efficient solution is related to a central open questions in mathematics, logic, and computer sciences: P = NP, see (Fortnow, 2009). From a practical point of view one way to solve them is to relax the integrality constraint in (1) to obtain a linear programming problem:
Problem (2) can be solved to proven global optimality with Dantzig’s simplex algorithm, for instance. Then in general some of the integer variables will assume fractional values in an optimal solution of (2), i.e., they are in Hence we have to re-introduce the integrality condition. On the one hand it is possible to add cutting planes to the relaxation (2). A cutting plane, or cut, is an additional
linear inequality at < which separates the optimal but fractional solution from the set of all feasible integer solutions. That means, for an optimal solution x*to (2) we have that aT x* > but for any
. Then inequality aT x < is added as a further constraint to the system Ax < b to obtain a new system A’x < b’, to which the simplex algorithm can be applied again.
On the other hand it is possible to apply branching. If x* is an optimal solution to (2) with for some
1< I < p then the problem will be split into two subproblems,where the selected fractional variable will be bounded by a new inequality in one subproblem, and in the other. Then solution x can no longer occur, but at the price of solving now two problems instead of one.
Both approaches can be combined into an integral approach known as branch-and-cut. For further details we refer to the literature, for instance (Nemhauser & Wolsey, 1998). Such branch-and-cut method is implemented in the numerical solver SCIP (Achterberg, 2009), which we use to solve problem (1). For the problem instances occurring in the context of the scenario technique we were able to solve them in very short time, typically within a few seconds.

165
PROCEEDINGS Conference MPDES 2011
Later we will be interested in not only computing one optimal solution to an integer program (1) (with p = n, that is, a problem without continuous variables). A modification of the solver SCIP to count all feasible solutions of an integer program, which we will use as a feature, was described by (Achterberg, Heinz, & Koch, 2008).
Aggregation of Influence Factors We apply an automatic aggregation of pairs of influence factors based on a similarity measure for the rows and the columns. This measure is defined in such way that it is able to describe the distance between the row and column data belonging to two different factors, see also (Fügenschuh, Gausemeier, McFarland, & Seliger, 2010).
Assume that we have a given set of influence factors = {1,2,…,n} and a given influence matrix A =
. The entries of this matrix A indicate whether factor i has no influence on j (for ai,j = 0), a weak influence (= 1), an average influence (= 2) or a strong influence (= 3). We first define the net similarity nsimkk,l between factor k and factor l as the sum of the column similarity (or active similarity) asimkk,l and the row similarity (or passive similarity) psimkk,l:
where the active similarity itself is defined as
and the passive similarity is defined as
By definition the net similarity is a real positive
number. Its value is the closer to zero the more similar the two corresponding factors are, that is, the fewer entries in the respective rows and columns are different to each other. Vice versa, if there are a lot of dissimilarities, a high value would be assigned.
We now define a normalization of the net similarity, which will then give the total (relative) similarity. We denote by m respectively M the minimal and maximal net similarity value among all of them. Using the following re-scaling we transfer the net similarity into the total similarity:
By definition the similarity simkk,l is a real number
between 0 and 1, where 0 stands for the greatest dissimilarity and 1 corresponds to the greatest similarity, in both cases relative to the entity of all net similarity values.
The final goal of the aggregation is to find pairs of influence factors which have a high similarity. That means, that their influence on other factors is similar, as well as the possibility to be influenced by other factors is also similar. In this case it can be justified to treat the aggregated pair as a new factor in the subsequent analysis of the scenario technique.
We introduce binary decision variables for all influence factors . Here xi = 1 means that factor i is not grouped at all in the solution, and yi,j = 1 means that the two factors i, j are grouped together.
Each factor must be assigned to exactly one such group, i.e., the factor is either alone or in a tuple:
The number of generated clusters can be controlled by
the user. A number N is specified in advance, and the number of clusters has to be equal to that number:
The ultimate goal is to find pairings that maximize the
sum over all individual pairs that are involved in the solution. That means, we want to maximize the following objective function:
Summing it up, we have to deal with the following
problem:
This problem (10) is a mixed-integer linear program. It
can be solved efficiently using a linear programming based branchand-cut-approach as outlined above. For instances with up to 100 influence factors the solver SCIP (Achterberg, 2009) applied to problem (10) finds optimal solutions within very short CPU time (less than one second). The result of these computations for different values of N is shown in Figure 3.
Sustainability Relevance Analysis In order to select key factors which have a large degree of relevance to sustainability, as well as to include factors with minimal relevance from further analysis, a sustainability relevance analysis using binary comparisons is performed. In the relevance analysis, the influence factors are evaluated according to their relevance to the social, economical and ecological dimensions of sustainability. In the initial step three matrices are prepared for a binary comparison analysis. The matrices include the existing, already aggregated influence factors. Each factor is then compared with the remaining factors, for example: Is the factor ’average/peak power supply’ more relevant to the social sustainability dimension than factor ’carbon emission trading and greenhouse gas emissions’? A yes is weighed with 1, a no with 0 (see Figure 4). This is repeated for all factors. The resulting sums of the evaluation build the individual social, ecological and economical sustainability relevancies. By adding these individual relevancies, the absolute sustainability relevance is determined. The resulting illustration (see Figure 4) is then included in the system grid for observation during the selection of key factors.

166
PROCEEDINGS Conference MPDES 2011
Figure 3: Quality of aggregation for different values of N
. System Grid Analysis The results of the previous evaluations are compiled in the so-called system-grid, which serves the selection of the key factors (Figure 5). The previously aggregated key factors are plotted according to their active and passive sums. The active sum provides information about how strongly the factors influence other factors; the passive sum describes how strongly the factor is influenced by other factors. Both sums result from the influence matrix. Furthermore, the relevance to economical, ecological and social sustainability is represented for each factor through the circle diameter and the respective portion of the pie diagrams.
Ideally, those factors with both a large active and passive sum and a large relevance are selected as key factors. The boundary, above which factors are selected according to their active and passive sum, is represented by the dashed line in the system-grid. The factors 7 and 16 clearly illustrate that, due to the observation of the sustainability relevance, adjustments are made. The factor 7 has for example not been chosen, due to lack of relevance and despite a significant active and passive sum. The influence factor 16 has, on the other hand, been chosen due to its large active sum and relevance. The resulting key factors with their original name and the name adapted after the aggregation are presented in Table 1.
Consistent Scenario Generation The problem of defining a consistent scenario can be modeled as a binary integer linear programming problem, see also (Fügenschuh, Gausemeier, Seliger, & Severengiz, 2010).
A scenario is defined by a set of key factors For each key factor several projections are possible that the key factor can assume, typically between 2 and 4, see Table 2. We denote by P the set of all projections of all key factors. Hence an element is in fact a tuple p = (d,i) where is the corresponding key factor and i is the respective projection of d.
For each pair of projection a consistency value . A value cp,q = 1 means that p and q cannot occur together in a scenario, p and q exclude each other. A value of 2 means that it is unlikely but not impossible that both p and q occur. 3 means that p and q are not related to each other. Similarly in the other direction a value of 5 means that p and q will and will only occur together, and a value of 4 indicated that p and q are likely but not entirely sure to occur together. The matrix is called consistency matrix.
We introduce binary decision variables . If xp = 1 for some then key factor d will assume projection i in the scenario, and xp = 0 otherwise. We introduce auxiliary decision variables . Here yp,q = 1 if and only if p and q are both selected, that is, if xp = xq = 1. The constraints of the problem are formulated as follows. Exactly one projection per key factor must be chosen:
If key factor d1 assumes projection i1 and key factor d2
assumes projection i2 then the corresponding auxiliary variable must also be switched on:

167
PROCEEDINGS Conference MPDES 2011
Figure 4: Excerpt from the social sustainability relevance analysis.
Table 1: Key factors.
Vice versa, if the auxiliary variable is active, then both projection selector variables must be switched on:
Note that constraints (12) and (13) are a formulation in
terms of linear constraints of the logical clause , which can also be seen as a pseudo-
boolean constraint. Further details can be found in (Berthold, Heinz, & Pfetsch, 2009) and the references therein. Then we are interested in computing all solutions to the integer problem (without objective function):
Note that problem (14) does not have an objective
function since we are interested in not only one, but all solutions to this problem. To obtain all solutions we apply the enumerative techniques of (Achterberg et al., 2008). We denote by C the set of all integer feasible solutions to problem (14).
Counting and Clustering Solutions Consider again the sustainability evaluation of the projections. From there we obtain numerical values
(typically ranging in – 2..2) on how much each of the projections contributes to the welfare and sustainability in terms of social, economical, and ecological aspects. Denote by the contribution of projection p to category s (social, economical, or ecological). Then we can project each scenario into the three dimensional space by computing (s1, s2, s3)-coordinates as follows:
In this way we can visualize all feasible solutions as a
“cloud” of points in the three-dimensional space, see Figure 6.
The scenarios in the cloud are clustered with respect to a goal direction, which is a user-defined weight vector w = (w1, w2, w3) in this three-dimensional space. Each component w1, w2, w3 of w describes the emphasis of the user for the particular evaluation of social, economical or environmental aspects, respectively, within the cluster. For example, we will use w = (1,1,1) and w = (-1,-1,-1) for our later comparisons of two different scenario clusters. The first will have a high emphasis on all three sustainability aspects, whereas the second one is the clear opposite. It is possible to have more than two clusters in

168
PROCEEDINGS Conference MPDES 2011
Figure 5: System grid.
this way (in fact, infinitely many), but for practical purposes one should limit the further discussion to a small number of two to three (or four at most), and select the weights such there is a big difference appearing in the clusters. By applying w to all elements from the cloud it is possible to assign a goal value g(x) to each scenario as
Denote by the smallest and biggest of these
numbers for all scenarios x. Then we scale g(x) with respect to a power
We will further take the consistency value into account
in such way that more consistent scenarios have a higher influence on the final assembly of the cluster. Denote by c(x) the consistency value of scenario the minimal and maximal value among all respectively. Then we compute a scaled factor with respect to some other power
The total weight of all scenarios in C with respect to these two functions is then given by
Since each cluster consists of a huge number of
individual scenarios (solutions of the consistency model), the output has to be aggregated to become meaningful for the human user. To this end we count the number of projections that are realized per cluster. That means we
compute a value aggw(p) as the aggregation of projection p in the cloud with respect to weights w as follows:
The list of values aggw(p) for all is then returned
to the user for further interpretation and discussion.
Results The evaluation in the consistency matrix, the evaluation of the projections in their sustainability dimensions as well as the clustering of the projections, based on these evaluations, has resulted in two scenarios. The following scenarios are described both in table form as well as in text form.
Scenario 1: India booms through the parallel development in conventional and renewable energy technologies New developments in energy technologies shape the field of energy and production for India in the future. Both technologies for increasing the efficiency of conventional energy generation with fossil fuels as well as technologies for generation through renewable resources such as solar energy become both technologically and economically mature. India plays a key role both in the application and development of such technologies. The overall availability of energy resources increases through an increase in efficiency, the availability of alternative technologies, and an increasing foreign trade because of a booming production in India. The production of capital and consumer goods has become more and more economically profitable, in part through the increase in energy availability. This increase in production catapults India

169
PROCEEDINGS Conference MPDES 2011
Table 2: Aggregated key factors and their projections.
out of its role as an emerging country. It has become a key player among the industrialized countries; not only Indian services are sought after but also Indian capital goods. The production industry is dominated by large companies. A strong supplier infrastructure has developed in and around the areas of high population density. India becomes increasingly attractive for foreign investments both in the producing industry as well as in the energy sector, the latter due to “Made in India” development in energy technologies.
The energy market in India is relatively stable. As resource and technology availability increases, India seeks a balance between larger centralized energy concerns and a highly competitive market with both national and
international participants. In general, the infrastructure in India moves towards an international industrialized standard. These developments have a positive effect on the living standards in India. The wages increase, infrastructure improvements in transportation, energy and water sectors have a positive effect on the health and education of Indian citizens.
Scenario 2: Obstruction of economic development through lack of energy technology The producing industry in India is obstructed by a lack of development in new and existing energy technologies, especially in the field of renewable technologies. Energy generation remains concentrated on fossil fuel solutions

170
PROCEEDINGS Conference MPDES 2011
Figure 6: The scenario cloud.
Table 3: Key factors and projections for scenario 1.
and insular off grid solutions. Increasing costs and a meager infrastructure make energy an increasingly scarce good. A few large energy providers dominate the market, holding energy prices high as the demand continually increases through the minimal but slow development of the Indian economy. Investments are concentrated on the upkeep and expansion of an ailing Indian energy infrastructure and not on new, more efficient technologies or technologies for alternative energy generation. The high prices inhibit India’s producing industry. The existing service industry continues to dominate and India becomes less attractive for foreign investments.
India cannot escape its role as an emerging country and align itself with the industrialized world. The Indian standard of living is shaped by a marginal access to expensive, ongrid energy. The standard of living gradually increases for those who can afford the high costs, and
stagnates for those who cannot. The lack of technological development further impedes affordable access to alternatives such as solar energy as the costs for these solutions remain exorbitant.
Discussion The complex circumstances of energy supply for production in India could be examined and the different prospective views of the future could be illustrated with the help of the developed method. The aggregation of the influence factors has reduced the information lost during the reduction of influence factors to key factors, as more factors are observed in further analysis through their combination. The selection of key factors according to their relevance to sustainability has clearly illustrated that some factors must be further observed,

171
PROCEEDINGS Conference MPDES 2011
Table 4: Key factors and projections for scenario 2.
despite their smaller active and passive sums. The evaluation of the projections in the dimensions of sustainability, based on the relevance analysis, and the following, adapted consistency analysis allowed the illustration of consistent possible futures and their individual sustainability. The resulting scenarios make clear, how different the supply of energy in Indian production and its surrounding environment can develop. The first scenario, India booms through the parallel development in conventional and renewable energy technologies describes a positive future, both in general and in the three sustainability dimensions. In contrast, the second scenario Obstruction of economic development through lack of energy technology shows how the entire economy and, in turn, the improvement of living standards is impeded by a insufficient supply of energy and the resulting shortages.
The options for strategic action for reacting to the framework conditions, determined at an early stage, must be as different as the resulting scenarios. The ability to react quickly demands that those factors must be observed in the coming years which can provide clues to the actual direction of development - so called indicators. From a production economy point of view, the framework conditions of the two different environments described have to be transferred into technical requirements. Out of these requirements, production technology solutions can be provided in the sense of option for strategic action.
References Achterberg, T. (2009). SCIP: solving constraint integer
programs. Mathematical Programming Computation, 1(1), 1–95.
Achterberg, T., Heinz, S., & Koch, T. (2008). Counting solutions of integer programs using unrestricted subtree detection. In L. Perron & M. A. Trick (Eds.), Integration of AI and OR Techniques in Constraint Programming for Combinatorial Optimization Problems (5015), 278-282. Springer.
Berthold, T., Heinz, S., & Pfetsch, M. E. (2009). Nonlinear pseudo-Boolean optimization: relaxation or propagation? In O. Kullmann (Ed.), Theory and Applications of Satisfiability Testing – SAT 2009 (5584), 441–446. Springer.
Dantzig, G., & Thapa, M. (1997). Linear Programming. Springer Verlag, New York.
Fortnow, L. (2009). Status of P vs. NP. Communications of the ACM, 52, 78 – 86.
Fügenschuh, A., Gausemeier, P., McFarland, R., & Seliger, G. (2010). Aggregation von Einflussfaktoren am Beispiel vonWiederverwendungsszenarien. In J. Gausemeier (Ed.), 6. Symposium f¨ur Vorausschau und Technologieplanung, 28-29 Oktober 2010, Berlin (pp. 101 – 117).
Fügenschuh, A., Gausemeier, P., Seliger, G., & Severengiz, S. (2010). Scenario Technique with Integer Programming for Sustainability in Manufacturing. In W. Dangelmaier (Ed.), 8th International Heinz Nixdorf Symposium, Changing Paradigms: Advanced Manufacturing and Sustainable Logistics (pp. 320 – 331). IHNS 2010, LNBIP 46.
Gausemeier, J., Plass, C., & Wenzelmann, C. (2009). Zukunftsorientierte Unternehmensgestaltung - Strategien, Geschaftsprozesse und IT-Systeme für die Produktion von morgen. Carl Hanser Verlag, München.
Kosow, H.,& Gaßner, R. (2008). Methoden der Zukunfts- und Szenarioanalyse. Überblick, Bewertung und Auswahlkriterien (Tech. Rep. No. 103). Werkstattbericht des IZT - Institut für Zukunftsstudien und Technologiebewertung, Berlin.
Nemhauser, G., & Wolsey, L. (1998). Integer and Combinatorial Optimization. J. Wiley & Sons, New York.
Sachs, J. D. (2005). The End of Poverty - Economic Possibilities for Our Time. Penguin Books, New York.
Seliger, G. (2007). Sustainability in Manufacturing - Recovery of Resources in Product and Material Cycles. Springer, Berlin.
Seliger, G. (2010). acatech Bericht - Wertschöpfung und Beschäftigung in Deutschland. Deutsche Akademie der Technikwissenschaften, Berlin.

I. Scientific PapersUser Experience

173
PROCEEDINGS Conference MPDES 2011
Changing Behaviour: Individual Energy Use, Strategic Behavioural Niche Management and Decentralised Energy Generation in the UK
David S. Theiss, MSc ([email protected])
London School of Economics, Alumni 5 Wilmington Square, London WC1X0ES, U.K.
Abstract This study considers individual behavioural changes that result from micro generation technology deployment in UK homes, focusing on two topics: altering energy use behaviour and engendering environmentally significant actions. Elements of theoretical arguments within transition management, technical systems and environmental behaviour literature contribute to the analysis. Using a web-survey and quantitative statistical evaluation methods, this study‘s findings indicate that individuals with microgeneration technologies in their home save more energy and act more environmentally than the control group, even though some supporting hypotheses could not be validated. The results confirm the possibility that renewable decentralised energy generation technologies have potential to transform the home into niches for the development of environmentally significant behaviour.
Keywords: Microgeneration; Strategic Behavioural Niche Management
Introduction In 2010, building on the 2009 Energy White Paper, the UK Coalition Government‘s Annual Energy Statement continued to revaluate its energy generation system in reaction to global environmental problems, primarily climate change, and ambitions to achieve energy security (DECC, 2010). The energy generation and consumption issue is of paramount importance because energy is the facilitator of modern lifestyles. There are few aspects of an individual‘s daily life that do not have an energy signature. There is uncertainty whether future government policies will require large or small changes in individual energy use and interaction with the environment. Evaluating the sheer amount of energy used by individuals, MacKay in his seminal work Sustainable Energy Without the Hot Air warns, ―if everyone [reduces energy use] a little, we‘ll achieve only a little‖ (2009, 3). Piecemeal behavioural changes may not be substantial enough to reduce the impact of existing behaviours. Thus, the UK is confronted with the need for radical changes in individual behaviour. Top-down policies mandating significant de facto changes in individual energy use may prove to be divisive and ultimately unsuccessful. Barriers to the transition to sustainable individual consumption of energy could possibly be overcome by alternative decentralised energy generation systems powered by microgeneration technologies.
The fundamental question examined in this work is whether the presence of microgeneration technologies impact individual choices regarding the environment and individual energy use inside and outside the home. Learning effects from the presence of microgeneration technologies in UK homes may cultivate behavioural changes that enhance the overall value of microgeneration
deployments. Considering the UK‘s desire to transition into a primarily renewable energy mix, while reducing national carbon emissions in a cost-effective manner (DECC, 2010), the implications of this expansion are clear: if microgeneration technologies reduce an individual‘s total energy intensity, leading to decreases in individual carbon emissions and energy demand, they could expedite the UK‘s transition to a more sustainable energy system.
Literature Review The existing body of literature on energy systems, socio-technical lock-in, environmentally significant behaviour, systems transformation and transition management offer significant insight into the myriad political, technical, social and behavioural factors interacting with energy generation and consumption in the UK. However, more research is needed on the broader impact of microgeneration technologies on energy use and environmentally significant behaviour.
What Are Microgeneration Technologies? Microgeneration technologies, hereafter ―MTs,‖ encompass a wide array of technologies that generate low carbon electricity or heat on a small scale in homes. These technologies include: micro-wind, micro-hydro, ground source heat pumps, biomass boilers, solar-thermal water heating, solar photo-voltaic, micro-combined heat and power (CHP) and fuel cells (DTI, 2006a; 2006b). Each technology has advantages and disadvantages that affect consumer uptake and different relationships with the policy context. In a government-funded study conducted from 2007-2008, Element Energy concluded that there are roughly 113,000 MTs in the UK (2008a, 13).
Policy Context After a decade of government debate on the potential benefits and costs of MTs, in 2009 the Energy White Paper established a formal feed-in tariff system that pays domestic energy generators for electric energy produced from renewable sources in an effort to stabilize future purchase prices (DECC, 2009a). After coming into effect in March 2010, feed-in tariffs attempt to overcome the cost barrier to consumer uptake of MTs by reducing the financial uncertainty that results from extended payback periods on the initial investment. This plan follows other successful polices from Europe aiming to standardise payments for electrical generation, particularly Germany‘s Act on Granting Priority to Renewable Energy Sources of 2000.
This stimulation plan promises to help the UK achieve its new goal of generating 2% of total energy in homes, despite the domestic sector accounting for nearly 30% of total energy consumption in 2009 (DECC, 2009b). The

174
PROCEEDINGS Conference MPDES 2011
paper stated that by 2020, UK homes would be expected to decrease their total energy usage by 29% (DECC, 2009a). In March 2011, UK Government established the Renewable Heat Incentive programme, which will extend direct payments to generators of heat from renewable sources. The domestic programme will provide premium payments for capital costs in 2011 and shift to tariff payments from 2012 onward (DECC, 2011).
Implications for the development of MTs are still emerging, but an examination of technological systems and their components will provide a more robust understanding of the potential future for MTs in the UK.
Energy Generation as a Technological System In the past, technologies were viewed as individual items like tools or machinery (Blau et al., 1976). Contemporary conceptions of technologies take a more systemic view. From this perspective, technological systems are comprised of technological artefacts (a car), infrastructure requirements (roads and filling stations), and software (regulatory systems and social behavioural patterns) (Rip & Kemp, 1998). Traditional energy generation and consumption systems provide an excellent example of multifaceted technological relationships where ―know-how [is] imbedded in architecturally linked systems and subsystems‖ (Unruh, 2000). Interactions between the distinct and reinforcing components of technological systems lead to the formation of dominant technological regimes.
According to Geels (2002), there are psychological and cultural forces reinforcing the existing relationships with technologies. Technological progress within dominant technological regimes affects the development of societal structures and behavioural patterns. Prevailing societal preferences combine with the three aspects of technological systems to create a dominant socio-technical regime (Geels, 2004).
Close study of the development of consumer behaviour within socio-technological paradigms reveals that a majority of individuals are risk-averse and do not support disruptive technical changes (Urry, 2008). Embedded behavioural patterns, initially shaped by technologies, have a feedback effect into technological progress. Within the constellation of actors that comprise a socio-technical regime, Arthur (1989) concluded that the interactions generate increasing returns to adoption for technological artefacts and systems. Influenced by the pervasive nature of energy use in modern life, social forces and cultural norms galvanise the pathways of the dominant energy producer-consumer relationships in the UK. Uncovering the components of socio-technical systems provides a framework for beginning to assess the barriers confronting the diffusion on microgeneration technologies within the UK‘s energy generation system.
Barriers for Sustainable Consumption of Energy The future of the UK energy system is dominated by two factors: technology and behaviour. There are many obstacles to developing sustainable behaviours and encouraging the widespread use of sustainable technologies, but this section will focus on two: socio-technical lock-in and the rebound effect. For this examination into behaviour and decentralised energy
generation, this section develops key concepts evaluated by Keirstead (2007) and Bergman (2009) and uses their recent contributions to this literature as a roadmap for further analysis.
Socio-technical Lock-in The inertia of the dominant socio-technical regime has major implications for the entrenchment of social and technological relationships. Kline states, ―self-perpetuating market dominance‖ or ‗lock-in‘ of a socio-technical arrangement can limit the options for future technological innovations or cognitively reduce behavioural options for individuals (2001, 98). Technological lock-in results from a confluence of economic and political factors including network externalities, economies of scale, path dependency, vested interests and regulatory frameworks (Ashford, 2002; Orsato & Wells, 2007; Unruh, 2000). Thus, technologies become locked-in through wide diffusion and usage and not necessarily as a result of absolute technical or economic superiority, underscoring the influence of behaviour.
The ubiquity of technologies has a direct effect on which receive support for development. Berkhout (2002) warns that bounded by the dominant regime, continued public and private support for available technologies ingrain the pathways of technological innovation which obscure the future development of alternative, perhaps more efficient technologies. An example of this effect is the dominance of the hydrocarbon-intensive transport system (Orsato & Wells, 2007). A consideration of the interplay of behaviours within the dominant energy generation and regime provides the context for analysing the ―lock-out‖ of radical innovations such as MTs and the power within incremental innovation practices.
Remaining within the confines of a socio-technical regime has many dangers. Keirstead (2007) argues that a significant risk to promoting incremental technological advancements affecting consumer behaviour is that individuals and households will become locked into consumption patterns and will resist exposure to radical but necessary technological innovations in the future. In the case of MTs and household energy use, there is evidence of consumer lock-in and individual reticence to behavioural change. In an analysis of the potential impact of MTs on the domestic energy sector in the UK, Bergman states, ―household energy usage, mainly from appliances, is growing faster than efficiency savings,‖ causing people to ―feel disempowered in relation to climate change, expecting the government to act, and often to not connect their own behaviour with energy generation,‖ (2009, 25). Consumer lock-in is another barrier to sustainable energy consumption, complicating the UK‘s ability to escape socio-technical lock into the current energy generation system.
Rebound Effect Assuming that some energy efficiency learning effects follow the installation of larger-scale renewable energy generation systems in accordance with the UK‘s 2009 Energy White Paper, the implications for long-term energy savings are not clear. Previous analyses of energy efficiency improvements have found evidence of an

175
PROCEEDINGS Conference MPDES 2011
absolute increase in energy use over time, or a ―rebound effect‖ (Sorrell, 2007). The UK government‘s recent goal to expand large-scale renewable energy generation and household efficiency evokes Joseph Huber‘s ecological modernization strategy to decouple economic growth and environmental harm through efficiency increases. A common criticism of ecological modernization approaches to solving environmental problems, such as reducing carbon emissions, is that they can fail to offer solutions to rebound effects resulting from consumption and behavioural patterns (Dryzek, 1998).
It is unclear whether energy generation or efficiency improvements in individual homes lower the electricity demand and thereby reduce energy prices, leading to increased energy consumption. In examining empirical studies on technological progress and sustainable development, Binswanger (2001) concluded that the rebound effect indeed exists in household energy use. Technological improvements in energy efficiency ―tend to overestimate the actual saving effects because they ignore the behavioural responses,‖ creating a rebound effect (Binswanger, 2001, 130). Focusing on small efficiency increases is an ―end-of-pipe‖ solution to broader systemic problems that lead to rebound effects (Janicke, 2008).
The link between energy consumption and renewable energy generation schemes remains an active area for research. Nonetheless, studies that attempt to quantify the impact of MTs and energy efficiency savings or behavioural changes have not determined the impact in energy intensive activities outside the home or through other facets of individual life. Quantifying energy consumption-related activities outside the home will help determine the scope of the rebound effect for MT deployment.
MTs as a mechanism for sustainable consumption In examining the full impact of MTs in individual homes, it is important to consider the contributions of research devoted to motivating sustainable consumption. Movements toward sustainable consumption must overcome consumer lock-in, changing habitual consumption patterns, and account for the multifaceted ways that consumption is tacitly influenced by societal norms (Jackson, 2004). The amalgamation of individual, social and market barriers and pressures create a landscape where individuals are unlikely to avoid unsustainable consumption patterns. Altering consumption patterns to include more sustainable or environmentally significant behaviour requires a greater understanding of the factors that positively influence such behaviour.
Stern (2000) discusses four major components that influence environmentally significant behaviour: attitudinal features, contextual factors, personal capabilities and habit and routine. All of these factors are causal and can instigate different types of environmentally significant behaviour. Increases in sustainable consumption that may result can be conceptualized broadly as either activism-oriented behaviour, non-activist public behaviour such as policy support or actions in the private sphere, for example, consumer purchases (Stern, 2000). Private-sphere actions are the type of environmentally significant behaviours most likely to
interact with motivation to purchase microgeneration technologies as well as contain implications for general energy consumption. However, it is unclear if it is possible to engender such behaviour.
Despite this uncertainty, past attempts to influence public behaviours concerning energy use have relied on a top-down educational or ―information-deficit‖ model to enhance economic and policy-based instruments (Owens & Driffill, 2006). In this model, consumers lack the necessary information to understand fully the environmental impact of their behaviour. With increased access to information, consumers may modify their consumption patterns. In light of the multitude of factors influencing consumer behaviour, engendering sustainable consumption behaviours requires a more deliberative and interactive relationship between the public and policymakers and other stakeholders (Owens & Driffill, 2006).
Watson (2004) and Walker and Cass (2007) find that the role of the public within the discussion of renewable energy generation and consumption is less defined than that of energy producers or end-of-wire consumers. Considering the complexity of individual relationships with energy use, questions remain concerning how consumer behaviour may offer solutions for future energy-related issues. Solutions must consider consumer behaviour; Walker and Cass argue that ―policy communities need to recognise that far more than a shift in attitudes and intentions is required to achieve significant carbon reductions,‖ (2007, 467).
Traditionally, energy generation and consumption infrastructure models simply required the ―passive‖ acceptance of consumers, with the social acceptance of new technologies having three distinct dimensions: socio-political, market, and community (Wustenhagen et al., 2007). Introducing decentralised energy generation technologies may produce significantly different behavioural effects depending on the social acceptance of the technologies. Consumers‘ active acceptance of microgeneration technologies has the potential to induce other behavioural changes as well, such as driving less, limiting airplane travel and reducing waste. Furthermore, changes in the management and infrastructure of an electricity generation system have the potential to reconfigure the consumer-producer roles within the system itself (Van Vleit, 1994). Such technological shifts represent a radical or disruptive innovation that drastically reworks the dominant energy generation paradigm (Sauter & Watson, 2007).
Systems Transformation To experience substantial technological shifts, for instance generating large amounts of renewable energy and meeting carbon emissions reduction goals, researchers have acknowledged the need for discontinuous or radical and disruptive technological innovations, or systems transformation (Christensen, 1997; Kemp, 1994). Kemp (1994) characterises disruptive innovation as a technological regime shift, often instigated by actors outside the dominant technological regime, while Geels (2002; 2004) conceptualises a multi-level perspective of systems innovation comprised of three interrelated scalar dynamics. The transformation of technological systems

176
PROCEEDINGS Conference MPDES 2011
takes place through interaction between the micro-, meso- and macro-levels of a technological system.
The micro-level is comprised of niches where technologies are developed and shielded from adverse market selection until they are mature enough for market introduction. The market exists in the meso-level, or socio-technical regime, which incorporates networks of actors and institutions around social ideals and relationships including market-user preferences and culture (Genus & Coles, 2008, 1437). Finally, the macro-level, or socio-technical landscape, is primarily exogenous to the micro- and meso-levels and accounts for any factors influencing technological or economic progression not present in the other two levels (Rip & Kemp, 1998).
System transformation occurs when influence from niches and the socio-technical landscape combine with windows of opportunity, or focusing event, causing realignments of the socio-technical regime around new technological systems, artefacts and software (Geels, 2004). In the UK, the window of opportunity created by fears surrounding energy security and climate change and the continuous development of renewable energy technologies allows for the reordering of the dominant energy system. To further examine the ingredients for technological change, it is necessary to take a closer look at the role of niches and the potential for the management of technological transitions.
Strategic Behavioural Niche Management Investigations into transition management of sustainable technologies have considered proactive ―governance-interventions‖ into socio-technical regime shifts by ―institutionally embedded networks of actors,‖ (Smith et al., 2005, 1508). These embedded actors strategically promote the introduction of new niche technologies into the socio-technical regime. Researchers such as Rip (1992) and Schot et al. (1994) describe strategic niche management as a strategy for managing socio-technological regime transition by capitalizing on learning and interaction to create constructive relationships. Other work on transition management suggests that technologies are proactively cultivated by governance structures to achieve policy-oriented goals. The major components of strategic niche management include: creating an environment where it is possible to consider necessary technological and institutional changes proactively, examining the costs and benefits of market introduction, establishing the groundwork for economically efficient production and diffusion, and building support for the technology across political, market and societal actors (Rip & Kemp, 1998).
A niche stimulation of sustainable energy generation and consumption ranges beyond the development of specific technological artefacts. Applying the concepts of the strategic niche management of technologies to energy consumption behaviour presents an opportunity to expand on the dimensions of transition management theory. The presence of MTs in individual homes may provide the same shielded location for the maturation of environmentally significant behaviour. Further comments on the conceptual development of strategic management
of behavioural niches are offered in the discussion section (see p. 9).
Studies MTs in UK homes and their implications for consumer behaviour have been the subjects of three studies of note. Each attempted to determine how MTs interact with domestic energy use in the home only. A 2005 analysis included twenty-nine in-depth quantitative interviews with individuals who had MTs found evidence of consumer behavioural change increasing energy efficiency, as well as changes in consumer attitudes and emotion concerning energy use (Dobbyn & Thomas, 2005). The results of this project were cited frequently in the 2006 UK Microgeneration Strategy.
Another study, based on 118 surveys and sixty-three follow-up interviews focused on energy consumption patterns of individuals in the UK that have solar PV technologies. It found that a majority of individuals did not experience a significant reduction in energy use, reporting only a 6% decrease in energy consumption across the sample (Keirstead, 2007). This study provided confirmation that a probable ―double-dividend‖ or provision of renewable energy and decreased energy consumption exists in households containing MTs.
A two-year interdisciplinary research project published in 2008 surveyed 110 households with MTs. Only 4% -5% of respondents reported behaviour that reduced energy use in the home (Element Energy, 2008a, 41). The study did not find significant evidence of domestic energy-use savings or energy-use increases among the individuals with MTs.
Conclusion The existing body of literature discussed offers significant insight into the myriad factors interacting with energy generation and consumption in the UK. However, more research is needed to explore more fully the broader impact of MTs on energy use and environmentally significant behaviour.
Research Objectives This study focuses on two broad topics: altering energy use behaviour and engendering environmentally significant actions. Prior studies related to this topic have primarily evaluated changes in energy use behaviour in the homes that create double-dividends. The central issue explored in the present analysis is whether the presence of MTs affect broader environmentally significant behaviour and total energy use, including behaviour outside the home. In addition to positive implications for environmental preservation, decreases in carbon emissions and total energy demand could have a positive effect on the broader UK economy based on the present and future economic costs of emitting carbon. This study addresses a key question in each of these areas of focus:
Research Question One: Do individuals with MTs in their homes save more (i.e. use less) energy in their actions inside and outside the home?

177
PROCEEDINGS Conference MPDES 2011
Research Question Two: Do individuals with MTs in their homes exhibit more environmentally significant behaviour inside and outside the home?
A survey was used to assess individual behavioural patterns. Survey respondents were divided into two groups: individuals with MTs in their homes (hereafter referred to as ―Generators‖) and individuals without MTs (hereafter, ―Average Users‖). The survey addressed Research Question One through a scoring matrix designed to quantify and evaluate the actual energy savings associated with specific actions. research question two was explored through the following thirteen supporting hypotheses (see Table 1), which contain the set of consumer behaviors underlying this study‘s exploration into environmentally significant behaviors.
Table 1: Supporting hypothesis.
Hypothesis Description – The presence of MTs have a: A Negative influence on air temperature in the home;
B Positive influence on the presence of double-glazed home windows;
C Positive influence on the presence of improved home insulation;
D Lead to greater commitment to recycling; E Negative influence on daily meat consumption;
F Positive influence on the reduction of packaging consumption;
G Positive influence on the commitment to create less household waste;
H Positive influence on the commitment to reduce energy waste;
I Negative influence on the amount of flights taken per year;
J Negative influence on car ownership;
K Positive influence of car fuel efficiency;
L Positive influence on the willingness to use public transit;
M Positive relationship with income level;
N Positive relationship with education level.
Results from the survey aim to clarify the true value of supporting policies that result in more aggressive MT deployment.
Methods
Approach This study utilizes a mixed-methods approach to maximise the analysis of the data gathered by the survey. In combination with quantitative methods, this study developed a more qualitative scoring matrix to determine the energy intensity of respondent behaviour.
The energy-use behavioural scoring matrix was derived from energy savings data from Section 29 of Sustainable Energy Without Hot Air, by MacKay (2009). The section presents a list of individual actions that reduce energy use and their associated energy savings, listed in kilowatt-hours per day. The purpose of the scoring matrix is to synthesize the
responses to arrive at general correlations of energy saving behaviour, not to quantify the exact savings in kilowatt-hours per day (kWh/d) of each survey respondent.
Table 2: Energy Scoring Matrix.
Activity and Scoring Criteria – response Energy Saving combinations from survey Controlled low temperature Energy savings=4 kWh/d
1: Have thermostat AND temp. of home must ≤ 19 C 2: Thermostat AND set to different temps. day/night AND average house temp. ≤ 20 C
Commitment to meter reading in home (water, gas and electric) 4 kWh/d
1: Must have visual energy monitoring device (proxy for interest in meter reading)
Eliminate draughts 5 kWh/d
1: Must eliminate draughts in home
Double-glazed windows 10 kWh/d
1: Must have double-glazed windows in home
Improved insulation 10 kWh/d
1: Must have improved insulation in home, either proactively or passively installed
Energy efficient light bulbs 4 kWh/d
1: Consciously only purchase energy efficient light bulbs
Maintain life-cycle for energy intensive “gadgets” (computer, TV, stereo, mobile pc, etc.) 4 kWh/d
Must keep energy intensive technologies for: 1: Four years 2: Five years 3: Until broken
Reduce purchases in packaging intensive times 20 kWh/d
Must minimise packaging always AND: 1: Say that reducing waste is very important 2: Say that reducing waste is important
Eat vegetarian six days per weeks 10 kWh/d
Must not eat meat: 1: Six days per week 2: Seven days per week
Reduce or stop driving 20 kWh/d
Not use a car: 1: four days per week, 2: five days per week, 3: six days per week, 4: seven days per week 5: does not own a car
Stop flying in airplanes 35 kWh/d
1: Must fly zero times per year on average
The scoring matrix captures fifteen different energy saving behaviours and provides a corresponding energy saving score. Since a number of behavioural changes described by MacKay (2009) represent multifaceted actions, the scores represent an amalgam of responses to more than one survey question. For comparison, one kilowatt-hour is roughly equivalent to the amount of energy it takes to power a 40-watt light bulb for an entire day, and an average driver of an average car uses approximately 40 kWh/d to drive fifty kilometres (MacKay, 2009, 29).
To determine the significance of group behaviours not captured by the scoring matrix, quantitative statistical methods will be used to evaluate each research question. Depending on the relationship at hand, various statistical techniques were implemented contained in the software package SPSS for Windows. Finally, to establish the quality of the survey data, this study will incorporate a univarate analysis to accompany the central bivarate analysis.

178
PROCEEDINGS Conference MPDES 2011
Survey Design The survey included forty-one questions. Forms of response ranged from binomial (yes/no), categorical choice-options, and open-ended formats. See Annex I for the list of survey questions. The survey focused on five distinct areas: energy generation capabilities, home energy efficiency, lifestyle-related behaviours, transport preferences and demographic information. Survey questions were designed either to capture behavioural patterns or to elicit the central rationale for these patterns. Survey Disbursement As stated above, the design of the study centred on capturing responses from Generators and Average Users in the UK. The Average Users group served as a control population exhibiting average energy use behaviours. Dispersion of the survey to each target group required a different strategy. Energy Generators Concerted and frequent attempts to contact an adequate sample of Generators by contacting the Department of Energy and Climate Change and the Energy Saving Trust (EST) and installers of small-scale MTs, energy generation and energy efficiency NGOs yielded no direct access to MT energy generators. As a solution to this lack of access, the survey was modified and made available online on the largest UK‘s Renewable Energy Forums, Navitron, Green Building and Sustainable Building Association Forums among others. Thousands of individuals with MTs participate in online conversations surrounding specific MT technologies, energy efficiency and general topics associated with energy use. A link to the web-survey was posted on Friday 24, July 2009 and responses were collected until Friday 14, August 2009. Average Energy Users In an attempt to mimic the disbursement pattern for Generators, the same survey was dispersed via social networking sites such as Facebook, UK-based professional message boards, e-mail through UK-resident participants and word of mouth. A new survey link and collector were created for this target group. 122 survey responses were collected from Friday 24, July 2009 until Friday 14, August 2009.
Limitations
Coverage The scope of the study was affected by limitations in time and resources, and was further constrained by the lack of direct access to MT users‘ contact information. It is hoped that future research will overcome these obstacles as part of a more expansive analysis of decentralised energy generation and use in the UK. Collaboration with DECC, the Energy Saving Trust and large renewable technology installers could provide such access to facilitate broader participation within the target population.
Technical and Financial Impediments Because the internet was the primary tool for gathering data, individuals without access to a computer were excluded from participation. Additionally, the prohibitive cost of MTs and potential home ownership requirement for proactive installation might constrain the applicability of the study‘s findings across the UK population. Thus, the technical and financial barriers to analysing MT deployment relate strongly to the MT deployment strategy debate examined by Watson (2004) and Walker and Cass (2007). Correlation Versus Causation There are a number of correlative and/or causal relationships within each target group that may affect data quality. This study fully recognises that findings at this stage provide correlative evidence concerning the impact of MTs on behaviour outside the home rather than causation-grounded conclusions. For the Average Users group, an individual‘s willingness to participate in a survey advertised as energy use research might mean that he or she is more interested in environmentally significant behaviour than the societal average. Within the Generators group, it would be useful to know whether the presence of MTs preceded changes in environmentally significant behaviour or whether environmentally significant behaviour preceded the presence of MTs. It could simply be that the any change in behaviours represents a 'green' lifestyle or worldview, although socio-techno behavioral relationships are complex. Since these relationships of broader environmental impact of MTs have not been analysed in this way previously, this project constitutes a pilot study into this area of add-on environmental benefit outside the home. Future studies could build on the results presented here and account for the casual variables present.
Results Univariate Analysis This univariate analysis is intended to summarize the main characteristics of the survey data, in which each variable is explored separately. In particular, it draws conclusions about frequency for qualitative variables as well as means and amount of variations for quantitative variables. The data is checked for normality with histograms and statistical tests. For this purpose, the analysis utilises a mix of descriptive statistics, histograms and pie charts.
Research Question One Tabulated survey responses were evaluated using the energy savings scoring matrix described above. For the 122 respondents, the mean and standard deviation of their energy savings (in kilowatt-hours per day) were measured as 69.5 and 26.4 respectively. The scores maintain a significance value of greater than 5% (0.51) in a Kolmogorov-Smirnov test, indicating a normal distribution.

179
PROCEEDINGS Conference MPDES 2011
Research Question Two To establish the influence of MTs on environmentally significant behaviour, it is important to review the interaction of the variables included within the supported hypothesis across the entire respondent population. The table of findings in Annex II represents the core results of each variable independently. In short, the univariate analysis revealed that there is a significant environmental commitment across the entire respondent population. This commitment is evidenced by high levels of respondent commitment to reducing energy use, reducing rubbish creation, installing energy efficiency improvements in the home, and environmentally conscious transport preferences. The analysis also demonstrates that the apparent uneven distribution across the responses to categorical or numerical questions potentially compounds the skewed responses to nominal responses (i.e. yes/no). Finally, the uneven distribution of responses may signal a sampling bias, which might affect the bivariate analysis of responses from the Generators and Average Users.
Bivariate Analysis - Research Question One The application of the scoring matrix to the survey responses sheds light on the relationship between MTs in the home and overall individual energy demand. Generators achieved an average energy savings score of 78.6 kWh/d, whereas Average Users attained an averaged energy savings of 58.5 kWh/d. The difference of 20.1 kWh/d is substantial, achieving a 5% (F=0.00) significance level (Tp=4.5; p=0.43). On average, Generators save 26% more energy than Average Users. Generators and Average Users share a minimum score of 23kWh/d and differing maximum scores of 123 kWh/d and 112 kWh/d respectively. In the behaviours considered, individuals with MTs in their homes save more (i.e. use less) energy than individuals who do not generate their own energy.
Bivariate Analysis - Research Question Two Hypothesis A The univariate analysis on the Air Temperature variable discovered that there were two outliers, which were removed before this test was conducted. The average home temperatures of the Energy Generator and Average Energy User groups were 18.98 °C and 19.00 °C respectively—a statistically insignificant difference. Hypothesis A is rejected at a 5% (F=.93) significance level (Tp=-0.057; p=0.86). Thus, the results suggest that the presence of MTs has no relationship with home air temperature.
Hypothesis B Only thirty-seven (67.3%) Average Users have double-glazed windows compared to sixty-four (95.6%) Generators, resulting in a difference of 28.3%. This outcome represents a statistically significant difference. Hypothesis B is not rejected at a 5% (F=0.00) significance level. Consequently, the findings demonstrate that the presence of MTs has a
positive relationship with the likelihood home windows are double-glazed.
Hypothesis C Sixty-one (91.0%) Generators have improved insulation in their home, a number comprising over 70% of total respondents with improved insulation. Only twenty-five (46.3%) Average Users reported having improved insulation. This finding represents a statistically significant result (F=0.00) that supports Hypothesis C. Therefore, the presence of MTs has a positive relationship with the likelihood insulation in the home has been improved.
Hypothesis D An understanding of the respondents‘ commitment to recycling was captured by collectively analysing three recycling oriented variables: commitment to recycling and recycling of kitchen and electronic waste. Generators ―always‖, ―sometimes‖ and ―never‖ recycle 82.1%, 17.9%, and 0% respectively, compared to 80.2%, 18.2% and 1.8% of Average Users. This result does not represent a statistically significant difference, exceeding a 5% significance level (F=0.54). More Generators recycle kitchen waste (85.1% to 49.1%) and electronic waste (56.7% to 34.5%) then Average Users. Using a Chi-Squared test, the kitchen and electronic waste recycling results represents a statistically significant finding (F=0.0 and F=0.15). Recycling kitchen and electronic waste represents a commitment to recycling. Findings indicate that the presence of MTs lead to a greater commitment to recycling.
Hypothesis E On average, Generators and Average Users eat meat 4.08 and 3.66 days per week respectively. Conducting a T-test reveals that this result is statistically insignificant. Hypothesis E is rejected at a 5% (F=0.29) significance level (Tp = 1.07; p=0.73). MTs have no relationship with daily meat consumption.
Hypothesis F Average Users profess to ―always‖, ―sometimes‖, and ―never‖ consciously reduce the amount of packaging purchased during shopping 18.9%, 79.2% and 1.9% of the time respectively. Generators only try to avoid purchasing of packaging-intensive goods 26.9%, 67.2% and 6.0% of the time for the same response categories. While the response percentages are each categorically different, this result fails to meet a 5% (F=0.27) significance level. Hypothesis F is incorrect. MTs have no relationship with packaging consumption behavior.
Hypothesis G Relating to response trends revealed in Hypothesis F, Generators and Average Users gave the importance of reducing less rubbish a score of 1.67 and 1.80 respectively. Responses were ranked on scale of one to four, one being very important and four being unimportant. The groups‘ responses trend toward feeling that creating less rubbish is important (score

180
PROCEEDINGS Conference MPDES 2011
of 2). Given the scale, the 0.13 difference between the responses fails to meet to meet a 5% (F=0.39) significance level (Tp =-0.86; p=0.93). The presence of MTs has little relationship with commitment to create less household waste, making the hypothesis incorrect.
Hypothesis H Responding on the same 1-4 importance scale, the mean response to ranking the importance of reducing energy waste between Generators and Average Users was 1.54 and 2.04 respectively. The difference of 0.5 between the responses is a statically significant result. Hypothesis H is not rejected at a 5% (F=0.00) significance level (Tp = 0.80; p=0.80). The results indicate that the presence of MTs has a relationship with on the commitment to reduce energy waste.
Hypothesis I In the univariate analysis the flight amount variable has a mean of 1.32 and was unevenly distributed, reflecting an inverse distribution pattern. Results indicate that Generators fly 0.81 times per year and Average Users fly 1.94 times per year. Finding that Average Users fly more than one more flight per year represents a statistically significant result. The T-test reveals that Hypothesis I is not rejected at 5% (F=0.00) significance level (Tp = -4.048; p=0.004).
Hypothesis J 94% and 56.4% of Generators and Average Users own cars respectively. Conducting a Chi-Square test reveals that the difference of 37.6% between respondent groups is statistically significant (F=0.00). However, this finding rejects Hypothesis J, indicating that the presence of MTs has a positive relationship with car ownership.
Hypothesis K The mean fuel efficiency for cars driven by Generators is 45.5 mpg compared with 42.4 mpg for Average Users. The difference of 3.1 mpg represents a non-statistically significant result. Hypothesis K is rejected at a 5% (F=0.44) significance level (Tp = 0.77; p=0.23). MTs have no relationship with car fuel efficiency.
Hypothesis L Respondents were considered to be willing to use public transport if they 1) used public transport or 2) said they would be willing to use public transport if available. 52% of Generators and 87% of Average Users would be willing to use public transport to travel to either work or non-work locations. This difference is statistically significant (F=0.00), but Hypothesis L is rejected. On average, more Average Users are willing to use public transport than Generators, expressing a negative relationship between MTs and willingness to use public transit.
Hypothesis M Both Generators and Average Users reported to have an average income within the £31,000 to £50,000 range (score of 4.1 and 4.55 respectively). Average
Users have a slightly higher average income, but it is not statistically significant. Hypothesis M is rejected at a 5% (F=0.13) significance level (Tp = -1.52; p=0.35). Thus, in this data, there is no apparent relationship between income and the presence of MTs.
Hypothesis N The survey captured education level by forming four brackets with a corresponding number values representing years in school. A greater percentage of Generators have postgraduate and vocational qualifications (40% and 32.4%) than Average Users (26.4% and 11.3%). However, a larger percentage of Average Users have undergraduate and high school qualifications (43.4% and 18.9%) than Generators (21.5% and 6.2%). A Chi-Squared Test reveals that these differences in education levels are statistically significant (F=0.001). Education level has a positive relationship with the possession of MTs.
Table 3: Research Question Two: Summary Table.
Hypothesis A B C D E F G H I J K L M N
Result - + + + - - - + + - - - - +
Validated = (+), Rejected = (-)
Summary Findings from the univariate analysis find that individuals with MTs in their homes save more energy than Average Users and the data reflects a strong commitment to environmentally significant behaviour across the entire sample. Collectively, the supporting hypotheses for research question two represent a belief that for the behaviors considered, Generators will demonstrate more environmentally significant behavior than Average Users. Findings that are unclear or reject hypothesis reflect that MTs have no effect on environmentally significant behavior. In general, the bivarate analysis exploring this research question does not immediately reflect a clear understanding of the relationship between environmentally significant behaviour and the presence of MTs. Of the thirteen hypotheses, eight were rejected and six were validated. Despite the implied quantitative parity between the distribution of findings, a more detailed qualitative discussion of the difference in environmentally significant attributes of the variables may point to a clearer understanding of the environmental value of the behaviours affected by MTs.
Discussion
Similarity in energy consumption-related habitual behaviour, not directly relating to energy use (e.g. minimising packaging consumption) between the Average Users and Energy Generator groups indicates that both are out-performing the average population. Despite this apparent environmental commitment, analysis of research questions one and two indicates that Generators use less energy and participate in a

181
PROCEEDINGS Conference MPDES 2011
greater number of environmentally significant behaviours than Average Users.
Escaping Socio-technical Lock-in According to Keirstead (2007), new technological developments may lock the UK‘s consumers into energy intensive lifestyles and perpetuate a generally passive relationship with energy use. Kemp (1994) and Rip (with Kemp, 1998) argue that the transformation of technological systems requires wholesale changes in the artefact, infrastructure and software components. Installing MTs in individual homes instantly provides alternative artefacts and infrastructure for a new energy generation system. Yet changes in associated software are not automatic.
Analysis of research questions one and two reveals a distinction between ―easy‖ and ―difficult‖ actions to reduce energy use that may point to an ability to escape energy intensive lifestyles. For instance, a clear majority of respondents (75%) have thermostats allowing for easy regulation of home air temperature. Not surprisingly, the average air temperature for each group is nearly identical. In contrast, over 90% of Generators have installed other energy efficiency improvements, such as double-glazed windows or improved insulation, compared with just over half of the Average Users. As mentioned in the 2006 Department of Trade and Industry Micogeneration Strategy, there are technical and financial barriers to installing energy efficiency technologies. Generators overcome these obstacles while Average Users typically settle for reaching the ―low-hanging fruit‖ within energy efficiency options. A similar pattern can be observed in recycling behaviour and airplane transport.
With this finding it is worth noting that to qualify for grants for MTs from the Low Carbon Buildings Programme (LCBP), a government-backed scheme to provide financing for MT installation, some participants were required to first implement various energy saving measures in their homes. The LCBP, one of the many UK grant programmes, only provided funding for a fraction of the nearly 113,000 known MT installations in the UK in 2008, (Element Energy, 2008b). Thus, the impact of this particular grant scheme on the study findings is unclear.
The higher savings scores and higher rate of active energy use behaviours of the Generators seems to signal the ability to escape a passive relationship with energy use as described by Bergman (2009). A component of the scoring matrix for research question one examined the amount of visual energy meters or in respondents‘ homes. Nearly 60% of Generators have such energy use monitoring devices compared with just 15% of Average Users. Furthermore, Generators have a higher commitment to reducing energy waste, as is shown in the analysis of Hypothesis H related to research question two.
This study also points to behavioural changes among Generators in activities connected to reducing energy consumption. Such transformations could instigate realignments of the software within the energy system to accompany the radical technological
and infrastructure innovations provided by MTs. It is questionable if replacing current large-scale conventional power stations with similarly sized renewable energy stations could provide an opportunity to reengage consumers with their energy use behaviour as described by Owens and Driffill (2006). If widely deployed across the population, MTs could indeed promote a realignment of the socio-technical regime envisaged by Christensen (1997) and Geels (2002; 2004) and allow UK energy consumers to break lock-in to intensive energy consumption.
Overcoming the Rebound Effect A second question considered in this work is whether the presence of MTs overcomes rebound effects occurring due to energy efficiency improvements and energy use in the home discussed by Binswanger (2001) and Sorrell (2007). Results from the examination of respondent energy use indicate that Generators clearly use less (i.e. save more) energy than Average Users. Even discounting the energy savings from the MT energy production, Generators use 306 kW less energy annually than the average population. That energy savings figure represents over 50% of an average UK household‘s annual energy use (MacKay, 2009). Results from the univariate and bivariate analyses reveal that this is the case despite being more likely to own a car, less willing to use public transit, being less committed to reducing packaging waste and eating more energy intensive protein sources (meat).
Concerning energy intensity in behaviours outside the home, results from research question two indicate that Generators only exceed the environmental performance of Average Users in just five of the twelve environmentally significant behaviours considered. Initially, it appears that Generators only marginally reduce energy intensive behaviours outside the home. However, as stated above, the baseline comparison behaviours may reflect a sampling bias toward energy savings. If this is true, then the energy demand decreases experienced by the Generators in the five categories reveal a tendency toward extreme energy reductions. But, of those five categories, only two directly relate to energy consumption outside the home. Thus, if examined more closely, Generators may not extend their domestic energy saving behaviour to energy intensive actions outside the home. Analyses of responses from Generators do not reveal the presence of a rebound effect, but there is no evidence of a trend toward the absolute avoidance of future rebound effects.
Private-sphere Environmentally Significant Behaviour The behaviours helping determine whether MTs can aid in escaping energy intensive socio-technical lock-in and avoiding rebound effects demonstrate a high level of private-sphere environmentally significant behaviour as described by Stern (2000). Results from the univariate analysis and research questions one and

182
PROCEEDINGS Conference MPDES 2011
two clearly express consumption patterns among survey respondents that overcome the barriers to sustained consumption offered by Jackson (2004) through changes in habitual consumption patterns. Despite this general outcome, findings concerning transport preferences analysed in research question two warrant further discussions.
While it has been noted that driving preferences and habits may be strongly influenced by geographic or socio-economic situations, Generators do not express environmentally significant behaviour when considering car or public transit use. This finding may indicate a lack of an interactive or deliberative relationship between the energy implications of transport and non-transport activities. Flying transport behaviours reveal the opposite relationship between the transport preferences Generators and Average Users. Despite the fact that 85% of respondents believe flying has negative environmental consequences, 57% of Generators do not fly whatsoever, compared to just 22% of Average Users. Strong difference preferences in transport behaviours between each group seem to point to a lack of Sauter and Watson‘s (2007) social acceptance of new transport behaviours. Perhaps the presence of MTs has more pronounced difficulty in altering behaviours with high levels of social interaction affecting overall acceptance.
Strategic Behavioural Niche Management Applying core goals of strategic niche management, described by (Rip & Kemp, 1998) to behavioural development add intriguing dimensions expanding the effect of MTs on engendering sustainable energy consumption. To achieve the ambitious consumption changes, like the energy efficiency, demand minimisation and carbon emissions reductions outlined by the 2010 Annual Energy Statement and the 2009 UK Energy White Paper, Walker and Cass (2007) state that behavioural change must accompany technological advancement. Top-down policy proclamations risk not engaging the public in a potentially transformative dialogue because the government action either represents an incremental change that does not disturb the dominant socio-technical regime or it corresponds to a radical policy shift and will be vetoed by the public because it represents a seemingly unrealistic departure from current behavioural patterns. MTs in individual homes present a way to begin to connect individuals to their energy use and strategically cultivate behavioural tendencies that are environmentally significant. Watson and Sauter‘s (2007) investigation in the social acceptance of technologies points toward a potential co-evolution of social acceptance and technology deployment. With MTs, homes have the potential to become niches for behavioural developments that are in-line with broader future, potentially habitually discontinuous, polices concerning the environment. Thus, the extension of strategic niche management theory for technologies to behavioural development calls for the creation of a
new concept called strategic behavioural niche management.
Behavioural niches are environments where it is possible for the governance interventions, described by Smith et al. (2004) to engage with individuals in developing and supporting proactive behaviours that may become standard in future arraignments of the socio-technical regime. Also, they provide a location for people to experience behavioural learning by experiencing the financial and social costs and benefits of a more environmentally conscious lifestyle. Furthermore, behavioural niches have the ability to establish social groundwork that may broaden the array of possible economically efficient solutions to very costly shifts in the energy system, like eradicating carbon emissions. Finally, energy learning actions within behavioural niches can build constructive relationships between future stakeholders (Rip, 1992; Schott et al., 1994), adding momentum to the diffusion of environmentally significant behaviours across political structures, the market and broader society.
It is noted that most social scientists would probably not consider it possible to drastically change individual behaviour without changing the surrounding culture. Conventional thinking in this regard would conclude that individual behaviour is limited and shaped by norms, regulations and institutions. However, potential behavioural changes evaluated in this study that may relate to the presence of MTs are not anticipated to rely on active influence of MTs in discreet timescales but minor and incremental awareness/action changes that interact with energy use behaviour patterns over longer periods of time. Taking account of this, results from this study support the concept that UK homes could become niches for the bottom-up development of environmentally significant behaviour.
Opportunities for Future Research Due to the methodological and research design limitations of this project, implications of causality cannot be demonstrated to a great degree in the findings. As stated above, it is apparent that conducting a web-based survey over a short period of time with self-selected participants is far from an ideal data collection procedure. It is not of the necessary breadth or depth to sufficiently capture behavioural development trends and their relationship with normative and external forces. Since the broader impact of MTs on behaviours outside the home has not been analysed in this way previously, this project constitutes a pilot study into this area, and its findings point to the value of future research.
Apparent methodological issues could be overcome by more comprehensive evaluation of these research questions along two main streams. Quantitative monitoring exercises should be expanded to establish actual changes in environmentally significant behaviour over time. Participants would have their energy use and environmentally significant behaviour monitored before and after MT deployment for a substantial period of time. In addition, these studies

183
PROCEEDINGS Conference MPDES 2011
should examine the effect of different mixes of MTs on individual behaviour. In tandem with the development of more robust quantification procedures, research projects should also apply expansive qualitative methods to explore, in greater depth, the motivation and rationale behind actions that directly and indirectly consume energy. To form the basis for making causal evaluations, a combination of in-depth interviews and focus groups would provide an opportunity to establish behavioural baselines and un-pack motivations for environmentally significant behaviours.
Conclusion As the UK looks toward its energy and environmental future, some emphasis has been placed on MTs being a valuable contributor to the nation‘s energy mix (DECC, 2010) However, discussions concerning MTs in policy documents have focused on short-term costs and benefits of domestic energy generation and energy efficiency. This focus ignores their potential behavioural change effects on energy intensive activities inside and outside the home, which may deliver wide-ranging environmental and economic benefits. Fully acknowledging the difficulty in fully addressing casual versus correlative concerns, this study evaluated whether the presence of MTs in individual homes might influence individuals to take part in more environmentally significant behaviour and save energy in activities beyond the home.
The study‘s findings indicate that individuals with MTs in their homes save more energy and act in a more environmentally friendly manner than the already environmentally committed control group. MTs provide an opportunity to change technical, infrastructural and social systems that could aid in escaping energy intensive lock-in. Moreover, individuals with MTs do not appear to experience a direct rebound effect of higher energy use in other non-domestic behavioural areas. Most importantly, this study‘s findings confirm the possibility that MTs could have the potential to transform the home into niches for the development of environmentally significant behaviour that may become mandatory due to future shifts in the market or policy. The UK government should treat the deployment of MTs into UK homes not only as an opportunity to generate renewable energy, but also as a way of developing locations for the strategic niche management of sustainable consumer behaviour within the UK energy system.
To stimulate consumer uptake of MTs, DECC established a feed-in tariff financial reward system for decentralised renewable electricity generation in April 2010 and announced the Renewable Heat Incentive scheme in March 2011. However promising this development appears, there is significant uncertainty surrounding the breadth and depth of the diffusion of MTs across the many socio-economic and geographical strata of the UK population.
In light of potential consumer behavioural development that may enhance the UK‘s decarbonised, efficient and renewable energy
strategy, the UK government should proactively consider ways to further and expansively evaluate the wider impact of MTs on normative behaviour patterns concerning energy use. Outputs from these studies could inform and enhance the government‘s cost-benefit and cost-effectiveness analyses concerning MT deployment. Innovative research projects in the future will continue to explore the true value of MTs that moves beyond the current, misplaced focus on personal financial costs and benefits and energy use solely within the home.
References Arthur, B. (1989). Competing Technologies,
Increasing Returns, and Lock-In by Historical Events. The Economic Journal, 99 (394), 116 – 131.
Ashford, N. (2002). Government and Environmental Innovation in Europe and North America. The American Behavioral Scientist, 45 (9) 1417– 1434.
Bergman, N. (2009). Can Microgeneration Catalyse Behaviour Change in the Domestic Energy Sector in the UK? European Council for an Energy Efficient Economy, Summer Study.
Berkhout, F (2002). Technological Regimes, Path Dependency and the Environment. Global Environmental Change, 12 (1) 1 – 4.
Binswanger, M. (2001). Technological Progress and Sustainable Development: What About the Rebound Effect? Ecological Economics, 36 (1) 119 – 132.
Blau, P. McHugh-Falbe, C., McKinley, W., & Tracy ,P. (1976) Technology and Organization in Manufacturing. Administrative Science Quarterly, 21 (1) 20 - 40.
Christensen, C. (1997). The Innovator‘s Dilemma: When New Technology Causes Great Firms to Fail. Boston, MA: Harvard Business School Press.
Department of Energy and Climate Change (2009a). The UK Low Carbon Transition Plan. DECC, London
Department of Energy and Climate Change (2009b). Energy Consumption Data in the UK. DECC, London
Department of Energy and Climate Change (2010). Annual Energy Review Statement. DECC, London
Department of Energy and Climate Change (2011). Renewable Heat Incentive. DECC, London
Department of Trade and Industry (2006a). Our Energy Challenge: Power from the People. DTI, London.
Department of Trade and Industry (2006b). Microgeneration Strategy. DTI, London, 2006.
Dobbyn, J. and Thomas, G. (2005). Seeing the light: the impact of micro-generation on our use of energy. London, Sustainable Consumption Roundtable.
Dryzek, J. (1998). The politics of the earth: environmental discourses. Human ecology review, 5 (1) 65.

184
PROCEEDINGS Conference MPDES 2011
Element Energy (2008a). The growth potential for Microgeneration in England, Wales and Scotland. Cambridge.
Element Energy (2008b). Numbers of Microgeneration Units Installed in England, Wales, Scotland, and Northern Ireland. Cambridge.
Geels, F. (2002). Technological Transitions as Evolutionary Reconfiguration Processes: A Multi-level Perspective and a Case-study. Research Policy, 31 (8-9) 1257 – 1274.
Geels, F. (2004). From Sectoral Systems of Innovation to Socio-Technical Systems: Insights about Dynamics and Change from Sociology and Institutional Theory. Research Policy, 33 (6-7) 897 – 920.
Genus, A., & Coles, A. (2008). Rethinking the Multi-Level Perspective of Technological Transitions. Research Policy, 37 (9)1436 – 1445.
Jackson, T. (2004). Motivating Sustainable Consumption – A review of Evidence on Consumer Behaviour and Behaviour Change. A report to the Sustainable Development Research Network. London, Policy Studies Institute.
Janicke, M. (2008). Ecological Modernisation: New Perspectives. Journal of Cleaner Production, 16 (5) 557 – 565.
Keirstead, J. (2007). Behavioural Responses to Photovoltaic Systems in the UK Domestic Sector. Energy Policy, 35(8) 4128 – 4141.
Kemp, R. (1994). Technology and the Transition to Environmental Sustainability: The Problem of Technological Regime Shifts. Futures, 26 (10) 1023 – 1055.
Kline, D. (2001). Positive Feedback, Lock-in and Environmental Policy. Policy Science, 34 (1) 95 – 107.
MacKay, D. (2009). Sustainable Energy – Without the Hot Air. Cambridge, England: UIT.
Orsato, R., & Wells, P. (2007). The Automobile Industry & Sustainability. Journal of Cleaner Production, 15 (11-12) 989 – 993.
Owens, S., & Drifll, L. (2006) .How to Change Attitudes and Behaviours in the Context of Energy. Foresight Review, http://www.foresight.gov.uk/Energy /Reports/ Mini_Energy_Reports/PDF/How_ to_change_attitudes_and behaviours.pdf.
Rip, A. (1992). A quasi-evolutionary model of technological development and a cognitive approach to technology policy. Rivista di Studi Epistemologici e Sociali Sulla Scienza e la Tecnologia, 2 69 – 103.
Rip A., & Kemp, R. (1998). Technological Change. In: Rayner, S. and E. Malone, eds, Human Choice and Climate Change, Columbus, OH: Batelle Press, 327 – 399.
Sauter, R., & Watson, J. (2007). Strategies for the Deployment of Micro-Generation: Implications for Social Acceptance. Energy Policy, 35 (5) 2770 – 2779.
Schot, J., Hoogma, R., & Elzen, B. (1994). Strategies for Shifting Technical Systems: The Case of the Automobile System. Futures, 26 (10) 1060 – 1076.
Smith, A., Stirling A., & Berkhout, F. (2005). The Governance of Sustainable Socio-Technical Transitions. Research Policy, 34 (10) 1491 – 1510.
Sorrell, S. (2007). The Rebound Effect: An Assessment of the Evidence for Economy-wide Energy Savings from Improved Energy Efficiency. UK Energy Research Centre, London.
Stern, P. (2000). Towards a Coherent Theory of Environmentally Significant Behaviour. Journal of Social Issues, 56 (3) 407 – 424.
Unruh, G. (2000). Understanding Carbon Lock-in. Energy Policy, 28 (12) 817 – 830.
Urry, J. (2008). Governance, Flows, and the End of the Car System? Global Environmental Change, 18 (3) 343 – 349.
Van Vleit, B. (1994). Shifting Scales of Infrastructure Provision. In: Southerton, D., H. Chappells and B. Van Vleit, eds, Sustainable Consumption, Cheltenham, UK: Edward Elgar, 67 – 80.
Walker, G., & Cass, N. (2007). Carbon Reduction, ‗The Public‘ and Renewable Energy: Engaging With Socio-Technical Configurations. Area, 39 (4) 458 – 469.
Watson, J. (2004). Co-Provision in Sustainable Energy Systems: The Case of Microgeneration. Energy Policy, 32 (17) 1981 – 1990.
Wustenhagen, R., Wolsink, M., Burer, M. (2007). Social Acceptance of Renewable Energy Innovation: an Introduction. Energy Policy, 35 (5) 2883 – 269

185
PROCEEDINGS Conference MPDES 2011
Local Acceptance of Wind Energy: A Comparison Between Germany, Argentina and Spain
Moïra Jimeno ([email protected]) PhD Candidate Forschungszentrum für Umweltpolitik (ffu)
Freie Universität, Ihnestr. 22, 14195 Berlin
Abstract
Commercial exploitation of wind parks started in the early 1990s in Germany, and in the mid 1990s in Spain and Argentina. Then, there have been an incremental use of wind turbines in rural areas. Many of them are characterised in economic terms by a diversified economic structure with a marginal significance. In the “innovative democracy and concrete institutional economy” approach one of the key problems regarding wind turbines, is the local acceptance. This raises the following questions: how is local acceptance, from the perspective of the innovative democracy, of the wind regions in Germany and Spain and why it was developed in this way. Another central question concerning the local acceptance of wind energy is how wind regions in Argentina (as an example of an emerging country investing in renewable energy) can learn from the european experiences. Based on this, I would like to make a comparative analysis between Germany, Spain and Argentina on the basis of various regions with the corresponding wind parks, within regional differences and similarities are to be worked out. First results tend to demonstrate that wind energy promotion programs will be most successful (in terms of their higher level of social acceptance) in locales that have participatory decision making structures and incorporate wind energy development into broader local or regional development programs. For example in touristic programs. In order to verify this, the case study approach is focused on comparing selected regions based on the three countries. Keywords: wind energy; local acceptance; regions; innovative democracy; participation
Introduction The commitment of the german and spanish governments in the generation of wind power during the last two decades correspond to a big trend of commercial exploitation of wind power in the european context. In fact, wind energy in Europe in 2009 had the largest installation rate of new capacities with 39%, followed by gas (26%) and solar photovoltaics (16%) (EWEA, 2009).
Furthermore, Germany and Spain were and are promoting the subject of renewable energy, especially wind energy, by financial incentives and specific new legislation. From the absolute total benefits of wind energy produced in 2008, Germany and Spain have with 23,903 MW and 16,754 MW, respectevely, the highest rates in Europe. This equates to 36.25% in Germany and 25.39% in Spain from the total benefits produced by wind energy sources in Europe (EWEA, 2009)
With the boom of the wind energy sector in the European Union (EU) large companies has played since the beginning of the last decade an increasingly important political and economic role in the international energy market in examples such as Enercon, Gamesa, GE Wind
Energy, Repower , Siemens and Vestas, etc.( Finanz und Wirtschaft, 2009)
On the other hand, the development of wind energy in Argentina is relatevely new but constant. Until now there are only a few wind parks, most of them installed in Chubut and in La Rioja, with a total capacity of 30 MW. However, the law 26.190 „Régimen de fomento nacional para el uso de fuentes renovables de energía destinada a la producción de energía eléctrica“ (2006) highlights that until the year of 2016 8% of the electric power supply must come from renewable energy sources. From that percentage 50% should belong to wind energy (Programa de Generación Eléctrica a partir de Energías Renovables (GENRE – 2010)). It is possible to say that Argentina has started a new trend in the energy generation that favours renewable energies, especially wind power. Moreover there are also a few wind energy industries with an increasing importance in the local industrial market such as IMPSA Wind, INVAP and NRG Patagonia.
This big global trend is part of the concept ellaborated by Jänicke (2007) „Umweltinnovation als Megatrend”. The author explains that “mit hohen Wachstumsraten in der Umweltbranche ist dagegen ein innovationsorientierter Ansatz zum Kern deutscher und europäischer Umweltpolitik avanciert” (Jänicke, 2007).
The installation of big wind parks, most of them in rural areas, means an intervention in the landscape in these regions and also an alteration for the local population who live nearby these areas. The local acceptance emerges as a central problem concerning the installation of windparks as renewable energy large- scale projects.
Local Acceptance of Wind Energy: Theoretical Framework In this paper I try to demonstrate that in the “innovative democracy” (Mendonça; Lacey & Hvelplund, 2009) acceptance of wind energie emerges as a central problem because all the top-down strategic plans related to it that are going to be implemented need the acceptance of the local population to make those succesful. In terms of the authors „the acceleration of RE growth can be created through innovative democracy, which attempts to bring all actors into the decision-making process”(Mendonca, 2009).
The “innovative democracy” concept comes from the “concrete institutional economy approach” (Mendonça, et al., 2009) in which the economy is understood as a political economy with an institution generation process dominated by the largest actors in the market. This concept differs from the neoclassical approach, where the market is simply the outcome of an economic
186
PROCEEDINGS Conference MPDES 2011
optimisation process and suggest the market is embedded in a historical political construction. In terms of Mendonça et al. (2009) “If people have this understanding of economy as political economy, they amongst others will tend to think that it is necessary for new and independent actors in the energy scene”1. This is especially important in the renewable energy market because new independent and local actors have appeared due to the decentralisation of the energy.
It is possible to see that the “innovative democracy” approach introduces the affected local population’s interests as the central question of the debate. Furthermore the authors analyse some case studies and conclude that if the objective is to have successful development of wind energy, local acceptance becomes a necessary condition in order to achieve it. They apply this concept in local communities with wind farms, explaining that “the fact that wind turbines turning in your local area means money being generated for local people has a powerful effect on behaviour and attitudes. One caveat for ownership restrictions is necessity”.2 This thesis is also shared by another study called „Akzeptanz Erneuerbarer Energien und sozialwissenschaftliche Fragen“ in which it is shown two different type of results. On the one hand, quantitative results show that there is a general acceptance concerning renewable energies but, on the other hand, qualitative results demonstrate the participation of the population in the planning and decision making process it is not enough to achieve renewable energie’s acceptance. (Schweizer-Ries; Rau & Zoellner, 2010.) The local population points out a lack of participation in the incomes generated or the negligence of the individual interests (EER, 2010a).
Another aspect of the social acceptance problem that should be highlighted is that it concerns not only countries like Germany and Spain which are densely populated but rather all the countries with big wind parks, also including the sparsely populated ones like Argentina. About this issue Mendonça et al. (2009) confirm that “If an area is not population-dense, and no community is impacted by turbines or other installations, restrictions may not be pertinent. However, as turbines increase in size, (…) and other large-scale renewable technologies are deployed, there will be an increasing need for local populations to support their presence”.3
Finally, it is noteworthy that local acceptance has a strong relation with the social and economical level of the regions, in which wind parks are installed. In other terms, social acceptance is easier to win in poorer areas where citizens view the trade off of a loss of aesthetic quality (i.e. a wind park) and renewable energy more favorably.
These two characteristics describe the conditions in Argentina. In fact, it may happen that social acceptance is high because until now local population do not feel affected by wind turbines. However in the coming years when wind parks increase in size the situation may change. Thus, it is advisable to take in account these aspects in the planning to be prepared for the future. In second place, social acceptance is quite high in almost all
1 Source: ídem 5 2 Source: ídem 5 and 6 3 Source: ídem 5, 6 and 7
the argentinian regions due to their lack of ressources and their low socioeconomic development.
On the other hand, local acceptance is a big problem for german wind companies that have social barriers in order to execute renewable energy projects. In fact, german and spanish companies claim that it is not about technical transfer, politic will, lack of money nor lack of production. What remains really problematic is the acceptance.
Renewable energy projects can fail in getting acceptance of the civil society. Few detractors argue about “reservations that could solidify majority opinions. The acceptance reclamation is therefore not a cosmetic factor in a decision of investment, but rather a critical success” (EER, 2010a).
Moreover the analysis of local acceptance becomes necessary to know how politics can implement and develop renewable energy, in this case wind energy.
These studies concludes with some recommendation about how to achieve this acceptance. However, there are insufficient studies on Germany, Spain and Argentina that analyses the dimension of acceptance at the local level as a topic of the political science. In this scientific gap I try to introduce a general perspective of the problem concerning the local acceptance and „innovative democracy“ in different countries like Germany, Spain and Argentina.
Based on the ideas below it is possible to propose the follow question:
Wind energy will only succeed in an “innovative democracy”. That means, wind energy promotion programs will be more successfull (concerning their high dimension of social acceptance) if there is a participation of the local population in the decision-making process. This participation is not just social but also a financial through economic incentives or compensations mechanisms. It is also depends on if the development of wind energy is integrated in others local or regional development programs.
In this sense the”100 % Erneuerbare Energie Regionen” website declare that the aim is to create an integration of the citizen from the beginning in order to implement renewable energy projects successfully (in terms of local acceptance). It is also mentions professional moderation and transparent communication as the factors that avoid impertinent debate with negative outputs. At the same time renewable energy installations can be gainfully used for the image and the tourism of a locality, leading to positive secondary effects (EER, 2010a).
There are some examples of localities in Germany and Spain that have implemented different incentives mechanisms for the local population generating financial participation and consequently a high local acceptance.
Wildpoldsried for example has an initiative called “Wildpoldsried Innovativ Richtungweisend” (WIR, 2010) in which there are, among other renewable energy sources, five public wind turbines with a total of 7.500 kw that produce 12.000.000 kwh of electricity/a. One part of the generated renewable public energy is used for the internal consumption and the rest is saved. In 2009 the town council create an added value of 3.230.906 euros

187
PROCEEDINGS Conference MPDES 2011
from the renewable energies sources such as hidraulic, biogas, photovoltaic and wind energy. The income of the latter was 902.955 euros.
Other interesting example in Germany is the region of Harz. The county of Harz (Sachsen-Anhalt and Niedersachsen) has realised diverse renewable energies model projects “EE-Modellprojekte”, in order to become a 100% RE-region. One of these projects is the “Regenerative Modellregion Harz (RegModHarz)”, which promess an enlightening analyse. „Mit seiner Vielzahl an regenerativer Energie – vom Windpark über Solaranlagen bis hin zum Wasserkraftwerk – bietet die Modellregion Harz die idealen Bedingungen für technische und wirtschaftliche Erschließung und Einbindung erneuerbarer Energieressourcen.”( RegModHarz, 2011) In fact the web site of ”100 % Erneuerbare Energie Regionen” sais that because the high acceptance of the locals becomes necessary due to the special territorial charactersistics of this region (in terms of nature protected and leisure area with a big national park) (EER, 2010b).
In the north of Spain in Navarra is the region of Sierra de Guerinda, where there is one of the first big wind parks of Spain. Sierra de Guerinda is a rural area with an intensive agriculture but at the same time a traditional prosperous region with a well developed infrastructure which is used for local tourism. This is a good case of how the profit from wind energy is linked with an intensive rural-ecotourism. Among the advantages of the renewable energies diagnostic in Navarra mentioned in the “Plan Energético de Navarra horizonte 2010- Gobierno de Navarra” there are:
An advanced and engaged society in which renewable energies have a high social acceptance
A high index of an energetic self-sufficiency thanks to RE
An emergerging industrial sector linked to the RE technology
The existence of the “Centro Nacional de Energías Renovables CENER-CIEMAT” and the “Centro Nacional de Formación Profesional y Ocupacional en Energías Renovables –CENIFER” (Gobernio de Navarra, 2010)
Interviews made in Sierra de Guerinda to locals who work in the vineyards demonstrate how important integration was: of the wind parks in the local tourism and the local landscape. The main answer local people gave was that they were grateful because of the touristic route made between the vineyards and the wind turbines.
In Argentina the installation of the wind park “Parque eólico de Arauco” (2010) in La Rioja has created around it a variety of infrastructural facilities in an area which was previously underdeveloped. Furthermore this year the government has organized a series of educative activities for the children related to wind energy. According to the theory that financial participation makes wind energy promotion programs more successfull (concerning their dimension of social acceptance) the creation of infrastructure facilities might be a factor that influence the social acceptance in a positive way. Moreover the local population interviewed was quite happy to have new economic activity in an area, where the economic
development is quite low and even traditional economic activities, such as agriculture, are only marginal. Arauco is a poor rural and very hot area, not appropriate for agricultural activities. This explains why local communities support the wind park with its infrastructural benefits.
As it has been shown, there are different cases that demonstrate there are different alternatives to generate social and financial participation of the local population and also that is possible to link wind energy programs with other local or regional development programs creating secondary effects for the regions.
Conclusions of a Preliminary Analyse about the Wind Energy and the Local Acceptance As the development of renewable energies is part of the global movement called „Umweltinnovation als Megatrend”(Jänicke, 2007) local acceptance must be taken into account in an efficient policy-making process of renewables in order to prevent future social conflicts. As it is shown above, social barriers become more and more problematic as the wind turbines and other renewable large scale technologies increase in size and number. The cases of Germany and Spain demonstrate this theory.
In fact in Germany there is a social platform called “Rettet die Uckemark”, which its website says that they emerged from the expansion of the wind turbines. In their own words“Rettet die Uckermark entstand 1996 aus der Notwendigkeit, ein Gegengewicht zum in der Uckermark grassierenden Windmühlenkapitalismus zu schaffen”(Rettet die Uckermark). In Spain in the region of Catalunya there exist a few local platforms against wind parks like “Plataforma per la Defensa de la Terra Alta” (2004), which was born from the beginning of the wind parks projects in la Terra Alta due to the magnitude of the wind energy programs in a tourist area.
Argentina is still quite new in the deployment of wind parks. However in the future may follow the same path as the european countries due to an accelerated development of large-scale renewables.
To sum up, in the “innovative democracy” local acceptance of wind energy can be achieved by working from the bottom up with all the actors involved. These policies may include all these aspects:
transparent communication periodical close information and difussion children’s education public consultation economic incentives such as feed-in tariffs,
among others ownership/investment restrictions integration of wind energy programs in the others
regional development programs integration of wind parks in the regional
landscape iintegration of wind parks in the local lifestyle

188
PROCEEDINGS Conference MPDES 2011
References EER, (2010a) 2. Kongress Umsetzungsstrategien für
Kommunen und Landkreise“ am 29./30. September 2010 Available on: www.100-ee-kongress.de/ergebnisse-2-kongress/f9-akzeptanz.html, 100 % Erneuerbare Energie Regionen.
EER, (2010b) Raummuster – Musterräume, Lüchow Dannenberg Available on: www.100-ee.de/index.php?id=182, Erneuerbare Energie Regionen.
EWEA (2009): Jahresreport 2008, Wind Energy- the Facts Executive Summary. Available on: www.ewea.org/fileadmin/ewea_documents/documents/publications/WETF/1565_ExSum_ENG.pdf and www.ewea.org/fileadmin/ewea_documents/images/homepage/press_releases/More_wind_power_capacity_installed_last_year_in_the_EU_than_any_other_power_technology.pdf; European Wind Association.
Gobierno de Navarra (2010): Plan Energético de Navarra horizonte 2010.Available on: www.navarra.es/NR/rdonlyres/808B0238-97BB-4A84-B12A-C1C4C4CB3F8E/128091/Planenergeticotextoc ompleto.pdf
Jänicke M.: „Umweltinnovation als Megatrend. Zur ökologischen Modernisierung von Wirtschaft und Staat”(2007). In ÖkologischesWirtschaften 4.2007.
Finanz und Wirtschaft, Ausgabe 99, 19.12.2009, S. 25 Mendonça M. et al.: Stability, participation and
transparency in renewable energy policy: Lessons from Denmark and the United States, Policy and Society (2009), doi: 10.1016/j.polsoc.2009.01.007.
RegModHarz (2011): From : www.regmodharz.de/projekt/projekt_index.html, Regenerative Modellregion Harz
Rettet die Uckermark. From: www.rettet-die-uckermark.de/index.html
Schweizer-Ries P. et al: Partizipationsprozesse und Akzeptanz Erneuerbarer Energien auf kommunaler Ebene (2010). Forschungsgruppe Umweltpsychologie (FG – UPSY) Magdeburg University.
Plataforma per la Defensa de la Terra Alta. From: www.plataformaterraalta.com/web%20castella/interficiecastella.htm
WIR (2010): Wildpoldsried Innovativ Richtungweisend. Available on: www.100-ee-kongress.de/fileadmin/.../ Zengerle_Kassel10_sep10.pdf

189
PROCEEDINGS Conference MPDES 2011
Rural Electrification in Developing Countries: Social Acceptance of Small PhotovoltaicLanterns in Ethiopia
Hannah Müggenburg ([email protected])
PhDCandidate, Saarbrücken
Tim Raabe ([email protected]) Deutsche Gesellschaft für Internationale Zusammenarbeit (GIZ)
Schweizer-Ries ([email protected])
Environmental Psychology, Saarbrücken
Annika Tillmans ([email protected]) PhD Candidate, Saarbrücken
Abstract In order to combat poverty and fight for the Millennium Development Goals through providing access to modern energy, it is necessary to analyze social acceptance of new forms of energy in order to implement them successfully. Nine different Pico Photovoltaic systems were tested during a field study in a non-electrified village in Ethiopia. Each lamp was tested for a week by one of 24 families. Qualitative methods (interviews, focus groups, participant observation) were conducted in order to explore technology change and its social impacts. With these methods, an alternating change of induction and deduction is achieved to gain insight. The most important results are: Apart from expected benefits in health, work, education and economy, people also noticed improvements in the autonomy of children, flexibility, stress, security and family life. Negative aspects were found regarding inter-social relations and in the absence of possible activities. Quality of lamps is defined by respondents according to brightness, duration and cone of light. Furthermore, people prefer white, bright light as well as a built-in switch. Systems considered best in European laboratory tests were evaluated poorly in Ethiopia. In the end, people ordered 30 systems. The decision to buy was a collective one. Even though energy supply is the responsibility of women, men made the final decision about the purchase of the lamps. Keywords: social acceptance; renewable energies; low-cost energy technology;development cooperation; diffusion of innovations; Pico Photovoltaic System
Introduction Chances of Energy in Development Cooperation Worldwide,about 1.5 billion people are without access to modern energy services (Roselund, 2010), whichmeans that one in four people have noaccess to electricity, today (Reiche et al.) In Ethiopia, only 1% of the rural population has the opportunity touse modern energy services (Entwicklungspolitik Online, 2009), meaning that about 66 million people are excluded from regular electricity access (Roselund, 2010).
Figure 1 shows theimpacts of access to modern energy supplyon development.
These assumed impacts are a result of experience gained from projects implemented in developing countries by, for example the BMZ (Bundesministerium für wirtschaftliche Zusammenarbeit und Entwicklung, 2010),
GIZ (Deutsche Gesellschaft für Internationale Zusamenarbeit, 2010a), Lighting Africa(Lighting Africa, 2010a) and others.It canbe seen, that access to modern energy is assumed to contributeto achieving the Millennium Development Goals(MGDs)agreed by the UN and variousinternational organizations to bereachedby 2015. It seems to have a positive influence on health (MDG 4 and 5) by reducing air pollution. Furthermore, it supports enterprises in development. Therefore, it indirectly influences the first MDG of reducing poverty. As observed, energy provides a critical input to implement a host of social services, such as education, health care and communication(Bardouille, 2004). This may have an impact on MDG 2, achieving universal primary education. Apparently above all, renewable energy supply provides a direct input concerning MDG 7 of environmental sustainability (Goldemberg & Johansson, 2004). In addition, solar energy, as one of the renewable energy options, helps to prevent resource conflicts. When implemented on a large scale, renewable energies make countries independent of limited energy sources, which have faced an extreme price increase in recent years. Only in this way, can they be independent of fluctuating global oil market prices, thereby ensuring sustainable effects from financial development cooperation (Bundesministerium für wirtschaftliche Zusammenarbeit und Entwicklung, 2010). Even if grid supplies, in general, represent an economical option, the large distance from the buildings in most rural areas to existing grids makes this option nonviable. Hence, off-grid solutions can play a crucial role in making access to energy possible for the people.
Industrialized countries are involved as well. Even though they are not affected directly, they will have to face, for example, the consequences of refugees from developing countries due to the effects of climate change (Warner, Ehrhart, de Sherbinin, Adamo, & Chai-Onn, 2009; Welzer, 2010), as well as increasing conflicts in the fight for resources. Not the least of possible consequences is the further destruction of already fragile and endangered ecosystems.(Messner, 2010).
If energy access is realized through renewable energy sources, a so-called leapfrogging process can be initiated. This means that technological stages of development, which are prodigal, are skipped in order to implement a

190
PROCEEDINGS Conference MPDES 2011
sustainable technology immediately (at least to the greatest possible extent) (Wissenschaftlicher Beirat der Bundesregierung Globale mweltver nderungen, 2004, p. 79).
Figure 1: Impacts of Energy. Source: BMZ, 2010
PicoPV systems As connecting rural households to grid as well as other renewable energy sources (e.g. Solar Home Systems) remain costly, PicoPV systems offer access to modern energy services even for low income households. PicoPV systems consist mainly of three components: asmall solar module, a battery and the lamp itself. An increasing number of systems are equipped with additional appliances, such as a radio or charger for mobile phones.
Figure 2 compares different solar models.
Figure 2: Classification of Solar Systems.
Source: (Deutsche Gesellschaft für Internationale Zusammenarbeit, 2010)
Theoretical Considerations “An innovation is an idea, practice, or project that is perceived as new by an individual or other unit of adoption”(Rogers, 2003, p. 12). Even though the technique of solar lamps was invented some years ago, it is perceived as new by Ethiopians. Specifically, the new PicoPV systems as a smaller alternative to Solar Home Systems are aninnovation, which has notyet spread across the countries. In terms of diffusion of innovations, the research work of Rogers is considered as the classical point of orientation(Wiswede, 2007).Rogers (2003) suggests, that the innovation process contains five sequential steps: (1) knowledge, in which the individual first learns of the existence of the innovation. Further on, it will seek more
information about it. (2) The stage of persuasion is more afflicted with emotional or affective components. The person‟s attitude toward the innovation is formed. (3) Decision: The individual decides whether to use the innovation (adoption) or not (rejection).(4) The stage of implementation represents the first time, the process of acceptance leaves the mental, cognitive phase and the individual begins to act. Finally (5) the confirmation stage takes place, in which the individual searches for support for his or her decision. Furthermore, Rogers‟ empirical studies (2003) show that the acceptance rate of an innovation depends on the following characteristics: (1) relative advantage, which he defines as “the degree to which an innovation is perceived as being better than the idea it supersedes” (Rogers, 2003, p. 229). Elements of the relative advantage are, for example, perceived advantages in terms of social status and economic factors. Another important characteristic is (2) compatibility, which he defines as “the degree to which an innovation is perceived as consistent with the existing values, past experiences, and needs of potential adopters”(Rogers, 2003, p. 240). These circumstances also take the cultural background, virtues and social values into account. According to Rogers (2003) (3), complexity describes the extent of difficulty in using and understanding the innovation.As fourth element, he defines (4) trial ability as “the degree to which an innovation may be experimented with on alimited basis”(Rogers, 2003, p. 258). The last factor Rogers identifies is (5) observability, which is defined as the possibility of others to perceive the consequences of an innovation. In this context, social networks such as family members, friends or neighbors, as well as peer-to-peer-networks play an important role.
In the context of the second stage, “persuasion”, it is logical to refer to the theory of planned behavior by Ajzen and Fishbein (1975 & 1980). This theory was developed in order to predict and explain human behavior in certain situations, such as the decision whether to adopt an innovation or not, as described in Rogers‟ stage of persuasion. It states that the behavioral intention of a person depends on the person's intention to perform a given behavior. Intentions consist of motivational factors, such as effort or strength of the will to perform a certain behavior. Intentions, in turn, are influenced by the individuals‟ attitude toward the behavior, his or her subjective norms and perceived behavioral control. On one hand, attitude is determined by the individual‟s expectation of probability of achieving certain consequences through one‟s own actions. On the other hand, the evaluation of these consequences contributes to the attitude. Subjective norms are influenced by opinions or claims of behavior of important persons and the motivation to follow them. In other words, it can also be described as perceived social pressure. The component perceived behavioral control, is composed of the subjective opinion of the person and the actual control (Madden, Ellen, & Ajzen, 1992). It describes the perceived ease or difficulty of performing a behavior and also includes obstructions in past experiences. The importance of this last component is said to increase as volitional control over the behavior declines. Ajzen states as a general rule that “the more favorable the attitude and

191
PROCEEDINGS Conference MPDES 2011
subjective norm with respect to a behavior, and the greater the perceived behavioral control, the stronger should be an individual‟s intention to perform the behavior under consideration”(Ajzen, 1991, p. 188).Apart from that general rule, the importance of each component is expected to vary across situations and behaviors. Empirical investigations show a high correlation between the two components, intentions and perceived behavioral control, and behavioral performance.
Figure 3: Theory of Planned Behavior. Source: (Ajzen,
1991). Regarding the particular diffusion of energy-saving
innovations, Darley and Beniger (1981, cited in(Wortmann, 2010)) further developed the following elements according to Rogers„ diffusion theory (Rogers, 2003): capital costs, perceived savings, certainty of savings, compatibility of innovations with values, attitudes and lifestyle of target groups, possibility of trial, dissatisfaction with the existing situation, and the effort and skills necessary for installing the innovation. Völlink, Meertens and Midden(2002) found that, concerning energy conservation technologies, not all characteristics assumed by Rogers, Darley and Beniger are equally relevant. They emphasized the importance of perceived compatibility with values as a general adoption factor. Furthermore, they showed that perceived relative advantage is the first criterion, which determines whether the adoption process continues or the adoption is rejected.
Research Objectives Given this context, a gapbetween the implementation of technology in Western countries and developing countries exists. This is not only caused by cultural differences, but also by varying needs,saturation of products and inventions. For example, it is not known whether adoption is independent of prestige/status effects or whether especially poor people attach higher value to their social environment due to a feeling of inferiority. Furthermore, innovation in Western countries also includes innovations of prestige and fun, while an innovation in developing countries maybe evaluated with very different dimensions, such as the essential improvement of daily life. Moreover, there is a lack of data concerning dimensions
in developing countries, which contribute to the decision of adopting or rejecting an innovation. Due to the newness of PicoPV systems, only little empirical data exists concerning their social acceptance. Furthermore, up to now there has been no attempt to combine empiric data and theoretical considerations in regard to the topic of acceptance of PicoPV systems in rural electrification.
Additionally, various experiencesof development cooperation (Deutsche Gesellschaft für Internationale Zusammenarbeit, 2007)show that even innovations which are extremely beneficial, such as life-saving innovations, do not diffuse on their own. Contrarily, their acceptance can take a long time(Rogers, 2003; Schweizer-Ries, 2008). Often the fitting of approaches of Western development cooperation and cultural values of developing countries are neglected.Incompatibility with cultural values leads to problems in context of social acceptance. Therefore, investigations into this matter are essential. Hofstede supports this opinion: He claims that, so far, only few investigations take a close look at the “mutual relationship between culture and technological change” (Hofstede, 2001, p. 438). Furthermore, he describes people of partner countries as cultural experts, who convey the way of application of innovations to technical experts from donor countries.
In order to make development cooperation more effective and sustainable, it is of interest to find first answers to the following questions: How do people in developing countries resolve whether to use a technical innovation? Which dimensions of evaluation are important for users?
Methods In order to explore the questions mentioned above, Ethiopiawas chosen aslocation forthis field study. Researchinto the acceptance of PicoPV systems here is worthwhile, because Ethiopia has a low electrification rate1 and a great potential for solar energy2 use.
The presented study was accomplished in the context of various PicoPV field studies conducted by GIZs “Energising Development” to address questions of user preferences, impacts, willingness to pay and lamp performance.
Data collection Problem-focused interview was the method of data collection. It was chosen in order to be open to perspectives of participants and to discuss important topics regarding the issue of this study at the same time. Therefore, the target is not to verify an established model or theory but to discover new relations (Flick, 2004). On this account, there are no explicit hypotheses to be verified as in quantitative research.The method of problem-focused interview follows an alternating change of induction and deduction to create insight.With this
1Only 1%of the rural population has the opportunity of using modern energy services (Entwicklungspolitik Online, 2009). 2national annual average irradiance is estimated to be 5.2 kWh/m2/day(Deutsche Gesellschaft für Internationale Zusammenarbeit, 2009)

192
PROCEEDINGS Conference MPDES 2011
measure it is possible to overcome the contrast between following specific theoretical guidelinesand remaining open at the same time (Witzel, 2000).
All interviews were conducted by one ofthe authors and translated by two interpreters who are able to speak two Ethiopian languages, Amharic and Oromifa, as well as English.
Description of Sample The village selected for the field study is located in a rural area 10-15 km away from Nazareth, Ethiopia. 24 families participated in the field study with nine different types of lamps. 18 interviews were conducted. Interviewees were 11 men and 7 women. The difference in number of gender was caused by patriarchic society. The village contains about 220 households in total. Lamps were rotated every week. All participants in the village are farmers. Families live in two to three small wad and bauble houses (kitchen is separated). The village was not electrified before. Improved lighting was named as wish of the highest priority by 91% of respondents of the sample.
Data Analysis Qualitative content analysis according to Mayring (2003) is the method used to analyze the data. Within inductive eanalysis, categories are derived out of the material.In this context, there should be no distortions because of theoretical knowledge.They are founded carefully and within repeatedly revised feedback loops. Categories are developed close to the text, and deduced to main categories. Deductive analysis refers to categories developed out of literature research and theoretical considerations. A fitting of inductively and deductively gained categories is examined. In order to later underline important categories, a frequency analysis of categories worked out of the interviews was computed in order to complement qualitative methods.
Results
Dimensions of Evaluation and Integration into Theory The main categories developed, which are described in the following section, are integrated into a theoretical model according to Mayring (2003). In the end, extracted categories and evaluational dimensions are integrated into the model of planned behavior according to Ajzen and Fishbein (1975 & 1980)as presented before.Figure 4at the end of this part depicts these developed categories, integrated into the theory.
Perceived relative advantage The title of this main category is derived from Rogers (2003). In this context, it describes advantages through the use of the PicoPV systems, which are perceived by the people of the village, themselves.
Education was noted by 89% of respondents as an important advantage. Interviewees reported that childrenespecially benefit in terms of their daily studies. Children are extremely concerned about school in order to achieve a better life than their parents. Additionally,
helping their parents with housework and studying for school are not mutually exclusive anymore. Qualitative and quantitative improvementsare mentioned.
Improvements of health are named by 89% of interviewees. Participants found advances in hygiene: Firstly, the village butcher can perform his work outside. As a consequence no insects are attracted by animal‟s blood inside the house and therefore do not contaminate villagers‟ food anymore. Furthermore, less damage to the house occurs, as carbon no longer blackens the inside of the house.Therefore, hygiene inside is not longer affected. Moreover, people complainedless about pain in their eyes and nosescausedby the penetrating smell of kerosene lamp smoke. The use of PicoPV systems causes fewer illnesses than traditional energy resources.
Economics: 50% of households interviewed claimed to have noticed savings in terms of money.This is caused by no expenditures for traditional energy, such as candles, kerosene, matches or batteries. Savings in time are noticed as well. This is achieved because there is no need to go to town in order to buy material. Additionally, people do not have to search for lighting devices in the dark. Within the social community, the following improvements were observed by 39% of the interviewees: There is less boredom, because families do not have to sit in the darkness in the evening to save energy or because they run out of energy sources. It is possible to meet neighbors or friends after seven o‟clock, despite a dangerous environment (thorns, wild animals) and thus enhance social contacts. Furthermore, children can study together in groups in the evening. Moreover, 44% of respondents stated, that their family life has improved: Less conflicts exist, because they now can use the lamp together at the same time. Formerly, conflicts between family members arosebecause the kerosene lamp always servedonly one person at a time.Now the light of the solar lantern can be used simultaneously and prevents disagreements. Parents start sharing ideas with their children in the evening and they have family meetings and discussions, which did notoccur before. Since more visits in other houses are possible, social contacts between family members are enhanced.
The feeling of increased security is expressed in different ways: a) enhanced autonomy: 33% of the parents reported directly, that their children are more independent, because they can study on their own at night. Parents are not afraid of accidents (e.g. fire) anymore and children are able to use the lamp on their own without hesitation (e.g. for education or going outside to toilet facilities). At the same time, this frees up time for parents to do other things. Moreover, people are more flexible: 50% of respondents stated, that they can act more spontaneously and can plan their time much more flexibly as a consequence of morehours of available light. 28% of households noticed less sorrow and stress: Women are mainly responsible for the households‟energy supply, meaning that they organize and calculate the acquisition of material for light as well as the consumption of it. As a consequence of sufficient light, women often report, that not feeling stressed anymore with thoughts about correct calculation or too little light, is an important advantage of the solar lanterns. In the same way it relieves women of

193
PROCEEDINGS Conference MPDES 2011
the fear of not having enough light in an emergency situation, when someone is ill or dying as well as for people with special needs like women giving birth or families with very young babies.
Finally, security in the environment inside (stated of 28% of interviewees) is improved. Better child care is possible. Furthermore, there are no more accidents (e.g. fire; accidents with furniture) because of either traditional energy sources, such as candles or kerosene, or insecure and uncontrollable ways of making light, like setting a tire on fire.If there is enough light, people do not make unhealthy choices, because they can rely on solar light. Outside the house, security is improved as well (response of 61%): walking outside the house, e.g. visiting people or going to the toilet, in the dark is also more secure. With the help of brighter light (which is also windresistant), protection against wild animals, which attack people as well as animals and plants, is much easier. Moreover, people are safe from injury by thorns, pointed stones, or dangerous plants.
11% of households mentioned aspects of status. Users are proud to live more similarly to city dwellers.
As 56% of respondents stated, jobs can be done more easily. In this context, quantity and quality is improved: Longer working hours are possible and less mistakes occur. Additionally, daily life is affected in great extent. Two sub-categories summarize changes: 78% of households described, that domestic jobs can be done easier. The need to go to town to buy energy supply goods or to charge mobiles is decreased, as 11% of respondents stated. Corollary, people save time, money and energy (getting to the city is exhausting, because of heat, dryness and roads in bad condition). However, compared to other categories, this does not seem to be the most important advance.
Negative Evaluation Negative aspects werementioned during the field test as well: 17% of the respondents report negative effects concerning the relations in the social community. Within the community of the village jealousy and envy.developedAs a consequence of mistrust,users take their system with them all the time and rarely leave it at home for charging. Moreover, 57.3% of Ethiopian inhabitants are illiterate(Central Intelligence Agency), especially those living in rural areas. Thus, even though they have light, there are not many additional activities, inhabitants can carry out at night. 22% referred to a lack of activities.
Quality Quality as a concept of Western culture can imply other aspects than in other cultures. Solar lampsthat have been highly rated in laboratory tests in Europe (Deutsche Gesellschaft für Internationale Zusammenarbeit, 2009) rated poorly in Ethiopia. As a consequence, characteristics, which are important for inhabitants of the Ethiopian village, are subsequently described.
Cone of light is an important attribute, because users hang the lamp in the middle of their houses in order to light the whole house for several family members at the same time and even outside. Therefore, 67% of
households named the angle of radiation as an important criterion of quality. Handling is required because of the multiple purposes for which the lamps are used, both inside and outside the house. Therefore, lamps should be easy to take outside and simultaneously to hang inside. 11% of respondents cited handiness,directly.
Brightness of the lamp is an important factor (confirmed by 94% of interviewees) in order to use the lamp for reading, for persons with special needs and for simultaneous use with other family members. Even though the lamp should be very bright, people appreciate if they don‟t glare. 28% of respondents pay attention to this feature. Especially children, who are not used to electricity, suffer from the dazzling of bright lights.
In the context of attributes of the light itself, white, bright light, which reminds users of sunlight, was favored by 44%3 in comparison to the yellow one. No one cites yellow as their favorite color. 67% of respondents state, that the duration of light is a very important aspect of quality. A satisfying duration was two days (which means an estimated duration of eight hours).
17% of respondents describe robustness of the solar lamp as another factor of quality. Consequently, parents can allow their children to use the lamp without fear.
Finally, great skepticism about products from Asia can be observed, because of the presence of many poor quality products from China in Ethiopia. Hence, great mistrust is widespread in all those manufactured goods. Surprisingly, users are willing to pay more for better quality products.
Usability 28% of households interviewed, appreciate the presence of a regulator to control the intensity of illumination. This allows userstoadjustthe level of brightness according to activity as well as save energy.
On the other hand, interviewees stated carefree use for children as another crucial factor. This implies safety as well as ease of operation. 22% of households report about ease ofuse, also for children.
In order to fulfill various demands of the different family members inside and outside the house, 44% of interviewees express their wish for a portable system. Protecting animals and plants, farmers are forced to hunt wild animals at night (mentioned by 17% of households).
The Mobile charger was described as nice feature but only 22% of interviewees asked for a mobile charger or described it as an important feature. Therefore, the crucial factor is light.
Discussion The following part discusses theoretical considerations with experiences gained in the pilot study. Afterwards a comparison with outcomes of other investigations is made.
3Remaining number of people didn‟t give a statement about the color of light. It seems not to be important for them.

194
PROCEEDINGS Conference MPDES 2011
Figure 4. Systems of categories. Compiled by the author.
Gaining experiencewas described as important in getting to know a new technology (Rogers, 2003; Kaplan, 1999)whendeciding whether or not to use it. Villagers hardly had any experience with modern energy before. Due to the fact that knowledge about solar technology has not spread in Ethiopia, people had no access to the relevant information. Some of them even regarded it as not worthwhile to attend the distribution meeting. Thus, testing the new technology plays an important role to gain trust in this new method of energygeneration. One aspect of experience is familiarity(Kaplan, 1999). Participants described the use of the lamp as easy. They do not have to think much about it.
As mentioned above, Rogers(2003) defines observability as “the degree to which the results of an innovation are visible to others.”In this context, the result of the PicoPV systems can clearly be observed in the darkness. The difference of traditional energy source and solar light can be perceived from some distance. Additionally, participants show a keen interest in comparing their lamps with those of their neighbors. Furthermore, interest in PicoPV systems increased immensely, as soon as people of the village saw the lamps of their neighbors.
As described in the theory of arousal by Raju(1980), components of novelty and conflict exist while perceiving an innovation. If both components are extremely high, a product might not be accepted. In this context, users described the component of novelty and surprise as very high. Therefore, firstly, users have to gain trust to minimize the component of conflict. In the context of the present study, this includes the aspect of trust in solar system technologyas well as trust in its maintenance. Hence, users test the lamps and try out different possibilities of use–sometimes to an extreme. As users experienced, service and maintenance is necessary. Every now and again, repair of the lanterns was required. Problems occurred like discharged batteries or broken switches.
To sum up, criteria used by Rogers (2003), such as perceived relative advantage, observability and the ability to test the lamps, could also be observed as being important within this pilot study.Compared with investigations of Dalrey and Beniger capital costs (financial abilities), perceived savings (economical factor), compatibility and attitudes (here consisting of lamp quality and usability, perceived relative advantage and negative evaluation) could be confirmed as important characteristics in this study. Due to the fact that some systems had to be repaired and people worried about the rainy season, certainty of savings might have played a role as well. Having the possibility of experimenting with the innovation was also accomplished and regarded as an indispensable factor. In addition, necessary efforts and skills in installing the innovation (perceived behavioral control) were asserted as well. Moreover, dissatisfaction with the existing situation was confirmed by users: 91% named light as an improvement of highest priority in theirhouseholds. But as Völlink, Meertens, Midden (2002) have already proposed, the most crucial aspect is perceived relative advantage. This assumption can be supported by this study„s perspective.
Figure 4 summarizes the categories that were identifiedwith the interviews. Categories are integrated in the theory of planned behavior (Ajzen, 1991). Ajzen‟s categories are colored blue. Attitude consists of villager‟s opinion about the PicoPV systems, which is divided in positive (perceived relative advantage) and negative evaluation and the opinion of usability and quality of PicoPV systems which has an influence on the evaluation of systems as well. Perceived behavioral control is determined of experience with thelamps, financial conditions and user behavior (e.g. fault tolerance of lamps as discussed above). Finally, subjective norm summarizes social influence of the community (collective community) and the influence of cultural values (discussed in Müggenburg, 2011).
In the following section results of the study are discussed with regard to further investigations and

195
PROCEEDINGS Conference MPDES 2011
implementations of PicoPV systems in rural areas in the context of development cooperation.
Early findings of studies are promising: Improvements regarding the economic conditions were found as well as in education, health, safety (fewer accidents inside houses) and environment (Deutsche Gesellschaft für Internationale Zusammenarbeit, 2010). In this context, the results of the present study support assumptions of a contribution of electrification with PicoPV systems to the Millennium Development Goals.
In the following section impacts are discussed, which make new insights possible. Security in a sense of serenity was a new aspect ofbenefits. Particularly, a daily life without sorrows and worries about energy supply, about having enough light for care of people with special needs and as a consequence a more flexible life enables new perspectives of advantages. As repeatedly observed, categories developed in analysis are ofteninterconnected. Therefore, the described impact of security also contributes to improved health (less stress). This leads straight to another revealed aspect of security: fewer accidents outside the houses (additionally, less unhealthy and dangerous ways of making light) and protection against wild animals. Moreover, the autonomy of children, who can use the system on their own without hesitation, is an important advantage. In addition, improved family life and relations in the social community should be paid attention to.
Findings of negative outcomes distinguish the present study from former investigations: aspects of envy and a lack of activities are identified. Former investigations (Lighting Africa, 2008a; Lighting Africa, 2008b) found out only acceptance barriers, such as expensive initial investment and fear of non-functional solar systems during the rainy season, which are mentioned by respondents of this study as well.
Comparing quantitative investigations with this study, matching resultsare foundas well in terms of quality and usability: Cone of light (large radiation) and brightness (high intensity) are one of the most important criteria according to the interviewees of this and other studies (Lighting Africa, 2008a). Outcomes of former investigations show, that users attach high value to products of good quality and long life-cycle (Deutsche Gesellschaft für Internationale Zusammenarbeit, 2010). It can be confirmed that people do not want to buy a product from Asia, because of the association and expectation of bad quality. Contrary to earlier findings, additional features, such as radio or mobile charger are evaluated as positive, but the crucial factor remains light.
The last point deals with visual design features. Studies imply effects of certain colors or forms. However, these criteria do not seem to play a significant role in the village in Ethiopia. Regarding visual design, only the color of the light, itself plays a role (white light is preferred as in other studies(Lighting Africa, 2009)). Instead, participants put the emphasis on features such as quality and usability: A PicoPV system seems to be more valuable, if it is easy to handle (even for children), portable, easy to hang up, handy and able to regulate in terms of brightness. Moreover, duration of light is an indispensable characteristic.
Outlook If PicoPV systems are to be distributed on a large scale, the quality of the systems needs to be improved and a quality labeling measure should be introduced, in order to prevent a loss of consumer trust. Furthermore, this study showed that the criteria of laboratory tests need to be adapted. In conclusion, the importance of field studies as a complement to laboratory tests was demonstrated.
A first glance of impacts and user perspectives in terms of the social acceptance of PicoPV systems, was granted by this study.As presented above, qualitative methods gained valuable new insights on impacts of the use of PicoPV systems, which were no subject of discussion in other investigations. In order to generalize these results, further qualitativeand quantitative investigations in other countries and cultures should be done. This is of keen interest, especiallywith regard to an international comparison of user behaviors. A contribution to the Millennium Development Goals was shown. Additionally, perceived advantages of using the PicoPV systems mentioned by respondents of the present study improve aspects of poverty, described by affected people, themselves within a worldwide study (The World Bank, 1999).
Therefore, it is worthwhile to investigate through further research in order to make an access to modern energy possible for non-electrified areas.
Technical problems, such as deeply discharged batteries and user questions occurred. That‟s why in subsequent field tests, attentionshould especially be paid to warranty and maintenance services.
Furthermore, an integral strategy should be considered when implementing PicoPV systems as described, for example, in the simplified model of human action according to Kaufmann-Hayoz. (Kaufmann-Hayoz, 2006; Schweizer-Ries, 2009).
References Ajzen, I. (1991). The Theory of Planned Behavior.
Organizational Behavior and Human Decision Processes , pp. 179-211.
Bardouille, P. (2004 February). Millenium Project. Retrieved 2010 15-June Available on http://www.energycommunity.org/documents/MckinseyMDGProject.pdf
Bundesministerium für wirtschaftliche Zusammenarbeit und Entwicklung. (2010). Erneuerbare Energien und Energieeffizienz fördern. Retrieved 2010 29-07 from Bundesministerium für wirtschaftliche Zusammenarbeit und Entwicklung: From http://www.bmz.de/de/themen/energie/index.html?follow=adword
Central Intelligence Agency. (n.d.). Retrieved 2010 14-June from https://www.cia.gov/library/publications/the-world-factbook/geos/et.html
Deutsche Gesellschaft für Internationale Zusamenarbeit. (2010a). Energising Development Report on Impacts.Eschborn: Gesellschaft für Technische Zusamenarbeit.
Deutsche Gesellschaft für Internationale Zusammenarbeit. (2007). Here comes the Sun - Options for Using Solar

196
PROCEEDINGS Conference MPDES 2011
Cookers in Developing Countries. Eschborn: Federal Ministry for Economic Cooperation and Development.
Deutsche Gesellschaft für Internationale Zusammenarbeit. (2009). Solar Lanterns Test: Shades of Light. Eschborn: GIZ.
Deutsche Gesellschaft für Internationale Zusammenarbeit. (2009). Target Market Analysis - Ethiopia’s Solar Energy Market. Eschborn, Germany.
Deutsche Gesellschaft für Internationale Zusammenarbeit. (2010). What difference can a PicoPV system make? - Early findings on small Photovoltaic systems - an emerging low-cost energy technology for developing countries. Eschborn: GIZ.
Deutsche Gesellschaft für Internationale Zusammenarbeit. (2010). What difference can a PicoPV system make? - Early findings on small Photovoltaic systems - an emerging low-cost energy technology for developing countries.Eschborn: GIZ.
Entwicklungspolitik Online, R. (2009 02-Januar). Retrieved 2010 15-June from http://www.epo.de/index.php?option=com_content&task=view&id=4531&Itemid=33
Entwicklungspolitik Online, R. (2009 02-January). Entwicklungspolitik online. Retrieved 2010 15-June from http://www.epo.de/index.php?option=com_content&task=view&id=4531&Itemid=33
Flick, U. (2004). Qualitative Sozialforschung. Eine Einführung. Reinbek: Rowohlts Enzyklopädie.
Goldemberg, J., & Johansson, T. B. (2004). World Energy Assessment. United Nations Development Programme; United Nations Department of Economic and Social Affairs; World Energy Council.
Hofstede, G. (2001). Culture's Consequences. California: Sage Publications.
Kaplan, A. W. (1999). From passive to active about solar electricity: innovation decision process and photovoltaic interest generation. Technovation 19 , 467-481.
Kaufmann-Hayoz, R. (2006). Human action in context: a model framework for interdisciplinary studies in view of sustainable development. Umweltpsychologie 10 (1) , pp. 154–177.
Lighting Africa (2008a). Ethiopia - Qualitative Off-Grid Lighting Market Assessment. Lighting Africa.
Lighting Africa. (2008b). Lighting Africa Market Assessment Results Quantitative Assessment - Ethiopia. Lighting Africa.
Lighting Africa. (2009). Lighting Devices Test Results. Tanzania Results. Lighting Africa.
Lighting Africa. (2010). Solar Lighting for the Base of the Pyramid - Overview of an Emerging Market -. Lighting Africa.
Madden, T. J., Ellen, P. S. & Ajzen, I. (1992). A Comparison of the Theory of Planned Behavior and the Theory of Reasoned Action. Personality and Social Psychology Bulletin .
Mayring, P. (2003). Qualitative Inhaltsanalyse. Grundlagen und Techniken. Weinheim: Beltz.
Messner, D. (2010 02-07). Bundeszentrale politische Bildung. Retrieved 2010 02-07 from Bundeszentrale politische Bildung: From
http://www.bpb.de/die_bpb/2V4F0M,2,0,Armut_und_Reichtum_in_der_Welt.html
Müggenburg, H. (2011). Rural Electrification: Acceptance of Pico Photovoltaic Systems in Ethiopia. Which conditions contribute to a sustainable integration of technical innovations into work and daily life in developing countries and implementation in the context of development cooperation? Diploma Thesis Technical University of Darmstadt.
Raju, P. (1980). Optimum Stimulation Level: Its Relationship to Personality, Demographics, and Exploratory Behavior. The Journal of Consumer Research 7 , 272-282.
Reiche, K., Grüner, R. A., Hellpap, C. & Brüderle, A. (2010). A Primer on Pico PV. Eschborn: GIZ.
Rogers, E. M. (2003). Diffusion of innovations. New York: Free Press.
Roselund, C. (2010 08-May). Solarstrom für den Rest der Welt: Netzunabhängige Photovoltaik für Millionen Menschen. Retrieved 2010 15-June Available on Solarserver: http://www.solarserver.de/solarmagazin/download/solarstrom_fuer_den_rest_der_welt.pdf
Schweizer-Ries, P. (2008). Energy sustainable communities:Environmental-psychologicalinvesti-gations. Journal of Energy Policy, 36 (11), 4126-4135.
Schweizer-Ries, P. (2009). Ein Verhaltensmodell zumUmdenken und Umlenken. Nachhaltige Konsummuster aus umweltpsychologischer Sicht. In M. Müller (Hrg). Nachhaligkeit: Burnout eines revolutionären Anspruchs? Umwelt-Wirtschaft-Soziales: Zuspitzung eines Dauerkonflikts. Loccumer Protokolle 71/08 (p. 101-116). Rehburg-Loccum: Evangelische Akademie Loccum.
The World Bank. (1999). Voices of the Poor. The World Bank.
Völlink, T., Meertens, R. & Midden, C. J. (2002). Innovating „Diffusion of Innovation“ theory: Innovation characteristics and the intention of utility companies to adopt energy conservation interventions. Journal of Environmental Psychology 22 , pp. 333-344.
Warner, K., Ehrhart, C., de Sherbinin, A., Adamo, S. & Chai-Onn, T. (2009). In Search of Shelter- Mapping the Effects of Climate Change on Human Migration and Displacement. Bonn: prepared for Climate Negotiations.
Welzer, H. (2010). Klimakriege. Wofür im 21. Jahrhundert getötet wird. Frankfurt: Fischer
issenschaftlicher eirat der undesregierung lobale mweltver nderungen. . elt im andel. Armutsbek mpfung durch mweltpolitik. erlin: Springer.
Wiswede, G. (2007). Einführung in die Wirtschaftspsychologie. Stuttgart: UTB.
Witzel, A. (2000 January). Das Problemzentrierte Interview. Retrieved 2010 23-March from Forum Qualitative Sozialforschung / Forum Qualitative Social Research [Online Journal]: http://qualitative-research.net/fqs
Wortmann, K. (2010). Energie. In V. Linneweber, E.-D. Lantermann, & E. Kais, Enzyklopädie der Psychologie. Spezifische Umwelten und umweltbezogenes Verhalten (pp. 409-436). Göttingen: Hogrefe.

197
PROCEEDINGS Conference MPDES 2011
Taking the User’s Perspective Regarding Knowledge on Solar Home Systems in Uganda
Annika Tillmans ([email protected])
Technische Universität Berlin Postgraduate Program Microenergy Systems, Center for Technology and Society
Sekr. WF 1, Fasanenstr. 90, D - 10623 Berlin, Germany
Petra Schweizer-Ries ([email protected]) University of Saarbrücken Environmental Psychology
Campus Saarbrücken, Gebäude A5 4, 66123 Saarbrücken, Germany
Abstract Solar home systems play an important role in attempts to fulfill people’s energy demands in off-grid areas and thereby address the Millennium Development Goals. Due to their complexity, the systems’ lifespan depends to a great extent on proper sizing, installation and use. Hence, knowledge communication to the local solar companies who carry out the sizing and installations, and to the users who have to handle their systems according to the usage instructions, is a crucial factor for the success of programs on rural electrification with solar home systems. The mental models approach provides principles for effective communication of information. In order to ensure optimal information processing and recall, new information should match the recipients’ existing beliefs and misbeliefs. Our study provides a first insight into the prevalence of beliefs and misbeliefs among key stakeholders in Uganda regarding basic technical aspects of solar home systems. Moreover, we analyze the ability of stakeholders, who are responsible for knowledge transfer, to accurately predict the users’ beliefs. The first result of our survey reveals an early knowledge drop in the chain of information transfer from the manufacturers via supervising organizations in Uganda, down to the local solar companies and the users. As a consequence, solar companies and users do not possess the required knowledge to run the systems sustainably. The second result demonstrates that those stakeholders, who possess the technical knowledge and the means to design instructions according to actual users’ needs, are unable to see the users’ perspective due to great psychological distance, thus limiting effective knowledge transfer.
Keywords: Solar home systems, mental models, user perspective, knowledge transfer.
Introduction Opportunities and Challenges for Solar Home Systems in Development Cooperation Worldwide every fourth human being lives without access to electricity (Reiche, R. Grüner, Hellpap, & Brüderle, 2010). In Uganda the countrywide electrification rate is 9%, but comes down to 3% in rural areas (Gesellschaft für technische Zusammenarbeit (GTZ), 2009). Grid connection is in most cases too expensive for people who live far away from the existing grid. Even though the energy demand of poor people in rural areas is only one kilowatt hour or less per day, they have to use about one third of their income to fulfill it as they have to buy kerosene, candles or batteries for lighting their homes and pay a service fee to have their mobile phones charged
(Bundesministerium für wirtschaftliche Zusammenarbeit, 2007).
Therefore, off-grid solutions like solar home systems play an important role in fulfilling the basic energy demands of Uganda’s rural areas. At the same time solar home systems can contribute to achieving some of the Millennium Development Goals (MDGs). Poverty can be reduced if people save money or increase their income-generating activities. Primary education can be facilitated in brighter and constantly available light. Due to less indoor pollution and lower accident risk, health can be improved as well. However, these advantages of solar home systems can only be used if the systems work reliably for a reasonable period of time. The experience of GTZ (2000) has shown that the reliability of solar energy installations significantly depends on proper handling and maintenance. As Schweizer-Ries (2004) states, solar systems mostly work without problems in laboratory or field tests; problems connected to the use arise only later. The users, but also the responsible technicians, seem to have problems with the new technology; they seem to be lacking the appropriate knowledge of correct handling, use and maintenance. As a result, the systems do not work reliably and break down prematurely. The suggested solution is a so called “social design” where users are involved in the design of the product service system from the beginning. If this is not the case, as for example in the analyzed project in Uganda, the users and other key stakeholders should at least be very well informed about correct installation, use and maintenance in order to enable the systems to last for a long time and therefore be a sustainable energy solution.
Successful communication of information should, according to Breakwell (2001), take the following three principles into account: a) every stakeholder needs to be offered a basic understanding of the system relevant to making decisions, b) existing beliefs are assumed to influence reception and interpretation of new information, and c) new information must be presented in a way that is consistent with the level of existing understanding. The concept of mental models provides a theoretical background for this approach.
198
PROCEEDINGS Conference MPDES 2011
Mental Models According to Norman (1983) a mental model reflects a person’s beliefs about a physical system. These beliefs develop either through observation, instruction or inference. Norman also states that people develop mental models in order to understand and anticipate a system’s behavior. In our case, every stakeholder involved in solar home systems has at least some relevant beliefs about it, which are assembled in a mental model about the solar home system in order to make inferences and reach conclusions on how to act, for instance how to design a system, how to determine its size and specifications, how to install it, how to facilitate it, or how to use it. A relevant part of the mental model, especially regarding comparatively new technology, is acquired by communication. The mental models approach has been studied most elaborately in the field of risk communication (see e.g. Morgan, Fischhoff, Bostrom, & Atman, 2002), but its tenets regarding communication also apply to communication on other matters or systems or to bridge the gap between mental models of laymen and experts.
Thus, mapping initial knowledge about the target system is crucial to developing matching communication of missing facts or correction of misbeliefs. Instructions concerning solar home systems have to be developed for different kinds of stakeholders. That is the reason why the mental models on basic technical knowledge concerning solar home systems of each group of key stakeholders will be examined in this study.
Since the users are the supposed beneficiaries of all of the efforts around solar home systems and correct use is the key to a sufficient lifespan of the systems and therefore sustainability in economical, social and ecological terms, all stakeholders try to transfer knowledge to the users (e.g. by developing user manuals, carrying out village presentations, or giving instructions during installation). In order to communicate effectively all stakeholders should attempt to anticipate the users’ beliefs and misbeliefs in order to anchor new knowledge to existing knowledge structures and to change inappropriate beliefs. But who of the key stakeholders can best predict the users’ mental models? The concept of psychological distance (Trope, Liberman, & Wakslak, 2007) seems to provide a well-founded hypothesis.
Psychological Distance and Perspective-Taking as Success Factors in Technical Development Cooperation Trope, Liberman, & Wakslak, (2007) refer to psychological distance as an important influence on individuals’ thoughts and behavior. Psychological distance has multiple dimensions, amongst others space and social distance. Research has shown that psychological distance affects mental models or construals and thereby guides prediction and evaluation. People construe objects or matters that are psychologically close to them in a more detailed and contextualized way, whereas they construe distant objects
or matters in more abstract and less detailed ways (see e.g. Galinsky, Gruenfeld, & Magee, 2003). Psychological distance also seems to affect the outcomes of programs of technology transfer to so called developing countries. Clemens, Karp & Papadakis (2002) analyzed a water project in Guatemala and considered a similar reason to be one of the success factors. This project, “Agua del Pueblo”, recruited all the required staff from indigenous peoples from rural areas to minimize social, cultural and economical differences between project coordinators and beneficiaries. Clemens et al. stated that this was very crucial for the projects’ effectiveness, since “Agua del Pueblo was able to act more sensitively to the local populations” (p.120). They also explained that even “cultural barriers between urban elites and the rural population undermine the success of regional development efforts” (p.120). Their findings seem to prove that one crucial factor for the project’s success was the staff’s ability to understand the world in which the beneficiaries live and their ability to see the project through the beneficiaries’ eyes.
Rural electrification with solar home systems in Uganda also involves technology transfer and therefore the need to communicate knowledge to local stakeholders as well as the need to communicate users’ needs to system designers and program supporters. According to the findings of Clemens et al. (2002) and Trope et al. (2007), stakeholders that are psychologically near the actual users of the systems should be able to anticipate the users’ mental models of solar home systems much better than stakeholders that are more distant.
A co-orientation approach was used in this study to examine the perception of solar home systems held by different groups of stakeholders (see e.g. Uzzel, 1987). This approach provides a methodology to analyze perceptions of specific subjects held by different groups. In this case, each stakeholder has a mental model regarding solar home systems and it is suggested that these models are related to other stakeholders’ conceptions (McLeod & Chaffee, 1973; Uzzell, 1987). This is extremely important because “a person’s behavior is not based simply in his private cognitive construction of his world. It is also a function of his perception of the orientations held by others around him and his orientation to them” (McLeod & Chaffee, 1973, p.470).
The co-orientation technique examines the connections of the communication processes among the groups using three concepts: The first is the concept of similarity and is the correlation among the mental models of two persons regarding an object. Congruency measures the level of similarity between the cognition of one person towards an object and those cognitions which are assumed to be held by another person towards the object. The concept of accuracy assesses how accurate a person estimates the cognitions of another person in reality.
Since the users are the center of activities around solar home systems, the focus of the present study lies on their perspective and the other stakeholders’ ability to anticipate it; in this case, the degree of accuracy to which stakeholders are able to see solar home systems from the users’ perspective. Accuracy in taking the users’ perspective is so crucial, because: “The less accurate the

199
PROCEEDINGS Conference MPDES 2011
perception, the more ineffective the communication will be” (Brønn, 2000, p. 14). Or to put it differrently; if stakeholders really understand and accurately perceive the needs and the knowledge structure of the users, the basis of effective knowledge communication on the one hand and social design of the products on the other hand, will be created.
Research Objectives The current study has two main objectives. First we want to learn more about the mental models of different groups of key stakeholders by exploring their beliefs and misbeliefs concerning crucial technical aspects of solar home systems. We expect a decline of knowledge from the manufacturer down to the user, since information is handed over from manufacturers via organizations working in development cooperation to local solar companies and technicians, and from them to the actual end users. Second, the ability of key stakeholders to take the users’ perspective will be analyzed with regard to their expected psychological distance. To achieve this objective the mental models approach will be extended to examining the stakeholders’ degree to predict users’ beliefs and misbeliefs.
We hope that the knowledge gained from these analyses will provide a valuable starting point for discussions about improvements in information transfer as well as changes in education of staff in technical development cooperation towards a more human-centered approach.
Methods Questionnaire Development Questions were developed bottom-up based on preliminary interviews with representatives of each stakeholder group, on-site technical system checks and additional expert discussions. The final questionnaire included ten statements about knowledge which is crucial for the lifespan of a solar home system1. For example, a solar panel labeled as “20 Watt” in fact only produces about 14 Watt peak, due to the performance ratio of the battery and other energy losses (reflections, cable losses, etc.). If a member of a solar company, who sizes systems and explains usage regulations to the user, does not know that, he might undersize the system or install too many light bulbs at the user’s home, which leads the battery inevitably to a shorter lifespan. Since batteries account for between one third and half of the price of the system, replacements cannot easily be made by the users.
Statements on these topics were incorporated into a single questionnaire, designed for users as well as other stakeholders. Participants of the study were asked to respond according to a “true-false-test-design”. The applied five-option scale (true – maybe true – don’t know – maybe false – false) is often used to examine knowledge questions in a mental models approach (e.g. Morgan et al.,
1 The actual survey contained additional questions not
discussed in this paper. These questions, mainly concerning beliefs about advantages and disadvantages of solar home systems, will be analyzed in following publications.
2002), because they are more compact than multiple choice questions and allow the respondent to express uncertainty. Users were asked to give their personal opinion about each item. In addition to their own opinion, the other stakeholders were also supposed to estimate the user’s opinion (see Table 1).
Each question was designed according to a hypothesis on how users and other stakeholders might respond. For example, we expected most of the participants, except for the manufacturers, to judge Item 3 (“When there is bright sunshine a 20-watt panel in a solar home system generates about 20 watt.”) as “true”, but Item 4 (“When there is bright sunshine a 20-watt panel in a solar home system generates about 14 watt.”) as “false”, because all the 20-watt systems we checked in Uganda were undersized, but often approved by the quality control of supervising organizations as “correctly sized and installed”.
We expected a similar result for statements 7 (“A 20-watt system with a standard 10-amperehour-battery can be run for many years with up to six 5-watt-lights and a mobile charger.”), 8 (”A 20-watt system with a standard 10-amperehour-battery can be run for many years with up to four 5-watt-lights and a mobile charger.”), and 9 (“A 20-watt system with a standard 10-amperehour-battery can be run for many years with up to two 5-watt-lights and a mobile charger.”), since the number of installed five-watt light bulbs is a direct consequence of the presumed output of the panel. Expert discussions and technical system checks proved Item 9 as “true”, but Item 7 and 8 as “false”. Hence, during our field research we found in many households 20-watt systems with three or four installed five-watt bulbs in addition to a mobile charger which is also supposed to consume five watts. The additional challenge for the already undersized systems was the fact that all bulbs were actually fake products consuming up to eight watts instead of the declared five watts.
To learn more about the importance stakeholders attach to correct sizing of the systems, we added item 6 (“The system size can be minimized for a required demand, when strict rules for usage are given.”). Organizations and solar companies try to minimize the panel size for financial reasons in a way that the system does not have any fault tolerance anymore. That means that any usage mistake (e.g. one hour extended light usage or dust on the panel) will immediately affect the charging condition of the battery in a way that can reduce its lifespan. Following rules or time slots very strictly is not especially “African” (see e.g. Mayer, Boness & Thomas, 2003). Many of the users we talked to during the system checks seemed to be unaware that only half an hour of extended light usage could already affect the lifespan of their system. They reported that they sometimes simply need and use more light than the regulations allow. It seemed to be illusory to believe that strict rules would be followed. Solar home systems should always be fault tolerant to ensure a long life span. Nevertheless, we expected most stakeholders to judge item 6 as “true”. How else could they justify their undersized systems?

200
PROCEEDINGS Conference MPDES 2011
Statement 2 (“Daily deep discharging of the battery reduces its lifespan.”) was designed as an “easy item” which most participants would agree to. But since it is so crucial to know that deep discharging reduces a battery’s lifespan, even a single user or other stakeholder who is not aware of this would be close to a catastrophe.
Item 1 (“When the charge controller shows red light all the time, it means the charge controller is broken.”) reflected one of the findings during the technical checks and the expert discussions: a few users reported that when they had called their solar company, because their charge controller showed a red light nearly permanently, the technician came and “did something with the charge controller”. After that, the charge controller did not show the red light anymore. Our interpretation of those incidents was the following: The users who reported those incidents all had a comparatively new system which was still under warranty. This means the broken parts had to be replaced by the solar company without extra costs. A nearly constant red light indicated a malfunctioning battery. Instead of replacing the costly battery, the solar company sent a technician to bypass the charge controller. A malfunctioning battery will still give a little bit of power, so the user would feel satisfied for a while. With
Item 1 we tried to find out how widespread that belief is among users, and maybe even among solar companies.
Item 5 (“When the automatic cut-off (so that the battery does not discharge below a certain level) is not working, the solar home system can still run well for many years.”) and 10 (“The automatic cut-off is the “life insurance” for the battery.”) were included, because the most frequently used charge controller in the inspected systems did not support low voltage disconnection. Since user manuals are rarely read, users rely on what they are told by the installing technician. All of the users we talked to during the system checks were sure that the charge controller would cut off the system in case of low power. Some of them experienced a system breakdown when the power was so low that the bulbs were not working anymore. They misinterpreted these incidents as regular cut-offs. Especially in undersized systems like the ones we found in Uganda, a low-voltage disconnection is very important to avoid such deep discharging which will destroy the batteries very quickly. Items 5 and 10 therefore target the awareness of the importance to employ a low-voltage disconnection. We expected some participants of the solar companies and some of the users to judge item 5 as “true” and item 10 as false, which means that they are not aware of the importance.
Table 1: Questionnaire.
Personal view Estimation of user’s response
Item Statement true
may
be tr
ue
don’
t kno
w
may
be
fals
e fa
lse
true
may
be tr
ue
don’
t kno
w
may
be
fals
e fa
lse
1 When the charge controller shows red light all the time, it means the charge controller is broken.
2 Daily deep discharging of the battery reduces its lifespan. 3 When there is bright sunshine a 20-watt panel in a solar home
system generates about 20 watt.
4 When there is bright sunshine a 20-watt panel in a solar home system generates about 14 watt.
5 When the automatic cut-off (so that the battery does not discharge below a certain level) is not working, the solar home system can still run well for many years.
6 The system size can be minimized for a required demand, when strict rules for usage are given.
7 A 20-watt system with a standard 10-amperehour-battery can be run for many years with up to six 5-watt-lights and a mobile charger.
8 A 20-watt system with a standard 10-amperehour-battery can be run for many years with up to four 5-watt-lights and a mobile charger.
9 A 20-watt system with a standard 10-amperehour-battery can be run for many years with up to two 5-watt-lights and a mobile charger.
10 The automatic cut-off is the “life insurance” for the battery.

201
PROCEEDINGS Conference MPDES 2011
Administration of the Survey Altogether 139 questionnaires were completed.
Members of nongovernmental organizations (NGOs), supervising organizations and manufacturers filled out the questionnaires by themselves in writing, whereas users and the majority of solar company members needed the support of an interview situation to answer the questions. Most users needed the help of a trained translator, because they were illiterate or at least unable to read in English. Many of the solar company members needed the interview situation as a source of motivation to actually respond to every question.
Sample The aim of the research was to measure the ability of
key stakeholders to adopt the user’s perspective regarding knowledge about solar home systems in Uganda. Key stakeholders are persons who are especially important for the success of a project or program or are able to influence the outcome significantly (Overseas Development Administration (ODA), 1995). Stakeholders are also labeled as “important” when they are the target of a project or program – in this case the users of solar home systems (ODA, 1995). If the user’s needs and interests are not satisfied or their problems are not solved, a program on rural electrification with solar home systems cannot be called a success. According to the “Guidelines for Conducting a Stakeholder Analysis“ (Schmeer, 1999) to identify key stakeholders, first literature about rural electrification programs in Peru (Cherni, 2006), South Africa (Wamukonya, 2001), Bangladesh (Alam, Rahman & Eusuf, 2003), Thailand (Green, 2004) and Sri Lanka (Caron, 2002) was analyzed in order to identify the largest possible number of potential stakeholders and their role in the described programs. In the second step, an expert discussion was conducted to prioritize stakeholders along the life cycle of solar home systems in rural electrification in developing countries (see e.g. Müller, Kebir, Stark &
Blessing, 2009). Following Schmeer (1999), these experts were consultants and scientists specialized on rural electrification with solar home systems, who possess overall knowledge on this topic and have worked with many stakeholders in that field. As a result, five groups of key stakeholders for rural electrification with solar home systems in Uganda were identified: First, the users, who are the supposed beneficiaries of the other stakeholders’ activities. Secondly, the NGOs that establish and carry out these programs on an administrative basis. Since in Uganda NGO programs for rural electrification with solar home systems follow a so called “two-hand-model” (as described in Kebir, 2011 (submitted)), solar companies are involved to cover the technical side, like sizing, selling, installing and repairing the systems. The fourth group of key stakeholders consists of supervising organizations like the GTZ, the Ministry of Energy, the Rural Electrification Agency, and the Rural Energy foundation. They are responsible for facilitating NGOs’ and solar companies’ activities by providing access to technical knowledge, trading partners and financial resources. They also provide a political framework and subsidies which are supposed to go hand in hand with quality control. Manufacturers of solar home systems or their parts are the fifth group of key stakeholders, since they develop and produce the employed products.
The user’s sample was mainly selected from the clients of FINCA (Foundation for International Community Assistance), a NGO and microfinance institution which is operating a comparatively large program for solar home systems in Uganda. At the time of the survey, FINCA carried out the largest solar electrification program in Uganda and had a widespread network of clients in rural areas that could be reached in a reasonable period of time. The 60 users lived mainly in central Uganda in rural or peri-urban areas with no or extremely unreliable grid connection. The majority of them were female. This is not only because FINCA focuses its activities on women, but
Table 2: Demographic data
.
Users Solar Companies NGOs Supervising
Organizations Manufacturers
Gender male 12 31 6 17 6 female 48 10 3 4 1
Nationality Ugandan 60 39 7 13 - Non-Ugandan 0 2 2 8 7
Technical training
received technical training 8 24 5 17 7 no technical training 52 16 4 4 - n. s. - 1 - - -
Technically interested
technically interested 55 32 7 19 6 not technically interested 5 3 1 2 1 n. s. - 6 1 - -
Position in company
user 60 - - - - head of company - 4 1 3 1 head of department - 12 2 5 5 employee - 22 4 13 1 other - 2 2 - - n. s. - 1 - - -
N 60 41 9 21 7

202
PROCEEDINGS Conference MPDES 2011
also due to the fact that the survey was carried out during daytime when many men were out for work. A minority of eight users had received an unspecified technical training, but the majority of 55 users labeled themselves as technically interested.
The solar companies were spread over all of Uganda with a focus on companies in Kampala. Among the 41 respondents were 31 males and 10 females. The vast majority of 39 were of Ugandan origin. Only 24 of them had received technical training for their job, but 32 considered themselves as technically interested. Most of the solar company members were employees (22) or occupied the position of a head of department (12). Four participants headed a solar company.
The nine NGO participants belonged to two different organizations with solar energy programs: FINCA and JEEP (Joint Energy Environmental Project), both situated in Greater Kampala. The majority was male (6 vs. 3 female), Ugandan (7 vs. 2 Non-Ugandans) and technically interested (7 out of 9). Five NGO members received technical training. One of the respondents was the head of her NGO, two were head of department, four were employees and two held other positions like internships.
Out of supervising organizations like GTZ, Rural Energy Foundation, Rural Electrification Agency, the Faculty of Technology at Makerere University Kampala, and the Ministry of Energy Uganda, 17 males and four females participated. The majority was Ugandan (13 vs. 8), technically trained (17 vs. 4), technically interested (19 vs. 2) and employees in their organization (13 vs. 5 heads of department, and 3 heads of organization).
All participating manufacturers of solar home systems or its components were Europeans who received a technical education. The majority was male (6), technically interested (6) and head of department (5 vs. one employee and one head of company) (see table 2).
Results The Frequency of Beliefs and Misbeliefs Regarding Solar Home Systems in Different Groups of Stakeholders
To compare the prevalence of misbeliefs or correct knowledge among the different groups of stakeholders, i.e. the participants’ own opinions about each statement, the polarities of items 2, 4, 9 and 10 (see Table 1) were reversed, so that answer 5 is the one which is considered to be true (after system checks and expert discussions, and with regard to technical facts and the circumstances in which the systems are employed in Uganda). We expected manufacturers and solar companies to have better knowledge of technical facts on solar home systems than users. We also expected supervising organizations to have similar degrees of knowledge as manufacturers relating to these comparatively basic questions, since they are the ones who support solar programs in controlling the quality of their work and products. What we found in the analysis of variance is the expected stair-case shaped decline of knowledge (see Figure 1) with significant differences between the groups (F=6,182, p<.0001). The
linear contrast test of the mean answers shows three “knowledge groups” that differ significantly from each other (T=6,700, p<.0001 (2-tailed)): manufacturers have the most profound knowledge about their products; supervising organizations and NGOs have a medium knowledge level; and solar companies and users seem to have the least knowledge. There is no significant difference between the answers of users and solar companies (T=0,948, p>.3 (2-tailed)) nor between NGOs and supervising organizations (T=0,267, p>.7 (2-tailed)).
Figure 1: Mean judgments of the different groups of stakeholders regarding the given statements.
The following examples illustrate the relevance of the
“early” knowledge drop in the chain of information communication. In items 3 (“When there is bright sunshine a 20-watt panel in a solar home system generates about 20 watt.”) and 4 (“When there is bright sunshine a 20-watt panel in a solar home system generates about 14 watt.”): 32 respondents of the solar companies and 10 of the supervising organizations rate item 3 as “true” or “maybe true, whereas many of them reject item 4 (19 out of 41 and 7 out of 21). That means, many of the stakeholders who are responsible for technician training, system sizing and quality control are not aware that their solar home systems may be undersized in a way that can destroy the batteries very quickly.
Item 2 (“Daily deep discharging of the battery reduces its lifespan.”) is correctly rated as “true” or “maybe true” by most of the users and other stakeholders, but there are six users and two employees of solar companies who say it is false. That may not be a huge number, but since it is so crucial for the systems lifespan to consider this fact when sizing and using the system, even a single misinformed user (let alone solar technician) is a disaster.
Many users (25 out of 59) and most of the other stakeholders (55 out of 75) judge item 5 (“When the automatic cut-off (so that the battery does not discharge below a certain level) is not working, the solar home system can still run well for many years.”) as “false” or “maybe false”. At the same time the majority of the respondents (106 out of 138) rates item 10 (“The automatic cut-off is the “life insurance” for the battery.”) as “true” or “maybe true”. Thus, the majority is aware of the relevance of the low voltage disconnection. Unfortunately most if the inspected systems did not have that feature, even though users believed it did. They used

203
PROCEEDINGS Conference MPDES 2011
the system accordingly and thereby constantly drained the battery.
Another interesting example of the relevance of lacking knowledge among stakeholders is the response to item 6 (“The system size can be minimized for a required demand, when strict rules for usage are given.”) As expected, 120 out of 138 respondents judge this item as “true” or “maybe true”, whereas reality in the Ugandan field of solar home systems shows the opposite: Many users actually have a higher energy demand than the system they were able to afford can provide. Most of them are not fully aware of the consequences of even minor over-usage and these minimized systems do not possess any fault tolerance. As a result, the batteries will be drained constantly up to the early breakdown we found in many of the visited systems.
The Ability of Stakeholders to Adopt the User’s Perspective We expected that stakeholders with small psychological distance from the users of solar home systems would be able to predict their knowledge better than stakeholders with greater psychological distance.
First we want to outline our assumptions concerning the psychological distance of the stakeholder groups towards the users. Participants of solar companies are considered to have the least psychological distance to the users because they are spatially and socially close to them. Solar company participants were mostly of Ugandan origin (95,1 %), generally had a low or medium level of education, and worked directly with the users when selling and installing the systems. The NGO members were slightly less often of Ugandan origin (77,8%) and mainly operated from Greater Kampala. However, during village presentations and installment collection they were in frequent contact with the users. Therefore their psychological distance to the users is assumed to be only slightly bigger. Only 61,9% of the participants from supervising organizations were Ugandans. The Ugandans
among them belonged to the urban elite whose personal living conditions differ considerably from conditions in rural areas. Nearly all of them had a university degree and worked in offices in Kampala city with almost no contact to the users of their systems. Even though they worked in Uganda, their psychological distance to the users can be assumed to be substantial. The biggest psychological distance to the users is expected to be found among manufacturers of solar home systems, since all of them were Europeans with university education, who worked in Europe and only knew Uganda from business visits.
Figure 2: Mean correlation between estimated and actual users’ responses.
The results seem to support these assumptions. As
Figure 2 shows, the mean correlation (after Fisher transformation) between the solar companies’ estimations and the actual users’ responses to the ten items is r=.425. Between NGOs and users it is r=.371. Supervising organizations and manufacturers seem to be less able to predict the users’ responding behaviors (r = .093 and r = .162). The difference between solar companies and supervising organizations is significant (p<.05), whereas other differences reveal trends.
Figure 3: Items ordered by prediction accuracy of the total stakeholder sample.

204
PROCEEDINGS Conference MPDES 2011
When items are sorted according to the mean prediction accuracy of all stakeholders (Figure 3), it reveals that respondents of solar companies were – in seven out of ten items – able to predict just as well better than the average. In the three cases (items 3, 5 and 9) where solar companies failed to predict as accurately as the average, data suggest that solar companies expected the users to answer “don’t know”, whereas users did in fact have an opinion. In five out of ten cases NGO participants predicted better or just as well as the average stakeholder – supervising organizations in one case, and manufacturers in two out of ten cases.
As is visible in Figure 3, there are items in which the prediction accuracy is generally very low among all groups of stakeholders (e.g. item 5 and 8). Figure 4 shows a typical response pattern of an item with low prediction quality: most of the stakeholders estimated that users would answer “don’t know” whereas many users actually had an opinion about the statement. Items 2 (“Daily deep discharging of the battery reduces its lifespan.”) and 10 (“The automatic cut-off is the “life insurance” for the battery.”) are items where solar companies could predict the users’ responses much better than other stakeholders. These items may cover topics which are part of the explanations that are given to the users by the installing technician. The two items (items 3 and 4) where all groups of stakeholders could predict the users’ responses on a high level, cover the rather technical aspect of whether a 20-watt panel produces 20 or only 14 watt. Most of the stakeholders correctly estimated that users agree to item 3, but are not sure about item 4.
Figure 4: Response pattern for Item 5 “When the automatic cut-off (so that the battery does not discharge
below a certain level) is not working, the solar home system can still run well for many years.”
Discussion Relevance of the Results and Recommendations Stakeholders who are supposed to have a small psychological distance to the users seem to be able to predict the users’ responses more accurately than stakeholders with a great distance. That means, with regard to Brønn (2000) and Breakwell (2001), solar companies and NGOs possess the basic requirement to
adjust their explanations to the users’ mental models, and thereby to effectively communicate knowledge about solar home systems to them. The problem seems to be that they are lacking correct knowledge themselves. The level of knowledge among stakeholders declines earlier than expected. Even the supervising organizations which facilitate and provide training for employees of NGOs and local solar companies do not possess the full knowledge necessary to properly size, install and use solar home systems.
The prevalence of misbeliefs among solar companies is alarming, since they are the ones who on the one hand size and install the systems, and on the other hand supply the users with usage instructions. That means, even if all the knowledge that actually reached the solar companies is passed on to the users, it is not sufficient to ensure a sufficient lifespan. As a result, the desired impacts on sustainability and the MDGs are in question.
The early knowledge drop suggests that information is not communicated effectively. The supervising organizations develop most of the informational material for solar companies and users, but they are the ones who are least able to anticipate their mental models and therefore to adapt their communication to existing knowledge.
Therefore, we strongly recommend incorporating a focus on mental models of users and other local stakeholders into the preparation of staff in development cooperation.
Stakeholders in NGOs and supervising organizations in particular have greater potential to adapt not only communication strategies, but also the design of products and programs to the actual requirements of the beneficiaries. The existing mental models among the beneficiaries have to be taken into account to facilitate the success of technical innovations. Technical innovation can never be regarded as detached from the people and always requires close collaboration between engineering and social sciences in order to be successful and sustainable.
Limitations of the Study One of the major motivations behind this study was to develop an understanding of knowledge structures, beliefs and misbeliefs of different groups of stakeholders on the topic of rural electrification with solar home systems. The second motivation was to learn more about the stakeholders’ ability to take the users’ perspective as a key meta-competency to design products and user training according to the users’ habits and existing as well as required knowledge. Some of the present results seem to prove that the groups of stakeholders who possess the technical knowledge and the means to design products and trainings according to the actual users’ needs, are unable to see the world through the users’ eyes due to great psychological distance. Of course, the direct results of this study are limited to solar programs in Uganda done by NGOs. Hence, results cannot just be transferred to situations in other countries, but can serve as a first hypothesis on what to take into consideration when starting to investigate similar situations. Furthermore the

205
PROCEEDINGS Conference MPDES 2011
samples of manufacturers and NGO members were comparatively small due to their low number in population. Quantitative results may therefore be biased.
Outlook Until now there has been very little research on mental
models in technical development cooperation. Also concerning solar home systems, several interesting questions have not yet been addressed by the current study and therefore need further investigation. Will there actually be an increase in the level of knowledge among users if stakeholders are able to predict the initial users’ misbeliefs more accurately? To what extent do the knowledge deficits of relevant stakeholders effectively influence the performance and lifespan of solar home systems? And if performance and lifespan are affected, how does it influence the customers’ trust in and their willingness to buy solar home systems? A comparative study with situations in other countries with successful solar programs, like Bangladesh, could be illuminating.
In order to obtain broader knowledge on mental models about solar home systems in different groups of stakeholders, not only technical knowledge has to be studied, but also beliefs and misbeliefs about assumed advantages and disadvantages of using a solar home system. Currently, solar home systems are being promoted as sustainable energy solutions which imply advantages for the social, economic and environmental situation of people in rural areas of developing countries. The strong belief in their advantages is probably one of the main motivations for stakeholders to promote solar home systems in rural areas of Uganda. But are all of the assumed advantages justified? And to which degree are stakeholders able to accurately predict the users’ beliefs and misbeliefs about advantages?
Some of these issues will be addressed in our further research which will include quantitative as well as qualitative techniques like narrative interviews with stakeholders and the analysis of training material.
Acknowledgements Primary financial support for this research came from the Hans-Böckler-Foundation. Any opinions, findings, and conclusions expressed in this paper are those of the authors and do not necessarily reflect the views of the Hans-Böckler-Foundation. We are grateful for the great support FINCA provided in Uganda to make the survey possible. Their dedicated staff enabled us to reach many users of solar home systems. The researchers of CREEC patiently helped us pretest our questionnaire and provided valuable technical and scientific support. Many people gave us advice and have helped to make contacts and find questionnaire respondents. Without implying that they occur in our findings and conclusions we wish to thank: Patricia Kawagga, Lucius Mayer-Tasch, Ronald Schuurhuizen, Miep Sellmeijer, Izael Pereira da Silva, Steffen Wassler, Karsten Bechtel, Ruth Kiwanuka, Patricia K. Litho, Tobias Rothenwänder, Annekathrin Gotsch, Heidi Berkmüller, Anna Husemann, Christoph Zipfel, the colleagues at the postgraduate program
Microenergy Systems and all the respondents who kindly completed our questionnaire.
References Alam, M., Rahman, A. & Eusuf, M. (2003). Diffusion
potential of renewable energy technology for sustainable development: Bangladeshi experience. Energy for Sustainable Development, 2, 88-96.
Breakwell, G.M. (2001). Mental models and social representations of hazards: the significance of identity processes. Journal of Risk Research 4 (4), 341-351.
Brønn, P. S. (2000). Mapping the Strategic Orientation of Public Relations Directors. Doctoral dissertation presented for the degree Doctor of Business Administration, HenleyManagementCollege.
Bundesministerium für wirtschaftliche Zusammenarbeit. (2007). BMZ Materialien 158. Erneuerbare Energien in der deutschen Entwicklungszusammenarbeit. Bonn: BMZ.
Caron, C.M. (2002). Examining alternatives: the Energy Services Delivery Project in Sri Lanka. Energy for Sustainable Development, Volume VI No. 1, pp. 38-46.
Cherni, J.A. (2006). Rural electrification under liberal reforms: the case of Peru. Journal of Cleaner Production 15, 143-152. Elsevier.
Clemens, B., Karp, A.W. & Papadakis, M. (2002). The People’s Water: Technology Transfer and Community Empowerment in Guatemala. Knowledge and Society, 13, 105-127.
Dauselt, C. (2001). Involving the user: Community Based Management of Solar Home Systems in Indonesia, Refocus, 2 (9), pp. 18-21.
Galinsky, A. D., Gruenfeld, D. H., & Magee, J. C. (2003). From power to action. Journal of Personality and Social Psychology, 85, 453–466.
Gesellschaft für technische Zusammenarbeit. (2000). Quality standards for solar home systems and rural health power supply. Photovoltaic systems in developing countries. Eschborn: Division 44, Environmental Management, Water, Energy, Transport.
Gesellschaft für technische Zusammenarbeit. (2009). Regional reports on renewable energies. Eschborn: GTZ.
Green, D. (2004). Thailand’s solar white elephants: an analysis of 15 yr of solar battery charging programmes in northern Thailand. Energy Policy 32,747–760.
Kebir, N. (2011). The African electrification initiative. The role of microfinance. Submitted to Wold Bank Publications.
Mayer, C.H., Boness, C. & Thomas, A. (2003). Beruflich in Kenia und Tansania. Trainingsprogramm für Manager Fach- und Führungskräfte. Göttingen: Vandenhoeck & Ruprecht.
McLeod, J.M. & Chaffee, S.H. (1973). Interpersonal approaches to communication research. American Behavioural Scientist, 16, 469-499.
Morgan, M.G., Fischhoff, B., Bostrom, A. & Atman, C.J. (2002). Risk communication: a mental models approach. Cambridge: University Press.
Müller, P., Kebir, N., Stark, R. & Blessing, L. (2009). PSS layer method – application case microenergy

206
PROCEEDINGS Conference MPDES 2011
systems. In T. Sakao & M. Lindahl (Eds.), Introduction to Product/Service-System Design. Berlin: Springer.
Norman, D.A. (1983). Some Observations on Mental Models. In: D. Gentner & A.L. Stevens (Eds.), Mental Models. Hillsdale: Lawrence Erlbaum Associates.
Overseas Development Administration. (1995). Guidance note on how to do stakeholder analysis of aid projects and programmes. http://www.euforic.org/gb/stake1.htm.
Reiche, K., Grüner, R., Attigah, B. Hellpap, C. & Brüderle, A. (2010). What difference can a PicoPV system make? Early findings on small Photovoltaic systems - an emerging low-cost energy technology for developing countries. Eschborn: Deutsche Gesellschaft für Technische Zusammenarbeit GmbH (GTZ).
Schmeer, K. (1999). Guidelines for Conducting a Stakeholder Analysis. Partnerships for Health Reform, Abt Associates Inc.
Schweizer-Ries, P. (2004). Nutzung von Solarstromanlagen. Ein umweltpsychologisches Thema. Magdeburger Wissenschaftsjournal, 1(9), 27 – 34.
Trope, Y., Liberman, N., & Wakslak, C. (2007). Construal levels and psychological distance: Effects on representation, prediction, evaluation, and behavior. Journal of Consumer Psychology, 17(2), 83-95
Uzzel, D. (1987). A Co-Orientational Analysis of the Professional Placement in Europe. European Journal of Education, 22(1), 85-100. Wamukonya, N. (2001). The uneven Road for the non-
grid programme in South Africa. Energy for Sustainable Development, 3, 41-46.

207
PROCEEDINGS Conference MPDES 2011
Micro-energy systems in low-income countries: learning to articulate the solar home system niche in Tanzania
Rob Byrne ([email protected])
SPRU (Science & Technology Policy Research) School of Business, Management and Economics
The Freeman Centre, University of Sussex, Brighton BN1 9QE, UK
Abstract Despite multiple efforts over two decades in Tanzania to apply a solar home system (SHS) diffusion „model‟ generated in Kenya, it is only in recent years that a Tanzanian SHS market has begun to grow. Why is it that the Kenyan „model‟ seemed to fail in Tanzania, even as the SHS market grew rapidly in Kenya; and why has the Tanzanian market grown rapidly since the early 2000s?
The objective of this paper is to explain the evolution of the Tanzanian SHS market. It applies the strategic niche management approach to the Tanzanian photovoltaic (PV) „niche‟ – the empirically identified set of actors, technologies and practices concerned with household electricity services using PV. By focusing primarily on the learning stimulated by a number of events, processes and projects, the research traces the dynamics of the socio-technical trajectory of the Tanzanian PV niche. This then enables reflection on the Kenyan SHS market and about the diffusion of sustainable energy technologies in poor developing countries more generally.
Keywords: Solar Home Systems; Kenya; Tanzania; Strategic Niche Management.
Introduction The long-standing objective of rural electrification in developing countries is expected to deliver many benefits, including “improvements in health, education, and opportunities for entrepreneurship” (Dubash, 2002, p. 2). For decades, the assumption and practice has been to build centralised generating capacity and transmit the electricity over national grids (Goldemburg, Reddy, Smith & Williams, 2000, p. 375). However, despite years of effort, only a small percentage of the populations of many developing countries has access to electricity. More recently, interest has grown in the potential of photovoltaic (PV) technology to solve the problem of rural electrification. This interest is intensified because PV is aligned with sustainability objectives; and PV systems are modular. PV‟s modularity is attractive for at least two reasons. One, it is more amenable to rural application where power needs are generally small – particularly in households – and grid infrastructure is weak or non-existent. Two, it is suitable for distribution through retail systems and so aligns with market-based approaches to development. Market-based development approaches – such as the Bottom of the Pyramid (BOP) (Prahalad & Hammond, 2002) – might provide „win-win‟ solutions: The poor gain greater access to services; private firms increase profits; and society achieves cheaper development than through public sector interventions.
A private market for household PV systems (solar home systems – SHSs) has grown in Kenya since about 1984; a market that is widely hailed as a success story among
developing countries (Jacobson, 2004). Now, there is estimated to be more than 200,000 SHSs installed in Kenya, sold through the private market (Hankins, 2005). As a result, policymakers have been interested to use the Kenyan „model‟ to disseminate PV elsewhere in the developing world using the private sector (Hankins, 2007). Until recently, Tanzania had almost no SHS market despite interest from a number of actors, including some of those involved in enabling the growth of the Kenyan market. However, sales of PV began to grow in the early 2000s and the trend appears to be gaining pace, with an estimated 285 kWp1 sold in 2007, having risen by 57% in one year (Felten, 2008). A number of large donor-supported projects have been recently active in the country, but there is also a burgeoning private sector of PV companies servicing a market that was estimated to be worth USD 2 million in 2007-2008 (Sawe, 2008).
What explains this recent rapid growth of the Tanzanian PV market, and does this success provide evidence that private sector led development is more effective than donor-funded interventions?
Research Objectives Empirically, the objective is to explain the evolution of the Tanzanian SHS market, concentrating on particularly revealing aspects of this evolution. The theoretical objective is to offer an operationalisation of some of the key concepts in strategic niche management (see below), the conceptual framework used here. Flowing from these two objectives are policy-relevant questions on diffusing sustainable energy technologies in developing countries.
Theoretical Framework Strategic niche management (SNM) is a conceptual framework that can be applied either analytically or normatively (Raven, 2005). Normatively, it is intended to be used for finding and developing sustainable solutions to societal functions, such as mobility or energy services. Analytically, it rests on the assumption that novel configurations of social practices and technological artefacts,2 that together provide solutions to societal functions, emerge in protected spaces wherein
1 kWp (kilowatt-peak) is equivalent to 1000 watt-peak. Peak
watts refer to the maximum electrical power output for a PV module under standard test conditions (1000 W/m2 solar irradiance at 25°C, air mass of 1.5 kg/m3).
2 The stream of literature that includes SNM analyses social and technical dimensions together, leading to the notion of socio-technical configurations. Social dimensions encompass cultural, social, economic and political aspects of the context within which technological artefacts are used.

208
PROCEEDINGS Conference MPDES 2011
experimentation proceeds free of constraints such as economic viability (Berkhout et al., 2010). Experimentation generates learning, builds networks of sympathetic actors, and begins to embed novel socio-technical configurations into the mainstream. SNM refers to such protected spaces as niches, while the mainstream consists of regimes. The broader context in which niches and regimes are situated is referred to as the landscape, and all three (niches, regimes and landscape) are connected in a hierarchical framework (seeFehler! Verweisquelle konnte nicht gefunden werden.) referred to as a multi-level perspective (MLP) (Geels, 2002). SNM is focused on evolution of the niche but is analytically open to interdependencies across the micro-, meso- and macro-levels of the MLP.
Figure 1: The multi-level perspective. Source: Geels (2002, p. 1261)
When analysing the emergence of a novel socio-technical configuration from a niche, SNM directs us to investigate a number of interacting processes and their characteristics, as they relate to technological experiments in a social context. They can be summarised as follows (elaborated below): (1) the processes and quality of learning (see, e.g., Hoogma, Kemp, Schot & Truffer, 2002), (2) the composition and quality of social networks (see, e.g., Caniëls & Romijn, 2008; Raven, 2005; Romijn, Raven & de Visser, 2010), (3) the evolution of collective socio-technical expectations and visions (see, e.g., Berkhout, 2006; Geels & Raven, 2006; Raven, 2005), and (4) processes of institutionalisation (see, e.g., Deuten, Rip & Jelsma, 1997; Raven, 2005).
Learning Learning is conceptualised in two forms within the SNM framework: first- and second-order learning. First-order learning arises when technological artefacts are tested in practical settings; it is an instrumental form of learning that is concerned only with the detailed functioning of artefacts, not with the underlying assumptions on which the use of such artefacts rest. In contrast, second-order learning arises “when conceptions about technology, user demands, and regulations are … questioned and explored” (Hoogma et al., 2002, p. 194).
Actor-Networks Networks of actors are important for attracting resources to socio-technical experiments, building constituencies of support, and providing multiple sites for experiments from which varied lessons can be drawn and translated to other contexts (Raven, 2005). SNM posits that broad networks are more helpful for novel technologies than networks of regime insiders, who may be more interested in maintaining the status quo or only incremental innovations (Hoogma et al., 2002).
Expectations and Visions Socio-technical expectations and visions are cognitive schemata that help to describe future states of the world in which particular socio-technical configurations perform societal functions better than current ones (Berkhout, 2006). When expectations and visions are shared widely among networks of actors they help to direct activity in particular directions – socio-technical trajectories (Geels & Raven, 2006). They also operate as recruiting devices, attracting actors and their resources to niches (Eames, McDowall, Hodson & Marvin, 2006).
Institutionalisation Institutionalisation refers to the processes of embedding practices into the routines of actors – whether users or producers, policy makers and others – and the creation of policies, laws, regulations, and so forth (Deuten et al., 1997; Raven, 2005). SNM, therefore, understands institutions in the sociological sense of norms, conventions, practices, policies, laws and regulations; not as organisations (Hodgson, 2006).
Methods It is straightforward to identify institutions and social networks in operation but perhaps less so for learning, and socio-technical expectations and visions. In this paper, these concepts are operationalised in a particular way. A fuller discussion that argues for this operationalisation can be found in Byrne (2009); here we simply state it.
Building on Berkhout (2006) and Eames et al. (2006), an expectation is a socio-technical „target‟ towards which actors align themselves and their activities, while a socio-technical vision specifies the means to achieve the expectation and defines the expectation in greater detail. We can see the operation of expectations and visions in, for example, arguments made for particular technologies, project goals, and „how-to‟ manuals.
We can relate learning to expectations and visions following Byrne (2009). First-order learning is generated when actors pursue a particular expectation: that is, they already hold a number of assumptions about a particular direction and then attempt to realise it, gradually filling in more detail to develop a vision. Second-order learning results in a change to those assumptions and a new direction to pursue; a new expectation, and the requirement for new first-order learning to envision it. Figure 2 shows these ideas. Actors initially work towards Expectation 1, making progress through first-order learning. At some point they may experience second-order learning that changes their assumptions about the

209
PROCEEDINGS Conference MPDES 2011
expectation to realise, resulting in Expectation 2. This is then pursued through first-order learning once again.
Figure 2: Schematic representation of first and second-
order learning, and expectations and visions. Source: Byrne (2009).
We can identify learning through changed behaviour and arguments, as well as changes and developments of knowledge communicated in reports and other documentation. First-order learning is recognised when there is activity that details a particular socio-technical direction or trajectory (see below). Second-order learning is recognised by a change in that trajectory.
Building on the notions of technological paradigm and trajectory in Dosi (1982), and the definition of a socio-technical regime (see, e.g., Hoogma et al., 2002, p. 19), we can develop a schematic representation of a socio-technical paradigm and trajectory. Dosi (1982, p. 152) defines a technological trajectory as a “pattern of „normal‟ problem solving activity … on the ground of a technological paradigm”. His elaboration of a technological paradigm details the elements that make the “pattern” to which he refers, including (p. 153): relevant material technology; physical/chemical properties exploited; and technological and economic trade-offs. Hoogma et al. (2002, p. 19) define a socio-technical regime as:
… the whole complex of scientific knowledge, engineering practices, production process technologies, product characteristics, skills and procedures, established user needs, regulatory requirements, institutions and infrastructures.
Combining the definitions given in Dosi (1982) and Hoogma et al. (2002) we can describe explicitly the dimensions of a socio-technical paradigm. Assuming that a socio-technical niche can be conceptualised as a nascent regime, we can investigate the evolution of the various dimensions of a socio-technical paradigm – each particular pattern being a socio-technical trajectory – as niche actors attempt to establish a new regime. Figure 3 shows these ideas schematically. So, the direction of activity in each dimension combines to form a particular
trajectory; a change in the direction on any dimension constitutes a change in trajectory.
Data Collection The field research took place in Kenya and Tanzania between July 2007 and July 2008. Semi-structured interviews were conducted with a wide range of actors involved in PV activities in the two countries: governmental and non-governmental, the private sector, donors, and universities. Secondary sources included a wide range of documentary material: project proposals and reports, government documents, research and consultancy documents, and so forth. A number of respondents gave copies of reports and other documents that are difficult to find in the public domain.
Results This section describes relevant aspects of the evolution of the Tanzanian SHS market. The description begins with an account of the arrival of PV in East Africa. We then review early activities in Kenya‟s SHS market, which had important influences on the activities pursued in Tanzania. Subsequent Tanzanian experiences are then described, focusing on those most revealing for developing our understanding of the evolution of this market.
PV Comes to East Africa PV systems entered East Africa during the late 1970s to power telecommunications equipment (Duke, Jacobson & Kammen, 2002; Hankins & Bess, 1994; Mwihava & Towo, 1994). During the early 1980s, donors began to fund the installation of health-related PV systems, some in Kenya and Tanzania. The US Agency for International Development (USAID) funded clinic systems (Roberts & Ratajczak, 1989); and the World Health Organization (WHO) began a worldwide programme to immunise all children by 1990 (Henderson, 1989), including the installation of PV-powered vaccine refrigerators (McNelis, Derrick & Starr, 1988). Following these developments, a number of international companies set up offices or agents in Kenya (Abdulla, 2008; Energy Alternatives Africa [EAA], 1998; Hankins, 1990; Rioba, 2008) and Tanzania (Kimambo, 2008; Mbise, 2002; Sawe, 1989).
It is unclear whether the Kenyan and Tanzanian ministries responsible for energy were aware of these developments. Both countries had a ministry for energy by the early to mid 1980s, and their first energy policies reveal awareness of PV technology (Republic of Kenya [ROK], 1987; United Republic of Tanzania [URT], 1992). While both ministries were engaged in renewable energy projects, there is no evidence that they were active in the technology (Rioba, 2008; Sawe, 2008). For the most part, the ministries (and donors) were more concerned with finding solutions to the burgeoning problems around biomass energy.
Second-order learning
First-order learning
‘Starting’ point
First-order learning Expectation 2
Expectation 1

210
PROCEEDINGS Conference MPDES 2011
Figure 3: Dimensions of a socio-technical paradigm, with a particular configuration as a socio-technical trajectory. Source: Adapted from Byrne (2009) following Dosi (1982) and Hoogma et al. (2002).
So, in the early 1980s, there was no significant market in either Kenya or Tanzania for SHSs. Projects for commercial and community services systems continued and a market developed around these. Indeed, such projects still account for a large part of the installed capacity of PV systems in the region (Energy for Sustainable Development [ESD], 2003).
The Kenyan SHS Market Phenomenon The Kenyan private market in SHSs is said to have started during 1984 and its beginning is attributed to the activities of Harold Burris, an ex-Peace Corps volunteer, after he set up the company Solar Shamba in a coffee growing region south of Mount Kenya (Acker and Kammen, 1996; Duke et al., 2002). Burris was an engineer who had worked in the nascent US solar industry (SolarNet, 2001) before coming to Kenya with the Peace Corps in 1977 (Perlin, 1999). During the middle of 1983 Burris met Mark Hankins by chance at a café in Nairobi (Hankins, 2007). Hankins was a Peace Corps volunteer teaching science at Karamugi Harambee Secondary School, which was in the process of considering electrification with a 5 kVA diesel generator3 (Hankins, 1993). The generator was chosen because the cost of connecting to the grid would be about USD 21,000 (Perlin, 1999, p. 133). But, the Karamugi board of governors were persuaded to visit Burris‟ home PV system whereupon they were impressed enough to postpone purchase of the diesel generator and to trial the use of PV in four classrooms and the headmaster‟s office (Hankins, 1993; Perlin, 1999). The
3 kVA is kilovolt-ampere, a measure of electrical power.
systems were installed during the first to third quarters of 1984 (Hankins, 2007) and, according to Kimani and Hankins (1993, p. 93), the headmaster, some of the teachers and others in the community bought systems for their own homes “within six months of the school‟s installation”. This was a clear signal to both Burris and Hankins that there could be a market for SHSs4: Burris “saw that there was a lot of business and there was a coffee boom going on too so there was a lot of cash” (Hankins, 2007). A major factor in the demand for electricity was the desire to watch television. Portable DC TVs began to appear on the market in about 1981, and the TV signal became increasingly available during the 1980s (Jacobson, 2004).
In response to these developments, Burris moved to Embu where he renamed his business from Kidogo Systems to Solar Shamba (Jacobson, 2004) and began “to get heavily into the marketing” (Hankins, 2007), making use of an array of marketing approaches (Muchiri, 2008). Hankins, for his part, applied to Peace Corps for an independent placement in which he would work with Burris on a project to install PV systems in three more schools, and include in the package the training of local technicians (Hankins, 2007). According to Hankins, he and Burris believed the training element would be critical to the growth of the market in Kenya (Hankins, 1996, p. 6). By the third quarter of 1984, the Peace Corps had given approval for Hankins‟ independent placement, provided he work solely on the project with Burris
4 The term „solar home system‟ had not been coined at this
time though (Hankins, 2007).
Technological and Economic
Trade-Offs
User Needs
Institutions
Infrastructures
Supply Maintenance Training Finance Repair Retail
Regulations Government Policy
User Preferences User Practices User Requirements
Product Functionality Product Aesthetics
Engineering Skills Engineering Procedures Engineering Heuristics
Product Characteristics
Engineering Practices
Material Technology
Physical Properties Exploited
Production Process Technologies
Scientific Knowledge S
ocio
-Tec
hnic
al
Par
adig
m
Soc
io-T
echn
ical
Tr
ajec
tory

211
PROCEEDINGS Conference MPDES 2011
(Hankins, 2007). USAID funded 50% of the cost of the systems for the schools and the installations were done during 1985 and into 1986 (Hankins, 2007). Burris and Hankins developed manuals for the training aspect of the project, and the 12 trainees spent part of their time installing systems and part in classroom-based training. At the end of the project, the technicians were introduced to a number of the Nairobi PV suppliers who then employed some of them (Hankins, 1993) while others went on to work for Burris (Muchiri, 2008). An important outcome of the project was a „model‟ of PV dissemination that Hankins and others applied in both Kenya and Tanzania.
Burris continued to develop his business, and the Nairobi PV suppliers also became active in the SHS market, initially around Mount Kenya but later expanding across the country as others entered the market (EAA, 1998; Hankins, 1990, 1993; Rioba, 2008). The SHS market itself expanded quickly after 1986. In 1987 it is estimated that module sales were slightly less than 100 kWp but by 2001 annual sales had reached about 650 kWp (Jacobson, 2004). By the mid 1990s, the average system size was about 20 W and falling (van der Plas & Hankins, 1998). Using 20 W as an estimate of system size in 2001, 650 kWp represents about 32,000 modules. At the end of 2007, annual PV sales were estimated to be worth USD 6 million (Mutimba, 2007).
So, a private market for SHSs grew rapidly in Kenya from the mid 1980s and continues to be significant. It also appears that the work of Burris and Hankins had an important influence on its birth and growth. Furthermore, it appears that the private sector developed the market itself; an exemplar of market-based approaches to development. However, a closer examination of the processes by which the Kenyan SHS market evolved reveals that this private sector led reading is over simplistic. Private sector actors were indeed important in growing the market but contributions from non-market actors have been underplayed in the literature. This becomes clearer once we examine the evolution of the Tanzanian SHS market where the contributions of non-market actors are more visible. The next section describes some relevant aspects of this evolution, enabling us to analyse its lessons. In turn, this will help us to reflect on the evolution of the Kenyan SHS market.
The Tanzanian SHS Market Experience This section reviews briefly the experiences with PV in Tanzania during the 1980s and the influence of the Kenyan dissemination model from the 1990s. It then reports the activities of a number of PV projects and shows how these helped to develop the Tanzanian PV niche. This account then lays the ground for an SNM analysis in the subsequent section.
PV in Tanzania during the 1980s As mentioned earlier, PV was introduced to Tanzania to power telecommunications equipment and was certainly in operation by the beginning of the 1980s (Mwihava & Towo, 1994). There had been an earlier interest in the technology, when the possibility of its use in villages was considered at a workshop in Dar es Salaam in 1977
(UTAFITI, 1978). Little immediate action came of these early discussions, at least in terms of governmental activities. MWE (the energy ministry) developed some interest in PV but was never able to secure resources to implement projects (Sawe, 2008). In any case, the more pressing concern was the issue of wood supply for household energy-use (Nkonoki, 1983). However, the use of PV expanded into other applications such as lighting for remote railway stations, community-scale water pumping, and health-related systems such as vaccine refrigerators (Sawe, 1989).
The few PV companies present in Dar es Salaam during the 1980s tended to service this project market, the exception being BP which had sold about 150 “domestic systems” in the period 1989 to 1994 (Mwihava & Towo, 1994, pp. 73-76). Outside Dar es Salaam there were very few active in PV. Tropical Solar Systems (TROSS) was started in Arusha by Stephen Kitutu in 1983 or 1984 (Arkesteijn, 2000), although Kitutu found there was more demand for solar water heaters than PV (Kitutu, 2008); and Karagwe Development Association (KARADEA), located in a remote part of north western Tanzania, received and installed a donation of about 20 PV systems from Swedish Church Aid in 1987 (Kasaizi, 2008; Musa, 2008). There may have been other donated systems in the country but there is little documentary evidence. In short, there were only scattered and fragmented PV activities in Tanzania up to the late 1980s.
Transferring a Model from Kenya A significant event in the development of the PV sector in Tanzania was a workshop held in Nairobi and Meru in 1992. Burris and Hankins initiated the workshop, helped by the Kenya Energy and Environment Organisation (KENGO), with funding from the African Development Foundation (ADF) (Hankins, 2007; Kimani, 1992). It brought together participants from 10 African countries and elsewhere for an intensive period during which they received practical PV training. Six attendees were from Tanzania; from both the private and public sectors, as well as NGOs and university. For Hankins, two project opportunities in Tanzania arose from the workshop. One was with an NGO near Arusha and the other with Oswald Kasaizi‟s organization KARADEA, mentioned earlier.
By the end of 1992, Kasaizi and Hankins had written a proposal for an ambitious project based around the idea of a Solar Enterprise Centre, encompassing a set of interlinked activities: a solar business; training courses; development of affordable small systems; installation of demonstration business PV systems; and a credit scheme (Kasaizi & Hankins, 1992). The Swedish development organisation Sida funded the construction of the building that contained a classroom and store, while the Commonwealth Science Council (CSC) funded the first training course in November 1993 (Kasaizi, 2008; de Groot, 1997). But not everything in the proposal was funded and so the project became focused more on training, with the result that the Solar Enterprise Centre became the KARADEA Solar Training Facility (KSTF).
Hankins, who had started the company Energy Alternatives Africa (EAA), led the training at KSTF. The form of the course was the same as that he and Burris had

212
PROCEEDINGS Conference MPDES 2011
developed for the USAID-supported schools project in Kenya and the 1992 Nairobi workshop (Jackson, 2008): there was classroom-based theory and practical work installing systems. KSTF continued to run courses once or twice per year up until about 2004 (KSTF, 2009). While the course content and form evolved over time, it continued to be the model that Hankins (and, later, many others) used in the ensuing years in Tanzania and other parts of eastern Africa. Indeed, a number of the participants went on to become influential in PV projects in Tanzania and elsewhere, helping to replicate the model (Byrne, 2009). Hankins himself, through EAA and with other organisations, conducted at least two similar courses in different locations in Tanzania: In April 1996, at the Simanjiro Animal Health Learning Centre (about three hours south of Arusha); and, in October 1997, at Wasso Hospital, near to the Serengeti. As with the previous courses, the trainees had classroom-based sessions and practical work (EAA-ApproTEC, 1998; Hankins, 1998). But, unlike in Kenya where there was entrepreneurial activity by the participants once they had finished the course, there was little business impact in Tanzania (Hankins, 2007). When the Tanzanian trainees returned home, they had no resources to implement projects, there were no local PV suppliers, and there was little awareness of PV and so no noticeable demand (Jackson, 2008).
Nevertheless, we can identify other outcomes. KSTF trained about 175 technicians (KSTF, 2009), while many others were trained in replica courses elsewhere. Some went on to influential positions in the PV sector that later developed. For example, Mzumbe Musa (KSTF‟s first Tanzanian manager) (Jackson, 2008; Musa, 2008), later coordinated the UNDP-GEF PV project in Mwanza (more below). Finias Magessa, who worked for TaTEDO (more below), was trained at KSTF and later became the Executive Secretary of the Tanzania Solar Energy Association (now the Tanzania Renewable Energy Association) (Magessa, 2008). Gaspar Makale, who had been with KARADEA from the 1980s (Kasaizi, 2008), later trained many others in the East Africa region. And KSTF did other pioneering work locally. For instance, there were attempts to use micro-finance to increase the sales of PV systems (Burris, Katumi & Hankins, 1992; Kasaizi, 2008); and bringing together participants from distant parts of the East Africa region helped to form networks of actors who would later collaborate. Furthermore, KSTF attempted to commercialise their activities around the Kagera region: They installed systems for aid agencies in the Rwandan refugee camps and hospitals; sold solar lanterns; attempted to open battery charging stations in villages; and tried to source the equipment within Tanzania, with a view to developing the local supply chain (Jackson 2008).
TaTEDO’s PV Activities The Tanzania Traditional Energy Development and Environment Organisation (TaTEDO), a local NGO which had been created in 1992 to help build indigenous capacity in the energy sector, began activities in PV around 1996 (Magessa, 2008; Sawe, 2008). These started with a small PV system installed at their offices by Burris who had started a PV company in Dar es Salaam
(Ultimate Energy), having left a job with a GEF PV project in Zimbabwe sometime in 1993 (Kolowah, 2008; Magessa, 2008). Following a major rural energy study funded by Sida (Hifab-TaTEDO, 1998), TaTEDO secured funding from Hivos and Norad to undertake a large PV project that included networking, training, awareness-raising, demonstration systems, and market development (Arkesteijn, 2000). The project ran from 1999 to 2002, covering Dar es Salaam, Mwanza, and Kilimanjaro Regions (Sanga, 2008); selected because of their poor grid infrastructure, potential for renewable energy use, and strength of the local cash economy (Arkesteijn, 2000). The project began with internal capacity building, including Finias Magessa‟s training at KSTF (Magessa, 2008). TaTEDO then invited Makale from KSTF, Burris and me5 to design a training course to be delivered in the three project regions, beginning with Dar es Salaam in May 2000. The format of the course was similar to KSTF‟s PV training. At the end of this first course there was a stakeholder‟s workshop in which the Tanzania Solar Energy Association (TASEA) was created (Arkesteijn, 2000). TaTEDO conducted two more courses the same year, one in each of the other two regions. After each course, there was a stakeholder‟s workshop and those attending were invited to join TASEA. Although the hope had been that the trainees would include PV activities in their organisations, very few were able to do so (Sanga, 2008). Only those who were already involved in PV prior to the course – mostly from PV retailers – continued after the training. Consequently, TaTEDO targeted those working in PV companies, or who demonstrated promising entrepreneurial energies, for the second round of training courses (Sanga, 2008). This was a more successful approach and was continued in a second project that ran until 2005, concentrating on building technical and entrepreneurial capacities.
Umeme Jua and Market Development An important relationship developed between TaTEDO and the Dutch PV manufacturer Free Energy Europe (FEE) in the late 1990s after FEE sent a Dutch engineer – Marcel van der Maal – to work with them while introducing FEE‟s amorphous modules to the Tanzanian market (van der Vleuten, 2008). Frank van der Vleuten (Marketing Manager of FEE) wanted to sell into Tanzania, having already experienced success with FEE modules in Kenya. In 2000, Karlijn Arkesteijn, a Dutch masters student, joined van der Maal at TaTEDO and conducted the first PV actor survey in Tanzania (Arkesteijn, 2000). This analysed the extent to which PV actors were networked with each other, and sought their views on what needed to be done to develop the market. Apart from the network in Dar es Salaam, Arkesteijn found that most PV actors in Tanzania were working in isolation – the networks were weak and fragmented. Nevertheless, the views on what was needed to develop the market were highly convergent. An overwhelming response was the need for a central actor who could
5 I had been working in a small PV project in northern
Tanzania and delivered part of the training on KSTF‟s policymakers course, where I met Magessa.

213
PROCEEDINGS Conference MPDES 2011
coordinate information and knowledge exchange. Beyond this, all the issues identified in the 1998 rural energy study were mentioned: lack of awareness of PV; difficulty sourcing equipment; lack of standards; taxes too high; not enough training; no finance, and so on (Arkesteijn, 2000).
Other market surveys followed. EAA, together with TaTEDO and Ameco (a Dutch consultancy), conducted market assessments in 2001-2002 in five regions. In 2004, TaTEDO and Fredka International (a Tanzanian consultancy) conducted a baseline survey of the PV market in Mwanza Region (TaTEDO-Fredka, 2005). Then in 2007, another set of regional market surveys was undertaken for Sida and the Ministry of Energy and Minerals (MEM) (Sida-MEM, 2007; 2008). They all converged on similar conclusions to the Arkesteijn and 1998 studies, and characterised the market in similar terms, although each contributed new information as well. For example, the EAA surveys revealed two unexpected market segments (van der Vleuten, 2008). One was for charging mobile phones and the other was a “migrant worker” market: People with steady incomes working away from their home area who sent goods home. PV was potentially attractive to them and they became a source of reliable business, in contrast to farmers who only had seasonal incomes (van der Linden, 2008). Arkesteijn‟s study helped to prepare the way for FEE‟s subsequent entry into the Tanzanian market (van der Vleuten, 2008). This became Umeme Jua – a joint venture with TaTEDO and Fredka International. By 2002, Umeme Jua was officially registered and Jeroen van der Linden became its first managing director.
Umeme Jua had intended to apply the model of supply that FEE had successfully used in Kenya. That made use of the dealer network of a large player (Chloride Exide in Kenya). However, no such player existed in Tanzania and so Umeme Jua identified dealers individually in the regions in which it decided to operate, hence the market surveys (van der Linden, 2008; van der Vleuten, 2008). This was a slow process that is unlikely to have occurred if Umeme Jua had not had significant funding from the Dutch government (Arkesteijn, 2009). But, over time, they built a network of retail dealers around the country and complemented this with a network of technicians who could service the local demand (van der Linden, 2008; van der Vleuten, 2008). Part of the reason this was a slow process is that it required training of the dealers and technicians. Initially, Umeme Jua used the Kenyan training model. However, Umeme Jua began to realise that this was unsuitable for most retailers and developed a course that could be conducted in repeated visits to a shop, and delivered in a few hours each time (van der Linden, 2008). This required extensive travel, and so was burdensome, but it generated other benefits. One of these was the building of trust between Umeme Jua and the retailers by cultivating long-term relationships (Arkesteijn, 2009). There were also incentives for dealers to sell more modules, including better terms depending on the quantities sold, supported by guaranteed delivery (van der Vleuten, 2008).
Other marketing techniques included demonstrating systems in public locations around the country and advertising on local radio stations (Arkesteijn, 2009). And
Umeme Jua made extensive use of marketing provided through the Free Energy Foundation, also funded by the Dutch government. This was available to all PV actors in Tanzania, together with the use of the „free brand‟ Solar Sasa (Schuurhuizen, 2008). Arkesteijn6 introduced standard systems that reduced the need for long explanations to customers in shops, as well as simplifying design and supply requirements. And Umeme Jua experimented with financing of SHSs. A number of these attempts failed but hire purchase was very successful (van der Linden, 2008). By 2008, Umeme Jua turned over about USD 1 million of business, which was estimated to be about 50% of the Tanzanian PV market (Sawe, 2008).
Subsequent PV Projects Four other large PV projects followed the Umeme Jua enterprise, although some of them were initiated earlier. Each of them bears remarkable similarities to the Umeme Jua approach and this is an indicator of the extent to which the PV actor-networks in Tanzania became far more integrated than they had been when Arkesteijn conducted her survey in 2000. Initiated in 1999, a UNEP-GEF funded project to develop dissemination networks across eastern Africa finally got underway in 2005 (de Villers, 2007). In 2002, the project held a stakeholder‟s workshop and Jeroen van der Linden was present (UNEP-EAA-MEM, 2002). It is unclear whether this was significant but it does establish that there was at least a connection between the Umeme Jua team and the UNEP-GEF project manager EAA (which later became Energy for Sustainable Development Africa [ESDA]). The UNEP-GEF project certainly appears to have been influenced by Hankins‟ understanding of the success factors in Kenya: Target a cash-crop area, set up a dealer network, train technicians, and raise awareness. Whether there was any influence on Umeme Jua, or vice versa, is difficult to judge. But much the same approach used was repeated in a subsequent Sida-MEM project (see below), which was also managed by EAA/ESDA.
In 2004, the GEF funded another project but this time through the UNDP and in Mwanza Region (URT-UNDP-GEF, 2004). It also suffered a long delay before implementation but this afforded Umeme Jua an opportunity to influence its final design (van der Linden, 2008). It concentrated on the Mwanza Region for the first three to four years, and was to be replicated in other lake-zone regions (Musa, 2008). While it had been influenced by the Umeme Jua approach, it was not identical. It donated some systems, which were placed in strategic locations as demonstrations, and experimented with productive uses of PV: Powering barber shops, providing mobile phone charging services, and others. Furthermore, it included a policy dimension, which involved the development of PV standards in collaboration with both the Tanzania and Kenya Bureaus of Standards. It also experimented unsuccessfully with micro-finance (Musa, 2008). Nevertheless, the project was successful and the PV market expanded significantly in Mwanza Region.
In 2005, a Sida-funded project got underway, known as the Sida-MEM project. Like the UNEP-GEF and UNDP-
6 Arkesteijn was Umeme Jua‟s second managing director.

214
PROCEEDINGS Conference MPDES 2011
GEF projects, it suffered a long delay before implementation (Kårhammar, 2008). Its final design was based on consultations between the incoming project manager, Jeff Felten, and local PV actors (Felten, 2008). So, once again, there was interaction and influence among those implementing projects in Tanzania – between Umeme Jua, UNDP-GEF and UNEP-GEF. Still, it was not identical to the other projects. It did share the multi-dimensional market development approach in general, and included a policy aspect similar to the UNDP-GEF intervention, as well as network building and marketing in line with the other projects. The difference was in the duration of its interventions. It targeted three regions initially but then moved on to other areas quickly. The approach was to identify potential dealers, train them, conduct local marketing campaigns, and then continue supporting the dealers with training for some time afterward. The network element of the project was achieved by providing funds to TASEA, which paid for a website, annual solar days in Dar es Salaam, and a sector magazine – SunENERGY. It appears that the project was successful. Indeed, it surpassed its own targets in the first two years of operation. According to Felten‟s figures as of 2008, the market grew by 57% between 2006 and 2007 to an estimated 285 kWp. If the average size of a system were 20 Wp (as we used in the Kenyan case) this would amount to about 14,000 modules. The price per watt-peak of PV fell from USD 12.07 in 2006 to USD 9.85 in 2007.
An SNM Analysis of PV Market Development
The Kenya Socio-Technical Vision The evidence suggests that, prior to the Karamugi installation, Burris had not considered PV systems for households as a viable business opportunity. This was despite his using PV for his own home and his attempts to develop a business with Kidogo Systems. And Hankins was not experimenting at all with PV. However, the experience of the Karamugi installation and subsequent adoption of household systems generated powerful second-order learning for both Burris and Hankins. The new expectation they now held was then partially envisioned through the USAID-funded schools project. This expectation/vision was then shared first with the trainees and then with the Nairobi PV suppliers. The success of the Kenyan market over the next few years served to strengthen the hold of this vision, and to help collectivise it amongst other actors. By the time Hankins and Kasaizi prepared the KSTF proposal, the vision had become highly detailed, reflecting the first-order learning gained in the Kenyan market.
From this we can understand the logic of the socio-technical vision held by Hankins and others. When the opportunity arose to work on PV market development in Tanzania, it would have seemed perfectly sensible to apply the same logic in order to realise the same vision. Hence, we can talk of a Kenyan model of PV market development and understand Hankins‟ actions in Tanzania as applying that model. But, as the narrative of the Tanzanian experience describes, the market did not develop as anticipated. We now analyse the Tanzanian
experience with the intention to explain why this model did not work in Tanzania.
The Tanzania Socio-Technical Vision We should acknowledge here that the model applied in Tanzania at KSTF was not the one that Kasaizi and Hankins had initially envisaged. Their hope was to implement a multiple set of activities but they were unable to secure funding for these. Consequently, the model actually applied was much simplified. This shows the importance of Berkhout‟s (2006) observation that expectations and visions must be collective if they are to be socially significant. While Kasaizi and Hankins shared a common vision for market development through KSTF, they did not succeed in collectivizing this amongst the donors. As a result, they were unable to recruit the resources necessary to realise their vision. Furthermore, the model actually applied was adopted by those actors who followed the KSTF training and so the vision that the KSTF „model‟ articulated became the one collectivised.
Implicit in that vision were various assumptions that had not been tested in the Kenyan experience. One, the vision assumed that spatial geography was not important. Two, it neglected the significance of descriptive and connective articulation. Three, it assumed that a functioning business culture existed. Four, it did not take account of risk. We can examine these in turn and compare the Kenyan and Tanzanian activities to reveal how, once these assumptions were tested in Tanzania, and actions adjusted accordingly, the market began to respond. This analysis also reveals some important lessons for our understanding of the evolution of the Kenyan market.
KSTF was located in a remote part of Tanzania, on the opposite side of the country to the Dar es Salaam suppliers. The nearest source of PV equipment was Kampala. Even Nairobi was closer than Dar es Salaam. Getting equipment to KSTF was a serious undertaking that could use many days, particularly if equipment was not in stock when the technician arrived at the supplier‟s door. Many of the trainees went back to similarly rural locations after their training. Setting up a business in such circumstances would have been extremely difficult. There was no secure supply chain so getting equipment would require collecting the cash for a system and then travelling by bus to Dar es Salaam (or Kampala or Nairobi) to buy it. If the supplier had no stock then the technician would have to stay in the city searching for alternatives. Once the equipment was bought it would have to be transported by bus again back to the site for installation. One would have to possess enormous entrepreneurial energy and hold very deeply an expectation of PV business to undertake such an endeavour.
In contrast, the Karamugi and three-schools projects were implemented in a relatively densely populated and wealthy part of Kenya a few hours from the Nairobi suppliers. This proximity facilitated more reliable supply of equipment and lower costs for travelling between the city and the centre of the PV market. Moreover, market information could flow more easily, particularly as a number of technicians – who already knew each other

215
PROCEEDINGS Conference MPDES 2011
from the three-schools training – were working in the same area travelling to sites to install systems.
While KSTF was able to further the processes of descriptive and connective articulation of the PV niche, it was the entry of TaTEDO that accelerated the processes through a large and relatively integrated project. An important element in this was the formation of TASEA. This grew rapidly by recruiting course participants and so helped to collectivise a PV expectation more widely. However, the first round of training courses exposed a gap in TaTEDO‟s understanding and vision. The networks it was building did not include many from the private sector. Private sector actors proved crucial to the articulation of the niche because they were able to make use of the training once they returned to their work, unlike many who were in NGOs. This continuation of activity was important to be able to realise the essential first-order learning needed to refine expectations into coherent visions. It also helped to begin the process of connective articulation of both the supply and demand sides of the market. That is, retailers could connect to customers and articulate for them an expectation or vision of PV – raising demand – and connect to the supply because they needed equipment to sell.
In Kenya, the activities of Burris had begun much of this articulation work. He already knew the suppliers in Nairobi and his marketing activities, together with the demonstrations of the school projects, were able to connect to the demand side. Then, as systems were installed in homes, they acted as demonstrations themselves and the owners articulated expectations and visions of PV for their friends.
We can see the importance of this in Tanzania following the activities of Umeme Jua. A large part of that effort was focused on connecting the demand and supply sides of the market, as well as connecting together the supply chain. In Umeme Jua‟s case, connecting the supply chain meant some years of work identifying retailers and learning to understand their needs. One consequence of this understanding was dramatically shorter training offered in situ. An important detail in the PV market development vision of Umeme Jua was to establish retailers physically close to customers, underlying the spatial geography point discussed above. The final part of connecting both demand and supply was to raise demand. That is, to articulate for customers a PV vision through advertising and demonstrations. This took huge effort and significant finance, which hints at the issue of the other two assumptions I am arguing were not tested in Kenya: a functioning business culture and the neglect of risk.
A number of the interviewees in the field commented on the issue of trust in business in Tanzania, or lack of it. Of course, this is an issue in all countries but it was particularly acute in the minds of those I interviewed. This may be because the institutional environment is weak in Tanzania, because the country is still learning how to function as a market economy following its African socialist experiment, or perhaps a combination of both. Whatever the reason, significant efforts had to be made to build relationships with private sector actors. Umeme Jua noticed the benefits of this (Arkesteijn, 2009), as did Musa (2008) in the UNDP-GEF project. The Kenyan
experience with a market economy is much longer and a business culture is embedded more deeply. The issue of trust may loom large there also, but private sector actors are more ready to do business as quickly as possible.
Finally, we come to the issue of risk. This relates, of course, to business culture and, less obviously perhaps, to articulation. But it also plays a role in the importance of spatial geography. Indeed, it appears to be fundamental and is mitigated by better articulation.
For example, we have seen that Tanzanian technicians returning home after their training could not be expected to start a PV business given the lack of discernible demand. Expressed differently, poor articulation of demand presented them with a high-risk endeavour. As market demand was demonstrated – better articulated – so risk was lowered and more actors were attracted into the market. We can see this even with Burris, who was using PV to power his home. It was not until demand for SHSs was articulated for him following the school installations that he began to develop and market household systems. Likewise, the Nairobi suppliers did not pursue the household market until the demand was demonstrated to them by Burris‟ activities; until demand was clearly articulated. Umeme Jua was able to develop its market-building activities because a significant part of the financial risk was absorbed by the Dutch government grant. The advent of the other large projects in Tanzania served to lower risk even further, demonstrating across many parts of the country that demand for SHSs existed and detailing it increasingly clearly for others to see. The lowering of risk was also important from the customer‟s perspective. The school projects demonstrated – articulated – a PV vision for them. Home installations did the same for many others. And, the demonstrations of systems in public spaces did the same in Tanzania.
Reflections on the Kenyan Market The analysis here raises questions about the usual understanding of the Kenyan PV market phenomenon. This is often portrayed as private sector led development. However, a closer examination shows that the private sector was not alone in developing the market. Donors played an important, if not always deliberate, role as well. The USAID-supported schools project, for example, helped to accelerate Burris‟ market development activities by enabling him to train sales technicians at no cost to himself. They were then able to multiply his efforts to scout for business. Some of the same technicians were later employed by the Nairobi suppliers bringing with them their knowledge of Burris‟ activities and short-cutting some of the learning necessary to enter the PV market. This also lowered the risks for the Nairobi suppliers by articulating the existence of a demand for SHSs. Once they had adopted this new expectation they were then attracted to the market where they pursued largely first-order learning to refine how to service that market. There was no space here to report fully the developments in Kenya after the three-schools project but they would also reveal that further donor-supported interventions helped to foster second-order learning that the private sector would have been unable bear the risk to create. In general, a closer examination of the Kenyan PV

216
PROCEEDINGS Conference MPDES 2011
niche reveals that, once a new expectation was created in this way, the private sector tended to adopt it and refine it – envision it – through first-order learning. The Kenyan SHS market developed as the result of both private and public sector activities, as did the Tanzanian market.
General Conclusions One of the general conclusions to emerge from this discussion is that a socio-technical analysis reveals clearly the extent to which functioning markets are complex systems. It is unsurprising that markets are complex but, when they are functioning in some sense „efficiently‟, we cannot readily see in what ways and to what extent this is so. By applying SNM, we were able to examine the extent to which PV market development in East Africa was a private sector endeavour. By using the notion of socio-technical trajectories, we were guided to examine many more dimensions of market structure and functions. Moreover, because we were looking for changes in these trajectories, we were guided to the sites of learning. We operationalised these concepts by linking expectations and visions with first and second-order learning. This helped to reveal the extent to which work had to be done to develop the markets in both countries and, especially in our case, the niches in both countries.
The Kenyan PV market „phenomenon‟ has long been used to exemplify private sector led development. Donor influence has usually been downplayed, based on a lack of direct sales impact. But, donor support was important for other reasons. If it had been missing, it is highly likely that much of the second-order learning that led to new products and business models (in both Kenya and Tanzania) would not have occurred. The most obvious reason for this is risk-aversion on the part of the private sector; entirely understandable given the conditions of the Kenyan and Tanzanian markets and the often precarious income sources of customers. However, even where donor support did not enable new products or business models, it did enable the enhancement of niche networks. The private sector, for its part, often then did the first-order learning to develop coherent visions once new expectations had been formed; an important aspect of niche development and market growth.
In contrast to the sometimes trite characterisation of the Kenyan PV market as private sector led, the Tanzanian PV market could be seen as a purely donor led development, given the number of donor-funded projects in place at the same time. Once again, however, this is a simplistic reading of the situation. Indeed, the recent Tanzanian PV market story is actually rather complex. Donors were certainly involved in various ways for a long time but no significant market developed. Part of the explanation for this, of course, was the poor economic conditions. Nevertheless, there did not appear to be a significant market developing when the large TaTEDO project was underway at the end of the 1990s. Yet, within a couple of years, the market began to grow quickly. It was a private actor who finally began to find some measure of success there. But, a significant proportion of that actor‟s resources to develop the market came from a donor. And the other donors who are currently involved
are not supplying equipment or subsidising directly; private actors are selling the technology.
So, in both cases, we see that the participation of donors and private sector actors was important. The balance of involvement may have been different between the two niches, and the kinds of interventions were certainly different: the Kenyan niche saw a number of experiments with products, while the Tanzanian niche is getting help with business and technical training. But the point is that it is difficult to see that either niche would have developed without the participation of both donors and private actors. The role of donors appears to have been, for the most part, to mitigate risk and so enable experimentation that led to second-order learning. The role of private actors appears then to have been mainly about adopting the expectations formed from experiments and developing the details of these – envisioning them – through practice. But, above all, whether the reality was as neat as this, there was considerable work done to develop the niches and markets. This is especially clear in the case of Tanzania, which only recently began to change from a „socialist‟ to market economy. However, the Kenyan niche displayed similarities in terms of risk-aversion.
A number of important implications arise from the recognition that the market-based diffusion of PV in East Africa – especially Tanzania – has taken a major effort to establish, if indeed it is established. Clearly, market structures in Tanzania are not well developed and it takes time and resources to achieve their development. Many donor-supported projects have been active in Tanzania for just one technology, and mostly concurrently. Moreover, the „model‟ of PV diffusion in Kenya had to be adapted to Tanzania. One clear policy-relevant conclusion that flows from these observations is that we need to foster context-specific learning that attends to a broad set of dimensions, not just technical improvements and lower prices (important though these are). And, the analysis here suggests that the private sector in poor developing countries cannot bear the risks associated with the experiments necessary to create this broad learning. This suggests an important role for donors and the public sector more generally. Projects, funded by public and private sources, can provide the sites for context-specific learning if they are understood to be socio-technical experiments rather than solutions in their own right.
Acknowledgements I gratefully acknowledge funding by the UK Economic and Social Research Council (PTA-031-2004-00227). I would like to thank all interviewees, and also the reviewers who provided helpful comments. All remaining errors or weaknesses are entirely my responsibility.
References Acker, R. and Kammen, D. (1996). The quiet (energy)
revolution: Analysing the dissemination of photovoltaic power systems in Kenya. Energy Policy 24(1), pp. 81-111.
Arkesteijn, K. (2000). Solar PV actor analysis in selected regions of Tanzania. Report for TaTEDO and Eindhoven University of Technology, June.

217
PROCEEDINGS Conference MPDES 2011
Berkhout, F. (2006). Normative Expectations in Systems Innovation. Technology Analysis & Strategic Management 18(3/4), pp. 299-311.
Berkhout, F., Verbong, G., Wieczorek, A., Raven, R., Lebel, L. and Bai, X. (2010). Sustainability experiments in Asia: innovations shaping alternative development pathways? Environmental Science & Policy 13(2010), pp. 261-271.
Burris, H., Katumi, S. and Hankins, M. (1992). Rural Solar Photovoltaic Project in Tanzania. Final Report for the Commonwealth Science Council, December.
Byrne, R. (2009). Learning drivers: rural electrification regime building in Kenya and Tanzania. Doctoral dissertation, SPRU (Science & Technology Policy Research), University of Sussex, Brighton.
Caniëls, M. and Romijn, H. (2008). Actor networks in Strategic Niche Management: Insights from social network theory. Futures 40(2008), pp. 613-629.
de Groot, P. (1997). A Photovoltaic Project in Rural Africa: A Case Study. Renewable Energy 10(2/3), pp. 163-168.
de Villers, T. (2007). Terminal Evaluation of the project „Building Sustainable Dissemination Networks for Household PV Systems in Eastern Africa‟. Evaluation and Oversight Unit, United Nations Environment Programme, September.
Deuten, J., Rip, A. and Jelsma, J. (1997). Societal Embedding and Product Creation Management. Technology Analysis & Strategic Management 9(2), pp. 131-148.
Dosi, G. (1982). Technological paradigms and technological trajectories: a suggested interpretation of the determinants and directions of technical change. Research Policy 11(3), pp. 147-162.
Dubash, N. (2002). Introduction. In N. Dubash (Ed.), Power Politics: Equity and Environment in Electricity Reform. Washington, DC: World Resources Institute.
Duke, R., Jacobson, A. and Kammen, D. (2002). Photovoltaic module quality in the Kenyan solar home systems market. Energy Policy 30(2002), pp. 477–499.
EAA (1998). The Kenyan Solar Photovoltaic Industry: Industry Status and Key Players. Final Report prepared for IT Power Ltd., PVMTI, Nairobi, December.
EAA-ApproTEC (1998). The Solar-Powered Battery Pack: Affordable Electric Power for Rural People. Concept Paper by Energy Alternatives Africa and ApproTEC. Submitted to Micro-Enterprises Support Programme, November.
Eames, M., McDowall, W., Hodson, M. and Marvin, S. (2006). Negotiating Contested Visions and Place-Specific Expectations of the Hydrogen Economy. Technology Analysis & Strategic Management 18(3/4), pp. 361-374.
ESD (2003). World Bank Study on PV Market Chains in East Africa. Draft Final Copy. Nairobi: Energy for Sustainable Development.
Geels, F. (2002). Technological transitions as evolutionary reconfiguration processes: a multi-level perspective and a case-study. Research Policy 31(2002), pp. 1257–1274.
Geels, F. and Raven, R. (2006). Non-linearity and Expectations in Niche-Development Trajectories: Ups
and Downs in Dutch Biogas Development (1973-2003). Technology Analysis & Strategic Management 18(3/4), pp. 375-392.
Goldemburg, J., Reddy, A., Smith, K. & Williams, R. (2000). Rural Energy in Developing Countries. In UNDP, World Energy Assessment: Energy and the challenge of sustainability. New York, NY: United Nations Development Programme.
Hankins, M. (1990). Optimising Performance of Small Solar Electric Systems in Rural Kenya: Technical and Social Approaches. MSc dissertation, University of Reading, Reading.
Hankins, M. (1993). Solar Rural Electrification in the Developing World. Four Country Case Studies: Dominican Republic, Kenya, Sri Lanka and Zimbabwe. Washington, DC: Solar Electric Light Fund.
Hankins, M. (1996). Lighting Services for the Rural Poor: Test Marketing and Evaluation of 7 Solar Lantern Units in Rural Kenya. Draft report for the World Bank IENPD, September.
Hankins, M. (1998). Solar Electricity in a Maasai Hospital: The Challenge of Sustainably Designing, Installing, and Maintaining an Energy System. Home Power 64(April/May), pp. 36-42.
Hankins, M. (2005). The Solar PV Market in Kenya. In C. Muchunku (compiler), Workshop Proceedings, Eastern Africa PV Systems Trade Fair and Workshop. Nairobi.
Hankins, M. and Bess, M. (1994). Photovoltaic Power to the People: The Kenya Case. UNDP-World Bank Energy Sector Management Assistance Programme (ESMAP), January.
Henderson, R. (1989). World Health Organization Expanded Programme on Immunization: Progress and Evaluation Report. Annals of the New York Academy of Sciences 569(Biomedical Science and the Third World: Under the Volcano), pp. 45-68.
Hifab-TaTEDO (1998). Tanzania Rural Energy Study. Final Report. Submitted to Sida. Hifab International and TaTEDO, September.
Hodgson, G. (2006). What are Institutions? Journal of Economic Issues 40(1), pp. 1-25.
Hoogma, R., Kemp, R., Schot, J. and Truffer, B. (2002). Experimenting for Sustainable Transport: The approach of Strategic Niche Management. London: Spon Press.
Jacobson, A. (2004). Connective Power: Solar Electrification and Social Change in Kenya. Doctoral dissertation, University of California, Berkeley.
Kasaizi, O. and Hankins, M. (1992). The Karagwe Development Association (KARADEA) Solar Enterprise Project: Developing a Sustainable Programme for Solar Electrification in Tanzania. Project Proposal. Kagera: Karagwe Development Association.
Kimani, M. (Ed.) (1992). Regional Solar Electric Training and Awareness Workshop. Workshop Proceedings. Held in Nairobi and Meru, 15th to 27th March, 1992. Washington, DC and Nairobi: African Development Foundation and Muiruri Kimani.
KSTF (2009). KARADEA Solar Training Facility pages of the KARADEA website. Accessed 10th October 2009: http://www.karadea.org/kstf/

218
PROCEEDINGS Conference MPDES 2011
Mbise, H. (2002). Background Information on PV Technology in Tanzania. Draft Report submitted to EAA (Energy Alternatives Africa Ltd.), Dar es Salaam, February.
McNelis, B., Derrick, A and Starr, M. (1988). Solar-powered Electricity: A survey of photovoltaic power in developing countries. London: Intermediate Technology Publications in association with UNESCO.
Mwihava, N. and Towo, A. (1994). A Study and Assessment of Energy Projects and their Effective Utilization in Tanzania. Report to the Tanzania Commission for Science and Technology. Dar es Salaam, March.
Nkonoki, S. (Ed.) (1983). Energy for Development in Eastern and Southern Africa. Proceedings of The Regional Workshop in Arusha, Tanzania, Volume 1: Summary Report. 4th to 13th April 1983.
Perlin, J. (1999). From Space to Earth: the Story of Solar Electricity. Ann Arbor, MI: aatec publications.
Prahalad, C. and Hammond, A. (2002). Serving the World‟s Poor, Profitably. Harvard Business Review 80(9), pp. 48-57.
Raven, R. (2005). Strategic Niche Management for Biomass: A comparative study on the experimental introduction of bioenergy technologies in the Netherlands and Denmark. Doctoral dissertation, Technische Universiteit Eindhoven, Eindhoven.
Roberts, A. and Ratajczak, A. (1989). The Introduction of Space Technology Power Systems into Developing Countries. Report No. NASA TM-102042. Cleveland, OH: NASA-Lewis Research Center.
ROK (1987). National Energy Policy and Investment Plan. Nairobi: Ministry of Energy and Regional Development, Republic of Kenya, March.
Romijn, H., Raven, R. and de Visser, I. (2010). Biomass energy experiments in rural India: Insights from learning-based development approaches and lessons for Strategic Niche Management. Environmental Science & Policy 13(2010), pp. 326-338.
Sawe, E. (1989). National Assessment of New and Renewable Sources of Energy Activities in Tanzania. Report for the Renewable Energies Development Project Unit. Dar es Salaam: Ministry of Energy and Minerals, United Republic of Tanzania, February.
Sida-MEM (2007). Project Monitoring: Tanga Survey. Draft. Dar es Salaam: Sida-MEM, May.
Sida-MEM (2008). Project Monitoring: Morogoro Survey. Draft. Dar es Salaam: Sida-MEM, January.
SolarNet (2001). PV Africa Pioneer Harold Burris Dies. SolarNet Newsletter 3(3), p. 8.
TaTEDO-Fredka (2005). Report on Baseline Data Survey for PV Solar Project in Mwanza Region. Final Draft Report. Dar es Salaam: Ministry of Energy and Minerals and United Nations Development Programme, January.
UNEP-EAA-MEM (2002). Stakeholders’ Meeting on Building Sustainable Commercial Dissemination Networks for Household PV Systems in Eastern Africa. Draft Executive Summary on Proceedings. Held on February 13th at the Peacock Hotel, Dar es Salaam. February.
URT (1992). The Energy Policy of Tanzania. Dar es Salaam: Ministry of Water, Energy and Minerals, United Republic of Tanzania, April.
URT-UNDP-GEF (2004). Transformation of the Rural Photovoltaic (PV) Market in Tanzania. Project Document. United Republic of Tanzania, United Nations Development Programme and Global Environment Facility. February.
UTAFITI (1978). Workshop on Solar Energy for the Villages of Tanzania. Report of a Workshop/Seminar held in Dar es Salaam, August 11th to 19th 1977. Tanzania National Scientific Research Council (UTAFITI).
List of Interviewees
Abdulla, A. (2008). Interview with Anil Abdulla,
Managing Director of Telesales. Conducted in Nairobi 14th July 2008.
Arkesteijn, K. (2009). Interview with Karlijn Arkesteijn, former Managing Director of Umeme Jua. Conducted by telephone 9th January 2009.
Felten, J. (2008). Interview with Jeff Felten, Managing Director of Energy for Sustainable Development Africa (Tanzania). Conducted in Dar es Salaam 23rd May 2008.
Hankins, M. (2007). Interview with Mark Hankins, former Managing Director of Energy Alternatives Africa and now an independent consultant. Conducted in Nairobi 16th November 2007.
Jackson, F. (2008). Interview with Frank Jackson, former Manager of KARADEA Solar Training Facility. Conducted in the UK September 23rd 2008.
Kårhammar, R. (2008). Interview with Ralph Kårhammar, formerly Sida but then World Bank. Conducted in Dar es Salaam 29th May 2008.
Kasaizi, O. (2008). Interview with Oswald Kasaizi, former Executive Secretary of KARADEA. Conducted in Dar es Salaam June 4th 2008.
Kimambo, C. (2008). Interview with Dr. Cuthbert Kimambo, University of Dar es Salaam, former Chair of TASEA, conducted in Dar es Salaam May 19th and June 5th 2008.
Kitutu, S. (2008). Interview with Stephen Kitutu, Managing Director of TROSS (Tropical Solar Systems). Conducted in Arusha June 20th 2008.
Kolowah, B. (2008). Interview with Bughe Kolowah, former Chief Technician with Ultimate Energy. Conducted in Dar es Salaam 16th June 2008.
Magessa, F. (2008). Interview with Finias Magessa, Executive Secretary of the Tanzania Solar Energy Association. Conducted in Dar es Salaam 26th and 27th June 2008.
Muchiri, D. (2008). Interview with Dickson Muchiri, former Sales Technician with Solar Shamba. Conducted in Nairobi 7th July 2008.
Musa, M. (2008). Interview with Mzumbe Musa, former Manager of KARADEA Solar Training Facility and former Project Coordinator of the UNDP-GEF Project, Mwanza. Conducted in Dar es Salaam May 22nd, and June 3rd and 6th 2008.

219
PROCEEDINGS Conference MPDES 2011
Mutimba, S. (2007). Interview with Stephen Mutimba, Managing Director of ESDA. Conducted in Nairobi 29th November 2007.
Rioba, C. (2008). Interview with Charles Rioba, Managing Director of Solar World, conducted in Nairobi 26th February and 2nd March 2008.
Sanga, G. (2008). Interview with Godfrey Sanga, Manager of Sustainable Energy Department, TaTEDO. Conducted in Dar es Salaam 11th April and 17th June 2008.
Sawe, E. (2008). Interview with Estomih Sawe, Executive Director of TaTEDO (Tanzania Traditional Energy Development and Environment Organisation). Conducted in Dar es Salaam May 7th, and June 10th and 11th 2008.
Schuurhuizen, R. (2008). Interview with Ronald Schuurhuizen, Regional Coordinator of Free Energy Foundation. Conducted in Dar es Salaam 29th April 2008.
van der Linden, J. (2008). Interview with Jeroen van der Linden, former Managing Director of Umeme Jua. Conducted in the Netherlands 16th September 2008.
van der Vleuten, F. (2008). Interview with Frank van der Vleuten, former Marketing Manager of Free Energy Europe. Conducted in Leuden 17th September 2008.

220
PROCEEDINGS Conference MPDES 2011
Quality Issues In The Market Based Dissemination Of Solar Home Systems
Klara Lindner ([email protected]) MicroEnergy International
Prenzlauer Allee 208, 10405 Berlin, Germany
Abstract In general, Photovoltaic systems are built to last and require little maintenance. However, field studies have revealed a high number of system failures, which are linked to a lack of quality assurance. This paper depicts problems that occur with solar home systems (SHS) disseminated on a market-based approach. The research methodology is based on three pillars: A literature review covers documented projects around the world dealing with solar home system dissemination. Expert practitioners drawn together in a workshop have shared valuable experiences, while a trip to rural Tanzania has been carried out to collect personal insights from the field. To facilitate continuous sharing of challenges between different stakeholders, common quality issues are grouped into four categories according to their cause: component quality, system integration, business model and framework conditions. While the solar component and the user are often initially blamed for system failure, it shows that difficulties arise at various levels of the SHS life cycle - this paper highlights focus problems within each stage. As a root, three underlying challenges are suggested: maladjusted systems, inadequate installations and a disorganized after-sales service. A possible instrument to assure better quality in this context is the enforcement of standards also in market-based SHS sales. Microfinance institutions are assumed as an important partner, because only clients with a functioning system are willing to repay the linked loan. As most of these institutions lack technical knowledge, they can only become an agent for their clients‟ wish for customer protection, if an independent facility certifies the system‟s functionality. The given recommendation is that a sustainable approach for solar home system dissemination should not attempt to increase the affordability by developing cheaper products but by fostering income-generating activities, which facilitate paying for good quality systems and make a service infrastructure viable. Keywords:solar home systems; quality; microfinance; standards; certification.
Introduction Currently, close to 1.5 billion people in developing countries have no access to electricity1. Those affected either live in rural areas without connection to electrical power grids or in urban areas with inadequate utility systems and have to rely on diesel gen-sets, kerosene lamps or candles instead. Because of the low population density in remote regions, extending the grid is often not financially viable. Concerns over environmental protection have led to renewable energy technologies being identified as a powerful option for decentralized energy generation. The research focuses on solar home systems (SHS), which are small single-home Photovoltaic
1International Energy Agency (IEA PVPS) estimations:
http://www.iea.org/weo/database_electricity/electricity_access_database.htm
systems that provide electricity for lighting and other low-power appliances.
While solar technologies have proven to be cost-effective in areas with high irradiation levels, the up-front investment remains a substantial restriction for potential users. Electrification programs funded by international donor organizations have helped to promote the dissemination of solar home systems on a large scale, but a number of studies have put the sustainability of this approach in question. A market-based approach is to incorporate microfinance in the SHS promotion – this instrument breaks down the high initial cost into a number of small credit instalments and allows individuals to purchase a system themselves. Users subsequently acquire a sense of ownership over the technology and are more likely to take better care of it.
Research Objectives In due course, three research questions were put forward. The first aim is to collect problems that arise when solar home systems are disseminated in the open market and to cluster them in a comprehensive model. In addition to that, existing standardization efforts from official quality assurance organizations as well as best practice projects are researched to find means to address these problems. As a last task, it is to be found out, whether a local test laboratory is a useful instrument to improve the quality of solar home system installations in developing countries.
Methods While governmental and donor-based projects for solar home system dissemination must be evaluated in order to secure funding and are hence documented systematically, this is not the case for commercial SHS distribution. In order to achieve the set aim in a structured way, a three-step approach has been chosen, which was developed by the United Nation‟s Global Environment Facility (GEF). Painuly‟s framework to identify relevant barriers for a renewable energy technology in developing countries consists of a literature survey, site visits and interaction with stakeholders(Painuly, 2001).In coherence with that, a thorough literature review forms the base of the analysis. On the one hand, general examinations of challenges in quality assurance have been consulted on a global level, namely studies from the World Bank‟s Energy Sector Management Assistance Program (ESMAP), the International Energy Agency (IEA), the Netherlands Energy Research Foundation (ECN) as well as the German Technical Corporation (gtz). Furthermore, East Africa has been chosen as target region, which lead to more detailed readings of project reports specifically about Kenya, Uganda and Tanzania. As solar home systems have first been microfinanced in Southeast Asia, surveys from Bangladesh and Sri Lanka serve alongside

221
PROCEEDINGS Conference MPDES 2011
as a source for long-term observations and successful standardization efforts.
Secondly, field research was carried out by a colleague from MicroEnergy International2. In addition to that, the author conducted a visit to the target region, which reaffirmed the findings and brought up first-hand information within a very specific context: Interviews with end-users as well as solar companies in rural Tanzania and Uganda may be of limited overall validity but provide indispensable insights about the real world.
In addition to that, a workshop with 19 experts was held to collect and compare various experiences across sub-Sahara Africa and Asia3. Personal interviews were carried out in parallel, which provided insights about potential risks and limitations of SHS dissemination in different contexts.
Using scientific reasoning, a qualitative evaluation, albeit limited, of emerging problems was carried out, the results of which serve as a foundation enabling the author to propose improvements linked to standardization and certification activities as followings.
Results Cluster Model A review carried out by the International Energy Agency in 2004 concludes the following:
“In spite of good intentions, many programs implementing Photovoltaics (PV) in developing nations have failed in one way or another, and only a very few, if any, programs can be regarded as all round success stories. A large number of failures can be attributed to lack of quality, both in terms of components and installation quality as well as in the organization and management of implementation programs.”(Wilshaw, Bates, & Oldach, 2004)
The aim of the proposed model is to collect the experiences, which have been made by various practitioners in the field of SHS quality assurance, and uncover the potential of certification and standardization to address recurring challenges.
To increase the visibility and foster further collection and sharing of these challenges, four main clusters have
been developed (see Figure 1). On the technical level, problems that result from the
product components themselves are separated from those problems that materialize once the technology is integrated into complete systems. A division on the meta-level is made into problems that emerge from the implemented business model on the one hand and challenges linked to the respective framework conditions on the other hand.
2 For details about the field research, refer to Rothenwänder‟s
report (Rothenwänder, 2009) 3 For details, a summary oft he workshop by N. Kebir is
available upon request.
Figure 1: Model outline with 4 problem clusters and their change agent
For each cluster, a dominant change agent is named:
while the problems within the business model are to be addressed by the project implementer, enabling framework conditions can only be set by official authorities. The challenges arising from system integration should be tackled by the designated technical staff on-site, while those arising from the individual components have to be taken care of by the product manufacturer.
Problem Analysis 1) Most obvious are problems, which are linked directly to the product itself – in this case to the individual parts that make up a solar home system. As the PV panel is the main component of a solar home system, it is often initially blamed for a system breakdown – but as various studies reveal, the pure solar part rarely fails (Egido, 2001). Due to their significant portion on the upfront investment, great efforts in assuring quality have been taken in the past. By now, they are highly standardized and commonly certified through internationally validated procedures, which let them become the least problematic part of the system (Nieuwenhout, et al., 2001). The battery on the other hand embodies a great number of issues – this is very alarming because when the complete life span of a solar home system is considered, frequent replacements of the battery let it become the most expensive component (Nieuwenhout, et al., 2001).
The charge controller makes up only a fraction of the system cost, which lessens its importance in the eyes of many. But because its functionality is crucial to a properly working battery, failures are very severe (Egido, 2001). In various cases, charge controllers that are not suited for high outside temperatures have been chosen for the installation and lead to a lower system performance (Nieuwenhout, et al., 2000). With regard to the SHS load, the absence of suitable appliances has been reported to be most challenging (Laufer, 2010). Within the existing range of appliances, many problems are related to the lighting source, whose quality decreases rapidly or cannot be assured at all, as product imitations have spread widely (Rothenwänder, 2009).

222
PROCEEDINGS Conference MPDES 2011
2) Yet even if the best quality components are used, a number of issues arise once those individual parts are integrated into a system, designed and installed locally and put into operation. In terms of system design, a lot of problems originate from misevaluations (Rothenwänder, 2009). Either because assumptions made upfront are inaccurate and lead to unsuited system sizes or because important safety principles are ignored and calculations based on a rule of thumb (Egido, 2001). The outcome may then vary from a minor decrease in usability to a severe drop of service life leading to complete system failure. (Fahlenbock & Haupt, 2000). Field experience has shown that the system life decreases significantly, if car batteries instead of appropriate deep-cycle batteries are used (Kristjansdottir, 2003).
According to Kristjansdottir, the origin of early system failure can be traced back to the wrong installation of the charge controller: a study that checked 20 different charge controller from 7 countries stated that none of those regulators disconnected the battery as it should; even more alarming is his comment that sometimes the technician himself bypasses the regulator to allow for deeper discharge of the battery. (Kristjansdottir, 2003)
In due course, problems arise once the system is put into use. While constant overuse or tempering with the system leads to a shorter lifetime, other challenges are connected to the limited availability of productive appliances or a lack of feedback potential (Rothenwänder, 2009). Nieuwenhout states that an early battery failure is mostly only a symptom of other problems and as a quick replacement does fix the system, complete checks to insure system functionality remain scarce (Nieuwenhout, et al., 2000).
3) The chosen business model defines the way the solar home systems get to the end-user, starting with pre-sales activities such as product testing through training and financing to after-sales services. Many of the challenges that have been reported originate from the partnership that is needed in most cases of coupled microfinance and solar home system dissemination. Roles are not clearly allocated, risks are shared unevenly and responsibilities are moved back and forth from partner to partner (Kebir, 2008).
Marketing activities do not follow organized planning and in order to increase the willingness-to-pay, unrealistic promises are made; Sandgren for example reports that in Uganda, potential clients were convinced by implying that not only lighting and radio or TV are possible, but also ironing and cooking, as soon as more PV panels are added at a later stage (Sandgren, 2001). It is challenging to find suitable employees in the right quantity in rural areas to carry out necessary services such as raising awareness through proper marketing and training of all stakeholders (Nieuwenhout & Vervaart, 2000). The problem most pressing however, is reported to be the provision of proper maintenance and repair: If a system is broken, in many cases the end-user is blamed for incorrect operation, overuse or skipping routine maintenance activities (Sandgren, 2001).
At the end of system-life, the issue of battery disposal is usually not covered by the technology provider. End-users are not given information on health and environmental
risks about the materials within and either leave the battery in their home or burn it with the regular waste. (Sandgren, 2001)
4) A number of external conditions set a framework in which the particular business model has to be placed in. Those realities may derive from the respective location, for example regional climatic conditions, can be formed by the actual public policy or are set by the situation on-site.
In various cases, a look into the respective public policy environment shows that oftentimes a lack of institutional involvement leads to difficulties in scaling up SHS dissemination (Nieuwenhout, et al., 2001). Examples for this are the unavailability of mechanisms to disseminate information or a lack of strong measures and enforcement capacities against product imitations (Painuly, 2001). Depending on the economic participation of potential SHS users, the entrepreneurial environment may play for or against their widespread implementation. Solar home systems are dependent on favorable weather conditions, a frequently stated drawback, because long rainy seasons are often not considered in the planning process (Rothenwänder, 2009).With regard to the infrastructure, difficulties arise from a limited road accessibility, making it hard to transport goods into rural areas. Moreover, limited communication infrastructure hinders various commercial activities (Painuly, 2001).
Focus Problems Along the SHS Life Cycle While the cluster model4 serves as a tool to visualize and share a variety of problems related to solar home systems, the most profound issues are described along the SHS life cycle. The applied paradigm (see Figure 2) is made up of seven different stages, starting with the production of each component as first of these. After system integration and pre-sale activities such as testing and marketing, the product shifts from the seller to the end-user at the point-of sale. Then, the SHS is sized accordingly, put into operation at the use-stage and needs after-sales services until the components are disposed of on life cycle completion.
Figure 2: Lifecycle view of a solar home system (own illustration)
4 The complete list of problems in the cluster model is
available upon request.

223
PROCEEDINGS Conference MPDES 2011
Component Production In the very first stage, the use of bad quality product components carries a great risk of ruining the reputation of solar home systems. If one part does not function as it is supposed to, the entire system becomes weak and cannot deliver the desired output. Field research indicates that components are not well-adapted to local conditions, as for example charge controllers cease to work under high ambient temperatures, because the electronic circuit is encapsulated (Rothenwänder, 2009).
Additionally, components may be of good quality, but their long-term performance under typical SHS conditions is not ensured and especially the battery has repeatedly been stated as unreliable element. But even if awareness about the need for quality exists, counterfeiting has spread widely and local implementers as well as end-users are unsure whether or not they deal with product imitations. This may be exemplified by the looking into the decision-making process for the PV generator. Amorphous panels are advantageous over crystalline panels for a number of reasons: They may have a smaller power output under standard test conditions, but the material can handle higher ambient temperatures better and catch more energy from scattered radiation during rainy season, which makes is more suitable for the target region. Seeing that they are also less expensive, their dissemination could be much higher - but due to the limited ability of checking panels in the field, traditional crystalline modules are preferred, as their quality is sufficient even when product imitations are used (Schnuurhuizen, 2010).
Once all components are integrated into a complete system, product imitation again is the issue most worrying. Besides imitations of light bulbs and batteries, fake cabling material has been reported in various cases (Rothenwänder, 2009). While this is one of the cheapest BOS-components, it is of no lesser importance than the others – if imitations are used that do not really have the marked diameter, the voltage drop within the electric circuit can severely damage the system. Another challenge is to match the right components. Whereas cheaper automotive batteries are used instead of deep-cycle tubular lead-acid batteries and shorten the system life significantly, improper system calculations oftentimes leave out safety factors like days of autonomy and a certain allowed depth of battery discharge and further weaken the system. (Pfanner, 2010)
Pre-Sales A distribution chain starting with a global manufacturer in Germany or China and ending in a remote village in Central Africa may become very complex and hard to manage; trade barriers, such as high import taxes on the components, hinder the procurement even more (Painuly, 2001). Experts further state that finding proper means of transportation and monitoring the correct distribution is a challenge (Cabraal, 2010). In terms of product testing, the problem is that products are tested with the trial-and-error method on the back of end-users, because proper knowledge about his true needs and abilities is missing on the manufacturer‟s side (Namazzi, 2010). Laboratory testing is not widespread in the developing world as needed equipment, such as flash solar simulators are very
costly (Pfanner, 2010). Thirdly, the marketing concept is ill-conceived in many cases: Statements such as “one-in-a-lifetime-investment” generate unrealistic expectations and lead to annoyance as soon as battery replacements become necessary. Furthermore, if SHS examples made up of small PV panels and big TV sets are used for advertisement through village presentations, this induces a wrong picture within potential customers (Hankins, 2010) (Schnuurhuizen, 2010).
Point-of-Sale At the point-of-sale, the high upfront-investment remains as a big issue. While the incorporation of microcredits lowers this barrier, there are not enough microfinance institutions present in African rural areas to work with (Dalberg, 2010).
Savings made through less spending on traditional fuel like kerosene are not enough to pay back the loan within the short credit period many microfinance institutions demand. Furthermore, the need to replace the battery during system lifetime is not communicated properly and thus no savings set aside for this event (Rothenwänder, 2009). Another challenge arises once the system is customized for the client – the technical assessment of user electricity needs and the economic assessment of his financial abilities are not synced and lead to dissatisfaction on either the end-user‟s or the MFI‟s side. Even worse cases have been reported, where the system is purposely either oversized to receive higher subsidies or undersized to patronize the end-user. In addition to that, the lack of quality installations further reduces the system lifetime at this stage. The designated technician is improperly trained and ill-equipped – many installations are carried out with as little as a screwdriver, flat pliers and a knife (Rothenwänder, 2009).
Use Solar home systems are made up of different components and only function as good as its weakest link. Many times, the SHS works properly in the beginning but starts to malfunction in the long run as its components are not harmonized with each other and its environment. Besides this technical challenge, a financial challenge is of great importance: To cope with the need to repay the loan within the demanded period, the SHS should induce increased income generation in the use phase. But as proper DC appliances as well as knowledge about entrepreneurial activities linked to electricity lack, the client does not take advantage of potential business opportunities. The biggest problem in that lifecycle stage is to ensure proper maintenance of the system. The end-user rarely receives proper training on maintenance tasks such as cleaning dust off the PV panels and refilling the lead-acid battery with distilled water (Rothenwänder, 2009).
After-Sales Considering after-sales services, the root of most problems lies in the allocation of roles between both partners, the solar company on the one hand and the microfinance institution on the other (Namazzi, 2010). The responsibility to act on user complaints is pushed to

224
PROCEEDINGS Conference MPDES 2011
and fro and leaves the end-user uncertain about what to do or whom to contact. As systems are not monitored properly, it remains unclear, whether the user tempered with the system, for example through by-passing the charge controller, or if the technology itself has caused a failure, and warranty enforcement becomes a challenging task. Most clients go through several credit cycles with the MFI and are afraid to lose their reputation, if they do not pay their instalment as protest measure against broken systems. In very remote regions, spare parts are simply not available even though the end-user would pay for them and self-made repairs, e.g. replacing a blown fuse with metal thread, exacerbate the problem (Sandgren, 2001).
End-of-Life At the end of the system life, the biggest issue is the disposal of the battery. The material within is not only environmentally harmful but also valuable when recycled, but nevertheless most of them end up being dumped or burned with the household trash. As systems are not traced, the component manufacturer is not able to receive feedback about the product and can therefore not include user experiences into design iterations (Zühlsdorf, 2010).
For a better overview, all focus problems are illustrated along the lifecycle of a solar home system in Figure 3.
Figure 3: Focus problems along the life cycle
Taken together, these results imply three underlying assumptions: 1. Maladjusted systems 2. Inadequate installations 3. Disorganized after-sales service
The first statement summarizes a number of reported problems – charge controllers overheat due to ambient temperatures, they are not adapted to, batteries have a much shorter life time than expected, because of daily cycling patterns, the overall system output is lower than planned, because the amount of scattered radiation was not taken into account and product counterfeits of insufficient quality lower the system performance.
The second assertion explains, how methodologically flawed system design leaves end-users dissatisfied with a system that does not meet their electricity requirements, how a mismatch of components leads to early system failure and how a lack of quality in activities such as wiring increases system losses significantly.
And thirdly, irresponsible after-sales organization leaves the end-user alone and allows that minor problems, which could be fixed without great effort, weaken the whole system and impede a sustainable solar home system dissemination.
Standardization of SHS Experiences made in different field studies show that the quality of installed solar home systems is better, if standards have been enforced. Demands made on solar home system quality and performance vary widely, partly because of particular country characteristics or the regional supply situation, but also because of a lack of binding standards or knowledge on their existence (Fahlenbock & Haupt, 2000). Thus, to define a good compromise between affordability and quality, various sources have been consulted: international standards from recognized standards committees, national standards from countries that have adopted solar home systems widely, best practices from organizations such as the World Bank and IEA PVPS and specifications for the evaluation of tenders of substantial aid-funded programs have been researched for suitable certification approaches that specifically address the problems identified earlier. In addition to that, these specifications have been backed up by opinions from experts in the field of SHS dissemination.
The leader in standards development for the Photovoltaic panel as well as the balance of system (BOS) components is the International Electrotechnical Commission (IEC) as representative of relevant committees and working groups of standards agencies from most manufacturing countries. While a number of IEC standards deals with batteries in general, appropriate sizing for PV systems or correct charging procedures are not covered to date (Wilshaw, Bates, & Oldach, 2004). According to a World Bank guidance note, the attempt to fill this gap and to assure quality through the PV Global Approval Program with a quality seal stating PV GAP certification has shown to be largely ineffective in practice, because neither manufacturers nor end-users requested it (World Bank, 2010).
While IEC specifications detail on how to conduct component testing in a standard and repeatable manner, the value of the measured feature is then set in procurement standards (Cabraal, 2010). A look at such standards from countries that have implemented solar home systems successfully facilitates the proposal of adequate values for decent quality at affordable prices. For this, the technical specifications developed for the Rural Electrification and Renewable Energy Development Project (REREDP) in Bangladesh have been found very suitable (TSC Bangladesh, 2005).
Valuable recommendations are also made in the proposal for a “Universal test standard for solar home systems” (UTS-SHS) – the Instituto de Energia Solar

225
PROCEEDINGS Conference MPDES 2011
(Spain) created this document together with standardization bodies from the European Community as a whole (JRC Ispra), France (GENEC) and Germany (WIP) to provide a basis for a global standard for SHS. For this, it took over formulations of the formerly named procurement specifications and made use of standards and guidelines from 20 countries, many of which in developing countries. The UTS-SHS however is limited to technical aspects and does not include recommendations related to after-sales services. (Wilshaw, Bates, & Oldach, 2004)
A report published by the gtz called “Quality Standards for Solar Home Systems and Rural Health Power Supply” evaluated various tender documents and other SHS specifications to develop a set of text modules that can directly be used for future project descriptions. In these, minimum requirements for a reliable technical set-up according to the current state-of-the-art, are stated, which assist in the procurement and installation of solar home systems. (Fahlenbock & Haupt, 2000)
Over and above, quality is important on all levels of SHS dissemination, including technician and end-user training, pre-sales and after-sales activities as well as disposal arrangements at end-of-system-life. The World Bank has developed four quality assurance manuals, which cover various aspects from manufacturing to design, to installation and maintenance and to laboratory accreditation, which are summarized under the term QuaP-PV. For further details on SHS standardization, refer to the IEA PVPS Task 3-Survey written by Wilshaw, Bates, & Oldach. (Wilshaw, Bates, & Oldach, 2004)
Targeted Testing Conform to all researched standard documents is the requirement to put only components into operation, whose quality has been certified under international IEC standards. Whereas it is possible for local laboratories in developing countries to become versed in running those test sequences, component testing should be left to major approved laboratories. The financial effort to acquire and maintain the necessary equipment is enormous, as for example, prices for solar flash simulator to test PV modules start at €50,000, and makes only sense for experienced laboratories that perform those tests on a large scale (Pfanner, 2010).
However, during the evaluation of problems, three main obstacles were collected that could be overcome by local hardware certification: the functionality of the system as a whole, the performance of different batteries under realistic load currents in usual SHS and the verification of the PV panel energy yield on-site.
Functionality of the System To be able to certify the performance of a complete
solar home system in operation, the IEC has developed a well-thought-out standard filed under “62124 - Photovoltaic (PV) stand-alone systems – Design verification”. The procedure includes both outdoor testing in prevailing conditions and indoor testing under simulated conditions and validates not only the functionality, but also the autonomy and ability to recover after periods of low state-of-charge of the battery – a pass
can thus reasonable assure that the system will not fail prematurely (IEC, 2004).
Battery Performance The need for a benchmark test to compare prices with lifetimes has been expressed by various experts (Schnuurhuizen, 2010)(Sandgren, 2001). According to Wiesner, the load current laid down in the IEC battery-standard 61427 does not correspond to realistic load currents in usual solar home systems and furthermore takes a long time to test (Wiesner, 2003). Thus, a regional standard, which has been drafted to assure the functionality under realistic conditions, is proposed instead: The East African Standards Community (EASC), which is made up of the official standardization entities of Kenya, Tanzania, Uganda, Rwanda and Burundi, has found the battery of a solar home system to be the most crucial part (EASC, 2003). In order to assure satisfying operation, the EASC with the Kenyan Bureau of Standards as its leader, has developed recommended practices for installation, maintenance, testing and replacement of this component, filed under “CD/K/04/2003 – Batteries for use in photovoltaic power systems”.
To evaluate the overall performance of a battery in a SHS, the test not only evaluates the usable capacity, but also estimates the battery life and its reliability.Typically, life expectancy for a lead-acid battery will halve for every 10 °C rise in temperature above the recommended operating temperature. However, in solar home systems, the cycle life plays a much more important role, as the batteries are subject to a daily cycle superimposed upon a seasonal cycle. The cycle endurance is the ability of a battery to withstand repeated charging and discharging. The EASC-standard specifies the number of cycles to be achieved by solar batteries. An accelerated simulation of battery operation in a PV system under increased ambient temperatures validates the values.
Over and above, valuable design considerations as well as recommended installation practices are explained, which create awareness about important factors, such as the time required accessing the site or measures against thermal runaway. (EASC, 2003)
PV Panel Performance On-Site On-site measurements are essential in validating the actual performance of the PV system, especially in projects where the panel is suspected of product imitation (Pfanner, 2010). Hence, the local test laboratory shall be able to offer a tool kit for local inspections that verifies the installed array power performance relative to design specifications.
The East African standard “CD/K/10/2003 - Crystalline silicon photovoltaic array-on-site measurement of I-V characteristics” proposes two different methods that use the junction temperature and the I-V characteristics for validation.
Local Test Facility As standards are useless without their proper application, setting up a test laboratory may serve as a valuable tool to enforce them locally. This facility may not only verify the

226
PROCEEDINGS Conference MPDES 2011
performance of the system and its components, but also fulfil further activities: The evaluation of problems has shown that a lack of awareness exists about limitations and potentials of solar home systems. Therefore, the laboratory could exhibit the functionality of SHS to interested microfinance institutions, their clients and other stakeholders involved. While the MFI is then able to understand and implement crucial elements of quality assurance and may furthermore negotiate with the technology provider at eye level, end-users see a real system in operation and cannot be fooled by creative advertising. Being conscious of the fact that systems depend on favourable weather conditions and may not be used for e.g. ironing or cooking will lower dissatisfaction at a later stage.
Regarding the potential of SHS, it would make sense to put systems with various appliances on display, which provide again both the MFI and its client with knowledge about income-generating services based on SHS use. Suitable DC appliances have not spread widely yet, but various activities are thinkable and a number of innovative tools have been developed in recent years. The test laboratory could receive direct feedback on those new product developments and help to adapt them to local needs.
Discussion Scope and Limitation Solar home systems have been distributed all across the developing world and associated challenges differ strongly among countries. The literature review covers various regions, whereas first-hand data collected in field trips is restricted to East Africa and was used to carry out an analysis of qualitative nature. Also, this work puts a focus on the technically sound performance of the SHS and takes financial issues only into account, when they are linked to the functionality of the system.
Problem Evaluation The first aim of this thesis was to identify problems that arise during solar home dissemination by means of a market-based approach and to categorize them accordingly. While the solar component and the user are often initially blamed for system failure, the analysis of problems suggests a different cause. It was found that difficulties arose at various stages of the SHS life cycle and three underlying causes were suggested: maladjusted systems, inadequate installations and a disorganized after-sales service. Proposals to Assure Quality In a next step, existing standardization efforts regarding solar home systems were researched to ascertain elements of a certificate for microfinanced SHS, which specifically address the problems evaluated earlier. It became clear, that most binding standards from international quality assurance organizations refer to the pure solar part or to the performance of individual components only. Due to this gap, many dissemination projects defined their own regulations in the past.
Local Testing Facility In order to provide a means of enforcing standards, a local test laboratory was proposed. Different test processes were identified as crucial to address the problems at a local level. In due course, the test lab may serve another purpose – exhibit the functionality of solar home systems. By furthermore including appliances into the exhibited system end-users may be informed about various activities that can be carried out with solar power to generate income and can also provide direct feedback on the development of new products.
This proposal partly reflect conclusions that were made in a similar research project carried out by the gtz: i.e. in order to increase the sustainability of electrification projects, a study on socio-economic and productive impacts of solar home systems in Uganda recommends the development of “business lines that especially promote „Solar Business Systems‟ that power hair shaving machines, charge cell phones and are flexible to new business ideas like fridges to sell cold drinks/ice cream and are adaptable to other innovations.” (Harsdorff & Bamanyaki, 2009)
Corroboration of Hypothesis When a comparison is drawn between the original objective and the outcome reached, it becomes apparent that the certification elements together with a local test laboratory may address the underlying problems only to a certain extent. The proposed set-up can guarantee system functionality under the given conditions, which would lead to more robust solar home systems and lower maintenance requirements. Moreover, the supplementary exhibition function of the test laboratory can improve the allocation of roles between project partners and thus foster a clear share of responsibility of after-sales services. However, even if necessary procedures are standardized, the maintenance effort is reduced and servicing responsibilities are clearly defined, this does not guarantee that installation and after-sales procedures are actually carried out properly.
To be able to ensure sound execution of those operations, high-quality training of involved stakeholders becomes crucial. Considering that, the World Bank has developed a useful guide for implementing a national quality trainer accreditation and practitioner certification system of PV systems design, installation and maintenance. For more information, readers are encourage to refer this document: “Certification for the PV Installation and Maintenance Practitioner: Manual for Implementing Qualified Certification Programs“ written for the Quality Program for Photovoltaics (QuaP-PV) in 2000 by Mark C. Fitzgerald (Fitzgerald, 2000).
Key Insight First and foremost, experiences made worldwide have underlined that the implementation of standards is of great value in projects that involve numerous stakeholders, because it provides a common language facilitating direct communication. Secondly, a sustainable approach for solar home system dissemination should not attempt to increase the affordability of the technology by developing

227
PROCEEDINGS Conference MPDES 2011
cheaper and cheaper products but by fostering income-generating activities, which facilitate paying for good quality systems and make a service infrastructure viable.
References UNBS Uganda. (2000). Code of Practice for
Installation of Photovoltaic Systems. Kampala: Uganda National Bureau of Standards.
USAID. (2007). Using Microfinance to Expand Access to Energy Services. Washington DC: Citti Group Foundation & USAID.
Zühlsdorf, P. (2010 15-July). BAE batteries for solar home systems. (K. Lindner, Interviewer)
Wiesner, W. (2002). Status of standardisation of qualification systems and test procedures for PV-systems and components. TU Köln. Köln: WREC VII.
Wiesner, W. (2003). Test facilities for long-time survey on small decentralised PV-supplied energy systems. Cologne: University of Applied Sciences Cologne.
Wilshaw, A., Bates, J., & Oldach, R. (2004). Survey Of National And International Standards, Guidelines And Quality Assurance Procedures For Stand-Alone PV Systems. IEA PVPS Task 3.
WIP. (2010). PV-Quality. Retrieved 2010 31-08 from http://www.pv-quality.org/
World Bank. (2010). Photovoltaics for Community Service Facilities: Guidance for Sustainability. Energy and Mining Sector Board. Washington DC: World Bank.
Yunus, M. (1999). Banker to the Poor. New York: Grameen Bank.
Allderdice, A., & Rogers, J. H. (2000). Renewable Energy for Microenterprise. Golden, CA: National Renewable Energy Laboratory.
Barbalata, J. (2010). Solar Home Systems Handbook. Berlin: MicroEnergy International.
Cabraal, A. (2010 7-August). Standardization of Solar Home Systems. (K. Lindner, Interviewer)
CGAP. (2010). Financial Access 2009 Sub-Saharan Africa (SSA) - A regional snapshot. CGAP.
EASC. (2003). Draft East African Standard for Solar Photovoltaic Power Systems. Arusha: East African Standards Committee.
Egido, M. A. (2001). Universal technical standard for solar home systems, Thermie B SUP 995-96, EC-DGXVII. Universidad Politécnica de Madrid. Madrid: European Community.
Eiffert, P. (2002). Building Integrated Photovoltaic Power Systems Guidelines for Economic Evaluation. IEA PVPS Task 7.
Dalberg. (2010). Lighting Africa: Overview of Off-Grid Solar Portable Lighting in Africa. Washington DC: Lighting Africa.
Daley-Harris, S. (2009). State of the Microcredit Summit Campaign 2009. Washington DC: Microcredit Summit Campagin.
Dowuona, M. (2008). Energy Efficiency Labeling for Domestic Appliances, The Ghanaian Experience,. Ghana National Electrotechnical Commitee.
Fahlenbock, B., & Haupt, S. (2000). Quality standards for solar home systems and rural health power supply. gtz, Photovoltaqic systems in developing countries.
Eschborn: Division 44 Environmental Management, Water, Energy, Transport Dr. R. Posorski.
Fitzgerald, M. C. (2000). Certification for the PV Installation and Maintenance Practitioner: Manual for Implementing Qualified Certification Programs. Institute for Sustainable Power. Washington DC: World Bank.
Gouvello, C. d., & Durix, L. (2008). Maximizing the Productive Uses of Electricity to Increase the Impact of Rural Electrification Programs. Washington DC: Energy Sector Management Assistance Program of theWorld Bank.
IEA. (2010). Electricity Database. Retrieved 2010 10-09 from http://www.iea.org/weo/database_electricity/electricity_access_database.htm
IEA PVPS. (2003). Renewables for developing countries.
IEC. (2004). 62124 - Photovoltaic (PV) stand-alone systems – Design verification. International Electrotechnical Commission. Geneva: International Electrotechnical Commission.
IEC. (2005). IEC TS 62257 Recommendations for small renewable energy and hybrid systems for rural electrification - Part 6: Acceptance, operation, maintenance and replacement. International Eletrotechnical Commission.
ISO/IEC. (2007). Using and referencing ISO and IEC standards for technical regulations. Geneva: International Organization for Standardization.
Hankins, M. (2010 19-May). Experiences with solar home systems worldwide. (K. Lindner, Interviewer)
Harsdorff, M., & Bamanyaki, P. (2009). Impact Assessment Of The Solar Electrification Of Micro Enterprises, Households And The Development Of The Rural Solar Market. gtz.
Karekezi, S., & Kithyoma, W. (n.d.). Renewable Energy Strategies for Rural Africa: Is a PV-led Renewable Energy Strategy the RIght Approach for Providing Modern Energy to the Rural Poor of Sub-Saharan Africa? Modern Energy for the Rural poor in Africa / Energy Policy .
Kariuki, P., & Rai, K. (2010). Market Survey on Possible Co-operation with Finance Institutions for Energy Financing in Kenya, Uganda and Tanzania. GVEP-International.
Kebir, N. (2008). Microfinance & Energy. Berlin: MicroEnergy International.
Kebir, N. (2010). Microfinanced solar home system dissemination. (K. Lindner, Interviewer)
Krauter, S. (2006). Solar Electric Power Generation. Berlin: Springer Verlag.
Kristjansdottir. (2003). A discussion of SHS in developing countries.
Laufer, D. (2010 12-June). Challenges in solar home system dissemination. (K. Lindner, Interviewer)
Namazzi, C. (2010 12-June). Naco Solar's experiences with microfinance. (K. Lindner, Interviewer)
Nieuwenhout, F. D., & Vervaart, M. R. (2000). Manual for the design and modification of Solar Home System components. ECN.
Nieuwenhout, F., van Dijk, A., Lasschuit, P., van Roekel, G., van Dijk, V., Hirsch, D., et al. (2001).

228
PROCEEDINGS Conference MPDES 2011
Experience with solar home systems in developing countries: a review. Progress in photovoltaics: research and applications, 9, 455-474.
Nieuwenhout, F., Dijk, A. v., Dijk, V. v., Hirsch, D., Lasschuit, P., Roekel, G. v., et al. (2000). Monitoring and Evaluation of Solar Home Systems - Experiences with applications of solar PV for households in developing countries. Utrecht: Netherlands Energy Research Foundation ECN.
Martinot, E., Chaurey, A., Lew, D., Moreira, J., & Wamukonya, N. (2002). Renewable energy markets in developing countries. Annual Review of Energy and the Environment, 27, 309-348.
McNelis, B. (2008). Renewable Energy Services for Developing Countries - In Support of the Millenium Development GOals: Recommended Practice & Key Lessons. IEA PVPS Task 9.
Microenergy International. (2007). Grameen Shakti - Mikrofinanzierung und erneuerbare Energien für ländliche Entwicklung. Bericht an die Global Marshall Plan Initiative .
Mollel, J. S. (2010 24-May). SHS dissemination via SACCOS in Northern Tanzania. (K. Lindner, Interviewer)
Morris, L. (2010 25-April). Sustainable dissemination of small-scale PV in Uganda. (K. Lindner, Interviewer)
Quddus, R. (2010 12-June). Experiences with solar home systems in Bangladesh. (K. Lindner, Interviewer)
Painuly, J. (2001). Barriers to renewable energy penetration; aframework for analysis. (U. C. Environment, Ed.) Renewable Energy, 24, 73-89.
Pfanner, N. (2010 12-06). Standardization of Solar Home Systems. Experiences gained in Balochistan. (K. Lindner, Interviewer)
Philipp, D. (2010 12-June). Monitoring solar home system usage. (K. Lindner, Interviewer)
Sahu, A. K. (2010 12-June). Experiences in SHS dissemination projects worldwide. (K. Lindner, Interviewer)
Sandgren, A. (2001). Batteries used within Solar Electric Systems in rural Uganda. Lund: Department of Industrial Electrical Engineering and Automation, Lund University.
SantaMaria, P. (2010 18-May). Fostering income-generation with SHS. (K. Lindner, Interviewer)
Schnuurhuizen, R. (2010 12-June). Solar home system dissemination in East Africa. (K. Lindner, Interviewer)
Sow, S. (2009). Investoreninformation für das MicroCharge-System. Maputo: Lighting Africa Conference.
Reinmüller, D., & Adib, D. (2003). Summary of models for the implementation of solar home systems in developing countries. Part 2: Practical experience. IEA PVPS Task 9.
RERED Sri Lanka. (2004). Specifications for Solar Home Systems. Renewable Energy for Rural Economic Development Project.
Rothenwänder, T. (2009). Analyse, Evaluierung und Optimierung von mikrofinanzierten Solar Home Systemen in Regionen mit schwach entwickelter oder nicht vorhandener Energieversorgung. Berlin: University of Applied Sciences Berlin.
TSC Bangladesh. (2005). Technical specifications for solar home systems (SHS). Technical specifications committee, Infrastructure Development Company Limited. Rural Electrification Board of Bangladesh.

II. Contributions from PractitionersTechnology

230
PROCEEDINGS Conference MPDES 2011
Introducing Integrated Food-Energy Systems that Work for People and Climate
Food and Agriculture Organization of the United Nations (FAO) Anne Bogdanski
Via delle Terme di Caracalla www.fao.org
Abstract Bioenergy can be part of the implementation of climate-smart agricultural development. However, it is crucial to develop bioenergy operations in ways that mitigate risks and harness benefits. Integrated Food-Energy Systems (IFES) can play an important role in doing so. Keywords: Climate-Smart IFES; Food security.
Problem, background, challenge of the project
Bioenergy can be part of the implementation of climate-smart1 agricultural development. In particular liquid biofuels for transport but also other types of biofuels have been promoted as means to reduce greenhouse gas emissions, boost rural development and ensure energy independence. However, increasing evidence clearly shows that this is the case only and if their production is properly managed. Large-scale liquid biofuel developments in particular may hinder the food security of smallholders and poor rural communities, and enhance climate change through GHG emissions caused by direct and indirect land use change. It is therefore crucial to develop bioenergy operations in ways that mitigate risks and harness benefits. Safely integrating both food and energy production addresses these issues, by simultaneously reducing food insecurity and often also greenhouse gas emissions. Integrated Food-Energy Systems (IFES) can achieve this on small to large scales as documented in the recent FAO report on “Making Integrated Food–Energy Systems Work for People and Climate - An overview”2, which was an output of a project funded by the Federal Ministry for Food, Agriculture and Consumer Protection in Germany. The document shows concrete options of how smallholder farmers and rural communities as well as private businesses can benefit from these developments. The overview is not restricted to large-scale biofuel operations for transport fuel production alone, but gives a holistic picture of the different types of energy that can be produced from agricultural operations, and how they can be aligned with current food production schemes.
Irrespective of scale and configuration, IFES can be categorized into Type 1 and Type 2 IFES:
1 By definition, climate-smart agriculture is agriculture that sustainably increases productivity, resilience (adaptation), reduces/removes greenhouse gases (mitigation), and enhances achievement of national food security and development goals; also see http://www.fao.org/climatechange/climatesmart/en/ 2 Bogdanski, A., Dubois, O., Jaimison, C., & Krell, R. 2010. Making Integrated Food-Energy Systems work for People and Climate. An Overview. FAO.
Type 1 IFES combine the production of food and biomass for energy generation on the same land, through multiple-cropping systems, or systems mixing annual and perennial crop species, i.e. agroforestry systems. Either system can be combined with livestock and/or fish production. Type 1 IFES maximize land-use efficiency.
Type 2 IFES seek to maximize synergies between food crops, livestock, fish production and sources of renewable energy. This is achieved by the adoption of agro-industrial technology (such as gasification or anaerobic digestion) that allows maximum utilization of all by-products, and encourages recycling and economic utilization of residues. These systems are often denominated closed-loop or cascade systems. Type 2 IFES maximize biomass use efficiency.
Combining type1 and type 2 IFES will increase the over-all resource-efficiency of a given system.
In order to minimize the risks of climate change and climate variability and to adapt today’s agriculture to climate change, it is important to diversify farming systems through the integration of cropping, livestock, forestry and fisheries systems, and to conserve ecosystems, their biodiversity, resilience and ecosystem services. Till October 2008, the UNFCCC Secretariat had received 38 National Adaptation Programmes of Action from Least Developed Countries of which 80 percent are falling under the category “Food Security and Agriculture”. Among these, IFES are suggested by different countries as a local means of adaptation to climate change, sometimes explicitly, as in the case of São Tomé and Principe3, and sometimes indirectly as part of the country’s energy strategy, as in the case of Rwanda.4
Type 1 IFES can enhance carbon sequestration, for instance through the inclusion of perennial crops in existing farming systems or, vice versa, through the inclusion of agricultural crops and livestock in forests, such as done in agroforestry systems which are explicitly recommended as a mitigation strategy by the IPCC5.
3 UNFCCC. 2008. NAPAs - Summary of Projects on Food Security identified in “Submitted NAPA as of September 2008”. UNFCCC. 4 UNFCCC. 2008a. Rwanda – Preparation and implementation of woody combustible substitution – National strategy to combat deforestation and put a break on erosion due to climate change. UNFCCC. 5 Smith, P., Martino, D., Cai, Z., Gwary, D., Janzen, H., Kumar, P., McCarl, B., Ogle, S., O’Mara, F., Rice, C., Scholes, B., Sirotenko, O., Howden, M., McAllister, T., Pan, G., Romanenkov, V., Scheider, U., Towprayoon, S., Wattenbach, M. & Smith, J. 2008. Greenhouse gas mitigation in agriculture. Philosophical transactions of the Royal Society Biological Science,363: 789-813.

231
PROCEEDINGS Conference MPDES 2011
Recent scientific studies such as Res et al. (2010) and European Commission 201067 show the significant potential of type 2 IFES to reduce direct and indirect land use change which can lead to a substantial reduction of greenhouse gas emissions. However, in some cases, re-use of residues can be problematic, when there is a competition between their different current and potential uses as source for food, feed, fuel and sustainable land management. Therefore, residue use needs to be carefully assessed according to each specific context as discussed in more detail below.
Approach The FAO IFES project was tailored to inform policy makers, practitioners and entrepreneurs, raising their awareness of different options and showing them concrete examples of (i) how to make IFES work for smallholders and businesses and (ii) how to upscale and further disseminate them. While examples of long-term implementation and uptake exist for simpler systems like biogas, innovative and more complex systems still face some constraints. The project was therefore laid-out to identify those barriers, and identify solutions to overcome them.
It was based on three activities which were designed to generate knowledge through the collection of information on existing IFES that have proven to be effective on the long-term, or innovative IFES that have a high potential of being up-scaled:
1. Activity 1 was an extensive review of literature on “Making Integrated Food–Energy Systems Work for People and Climate - An overview” showing different configurations of small and large IFES all around the globe. It displays different options of how to make these systems work for smallholders and businesses, and makes suggestions of how to upscale them.
2. Activity 2 was a FAO technical consultation held in July 2010 on “How to make Integrated Food-Energy Systems work for both small-scale farmers and rural communities in a climate-friendly way” which aimed to identify what hinders the uptake of IFES, in particular, and to find some key solutions that could help realize their benefits on a wide scale.
3. Activity 3 was a field project assessment which took place from 11 to 29 October 2010 in China and Vietnam. The programme was set out to assess IFES of different scales and modalities set up by different implementing bodies.8
Lessons learned This section presents some general lessons that we
learned from our activities in the IFES project concerning
6 Ros, J.; Van den Born, G.J. & Notenboom, J. 2010. The contribution of by-products to the sustainability of biofuels. Netherlands Environmental Assessment Agency. 7 European Commission. 2010. The impact of land use change on greenhouse gas emissions from biofuels and bioliquids. Literature review. EC. 8 Bogdanski, A., Dubois, O., & Chuluunbaatar , D. 2010b. Integrated Food-Energy Systems. Project assessment in China and Vietnam, 11. – 29. October 2010. Final Report. FAO.
barriers and their potential solutions regarding agricultural, institutional and policy issues. However, as mentioned earlier in this paper, Integrated Food Energy Systems vary widely in shape, size and composition and so do the issues arising with each particular case. Therefore, in the context of this short paper, lessons can only remain general, and are merely aim at giving a short, but comprehensive overview. In order to illustrate some of the issues in more detail, we will start this passage with three case studies taken from the field project assessment in China and Vietnam.
1. Examples 1.1 Smallholder biogas programmes in Vietnam Vietnam embarked on an integrated land management scheme after land rights had been given to individual farmers during the Doi moi economic reforms starting in 1986. Since then, Integrated Food Energy Systems, in particular smallholder biogas schemes, have received much attention from different public bodies, international organizations, local NGOs and universities in Vietnam, as can be seen in the quantity of different programmes promoting these systems. One example is the “National Biogas Programme” which has been supported by the government and the Netherlands Development Organization SNV; another example is the “VAC integrated system” approach by the Vietnamese Gardeners’ Association (VACVINA) and The Center for Rural Communities Research and Development (CCRD). Both programmes focus on integrated smallholder systems that involve gardening, fish rearing and animal husbandry, to make optimal use of the land. Traditional fuels such as wood and coal for cooking are becoming increasingly scarce and expensive, and can contribute to deforestation. Increasing livestock production in rural communities with high population density leads to health and environmental issues due to the quantity of animal dung being produced. Biogas digesters are part of the solution to these problems, using the waste to generate energy, and the resultant slurry as a fertilizer to improve soil quality or as fish feed.
VAC-systems - an example from Thanh Hoa Province9 By 2010, approximately 1000 biogas plants had been installed and 70 technicians had been trained by CCRD/VACVINA in Thanh Hoa Province. Farms vary in size – between 0.5 to 2ha – and in the types and quantity of crops, vegetables and animals. The farmer needs at least four to six pigs or two to three heads of cattle to make the biodigester viable. On an average farm, 70% of the land is occupied by crops and trees such as rice, corn and apple trees, 15% is dedicated to livestock production and another 15% to fish ponds.
The household biodigester is an underground flat-top system which combines the pigpen with a toilet. It has a concrete floor on which the pig shelters are built. This
9 Due to space constraints, only one example is presented here. A more comprehensive overview of Vietnamese biogas initiatives and references can be found in Bogdanski et al 2010b.

232
PROCEEDINGS Conference MPDES 2011
reduces land requirements to a minimum which is crucial for Vietnamese farmers due to restricted land resources. The gas is collected in a plastic bag reservoir which is usually hanging underneath the roof of the shelter or the kitchen. Its innovative design prevents the accumulation of a hard scum layer that reduces gas output in the absence of annual cleaning. The price is half of the investment needed for a classical fixed-dome digester, and amounts to approximately US$ 500. The gas is usually completely used for cooking. The slurry has various uses. It is either directly applied to the fields and/or used as fish fodder. In some cases it is used for composting.
Benefitting smallholders As a financial incentive to purchase a biogas digester, VACVINA offers an early-bird discount which reduces the original price by up to 30%. On top of this, a household saves on firewood and synthetic fertilizer, breaking even after ten years. The biogas produced displaces the use of firewood estimated at 2,500 kg per household per year for which families spend between $5 and $10 per month. The application of the organic fertilizer reduces the application of synthetic fertilizers by about 50 percent.
Apart from these financial benefits, the farmers’ standard of living increases significantly. Long hours formerly needed to collect firewood can be saved, and respiratory and eye diseases related to smoke decrease significantly. The unpleasant odor of unhygienic pig and manure operations and the pollution of nearby waterways vanishes, which does not only serve the farmer but also the environment.
At the same time, integrated agricultural practices increase the capacity to adapt to climate change by increasing farmers’ resilience by making him/her more self-sufficient in terms energy and agricultural inputs, and through income diversification (e.g. if they sell the compost generated through biogas production, or the biogas itself). Another advantage, benefitting both farmers and the environment, results from the reduction of greenhouse gas emissions. Some methodologies under the Clean Development mechanism (CDM), e.g. the CDM Programme of Activities (PoA), and certain voluntary standards designed for household biogas systems will allow farmers who are certified under this scheme to receive a share of the certificates sold. Making smallholder IFES schemes work for carbon finance will most likely contribute to upscaling these systems, additional to the factors mentioned below.
Upscaling IFES According to CCRD’s director Van Than (personal communication 2010), several success factors have been identified that allow for the dissemination of VAC biodigesters and the promotion of integrated agricultural systems. The first and most important step is the identification of a local partner for collaboration. CCRD has identified VACVINA, which is a well-known and reputable community-based organization. CCRD trains their staff in technical and marketing skills. Once accomplished, the biogas system needs promotion. CCRD and VACVINA usually implement several demonstration
sites, make publicity on the local radio and open “biogas shops” that provide potential customers with information. The above mentioned “Early-bird promotion” attracts further attention. Once purchased, the VACVINA technicians provide the farmers with the turn-key biodigester: They hire local masons, and provide the technical know-how during the building process. In order to enhance downward accountability, user surveys are carried out, allowing the customers to give their views about different topics, such as quality of the provided energy conversion devices, overall degree of user satisfaction, and environmental and livelihood impacts of the biogas system as a complement to crop-livestock-fish integration.
1.2. Biogas “District Model” in China Agriculture accounts for 30% of the economy of Hainan province. The province, located in the South of China, has a population of 8.6 million people, of which 60% work in the agricultural sector. Hainan has a tropical moist monsoonal climate. Paddy rice is cultivated extensively in the north-eastern lowlands and in the southern mountain valleys. Main crops other than rice include coconuts, oil palm, sisal, tropical fruits, black pepper, coffee, tea, cashews, and sugarcane as well as rubber trees. The livestock sector, mainly based on 7 million pigs, represents a fifth of Hainan agricultural income.
In order to solve the increasing environmental challenge of disposing pig manure, biogas digesters have been installed throughout the province - between 2003 and 2010, 300 000 household biogas devices. Current figures show that approximately 18% of Hainan households possess biodigesters.
Beyond the household biogas digesters, Hainan is currently pilot-testing a completely different model that provides farmers with biogas and slurry. The so-called “District biogas farm model” is an innovative institutional arrangement which combines division of labour and guarantee of benefits to small-scale farmers by involving these as shareholders in the district farm: Instead of raising pigs themselves, small-scale farmers pay the district farm a certain fixed amount for as many pigs they wish – i.e. their “shares” in the district farm. Thanks to these financial contributions, the district farm, which raises all the pigs, can reach a scale which allows it to invest in more efficient biogas systems than in the case of household systems. On the other hand, small-scale farmers benefit from a share of the revenue from the sale of the pigs, and often recoup their initial investments. They break even after 3 to 4 years – any dividend from the sale of pigs by the district farm is therefore net benefit for small-scale farmers after that period. In addition, not only shareholder farmers but all surrounding small-scale farmers benefit from the biogas and slurry by-product produced by the district farm at a discounted price.
One concrete pilot-farm in Hainan is based on 5000 pigs and provides 135 households with biogas. Of these, 46 households have shares in the company. The two villages involved in the district farm are connected to the district biodigester by an underground pipeline of 400 and 800m length, respectively.

233
PROCEEDINGS Conference MPDES 2011
Benefitting smallholders This model shows that smallholders can also benefit from large IFES operations - in this case, by becoming “shareholders” in the company. Both food and energy are produced by the district farm. The smallholder does not receive food (meat), but is provided with cheap energy and revenue from the sale of the pigs. At the same time, he/she saves time which he/she can invest in other activities such as crop cultivation. In environmental and climate change terms, this operation might be more efficient since gas and manure leakage is less likely to occur here than in smallholder systems. Compared to the household model, the district model presents several advantages: the smallholder does not have to take care of the pigs and the biogas digester her/himself which makes it very time-effective and saves him/her labour. Furthermore, he/she receives a guaranteed income each year depending on his/her shares in the company. Large-scale biogas systems are much cleaner and environmentally friendly management systems of livestock manure both for farmers and the neighbouring environment. They are also easier to regulate and monitor. Economies of scale arise as company owners, usually large farmers, can invest in better technologies, leading to better technical performance.
Upscaling IFES This example also shows that IFES, if properly managed, do provide several financial and other advantages. It is no secret, that this fact alone can be an efficient engine to promote IFES, leading to their large-scale dissemination. However, having the right policies in place can speed up the process significantly, or enable it in the first place, especially if small-scale farmers or company owners cannot afford the initial investment and do not have access to sources of credit.
Subsidies promote the quicker uptake of IFES, and make them easier to afford as can be witnessed in this case in China, but also in the case of smallholder biogas systems in both China and Vietnam. The Chinese central government, for example, pays subsidies both for smallholders (roughly a third of the total price) and private investors (up to 40 % of total investment). On the other hand, disincentives can also be stimulus for IFES. In China, the manure of small, medium, and large-scale livestock operations has to be adequately disposed to prevent environmental degradation. Otherwise, a fine has to be paid. Biogas digesters solve this issue.
As seen in this particular case of the district farm, the model requires a lot of capital investment in the first place. Including small-scale farmers as shareholders does not bring much profit for the company owner, but is rather linked to an agreement between him/her and the central government. The company can receive ample subsides for its implementation; in exchange he commits to work with smallholders – an interesting approach which, however, needs a strong government.
It is important to stress that this operation is still in the pilot phase. The long-term feasibility remains to be seen in the future. Meanwhile, learning from experiences during these pilot operations would be crucial to develop this innovative approach further.
1.3. Liquid biofuels from Jatropha in Vietnam According to Vietnam’s ministry of energy, Vietnam is currently focusing on the production of „green gasoline from cassava, coconut, sesame, peanut, flax and Jatropha, and from animal products such as catfish fat. In its biofuel development strategy till 2025 Vietnam plans to produce 1.8 million tons of ethanol and vegetable oils for use as fuel annually, meeting 5% of domestic petrol and diesel demand in the next 15 years10. Vietnam’s Jatropha Action Plan alone targets 300,000 ha of Jatropha by 2015 expanding to 500,000 ha by 2025.11
To reach these ambitious targets, large biofuel operations are currently initiated throughout the country. Most of these are still at the experimental scale. However, if not properly set-up and managed from the start, both rural development needs and environmental concerns might not be addressed in the right way in future operation. One main issue concerns the risks that large biofuel operations can bring for the food security of the rural population. This is particularly true when small farmers are encouraged or formally contracted by a given company or organization to transform their land originally used for food production to plantations of biofuel crops. Some of these “contracts” have failed however; for instance due to the fact that Jatropha, at one time coined as “miracle plant”, had not performed as expected, and farmers were left without markets. To prevent this to happen, Green Energy Biomass J.S.C., a private company producing Jatropha in cooperation with smallholders, has taken an exemplary approach.
Farmers are obliged by contract to use unproductive land outside of their plot to grow Jatropha. This, in turn, can only happen if the household has formerly been assessed as having sufficient labour to cultivate both their original fields and the new Jatropha plots, or if the household has sufficient means to pay extra labour to do so. Furthermore, to prevent that livestock keepers are displaced from the denominated unproductive land – defined as such in Vietnamese regulations – weeds and grasses are maintained throughout the plantation allowing the animals to keep grazing in the plantations.
Benefitting smallholders Green Energy Biomass J.S.C. agricultural partners are Vietnamese cooperatives and farmer’s unions. These entities are contracted over the long-term (30 years) to sell their produced biomass to Green Energy Biomass J.S.C. - in return for the company’s investment, professional training, and the guaranteed purchase of their produce. Green Energy Biomass J.S.C. processes the biomass for sale and distribution in Vietnam and globally. The actual production units are the members of the cooperative, Vietnamese smallholders, who plant Jatropha on a portion of their own land. The smallholders are assisted in their biofuel feedstock start-up with help from Green Energy Biomass J.S.C. via “forgivable loans” for establishment costs, seedlings, and extensive training, which means that
10 International Business Times. 2010. Vietnam joins race for biofuel. International Business Times online. 11 SNV. 2009. A case study. Jatropha Development in Vietnam. SNV.

234
PROCEEDINGS Conference MPDES 2011
if the farmer meets the company’s requirements, repayment of the loan will not be required.
Since the start of field testing in 2007, Green Energy Biomass J.S.C. has developed methods for Jatropha cultivation by smallholders, trained 20,000 smallholders in these methods, and delivered 37 million income producing trees to smallholders. One interesting innovative incentive concerns the fact that Green Energy Biomass J.S.C. purchases Jatropha seeds according to the fluctuations of the oil price. Famers receive 10% more for jatropha oil than the existing fossil fuel price. Therefore, while farmers might struggle to pay for inputs for other crops when oil prices increase, they gain in the case of Jatropha.
Training to farmers and local extension workers is given once a month. Farmers are encouraged to use organic agricultural methods. During the training provided, farmers learn how to make compost from cow manure and crop residues and to apply organic pesticides such as tobacco leaves or leaves from the Neem tree. Legume trees are planted between the Jatropha rows to improve soil quality and control erosion. Jatropha seed cakes serve as fertilizer or are used instead of coal for cooking. Weeds and pasture grasses are maintained throughout the Jatropha rows for cattle feed.
Upscaling IFES By providing the above-mentioned financial and non-monetary incentives (training) and by giving a guarantee to purchase the produce (contract), farmers throughout the region are encouraged to collaborate with Green Energy Biomass J.S.C., and to deliver high-quality produce. Along with its smallholder production partners, the company plans to expand the production base of Jatropha Curcas to 25,000 hectares – each one established under the principals of the Roundtable on Sustainable Biofuels - and increase the Vietnamese production of substantive amounts of clean fuel. The economic goal is to deliver additional income for approximately twenty thousand smallholder households. Since Green Energy Biomass J.S.C. does not encourage cultivation of Jatropha on productive lands, this is an addition to existing income.
The business link is directly between the company and the Farmer Cooperatives. The company seeks advice from a number of institutions and organizations (e.g. SNV) around them to improve their business operations. Green Energy Biomass J.S.C. works together with public institutions at national, provincial and lower levels to develop appropriate policies and implementation mechanisms for the contract farming modalities.
2. Barriers to the dissemination of IFES Building on the above case studies from China and Vietnam and drawing from a variety of cases throughout the world, we identified barriers to the implementation and wide-scale dissemination of IFES. Barriers are manifold and concern various aspects at both farm and beyond farm level. As mentioned before, due to space constraints, the following passage can only give a general overview: Knowledge generation and technical support is
essential, but not always available.
Reliability of the systems must be established at an early stage, before major upscaling is attempted to prevent a bad reputation that will discourage replication;
Financing is mostly related to the investment required for the energy conversion equipment. Very often, the better they are from an energy and GHG point of view, the more expensive they are.
The increased workload often experienced with IFES makes the systems less attractive to farmers. Where multiple crops are grown on one piece of land (physical co-existence or Type 1 IFES) or where there is a diverse array of inter-connected crops and livestock (closed-loop or Type 2 IFES), there tends to be less scope for specialization and mechanization and thus higher manual labour may be required.
IFES can give rise to competition for wastes/residues used for energy production vs. other needs/uses, such as soil fertility or for animal feed; the system design needs to consider these other uses based on their relative value in socio-economic and environmental terms.
Trade-offs in the use of resources (land, water and nutrients) will need to be balanced, as competition for biomass for food, feed, fertilizer and fuel increases; in general, the intrinsically higher efficiency of IFES itself will address such trade-offs in the longer term, but it`s necessary to manage short term conflicts that can present a barrier to implementation.
The existence of multiple products and markets in IFES requires broader access to markets for agricultural and/or energy products; the distribution and transport channels for the various products must be considered as well as their competitiveness in price and quality.
Access to information-communication and learning mechanisms regarding the above-mentioned factors is a production factor which is as important as the classical factors land, labour and capital.
Few government policies encourage all aspects covered by IFES, and some sectoral technical support policies even play against the replication and scaling up of IFES, especially more complex ones.
3. Possible solutions to the dissemination of IFES 3.1 Agricultural Solutions The use of soil residues for energy production might, in some cases, interfere with the need to maintain and enhance soil quality, or with other residue uses such as animal feed. To be used in a sustainable way, residue must only be removed when it does not hamper soil quality. In some regions the combination of crop, management practices, soil, and climate, work together to produce more than is needed to maintain soil health. In this case, excess residues could potentially be used for conversion to biomass energy. However, it is important to identify in which systems residue harvest for energy purposes is possible, or even beneficial, and at what rates.

235
PROCEEDINGS Conference MPDES 2011
This is particularly true for tropical and sub-tropical climates where the soil organic carbon pool is below the critical level. Given the importance and the complexity of the topic, it certainly warrants more research and development in the coming years.
3.2 Institutional Solutions Institutional arrangements that support the scaling-up of IFES concern two different issues, i.e. the workload and financial constraints. Often both types of issues are addressed through the division of labour and costs, when individuals specialize and work together, rather than individually, to implement all the components of IFES. Knowledge management and supporting services in the case of simple IFES are usually provided through vertical integration of the supply chain, which also allows for labour division, with private sector companies or cooperatives entering into contracts with small-scale farmers (contract farming). Tenant farming and sharecropping, whereby small holders farm the land belonging to companies, is another type of agribusiness-smallholder partnership which often includes provision of technical services and sometimes inputs to the farmer.
In many countries there are formal mechanisms established to provide credit to small-scale farmers and entrepreneurs in rural areas. Small-scale farmer organizations such as cooperatives can help to increase access to micro-credits for small-scale producers where rural banks are reluctant to engage. Some simple IFES systems, such as those using biogas, are good candidates for carbon finance, given the significant potential they hold to reduce GHG emissions and the possibility for relatively simple monitoring.
3.3 Policy Solutions Institutional arrangements require policy instruments to support their implementation. Policies relevant to IFES concern both their agricultural and energy components. Those related to the agricultural components include the need to increase productivity to meet future global food and energy needs. Policy measures to promote this concern research and development and technology adoption (e.g. input subsidies, tax incentives, and technical and financial support). But agricultural policies also need to promote environmental conservation and social equity. The former can be achieved through a combination of market based measures following the provider gets-polluter pays principle and regulations such as zoning. Policies regarding more environmentally-oriented agriculture, for instance, through the ecosystem approach to agricultural intensification promoted by FAO, face serious challenges. Policy instruments, in support of the energy component of IFES and more broadly renewable energy (RE) are manifold. Two areas of support stand out: First, the promotion of renewable energy markets through quotas/mandates and/or feed-in tariffs. Second, financial incentives in the form of grants, subsidies, micro-credits, carbon finance or tax breaks.
Research demands The previous section presents some general lessons learned on barriers and potential solution regarding
agricultural, institutional and policy issues, and some concrete case studies from China and Vietnam. We conclude that one main reason, why IFES, in particular biogas schemes, have been successfully scaled-up in China and Vietnam is partially due to the long tradition of integrated agriculture in South and Southeast Asia which has built a solid (knowledge and resource) base for upscaling IFES. Technologies to do so exist; however the enabling environment is still weak. One of the main hindrances of upscaling IFES to date is of financial nature, particularly regarding start-up investment costs, and potential finance options for smallholders. Further issues concern the quality and continuity of technical support. These areas deserve further research.
In addition, examples both in China and Vietnam show how the right policies and institutions can address these issues. Linking research efforts to institutional and policy needs will be crucial to advance the development of both, traditional and innovative IFES.
Greenhouse gas management is playing an increasingly important role in policy development. Since IFES show a large potential to qualify for carbon finance, more research will be needed to determine the extent to which IFES can contribute to climate mitigation, and how smallholder can benefit from these developments. Currently ongoing FAO’s activities under the “Mitigation of Climate Change in Agriculture (MICCA) Project”12 “which is designed to support efforts to mitigate climate change through agriculture in developing countries and move towards climate-smart agricultural practices” will significantly contribute to realize this potential. Different pilot projects are currently under development to integrate smallholders into mitigation activities, among them IFES.
As opposed to more traditional IFES such as biogas systems, more innovative types of IFES, particularly those involving the cultivation of feedstock for biofuel production, still need considerable research as the sector is relatively new, and only few exemplary cases are available.
To sum up, documenting good practice, success factors and potential failures will help to inform decision making on all levels, particularly the policy and private sector. At the same time, unsolved issues need to be thoroughly assessed, to advance the upscaling of IFES.
12 http://www.fao.org/climatechange/micca/en/

236
PROCEEDINGS Conference MPDES 2011
Development of Adaptive technologies in the Project Biogas Support for Tanzania ”BiogaST”
EngineersWithout Borders (Germany) / MAVUNO Project (Tanzania)
Philipp Becker Ariane Krause
Boxhagener Str. 29, 10245 Berlin, Germany [email protected]
Abstract BiogaSTs goal lies in improving the rural populations living circumstances and in strengthening the economic growth of the Kagera Region in Tanzania by providing long term assistance for self-empowerment. This is to be reached by the construction of a decentralized energy supply through small, adapted biogas digesters for the use of fermentation gas as cooking energy and for further energetic applications. The sustainability of the project is ensured by accompanying training and educationn this environmentally friendly technology. The existing natural resources shall be used efficiently with the anaerobic fermentation of crop residues. Against the backdrop of climate protection, the project will help reduce greenhouse gas emissions while also working against the proceeding deforestation in the region. It is being implemented as a cooperation between the registered association Engineers Without Borders Germany (EWB) and the Tanzanian non-governmental organization MAVUNO Project. Keywords: decentralized energy supply, fermentation gas, small biogas digester, development of adaptive technologies, development cooperation
Problem, Background, Challenge of the Project
State of the Art The first small biogas digesters for a decentralized energy supply were already built in the 1930s. The so-called Fixed Dome and Floating Drum Digesters were designed for rural areas in the subtropical climate zone. Based on using animal excrements as substrates, they were configured to guarantee a steady supply of biogas for cooking and light. A simpler, newer model of the Floating Drum Digester is the Barrel Digester. This innovation’s advantage lies in its small size, due to which it can also be used in urban areas. However, this type of digester reaches its structural limits if used for families of five persons or more. Furthermore, a continuous usage would only work with easily fermentable substrates like e.g. food leftovers or pure sugar. In the context of advancement of materials, a Plastic Sheet Fermenter was developed. It can be installed quickly and easily and also operates with animal excrement as substrate. Yet the disadvantages of this construction lie in the very poor quality of the plastic sheets and their short operating life-span. For rural regions with large families where agriculture is predominant and animal excrement is rare, none of these standard types of small biogas digesters offer a permanent, lasting solution.
Initial situation in the region Kagera (Tanzania) The Kagera Region is one of the poorest regions in Tanzania. Approximately 95% of its population lives on subsistence agriculture. An average family consists of six to eight people. Only few agricultural households are able to keep enough livestock, e.g. cows, to produce a sufficient amount of substrate for their daily demand of fermentation gas. A strong potential to supply these families with fermentation gas despite their situation lies in crop residues. Especially plantains are basic food in the region - each household owns an average of 1.2 hectares of banana plantation with 300 banana trees. The trunk and the leaf sheath of the banana tree, which are cut after harvesting the banana fruits, are always available as a well fermentable substrate. But the effective use of this potential requires technological adjustments.
The Project Biogas Support for Tanzania ”BiogaST” has yielded significant results. Together, Engineers Without Borders Germany and the Tanzanian non-governmental organization MAVUNO Project were able to develop a new type of digester, which has been adapted to the conditions of the region and thus offers the possibility of covering the entire need for fermentation gas of small, rural families.
Keeping in mind the global climate change, the selected approach is a measure against accelerating deforestation and desertification by protecting the wood resources of the scarcely existing forests and near-natural ecosystems. Fermentation gas stands as substitute for fire wood or charcoal for cooking, providing opportunities for reforestation. The supply of electrical energy is limited to a few areas in Kagera and is unacessible for a majority of the population. Thus, the supply of light in the households is usually produced through burning of liquid fuels (e.g. paraffin or kerosene). The produced fermentation gas should therefore also offer an alternative for the supply of light.

237
PROCEEDINGS Conference MPDES 2011
Approach Development of adaptive technologies A development of adaptive technologies is oriented towards the needs of the consumer groups as well as to the opportunities and limitations in the target region. The newly developed type of digester should be seen as a combination of a Plug-flow Fermenter and a Fixed Dome Digester. It meets the following criteria: By circulating the process water, no fresh water must
be added, thereby adjusting to the consequences of climate change which are already apparent in Kagera through prolonged periods of drought and increasing water shortage.
No obligatory use of animal excrements as substrate, thereby access to effectively produced energy is also guaranteed in predominantly agricultural regions.
Digester for renewable raw materials which can also use solid substrates and substrates with a high dry matter content for a continuous operation, so that the energy supply is secured also in the dry seasons.
Plug-flow Fermenter without a stirring system, this signifies a small risk of disturbances like possible overacidification as well as low maintenance efforts.
Construction is possible with entirely locally available building materials and tools, which offers a large potential for the development of regional value chains. Figure 1 shows a cut through a 3D model of the
newly developed type of digester.
Figure 1: Cut through a 3D model of the pilot digester
at MAVUNO Project
Lessons Learned The initial idea came up in 2007 when MAVUNO Project approached Engineers Without Borders Germany with an enquiry concerning a scientific development cooperation. A feasibility study was conducted in the context of a threemonth investigative journey to the target region Kagera in 2008. It was divided into a needs assessment and a potential analysis as well as considerations concerning a possible implementation. The study was based on the 2002 census and the results of the on-site investigations. A laboratory was established with the purpose of examining different substrates that could be found in the region. It was then possible to carry out the fermentation tests necessary for the potential analysis (according to VDI guideline 4630). The laboratory also serves as a training and education site for specialists. In addition, ten digesters in the region were visited and
evaluated technically. The study showed that there exists a demand of approximately 135.000 small biogas digesters in the Kagera Region, which could be entirely covered by the existing potential of substrate, though not with the current technology.
Based on these results, a new type of digester was conceptualized. The University of Hohenheim in Stuttgart joined the project as an additional cooperation partner, as it has extensive expertise with biogas technology. In the beginning of 2010, two different pilot digesters were constructed and tested in Germany (Berlin and Stuttgart). Each pilot digester ran a four-month test operation in order to work on issues like functionality, heat input and maximum gas yield. Upon completion of this development stage in Germany, a first optimized pilot digester for education and research was built and put into operation in Tanzania at the education center of MAVUNO Project.
Research demands The gained experiences lead to the conclusion that additional research demands exist with regard to an increase in efficiency and the simple scalability of the digester. Two test series of five months are to be performed at the pilot digesters in Germany and Tanzania through participative research. The aim of these tests is to apply the digesters to different conditions (e.g. by use of different substrates) and to collect information about the facilities’ performance within practical operations. Specific data about existing substrates are to be collected and processed by the conduction of parallel fermentation tests. All collected data shall be collectively evaluated afterwards and regenerated for a dimensioning calculator, which should serve as a planning and decision-making aid. Exact contents and goals of the particular test series are: 1. Collection of data about the specific gas yield by
using different substrates and mixtures of substrates. 2. The investigation of floating layers and possibilities
for preparing the substrates. 3. Maximum loading rate and the investigation of the
used substrates’ flow characteristics. 4. The investigation of specific detention time in the
digester concerning the different substrates at a given temperature as well as examinations of the correlations between detention time and degradation rate.
5. The investigation of heat input and heat distribution inside the digester in order to increase the gas yield.
6. Processing of specific data concerning the substrates in order to create substrate lists for feeding the digester.

238
PROCEEDINGS Conference MPDES 2011
Hydrothermal carbonization as innovative technology in sustainable sanitation in Tanzania
Engineers Without Borders (Germany) / Project “Carbonization as Sanitation” (CaSa)
Ariane Krause Pettenkoferstr. 7, 10247 Berlin, Germany
Abstract The need for sustainable systems is apparent as climate change and other adverse anthropogenic activities continue to negatively affect the soil fertility in Africa. One of the indicators of the loss of soil fertility is the continuous decrease in soil organic matter, which is the major building block of a fertile soil. This is mainly attributed to the inappropriate practice of human-beings of taking more substances from the ecosystem than the amount replaced. As the soil fertility is increasingly lost, food insecurity, due to dropped productivity of the soil, is becoming a critical issue in many areas of Africa. Tanzania is not any different in this respect. On the other hand, most people in rural areas of Africa still lack possibilities to cover their daily energy needs in a more sustainable way and many people mainly rely on firewood. This, in turn, has an adverse impact on the climate and the soil, causing a local viscous circle of poor soil and productivity conditions. Moreover, the sanitation coverage of those areas is very low and there is a need for appropriate sanitation systems. Therefore, the aim of this project is, to conduct research on the possibility of establishing a self-sustaining system for the rural areas of Kagera, Tanzania, to address the three basic issues: sanitation, energy supply and soil fertility. The system consists of a small-scale biogas digester, a urine diverting dehydrating toilet (UDDT) and an adaptive hydrothermal carbonization (HTC) unit. Biogas is produced from crop residues and other domestic organic waste. The fermentation residues and the dehydrated fecal matter from the UDDT is then treated with HTC. The carbonised and sanitized residue is then applied as soil amendment to improve the soil fertility as manifested by the Terra Preta in the Amazon. This holistic approach is a new development in ecological sanitation. Therefore, a comprehensive sustainability assessment including environmental, economic and socio-cultural issues will be conducted. Keywords: Hydrothermal carbonization, biochar, Closing-Loops, Terra Preta, sustainable sanitation, soil amelioration, development of adaptive technologies
Problems, background and project challenges Kagera is one of the poorest regions in Tanzania located in the northwestern part of the country near Lake Victoria. Most of the people in this area live with their family in small houses on subsistence farming. More than 97% of the rural households still use firewood for cooking. This predominant use of wood fuel causes deforestation resulting in big scale soil erosion. Moreover, the region is dominated by a tropical climate with year round elevated temperature and torrential rains during two rainy seasons. Under this climate the soil organic matter is lost easily due to faster microbial decomposition and nutrients are susceptible to leaching due to the heavy rain. As a result, the soil in the region is poor lacking humus, an essential
part of a fertile soil. It is characterised by a low water and nutrient retention capacity, low cation exchange capacity, high siltation sensitivity, poor texture and hardening. This results in very low crop yield, which, in turn, results in malnutrition leaving the people susceptible to diseases.
On the other hand, due to lack of appropriate sanitation systems, human excreta are often disposed in the landscapes or in shallow holes in the ground (“pit latrines”). This further pollutes the environment and exposes the people to many diseases. However, with an appropriate management, the human excreta can be safely recycled to improve the soil quality while at the same time addressing the sanitation problem. The energy need of the people can also be met with small scale biogas plants.
The aim of this project is, therefore, to develop an appropriate innovative sanitation system by optimising, adapting, and linking existing processes, specifically: (1) anaerobic fermentation of domestic waste and crop residues in small-scale biogas digester1, (2) carbonization and sanitation of fermentation residues and feces under hydrothermal carbonization (HTC), (3) composting and (4) application of the carbonised materials to agricultural plots to improve soil quality (see figure 1 for the flow diagram).
The benefit of this innovative system is manifold: Promotes effective and efficient use of resources to
protect the environment through the supply of biogas as a substitute for firewood (in particular as an activity against deforestation) and progressive recycling of nutrients contained in human excreta to close agricultural nutrient cycles.
Improves living conditions of the people in the target region, insuring long-term food security through improved soil fertility and thus productivity, better sanitation conditions and sustainable resource-saving energy supply.
Improves soil texture by improving humus conditions like in the “Terra Preta”2 as an activity against soil erosion, soil degradation and desertification.
Reduces greenhouse gas emissions and facilitates mediumterm sequestration of carbon into the soil and improves adaptation to climate change through improved nutrient and water retention capacity of the soil.
1 Project Biogas Support for Tanzania - “BiogaST” - of Engineers without borders (EWB) and the Tanzanian non-governmental organisation MAVUNO Project. 2 That is a very fertile and black soil with high carbon and nutrient content, as practised by the Incas in South America a long time ago.

239
PROCEEDINGS Conference MPDES 2011
Approach As the project involves adaptation of the thermo-chemical process to the conditions of the target region, a comprehensive feasibility study was carried out during an exploration journey to Tanzania. Furthermore, laboratory experiments were conducted at TU Berlin with an autoclave to adapt the process parameters to possible practicable values. Based on the initial investigation results, a pilot scale plant, comprising all the components of the system, will be built in summer 2011 in Berlin, Germany, to test the system.
The flow diagram below shows the holistic concept (see figure 1). It is a new approach for sustainable and ecological sanitation that includes the usage of urine diverting dehydrating toilets (UDDTs) and HTC in lower temperature range in the sanitation process. The urine will be used directly (after a certain storage time) as fertilizer in agriculture and the feces will be thermally treated together with fermentation residues via carbonization. Separate collection is reasonable as there is no need to sanitise urine at the same level as feces and under energetic considerations it is important to decrease the amount of water that has to be heated prior to HTC. Subsequently a composting process of the carbonized material together with other organic residues, char from fire residues, earthworms and beneficial micro-organisms will be done for producing “Terra Preta” and applying that to agricultural plots.
Figure 1: New concept for sanitation and nutrient
recovery with integrated carbonization process
Lessons learned Why thermochemical biomass conversion? Advantages of thermochemical treatment compared to biochemical decomposition are the conversion and stabilization of carbon compounds and inherent sanitation of the material according to the process temperature, which means that pathogens, e.g. bacteria, viruses and worm eggs, are inactivated. The same is true in comparison with microbiological carbonization, for example by Aspergillus niger. For the application in favour it is crucial to treat the materials thermally so carbonization takes place and further use in agriculture as soil conditioner is possible without any health risk.
The reasons why HTC was considered at first in this project are: Comparison of different carbonization processes
shows that the possible yields of biochar via pyrolysis or gasification are comparatively low; it is only possible to realize these processes in an efficient way by also using the gaseous and liquid by-products.
Biochar as a product of conventional pyrolysis has already generated good impacts on soil conditions. The process itself has obvious disadvantages as e.g.: polluting, energetically inefficient, uneconomic, need of dry biomass.
Wood is a very scarce resource, especially in regions under semiarid and tropical climate, and the need for protection is very high. Thus it should not be considered to be used for carbonization via pyrolysis any more.
HTC is applicable for any kind of biomass irrespective the moisture content.
Because of the specific conditions with a temperature > 130 oC, residence time > 30 minutes and elevated pressure with conditions of saturated vapour the process also leads to a sanitation of the treated biomass.
Development of adaptive technologies The development of adaptive technologies takes into account the possibilities and limits in the target region as well as the interests and needs of the technology users. It is intended to use only materials that are locally available for construction to enable long-term operation and maintenance and to strengthen the markets in the target region. Results of the feasibility considerations show that HTC, according to the stateof- the-art of science and technology, is not realisable under the prevailing conditions because of the following reasons: Local and regional markets only offer basic materials.
Materials that are sufficient in quality, e.g. stainless steel, are expensive goods and mostly provided in bad quality. Thus the construction conditions are limited to a lowtechapproach.
The potential technology users have little or no experience with the handling of high pressures.
Limits in given infrastructure, especially scarce or no electricity supply and the fact that most houses have no access to roads, restricts possibilities of transportation for a central implementation.
Initial results and discussion So far it has been possible to construct an adapted small lowpressure reactor. It is built only with materials that are available in the target region. It was possible to prove that it can hold pressure of minimum 5 bar.
Laboratory experiments with an autoclave, aimimg at adapting HTC to lower temperature of about 140 oC over different residence times, showed that the process leads to a partial carbonization of the biomass. Even though the products did not exhibit the characteristics of typical biochar, nutrients were retained in the solid part. This fact
240
PROCEEDINGS Conference MPDES 2011
can be seen as advantage compared to HTC under standard conditions, where most nutrients are found in the liquid product along with carbolic acids. Unlike the standard HTC, no extra water apart from water content of the biomass was used. Therefore, with these experiments, it was observed that carbonization happens not only when biomass is surrounded by a liquid water medium but also under conditions of vaporous atmosphere. Most of the experiments were done with fermentation residues from grass with high water content (> 80%) but results of experiments with dried fermentation residues with a lower water content (< 30%) show no significant difference in the examined characteristics.
Research demands An important focus of further technical research is the energy supply for the pilot HTC plant and the technical linkage with a small-scale biogas digester. The required heat for the carbonization process will at first be provided by burning biogas. Because feces are sanitized by HTC they can be used as an additional substrate for biogas production, which, in this region, are not considered as substrates for biogas-production because users want to avoid contact and thus health risks. It also seems necessary to use the process heat of the carbonization to increase the temperature inside the digester and thus also the specific biogas yield of the fermenter. In addition to recirculating the hot process water another possibility could be to use the freshly carbonized and still warm material for preheating the biogas-feedstock. The use of the rejected heat seems to be crucial to evaluate efficiency and thus ecological sustainability of the process.
Further research in composting as well as field experiments will be performed to evaluate the impacts of the system on soil fertility and structure. Therefore the carbonized materials will be examined by analysis in terms of soil-relevant characteristics. Effects and changes on biochemical and physiochemical soil processes and attributes by applying the Terra-Preta-compost can be estimated through extensive soil analysis. Investigation of the stability of the recycled carbon in the soil will also be an important focus in further ecological research.
To evaluate sustainability of the approach it is planned to do an environmental life cycle assessment of the entire system. In doing so the following analysis and balances will be worked out: A) energy balance and different mass flow balances, particularly B) humus- and nutrient balances and C) identification and quantification of changes of global greenhouse gas emissions incl. soil processes (e.g. N2O, CH4).

241
PROCEEDINGS Conference MPDES 2011
Small Hydropower in Rural Uganda
Centre for Research in Energy and Energy Conservation (CREEC) Faculty of Technology, Makerere University
Mary Suzan Abbo P.O Box 7062 Kampala, Uganda
www.creec.or.ug [email protected]
Abstract Electrification coverage in rural Uganda is very poor with less than 1% of the rural population having access to the national grid. Rural people are still an important majority in Uganda with about 88% of the population residing in rural areas (UIA1, 2009). Small hydropower development is one solution to bridging this electricity supply gap. Some of the potential sites can be developed for isolated grids and others for electric energy sales to the grid. This paper describes the successful development and operation of such a plant at Kisiizi Hospital in western Uganda with an installed capacity of 294Kw and how the lessons learnt are being applied by CREEC to Design a 3kW Pico2 hydro scheme. Keywords: Rural Uganda; Small Hydropower.
Background The population of Uganda stands at 32.4 million out of which 95% do not have access to electricity. The annual population growth is about 3% and the electricity demand growth is rated at 7-8% per year (DR3, 2005). The role of small hydropower as a renewable energy source, in addressing energy gaps in rural Uganda is substantial. Feasibility studies have been carried out for 10 small hydro power plants which are expected to add 50MW to the grid in the medium term (GTZ4, 2010). Many of the installed small hydro plants are not operational. This is attributed to inadequate feasibility studies, poor designs, lack of local manufacturers and poor maintenance culture. Some of the small hydropower plants that are still operational are shown in table 1 below.
Table 1: Some of the operational small Hydropower plants in Uganda
Site District Installed capacity (MW) Mobuku 3 Kasese 10 Mobuku 1 Kasese 5.4 Bugoye Kasese 13 Kuluva Moyo 0.12 Kisiizi Rukungiri 0.294
Particular reference is now made to the technology adopted in the operational small hydropower plant of up to 294 kW at Kisiizi hospital.
1 Uganda Investment Authority 2 Hydropower of up to 5kW 3 Developing Renewables – European Union 4 German International Cooperation
Kisiizi Electricity Church of Uganda Kisiizi Hospital is a Private Not for Profit (PNFP) Health Care Provider which is rurally situated deep in the mountains of North Kigezi in Rukungiri district South West of Uganda. The hospital has 14 medical departments and 8 support departments including a primary school and a nursing school which all require electricity.
The hospital at Kisiizi began in 1958. The site had previously been a flax factory. This factory used water power from the River Rushoma by means of a small overflow dam on the river just above Kisiizi falls and a turbine wheel with mechanical drive to the machinery. The plant was built in 1944 and the small overflow dam has been used for all the hydro-electric plants including the new one.
The Small Hydropower plant at Kisiizi has been operational since 1964 to date with two major phases of capital reinvestment to increase installed capacity in 1986 and 2009. The first plant was a small one of 14kW installed in 1964 and the second was of 60kw using a francis turbine installed in 1986. By the year 1997 this was proving inadequate and plans were made for a larger one. Measurements of the river flow indicated that for much of the year there was sufficient water for a 300kw plant. Support was gained from the World Bank through the Ministry of Energy and Mineral Development and the Rural Electrification Agency.
Work began in May 2005 and was commissioned in April 2009 and by May 9th 2009 was providing power to the hospital. Since then, the plant has been running continously except for minor problems and maintenance.
Approach Efficient Electromechanical design For a sustainable approach, Kisiizi power plant installation adopted the use of proven technology for the electromechanical components to ensure efficiency of the scheme. The new turbine is Crossflow and is made by Ossberger, a German firm with a long and sure track record in the manufacture of these particular machines. The turbine/generator technical specification is: (i) 294kW maximum expected output (ii) Crossflow runner in Stainless Steel (iii) Direct drive to a special build, low speed alternator (iv) Vane type flow control for slow acting speed regulation (v) Electronic Load Control by Thomson & Howe (Canada) for fast acting speed regulation. The rationale behind the specification is that the major service intervals on bearing changes should be few and far apart, under normal conditions not less than

242
PROCEEDINGS Conference MPDES 2011
12 years. It was decided to opt for the Crossflow rather than a Francis type because the latter is not capable of handling a wide spread of flows while maintaining efficiency as illustrated in the figure 1 below.
Figure1: Comparison of turbine Part-flow efficiencies
(Mason5, 2010)
Minimal costs on civil works Involvement of local labour in the civil works rather than external contractors reduced installation costs by 85% and increased the sense of ownership of the local community. The entire civil infrastructures were designed in house, with checking by some volunteering (Kisiizi Friends) engineers who visited the Kisiizi site. With the exception of the enclosed pipes which deliver water to the turbines, all civil works equipment were sourced or fabricated locally. Local metal fabricators and carpenters were employed and the machine shop at Nakawa Vocational Training Institute, in Kampala was utilized.
All construction was carried out by a team of masons, carpenters and porters drawn from the immediate area. The installation of the pipes was a good example of “low tech” techniques. Rather than hiring an expensive crane for an unpredictable amount of time, Kisiizi went for the construction of a ramp and sledge to lower the pipes downhill.
Quality assurance A fault detection and switch for the 11kv lines was provided free by Scottish and Southern Energy of the UK whose engineers also helped with supervision of the overhead network and commissioning the plant for quality assurance.
Power sales Connecting customers outside the hospital began in October 2009. The local community had been anxiously waiting for this for some years. By mid-December 2009, 78 customers had been connected and average weekly sales were 500,000 Uganda Shillings (213 US Dollars). By mid-December 2010 there were 200 customers and weekly sales were 1,000,000 Uganda shillings (425 US Dollars). Electronic pre-paid meters are used and
5 Dr. Peter Mason – Presentation on dam construction,
Manitoba Hydro International
customers have to buy a token. This is a slip of paper with a series of 20 digits which are entered into the meter to give credit for electricity (Wadsworth6, 2010).
Environment The main criterion was to preserve the waterfall as much as possible as it is a tourist attraction and a Kisiizi focal point. This included designing a bypass in the weir to ensure a minimum flow of 150 litres/second over the Falls at all times, and a specially designed headrace and water saving turbine specification so that when power consumption is low, the excess water goes back over the falls.
Lessons learned As a result of the scheme installation, Kisiizi hospital and its affiliated institutions have their own isolated grid with enough power to light; operate hospital equipment, domestic appliances and capacity to sell electricity to 10 schools, 100 small shops and about 200 households.
The successful experience of the Kisiizi hydro power scheme is now used by CREEC to plan for the implementation of a 3kW Small hydro power plant at Rwenzori Mountaineering Services (RMS) to boost its tourism sector. A cross flow turbine is chosen for its capacity to work with the low head of 10m and to handle a range of flows. The possibility of manufacturing the turbine locally could reduce maintenance costs. Local labour will be employed.
Small Hydropower is still a viable approach for rural electrification in Uganda and the use of cost effective approaches like local manufacturing and labour cannot be overemphasized.
Research demands The use of cost effective approaches like local manufacturing of turbines, generators and other electromechanical components reduce costs of importation which is currently the predominant way of procuring components for most small hydro power plants in Uganda.
CREEC in collaboration with GIZ manufactured a pelton turbine as a first step in this research. In future projects, CREEC will consider using locally manufactured turbines like the crossflow after the pilot plant at RMS. More research should be done to investigate the best finance options and effective community involvement framework.
6 George Wadsworth – A report on Kisiizi Electricity
% EFFICIENCY

243
PROCEEDINGS Conference MPDES 2011
Presenting Automatic Demand Control (ADC) as a new frequency control method in Smart Grids
Power and Water University of Technology / Tehranpars, Vafadar Blvd.Tehran, Iran
Mohammad Taghi Ameli [email protected]
Ali Ameli [email protected]
Hamed Maleki H_maleki @stud.pwut.ac.ir
Amir Kabir University of Technology / Valiasr ,Tehran, Iran
Alireza Mobarhani (ali_mobarhani @aut.ac.ir)
Abstract Electric power is the most important part of human energy consumption, and since it has a low storage coefficient it is of particular importance to establish a balance in demand and generation in order to modify and optimize consumption patterns. The expression "Smart Grid" can be used to describe technologies which are applied for the automation and optimization of the generation, transmission and distribution network management. This technology requires the integration of information and communication technology in electrical network operation. This paper will study how the Smart Grid capabilities can be used to manage and optimize power network consumption, as well as how the consumers collaboration process using an AGC (Automatic Generation Control) system acts to provide secondary frequency control through consumed load shedding. Reestablishing the balance between demand and generation in critical network operation is also investigated. In other words, utilizing the above method, a new system, ADC (Automatic Demand Control), is offered for use alongside the AGC system in Smart Grids to restore the frequency value to its nominal value. This can lead to a more competitive electricity market and reduce the system storage while maintaining adequate security and network reliability. One of the benefits of the proposed methods described in this paper, in addition to restoring the frequency value to its nominal value, is lower costs and a more economic network operation through reducing fuel and CO2 emission by managing and controlling the amount of the consumed load in the Smart Grid. Also consumers are given the capability to have a specific timetable to economize on their energy requirements which will also reduce the load peak and the network losses. Keywords: Smart Grid; Secondary frequency control; classified load
Introduction Although the power grid has already benefited from some advances in technology it still suffers from not being smart enough and from a lack of centralized automation. Therefore it has become necessary to optimize and modify consumption patterns. Therefore the necessity has arisen to optimized and modify consumption patterns.
Using smart systems will result in higher productivity and cost savings. The following four key objectives are the reasons for higher network investment: increased
reliability and security, increased cost and operating efficiency, established balance between energy resources and demands, reduction in the overall impact of the electrical systems on climate change.1 Network observation will enable the most optimal load flow to be run and thus consumers can be provided with produced energy with minimal loss.
The loads are classified according their importance in this network. In the case of a frequency reduction, they will be removed from the circuit by the AGC command in this order. Important loads can be provided by distributed energy resources according to the amount of local production, and thus the frequency remains at its limits. In spite of a competitive electricity market, consumers can reduce a certain amount of their load in a critical network situation according to the Smart Grid capability, while participating in the electricity market. This system is called Automatic Demand Control (ADC), and it can help the Automatic Generation Control (AGC) in the secondary frequency control by returning the frequency to its nominal value. It should be mentioned that the presented solution (ADC) could be especially useful in Micro Grids operation.
Executive Power Management Solutions Given the importance of electric energy consumption, management and optimization, action should be taken to advance this goal. Some of these actions are applicable in the short term, as consumers can play a more effective role by helping to de-peak the power network. For example, replacing string lamps with High efficiency lamps, and operating electrical equipment such as washing machines, vacuum cleaners and juice makers in non-peak hours can be very effective. In order to progress in this field, multi-tariff meters and multi-tariff rates are useful. Bilateral coordination between consumers and producers is possible in a Smart Grid, whereby consumers could be informed of the network status at any given
1 Momoh, J. A. Fellow of IEEE (2009). Smart Grid Design for Efficient and Flexible Power Networks Operation and Control. 978-1-4244-3811-2/09©2009 IEEE.

244
PROCEEDINGS Conference MPDES 2011
moment and thus optimize their consumption according to cost.2
Smart Grid Future electricity networks are known as Smart Grids, and it is expected that these will compensate for many deficiencies in the current electrical networks. The optimization of electric networks and making them intelligent in all aspects leads to the appearance of Smart Grids. The term ‘Smart Grid’ includes a generation, transmission, distribution and consumption system that integrates the existing power network with distributed generation resources, energy storage sources, measuring equipment, modern two-way information and communication technologies to improve the network performance and provide subscribers with a wide range of added services. Smart Grid is not just defined by the technologies it combines, it is also defined by how it performs [2-4].
In summary, the use of sensors, communication systems, computational and control capabilities by the Smart Grid can increase the overall performance of the delivery system.3
The four major reasons for bringing on the Smart Grid are:
- Increased power network reliability, efficiency and security
- Decentralization of power production so that subscribers can be both power consumers and producers
- Increased flexibility of the subscribers for selecting power providers
- Possible development of using renewable energies and their coordination with the network
To achieve the goals of the Smart Grid in the available electricity network required infrastructures should be added to the power grid. Some of the basic infrastructures are shown below:
- Home network - Electric vehicles’ available network connection - Energy storage equipment - Distributed generation resources - Voltage and reactive power control equipment - Demand response - Micro Grids - Investment Management
The benefits of a Smart Grid include increasing the energy gain factor and helping in greenhouse gas reduction, which can be used as leverage in lowering costs, economizing industrial generation units by reducing fuel consumption and greenhouse emissions, and increasing profit by using the same equipment, by the means of consumption management and control through Smart Grids. A Smart Grid enables regional electric power companies to be aware of the consumption of their customers at any given time, because the Smart Grid
2 Amin, S.M. & Bruce, F.W. (2005). Toward a Smart Grid. IEEE power & energy magazine, Vol. 34, No. 5, (pp 34-41). 3 Farhangi, H. (2010). The Path of the Smart Grid., IEEE PES magazine, Vol.8, No.1, (pp.19-28)
technology helps producers to respond to consumer demand. Also this capability enables every customer to have information about their energy consumption and what this is costing.4
Moreover, when secondary frequency control is required by the AGC, specific smart actions could be taken by precedence load shedding to re-establish the balance between production and demand to bring the frequency back to its nominal value and provide consumers with high quality power.
Introducing Automatic Demand Control (ADC) As can be seen in Figures 1 and 2, consumers can obtain power from both the main electricity network and from renewable energy resources (DG) or electrical energy storage devices in a Smart Grid. Electricity prices in the electricity market will change online, so in peak consumption times, when the price is higher, it is not beneficial for consumers to obtain power from the electricity network. This will lead to a peak load reduction and maintaining network security will naturally be more comfortable.
It is assumed that the Smart Grid is in normal operation condition (network or insider connections). In a particular moment if the system gets overloaded and the power generation units are not able to provide this added load, the balance between generation and consumption will be lost and therefore the network frequency will decrease.5
The installed frequency meter in the control center (Figure 2) measures the current network frequency and compares it with the reference frequency value. The frequency deviation value will be noticed and recorded.
So far the generation unit governor systems have acted first to control the frequency deviation. If the frequency value cannot return to its nominal value after 15 seconds, the AGC system will come into action as a secondary frequency control to re-establish the balance between production and consumption, and so the frequency receives its nominal value again.6
The difference that the method described in this paper offers is that not only the generation units (such as DGs) bid in the electric market for returning the frequency value to its nominal value due to their power generation, but also consumers participate in the market and offer bid prices to reduce their loads to enable secondary frequency control and help the AGC system. Then a priority list of the consumers and producers bid prices will be provided by the market.
If a secondary frequency control is required in case of a certain power shortage, this will be provided by means of the consumers and producers in the priority list, and so the balance of power generation and consumption will be re-
4 Santacana, A. E.; Rackliffe B. G.; Le Tang , C. & Feng, D. Xi. (2010). getting smart. IEEE PES magazine, Vol. 8, No 2,( pp. 41-48). 5 Yamashita, K.; Juan, Li; Pei, Zhang & Chen-Ching, Liu. (2007). Optimal Automatic Generation Control (AGC) Dispatching and Its Control Performance Analysis for the Distribution Systems with DGs. Power Engineering Society General Meeting,. IEEE 6 ibidem

245
PROCEEDINGS Conference MPDES 2011
established and the frequency returns to its nominal net value. Therefore a new system called Automatic Demand Control (ADC) will be applied beside the AGC system in Smart Grids to restore the frequency value as a secondary frequency control method, which could lead to a more competitive electricity market, reduce system reserves and maintain system reliability and adequate network security.7
The network shown in figure 1 includes power plant generation, distributed generation units and consuming load which is divided into three sections according to their importance. These classified loads have low, normal and high importance, so the consuming time of the loads vary and consumers can choose the optimum time to connect their loads which have low importance to the network.
Meanwhile, at the time of peak consumption consumers can reduce their less important loads, which measure is defined through the market results, and so help the frequency control. According to Figure 2, loads no. 1 and 2 are less important loads, (like washing machines, dishwashers, sports equipment and etc.) which usage were not necessary at any given moment. Load no. 4 includes loads with normal importance (such as television) and high important loads are defined as load no. 3 (computers, lights, refrigerator, freezer, telephone etc.) that can only be disconnected in emergency situations where the risk of total network loss and a blackout is very high.
Hence, using the abilities of a Smart Grid, the control center is aware of the amount of the network power at any time and will disconnect loads with low importance first according to the market results. If more load needs to be cut, it will remove loads with normal importance but shedding loads that have high importance, is not permitted except in special circumstances.
To show the practical and effective function of this method, the role of the ADC system for controlling the frequency of the New England 9-Bus IEEE Network has been investigated in the next chapter. The DIgSILENT power software is applied for the simulation procedure.
7 Amin, M. (2008). Challenges in Reliability, Security, Efficiency, and Resilience of Energy Infrastructure: Toward Smart Self-healing Electric Power Grid. Power and Energy Society General Meeting Conversion and Delivery of Electrical Energy in the 21st Century, IEEE

246
PROCEEDINGS Conference MPDES 2011
Figure 1: Simplified Smart Grid diagram
Figure 2: Sample schema of a Smart Grid with classified loads

247
PROCEEDINGS Conference MPDES 2011
Figure 3: New England 9-Bus IEEE Network
Study Case and Simulation Results The New England 9-Bus IEEE Network is shown in figure 3. We overload this network with a 24 MW load in second 5 of the time simulation and can see its impact on the network frequency in figure 4. The frequency value decreases to 49.78 Hz, then the power plant governor systems act automatically to bring back the frequency value to its nominal value, but finally the frequency receives 49.94 Hz because of the governor’s droop adjustment, and remains in this value which is in the defined limit.
The frequency behavior of the system can be seen in figure 5, where the secondary frequency control system comes 100 seconds after the simulation begins, in action. As can be seen, while using the AGC system as a secondary frequency control, the frequency value increases up to 49.96 Hz and is still less than the nominal value. The influence of applying the ADC system in addition to the AGC system at the same time (100 seconds after the simulation run) and controlling the participating removable loads on the market is observable in figure 6. In the end this hybrid method is able to bring back the frequency value to its nominal value. The simulation results in this paper show that the ADC system is capable of complete secondary frequency control in power systems next to the AGC system with minimal costs due to Smart Grid capabilities.
Conclusion Through a Smart Grid, regional electric power companies are able to identify the consumption of their costumers and consumers at any time, enabling optimal generation
and distribution, and employment of available resources and increased efficiency.
The proposed system in this paper (ADC) uses Smart Grid capabilities along with the AGC system to increase the power capacity of the secondary frequency control system. It also has an important influence on providing more competitive electricity market for frequency control and decreasing its relative costs. In addition it reduces the system reserves while maintaining system reliability and security. Furthermore, this method leads to reduced pollution while removing loads instead of increasing power generation for the secondary frequency control.
On the other hand it is clear that the operation, optimal control and stability maintenance of a Micro Grid requires more reserve capacities comparing the power network due to their limited production capacity. Definitely would these reserves be very expensive and also would cause pollution and greenhouse gas emissions. Thus the system presented in this paper (ADC) could be particularly useful and efficient in raising the reliability of the operation of Micro Grids. Moreover it's easily operable using Smart Grid capabilities without incurring additional cost.
Therefore, the application of this new approach to secondary frequency control is highly recommended.

248
PROCEEDINGS Conference MPDES 2011
Figure 4: Impact of the primary frequency control (power
plant governor systems) on the frequency deviation
Figure 5: Impact of the AGC system in the 100th second
(secondary frequency control) on the frequency deviation
Figure 6: Impact of both the ADC and AGC system in the
100th second (secondary frequency control) on the frequency deviation

II. Contributions from PractitionersImplementation and Business Models

250
PROCEEDINGS Conference MPDES 2011
Capitalizing on the asset nature of Micro Energy Systems to promote social transformation in economically
marginalized and structurally neglected rural areas of Kenya A case study on an asset creation program in Kenya.
R. Mutsaers ([email protected])
Gpower NGO Fana Road 27, Nairobi, Kenya
Abstract Realizing the intimate relation between rural electrification and private sector development, Gpower NGO extracted a bottom up capital isolation model that is based on a hybrid approach. The customized model represents a capital isolation concept that realizes commercial energy service ventures in order to secure access to credit markets through the establishment of financial institutions. This paper represents a case study on Gpower’s REA model that has been developed over the past eight years and continues to mature until 2014. The presented model demonstrates that isolation of capital under renewable energy generation- and distribution ventures could possibly spearhead development of both the First- and Third economic sectors in developing countries. Keywords: rural electrification, financing schemes, credit market, carbon credit program
Introduction A promising new approach to efficiently advance rural electrification in the context of present-day market liberalization trends is the establishment of renewable energy mini-grid systems that are constructed, owned and operated in collaboration with farmer shareholders.
Through its REAM (Rural Energy Access Model), GPOWER NGO pioneers this approach through the isolation of public assets under a social-monetary governance program.
While conventional electrification projects mainly focus on the technical implementation of power plants, the REAM programme reaches far beyond mere electricity provision. It represents a strong integrative social development tool that efficiently addresses chronic poverty levels in rural Africa. It is firmly anchored in the collaborative creation of capital assets and advances beneficiary social transformations in direct partnership with those affected. Through the model’s comprehensive- and multi-level approach – asset creation, knowledge transfer, economic empowerment and social development - the REAM encompasses a wide range of programmes and activities, tackling rural poverty from the various angles of its root causes.
Case Study Objectives I. GPOWER NGO, an introduction to the social
engineering entity behind the concept of electrification through rural asset creation;
II. The REAM-Programme Rationale; III. Energy Property Systems: Converting socio-
economic potential into real assets;
IV. Generating Collective Responsibility through the Mobilisation of Energy Assets: Conveyance of a representational approach and self-governance;
V. Monitoring Systems: Administration and finance governance of collective energy investments to ensure more valuable combinations and opportunities;
VI. Access to credit markets: Collective investment and institutionalization of extra-legal assets.
I. GPOWER NGO, an introduction to the social engineering entity behind the concept of electrification through rural asset creation GPOWER NGO is a Kenyan based non-governmental organization (NGO) with an international status and operational in developing and post-industrial countries. As a social engineering agency, the organization’s mission upholds the establishment of sustainable human networks through the identification of capital assets and the design of institutionalization processes that isolate- and govern rural and national resources.
Under GPOWER NGO’s REAM inefficient alternative energy expenditures are isolated and transformed into efficient channels through the establishment of electricity networks.
Currently, GPOWER NGO is active in Kirinyaga District, Central Province, Kenya, and engages itself to isolate capital and network ten thousand small-scale farmers in order to secure development of public assets.
In collaboration with ten CBOs (Community Based Organizations) the model prospects to isolate 36 Million USD under commercial energy- and agricultural ventures that are monitored- and governed by financial institutions.
II. TheREAM-Programme Rationale The REA-model reflects the development of a social market economy that seeks to combine private enterprise goals with measures of collective ethical governance in an attempt to establish fair competition, low inflation, low levels of unemployment, an appropriate standard of working conditions and social welfare under the following key denominators:
a. Rights to energy access; b. Rights to higher education; c. Rights to health security; d. Rights to access credit markets for further
development of the economy.

251
PROCEEDINGS Conference MPDES 2011
In cooperation with academic-, financial-, legal- and technical partners, GPOWER NGO implements its ‘Rural Energy Access Model’ through a two-phase strategy, each phase consisting of the milestone objectives listed below:
Phase I – Off-Grid Energy Access (4-5 Years/ 3.6 Million Euro Capital Isolation):
- Identification and support towards institutionalisation of suitable partner Community Based Organisations (CBOs);
- Linkage of awarded CBOs to potential hydroelectricity sites;
- Kick off of feasibility studies, design and construction of power generating and distributing facilities;
- Establishment of organizational- and legal structures (Electricity Holding and Electricity Operating Company) to secure public ownership on a shared risk basis;
- Launch of training and educational programmes ensuring adequate knowledge and capacity transfer to participating shareholders and project co-owners;
- Securing of customer base and enhancing organisational liability through public relations and targeted governance coaching activities;
- Preparative tasks for the establishment of a mega-watt generation facility in Phase 2;
Phase II – Interconnected Grid Energy Access ( 3 Years/ 24 Million Capital Isolation):
- Construction of a mega-watt generation power plant and interconnection of isolated grids established in Phase I;
- Access to credit markets via asset security and shareholding structures;
- Networking with international partners seeking to invest in commercial enterprises powered by the electricity infrastructure established in Phase I and II;
The approach outlined above has been under development over a period of seven years and continues to mature consistently - incorporating and institutionalizing a diversity of governance structures that create, enable and motivate local representatives to alleviate poverty through capital isolation and socio-economic reforms. Essentially, the ‘Rural Energy Access Model’ has been customized to the needs and economic capacity of targeted rural population; it identifies opportunities and educates communities to understand and recognize the root causes of socio-economic poverty actors from various perspectives and translate resulting responsibilities to future generations.
III. Energy Property Systems: Converting socio- economic potential into real assets The identification of partner communities for the replication and expansion of the REAM represents an integral aspect of the model.
In collaboration with religious-, educational and commercial institutions GPOWER NGO identifies promising local leadership and assists with the establishment and institutionalisation of respective CBOs
under the Ministry of Social Services. This is a crucial step in organising community representation and contribution towards development projects in general and the REAM in particular.
Since the completion of its Thiba pilot project in 2005 GPOWER NGO has identified and coordinated 11 CBOs and respectively launched the construction of 11 micro-hydro plants in Kirinyaga alone.
Table 1: 11 communities in central Kenya with whom
GPOWER NGO is currently engaged.
Summary Details 1st Phase Gen. 1st Phase Dist. Project M
w F-
st. (%)
C- (%)
F-sec (%)
F-st. (%)
C-(%)
F-sec (%)
Kiangurwe
0.3
100
100
100
100
20 10 Riakaruria 0
.5 10
0 40 10
0 10
0 5 s.
Inanjugu 0.3
100
90 100
100
1 s. Rianjue 0
.3 10
0 30 10
0 10
0 1 s.
Gitii 0.3
100
30 30 100
- - Kii 0
.2 10
0 60 60 10
0 - -
Muchungwa
0.5
100
20 20 50 - - Muketura 0
.2 10
0 60 10
0 50 5 s.
Muromu 0.2
100
10 10 50 - - Urumandi 0
.2 10
0 10 10 50 - -
Riagiceru 0.2
100
10 10 50 - - F-st.= Feasibility study; C-(%)= Completion; F-sec= Funds secured; s.= Scourcing;
Table 2: Detailed overview of these projects, i.e. the related investment as well as completion and funding
status.
Project HH- Con. Funding Partners
Kiangurwe 1000 C-C/ TARDA/ Liberty Foundation/ French Emb. Riakaruria 1000 C-C/ Finnish Embassy
Inanjugu 1000 C-C/ Africa Lighting1 Rianjue 1000 C-C/ Africa Lighting Gitii 1000 C-C/ Gpower Ltd. Kii 500 C-C/ Gpower Ltd. Muchungwa 1000 C-C/ Gpower Ltd. Muketura 500 C-C/ Japanese Embassy/ Gpower Ltd. Muromu 1000 C-C/ CDF Urumandi 1000 C-C/ CDF/ Gpower Ltd. Riagiceru 1000 C-C/ Gpower Ltd.
HH-Con=Household connection; C-C=Community contribution
1 World Bank

252
PROCEEDINGS Conference MPDES 2011
Table 3: Detailed overview of these projects, i.e. the related investment as well as completion and funding
status.
P-St. T+P T. Gen. HH Tr. T.
Dist. Kiangurwe/100KW 147 83 231 1000 14 587 Riakaruria/100KW 220 83 304 1000 11 533 Inanjugu/100KW 147 83 231 1000 11 533 Rianjue /100KW 323 83 407 1000 11 533 Muketura/60KW 88 83 172 500 5 269 Gitii/100KW 147 83 231 1000 10 515 Kii/100KW 88 83 172 500 5 269 Muchungwa /100KW 220 83 304 1000 10 533 Muromu/100KW 110 83 194 1000 10 515 Urumandi/100KW 117 83 201 1000 11 533 Riagiceru/100KW 264 83 348 1000 10 515 Generation Investment 2,798 5,341 P-st.=prime structure; T+P=Turbine and Penstock; T.Gen.=total generation; HH=Households; Tr. Transformers; T.Distr.=total distribution.
IV. Generating Collective Responsibility through the Mobilization of Energy Assets: Conveyance of a representational approach and self-governance In collaboration with internship programmes via UQAM (University of Montreal), MIT, University College of Utrecht, University of Berlin, GPOWER NGO facilitates an education- and training programme for shareholders and CBO representatives under the following topics: - Organization and Governance strategy; - Legal strategy - Shareholding and Credit Access strategy; - Administration strategy - Implementation strategy. - Operation strategy
Seminars are currently held on a weekly basis through
the Kianyaga branch office
Commercial Venture Programme Through the establishment of affordable energy infrastructure and via the considerable capacity building input materialized through the REAM programme, the target area is prospected to become increasingly attractive to foreign/private sector investment.
In this context GPOWER NGO is networking with international venture partners to secure successful micro-economic and social development within the REAM partner communities.
Outreach Programmes To ensure full community participation, including the participation of women, GPOWER NGO organizes outreach workshops, prints materials and facilitates site visits, also for Western Kenya where GPOWER NGO has only become active since August 2008 and where communities do not yet have a reference point on how best to organize their electrification projects.
With respect to gender parity and the specific enhancement of human development outcome for women the impact of the projects may be summarized as follows: Women, still having the traditional and common role of a housewife in Kenya, will benefit from the improved lighting since they spend most of the time indoors. Smoke
induced respiratory illnesses will diminish due the fact that electric light bulbs will replace kerosene lamps.
The availability of electricity for productive use enables women to start micro companies such as tailor business or processing of agricultural products.
By creating assets for the communities through the electricity companies, the overall wealth situation will improve. Micro-finance institutions (MFIs) will be created, which, in line with a great majority of equivalent schemes throughout the developing world will promote gender equity in lending statuses.
Carbon Credit Programme
Micro-hydro is one of the most environmentally benign energy conversion options available, because unlike large-scale hydro power, it does not attempt to interfere significantly with river flows and relieves the local population from dependence on scarce natural resources. Through its environmentally friendly approach the REAM may facilitate capitalisation on a variety of synergies such as carbon credit. GPOWER NGO in collaboration with the Berlin University of Technology and Linklaters Ltd. NY, is currently launching a carbon credit programme to secure further pre-financing of its projects through Gold Standard Status.
Table 4: The prospected yearly revenue from the carbon credit programme in the Kirinyaga Model.
Year Y-
Output Y-R (CER@ 10 Euro)
Y-R (CER@ 6 Euro)
A-Output
A-R (CER@ 10 Euro)
A-R (CER@ 6 Euro)
2009 814 8.140 4.884 5.545 55.450 33.270 2010 4.731 47.310 28.386 10.276 102.760 61.656 2011 4.731 47.310 28.386 19.890 198.900 119.340 2012 9.614 96.140 57.684 37.072 370.720 222.432 2013 17.182 171.820 103.092 54.254 542.540 325.524 2014 17.182 171.820 103.092 71.436 714.360 428.616 2015 17.182 171.820 103.092 88.618 886.180 531.708 2016 17.182 171.820 103.092 105.800 1.058.00
0 634.800
2017
17.182 171.820 103.092 122.982 1.229.820
737.892 V. Monitoring Systems: Administration- and
finance governance of collective energy investments to ensure more valuable combinations and opportunities GPOWER NGO’s financial strategy is, for one, centred on self-reliance and sustainability - i.e. no reliance on donor support once the model is operational - and also strongly advocates maximum community contribution to the projects which represents a vital facet towards enhancing a sense of security, ownership, responsibility and motivation towards the REAM realisation.
Farmer members in the target area have agreed to sign individual five year loan agreements and secure investment returns of Euro 250/ HH. This fee will be raised to secure third party loans acquired for rolling out various components of the respective energy facilities. While this amount is more than 15% below the heavily subsidized connection fees currently collected by KPLC (Kenya Power & Lighting Company Ltd), it reflects a substantial contribution with respect to the average annual income of rural households in the Mt. Kenya region.

253
PROCEEDINGS Conference MPDES 2011
Naturally the REAM infrastructure cannot be completed with these contributions alone and rely on subsidiary grant support from donor organisations.
Grant/ Loan Policies In line with the aforementioned loan agreements and to implement the projects in an economically viable manner, GPOWER NGO is seeking loans from lending institutions equivalent to the amount which can be secured through the shareholder fees from the individual communities (900 members per site @ Euro 350). 40% grant investments are required to compensate necessary investments thatsupersede the contribution-threshold of the communities. Generally, grants are requested to establish asset maintenance- and operation that is auxiliary to all projects under one REAM i.e. training centre, outreach programmes or operating expenses of umbrella, electricity holding and operating companies in their first year(s), whilst the projects are not fully operational.
During implementation and initial five years of operation, GPOWER NGO bears full liability for grants and loans through company assets, equity shares, CBO- and individual shareholder agreements.
REAM Governance and Legal Structures Currently, each of the participating communities operates through a registered Community Based Organization, or CBO. GPOWER NGO partners with each of these CBOs to establish the prime structures (inlet channel, powerhouse, outlet channel etc.) and the generation facility (1 or more micro-hydro turbines). However, once the prime structures and generation facility are complete a new legal structure must be put in place to define ownership and responsibility of power generation and distribution as well as asset governance upholding the collective ethical objectives of the model.
Since 2007, GPOWER NGO has been receiving extensive pro bono legal support from Linklaters Ltd. - a large New York based law firm - to draw up legal structures that are designed to independently govern power producing companies and its assets under Kenyan law.
In Collaboration with Linklaters Ltd. GPOWER NGO developed the Memoranda of Articles and Association for the REA. The below presented block diagram reflects the governance structure of the REA company:
Figure 1: REA organizational chart
Umbrella Company (District Financial Institution): REA Umbrella Company rests at the top of all other governing structures and governs the financial-, administrative- and technical activities of the underlying local Holding- (Financial institution) and Operating Companies (maintenance- and operation of assets) and therefore reflects a 100% ownership of the 10 subsidiary holding companies.
Under the ‘Access Right to Energy’ concept, the REA Umbrella Company guarantees that the creation of electricity generation- and distribution facilities is utilized as a tool to mobilize public capital for the maintenance of a human network that identifies sustainable socio-economic standards within the target region.
Holding Company (Local Financial Institution): Each project related Holding Company is registered as a credit entity governing the isolation and expansion of capital at a local level. Under the ‘Access Right to Energy’ concept, each of these Holding companies incorporates two governing bodies; the CBO ltd (financial institution/ commercially embodied CBO) and a technical partner procuring the realization of assets.
Each CBO initiative (micro-hydro project) is governed by one holding company which maintains a mandate to independently govern 100 percent of the assets created under its human network.
Technical Partner The technical partner undertakes the specific tasks required to construct the generation- and distribution facilities and designs the operation- and maintenance structures.In addition, the technical partner advises the operating companies on KW/h tariffs as well as on maintenance- and operation of the capital infrastructure implemented. Unlike GPOWER NGO, the technical partner acts as a contractor and in return for its investment becomes an equity stakeholder of these companies by obtaining 30% ownership of the assets built during the generation and distribution work. These 30 percent refer to movable assets, namely the turbines, the control panels, the transformers, and the switchgears. The decision making power of the technical partner resides within two appointed officials.
REA Umbrella Company (Technical Partner: 30%, CBO-Ltd 7% x 10 Hold. Co.
Ltd.’s)
Holding Company 1 (registered as a
financial institution)
Technical Partner (30%
equity) 10X Replication under REA
Electricity Company 1
CBO-Ltd (70% Equity)
10X Replication under REA
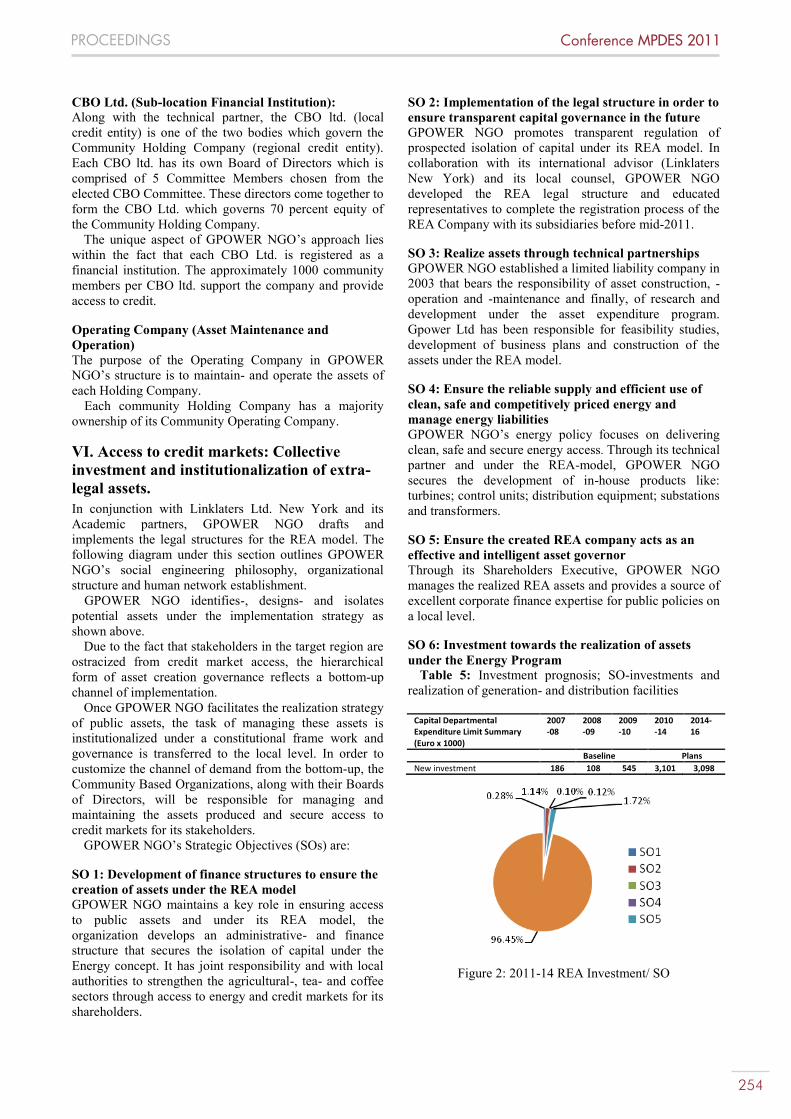
254
PROCEEDINGS Conference MPDES 2011
CBO Ltd. (Sub-location Financial Institution): Along with the technical partner, the CBO ltd. (local credit entity) is one of the two bodies which govern the Community Holding Company (regional credit entity). Each CBO ltd. has its own Board of Directors which is comprised of 5 Committee Members chosen from the elected CBO Committee. These directors come together to form the CBO Ltd. which governs 70 percent equity of the Community Holding Company.
The unique aspect of GPOWER NGO’s approach lies within the fact that each CBO Ltd. is registered as a financial institution. The approximately 1000 community members per CBO ltd. support the company and provide access to credit.
Operating Company (Asset Maintenance and Operation) The purpose of the Operating Company in GPOWER NGO’s structure is to maintain- and operate the assets of each Holding Company.
Each community Holding Company has a majority ownership of its Community Operating Company.
VI. Access to credit markets: Collective investment and institutionalization of extra-legal assets. In conjunction with Linklaters Ltd. New York and its Academic partners, GPOWER NGO drafts and implements the legal structures for the REA model. The following diagram under this section outlines GPOWER NGO’s social engineering philosophy, organizational structure and human network establishment.
GPOWER NGO identifies-, designs- and isolates potential assets under the implementation strategy as shown above.
Due to the fact that stakeholders in the target region are ostracized from credit market access, the hierarchical form of asset creation governance reflects a bottom-up channel of implementation.
Once GPOWER NGO facilitates the realization strategy of public assets, the task of managing these assets is institutionalized under a constitutional frame work and governance is transferred to the local level. In order to customize the channel of demand from the bottom-up, the Community Based Organizations, along with their Boards of Directors, will be responsible for managing and maintaining the assets produced and secure access to credit markets for its stakeholders.
GPOWER NGO’s Strategic Objectives (SOs) are:
SO 1: Development of finance structures to ensure the creation of assets under the REA model GPOWER NGO maintains a key role in ensuring access to public assets and under its REA model, the organization develops an administrative- and finance structure that secures the isolation of capital under the Energy concept. It has joint responsibility and with local authorities to strengthen the agricultural-, tea- and coffee sectors through access to energy and credit markets for its shareholders.
SO 2: Implementation of the legal structure in order to ensure transparent capital governance in the future GPOWER NGO promotes transparent regulation of prospected isolation of capital under its REA model. In collaboration with its international advisor (Linklaters New York) and its local counsel, GPOWER NGO developed the REA legal structure and educated representatives to complete the registration process of the REA Company with its subsidiaries before mid-2011.
SO 3: Realize assets through technical partnerships GPOWER NGO established a limited liability company in 2003 that bears the responsibility of asset construction, -operation and -maintenance and finally, of research and development under the asset expenditure program. Gpower Ltd has been responsible for feasibility studies, development of business plans and construction of the assets under the REA model.
SO 4: Ensure the reliable supply and efficient use of clean, safe and competitively priced energy and manage energy liabilities GPOWER NGO’s energy policy focuses on delivering clean, safe and secure energy access. Through its technical partner and under the REA-model, GPOWER NGO secures the development of in-house products like: turbines; control units; distribution equipment; substations and transformers.
SO 5: Ensure the created REA company acts as an effective and intelligent asset governor Through its Shareholders Executive, GPOWER NGO manages the realized REA assets and provides a source of excellent corporate finance expertise for public policies on a local level.
SO 6: Investment towards the realization of assets under the Energy Program
Table 5: Investment prognosis; SO-investments and realization of generation- and distribution facilities
Capital Departmental Expenditure Limit Summary (Euro x 1000)
2007-08
2008-09
2009-10
2010-14
2014-16
Baseline Plans New investment 186 108 545 3,101 3,098
Figure 2: 2011-14 REA Investment/ SO

255
PROCEEDINGS Conference MPDES 2011
Methods
Interviews with Co-founders of Gpower NGO Kenya In collaboration with Gpower co-founder Stephen NyagaNdiga and the UQAM evaluation team, the data and status quo of the REA-model activities were extracted through data assessment on financial-, legal- and administrative structures during the October and November 2010.
Interviews with farmer stakeholder representatives and -shareholders During the month of October 2010, we held seven farmer representative stakeholder meetings wherein model consensus was evaluated. During these meetings the following key denominators were discussed: - Energy access/ demand; - Isolation of capital under the REA model; - Investment scheme; - Legal structure; - Financial structure; - Administrative structure
Data assessment of 3200 household randomized evaluation questionnaires by the UQAM University In collaboration with its Kirinyaga Research office (KRO), this paper is supported through data extraction from a randomized evaluation study that analyses the impact of energy access within the target region.
Project status assessment Through onsite assessments, asset development under the Energy program has been recorded and incorporated in the overall financial projections, implementation scheme investment potential and design of strategic objectives (SO’s).
Stakeholder investments Through the REA administrative- and finance systems, this paper extracted farmer stakeholder data through: - In-kind contributions; - Financial contributions; - Labour contributions; - Land contributions.
Results
Positive impact on collective responsibility, employment, health and education through the implementation of socio-economic transition strategies The vision of access to asset capital through the Energy concept integrates a shared hierarchical division of wealth and power between communities in Kirinyaga District. The bottom-up organizational structure ensures community participation through democratically elected representatives that uphold- and challenge transparency,
accountability and responsibility. The REA-model integrates a total of 165 elected representatives and officials that translate capital accumulation through the energy concept.
Through the REA spatial planning initiative, the model creates a universal value consensus that addresses the functional prerequisites of the overall targeted population. Isolation of capital that ensures access rights to energy, -education, -health and -credit markets determine the long term visionary approach and necessity of multi-level participation.
The multi-level approach of REA-asset isolation secures regional autonomy through integration of economic interdependency structures that link monetary channels through a human network. Cross investments by neighboring farmer communities ensure model development and social integration.
The broad spectrum poverty alleviation approach integrates ten thousand households, interlinking these through asset creation- and maintenance participation programs that secure Third sector socio- economic transitions.
Increase in the demand for centralized governance of collective - and in the REA case - public assets; stakeholders have developed a unique long-term collaboration framework through the realization of legal- administrative- and financial structures The REA- model is customized upon local governance traditions that institutionalize board resolutions into its organizational- and subsequent agreement structures. Since the initiation of the REA initiative in 2004, each Holding Ltd. has been responsible for the isolation of their local energy assets.
Since initiative execution and in collaboration with Linklaters NY, its local legal counsel and through representative participation, Gpower NGO managed to develop the constitutional frameworks and ensure multi-level participation towards the development of socio-economic functional prerequisites of the targeted population.
In collaboration with the REA representatives, board resolutions have paved the way for REA interdependency agreement structures and long term vision integration. REA agreement policies include: - Cross investment schemes; - Asset security schemes; - Capital accumulation schemes.
The REA legal framework integrates Third sector development initiatives that are built upon spatial planning and regional cohesion.
The generation of assets through the provision of access to energy for domestic use has been a preference factor throughout the REA-model project area Since initiation and in contrast to conventional energy development schemes, the REA model integrates a human network and builds upon risk mitigation strategies that ensure capital accumulation through local ownership.

256
PROCEEDINGS Conference MPDES 2011
Domestic household expenditures on alternative energy sources maintain the primary target of Gpower’s REA capital isolation vision. Energy investment prognoses have been designed upon monthly household expenditures and regional population densities.
Under its energy concept, the REA model integrates capital accumulation programs through 300KW/ 1000HH-network projects. Capital governance autonomy is represented by energy assets that are collectively owned by network area investors.
Asset- and human network expansion is driven by a competitive structure that translates overall transparency, accountability and responsibility. Cross-investments and asset allocation ensure asset expansion and translate the model’s competitive nature.
The REA model potentially isolates assets as high as thirty million Euro for a collective group of ten thousand households Through its asset expansion strategy, the REA model isolates capital under: - 10.000HH network; - 1.8 MW generation facility; - Ten 300KW generation facilities; - Ten processing factories.
Over the past four years, the REA Company managed
to isolate a total of Euro 850,000 on assets and through completion of two 100KW generation plants, three additional 300KW hydraulic structures and a 275HH isolated grid.
Asset expansion prognoses for the year 2011/12 include: - Three additional150KW generation installations; - 800HH network expansion.
Integration of gender- and youth programs secure social harmony Under the REA model, gender- and youth specific programs are integrated in order to ensure asset expansion through risk mitigation strategies.
Although female gender and youth participation have been integrated within the energy asset accumulation concept, this program largely represents the male gender.
Supplementary to the energy program, females have been organized under a supermarket initiative that is responsible for centralized supply of household consumables for stakeholders. In collaboration with UQAM evaluation team, a HH-consumption survey was undertaken in order to assess stock- and turn-over projections. Asset creation under the initiative secures investment returns of stakeholder energy equity purchase.
The supermarket initiative is registered under a commercial venture and REA stakeholders invest in order to expand on assets and in return, gain access to loan security schemes for REA-energy equity purchase.
Data extraction from the UQAM randomized evaluation questionnaire indicated that gender specific risk mitigation programs maintain a necessity towards the success of REA program implementation.
In addition, the REA-model ensures youth participation through research- and development programs. UQAM University has selected and trained research assistants that are responsible for household interviews and data entry. In addition, the program is exploring commercial ventures under a commercial water bottling- and bakery scheme.
Educational institutions established under the REA maintenance and operation programmes secure long term sustainability Sustainable asset accumulation and –expansion under the REA spatial planning requests for labor specialization at all levels of the organizational structure. Through partnerships with academic partners, REA operation- and maintenance expertise development secures commercial- and social stability within the target region.
In collaboration with UQAM, Mc-Gill University, University College of Utrecht, Technical University of Berlin and Reiner Lemoine Institute, the REA model is supported through internship programs that implement output specific training.
In collaboration with the local Polytechnic Institute, a hydro-power maintenance- and operation course has been developed and currently, a team of thirteen students are undertaking the training.
The training institute has been registered under a commercial venture and REA stakeholders invest into course development in order to create the necessary foundations for the development of its REA-education concept.
Discussion Generation and mobilization of capital under a social market economy seems only feasible under an ethical financial governance strategy where capital is regulated through a transparent system. The REA bottom up approach ensures the necessity of transparent systems that translate- and monitor collective interests and investments.
Through the REA-program, access to the potential of assets within the target region is translated through Third sector spatial- and economic planning. The model builds upon region integration of collective capital structures that secure harmonious socio-economic transitions of living standards and opportunities.
In contrast to the market economy model, this initiative seeks to build upon economic planning that integrates state support and -participation towards the development of public-private ventures.
In order to secure harmonious socio-economic transitions, spatial development and economic planning is considered to be the best approach to capitalize on assets and expand on alternative business opportunities. The model develops a public-private sector opportunity to influence land use planning including rural planning, regional planning and environmental planning.
In addition, the model supports broad spectrum socio-economic transitions that influence education-, employment- and health development schemes.

257
PROCEEDINGS Conference MPDES 2011
References Aligula E.M., Nyanjom, O., Owegi, F.O., &Mutua, J.M.
(2006).Decentralized funds.Study in Kenya, Nairobi, Kenya: KIPPRA Special Report.
Barnes, D. & Floor, W.M. (1996). Rural energy in developing countries: A challengefor economic development. Annual Review of Energy and Environment 21, (pp.497–530)
Barnes, D. & Foley, G. (2004). Rural electrification in the developing world: Asummary of lessons from successful programs. Washington, DC:UNDP/World Bank.
Barnes, D., William, H.F. &Krutilla, K. (2005). The urban household energytransition: Social and environmental impacts in the developing world.Washington,DC: Resources for the Future.
Covindassamy, M. A., Oda, D.& Zhang, Y. (2005). Analysis of power projects withprivate participation under stress. ESMAP Report number 311/05. Washington, DC:World Bank.
De Gouvello C. &Durix, L. (2008).Maximizing the productive uses of electricity toincrease the impact of rural electrification programs: An operational methodology.ESMAP Report Number 322/08. Washington, DC: World Bank.
Eberhard, A. &Gratwick, K. (2005).The Kenyan IPP experience.program on energyand sustainable development.Working Paper No. 49. Center for EnvironmentalScience and Policy, Stanford: Stanford University.
Energy Sector Management Assistance Programme (ESMAP). (2000a). Reducing the
cost of grid extension for rural electrification. ESMAP Report No. 227/00.Washington, DC: World Bank.
Energy Sector Management Assistance Programme (ESMAP). (2000b). Energyservices for the world’s poor. [ESMAP Report No. 227/00]. Washington, DC: World
Bank. Estache, A., Wodon, Q. & Foster, V. (2002).Accounting for
poverty in infrastructurereform: Learning from Latin America’s experience. Washington, DC: World Bank
Fankhauser, S. & Tepic, S. (2005). Can poor consumers pay for energy and water? Anaffordability analysis for transition countries.Working Paper Number 92. London:
European Bank for Reconstruction and Development. Foster, V. &Yepes, T. (2006).Is cost a feasible objective for
water and electricity?The Latin American experience.World Bank Policy Research Working paper.WPS3943. Washington, DC: World Bank (pp.35/38).
Gustavsson, M. &Ellegard, A. (2004).The impact of solar home systems on rurallivelihoods: Experiences from the Nyimba energy service company in Zambia.
Renewable energy, GTZ Eastern Africa. International Energy Agency (IEA), 2000. Energy and
Poverty In: World Energy. Available from:http://www.iea.org/textbase/nppdf/free/2002/energy_poverty.pdf]
Jadresic, A. (2000). Promoting private investment in rural electrification- The case ofChile. Private Sector and Infrastructure Network Note number 214. Washington, DC:World Bank.
Kammen, D. M. &Kirubi, C. (2008).Poverty, energy, and resource use in developingcountries: Focus on Africa. Annals New York academic of science, (pp. 348-357).
Karikezi, S., Kimani, J. &Amenya, S. (2004). The potential of renewables inelectrifying the poor in East Africa. Nairobi, Kenya: AFREPREN/FWD. Available from: http://www.afrepren.org/project/gnesd/conferen.pdf
Kebede, B. (2006). Energy subsidies and costs in urban Ethiopia: The cases ofkerosene and electricity.Renewable energy, volume 31, (pp. 2140-2151).
Kenya Integrated Household Budget Survey (KIHBS) (2007). Volume 1 basic report,2005/06. Nairobi, Kenya: Ministry of Planning and National Development (MoPND). (pp.36/38).
Kenya National Bureau of Statistics (KNBS), (2000).Household energy consumptionsurvey. Nairobi, Kenya: KNBS. Available from: http://www.cbs.go.ke/
Kenya Power & Lighting Company (KPLC) (2002). Annual report 2002-2003.Nairobi, Kenya: KPLC.
Kenya Power & Lighting Company (KPLC) (2006). Annual report 2005-2006.Nairobi, Kenya: KPLC.
Komives, K., Foster, V., Halpern, J. & Quentin, W. (2005). Water, electricity and thepoor: Who benefits from utility subsidies? Washington, DC: World Bank.
Ledgerwood, J. (1999). Microfinance handbook: an institutional and financialperspective.Washington, DC: World Bank.
Maher, P., Smith, N.P.A, & Williams A.A. (2003).Assessment of pico hydro as an
option for off-grid electrification in Kenya.Renewable energy.
Miller, A. &Martinot, E. (2001).The GEF: Financing and regulatory support for clean
energy. Natural resources and environment. Ministry of Energy (MoE) (2002).Study of Kenya’s Energy
Demand, Supply andPolicy Strategy for Households, Small Scale Industries and Service Establishments. Final Report, Nairobi: KAMFOR Company Limited.
Munaita, P. (2008). Bulk Tariff is the lifeline for power produce. Business DailyAfrica. 05 September

258
PROCEEDINGS Conference MPDES 2011
Developing Microfinance Models to Facilitate Adoption of Biogas Systems in Rural Northwest China
PlaNet Finance Gabrielle Harris
Room 2508 Building 5, 1 XiangHeYuan Road, Dongcheng District, Beijing, China www.planetfinancechina.org
Abstract This paper discusses a successful means of increasing low-income populations’ access to renewable energy technology. Actions included the tailoring of micro-credits to the needs of low-income investors in biogas, the development of systems to assure long-term and efficient use of the technology, and the integration of more comprehensive trainings which increase awareness on the system’s requirements for year-long operations especially during the cold winters of Northwest China. Keywords: microcredit; biogas, China, renewable energy
Problem, background, challenge of the project
In order to accelerate the adoption of biogas systems, the Chinese government provides subsidies for rural farmers. During the project period, subsidies for biogas systems were RMB 1,5001 per household, leaving the household with a responsibility to produce RMB 2,000 during a relatively low-cash time of the year - a significant challenge for many families. Furthermore, due to inadequate, rote-style training and lack of user feedback loops, the long-term utilization rates of the biogas installations are low. Utilization and efficiency rates are also affected by the cold winter temperatures which stop the fermentation process of the biogas systems.
PlaNet Finance worked with a local microfinance institution, the local government, and other supporting agencies such as the Energy Office to design a microfinance program which allowed households to apply for an RMB 2,000 loan to help offset the initial construction costs. The project also challenged the traditional methods of trainings through the introduction of more dynamic trainings for both users and providers, and the implementation of a feedback loop to increase communication flow between user and provider.
PlaNet Finance China has been working in China since 2003 and specifically in Gansu since 2005. PlaNet Finance China is the Beijing representative office of PlaNet Finance, an international non-profit microfinance organization based in Paris. PlaNet Finance offers a wide range of expertise to various actors in the microfinance sector in China, all with the goal of accelerating poverty alleviation and promoting sustainable social, economic, and environmental development. As such, many projects also address the health, education, and environment related challenges that often accompany development.
1 EUR 1 = RMB 9.12
Approach PlaNet Finance observed the traditional manner of biogas training and noted the barriers that hindered parts of the poverty-stricken population from adopting renewable energy technology. After gap analysis, PlaNet Finance worked with the local Energy Office to introduce more effective, participatory trainings and also to introduce the benefits and structure of a feedback loop which would utilize the loan officer who would be responsible for passing along any of the farmers’ emerging questions or issues with their systems. PlaNet Finance simultaneously worked with local government agencies and the local microfinance institution to design micro-loans that would enable farmers to access financing for the renovations to cold-proof their digesters.
Particular attention was paid to the capacity building of the local institutions, specifically the microfinance institution, which had never previously provided non-income generating loan products. Between March 2008 and October 2009, PlaNet Finance conducted six trainings for the project’s loan officers who were instrumental in the development of a feedback system. PlaNet Finance also initiated greater communications between the local Energy Office, the government agencies, and the microfinance institution.
Over the course of two years, 430 loans were disbursed, allowing farming households to not only access biogas technology, but also to access the financing necessary to assure appropriately constructed and functioning systems.
Lessons learned Fully functioning biogas systems provide rural households with significant improvements in the standard of living including: greater household sanitation, greater convenience in meal preparation, decreased need to purchase chemical fertilizer due to the system’s generation of organic fertilizer, increased soil health (in terms of organic matter content, humidity retention, nutrient recycling) leading to improved agricultural yields. However, in order for these advantages to be fully realized by the households and for the benefits of the government subsidy to reach the target populations, it is crucial to develop: Better access to financing Innovative channels for communication and Timely information exchanges between users and
providers Dynamic training programs whic hhelp to promote
the farmers’ thorough understanding of biogas systems construction and maintenance

259
PROCEEDINGS Conference MPDES 2011
PlaNet Finance concludes that there is great potential to promote sustainable development through the integration of microfinance and renewable energy technologies. The result of such a combination is found to be mutually beneficial. The microfinance services enable access to the renewable energy technology and, with a properly implemented feedback loop, the loan officer can provide a measure of security which assures continued, efficient use of the technology. The renewable energy technology positively impacts the household’s ability to live with greater physical, social, environmental, and economic health -- thereby allowing them to better utilize their natural assets and foster the development of the local economy.
Research demands PlaNet Finance is continuing to explore the use of microfinance as a platform for increasing low-income rural populations’ access to renewable energy technologies. To increase the ability to measure impact of biogas digestors, PlaNet Finance is interested in studies involving the measurement of kitchen and household air-quality pre and post biogas system installation.
PlaNet Finance is also especially interested in expanding loan products to include other affordable, small-scale renewable energy technologies that can decrease the heavy dependence on coal which is a main source of heat in the winter. Other studies and initiatives which combine microfinance investment loans with renewable energy technology adoption are particularly welcomed.

260
PROCEEDINGS Conference MPDES 2011
Microfinancing decentralized solar energy systems in India: Experiences of rural banks and the way forward
National Bank for Agriculture and Rural Development (NABARD)
Satish Pillarisetti 54, Wellesley Road, Shivajinagar, Pune-411 005, India
www.nabard.org [email protected]
Abstract
The microfinancing scheme for solar home lighting system introduced by rural banks in India turned out to be a huge success. It has added substantially to the off grid power generation in the country. The scheme had positive outcomes for the families in the fields of education and health. It has also led to overall improvement in quality of life for the users of this alternative power. Having learnt from this programme, the government is envisaging upscaling it through subsidy linked bank credit. Keywords: microfinancing; solar home lighting
Problem, background, challenge of the project
As per the 2001 census, in India nearly 700 million people do not have access to modern energy services. While 300 million people do not have access to electricity, an even larger number (625 million) do not have access to modern cooking fuels. Added to that, the peak demand (in 2008) was 120 gigawatts of power, while only 98 gigawatts could be supplied. Further, there is a recurring problem of power shortage and in many rural areas power outages range from 6 to 18 hours per day, with most part of the night in the rural areas being enveloped in darkness. People have to use kerosene lamps for lighting their homes, which are harmful to health and are not cost effective This implies that energy supply to a vast multitude of people couldn’t be accomplished by conventional electricity supply mechanisms. An alternative system had to be evolved.
Approach In India regional rural banks, which are state owned, cater the credit needs of rural populations. Their major loan portfolio is for agriculture and rural micro-enterprises. These banks provide short term and long-term investment loans for agriculture, loans for small and microenterprises and small traders, a large part of which are collateral free. In 2006, Aryavart Gramin Bank- a rural bank in north Indian state of Uttar Pradesh - introduced the scheme of financing solar home lighting systems in rural areas for homes, small businesses and microenterprises. The bank has designed the project as a medium term loan repayable in 5 to 7 years. It negotiated with a firm manufacturing the solar home lighting systems to reduce the market price. The cost per unit was $ 323, of which 15 percent was borrower’s stake and the balance was sanctioned as bank loan. The system consists of 30 watt Solar Photovoltaic Panel, Tubular Batteries, Luminaires and MCR Charge Controller. The system energises two 9-watt CFL bulbs (for a minimum of 5 hours), one DC table fan,
one black and white TV and one mobile charger. The bank was also aware of the fact that there has to be a mechanism for the maintenance of the system once it is installed and this has to be in a cost effective manner. To ensure this, it introduced a system of 'Business Facilitators', wherein the Branch Manager identifies a local youth interested in community welfare, who is trained by the company/ dealer and is provided with a kit to maintain the system. The bank pays him $ 223 per annum. This arrangement has proved to be extremely satisfactory for both the customer as well as the bank. Each facilitator maintains and services 100 systems. This ensured the continuous operation of the devices. The bank also realized that for a novel and innovative idea, 'seeing is believing' and it ensured that at least one unit was installed in each village so that there will be local level sensitization of the scheme. In addition, the bank had organised a number of credit camps for financing the solar home lighting system and at each camp, more than 1,000 loans got sanctioned. To popularise the scheme, it organised workshops for increasing awareness and familiarisation. The Farmers' Clubs existing in the villages in the service area of the bank were used in a big way to popularise the scheme.
As the project was a success and the apex bank for rural development - the National Bank for Agriculture and Rural Development (NABARD) - mainstreamed its adoption by all rural banks. Further to set up model units for demonstration and popularization it introduced a scheme of subsidizing 50 percent of the cost. The strategy of NABARD was to popularise the scheme among the rural communities and to involve the stakeholders in educating the people for the optimum utilization of solar energy to ease out their power problems. In 2009, the scheme proposed by NABARD has been emulated by another rural bank Wainganga-Krishna Gramin Bank (WKGB) in the state of Maharashtra. 20 units were installed as a demonstration pilot project in a village in Bhandara district, wherein 50 percent of the costs were subsidized by NABARD and the balance was given as a loan by the bank. After this pilot project six other pilots were taken up by this bank in three other districts. These pilots helped in popularizing the solar lighting systems in those and surrounding villages. The financing scheme started by Aryavart Gramin Bank has now reached a level of 30,000 units and has been picked up by other rural banks in northern India, while the demonstration pilot project started by WKGB has reached a level of around 700 units within a period of one year
This implementation of the financing scheme was studied in 5 sample villages each in the states of Uttar Pradesh and Maharashtra. Ten borrowers were

261
PROCEEDINGS Conference MPDES 2011
deliberately selected in each of the villages. The cost-benefit analysis for the borrowers indicates that for the total loan period of 7 years, factoring in the cost of battery replacement after 4 years and interest cost of the loan the solar home lighting system costs a total of $ 495, whereas for the 7 year period the cost of kerosene works out to $ 878 based on the present level of average consumption and cost of kerosene. The monthly expenses on kerosene at the rate of 10 litres per day works out to $ 10.50 per day. This implies that the borrower is able to recoup the loan amount in the first 4 years of the loan. Though the credit is not directly income generating, it is being compensated by savings on kerosene so there is no financial outgo from the borrowers’ families. The financing scheme has turned out to be a profitable business proposition for the rural banks, as they could expand their loan portfolio substantially through this lending. However it forms only 4.47 % of the total loan portfolio of Aryavart Gramin Bank and as such the portfolio risk is minimal.
The first outcome of this programme is in education. It has enabled the children to pursue their studies uninterrupted by power cuts. The data indicates that in Uttar Pradesh the average academic performance improved by 15 percent whereas in Maharashtra it improved by 12 percent concerning children from families that have installed the solar home lighting system. The second benefit were reduced health costs, due to the absence of kerosene fumes in the house. In UP the average reduction in health costs per annum was 20 percent, whereas in Maharashtra it was 17 percent. Secondly, it was observed that in both states together an average of 25 percent of the lighting systems were installed by small retail businesses in the villages which were basically of the home-cum-shop type. The average annual sales turnover of these small businesses increased by 28 percent in UP and 24 percent in Maharashtra. The majority of families, which are using these systems, are those of marginal and small farmers and petty traders. The benefits for the rural families in terms of a better illuminated household, absence of poisonous fumes from kerosene lamps, access to a fan in summer periods and access to a television as a source of information, communication and entertainment as well as the facility to charge their mobile phones may not be easily quantifiable in financial terms, but the qualitative results can be noticed in these villages. The benefits of Solar Home Lighting Systems in these villages are in terms of productivity through sufficient light to do household chores, local youth getting partial employment, in terms of education by enabling children to study in nights, television bringing people closer to national and international events and in terms of environment by being a system easy to handle, maintenance free, pollution free and absence of fear of fire or burns. Already 300,000 litres of kerosene are being saved annually, 200,000 villagers have benefited and 1.5 megawatts of off-grid power capacity have been generated.
Lessons learned The results indicate that the scheme of financing decentralized solar home lighting system has been a success in the limited areas of both states in which they were introduced. The financial outcomes were positive both for the borrowers and the banks. Improvements in health and education were also observed. In conclusion we may state that such schemes for microfinancing decentralized solar energy systems are the only solutions for an inclusive energy growth in a country like India. However there is an urgent need for upscaling and further mainstreaming such initiatives. As an outcome of the intervention by rural banks, NABARD and the Ministry of New and Renewable Energy, Government of India have worked out a major credit linked programme. This programme envisages a capital subsidy of 30 percent and at a subsidized interest rate of 5 percent for the solar home lighting system. Banks can take refinance from NABARD at a low rate of 2 percent. The focus of the programme is on promoting off-grid solar energy systems to meet and supplement lighting, electricity/power, heating and cooling energy requirements. The need was also felt at this juncture to standardize the systems and short list the suppliers meeting the standards. Solar manufacturers have submitted an expression of interest to participate in the credit linked subsidy scheme. After due diligence, 22 manufacturers meeting the standards set under the guidelines of the scheme have been short listed and 11 models of solar home lighting systems have been identified for soft loans and capital subsidy. A network of business facilitators such as youth wishing to make a living through this scheme need to be developed. Appropriate training in the installation and maintenance of the systems should be provided to them by the manufacturers and dealers. The compensation to these facilitators should be appropriate. This programme has just been launched and it is hoped that it will result in the production of at least 200 mega watts of off-grid solar power in the country by 2013. This scheme has its objective to establish India as a global leader in solar energy usage, promote off-grid applications of solar energy, to create a paradigm shift needed for commoditization of off-grid solar applications and to encourage replacement of non-renewable sources with solar energy
Research demands The outcomes of the scheme can be studied in a more comprehensive manner with larger data sets, covering a longer time frame, which was not possible in the present study. At the present stage the technology is taken as given, however, it would be worthwhile for the installed systems to be studied for their performance and utility after a period of, say, 5 years. As the life of the unit is stated as 15 years, mechanisms for disposal are not explicit at this stage. This is an area for further study.
(Note: The outstanding loan portfolio of regional rural banks is more
than 4 times that of microfinance companies which are in a problematic position in India due to their methodologies of working.)

262
PROCEEDINGS Conference MPDES 2011
Energy Access for Climate Change Mitigation and Adaptation: The ‘Micro Renewable’ Solution
Carbon Finance and Technology Solutions (CFTS), Emergent Ventures India Pvt. Ltd., Gurgaon, India Ankit Kumar
Abstract Energy and its access have been the principal driving forces behind development. While energy access has accelerated development, the traditional paths of achieving it have created the crisis of climate change. This makes energy and its access the principal factors defining our response to climate change. Most parts of the world are seeing a rapid increase in population. Providing energy to this population will involve extensive use of fossil fuels leading to large quantity of green house gas (GHG) emissions, which will augment the crisis of climate change. Thus, the path that we chose for development will be highly critical for climate change mitigation. The countries and regions with higher poverty, lower levels of human development, and lesser energy access will have fewer options and lower adaptive capacity.1 It has also been documented that countries with high level of per capita electricity consumption perform better both economically and socially. It can be inferred that access to energy plays a defining role in adaptation to climate change. Ironically, the historic path of attaining energy access through fossil fuel use augments the problem. However, renewable energy emerges as a solution that can help in providing wider energy access at the same time avoiding GHG emissions. The solution for loss of precious energy in long distance transmission and distribution can be found in micro renewable energy. Micro renewable energy can not only bring a balance between climate change mitigation and adaptation but also save energy otherwise lost in transmission and distribution. Keywords: Microgeneration; Microenergy; Renewable energy; Mitigation; Adaptation
Introduction Climate change has emerged as the single largest problem being faced by the world today. While the climate has always varied naturally, evidences now point towards a new kind of change which is largely attributed to anthropogenic activities. Man due to his indiscriminate use of fossil fuels, deforestation and land use change has emitted large quantities of green house gases (GHG) into the atmosphere. This has led to disturbance in the critical balance of atmosphere, the result being an increase in global temperatures and change in climatic patterns.
Fig 1 reveals that at 26%, energy supply accounts for the largest share of global green house gas (GHG)
1 CCCD (2009). Energy Access, Climate and Development, Stockholm: Commission on Climate Change and Development
emissions.2 Thus, making the energy sector sustainable is one of the keys to climate change mitigation.
It has now also been established that this changes in global climate will lead to severe impacts like sea level rise, change in cropping patterns, floods, droughts etc. As a whole climate change will have an overshadowing impact on people, economies and ecosystems.3 Hence, now equal emphasis is being put on both on climate change mitigation and adaptation. Development and adaptation are closely linked. Development increases the resilience and adaptive capacities of the people. It has been documented that countries which possess a high level of per capita electricity consumption rank higher in both GDP per capita as well as HDI.4
Figure 1: Percentage GHG contribution of various sectors (IPCC 2007)
Hence, it can be said that energy and its access form a nexus between climate change mitigation and adaptation. Energy and the pathways to its access can work both ways to implement our agenda of climate 2 IPCC (2007). Technical Summary: Contribution of Working Group III to the Fourth Assessment Report of the Intergovernmental Panel on Climate Change, Inter Governmental Panel on Climate Change Secretariat, Cambridge, U.K: Cambridge University Press IPCC (2001). Climate change 2001: synthesis report, Intergovernmental Panel on Climate Change Secretariat, Cambridge, UK: Cambridge University Press 3 UNFCCC (2005). Caring for climate 2005 - A guide to the Climate Change Convention and the Kyoto Protocol, Bonn: United Nations Convention on Climate Change 4 Kanagawa, M., & Nakata, T. (2008). Assessment of access to electricity and the socio-economic impacts in rural areas of developing countries, Energy Policy, 36, 2016–2029

263
PROCEEDINGS Conference MPDES 2011
change mitigation and adaptation. Novel solutions which can bring a balance between mitigation and adaptation need to be found and evaluated. ‘Micro renewable energy’ (MRE) could be one such solution.
Electricity generation by individual households (known as microgeneration) is attracting an increasing amount of interest within the government, industry and the research community.5 Microgeneration can also be understood as generation of energy at a very small scale in decentralised manner. The terms microgeneration or microenergy can be alternatively used. Also, the already widely used term, decentralised energy can be modified into micro decentralised energy (MDE) and be alternated with microgeneration. The term micro renewables or micro renewable energy (MRE) emerges from the use of renewable energy in microgeneration or micro decentralised energy.
Research Objectives As discussed above, energy and its access are the principal factors defining our response to climate change. Although energy efficiency also figures prominently in all plans concerning climate change mitigation, it may not be as relevant from the point of view of climate change adaptation. This paper begins with a hypothesis that ‘micro renewables’ or ‘microgeneration through renewable energy’ can fashion the critical balance between climate change mitigation and adaptation by providing clean energy access. The critical research questions being looked at here are: - Can micro renewable energy help in climate change mitigation? - Does micro renewable energy promote the cause of climate change adaptation? - Can this new form of energy foster a balance between the domains of mitigation and adaptation? The objective of this paper is to ponder upon these critical questions and rationalise this hypothesis to evolve it into a theory.
Methods To prove the hypothesis, various sources related to the fields of renewable energy, energy access, microenergy, Millennium Development Goals (MDGs), climate change mitigation and adaptation were studied. The case of UK was studied, where microgeneration is being developed as a possible solution to energy sustenance and climate change mitigation. Also, India was studied as a country where micro generation could provide solutions for wider energy access and climate change adaptation. The study resulted in the arguments presented in the paper, strengthening of the hypothesis and ultimately emergence of a theory. While a study of the relevance of micro renewable sources cannot be complete without an all round view from the perspectives of technology, socio-economic and policy,
5 Watson, J. (2004). Co-provision in sustainable energy systems: The case of microgeneration. Energy Policy, 32, 1981–1990
the present study has been limited to the policy perspective.
Discussions Energy and Development Energy and its access have always been the most prominent factors driving development. Energy has helped in reducing poverty, improving life expectancy, providing livelihood opportunities and improving the overall standard of living. No country in modern times has substantially reduced poverty without a massive increase in its use of commercial energy and/or a shift to more efficient energy sources that provide higher quality energy services.6 Energy services are highly correlated with several key indicators of human development such as infant mortality, illiteracy, life expectancy and fertility as well as the composite Human Development Index. The relationship between energy and development is best illustrated by the fact that the population living below the poverty line in developing countries reduces as we move from a low level of electrification to higher levels.7
Figure 2: Electrification vis-a-vis population below poverty line (Srivastava and Rehman 2005)
The importance of energy for development was also recognised by the Convention on Sustainable Development (CSD) at its ninth session in 2001, when it said that poverty reduction goals, expressed by the Millennium Assembly of the United Nations in 2002, would not be met without increased access to modern energy by the world’s poor8
The World Summit on Sustainable Development’s (WSSD) Plan of Implementation in its poverty eradication chapter urges ‘‘actions and efforts… at all levels to improve access to reliable and affordable energy services for sustainable development sufficient to facilitate the achievement of the Millennium Development Goals, including the goal of halving the 6 UNDP (2005). Energizing the millennium developing goals: A guide to energy’s role in reducing poverty, United Nations Development Programme, New York 7 Srivastava, L., & Rehman, I. H. (2005). Energy for sustainable development in India: Linkages and strategic direction. Energy Policy, 34, 643–654 8 GFSE (2002). Summary of the Third Meeting of the Global Forum on Sustainable Energy: Public-Private Partnerships for Rural Energy Development 27–29 November 2002 Sustainable Developments, 78(1), 1–9

264
PROCEEDINGS Conference MPDES 2011
proportion of people in poverty by 2015, and as a means to generate other important services that mitigate poverty, bearing in mind that access to energy facilitates the eradication of poverty’’
It must also be recognised that while sufficient access to energy has been limited to some parts of the world, the pathway for access of energy is affecting all parts of the world.
Energy and Climate Change Adaptation Climate change will lead to problems like crop failure, increase in the frequency and intensity of natural disasters, and increase in the spread of disease9 thus overall reducing standard of living. This will be more pronounced in some parts of the world than in others.
It is understood that the more exposed a system is to a particular climate stimulus, the greater the system vulnerability; conversely, the greater the adaptive capacity of the system to a given climate event, the lower its vulnerability.10 A relation between development and adaptive capacity has also been established. IPCC observed that, ‘‘the ability to adapt clearly depends on the state of development… underdevelopment fundamentally constrains adaptive capacity, especially because of a lack of resources to hedge against extreme but expected events.’’11 12 Enhancing adaptive capacity, ‘‘involves similar requirements as promotion of sustainable development’’ such as resource access, poverty reduction, increased equity and increased capability to participate in local politics and actions.13 Hence, a nexus between energy development and climate change adaptation emerges
9 IPCC (2001). Adaptation to climate change in the context of sustainable development and equity. In: Smit B, Pilifosova O (eds.), Climate change 2001: impacts, adaptation and vulnerability, contribution of working group II to the third assessment report of the intergovernmental panel on climate change, Intergovernmental Panel on Climate Change Secretariat, Cambridge, UK: Cambridge University Press 10 Smit, B., & Pilifosova O. (2003). From adaptation to adaptive capacity and vulnerability reduction. In: Smith J., Klein R., Huq S. (eds.), Climate change, adaptive capacity, and development. London: Imperial College Press 11 IPCC (2001). Adaptation to climate change in the context of sustainable development and equity. In: Smit B, Pilifosova O (eds.), Climate change 2001: impacts, adaptation and vulnerability, contribution of working group II to the third assessment report of the intergovernmental panel on climate change, Intergovernmental Panel on Climate Change Secretariat, Cambridge, UK: Cambridge University Press 12 Ribot, J. C, Najam, A., & Watson, G. (1996). Climate variation, vulnerability and sustainable development in the semi-arid tropics. In: Ribot J. C., Magalhaes A. R., Panagides S. S, (eds.), Climate variability, climate change and social vulnerability in the semi-arid tropics. Cambridge: Cambridge University Press 13 IPCC (2001). Adaptation to climate change in the context of sustainable development and equity. In: Smit B, Pilifosova O (eds.), Climate change 2001: impacts, adaptation and vulnerability, contribution of working group II to the third assessment report of the intergovernmental panel on climate change, Intergovernmental Panel on Climate Change Secretariat, Cambridge, UK: Cambridge University Press
with energy access reinforcing development and development reinforcing adaptation.
This nexus also tells us that the parts of the world with the least access will be the worst affected by the impacts of climate change as they lack resilience owing to their lack of development stemming from the lack of access to energy. These countries and regions with higher poverty, lower levels of human development, and lesser energy access will have fewer options and lower adaptive capacity.14 This is an evidence of the fact that for adaptation to the problem of climate change, it is critical that we increase the resilience of these parts of the world by promoting development through improved access to energy.
As evident from fig 3, there is a huge discrepancy in the energy consumption levels between the developed and the developing countries as more than two billion people in the world (largely in Latin America, Asia, and Africa) have no access to modern energy supplies.
Figure 3: Energy consumption in developed and developing countries (IEA 2010)
Due to the vital link between energy and development, lack of energy not only has a negative bearing on the livelihoods of people, but also on several other drivers of sustainable development including water, agriculture, and health. This negative impact on such vital elements will have a decisive effect on the resilience of these people. This reiterates the significance of energy access for climate change adaptation.
Energy and Climate Change Mitigation Today most of our energy production is fossil fuel based and centralised. A need for rapid development has led to the establishment of large fossil fuel based power plants supplying power to a land area thousands of kilometres in size. The development of these energy systems has surely helped accelerate development in certain parts of the world. At the same time emissions from large scale, indiscriminate use of fossil fuels in these power plants has led to problems of climate change. Hence, it can be said that Climate Change is a derivative problem of development. 14 CCCD (2009). Energy Access, Climate and Development, Stockholm: Commission on Climate Change and Development

265
PROCEEDINGS Conference MPDES 2011
Energy supply sector is the single largest contributor to global green house gas emissions (fig 1). High energy-demand growth rates in Asia (3.2% per year 1990–2004) are projected to continue and to be met mainly by fossil fuels (high agreement, much evidence). In 2004, globally emissions from power generation and heat supply alone were 12.7 GtCO2-eq (26% of total emissions) including 2.2 GtCO2eq from CH4. In 2030, according to the World Energy Outlook 2006 baseline, these will have increased to 17.7 GtCO2-eq. (high agreement, much evidence).15
Hence we can conclude that reduction in GHG emissions in the energy sector can go a long way in mitigating climate change.
The ‘Micro Renewable’ Solution As discussed in the paper, energy and its access are critical elements for climate change adaptation. Ironically, following the historical path of development and attaining energy access is not only the driver of climate change but also the key to adapt to climate change. To escape this paradox and engender development through increased energy access while avoiding increased GHG emissions, the shift of energy dependence from fossil fuels to renewable energy sources must be achieved. This can be an ideal solution for a country like India which needs to provide energy solution to more than 50% of its population (Urmee et al 2008), still lacking energy access.
Figure 4: Integrated assessment framework for considering anthropogenic climate change (IPCC 2001)
It can be observed from the bottom right box in fig 4 that by selection of correct socio-economic development paths both climate change mitigation and 15 IPCC (2007). Technical Summary: Contribution of Working Group III to the Fourth Assessment Report of the Intergovernmental Panel on Climate Change, Inter Governmental Panel on Climate Change Secretariat, Cambridge, U.K: Cambridge University Press IPCC (2001). Climate change 2001: synthesis report, Intergovernmental Panel on Climate Change Secretariat, Cambridge, UK: Cambridge University Press
adaptation can be reinforced. The socio-economic development paths point towards pathways for economic growth and technology among other things. Thus right technology choices for energy access and economic growth will be the imperative for both climate change mitigation and adaptation.
Renewable energy sources like wind, solar, and biomass can be fashioned and used in a decentralised manner, avoiding the transmission and distribution losses of precious energy. While increasing use of renewable energy will help in avoidance of GHG emissions, their deployment in decentralised manner will save precious energy otherwise lost in transmission and distribution. According to figure 5, the world average for transmission and distribution losses in the year 2007 have been estimated to stand at 8.4% of the total electricity output. This figure rises to a staggering 24.7% for a developing country like India for the same year. This energy currently being wasted, if conserved can cater to many more people currently living in energy poverty.MRE will not only avoid GHG emissions but also provide energy access to the population at large. Thus, sustainable development can be achieved by balancing climate change mitigation and adaption.
Figure 5: Electric power transmission and distribution losses (% of output) (World Bank Data Bank)
United Kingdom (UK) has been one of the leaders in the field of microgeneration and can be studied as a case for better understanding of the microgeneration scenario. UK has defined microgeneration as ‘‘the small-scale production of heat and/or electricity from a low carbon source’’. It has further been defined as anything below 50-100 kW, with most household electricity-supply installations being below 3 kWe; slightly larger for heat-supply.
UK has set a target of 80% reduction in its emissions by 2050 with base year as 1990 (Climate change act 2008). Also, UK has committed itself to the shorter term plan of EU, 20-20-20 which mandates a 20% reduction in green house gas emissions (below 1990 levels) and sourcing 20% energy from renewables by 2020. These are ambitious targets and microenergy is set to play a big role in achieving this target. Microgeration until now does not has a substantial share in the UK’s energy mix but it is being projected that it

266
PROCEEDINGS Conference MPDES 2011
could contribute to as much as 10% by 2020.16 According to the energy saving trust, microgeneration could supply 30-40% of UK electricity demand by 2050.17
It has also been projected that by 2050 microgeneration could help reduce household carbon emissions in UK by 15%.18 Within UK, several examples have already been set in the field of distributed energy systems. Woking Borough Council achieved a 49% reduction in energy consumption and a 77% reduction in CO2 emissions between 1991 and 2004.19
Figure 6: The 'micro renewable' solution for Climate Change Mitigation and Adaptation
India, like most developing countries is trying to make energy accessible to much of its wide spread rural population. Partial success has been achieved but still a huge gap needs to be covered for the country to become energy independent and make much of its population more climate resilient. However, for this to happen some of the current approaches need to be revisited and new paths need to be discovered.
Energy provision in the rural areas of India has become synonymous with extension of the centralised
16 Mott MacDonald (2004). System Integration of Additional Micro-generation, DTI 17 Energy Saving Trust (2005). Potential for Micro-generation, Study and Analysis, Energy Saving Trust 18 ibidem 19 Allen. S. R., Hammond, G. P., & McManus M. C. (2007). Prospects for and barriers to domestic micro generation: A United Kingdom perspective. Applied Energy, 85, 528–544
grid to the villages. Hence, if the grid reaches the village, its energy needs are taken to have been met irrespective of the power or the lack of it in the grid. Though in India, 86.76% villages have been electrified20 only 43.5% of rural households have access to electricity. The centralized grid-based rural electrification programme has been expensive, and due to social considerations, has become a huge financial burden on the electric utilities.21 In such a scenario microgeneration through renewable energy sources could be an effective tool to, on the one hand increase the percentage of households electrified and on the other hand reduce financial burden on the electric utilities.
If we look at the Millennium Development Goals (figure 7), we can say that high quality energy services (not necessarily MRE) are positively associated with development goals. However, as we look at Goal 7 (ensuring environmental sustainability), we can say with some certainty that ‘distributed renewable energy’ or ‘micro renwables’ are the only realistic option. The alternative ‘business-as-usual’ option is extending national power grids and expanding centralized power generation capacity using fossil fuels. This business as usual scenario is not compatible with stabilized atmospheric CO2 concentrations and risks catastrophic climate change (Nakicenovic et al. 1998). Keeping the immediate need of providing energy services and ensuring sustainability in mind one can say that MREs might be the only realistic option. The majority of the world’s population specifically in the developing nations is still rural, geographically dispersed, and generally well-matched to the diffused nature of renewable energy resources.22
20 Government of India (2001). Planning Commission. Annual report on the working of state electricity boards & electricity departments. New Delhi: Government of India, Planning Commission 21 Rehman, I.H., & Bhandari, P., (2002). Rural energy policy and planning: issues and perspective. In: Conference on Rural Energy Transition organized by Centre for Environmental Science and Policy (Stanford) and The Energy and Resources Institute (TERI), 5–7 November 2002, New Delhi. 22 WEC/FAO (1999). The challenge of rural energy poverty in developing countries, London: World Energy Council and Food and Agriculture Organization of the United Nations

267
PROCEEDINGS Conference MPDES 2011
Figure 5: Environment and MDGs (World Bank 2002)
Table 1: Micro renewable energy (MRE) as a solution for mitigation and adaptation
Energy and mitigation or adaptation MRE
Energy sector is the largest contributor to global emissions (Mitigation)
MRE is by definition non fossil fuel source with no permanent GHG emissions
Energy access needs to be provided to a large part of the global population specially in developing countries which are mostly rural in nature and dispersed far and wide (like in India) (Adaptation)
MRE is decentralised in nature and can be ideal for the dispersed rural population
Saving energy lost in transmission and distribution (mitigation)
MRE works at local level and excludes the need to long distance transmission and distribution thus saving precious energy
Concluding our discussion we can say that in case of the energy sector ‘micro renewables’ or micro generation from renewable energy can fit the slot reserved for the pivot which can run the wheels of climate change mitigation and adaptation together. Although a harmony between mitigation and adaptation cannot be considered as the panacea but it is one of the most important requisites and MRE can help achieve it. Considering the justifications presented above we can finish by saying that our hypothesis has been converted into a theory that ‘micro renewables’ or ‘microgeneration through renewable energy’ can fashion the critical balance between climate change mitigation and adaptation by providing clean energy access.

268
PROCEEDINGS Conference MPDES 2011
Solar Lighting Systems Delivery Models for Rural Areas in Developing Countries
Center for Renewable Energy (ZEE), University of Freiburg/ Fraunhofer ISE, Freiburg, Germany Binod Prasad Koirala
[email protected] Brisa Ortiz
KTH Royal Institute of Technology, Stockholm, Sweden Anish Modi
Malaviya National Institute of Technology Jaipur, India Jyotirmay Mathur
Alternative Energy Promotion Center (AEPC), Kathmandu, Nepal Nashib Kafle
Abstract Many rural areas in developing countries will not have electricity access from the central grid for several years to come. Autonomous Solar Lighting Systems (SLS) are attractive and environmentally friendly options for replacing kerosene lamps and providing basic lighting services to such areas. In order to highlight the benefits of these technologies, analysis of reduction in indoor air pollution due to replacement of kerosene lamp by SLS has been carried out. Use of SLS in place of kerosene lamps saves an equivalent of 1341 kg CO2 emissions per annum from each household. If a suitable mechanism is created, this amount of GHG emissions saving could alone be sufficient to finance solar lighting system for rural households. However, these technologies have not reached most of the poor population. In order to guarantee the access of solar lighting to the people at the Base of the Pyramid (BOP), strengths of different organizations working in the rural areas should be combined together to form successful business models. This paper will discuss business models to disseminate such services to needy people. A comparative study of SLS delivery models based on cash, credit, leasing, subsidy and service is performed. In addition, SWOT analysis for each model is employed. Further, Case studies of few projects to elaborate different models are also presented. If suitable business models for its delivery to rural people are considered, solar lighting systems are viable for providing basic lighting needs of rural areas in developing countries.
Keywords: Central Charging Station (CCS); Rural Energy Supply; Solar Lighting Systems (SLS); Base of Pyramid (BOP); Kerosene Lamps.
Introduction Access to electric lighting has become one of the basic needs of modern human civilizations. However, most of the households in the rural areas of developing countries use kerosene lamps to fulfill their basic lighting needs. Although the light output from kerosene lamp is very poor and it has many health related issues, around 1.6 billion people in the world still lack access to electric lighting1
1 IEA (2008). Renewable Energy Services For Developing Countries: Photovoltaic Power System Programs (PVPS),
and are using kerosene lamps to fulfill their lighting requirements. More than 99% of the people without electricity access are living in developing countries, and four out of five such people live in rural areas.2 Centralized utility models established in the developed nations are not economically viable for developing nations. This is the main motivation behind the focus on rural areas of developing countries in this paper. Further, the governments in developing countries have to spend huge amounts of money for subsidizing kerosene price so that it becomes affordable for poor people. This subsidy burden is ever increasing with the price of kerosene. The majority of the people at Base of the Pyramid (BOP) have minimal access to cash. Solar Lighting Systems (SLS) are out of even imaginations for most of these people. Energy poverty is one of the greatest hindrances in development of such areas. Rural people are already spending money on lighting but not necessarily on the healthiest, cleanest and cheapest products and services. This creates a huge market potential for clean and affordable solar lighting systems in rural areas.
Conventional approach of providing lighting to rural populations through extension of central grids has not been very successful due to requirement of heavy investment in grid. Whereas, the latest schemes such as centralized PV plants and residential PV systems have also not been successful due to high initial investment and subsequent maintenance problems.3 There are many challenges of providing electric lighting to the rural households. Often, houses in the villages are scattered,
Report IEA-PVPS T9 -09: 2008. International Energy Agency (IEA). 2 IEA (2004). World Energy Outlook. Chapter 10: Energy and development . Paris, France. International Energy Agency (IEA). 3 Saha H., Muhopadhyay K. and Sensarma B. (1993). Solar PV lanterns with centralized charging system – a new concept for rural lighting in the developing nations. Solar Energy Materials and Solar Cells 31 (pp. 437-446). North-Holland. Elsevier.

269
PROCEEDINGS Conference MPDES 2011
where extension of the grid electricity is neither technically feasible nor economical. Even in the cases when the village has access to grid electricity, there still are a lot of problems in the supply side like low voltages, frequent power cuts, etc. Further, power shortages in the developing countries are very high due to an increasing difference between supply and demand. Utilities have always kept the rural areas in the least priority for the electricity supply. This is one of the reasons for poor quality and regular load shedding in electricity supply in rural areas. This happens particularly at times when the need of electricity for the lighting is the greatest. Even in the electrified villages many poor households are still not connected to the grid because of high fees for electricity connection for their houses and unreliability of the electricity supply. Despite having access to the grid, dependency on kerosene-based lighting has not decreased in such villages.4
Distributed renewable energy systems have already been proven as an effective option for providing basic lighting requirement in different parts of the world.5 Stand-alone systems such as solar home systems (SHS), micro-hydro etc. can be attractive options but because of their high initial investment and continual service requirements, they are not affordable for many villagers.
In order to respond to the lighting needs of large number of poor people, best practices in sustainable financing and implementation of SLS delivery models have to be expanded. It is important to analyze and understand existing SLS delivery models in order to increase institutional capacity of the developing countries to scale up, replicate and mainstream these services to rural people. Recently, a new height is given to lighting service delivery in such remote locations by introduction of innovative business models in the form of “Central Charging Station (CCS)” with renewable energy technologies. This model is implemented in few projects around the world such as solar lantern rental systems in Vietnam, Lighting a Billion Lives (LaBL) project in India; Lighting Africa project etc.
Objectives and Methodology Solar lighting systems though being an attractive solution have not fully reached its full market potential. This paper is aimed to influence the start and scaling up of business activities for SLS focused on people at BOP. The basic objective of this paper is to make comparative study of SLS delivery models based on cash, credit, leasing, subsidy and service so that the suitable models to disseminate such service to the rural people can be identified. First, the benefits of these technologies are highlighted in terms of reduced indoor air pollution and kerosene lamps replacement. Then, the phenomenon for
4 Mahapatra S., Chanakya H.N. and Dasappa S. (2009). Evaluation of various energy devices for domestic lighting in India: Technology, economics and CO2 emissions. Energy for Sustainable Development 13. (pp. 271-279). Elsevier. 5 Green D. (2004). Thailand‟s solar white elephants: an Analysis of 15 years of solar battery charging programmes in northen Thailand. Energy Policy 32. (pp. 747-760). Elsevier
delivery of SLS units is evaluated based on suitable business models by analyzing involved stakeholders and identifying benefits and barriers in terms of SWOT analysis. Comparison is performed based on parameters such as technology, economics and user-friendliness. Along with other case studies, our field experience on delivering SLS and solar lanterns based on White Light Emitting Diodes (WLED) and solar lanterns in the villages of Rajasthan, India is also presented.
Results
Indoor Air Pollution in Rural Areas In rural areas of developing countries fuel woods, cow dung cakes, kerosene etc. are used in the kitchen to cook daily meals. Generally the kitchen exists at the corner of the house without any proper ventilation. In addition to this, kerosene lamps are used for lighting. This results in heavy amount of pollutants such as NOx, CO, particulate matter etc. inside the house. The children and women are the most affected victims of these pollutants and suffer from several health hazards such as nausea, vomiting, headache, cough containing black soot and long term respiratory diseases.
To address this issue, a field measurement was conducted in rural households of Bhojpur village at 70 km distance from Jaipur, Rajasthan (India). The women spent 8-10 hours daily for cooking in the kitchen and children studied under kerosene lamps for 2-4 hours a day. The maximum exposure level of CO went up to 206 ppm, NOx up to 4 ppm and PM up to 1.2 mg/h (or 10 mg/m3). These levels are much higher than what are considered to be the safe threshold limits for indoor air quality which are 70 ppm for CO, 200 μg/m3 (one hr mean) for NO2 and 50 μg/m3 (24-hr mean) for PM10 particles.6
The effect of indoor air pollution from kerosene lighting alone is also very significant. These effects can be minimised to greater extent using solar lighting systems.
GHG Emissions with Kerosene Lighting Solar lighting systems do not only contribute to improving the standard of living in rural areas of the developing countries, but also to reducing greenhouse gas (GHG) emission and dependency from fossil fuels such as kerosene. For typical households, CO2 emissions based on use of kerosene lamps is calculated by (Ortiz, 2005) as presented in Table 1. Corresponding emission factors for kerosene is estimated using carbon content, the density and the percentage of carbon that will be converted in CO2 by combustion. The density of CO2 is 840 kg/m3 and burning rate is 0.05 litre/hr. It is assumed that in average each household uses two kerosene lamps for four hours every day. Thus, each lamp consumes 0.2 liters of kerosene per day. Energy density of kerosene is 12 kWh/kg. CO2 conversion factor for kerosene is 0.2676 kg CO2/kWh. CO2 emission factor is obtained by
6 Mathur J., Modi A. and Subramanyam S. (2008), Improving indoor air quality in rural areas using solar and wind energy, World Renewable Energy Congress X (WREC X). Glasgow. (pp. 284-289).

270
PROCEEDINGS Conference MPDES 2011
product of kerosene density, energy density and CO2 conversion factor. Similarly, amount of other GHGs such as N2O and CH4 emissions from the kerosene lamps can be calculated using the emission factors of 0.087 g/kg and 0.02175 g/kg respectively. These GHGs are even more harmful than CO2 because 1 ton of N2O is equivalent to 21 tons CO2 and 1 ton of CH4 is equivalent to 310 tons of CO2. Equivalent CO2 emissions for a household using two kerosene lamps for a year as calculated by multiplying equivalent CO2 emissions from CO2, N2O and CH4 per day by 350 days per year are obtained equivalent to be 1341 kg-CO2/year.
Table 1: GHGs emissions from a kerosene lamp
Type of GHG
Emission factor (kg GHG/L)
Con-version η (%)
Burning time (liter/hr)
Emission (kg /day)
CO2 N2O CH4
2.61 0.0731 0.0183
95 95 95
0.05 0.05 0.05
0.49 0.014 0.0035
If all the SLS installed in the village or district are
selected this would be sufficient to make the project eligible under Clean Development Mechanism (CDM) to receive additional funding. For example, for a village consisting of 200 households, €5364 per annum can be obtained for offsetting the carbon emissions. The amount received from carbon revenue cannot be able to install the complete system but can be utilized for the operation and maintenance of the solar home system. The upfront cost for developing such a CDM project is high but this would be lesser if the CDM project is developed under the programmatic approach. An amazing 77 billion liters of kerosene is burnt every year in the world emitting 190 million tons of CO2.7 This number will be much higher if N2O and CH4 emissions are also considered. Thus the SLS has a good potential for the CDM project.
Advantages of SLS SLS has many positive impacts over kerosene lamps in the development of rural areas in developing countries. Some of them are mentioned below:
1. Improved lighting 2. Improves health of rural people 3. Reduces indoor air pollutions 4. Decreases greenhouse gases 5. Decreases use of primary energy 6. Decreases fire hazards 7. Contribute to increase literacy rates 8. Enable extended working duration and other
productive activities in rural areas 9. Prevent migrations to cities
7 Mills E. (2005). The Spector of fuel based Lighting. Science 308 (5726), (pp. 1263-1264).
Table 2 presents the comparison between SLS and kerosene lighting89 Table 2: Comparison of SLS with kerosene lighting
Parameter SLS Kerosene Lighting
Capital Cost High Low Operating Cost
Low
Recurring and high
Illumination 4-5 times higher than kerosene lamps
Low
Reparability Poor Good and easy Safety Very safe Fire and health
problems Fuel Cost Nil Recurring,
depends on use
Working Principle
Fluorescence (CFL), solid state lighting (electro-luminescence, LED)
Incandescence (most energy lost in heat)
Subsidy Burden
One time for capital subsidy
Recurring burden
SLS Delivery Models The accessibility of affordable and reliable SLS is very important for rural populations in developing countries. Though considerable amount of money have been invested by the government in the developing countries for lighting rural areas, the benefits has not yet reached to too many poor and needy people. There is a need to restructure the overall approach and go for a market-based mechanism to supply solar lighting systems in remote rural areas. In this respect, the following market based mechanisms have been identified.
Cash Delivery Model In this model, the users buy complete SLS with power supply systems. The ownership of the system transfers to the user automatically upon payment to the system providers and ownership increases the sense of responsibility. Cash sales and cash & carry are two different types of this model. In cash & carry model users are also responsible for installation, operation and maintenance of complete system; whereas in cash sales models the system provider is responsible for installation, which in turn increases the cost of the system. In cash delivery model the system provider needs to invest only small amount of capital, hence the financial risk is low (Reinmüller and Adib, 2001).
8 Chaurey A. and Kandpal T.C. (2009). Solar lanterns for domestic lighting in India: Viability of central charging station model. Energy Policy 37. (pp. 4910-4918). Elsevier. 9 Mahapatra S., Chanakya H.N. and Dasappa S. (2009). Evaluation of various energy devices for domestic lighting in India: Technology, economics and CO2 emissions. Energy for Sustainable Development 13. (pp. 271-279). Elsevier.

271
PROCEEDINGS Conference MPDES 2011
However, there are also some risks associated with this model. Because high quality SLS components are very expensive, many users end up buying low quality components as replacements. Further, because of lack of knowledge and training with the users, the system may be installed incorrectly. The market potential of this model is small as the purchase cost for the complete SLS is rather high as compared to the income of the targeted users. In order to increase the dissemination of this model to the poor people smaller systems with lower price and modular systems with the option of expansion to higher rating as per the requirement, and economic capacity of the user, should be developed. The suppliers in the cities are an example of this model. The users go to the suppliers‟ stores in the city, present their interests and purchase the SLS units accordingly. The SWOT analysis for this model is presented in Table 3 below.
Table 3: SWOT analysis of Cash Delivery Model
Strengths Weaknesses Users are owners. Low financial risk for service provider.
High initial cost and small market potential.
Opportunities Threats Sense of responsibility and carefulness. Smaller low cost system and modular system.
Low quality components as replacements. Operation and maintenance. Theft risks.
Credit Delivery Model A credit is the amount of money lent to a person for a
particular time period and purpose at a specified interest rate. Credit delivery model can be divided into technical and financial parts. The technical parts include the system provider, which is responsible for supplying the SLS unit and their installation, operation and maintenance. The financial parts consist of micro-finance institutions or other financial institutions which are responsible for providing the credit to the users and collecting them in installments. However, these two parts are interlinked with each other. In fact, they operate in close co-operation. The users pay for complete SLS or its component through the money they received as credit from corresponding financial institutions. Installment credits, personal credits and supplier (dealer) credits are different forms of existing credit schemes for the users.10 For example, in this model there are third-party agreements between suppliers, users and micro-finance institutions. The suppliers get the payment for the SLS units sold from the micro-finance institutions. The users have to pay the credit in installments to the micro-finance institutions.
The main benefit of this delivery model is reduced collection risk due to involvement of financial institutions that have already gained expertise in this business.
10 Reinmüller D. & Adib R. (2001). Rural Energy Supply Models (REsuM), Final Report, International Solar Energy Society (ISES).
Further, there is in-direct control from financial institutions providing installment credit to the system provider, so that a quality product is delivered to the end users and the financial institutions gets their investment back without any difficulties. The system providers are also forced to perform regular monitoring and maintenance of the system if needed. This kind of co-operation is also visible in dealer credit schemes as the suppliers might offer basic operation and maintenance support so as to get their investment back.
The difficulties associated with the credit delivery model are problems in identifying the right financial institutions as partner, hesitation of such institutions for investment in solar technologies, which are still young etc. The availability of financial institution in rural areas is also rather low. The SWOT analysis for this model is presented in Table 4 below.
Table 4: SWOT analysis of Credit Delivery Model
Strengths Weaknesses Reduced collection risk. Indirect control for quality products delivery from credit provider.
Problems in identifying suitable financial institutions.
Opportunities Threats Involvement of micro-finance institutions. Regular monitoring.
Low availability of financial institution in rural areas.
Leasing Delivery Model In this model, the system provider allows the users to use complete SLS or some of its components on the condition that they will pay leasing fees at regular intervals. Finance leasing and renting are two different types of this model. In finance leasing ownership of SLS or components can be transferred to user after payment of the residual amount. The system providers, who can be NGOs, aid projects or dealers, are responsible for installation of SLS. Users are responsible for operation and maintenance of the respective units. In renting model, the system provider is owner of complete SLS units or its component and responsible for installation, operation, maintenance and monitoring at regular intervals.11
The system provider is responsible for financing and collection. The implementation of this model is not limited to the rural areas where financial institutions exist. Hence, this model is superior to both cash and credit delivery model in this regard.
However, as the user is operating and maintaining the SLS units which are property of system providers, there is some technical risk associated. Since the staffs that do not have as much expertise as the people from the financial institutions collect regular leasing fees, there exists collection risk too. For example, in CCS users can bring their solar lanterns almost every day and charge it by paying some amount of charging fees. If the solar lanterns
11 Chaurey A. and Kandpal T.C. (2009). Solar lanterns for domestic lighting in India: Viability of central charging station model. Energy Policy 37. (pp. 4910-4918). Elsevier.

272
PROCEEDINGS Conference MPDES 2011
are the property of the service provider, the users have to pay little bit higher charging fees in order to overcome rental fees also. Charging fees should be sufficient enough to recover the capital and operation costs. A monthly or weekly fee for charging the battery is better than fees per charge.12 The SWOT analysis for this model is presented in Table 5 below.
Table 5: SWOT analysis of Leasing Delivery Model
Strengths Weaknesses Suitable for low-income customers.
Need to bring solar lanterns almost every day to charging stations.
Opportunities Threats Not limited to the rural areas where financial institution exists.
Collection risk for rent.
Subsidy Delivery Model The subsidy delivery model has been used for the dissemination of Solar Home System (SHS) in Nepal. The users are provided subsidy under this model for installing the SHS. The subsidy is provided to households for installing SHS of 10-18 Wp, and more. The level of subsidy is determined based on the geographical region and well as on the basis of grid electrification. The remote and very remote villages/districts where the grid electricity has not reached are provided with the higher subsidy whereas the accessible villages/districts receive lesser subsidy for the same system.13
The subsidy is managed by Alternative Energy Promotion Center (nodal agency under Ministry of Environment in Nepal for the promotion of renewable energy technologies). A coordination committee has been formed under AEPC that is responsible for matters related to the implementation, promotion, dissemination, quality assurance and monitoring of solar energy systems.14
The demand of SHS in any particular village/area is collected through the market surveys and field visits. The SHS are installed through the prequalified SHS companies (selected by AEPC based on the quality of the product and service they provide). The users have to install the SHS through pre-qualified companies in order to be eligible for the subsidy. The companies after the installation of the SHS submit the specified application form with the cover letter to AEPC for subsidy disbursement. The committee reviews the application and the subsidy is approved once everything is found to be in order. After approval, certain percent of the subsidy is given to the user through company while certain percentage is retained as guarantee for maintenance
12 Kumar, S., Dung T.Q., Anisuzzaman, M. and Bhattacharya S.C. (2003). Demonstration of multi-purpose battery charging station for rural electrification. Renewable Energy 28. (pp. 2367-2378). Elsevier. 13 AEPC (2009). Subsidy Policy for Renewable (Rural) Energy 2009, www.aepc.gov.np/images/pdf/RE-Subsidy-Policy-2009.pdf 14 AEPC (2010). Renewable (Rural) Energy Subsidy Delivery Mechanism, 2010. www.aepc.gov.np/images/pdf/tasdm2010.pdf
support. This will be released based on the evaluation of maintenance support provided by the company that is conducted annually by independent third party. This will ensure that the companies on a regular basis provide the users with the proper after sales service. The maintenance support surveys also form as the basis of evaluation of the performance and grading of the solar companies. The companies will be disqualified for providing the service if it found that they are not providing maintenance support, found using defective and low quality materials and equipment etc.
This model has been effectively used in Nepal for dissemination of the Solar Home System in the non-electrified and off-grid villages. There are more than 0.2 million SHS installed in the country under this model. The SWOT analysis for this model is presented in Table 6 below.
Table 6: SWOT Analysis of Subsidy Delivery Model
Strengths Weaknesses Suitability to low income and remote areas customers who do not have access to the grid electricity
Dependencies on government, donor agencies for contribution as subsidy. Strong body is needed for the proper management and monitoring of the subsidy.
Opportunities Threats Possibility to cover entire villages. Able to provide the basic lighting to the off grid villages in a lesset time
Operation and maintenance. Subsidy might not reach the needy people if not properly managed and monitored
Service Delivery Model In this model, users pay regular service fees to the system providers. Fee-for-services and energy services are two types of service delivery models. The only difference between these two types is the end product offered to the users. In this model, the system provider is the owner of the complete system. The system provider is also responsible for installation, operation, monitoring and maintenance of the system. Depending on the service, fix service models or consumption dependent service models can be realized. In consumption dependent service models, the system providers install central energy generation units, e.g. PV generators, and customers have to pay according to the amount of electricity they have consumed for solar lighting. The users can also use other appliances by paying higher service charges.15
A service delivery model is a long-term model. The entire concepts, infrastructure, business and financial estimation are modeled for long-term applications. Technical service also has to be of high quality and the
15 Reinmüller D. & Adib R. (2001). Rural Energy Supply Models (REsuM), Final Report, International Solar Energy Society (ISES).

273
PROCEEDINGS Conference MPDES 2011
service fee should be low. This model can have very high market penetration as compared to the other delivery models discussed above. However, solar lighting options are being developed very rapidly with extensive research. The technology that was prevalent few years ago has already become obsolete. Thus, when a system is designed for the long-term, it would not be able to incorporate these technological changes with time. Further, the capital needed to develop such extensive infrastructure is very high. This creates a huge amount of financial risk to the system providers. Energy service companies who are providing electricity service for whole villages are the examples of this model. They operate almost in same principle as the larger utilities companies in the big cities. The SWOT analysis for this model is presented in Table 7 below.
Table 7: SWOT analysis of Service Delivery Model
Strengths Weaknesses Long-term applications. Operation, monitoring and maintenance from the system provider.
High capital requirement. Huge financial risk.
Opportunities Threats Very high market penetration. Productive use of the electricity.
Rapid technological changes. Monopoly.
The above-mentioned models are five basic models. There can be further division to these models. Also, new mixed models can be formed by the combination of two or more of these models. The suitability of any of these models depends largely on cost of SLS units, location, socio-economic factors and electricity needs of the users.
Table 8 presents the comparison of these models based on various characteristics such as ownership, financing methods, installation, operation and maintenance, completion of the system, penetration to the people at BOP etc.16
Table 9 shows the comparison between the leasing and service delivery model approach for Central Charging Stations (CCS).17 .
16 ibidem 17 Chaurey A. and Kandpal T.C. (2009). Solar lanterns for domestic lighting in India: Viability of central charging station model. Energy Policy 37. (pp. 4910-4918). Elsevier.
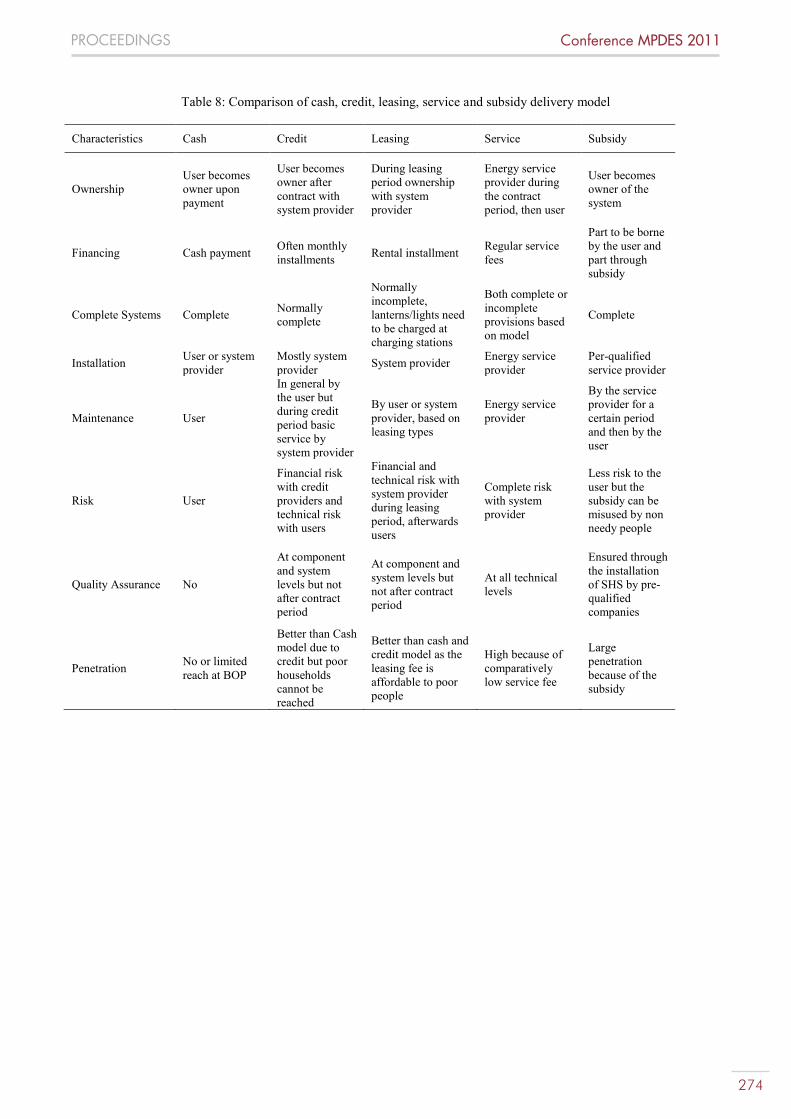
274
PROCEEDINGS Conference MPDES 2011
Table 8: Comparison of cash, credit, leasing, service and subsidy delivery model
Characteristics Cash Credit Leasing Service Subsidy
Ownership User becomes owner upon payment
User becomes owner after contract with system provider
During leasing period ownership with system provider
Energy service provider during the contract period, then user
User becomes owner of the system
Financing Cash payment Often monthly installments Rental installment Regular service
fees
Part to be borne by the user and part through subsidy
Complete Systems Complete Normally complete
Normally incomplete, lanterns/lights need to be charged at charging stations
Both complete or incomplete provisions based on model
Complete
Installation User or system provider
Mostly system provider System provider Energy service
provider Per-qualified service provider
Maintenance User
In general by the user but during credit period basic service by system provider
By user or system provider, based on leasing types
Energy service provider
By the service provider for a certain period and then by the user
Risk User
Financial risk with credit providers and technical risk with users
Financial and technical risk with system provider during leasing period, afterwards users
Complete risk with system provider
Less risk to the user but the subsidy can be misused by non needy people
Quality Assurance No
At component and system levels but not after contract period
At component and system levels but not after contract period
At all technical levels
Ensured through the installation of SHS by pre-qualified companies
Penetration No or limited reach at BOP
Better than Cash model due to credit but poor households cannot be reached
Better than cash and credit model as the leasing fee is affordable to poor people
High because of comparatively low service fee
Large penetration because of the subsidy

275
PROCEEDINGS Conference MPDES 2011
Table 9: Rental vs. Fee-for-Service model for CCS
Leasing (Rental) Service (Fee-for-Service) Entrepreneur: Owns CCS by paying all cost of PV modules, electronics and lanterns Responsible for O&M of all components Keeps all revenues collected from renting the lanterns User: Rents the charged lantern from CCS No O&M costs
Entrepreneur: Owns CCS by paying all cost of PV modules and electronics only Responsible for O&M of PV modules and electronics only Keeps revenues from recharging the lanterns User: Owns the lanterns, get it recharged from CCS O&M of Lanterns
Comparison between SHS and CCS Solar Home System (SHS) is usually designed to provide reliable electricity services to the single household. Typically it consists of solar PV modules, charge controllers, battery bank and DC appliances. SHSs are mainly used to meet the lighting needs of a house Deliveries of SHS units are done generally using cash delivery model. On the other hand Central Charging Stations (CCS) charges solar lanterns and batteries primarily using photovoltaic modules or other renewable energy resources. This concept works on the model of fee-for service or renting .18 Issues such as location of the CCS with respect to users home, affordability of the user to buy batteries and solar lamps, possibility of grid expansion in the near future, other options for electricity generations, demand of the electricity, interest and assistance of the concerned local authorities should be considered before implementation of CCS.19 The users must pay charging or renting fee to the system provider. CCS should be located at a suitable distance for almost all users in the village. Table 10 below presents comparison between SHS and CCS.
18 Chaurey A. and Kandpal T.C. (2009). Solar lanterns for domestic lighting in India: Viability of central charging station model. Energy Policy 37. (pp. 4910-4918). Elsevier. 19 Kumar, S., Dung T.Q., Anisuzzaman, M. and Bhattacharya S.C. (2003). Demonstration of multi-purpose battery charging station for rural electrification. Renewable Energy 28. (pp. 2367-2378). Elsevier.
Table 10: SHS vs. CCS
SHS CCS Autonomy to user to manage its energy consumptions
Service provider renting or charging solar lanterns
Usually owned by user, hence responsible for O&M
Owned by user or service provider, O&M by owner
Designed to service lighting and other small loads
Mainly lighting, occasionally other applications by renting big charged batteries
Use of single or few PV modules
Large numbers of modules
PV modules installed at user‟s home, fear of theft
Installed at CCS premises with security measures
Poor monitoring of the complete system
Better monitoring of the complete system
Not affordable to people with low income
Affordable to people with low income
Case Studies
This section presents our own experience in distribution of various solar lighting systems in rural areas, and provides two other case studies for comparing other delivery models.
Case Study: Field experience in Rajasthan (India) As part of the student project at Malaviya National Institute of Technology, the student teams had certain funds available from Mondialogo Engineering Award (2007, 2009) for the dissemination of solar lighting systems and lanterns to villagers on a discounted price to reduce the indoor environment pollution. This implementation targeted replacing the kerosene lamps that were used otherwise to fulfill the lighting requirements of the villagers. The model adopted is explained below. 1. Salient features: Since students were involved in
project implementation, it was decided to follow the cash delivery model (as it wouldn‟t be possible for students to take full responsibility of maintenance of the lamps later). The project has seen the inclusion of students from four consecutive years which made it possible to maintain the systems to a small extent.
2. Purchasing/distributing the SLS: The solar lighting systems were purchased from reputed suppliers so as to ensure that a quality product reaches the end-users. These products were purchased at their market prices from the suppliers, and later distributed at discounted prices to the villagers. The technical specifications of complete solar lighting systems distributed to the villagers are given in Table 11.
3. Identifying the beneficiaries: As limited fund was available, it was not possible for us to cover many villages, or even a single village entirely. Hence, it was decided to distribute the systems to four or five families each in few nearby villages, rather than providing all systems to families in one particular

276
PROCEEDINGS Conference MPDES 2011
village. This would help in promoting the use of solar based lighting systems to more areas, rather than just one village. The beneficiaries were identified in a very simple manner – the families with more number of children, lesser income and more women spending time inside the houses. Apart from the individual families, few systems were also provided to one of the NGO‟s operating in those areas as they conducted educational classes during the nighttime. As several people from nearby villages attended those classes, it was a good opportunity to introduce more people to such systems.
4. Distribution Model: The systems were distributed and installed by the students involved in the project implementation. The systems were sold to the villagers at 300 Indian Rupees, which was approximately 5% of the incurred price to the students, i.e., the buyers. The difference in the amount was covered by the fund available with us for this purpose. One of the major reasons to charge a small amount to the villagers for the systems was so that they don‟t take these systems for granted and have some sense of responsibility towards them. The villagers were duly educated about operating the systems and how to maintain them in general day-to- day use so as to attain the maximum benefit from the installations. The money thus collected from the
Table 11: Technical Specifications of SLS installed
Components Specifications Small Solar Home System PV Module (Moser Baer) WLED Lights (Solid Solar)
(to 13 households): 10 Wp 2 or 3×2.5 W (1 W on each LEDs and 0.5 W parasitic consumptions per lamp.
Battery (VRLA) & Charge Controllers (Solid Solar)
12 V, 7.2 Ah Standard Circuit
Solar Lanterns ( Tata BP Solar) (to 50 households): PV Module 2 Wp LEDs 100 lumens Battery (SMF) 6 V, 4.5 Ah
Figure 1: Small SHS (WLED lamp, switch, battery and
charge controller circuit)
villagers was put back in the total pool of fund available with us.
5. Maintenance: The maintenance of the systems was primarily left to the villagers. Being a solar-based system, the only maintenance required was to replace the battery when it reaches the end of its usable life, or to replace the LED lamps if some of them stop functioning. However, students, from time to time visited the villages to check if the lights are working properly or not. It was found that most of the systems were working well even after two years of operation. However, a few had small technical problems like loose connections, dead battery etc. These were fixed free of charge for the villagers by the students themselves.
6. Conclusions: The delivery model received immense positive response from the villagers and the demand of such systems became much higher than what was initially expected, mainly because of the very low initial cost. However, the villagers were even ready to pay approximately 20% of the total system cost. A proper maintenance model is very important to make the system self-sustainable. An ideal approach to this would be to train some of the locals to make them capable enough to maintain the systems, and buy replacement parts as and when required. This would also be a source of income to those persons.
The major problem faced was that when some part of the system failed (like LED, battery etc.), the villagers either stopped using the systems completely or they purchased much lower quality of the replacement parts because of the lack of knowledge. Some instances of tampering with the system were also observed. It was therefore felt that for large scale projects the issue of maintenance and availability of spares should be tackled trough preparing local entrepreneurs for maintenance support.
Case Study: SELCO with Credit Delivery Model An example of the Credit Delivery Model is the business model adopted by Solar Electric Light Company (SELCO), India. Their business model is described below.20 1. SELCO’s key features: SELCO creates products
based on end user needs going beyond just being a technology supplier but customizes their products based on individual needs. For installation and after-sales service, dedicated regional energy service centers are created to ensure prompt maintenance and service. Standardized financing packages are available to create channels for end users to afford systems based on their cash flow.
2. Business/Delivery Model: SELCO provides good quality products to its customers and the quality is maintained because of the in-house process of assembling the products. The company also provide a full service network to its customers for installation and after-sales service. The particular difference of their model from other similar organizations is that
20 SELCO. (2010). SELCO Solar Pvt. Ltd. Retrieved February 28, 2011 from www.selco-india.com/about_us.html.

277
PROCEEDINGS Conference MPDES 2011
they also provide finance options and sufficient credit to the potential customers with the help of various financing organizations like rural banks, micro-finance organizations etc.
3. Conclusions: The company is in operation since 1995, hence it can be safely concluded that this modelfunctioning. More than 90% of SELCO customers utilize credit through its financial partners when purchasing systems. Credit terms are based on the credit source and the local situation. Interest rates range from 5% to 14%, and customers typically put between 10-25% down, and pay the balance over three to five years. The major problem that the company faced was to gain the support of the finance organizations in its initial years to fund the end users for purchasing the solar lights.
Case Study: TERI with Leasing and Service Delivery Models An example of mixed type of the Leasing and Service Delivery Models could be the Lighting a Billion Lives (LaBL) program of The Energy and Research Institute (TERI), India. The distribution model is described below.21 1. The LaBL campaign intends to provide a platform on
which socio-economic development of rural communities can take place. The implementation of the campaign rests on strategic partnership with clearly defined roles and responsibilities for each stakeholder at different levels.
2. Key Stakeholders: They include the professionals and advisors who support the campaign through their constant mentoring and guidance, the investors of the campaign, the coordinators the campaign at the local/village level, the product suppliers and energy service companies that undertake design, development, supply, installation, and commissioning of solar lanterns and charging stations, the local entrepreneurs who are responsible for day-to-day operations of the solar lanterns and the charging station and finally the end-users or the rural communities who receive the benefits of the solar lanterns.
3. Delivery Model: The delivery model for the campaign is a fee-for-service model, where solar charging stations are set up in villages for charging the lanterns and providing them on fee-for-service (or rental) basis to households and enterprises on a daily basis. The charging stations are operated and managed by local entrepreneurs who are selected and trained by TERI and other affiliated institutions.
4. Conclusions: The user pays a rental to the entrepreneur for managing and maintaining the charging station that is modeled as a business activity for the entrepreneur. The entrepreneur receives technical training to effectively operate the charging station and better manage the business.
21 TERI. (2010). Lighting a Billion Lives Project, The Energy Research Institute, India. Retreived February 28, 2011 from http://labl.teriin.org.
The campaign links and synergizes the initiatives and commitments of the governments, private sector and donor agencies towards socio-economic development of the communities using lighting as a means for facilitating and advancing their initiatives. Health services, ICT based educational services, water purification services etc. can be provided to the communities by expanding the capacity of the solar charging stations in the future.
Emerging Trends in SLS There has been very rapid progress in research and development of solar lighting technologies. Due to economies of scale, PV panels, lighting bulbs such as CFL and LED lamps, batteries and charge controllers will become less expensive when more units are sold and used. The manufactures will need to increase their production capacity, which in turn will increase employment opportunities.
The prices of the photovoltaic panels and balance of system (BOS) parts are continuously decreasing. The 80% learning curve for PV means module prices decreases by 20% for every doubling of cumulative production.
LED technologies are most promising for SLS. The advancements in LED technologies will bring down the cost per Watt while giving more lumen output per Watt of electricity consumed at the same time, hence bringing down the cost of useful energy from LED.22 This progress will help in reducing the size of the battery required and also the size of the PV panels. Significant and promising research is also happening in the field of battery technologies which will increase sustainability and reliability of the system. These progresses will reduce overall cost of the system and hence will make these technologies more common and popular among rural people.
For SLS, the billions of the people who do not have access to electricity are an opportunity rather than a challenge. This will emerge as a very huge market in the near future.
Discussion Market potential for affordable and sustainable SLS is huge in low-income rural areas in developing countries. If a suitable business model for its delivery to rural people is considered, solar lighting system is viable option for providing basic lighting needs of rural areas in developing countries where the extension of grid cannot be imagined in the near future. These business models assist in eliminating the high cost barrier either by reducing the system components or increasing the accessibility to people at BOP through credits. Further with the mobilization of more SLS units to the rural people the cost of the entire system is expected to be reduced because of the competition and new market with lot of potential is going to be developed. The case studies above show that small and medium sized local firms, domestic
22 Chaurey A. and Kandpal T.C. (2010). Assessment and Evaluation of PV based decentralized rural electrification: An overview. Renewable and Sustainable Energy Reviews 14. (pp. 2266-2278). Elsevier.

278
PROCEEDINGS Conference MPDES 2011
companies and social enterprises are usually more effective in designing and implementing these business models to people at BOP than large firms. Even when large firms are involved, it is important for them to have strong local partners for better market penetration and service. These localized solutions can be both self-sustaining and replicable. The users of SLS should be trained on use of battery, solar lights and other components. Awareness of users on O&M and optimum use of SLS units must be ensured. Local communities should be involved as decision makers and entrepreneurs, not only as users. End-users themselves should be involved in management and running of the solar lighting system to ensure long term sustainability. Components with high quality after the field test should be used to avoid frequent repair and maintenance. Success of SLS delivery models largely depends on effective co-operations between business firms and local government, NGOs, local communities and entrepreneurs. Operating costs will be reduced if local entrepreneurs are involved in SLS business models. This will help to increase access of SLS to population at BOP. Solar charging stations contribute to the development of “business units” that have long term operation schemes strengthening therefore the local development. The substitution of kerosene and the consequently avoidance of CO2 equivalent emissions may look for further mechanisms that reaches people at BOP worldwide.
For most of the rural areas, the most important need in terms of energy after lighting is cooking fuel. The business models discussed above can further be explored to serve this need. This could be done in two ways. The cooking fuels currently used are mainly cow dung cakes and fuel-wood. Thus, a supply system could be established which supplies good quality fuel to the users through proper channels. However, since most of the villagers use locally, and freely available fuel, there are high chances that this business will not work on larger scale. Alternatively, a better solution is to provide improved models for the stoves currently used by the villagers, improved in terms of design and thermal efficiency. Since these stoves are a onetime investment, not expensive, are similar to the already existing stoves and require negligible maintenance, a cash delivery model could be used to distribute them. This will certainly improve the indoor environment conditions in such areas.
Nowadays, using mobile phones has become very common in most of the developing countries, hence the solar lighting systems could be modified to be able to provide phones and portable torch charging points without much increase in the product cost. Such products will have an advantage over the regular „only-light‟ products.
If the areas are on a better prosperity level and have higher energy demands, the CCS model could be integrated with other renewable energy technologies such as biomass gasifiers and small wind turbines to cater to the extra demands. An energy container and micro-grid based solution can be evaluated and distributed under subsidy models by the local governments. This would work as a local grid, and will be maintained by a local person, thus generating employment opportunities. Selling the electricity from this mono/hybrid and stand-alone
energy supply system can generate the maintenance cost, plus some profit. The feasibility of such system could be evaluated by comparing the cost of connecting the village to the main grid with the cost of providing this renewable energy based system. The benefits include clean energy, energy independence, no extra load on the current grid and earning through CDM.
Future work could be focused on the pico PV system addressing the role of new technologies, recycling of batteries, and improvement of failure rates in the component as well as local development. As there is a huge potential of GHG emissions saving, the issue of carbon financing shall also be addressed.
Acknowledgements The authors acknowledge Mondialogo Engineering Award for providing base-funding for motivating this research. The contribution from student teams at Malaviya National Institute of Technology, Jaipur has been significant. We want to extend our sincere thanks to Dr. Benjamin Sahan, Dr. Joachim Went, Dr. Ramchandra Bhandari, Dipl.-Ing. Alexander Schies and Nancy J. Cole for proof reading and motivation.

II. Contributions from PractitionersRegulation
280
PROCEEDINGS Conference MPDES 2011
Energy Delivery Model Tool for Understanding and Scaling Up Decentralised Energy Supply
Practical Action Consulting
Ewan Bloomfield The Schumacher Centre for Technology and Development, Bourton on Dunsmore, Rugby,
Warwickshire, CV23 9QZ, UK www.practicalactionconsulting.org.uk
Abstract
This paper describes an on-line framework form which attempts to map and link the key physical, institutional, financial and supporting options possible within the design and implementation of delivery models for increased energy access. The aim of the framework is to increase the understanding of the relative options for increasing clean energy access for the poor in developing countries, including the scaling up of pro-poor options such as decentralised energy. Such energy access scenarios, at the point of use, are mapped and can be compared with others to understand the limiting factors for scaling up. Through the process of completing the framework form decentralised energy project developers and policymakers are assisted in considering the relative positioning of their proposed model, to identify any gaps or alternatives from past experience, and ultimately to develop more sustainable energy delivery models. Keywords: Energy Delivery Models; Energy Access.
Problem, background, challenge of the project
Energy is delivered to individuals and households at a number of scales, using a range of fuels, conversion equipment and appliances, and using several models of delivery as well as financing and management systems. There has previously been limited progress in the categorization of these various models, to allow different energy delivery systems to be compared against each other, and for the limiting factors to be defined and then examined.
To try and better categorise all methods of energy delivery, including decentralized systems, and to allow all energy delivery models to be compared against each other, an on-line energy delivery model tool has been developed by Practical Action Consulting (PAC) in collaboration with IIED, GVEP International and HEDON, through the DFID PISCES (Policy Innovation Systems for Clean Energy Security) Research Programme.
Approach To allow all energy delivery systems to be compared against each other, the energy delivery model tool breaks each aspect of an energy project down into its base components, such as its energy source, appliance and equipment, including maintenance and financing, categorized into 5 main sections (as shown in Figure 1), through a new approach developed by Practical Action.
Section 1: the Basic Model, defines the energy user, the energy being used, the energy vector and the delivery system. Section 2, the Energy Equipment, details information about the energy equipment including the model for purchase, its ownership, maintenance and financing. Section 3, the Energy Resource, defines the type of energy being used and the rights associated with its use. Section 4, the Appliance, defines the type of appliances being used by the energy users, and who is responsible for them. Section 5, the Energy Initiative, details how the overall initiative is led and managed.
Not all of the various options are compatible with each other and the tool highlights all compatible, semi-compatible (options which might be compatible depending on other factors), and incompatible options, automatically highlighted in traffic-light colour-coding. This gives valuable feedback to energy practitioners who are planning on developing a decentralized energy system.
Once all the information has been entered into the tool a corresponding market map is produced which is unique to the particular decentralized energy delivery system described. The market map (shown in Figure 2) is broken down into 3 main areas. The market actors are located in the centre, and are all
the people and organisations involving in delivering a particular energy service.
At the bottom are the supporting services which are able to provide assistance to all the market actors to enable them to deliver the energy more effectively.
Finally, at the top, is the enabling environment, which summarized the main factors which affect the ability of the market actors to sustainably deliver the energy, but are beyond their control (although which can be influenced by others such as NGOs).
By defining the market map associated with an energy delivery system, such as a decentralized energy system, all of the important aspects are identified as well as their relation to each other. An examination of such a market map allows the limiting factors to be identified, as well as positive links between difference actors, which can help the scaling up of energy delivery models, such as decentralized energy systems.
In addition to the market map guidance on key issues that should be considered in promoting such a model, can be viewed, based on past experience. This is of particular relevance to understanding all aspects of smaller, decentralised energy options, which might not have been tried before. The framework also gives examples of other

281
PROCEEDINGS Conference MPDES 2011
successful energy access delivery models, which have been mapped onto the framework, for information and comparison, many of which are decentralised energy supply models.
If a given delivery model can find a path from top to bottom then the scheme is in principle viable, within the limitations of the energy needs and users it can be seen to be serving. The tool is aiming at all energy practitioners and policy makers who are focused on delivering energy to the poor in developing countries (including private organisations, NGOs and Government bodies). Individuals complete the forms for successful decentralised energy models, with comments for future comparative analysis and facilitated networking of like initiatives, to support their scaling up. The framework form can be completed for any actual or potential energy access delivery model, including decentralised energy systems.
The energy delivery model tool has been undergoing a series of improvements based on feedback from other energy practitioners (including private companies, NGOs and university experts), and can currently be accessed through Practical Action’s website. It is being actively disseminated to a wide audience through our networks and feedback is sought on improvements to the captured data and support information on the market mapping process.
Lessons learned Through entering a number of real life energy delivery projects into the tool (including international Ashden Award winners and a Chardust Briquettes project in Senegal as shown in Figure 2), a number of structural changes to the tool have been identified, to improve its ability to help energy practitioners and policy makers delivering sustainable, decentralised energy to the poor.
These changes include the simplification of some of the terms to eliminate confusions, increased details to the appliance section to ensure that energy efficient wood and charcoal stove projects can be included, and more focused information to support the market maps section to provide greater support to energy practitioners. The tool has already been used by a number of organisations to provide greater understanding of how energy delivery models are constructed and how successful examples can be more effectively scaled up.
Research demands Questions that should be dealt with in the further are: How can the Energy Delivery Model tool be more widely used by decentralized energy practitioners? How can it more effectively inform energy practitioners to increase energy access for reduced poverty and improved livelihoods? How can the identification of the limiting factors for the scaling up of decentralized energy be translated into real changes?
Figures
Figure 1: An outline of the entire Energy Delivery Model Tool showing the 5 main categories
Figure 2: Typical Market Map from a Chardust Briquettes’ project in Senegal showing the market actors,
the enabling environment and supporting services

282
PROCEEDINGS Conference MPDES 2011
A Sustainable Solar Market Package to Increase Electricity Access in Disadvantaged Regions
Indonesia Ministry for Development for Disadvantaged Regions
Eva Wulandari [email protected]
Abstract The Ministry for Development for Disadvantaged Regions (KPDT)1 has an ongoing grants program to provide basic infrastructure to disadvantaged regions. With increasing demands and limited governmental resources, partnership funding from international donors is being pursued. A framework concept to help guide the provision of solar energy infrastructure is developed. We propose a pilot project to introduce the Sustainable Solar Market Package (SSMP) as a model to guide policy and practical implementation. Keywords: Sustainable Solar Market Package; Project, Solar Home Systems.
Problem, background, challenge of the project
Since 2006, the Ministry for Development of Disadvantaged Regions (KPDT), through its office of infrastructure improvement, has been implementing a program to accelerate the provision of basic rural infrastructure in disadvantaged regions. This program is referred to in Indonesia as “P2IPDT.”2 Five deputy assistant offices3 manage the grant facility to support key infrastructure: social, economic, transportation, information and telecommunication and energy. This program is organized by KPDT in conjunction with the local governments. The sustainability depends on community based organizations (CBO) which are established specifically for this purpose by the local governments. The establishment of a CBO is required by the KPDT as a precondition for all projects.
Key activities in 2010 were: a. Transportation Infrastructure: 127 village roads built,
21 harbors built, developed and rehabilitated in villages, and outboard motorboats provided to 8 villages.
b. The Information and Telecommunication Infrastructure office has provided internet and computer facilities for schools, set up “handy talky” and public information shops in 46 disadvantaged districts. In addition to this, starting in 2010, three ministries (KPDT, the Ministry of Interior and the Ministry of Communication and Information) signed
1 KPDT stands for Kementerian Pembangunan Daerah
Tertinggal (The Ministry for Development for Disadvantaged Region) which was established in 2004.
2 P2IPDT is a program established by KPDT in 2006. It provides grants to local governments for basic infrastructure. Local governments provide a matching budget and commit to operation and maintenance of facilities, in partnership with community based organizations.
3 A “Deputy” in KPDT refers to a government department, not necessarily a position or a person.
an agreement referred to as “Ring Village,” a USO (Utility Service Obligation) program to provide basic telephone services. This program has been implemented in 38,417 villages.
c. The Social Infrastructure office has provided 13,760 households with clean water systems and other basic infrastructure for housing, education and health care services. By 2010, a total of 50 infrastructure units serving 61 villages have been funded.
d. The Economic Infrastructure office has provided basic equipment for income generation purposes in 290 villages in 51 districts. Examples include market stalls, fishing boats and equipment, fish dryers using low amounts of salt, hand tractors, power threshers, ice makers and cold storage.
e. The Energy Infrastructure office has funded: 45,481 units of Solar Home Systems (SHS) (50 Wp), 4,890 centralized PV units, and 53 micro hydropower units. In total there are 46,062 electricity generation facilities based on renewable energy in 1,139 villages, benefiting 64,681 households.
Despite the high numbers achieved during this period, there are many pending energy proposals thatso far couldn`t be considered. Among those are 348,815 proposals for SHS that were received by the KPDT, as well as 240 proposals for centralized PV units (5 kWp), and 119 proposals for micro hydro units. These have not been funded due to limitations both in budget and government capacity. The KPDT budget can support 9,000 units of energy infrastructure each year. Using KPDT funds alone, it would take 35 years to fund all the current proposals.4
Because there are five deputy assistant offices managing the provision of basic infrastructure, it is essential that the concept provides an unified effort which meets energy service needs in disadvantaged regions. The concept also must contribute significantly to achieving the targets of the KPDT infrastructure improvement office.
Approach The national solar home systems program was initiated through a World Bank funded project, “200,000 Solar Home Systems,” which aimed at providing electricity services to one million people in rural areas in three provinces.5 The project depended heavily on micro-credits from commercial banks, as well as private sector retail sales in rural areas. When the Asian economic crisis of
4 Presentation of Mr. Himawan Wahyudi, MM, (formerly)
Deputy Assistant for Infrastructure Energy, in a coordination meeting with the Finance Ministry, 2010.
5 The project ran from 1997 to 2002, with a geographic focus on West Java, South Sulawesi and Lampung.

283
PROCEEDINGS Conference MPDES 2011
1997/8 hit Indonesia, demand for micro-credit ceased and sales were far below the target. However, many stakeholders became familiar with SHS and the market was still supported at a lower level by provincial government programs in parts of Indonesia. Despite the failure to introduce SHS in Indonesia via the market, other countries have successfully introduced SHS commercially, such as the Philippines and countries in Latin America and Africa. In Indonesia today, economic conditions are favorable for a transition from a solely government-supported SHS market to a commercial market in rural areas for PV-based technologies.
A substantial change in the concept is also needed, namely to utilize the government development of public facilities as an anchor for the private sector to introduce SHS commercially in rural areas. In this model, the government competitively bids public facilities together with a component for marketing and retail services of solar technologies in the same area. Under a government contract, the private sector provides equipment and after sales service, as well as carrying the responsibility for maintenance and operation of public facilities. Private companies can and should work together with local community organizations.
Recently, this concept has become known as the Sustainable Solar Market Package (SSMP),6 introduced initially in the Philippines. It aims to tackle the challenges of making PV systems sustainable in off-grid rural areas. The concept addresses the problems of low sales and high prices of household systems, as well as the lack of after sales services in remote areas.
From a government perspective, the concept is to combine the provision of PV-based public utility services with the sale of solar home systems for rural households in the same areas. Thus, the government contract includes terms that specifically obligate the company to market and sell Solar Home Systems (SHS) on a credit basis within a certain time period. The company has both a financial incentive as well as a possible penalty related to its sales performance.7 This incentive is an encouragement for the companies to stay in rural areas, to provide after sales services for PV-based public utilities, and to develop commercial markets for solar home systems. In addition the company has the opportunity to sell other products such as spare parts, lighting, batteries and other items during the contract period. The credit arrangement can be made in cooperation with local banks or micro-finance institutions. Currently, the Indonesian Solar Lending program, managed jointly by the Frankfurt School of Management and UNEP, and funded by the German
6 The concept is summarized in the report, “Photovoltaics for
Community Service Facilities; Guidance for Sustainability,” published by the World Bank, December 2010. The main authors are Mr. Jim Finucane, PhD and Mr. Anil Cabraal, PhD who managed the SHS World Bank project.
7 A financial penalty or incentive can be included in the contract for the public facility. As an illustration, the contract amount for a public facility can be 15% higher if the company also sells a target number of SHS systems within, say 24 months, on a credit basis. As a penalty, if the company retail sales do not reach a given target, then the contract amount will be lowered 10% from the fixed price agreed in the contract.
government, has an ongoing project to introduce this concept to several micro-finance institutions and banks in Indonesia. The prospective banks include BRI, Bank Mandiri and Bank Niaga.
In summary, SSMP consists of two parts that can be dealt with simultaneously. First, establishing the public facility (through government tender), and second, introducing retail sales of solar home systems via micro-credit within the same region.
Types of facilities which can be established through government tender include: 1. Social infrastructure: clean drinking water facilities,
rural health center facilities and school buildings 2. Energy/ electricity infrastructure: lighting for
mosques, schools, community halls, and streets 3. Transportation: village roads and bridges 4. Information and telecommunication: communication
and information shops 5. Economics: solar dryers, hand tractors, and livelihood
related equipment While the ongoing discussion focuses on public-private
partnerships, a purely commercial approach is also possible. One potential strategy is to have solar energy technology, financed by a commercial loan, which supports community income generation.
Theoretically, the public-private concept can be implemented in line with the existing infrastructure improvement program. Thus, the levels and types of services must be tailored to the specific needs and budgets of government funded projects. These public facilities and services will be funded by the KPDT (through regional budgets, or APBN), procured through public tender, and if necessary, funded in partnership with international donors.
Companies that successfully bid for the contracts will be obliged to sell PV systems commercially. Some of the basic rules stipulate that SHS sales to rural households comprise a minimum of 10 to 25 percent. Sales must also be conducted within 18 to 24 months. The company may work together with micro-finance institutions, such as BRI, or directly retail to customers. The company may also establish recharging services at kiosks for poorer households with basic lighting needs. Some government funding may be used to subsidize households and other customers to improve the affordability – with levels determined based on ability to pay (e.g., $2-3 USD per Wp). Funding may also be used for additional cost-shared support to the contractor for market development.
Based on discussions with local governments, including certain incentives and penalties into the contract is important to encourage the companies to continue the business of retailing Solar Home Systems in rural areas.
Lessons learned The lessons learned can best be derived from the
current KPDT–P2IPDT program, since the Sustainable Solar Market Package is still in the discussion stage prior to implementation8.
8 KPDT is in the process of funding the initiative jointly with
the World Bank under the project, “Increasing Electricity Access in the Disadvantaged Regions” and Asian Development Bank

284
PROCEEDINGS Conference MPDES 2011
Based on the current program,9 a key lesson learned is that even though the P2IPDT program has had positive impacts on rural society, its implementation needs improvement.10 One finding from monitoring that took place during the program is that the use of renewable energy will also contribute to the government’s goals of reducing kerosene use for lighting and increasing rural income generation. A second lesson learned is the need for capacity building of local organizations, particularly in project management skills, from the preparation through the maintenance phase. The key success factor that is essential to the local community having a sense of true ownership of the energy infrastructure and services is to involve them from the very beginning. One important step is to hold public discussions on the location of new public facilities11 as well as the amount of the monthly fee for facility maintenance, seeking agreement with the relevant CBO committee. Trainings and capacity building programs are very much required to improve the performance.
From the Philippine experience, one of the initial lessons learned in applying the SSMP12 concept is the need to ensure the affordability of household systems. Another lesson learned is to ensure that market development support systems are in place and functioning. Furthermore, contractors should have their own quality assurance systems, such that if quality problems should arise, the company covers the costs of return verification visits. Furthermore, the Philippines’ experience shows that the market development component should focus on expanding capacities that enable the private sector to set up businesses in rural areas. There can be extremely high costs associated with operating in remote areas with limited infrastructure. These costs are the main barrier, even though sometimes the purchasing power in remote areas is sufficient to obtain SHS on a credit basis. Consequently, in addition to the subsidy
project, “Empowering the Poor through Increasing Access to Energy.” Meanwhile, GIZ in February 2011 sent a letter to the Bureau for National Development Planning (Bappenas) and KPDT, offering significant amounts in soft loans and grants for Technical Assistance, which might also be utilized to implement this project concept.
9 Presentation of Dr. Siswa Trihadi, Deputy Assistant for Infrastructure Energy, Ministry of Development for Disadvantaged Regions, 2010.
10 The critical improvement that requires immediate action is system maintenance. A field trip conducted by ADB and KPDT in Garut, West Java, in February 2011 found that the centralized PV, which is supposed to be able to provide lighting for 30 households for a minimum of 6 hours per day, can actually only provide lighting for 2-3 hours per day. Two years after installation, no institution has taken action to remedy the low level of service. The main barriers are limited funding and lack of coordination between the local government, CBO and the company.
11 There are often villagers willing to donate their land or area as the new site for a public facility because they are grateful to have such equipment and services provided in their village.
12 The SSMP concept was implemented in the Philippines in 2007 as part of the Rural Power Project. A key challenge has been the technical implementation, which still needs to be improved.
incentive for private sector investment in rural areas, assistance for continual business coaching is required that provides companies with advice on how to sustain the solar PV business in less developed or disadvantaged villages. Moreover, suitable training on the technical operation, on sales and marketing, and on basic office management would be useful. A comparative study in other regions would also be helpful to encourage and provide further insight to all stakeholders on how to continuously improve the project and ensure sustainability.
Research demands As the project moves from concept to application, initial research will include identifying locations suitable for a pilot project and further replication. The criteria include the following points. For communal PV systems, the selected locations must be in housing clusters. For SHS, the selected houses should be scattered, not clustered. In support of the KPDT mandate, the solar systems will also be installed in regions classified as disadvantaged, conflict vulnerable, and/or post disaster. The energy expenses for lighting purpose is more or less is the same with the monthly installment to purchase SHS on credit basis. Also, research should consider the ability and willingness to pay of villagers and the presence and possible roles of small industries. Additional research questions should address the appropriate technology options for this project that are also consistent with the least cost principle and any other renewable energy sources that are available in the area.
A critical factor for successfully implementing the concept in specific sites will be to define the role and level of involvement of the local governments, particularly the availability of co-financing within their budgets. It is especially important to confirm the accessibility of subsidies and grants, since the deployment of solar energy systems will depend on the viability of the public facility. After the facility funding is secure, the retail market component may include additional subsidies to reduce the Solar Home Systems price. The subsidy is designed to make the SHS more affordable for the rural customer. The price subsidy would ideally be provided by the local government, since its constituents will benefit. Later on, the study will determine which strategies to implement, as well as recommendations for the service obligation agreements, regulatory and tariff setting procedures, and detailed manuals for implementation and operations. Finally, it is critical to investigate further the capacity building requirements at various levels of both central and local government, as well as community based organizations at the village level.

II. Contributions from PractitionersUser Experience

286
PROCEEDINGS Conference MPDES 2011
Technical Monitoring and Economical Assessment of the Micro-financed Solar Program in Bangladesh
Rafael Wiese ([email protected])
PSE AG, Emmy-Noether-Str. 2, 79110 Freiburg, Germany
Michael Steidl ([email protected]) Micro Service Consult GmbH, August-Bebel Strasse 1-3, 67227 Frankenthal, Germany
Abstract The Solar Home System (SHS) dissemination program in Bangladesh is considered to be one of the most successful programs of its kind worldwide. Between 2005 and 2010 nearly 750,000 SHS have been installed, the vast majority is at 50 Wp. Systems have been implemented in rural areas where grid electricity supply is neither available nor envisaged in the mid-term future. Supported by international grants and soft loans, monthly installation rates have increased to over 30,000 SHS. The program management responsibility lies with the Infrastructure Development Company Limited (IDCOL). Around 20 micro-finance institutions (MFI) are responsible for the technical and financial implementation. They provide micro-financing to enable their customers to purchase the SHS. The authors carried out a technical monitoring of more than 5,000 SHS since 2007. In general it was found that nearly all systems are operational and only 7% had technical problems which required immediate repairs to prevent technical failure of the SHS. The main problems in this category were damages to or bypassing of the charge controller. The authors also assessed the financial performance of the MFIs. As a result, measures for credit risk management were introduced which have strengthen the financial performance. Keywords Solar Home System; Micro-Finance; Credit Risk Management
Introduction The dissemination of Solar Home Systems (SHS) to rural households in off-grid areas of Bangladesh began in 2002. As micro-lending is an established tradition in Bangladesh, the program was channeled through micro-finance institutions (MFIs). MFIs are the key players in the program, as they are responsible for technical installation and maintenance services as well as for loan disbursement and instalment collection. The Solar Energy Program is organized and overseen by the Infrastructure Development Company Limited (IDCOL). IDCOL is in charge of overall project management and monitoring, defines the regulations for loan disbursement to the Partner Organizations (POs or micro-finance institution MFI) and sets the technical standards for SHS components and installations. During monthly meetings with all concerned POs, continuous feedback is given vice versa.
The consulting team of PSE AG and INTEC-GOPA Germany and PSL Ltd. Bangladesh facilitates a technical and economical monitoring of around 2% of all installed SHS. The consulting period is 2007 to 2011.
Within the framework of their monitoring service, the consultants inspected 5,200 SHS as well as around 200 PO field offices in the period of June, 2007 to September, 2010. During this period, around 500,000 SHS were installed, co-financed by grants and loans from World Bank, GTZ, KfW and ADB.
Figure 1 shows the role of each partner: The POs are central and their tasks will be described in the next chapter. The donors provide soft loans and grants to IDCOL. Theses funds are transferred to the POs after installation of the SHS. The loan repayment chain extends from the customers to the POs, from the POs to IDCOL, and finally to the donors.
Many of the biggest MFIs in Bangladesh have established energy divisions that are involved in the program. Grameen has developed its energy division called Grameen Shakti (GS) intensively during the last six years. Nowadays it is responsible for two thirds of all installations under this SHS program. Second comes Rural Service Foundation (RSF) which has boosted its SHS installations within the last three years tremendously. BRAC Foundation, a concern of BRAC which is the biggest NGO of the world comes third.
In total, 20 POs are registered under the IDCOL program. They are responsible for marketing and user identification, collection of down payments and monthly instalments. All POs have established field offices spread throughout the country. In total, around 1,500 field offices have been set-up so far. At least one manager/accountant and two technicians work full time at each field office. They also carry out the technical installation of the SHS and the technical service. GS and RSF have increased their monthly installation rates significantly during the last few years from a few hundred to 20,000 respectively 6,000 SHS. This was only possible through investments in new field offices, hiring and training of technicians and accountants, and a strong management.
All POs are obliged to report their installation figures and financial details, such as collection efficiency and overdue collection rates, to IDCOL on a monthly basis. Thus, the program is transparent in terms of PO performance at the headquarters level. The authors therefore collected technical and financial data from the PO field offices in order to verify the reported figures.
IDCOL inspectors also carry out technical checks of the installed SHS and have targeted a 50% inspection rate before loan disbursement to the POs. Due to the POs’ rapidly increasing installation rates, IDCOL has increased its inspection staff to keep pace with the installations.

287
PROCEEDINGS Conference MPDES 2011
The performance of the POs is quite diverse. The three leading POs account for more than 85% of all installations. Other POs work only in specific areas of the country. In general, the high population density of more than 1,000 inhabitants per km² is a favourable condition for the solar program. Once a PO has established an office in a village, customer accessibility is very good and travel time and costs for customer visits are low. Thus, POs can guarantee a 24-hour maximum reaction time to investigate user complaints.
Figure 2 shows the total number of SHS installations made each month by all POs. Peaks and dips of monthly installations depend heavily on various parameters such as the components supply situation, weather conditions (cyclones), and sales and marketing activities.
Research Objectives The tasks of the German-Bangladeshi consulting team is
to monitor the technical implementation of the SHS on a 2% sample basis randomly selected, proportionate to the POs and to the geographical distribution
to assess the economical performance of all MFIs As main objectives, the monitoring and assessment aims to
to ensure the long-term technical performance of the SHS emphasising the quality of components and installation work, and
to contribute to safeguard the financial soundness of the involved MFIs.
Methods The technical monitoring is facilitated through monthly
field visits of around 2% of all installed systems. In order to obtain information of long-term system behaviour the authors distinguish between old and newly installed SHS. The monthly technical data of around 400 SHS are collected by the Bangladeshi consultants. For each customer/SHS a technical questionnaire is filled in with specific data on all components and around 20 failure codes. The data are later computerised and transferred for statistical evaluations and plausibility checks to the German consultants. In addition, the German consultants do field visits and visits to PO headquarters several times per year.
The economical assessment of monthly two to three PO field offices is also done by the local partner. The account data of each customer of the visited field office is taken and processed into a computer data base. This results in the monthly figures on collection efficiency and arrears rates. In addition, the German consultants do visits and investigations at PO and IDCOL headquarters.
Results Results of the technical monitoring The SHS implemented under this program have a rated solar module power of between 30 and 130 Wp. The most common size is 50 Wp. Up to September 2010 675,000 SHS with a total capacity of at least 30 MWp have been installed. So far, solar modules are imported; mainly from
Asian countries. In May 2010 a local module manu-facturer became operational.
The SHS batteries are lead acid batteries. Due to high import tax (37.5% for sealed lead acid batteries) all batteries are sourced locally. The main supplier is Rahimafrooz, which accounts for at least two thirds of all deliveries. Charge controllers are also mainly manu-factured locally; some POs assemble prefab kits imported from Sundaya (Indonesia) and STECA (Germany). The SHS are delivered together with three or four CFL light bulbs, which are sourced locally and internationally. IDCOL has defined technical standards for the system design and publishes a list of eligible components. The SHS are mainly purchased (through a loan scheme, as described later) by households. The lights are used in the cooking area and in courtyard working areas. Some customers use the systems to power their radios and small 12 Volt televisions. Almost all use them for mobile phone charging.
The authors do not have access to quantitative information regarding the income generation activities of households using SHS, as this was not included in the monitoring service. However, owners of small enterprises in Bangladesh often use SHS to light their shops or small restaurants. This increases their income, as reported by the authors during casual field visits.
The consultants inspect around 2% of all newly installed systems, thus they have to keep path with the monthly installation rate and increase their efforts from monthly 100 SHS to currently 450 SHS per month. This delivers statistically significant figures of technical finding that can be divided into three categories:
Negligible observations, such as shading or wrong angle of the solar module, which can be corrected locally
Observations: Deficiencies needing attention, such as the use of inferior quality wire or components not up to the technical standards
Problems: Installation defects that could potentially damage the system or reduce its lifetime
Only 7% or 273 out of 4,196 inspected SHS showed installation defects requiring immediate repairs to prevent damage to the system (Figure 3). The main problems in this category were damages to or bypassing of the charge controller. The percentage of problems remained stable during the monitoring period and the increasing number of monthly installations.
The consultants found a high percentage (52%) of SHS with inferior installation quality, such as the use of excessively long cables and the absence of wire connectors. With the increased number of monthly installations it was found that also the percentage of observations has risen. This indicates that further technician training is needed to improve technical skills to newly employed technicians. On recommendation of the consultants, IDCOL issued a technical checklist for installation works which is mandatory to all Pos.
The main portion (41%) of inspected systems showed no problems or only negligible inefficiencies.

288
PROCEEDINGS Conference MPDES 2011
Results of the financial performance assessment The collection performance of all POs was analyzed throughout the consulting period. Out of a total of around 1,500 field offices, the consultants visited around 175 offices. This allowed the consultants to procure statistically relevant data sets to confirm their findings. PO field offices are responsible for customer selection and registration, the collection of down payments and the collection of monthly instalments. Most field offices are not computerised, and financial data is kept manually in books and reported monthly in aggregated figures to the PO headquarters. These figures include the number of newly installed SHS, the monthly and overall collection efficiency, and the actual and overall due instalment collections. In general, PO field office staff carries cash once or twice a day to the nearest bank to ensure the safety of the funds.
Customers can opt for a 24 or 36 month loan period. To date, most have chosen the latter. The POs provide loans with a 6% interest flat rate to the customers. The SHS is considered collateral.
Table 1: Typical 50 W SHS loan scheme
US$ (a) SHS price 395 (b) Grant from IDCOL, funded by donor - 48 (c) Remaining costs = price to customer 347 (d) Customer down payment [15% of (c)] - 52 (e) Remaining cost = customers loan (c-d) 295
Customers pay around 8 US $ per month interest and
redemption; at this rate, they become owners after 36 months.
Starting in the second half of the year 2008, until September 2010 a total of around 75,000 small SHS with a rated power of ~20 Wp were installed. Currently they account for 20 % of the total monthly installation rate and are managed and financed under the same process as larger systems. The fact that the amount of grant provided by the donors is equal to all systems regardless the size of the SHS has build in a social component especially to small SHS. The actual grant percentage is around 30 % for a 21 Wp system compared to around 12 % for a typical 50 Wp system.
Refinancing of the program is made possible via 8-10-year soft loans from IDCOL to the individual POs. IDCOL receives this fund from the government of Bangladesh, which has received a soft loan from the World Bank and the Asian Development Bank with very long tenors. Grant is made available by KfW and GTZ.
The results of the PO assessments showed a considerable discrepancy between the sample audits in the field offices and the collection efficiency reported by the PO Headquarters to IDCOL. Up to mid 2008, collection efficiency was reported as above 95% on average for all POs. The efficiency found at the field offices visited was far below this percentage, sometimes below 50%. To quantify the findings, the consultants introduced an instrument to measure the risk involved in the loan portfolio. The delinquency rate is an early warning sign of
the credit risk implicit in the loan portfolio. It is defined as the outstanding balance of loans with delinquent payments divided by the total loan portfolio.
From a statistically relevant data set, the authors calculated the delinquency rate of 37 field offices of one single PO that were visited between July, 2007 and January, 2008 (see Figure 4).
The correlation between delinquency rate and collection efficiency should be such that low delinquency rates correlate with high efficiencies and vice versa. The above graph shows considerable divergences between delinquency and collection rate. Some data can not be correct, i.e. high collection efficiency and high delinquency rates for the same field office. We assume that incoming payments from new customers for the first instalment were not clearly separated in the books from overdue payments from existing clients who were in arrears.
In response, IDCOL and the consultants introduced a Credit Risk Management Guideline to the POs, and IDCOL inspectors began measuring the portfolios at risk (PAR30) on a sample basis. PAR30 refers to a delinquency of 30 days. Most PO field offices have PAR30 rates of more than 30%; one even an extreme 66%.
Notwithstanding the shortcomings in credit risk management by the POs, the overall performance of the portfolio is not alarming. Current estimates by the consultants based on the available financial data indicate that the POs lose around 2.5% to 3.0% of their portfolio each year – an acceptable figure.
However, the authors highly recommend that POs take adequate measures to improve their credit risk management: computerise their filed offices, monitor the financial information on aggregate and on customer basis, and in general pay more attention to measuring their risk in the SHS loan portfolio.
Discussion The SHS dissemination program in Bangladesh is being successfully implemented by 20 micro-finance institutions. Within the last four years, around 582,000 SHS have been installed. With a monthly installation rate of over 30,000 SHS, the program is world-record-breaking. The SHS are financed through a loan scheme including around 12% grant funds.
The overall technical performance of 400,000 systems was monitored on a 1% sample basis between June, 2007 and June, 2010. From a total of 4,196 SHS it was found that only around 4% of SHS had more serious technical problems which had to be adjusted by the POs after detection. Nevertheless, the authors recommend:
Technical training for technicians Monitoring of SHS over a period covering the
lifetime of the batteries Statistical evaluation on productive usage of SHS Concerning financial monitoring, the authors found
divergences in the collection efficiency between field offices and headquarters. Together with IDCOL, the implementing agency, they introduced risk management guidelines at the POs.
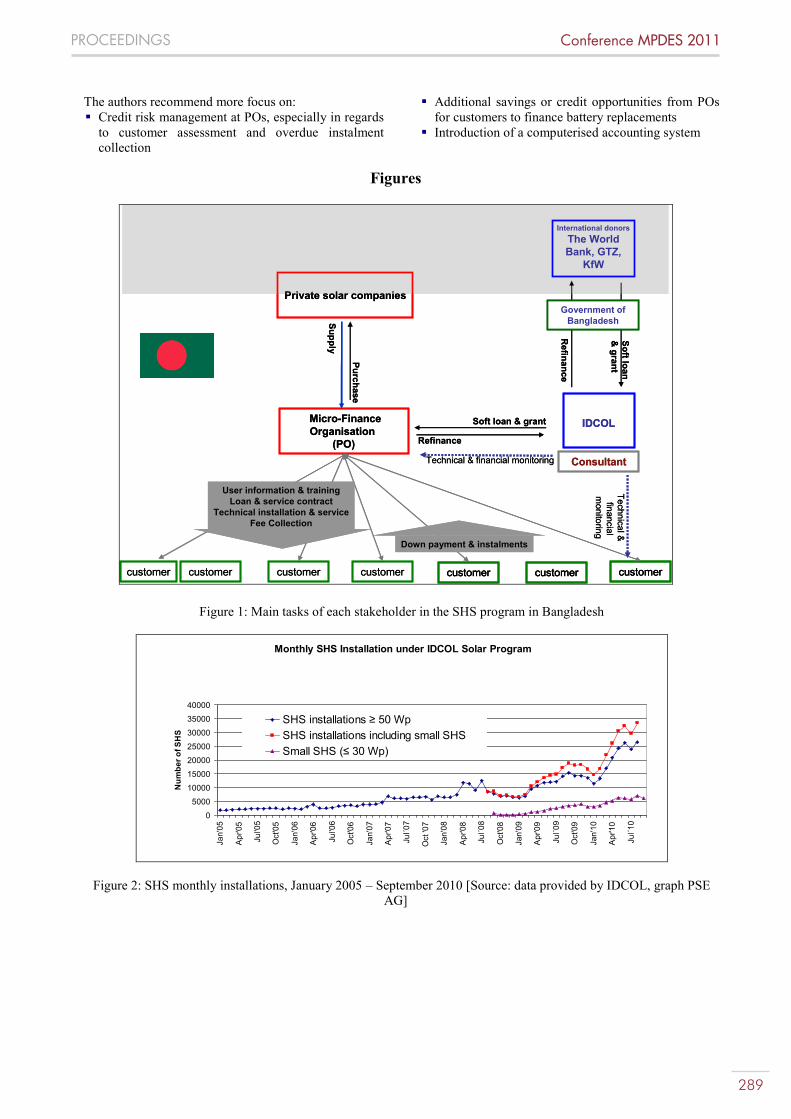
289
PROCEEDINGS Conference MPDES 2011
The authors recommend more focus on: Credit risk management at POs, especially in regards
to customer assessment and overdue instalment collection
Additional savings or credit opportunities from POs for customers to finance battery replacements
Introduction of a computerised accounting system
Figures
Micro-FinanceOrganisation
(PO)
Private solar companies
Soft loan&
grant
Refinance
Refinance
customer customer customer customer customercustomer
Soft loan & grant
Technical &financial
monitoring
ConsultantTechnical & financial monitoring
customer
International donorsThe WorldBank, GTZ,
KfW
Government of Bangladesh
IDCOL
Supply
Purchase
User information & trainingLoan & service contract
Technical installation & serviceFee Collection
Down payment & instalments
Micro-FinanceOrganisation
(PO)
Private solar companies
Soft loan&
grant
Refinance
Refinance
customer customer customer customer customercustomer customer customercustomer
Soft loan & grant
Technical &financial
monitoring
ConsultantTechnical & financial monitoring
customer
International donorsThe WorldBank, GTZ,
KfW
Government of Bangladesh
IDCOL
Supply
Purchase
User information & trainingLoan & service contract
Technical installation & serviceFee Collection
Down payment & instalments
Figure 1: Main tasks of each stakeholder in the SHS program in Bangladesh
Monthly SHS Installation under IDCOL Solar Program
0
5000
10000
15000
20000
25000
30000
35000
40000
Jan'
05
Apr
'05
Jul'0
5
Oct
'05
Jan'
06
Apr
'06
Jul'0
6
Oct
'06
Jan'
07
Apr
'07
Jul´0
7
Oct
'07
Jan'
08
Apr
'08
Jul´0
8
Oct
'08
Jan'
09
Apr
'09
Jul´0
9
Oct
'09
Jan'
10
Apr
'10
Jul´1
0
Num
ber o
f SH
S
SHS installations ≥ 50 WpSHS installations including small SHSSmall SHS (≤ 30 Wp)
Figure 2: SHS monthly installations, January 2005 – September 2010 [Source: data provided by IDCOL, graph PSE AG]

290
PROCEEDINGS Conference MPDES 2011
SHS inspected by the consultants during June 07 - June 10
35%
6%
52%
7% Correct installation
Negligible observations
Observations that needattention
Installation deficiencies(problems)
4196samples
Figure 3: Distribution of SHS installation deficiencies from June 2007 to June 2010, 4196 samples
Nam
e of
fie
ld o
ffice
0%10%20%30%40%50%60%70%80%90%
100%
Baris
al S
adar
Kazi
rhat
, Bar
isal
Mul
adi,
Baris
al
Hiz
la, B
aris
al
Din
ajpu
r Sad
ar
Pirg
onj,
Thak
urga
on
Balia
dang
i, Th
akur
gaon
Thak
urga
on S
adar
Bira
mpu
r, D
inaj
pur
Syed
pur,
Din
ajpu
r
Gan
gach
hara
, Ran
gpur
Panc
haga
r Sad
ar
Salb
ahan
, Pan
chag
ar
Tara
kand
a, M
ymen
sing
Phul
pur,
Mym
ensi
ng
Hal
uagh
at, M
ymen
sing
Dho
baor
a, M
ymen
sing
Shak
hipu
r, Ta
ngai
l
Mad
hupu
r, Ta
ngai
l
Dha
lapa
ra, T
anga
il
Kalih
ati,
Tang
ail
Tora
bgon
j, Ta
ngai
l
Rat
ango
nj, T
anga
il
Syed
pur,
Tang
ail
Gal
achi
pa, P
atua
khal
i
Khas
herh
at, P
atua
khal
i
Das
hmin
a, P
atua
khal
i
Baup
hal,
Patu
akha
li
Patu
akha
li Sa
dar
Barg
una
Sada
r
Beta
gi, B
argu
na
Mirj
agon
j, Ba
rgun
a
Amta
li, B
argu
na
Sailk
upa
Mag
ura
Jhen
aida
h
Kust
ia
Delinquency Rate % Collection Efficiency %
Perc
enta
ge
Figure 4: Correlation between delinquency rate and collection efficiency of 37 visited field offices of one single PO between July, 2007 and January, 2008
References
Rafael Wiese, Volker Schacht, PSE AG; Dr Stefan Drenkard and Michael Steidl DECON GmbH; Asma Haque, Prokaushali Sangsad Limited; Winfried Klinghammer, Projekt-Consult GmbH (2010). Empowering A Rural Revolution Solar Home Programme Brings Power to Off-Grid Bangladesh. Renewable Energy World Magazine, Vol. II. Essex, UK, PenWell International
Rafael Wiese, Volker Schacht, PSE AG (2010). Results of
the technical and financial monitoring of a micro-financed program for solar home systems in Bangladesh. 25th European Photovoltaic Solar Energy
Conference and Exhibition. Proceedings, Valencia, Spain,

291
PROCEEDINGS Conference MPDES 2011
Implementation of Triple Helix Clusters Procedure in the sub-Sahara Africa Energy Sector
Case Study: Academia - CREEC Photovoltaic Laboratory
Makerere University, Centre for Research in Energy and Energy Conservation (CREEC) Faculty of Technology, Makerere University
P.O. Box 7062, Kampala, Uganda Izael Da Silva
[email protected] Steffen Wassler
Abstract Penetration of decentralized power supply for households and commercial enterprises is low in Sub-Sahara Africa. Solar Home Systems (SHS), despite their widespread use in other continents have failed to attain much success in Africa. One of the reasons is the high rate of failure of existing implementations. Data shows earlier failure rates of 50%.1 This is largely attributed to poor quality of products used, inefficient installation, mismanagement and lack of maintenance. To address this problem, the Centre for Research in Energy and Energy Conservation (CREEC) is setting up a Solar PV test laboratory in Uganda. This paper describes the installation process and how to sustain the laboratory after implementation. The lab is intended to provide a forum for training, research and consultancy under CREEC. It is intended as a tool to implement the triple helix and clusters procedure in the PV industry in particular and the energy sector in a more general scope. This paper offers details covering the current situation of the energy sector in Uganda and how the lab supports capacity building in the university to support the upcoming demand. Keywords: Solar home system, Renewable energy, Test laboratory, PV training, Clusters; Rural development, PV market.
Introduction Uganda is endowed with good insolation levels practically the whole year round ranging from 4000 to 6000 Wp/m2/day. The national grid covers less than 10% of the urban population and less than 3% of the rural one. Despite this scenario, PV technology has not managed to penetrate and the PV industry is small and financially weak in the country.
The government is making an effort to further its dissemination but the results are rather meagre. The Ministry of Energy and Mineral Development (MEMD), Rural Electrification Agency (REA), Private Sector Foundation Uganda (PSFU) are the units receiving funds from the World Bank under the Energy for Rural Transformation (ERT) project phase II to tackle the problem.
Development agencies such as Sida, GIZ, and NORAD have availed extra funds in one way or another to
1 GIZ-PREEEP studies: Impact assessment of the Solar Electrification of Health Centres and Impact assessment of the Solar Electrification of Micro Enterprises, Households and the Development of the Rural Solar Market, both in 2009
strengthen the PV industry under the Renewable Energy Agenda.
The Private Sector has been improving steadily though on a small scale and lately has organised itself under the Uganda National Renewable Energy Association (UNREA). Leading academia’s efforts, CREEC at the College of Engineering, Design, Art and Technology (CEDAT), Makerere University is creating capacity at technical, degree, masters and PhD level. With the support of the above-mentioned development agencies a Masters in Renewable Energy has been established at CEDAT with four specializations: bioenergy, micro-hydro, solar PV and energy efficiency in the building environment supported by NORAD. Sida has given close to 10 million dollar in a five years project to build capacity at PhD level with a total of 30 plus candidates. Four of them are conducting research in renewable energy. GIZ has sponsored quite a number of PV related projects and (with the support of German private companies) has provided CREEC with three PV systems for demonstration and training (1050 Wp, 330 Wp and a DC fridge system 185 Wp). It is within this framework that Sida availed 150 thousand USD for solar PV laboratory equipment.
Triple Helix Approach Despite the reliability of the PV technology, the support of the government, the willingness and good will of the private sector and the ability of the academia to handle applied research in this field, PV power as a percentage of total power consumed in Uganda is practically negligible at less than 1%.
This is mostly because there is not a coordinated effort by the three players government, private sector and academia to put their potential in a concerted manner to achieve the goal of widespread use of solar energy in Uganda. The solution for this problem could perhaps be the implementation of the so called “triple helix” or clusters initiative.
To understand better the triple helix concept we list below three citations:
At the moment, one unsatisfactory element in the European system has been that the linkages between university and industry, research and business world are not strong enough. Moving towards the knowledge-based society, however, also means that boundaries between public and private, science and technology, university and industry are blurring as the distribution of research locations becomes a key factor of economic growth in a

292
PROCEEDINGS Conference MPDES 2011
knowledge-based economy. Knowledge has become to a growing extent a potential product that can be exploited on the market, which means the industrialisation of the production of scientific knowledge.2
Universities and firms are in growing extent assuming each other’s tasks, and, as the university crosses traditional boundaries in developing new linkages to industry, it has to devise the connections between research, teaching, and economic development. Within industry, questions are raised about what should be located inside the firm, between firms, or among firms, universities, and government institutions. Are the firms willing to support basic research or is better to leave this task to the universities? What is the role of government given the need for technological innovation in international, national and regional development?.3
This mode of thinking - referred as 'triple helix' - is beneficial especially for the 'hard sciences', in which basic and applied research can be organised according to the triple helix model. However, in the field of humanities and social sciences, anything comparable to the technology centres has not yet been established, even though there are some efforts in that direction. Today the life sciences are a good example of a field where the co-operation between state, universities and a specific industrial cluster is a prerequisite for generating innovations. Universities are needed for the basic research, and they collaborate in R&D with the enterprises for the development of practical applications in specially designed environments (science parks etc.) funded largely by national governments but extracting also a lot of other funding. These installations have the capacity to employ a large amount of experts with postgraduate qualifications in different disciplines.4
An example of a successful triple helix implementation is Silicon Valley, where the government has provided land, financing mechanisms, tax holidays and suitable policies to allow the private sector to thrive - in this specific case on the IT industry.
On its side, the private sector (Dell, HP, Oracle, Intel, Microsoft, etc) do what they know best, which is production of reliable computers and software produced in a sustainable and efficient manner.
The very needs of the industry, powered by the created market, generate the need for the academia which in this case comprises of ICT professionals who are given all facilities to do R&D and product development to further boost the industry.
Government, industry and academia all profit as taxes are collected on sales of goods, revenue is generated and
2 Etzkowitz, H. & Leydesdorff, L. 1995: The Triple Helix: University - industry - government relations. A laboratory for knowledge based economic development. EASST Review. European Society for the Study of Science and Technology 14(1): 18-36. 3 Jacob, M. 1997: Life in the Triple Helix: The contract researcher, the university and the knowledge society. Science Studies 10(2): 35-49. 4 Ziman, J. 1994: Prometheus Bound: Science in a dynamic steady state. Cambridge University Press. Cambridge U.K. From http://finhert.utu.fi/ruse/helix.htm
knowledge is developed within a suitable research environment.
Nevertheless, this is not the whole story. The greatest beneficiaries of this cluster program are the consumers who can buy good and reliable computers - tools to empower them as individuals and provides a platform for them to play a meaningful role in society.
This comparison of solar PV dissemination in Africa with Silicon Valley may look a bit farfetched but it is not. Actually any business can be implemented using the triple helix concept. It is replicable and up-scalable.
As a matter of fact, there is a project sponsored by Sweden to start 1000 different clusters in Africa. It is called “Lighting 1000 cluster fires by 2010”.5
This shows that the dissemination of solar PV equipment for decentralized power supply in Africa can very well benefit from this triple institutions business approach. What follows in this study is a description of the three “partners” meant to change the face of Africa in terms of renewable energy utilization and people’s living standards. We shall start by describing the unit in charge of knowledge management, innovation creation and validation of product which we call generically academia. This will be followed by details on the Government of Uganda and finally the private sector.
CREEC The Centre for Research in Energy and Energy
Conservation is a research, consultancy and training organisation based at the College of Engineering, Design, Art and Technology (CEDAT), Makerere University. CREEC was founded in 2001 with the goal of developing into a centre of excellence in energy for Uganda and the entire East African Region.
Its goal is to create capacity in all fields related to energy with a special focus on the following areas:
Energy management Pico hydropower Solar photovoltaic (PV) Bioenergy
Its aim is to develop technologies and systems that have a direct, positive impact on people’s everyday lives. Along these lines, CREEC promotes technology transfer from researchers to society through pilot project implementation, training programmes and public awareness initiatives. This is done in order to bridge the missing link between researchers, the business community, funding agencies and the general public.
CREEC has a threefold mission: Research – The centre has access to experts in
the various fields of energy at PhD level. It participates in regional and international research initiatives, such as joint Master and PhD projects with renowned universities abroad.
Training – CREEC offers training courses to professionals who wish to improve their practical knowledge in photovoltaic installation, pico-hydro systems, bioenergy and energy
5 http://www.tci-network.org/news/card/208
293
PROCEEDINGS Conference MPDES 2011
management. Furthermore, CREEC’s director, Dr. Izael Pereira da Silva, is the coordinator of the MSc Degree Programme in Renewable Energy in cooperation with the Norwegian University of Science and Technology (NTNU).
Consultancy – Apart from energy auditing, experienced staff offers expertise on energy policy, small-scale energy project implementation, rural electrification programs and others.
Among many smaller projects, CREEC is currently implementing two large renewable energy projects:
1. Dissemination of energy efficient stoves: CREEC won a grant from the World Bank’s Biomass Energy Initiative for Africa (BEIA) to develop, produce and disseminate energy efficient stoves. In collaboration with Prof. Paul Anderson from the U.S. CREEC will promote the existing TopLit UpDraft (TLUD) stove, which will be produced locally and disseminated in rural Uganda. Supported by GIZ, a facility called Bioenergy Research Centre has been established that is well equipped to conduct biomass research. For example, CREEC owns the only Portable Emission Measurement System (PEMS) in Africa; this is being used to measure emissions from cookstoves. 2. Millennium Science Initiative (MSI): Dr. Izael Pereira da Silva, CREEC’s director, is the Principal Investigator of the interdisciplinary research project “Rural Electrification in Uganda Increasing Access to Modern Types of Energy” which is sponsored by the Uganda National Council for Science and Technology (UNCST). This research project focuses on the implementation of renewable energy systems, GIS mapping and business modelling. Because CREEC is linked to Makerere University and thus has at its disposal a large number of lecturers, undergraduate and graduate students, it can develop the role of knowledge management and capacity building to strengthen the renewable energy sector not only in Uganda but also in the whole of East Africa.
CREEC’s PV Laboratory Many solar laboratories have been built in Africa but most of them have failed because technicians were not familiar with equipment and/or because income generating activities were not defined as a critical output of the laboratories. In order to avoid this, CREEC plans to establish cooperation with the Government of Uganda and solar PV dealers to create business for the lab. This is done on the spirit of collaboration mentioned above. Possible ways to sustain the lab are:
Cooperation with the Uganda National Bureau of Standard (UNBS) to set up standards to be met by solar products entering the country. Use the laboratory to do labelling on their behalf. Labelling has been a very effective tool to enforce standards and fight counterfeit items coming into the market.
Charging for independent solar PV equipment testing and consultancy for importers who wish to test prototypes/samples of equipment they plan to sell to the Ugandan market.
Offering our practical expertise to train engineers at undergraduate and graduate levels to fill the market need.
Train technicians from the private sector in all matters pertaining PV design, installation and maintenance
Ensure the quality label of Lighting Africa by using Lighting Africa's test procedures and standards to test solar lanterns (pico-PV products)
Besides these activities CREEC will be able to generate income through the services rendered by the laboratory when it is used to provide tests to projects such as the one sponsored by the World Bank and the Uganda National Council for Science and Technology.
The initial set of equipment that the lab is acquiring is listed below:
- Luxmeter - Photometer box - Integrating Sphere with photometer - Set calibration lamps - Spectrophotometer with optical fiber - DC supplies - Multimeter - Datalogger - Battery charging and analyzing device - PV module analyzer
Using the procedures developed by Fraunhofer ISE during the lamp-test with GIZ and published under Lighting Africa and quoted in MICRO ENERGY international6, the laboratory will be able to support implementation of Solar Home Systems (SHS) through:
Demonstrating SHS Evaluating the quality of the whole SHS configuration e.g. checking how many Watt a panel actually delivers
Unmasking illegal imitation systems Confirming manufacturers stated specifications Designing the system’s configuration
Another goal for the laboratory is to set up a global network with other test facilities such as Joint Research Centre (JRC) in Ispra - Italy. Furthermore, the laboratory can be used to:
Simulate different users’ profiles Collect information about the long-term
performance of SHS Compare the performances of different system
configurations e.g. change the different load appliances, batteries, charge controllers and solar panels
Check the potential effects on the systems of some uncommon usage practices e.g. bridging the battery
6 The concept of solar home systems test facility; unpublished material. MICRO ENERGY international (www.microenergy-international.com)

294
PROCEEDINGS Conference MPDES 2011
The local test facility has to have the following features: It should be built of robust components The set-up and the operation should be clear to
local technicians It can be used for training local technicians Running costs should be covered by its activity
(cost-recovery approach) Check the performance of the whole SHS system
as well as separate components Data analysis should be in line with international
procedures Autonomous power supply to run the logging
unit, especially to operate in the off-grid areas and the areas of unstable grid
An additional target of the laboratory is to involve electrical engineering students from CEDAT to work under the supervision of trained personnel in practical activities to enhance their training and awareness regarding renewable energy in general and solar PV technologies in particular.
This will definitely have a positive impact on the solar market in Uganda and is a typical win-win situation as students can work for small pay and thus help reducing the laboratory operational costs.
CREEC has an agreement with the CEDAT through which the college avails the centre with space, electricity, internet, water and security for free, further helping the lab to be self-sufficient.
Case study: first tests done by the laboratory CREEC tested a solar system which was assembled in Uganda with as much local products as possible. These lights are meant to be sold in the rural and peri-urban areas and are designed to target the poor in those areas. The LED lamps are also designed to be assembled where there is no access to electricity. For instance, the connections are made in such a way that they do not need soldering. A plastic bottle head forms the lampshade and works as the container for the electronic parts. The LEDs are inserted in a cushion covering the lamp.
This is a seemingly excellent idea of a product built by the poor for the poor without compromising quality. For this reason the manufacturer asked CREEC to test the prototype.
CREEC's test methodology focused on following measurements:
Battery Discharging Test versus Lumen Output The discharging curves from the manufacturer’s
datasheet were verified by measuring the battery voltage drop over time while the lamp was switched on. During this experiment, the battery voltage and the current were continuously measured by data loggers. The lamp was lit inside of a dark box within which a light meter (luxmeter) measured light intensity. The measurement started with fully charged batteries and lasted until the battery was fully discharged.
Charging test The battery voltage and the power provided by
the PV panel during charging by sunlight were measured. The idea was to find out how long it
would take for the battery to be fully charged under several insolation conditions.
Comparative Light Output test The light output of the lamp was measured and
compared to the light output of a kerosene lamp and also a wax candle.
IP rating test The degree of protection in accordance with EU
standard DIN EN 60529 was used as a measure for the safety of the system.
Figure 1: Wiring Diagram of the LED lamp
The results of the test and the recommendations provided by CREEC can be used by the manufacturer to enhance dissemination of the product and to further improvements of the product.
This example shows clearly how a laboratory in Africa can help private sector people to test their products not only with regards to the technical aspects but also to show them which measures to take to provide the market with a successful product.
In the near future CREEC has plans to cooperate with UNBS to be able to test and label solar PV equipment on behalf of their institution.
Performance test of PV System CREEC was granted a solar PV system of 1050 Wp with a 600 Ah 24 V battery bank (14.4KWh). In January 2010 the control system was showing power available (SoC) at about 50% of the expected and the weather was sunny with almost no clouds. The load attached to the system was way below its nominal size and there were no losses in cables or connections as the panels are at a maximum 5 meters from the battery bank which is about 5 meters from the load.
This became a puzzle which CREEC personnel took upon themselves to solve. Tests on each of the components were performed and it was found that the output from the six 175 Wp panels were not the expected. A visual inspection of the panels showed no defective parts nor stains which could have accounted for the weak output.

295
PROCEEDINGS Conference MPDES 2011
One of the most conventional modes of installation of solar panels in Uganda is to secure them with an angle L shaped iron frame to prevent theft. It so happened that in this case the frame was not tightly attached to the panels and was thus creating shadow on a whole set of cells of the panels (see picture below).
A simple reduction of the size of the frame and a support placed under the panels resolved the problem totally. This is a typical issue which, left unchecked would make people in NGOs, users and even in government to come to the wrong conclusion that solar PV systems do not work in our region.
Again, the presence of well trained personnel with a set of well suited tools made it possible to solve this problem. CREEC has since then tried to disseminate this information so that all stakeholders are aware of this possible problem when installing solar PV systems.
Figure 2: Shadow at 3 pm due to the unsuitable frame
The Government of Uganda The Ministry of Energy and Mineral Development (MEMD) is very supportive of initiatives that foster the use of renewable energy.
Uganda is actually considered the most innovative country in the entire East Africa region when it comes to the electricity sector regulation. Things started changing in 1999 when Parliament approved the Electricity Act [6] by which the government monopoly of generation, transmission and distribution of electricity ceased. ESKOM manages the generation, transmission remained a government managed company (Uganda Electricity Transmission Company Ltd) and distribution was privatized and is now managed by a number of different companies. UMEME, which handles more than 90% of the power distribution in Uganda, is the biggest one in this field.
The government has published the Energy Policy Act7 in 2002 and the Renewable Energy Policy8 in 2007.
With the support of the World Bank it has established the Rural Electrification Agency (REA) to manage funds
7 Available on: www.era.or.ug/Pdf/Electricity_Act.pdf 8 The Energy Policy for Uganda, Ministry of Energy and Mineral Development, 2002. Available on: www.rea.or.ug/userfiles/EnergyPolicy%5B1%5D.pdf
as well as implement and supervise activities aiming at provision of energy to rural areas (www.rea.or.ug).
One of the most important decisions of the government towards the dissemination of solar PV power systems in the country was the waiving of all taxes on importation of solar PV equipment. Even VAT was scrapped making these items a lot more affordable to the consumers.
From a capacity building view point the Government of Uganda has also created a department for Renewable Energy in the Ministry of Energy being run under a commissioner.
Following a decentralization trend the Ministry of Energy has also created a post of District Energy Officer. This position is to hold the portfolio of supporting at district level all projects and initiatives related to energy, rural electrification, and income generating programs using renewable sources of energy.
Lastly, the Uganda National Bureau of Standards (UNBS) has been working on setting up standards to avoid the proliferation of poor quality solar PV equipment in the market. This para-governmental institution has received support from development agencies to set up laboratories and to work on bringing their testing facilities to international levels, especially the ones related to electrical equipments.
One of the things which, although already spelt out in the Renewable Energy Policy document in 2007, has being set for implementation in November 2010 as per the document: “Uganda Renewable Energy Feed-in Tariff (REFIT); Phase 2; Guidelines 2010; Draft V4; 1st November 2010”9 is the feed-in-tariff for solar PV which has the government committed to pay USD 0.326 per kWh of solar PV generated energy up to a maximum of 2 MW.
As can be seen, the role government can play for the creation or strengthening of the energy sector is essential and without this player sustainable growth cannot be realised.
The private sector Uganda’s GDP ranks amongst the smallest in the whole world. Even when compared with other African countries it does not fare any better. More than half of the population live under the poverty level on less than one dollar a day. Recently, Uganda and four neighbouring countries (Kenya, Tanzania, Rwanda and Burundi) joined the East African Community, allowing free movement of people and goods. This brings some hope to the solar PV industry as the almost 130 million people in these five countries can make competitive importation of solar PV equipment from Europe and the USA more affordable.
Added to that, we recently had the birth of a new country with the split of Sudan into North and South Sudan. The newly created South Sudan with a population close to 10 million is a new market which will naturally be added to the East African Community one.
9 The Renewable Energy Policy for Uganda, Ministry of Energy and Mineral Development, 2007.Available on: www.rea.or.ug/.../RENEWABLE%20ENERGY% 20POLIC9-11-07.pdf

296
PROCEEDINGS Conference MPDES 2011
In this study we consider more specifically the Ugandan situation but Kenya and Tanzania have a greater market of solar PV than Uganda.
In Uganda the solar PV dealers have organised themselves in an association called UNREA.
UNREA The Uganda National Renewable Energy Agency Limited (UNREA) is a confederation / association of Ugandan private companies dealing in distribution of solar PV and other renewable energy technologies in Uganda. It was incorporated in 2009 and has 10 reliable solar PV dealers in Uganda as members:
1. Energy Systems Limited. 2. Power & Communications Systems Limited. 3. Solar Energy Uganda Limited. 4. Incafex Solar Power Systems Limited. 5. Konserve Consult Limited. 6. Ultra Tec Uganda Limited 7. Power Options Limited 8. Solar Energy For Africa Limited 9. Battery Masters Limited 10. Mark Impex (U) Limited
Its mission and work is defined as: “…an autonomous private sector based stakeholder and participant in the general energy sector pursuing realistic promotion, development, and deployment of sustainable clean renewable energy solutions by promoting, coordinating, demonstrating, financing, disseminating and influencing energy delivery policies, protect energy consumers, promoting private sector sustaining investment in energy delivery services in Uganda”.10
The core work of UNREA is to play a leading role in pursuing balanced rural electrification based on sustainable utilization of solar energy and other renewable energy resources in Uganda. UNREA is the strategic all-round working interface for the renewable energy sector.11
Though the volume of trade is still small, UNREA is determined to become a very important player in the renewable energy sector as government provides suitable taxation schemes and channels funds from development agencies towards the private sector via mechanisms such as Public Private Partnership (PPP) where government entrusts to the private sector activities such that the outcome can be counted as government achievement in the energy sector.
PSFU The Private Sector Foundation Uganda (PSFU) is also playing a very important role as a government organ with the function of supporting the private sector. They have received support from the World Bank under the Energy for Rural Transformation (ERT) project and have availed the business community with grants up to 50% to cover
10 “Uganda Renewable Energy Feed-in Tariff (REFIT); Phase 2; Guidelines 2010; November 2010” yet to be implemented is the feed-in-tariff for grid connected PV systems. Available on: www.era.or.ug/.../Approved_Uganda%20REFIT% 20Guidelines%20V4%20(2).pdf 11 UNREA – Memorandum of the company, 2009
consultancy and market survey to provide a smooth start to business.
It is not the mission of this paper to delve into the activities of PSFU but a visit on their website will show the tremendous impact they are having in the energy sector under the above mentioned ERT project.
Currently CREEC has a Memorandum of Understanding with PSFU to work in three areas, namely: solar PV, small hydro-power and energy efficiency. Under this last one CREEC is expected to do verification and evaluation of the creation of a 10 MVA Virtual Power Station (VPS) made up of savings from energy efficient projects from at least 50 industries.
Conclusions Although all three partners for the triple helix system are already in place in Uganda, we are yet to start working in a more systematic manner together. We have the opinion that rather than designing great schemes, the right path is to start doing some projects in cooperation and to widen little by little the scope of this clusters cooperation upon verifying the success of the venture.
As can be seen by the two sample activities performed at CREEC’s lab, the initiative can help all solar PV industry stakeholders. As mentioned above, government has created the position of a District Energy Officer to handle matters pertaining especially renewable energy at district level. Currently there are close to 100 districts in Uganda. So, practical training in our facilities would go a long way to produce the right people to take over these responsibilities and thus help penetration of renewable energy technologies into rural Uganda. For the private sector the test laboratory at CREEC can provide short term training to get technicians able to install reliable systems from SHSs to large institutional ones. Finally, for the academia this is a perfect place to give engineers hands on experience which sometimes is lacking in many high level training institutions in sub-Sahara Africa.
All the possible activities of the solar PV laboratory at CREEC have as their overall goal to support the growth of the solar PV market in Uganda and provide solutions for the energy needs of people in rural areas using the concept of decentralized renewable energy power supply. Once fully installed the lab will play a relevant role in setting up a renewable energy cluster in Uganda and the East African region able to emulate the success of Silicon Valley.

297
PROCEEDINGS Conference MPDES 2011
Waste to Energy – Making charcoal fines useable
Centre for Research in Energy and Energy Conservation (CREEC), Faculty of Technology Makerere University
Vianney Tumwesige P.O. Box 7062, Kampala-Uganda
www.creec.or.ug [email protected]
Abstract Agricultural wastes and charcoal fines can be transformed into charcoal briquettes, and this could result in decreased exploitation of rain forests. This paper discusses charcoal briquette production and reports a study on perceptions of these briquettes from 25 charcoal consumers. Keywords: Charcoal fines; Briquettes.
Background Uganda's energy balance is comprised of hydro, solar, petroleum and biomass. Among these, biomass contributes to over 91% of the total energy consumed in the country to meet basic energy needs for cooking and water heating. The traditional ways of using biomass are 80% wood, 6% charcoal and 5% agricultural waste (MEMD1, 2008).
Uganda’s failure to transform its natural agricultural wastes into charcoal briquettes has resulted in increased exploitation of Uganda’s primary forests. The country's failure to legislate for sustainable practices in the logging industry has resulted in forests that are currently being depleted with no plans for replacement. This is causing an even greater shortage of the woody biomass needed for making firewood and charcoal, and has contributed to an incremental increase in the fuel price and the need for rural people to spend more time and effort in collecting firewood.
Charcoal is a popular household fuel in many parts of Uganda with a consumption of about 600,000 tons in 2008 (MEMD, 2008 Annual report). To produce 1 ton of charcoal, on average 7 tons of wood are burned in inefficient kilns causing rapid dwindling of forests resource. The charred material burns longer, has a steady flame; is easier to transport / handle and dries faster after it becomes wet compared to wood.
The proportion of charcoal fines in bags significantly increases by up to 15% during distribution. The more the charcoal is handled and the greater the number of transport stages, the more charcoal fines are produced. The disadvantages of charcoal fines include its inability to burn in the usual charcoal stove as well as its lower purity than charcoal. As a result, these charcoal fines are rarely used and often are dumped.
1 MEMD – Ministry of Energy and Mineral development
Approach Objective The main purpose of this study was to establish a sustainable business model for effective use of charcoal briquettes made from charcoal fines and agricultural by- products (referred to below as “Eco-Manda”).
Data from the survey in Kampala allowed the following: (i) greater understanding of charcoal users’ perceptions and attitudes towards charcoal and Eco-Manda; (ii) assessment of households’ ability and willingness to switch from charcoal to Eco-Manda; and finally (iii) identification of barriers that may inhibit charcoal users from switching to Eco-Manda.
Waste to energy The process of compaction of residues into a product of higher density than the original raw material is known as briquetting. Briquettes are made by pressing a mixture of binding material with charcoal fines and carbonized agricultural waste into a mould. The briquettes are then sun dried, packaged and distributed to the final consumer. Briquettes can be used as a cooking fuel by burning in a modified stove.
Compared to fire wood or loose biomass, briquettes show much higher specific density of 1000 to 1500 kg/m3 and a bulk density of 800 kg/m3 because of low moisture content. This is compared to a bulk density of 60 to 180 kg/m3 for loose biomass (Ahmed2, 2010). Due to their high density and low moisture content, the briquettes have a longer burning time. In this way they make good use of waste materials and reduce depletion of forestry resources. Furthermore, end-users save money because the product is obtained from cheaper raw materials.
Pilot project Production The process of briquette production took place at CREEC bio-energy research centre. One hundred and twenty five kilograms of charcoal briquettes were produced using two main components; charcoal fines and a binder. This time cassava flour was used for binding the fines.
To remove larger particles, the charcoal fines were crushed and sieved. Proportions of crushed material and gelatinized starch (cassava) were poured into a mixing container in a ratio of 50:1 charcoal fines to starch. In order to enhance adhesion, the crushed fines were then thoroughly mixed by hand to coat them with a film of the binder. The mixture was converted into the finished
2 Dr. Ahmed Hassan Hood’s Biomass briquetting in Sudan

298
PROCEEDINGS Conference MPDES 2011
product using a manual press e.g. modified mincing machine. The wet briquettes were placed on paper boards and dried in the sun for three days. The dried briquettes were packed in 5 kg bags.
User survey and results The packs were distributed to 25 charcoal users by Green Heat (U) Ltd3. The company chose Eco-Manda as the brand name for the self-made briquettes; Manda is a Ugandan word for charcoal. Both the product and name were tried with 25 charcoal users in September 2010 in Kampala.
The trial group represented different types of charcoal user, ranging from households, barbecue stalls and small restaurant owners. Each user was supplied with a 5 kg pack of Eco-Manda and a customer satisfaction questionnaire.
All subjects surveyed showed high preference for the brand name and feedback on the initial product was very positive. Twenty three questionnaires were returned and out of these, 13 respondents were willing to buy a 5 kg pack of Eco-Manda at $1.25, while the rest were willing to spend $1.50. Green Heat will price a 5 kg pack of Eco-Manda at $1.25. A household would consume Eco-Manda worth $3.75 per week; a restaurant would consume Eco-Manda worth $50 per week. Results from the survey indicated that households and small restaurants spend between $5 and $65 respectively on charcoal per week.
The survey investigated what are the motives of the current charcoal users to switch from charcoal to Eco-Manda. The responses are shown in the table below:
Table 1: Motivating factors
Factor Respondent
Number Percentage Lower cost (LC) 1 4 Efficiency (Eff.) 6 26 Environment (Env't) 6 26 All the above 3 13 LC and Eff. 1 4 LC and Env't 2 9 Eff. and Env't 2 9 None of the above 2 9 Total 23 100 From the table above, 6 respondents would purchase
Eco-Manda because of efficiency and for environmental reasons. Three respondents would be motivated to buy Eco-Manda because of the low cost, efficiency and for environmental reasons.
In addition, 20 respondents found Eco-Manda better than conventional charcoal, since Eco-Manda provided stable heat for a longer period of time. Nineteen respondents reported Eco-Manda to be of superior quality than conventional charcoal.
3 Green Heat (U) Ltd starts commercial briquette production in January 2011.
A criticism of Eco-Manda from some of the respondents was that it was easy to break and could not be transferred to another stove once lit, as it would disintegrate. Fifteen subjects stated that Eco-Manda was also harder to ignite than conventional charcoal.
Lessons learned Transformation of charcoal fines and agricultural waste into charcoal briquettes, contributes to fuel (charcoal) efficiency, thus reducing carbon dioxide emissions and saving wood.
Green Heat will purchase charcoal fines to make the briquettes, thus providing additional income to charcoal vendors. Finally, Eco-Manda would enable households and restaurants to save between $2 and $15 weekly, respectively.
Research demands Green Heat (U) Ltd will purchase an electric powered briquette press which will mould Eco-Manda into pillow-like shapes. This press has rollers which exert a pressure of 900 kg/m2, making each briquette tougher and more compressed than it was possible using a hand press. The thin edges of the briquette are likely to allow easy ignition.
Research is needed on alternative binders; cassava-starch is commonly used as the binder, but it is a staple food for many communities in Uganda.
Since cost of fuel is an important factor to the majority of Ugandans, any company wishing to venture into this as a business should aim at producing a fuel that is sustainable and affordable. This requires both understanding of consumer behavior and market research.
Impressum
Druck: Endformat, Ges. für gute Druckerzeugnisse mbHPrinting: Köpenicker Str. 187-188, 10997 Berlin
Verlag: Universitätsverlag der TU BerlinPublisher: Universitätsbibliothek Fasanenstr. 88 (im VOLKSWAGEN-Haus), D-10623 Berlin
Tel.: (030)314-76131 Fax: (030)314-76133 E-Mail: [email protected] http://www.univerlag.tu-berlin.de
* Gedruckt auf säurefreiem alterungsbeständigem Papier
ISBN 978-3-7983-2319-3 (Druckausgabe)ISBN 978-3-7983-2320-9 (Online-Version)
Berlin 2011

Martina Schäfer, Noara Kebir, Daniel Philipp (editors)
organized by
funded by
supported by
ISBN 978-3-7983-2319-3 (Druckausgabe)ISBN 978-3-7983-2320-9 (Online-Version)
MICRO PERSPECTIVES FOR DECENTRALIZED ENERGY SUPPLY
Proceedings of the International Conference
Technische Universität Berlin, 7th-8th of April 2011
of th
e In
tern
atio
nal
Con
fere
nce
Berlin 2011
MIC
RO P
ERSP
ECTI
VES
FOR
D
ECEN
TRA
LIZED
EN
ERG
Y SU
PPLY
PR
OC
EE
DIN
GS
Promotionskolleg Mikroenergie-Systeme