Cost estimation method for variation management - Archive ...
11
HAL Id: hal-02168303 https://hal.archives-ouvertes.fr/hal-02168303 Submitted on 27 Mar 2020 HAL is a multi-disciplinary open access archive for the deposit and dissemination of sci- entific research documents, whether they are pub- lished or not. The documents may come from teaching and research institutions in France or abroad, or from public or private research centers. L’archive ouverte pluridisciplinaire HAL, est destinée au dépôt et à la diffusion de documents scientifiques de niveau recherche, publiés ou non, émanant des établissements d’enseignement et de recherche français ou étrangers, des laboratoires publics ou privés. Cost estimation method for variation management S. Mirdamadi, Alain Etienne, Alaa Hassan, J.Y. Dantan, Ali Siadat To cite this version: S. Mirdamadi, Alain Etienne, Alaa Hassan, J.Y. Dantan, Ali Siadat. Cost estimation method for varia- tion management. Procedia CIRP, ELSEVIER, 2013, 10 (2), pp.44-53. 10.1016/j.procir.2013.08.011. hal-02168303
-
Upload
khangminh22 -
Category
Documents
-
view
2 -
download
0
Transcript of Cost estimation method for variation management - Archive ...

HAL Id: hal-02168303https://hal.archives-ouvertes.fr/hal-02168303
Submitted on 27 Mar 2020
HAL is a multi-disciplinary open accessarchive for the deposit and dissemination of sci-entific research documents, whether they are pub-lished or not. The documents may come fromteaching and research institutions in France orabroad, or from public or private research centers.
L’archive ouverte pluridisciplinaire HAL, estdestinée au dépôt et à la diffusion de documentsscientifiques de niveau recherche, publiés ou non,émanant des établissements d’enseignement et derecherche français ou étrangers, des laboratoirespublics ou privés.
Cost estimation method for variation managementS. Mirdamadi, Alain Etienne, Alaa Hassan, J.Y. Dantan, Ali Siadat
To cite this version:S. Mirdamadi, Alain Etienne, Alaa Hassan, J.Y. Dantan, Ali Siadat. Cost estimation method for varia-tion management. Procedia CIRP, ELSEVIER, 2013, 10 (2), pp.44-53. �10.1016/j.procir.2013.08.011�.�hal-02168303�

Cost estimation method for variation managementS. Mirdamadi*, A. Etienne, A. Hassan, J.Y. Dantan and A. Siadat
aLCFC, Arts et Métiers ParisTech Metz, 4 Rue Augustin Fresnel, 57078 METZ CEDEX 3, Francea
Cost engineering key objectives is to ensure cost estimates' accuracy and to avoid cost overruns. In such a global context, this paper focuses on the manner through which the uncertainties as well as variations, impact the cost dimensions during different phases of product lifecycle: Tolerance allocation, Process Planning, Inspection Planning.What is investigated is the adaptability of a modified Activity-Based Costing model in evaluation of cost regarding the activities indifferent stages of theplanning, via the impact of variations and uncertainties (i.e. inspection risk). The aim is to take into account not only the cost but also the quality (quality-driven activity-based costing) of product.
1. Introductiona
The cost estimation is considered as a key activity toimprove the tolerance allocation, to select fittest manufacturing resources or inspection allocation planning. Particular deficiency of cost estimation methods and techniques is their specific use cases andapplications. For instance parametric models areappropriate to tolerance design to assess the cost impacted by tolerance allocation. The drawbacks andadvantages of parametric and two other approaches in cost estimation will be compared in 3. A significantamount of research has been devoted two essentialinconveniences in these approaches; costly evaluation of their required parameters and also their limited validityand generality in the industrial framework. Moreover,they are supposed to be applicable in different design stages with variant granularity of information as it isdiscussed in section 2.
Therefore, we propose a unified method which couldbe used for cost estimation in several stages of a product design cycle: Tolerance design, CAPP (Computer Aided Process Planning) and CAIP (Computer Aided
Inspection Planning). Contrary to existing solutions, thismethod consists in assessing the subsequent costs impacted by the variation management: quality weightedcost (quality-driven ABC). To estimate themanufacturing cost of the product through an improvedABC approach, the proposed concept takes into account the quality of both product and process.
As it is shown by [1], the selection of manufacturingand product control process, including variousparameters and accuracies, are strongly affected by thetolerance of the part to be machined. In the same context [2] proposed an approach for functional toleranceallocation that provides the best ratio between functionalperformances and manufacturing cost. They intended toconsider the manufacturing constraints in the early stages of the design process, to identify the parameterswith relevant impacts on product performance and itscost, as it is applied in our approach. A tight tolerancewould cause a sharp increase in manufacturing cost.
less strict control and vice versa. The assignment of anover-relaxed tolerance would also increase the total cost. The quality loss depends also on process tolerancesrelevance [3] usually comprised in process capability.
Through slight modifications to the classic ABCmethod, it could federate the costs, not necessarily
life cycle. Probabilities are involved to the activitiesdefined in ABC. Activities are associated with cost drivers due to consumption of resources, uncertainty andvariations. These latter permit us to estimate the cost regarding to activity drivers and not to activity cost as
2. Cost estimation methods essential to variationmanagement
Influence of design on manufacturing cost is usuallygreat. Considering manufacturing in early product design stage [4] avoids the errors which tend tocontribute as much as 70% to the cost of production.Design for manufacturing (DFM) is an activity of assessing the manufacturability, improving design,estimating the cost in the product development stage.Moreover, variations and uncertainties are ubiquitous inproduct and manufacturing process design andconcurrent engineering. Indeed, the inherent variationsand uncertainties of manufacturing processes and ffresources involve a degradation of functionalcharacteristics. Performance evaluation of design iswilling to find a compromise between allocatedtolerance, process precision and control uncertainty. Todo so [5] co-evaluate the product, process andproduction system. They believe that the most important
o respect the product functionality, quality,manufacturability, cost and performance.
The goal here is as well to put the management of variations and uncertainties in a concurrent engineeringcontext. There is an important question that would needto be looked upon: Why cost estimation methods areessential to variation management?
At each stage of the product and manufacturingprocess design, it is necessary to quantify the totalimpact of variations on the safety, perception,performance, and end cost of the product. The costs of variations typically include scrap, downgraded product,
on three main activities of the product development which impact the variation and the cost: Toleranceallocation, Process planning, and Inspection planning.
2.1. Tolerance allocation / preliminary process plangeneration
To ensure a certain level of product quality, thetolerance allocation aims to determine the acceptablelimits of the part deviations (variations). The allocation or synthesis of functional tolerances takes placegenerally during the detailed design and greatly impactsthe design of the manufacturing process, manufacturing
on the manufacturing cost and product quality (customer satisfaction) are then quantified. These two concepts areusually considered as conflicting goals. Most of theapproaches consist in balancing the distribution of thetolerance interval [6]. These approaches focus on therequirement and the customer satisfaction while ignoringthe tolerance impacts on the manufacturing process
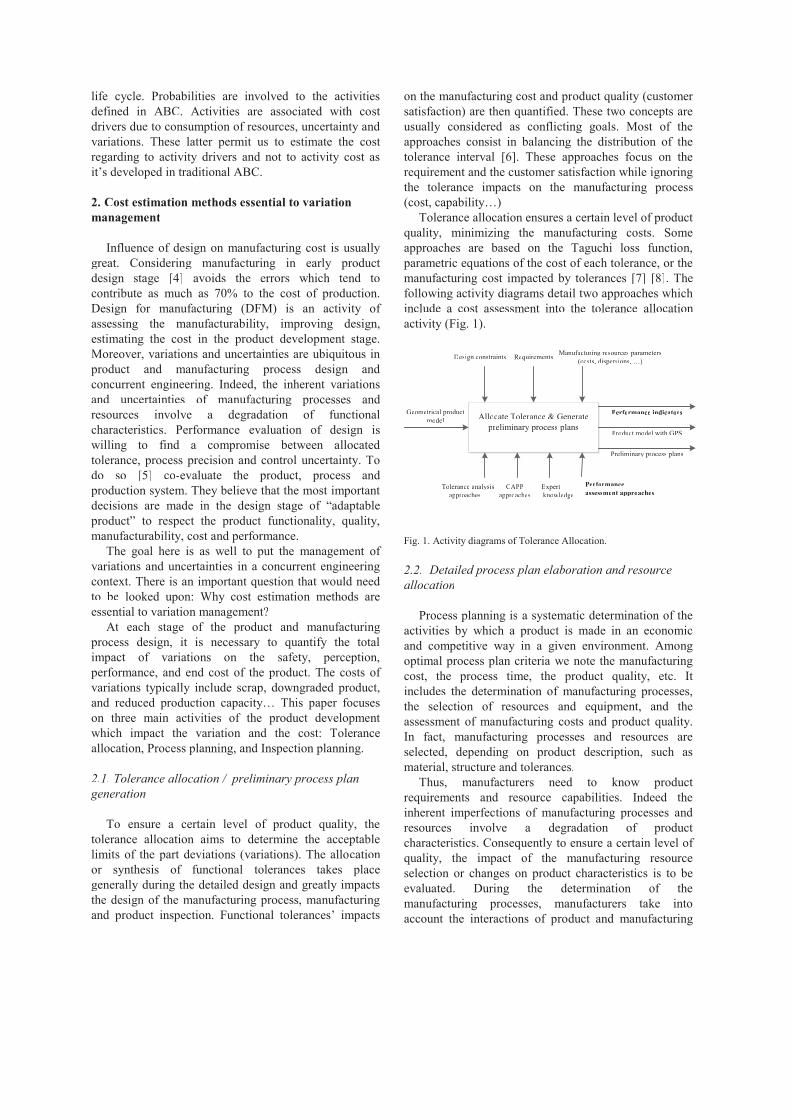
Tolerance allocation ensures a certain level of product quality, minimizing the manufacturing costs. Someapproaches are based on the Taguchi loss function,parametric equations of the cost of each tolerance, or themanufacturing cost impacted by tolerances [7] [8]. The following activity diagrams detail two approaches whichinclude a cost assessment into the tolerance allocation activity (Fig. 1).
Allocate Tolerance & Generatepreliminaryrr process plans
Perfoff rmance indicators
Produd ct model with GPS
Preliminaryrr process plans
Design constraints Requirements Manufaff ctut ring resources parameters(costs, dispersions, )
Tolerance analysisapa proaches
CAPPapa proaches
Expertknowledge
Perfoff rmanceassessment approaches
Geometrical produd ctmodel
Fig. 1. Activity diagrams of Tolerance Allocation.
2.2. Detailed process plan elaboration and resourceallocation
Process planning is a systematic determination of theactivities by which a product is made in an economicand competitive way in a given environment. Among optimal process plan criteria we note the manufacturingcost, the process time, the product quality, etc. It includes the determination of manufacturing processes, the selection of resources and equipment, and theassessment of manufacturing costs and product quality.In fact, manufacturing processes and resources areselected, depending on product description, such asmaterial, structure and tolerances.
Thus, manufacturers need to know product requirements and resource capabilities. Indeed the inherent imperfections of manufacturing processes andresources involve a degradation of product characteristics. Consequently to ensure a certain level of quality, the impact of the manufacturing resource selection or changes on product characteristics is to beevaluated. During the determination of themanufacturing processes, manufacturers take intoaccount the interactions of product and manufacturing
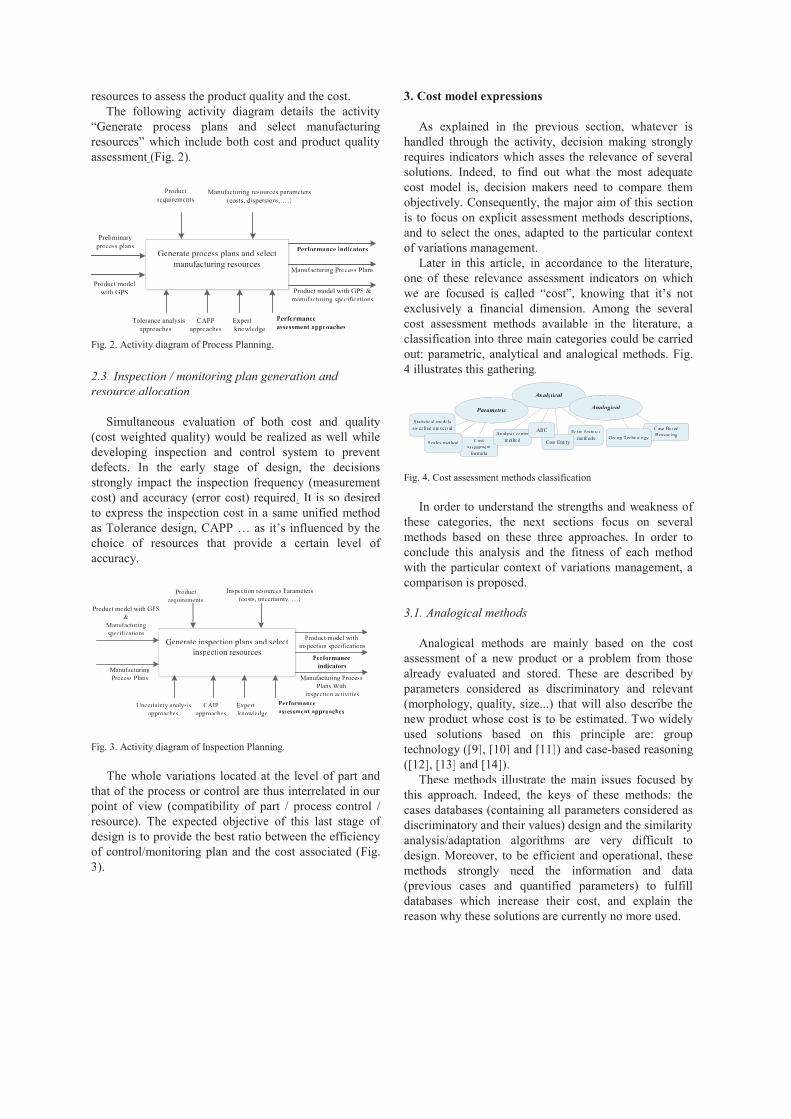
resources to assess the product quality and the cost.The following activity diagram details the activity
assessment (Fig. 2).
Generate process plans and selectmanufaff ctut ring resources
Perfoff rmance indicators
Produd ct model with GPS &manufaff ctut ring specififf cations
Manufaff ctut ring Process Plans
Produd ctrequirements
Manufaff ctut ring resources parameters(costs, dispersions, )
Tolerance analysisapa proaches
CAPPapa proaches
Expertknowledge
Perfoff rmanceassessment approaches
Produd ct modelwith GPS
Preliminaryrrprocess plans
Fig. 2. Activity diagram of Process Planning.
2.3. Inspection / monitoring plan generation and resource allocation
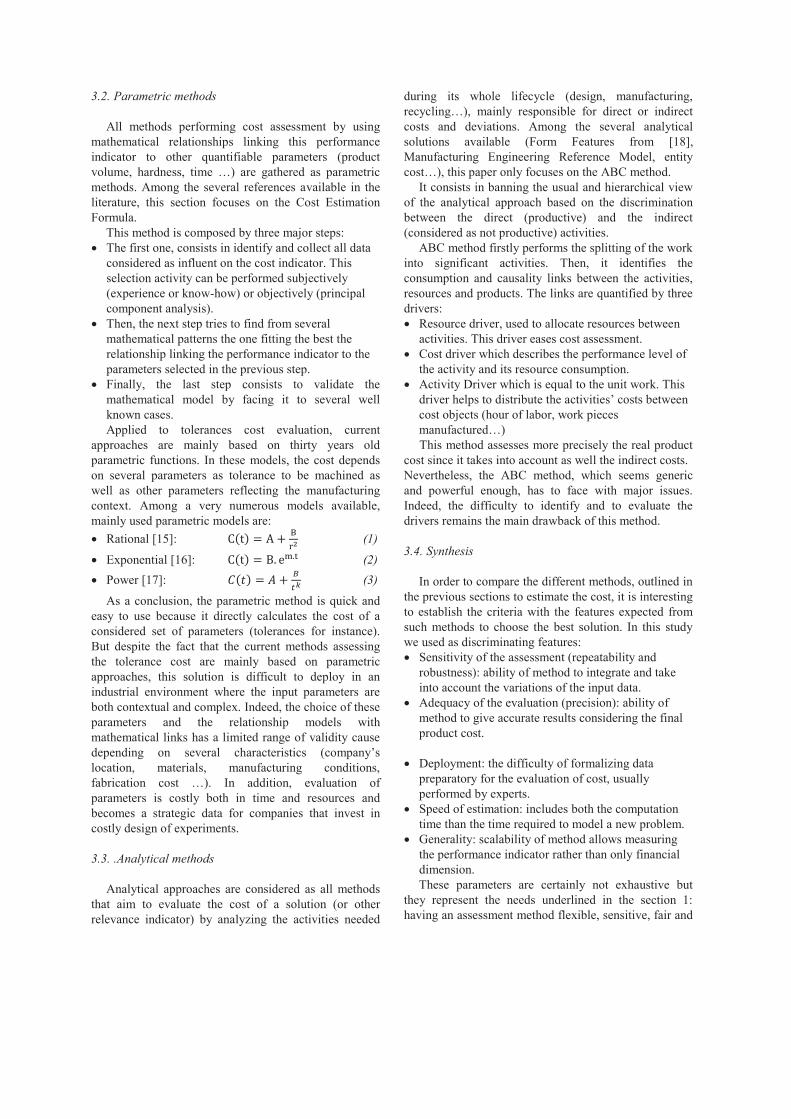
Simultaneous evaluation of both cost and quality(cost weighted quality) would be realized as well whiledeveloping inspection and control system to preventdefects. In the early stage of design, the decisionsstrongly impact the inspection frequency (measurement cost) and accuracy (error cost) required. It is so desired to express the inspection cost in a same unified method
choice of resources that provide a certain level of accuracy.
Generate inspection plans and selectinspection resources
Perfoff rmanceindicators
Manufaff ctut ring ProcessPlans With
inspection activities
Produdd ct model withinspection specififf cations
Produdd ctrequirements
Inspection resources Parameters(costs, uncertainty, )
Uncertainty analysisapa proaches
CAIPapaa proaches
Expertknowledge
Perfoff rmanceassessment approaches
Produdd ct model with GPS&
Manufaff ctutt ringspecififf cations
Manufaff ctutt ringProcess Plans
Fig. 3. Activity diagram of Inspection Planning.
The whole variations located at the level of part andthat of the process or control are thus interrelated in our point of view (compatibility of part / process-control / resource). The expected objective of this last stage of design is to provide the best ratio between the efficiencyof control/monitoring plan and the cost associated (Fig. 3).
3. Cost model expressions
As explained in the previous section, whatever ishandled through the activity, decision making strongly requires indicators which asses the relevance of severalsolutions. Indeed, to find out what the most adequatecost model is, decision makers need to compare themobjectively. Consequently, the major aim of this sectionis to focus on explicit assessment methods descriptions,and to select the ones, adapted to the particular context of variations management.
Later in this article, in accordance to the literature,one of these relevance assessment indicators on whichweexclusively a financial dimension. Among the severalcost assessment methods available in the literature, a classification into three main categories could be carried out: parametric, analytical and analogical methods. Fig.4 illustrates this gathering.
Fig. 4. Cost assessment methods classification
In order to understand the strengths and weakness of these categories, the next sections focus on severalmethods based on these three approaches. In order toconclude this analysis and the fitness of each methodwith the particular context of variations management, acomparison is proposed.
3.1. Analogical methods
Analogical methods are mainly based on the cost assessment of a new product or a problem from thosealready evaluated and stored. These are described by parameters considered as discriminatory and relevant (morphology, quality, size...) that will also describe thenew product whose cost is to be estimated. Two widelyused solutions based on this principle are: grouptechnology ([9], [10] and [11]) and case-based reasoning ([12], [13] and [14]).
These methods illustrate the main issues focused by this approach. Indeed, the keys of these methods: thecases databases (containing all parameters considered as discriminatory and their values) design and the similarityanalysis/adaptation algorithms are very difficult to design. Moreover, to be efficient and operational, these methods strongly need the information and data (previous cases and quantified parameters) to fulfilldatabases which increase their cost, and explain thereason why these solutions are currently no more used.
Analyll titt cal
PaPP rametrtt ic Analoll go ical
Statistical modelsso-called universal
Costassessment
foff rmula
Scales method
Case BasedReasoningGroupu Technology
Form feff atut resmethods
Analysis centermethod Cost Entity
ABC
3.2. Parametric methods
All methods performing cost assessment by using mathematical relationships linking this performance indicator to other quantifiable parameters (product
methods. Among the several references available in the literature, this section focuses on the Cost Estimation Formula.
This method is composed by three major steps: The first one, consists in identify and collect all data considered as influent on the cost indicator. This selection activity can be performed subjectively (experience or know-how) or objectively (principal component analysis). Then, the next step tries to find from several mathematical patterns the one fitting the best the relationship linking the performance indicator to the parameters selected in the previous step. Finally, the last step consists to validate the mathematical model by facing it to several well known cases. Applied to tolerances cost evaluation, current
approaches are mainly based on thirty years old parametric functions. In these models, the cost depends on several parameters as tolerance to be machined as well as other parameters reflecting the manufacturing context. Among a very numerous models available, mainly used parametric models are:
Rational [15]: (1)
Exponential [16]: (2) Power [17]: (3)
As a conclusion, the parametric method is quick and easy to use because it directly calculates the cost of a considered set of parameters (tolerances for instance). But despite the fact that the current methods assessing the tolerance cost are mainly based on parametric approaches, this solution is difficult to deploy in an industrial environment where the input parameters are both contextual and complex. Indeed, the choice of these parameters and the relationship models with mathematical links has a limited range of validity cause depenlocation, materials, manufacturing conditions,
parameters is costly both in time and resources and becomes a strategic data for companies that invest in costly design of experiments.
3.3. .Analytical methods
Analytical approaches are considered as all methods that aim to evaluate the cost of a solution (or other relevance indicator) by analyzing the activities needed
during its whole lifecycle (design, manufacturing, recyccosts and deviations. Among the several analytical solutions available (Form Features from [18], Manufacturing Engineering Reference Model, entity
It consists in banning the usual and hierarchical view of the analytical approach based on the discrimination between the direct (productive) and the indirect (considered as not productive) activities.
ABC method firstly performs the splitting of the work into significant activities. Then, it identifies the consumption and causality links between the activities, resources and products. The links are quantified by three drivers:
Resource driver, used to allocate resources between activities. This driver eases cost assessment. Cost driver which describes the performance level of the activity and its resource consumption. Activity Driver which is equal to the unit work. This driver cost objects (hour of labor, work pieces
This method assesses more precisely the real product cost since it takes into account as well the indirect costs. Nevertheless, the ABC method, which seems generic and powerful enough, has to face with major issues. Indeed, the difficulty to identify and to evaluate the drivers remains the main drawback of this method.
3.4. Synthesis
In order to compare the different methods, outlined in the previous sections to estimate the cost, it is interesting to establish the criteria with the features expected from such methods to choose the best solution. In this study we used as discriminating features:
Sensitivity of the assessment (repeatability and robustness): ability of method to integrate and take into account the variations of the input data. Adequacy of the evaluation (precision): ability of method to give accurate results considering the final product cost.
Deployment: the difficulty of formalizing data preparatory for the evaluation of cost, usually performed by experts. Speed of estimation: includes both the computation time than the time required to model a new problem. Generality: scalability of method allows measuring the performance indicator rather than only financial dimension. These parameters are certainly not exhaustive but
they represent the needs underlined in the section 1: having an assessment method flexible, sensitive, fair and
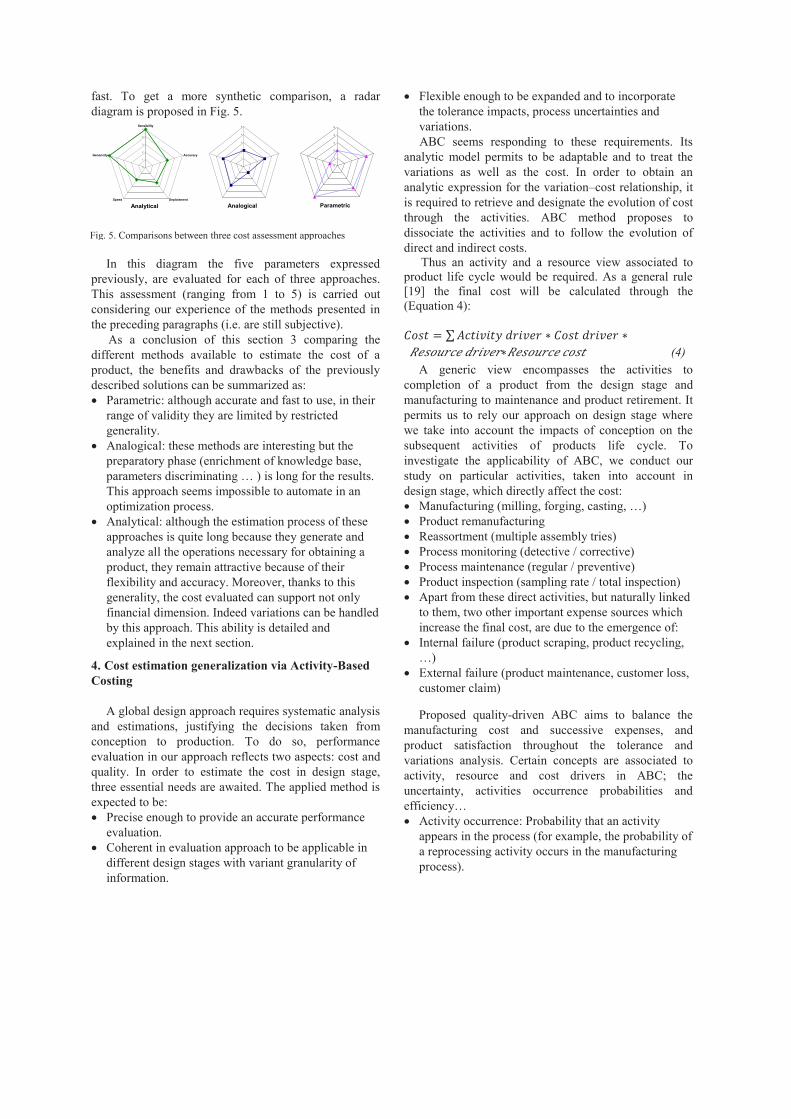
fast. To get a more synthetic comparison, a radar diagram is proposed in Fig. 5.
In this diagram the five parameters expressed previously, are evaluated for each of three approaches. This assessment (ranging from 1 to 5) is carried out considering our experience of the methods presented in the preceding paragraphs (i.e. are still subjective).
As a conclusion of this section 3 comparing the different methods available to estimate the cost of a product, the benefits and drawbacks of the previously described solutions can be summarized as:
Parametric: although accurate and fast to use, in their range of validity they are limited by restricted generality. Analogical: these methods are interesting but the preparatory phase (enrichment of knowledge base,
results. This approach seems impossible to automate in an optimization process. Analytical: although the estimation process of these approaches is quite long because they generate and analyze all the operations necessary for obtaining a product, they remain attractive because of their flexibility and accuracy. Moreover, thanks to this generality, the cost evaluated can support not only financial dimension. Indeed variations can be handled by this approach. This ability is detailed and explained in the next section.
4. Cost estimation generalization via Activity-BasedCosting
A global design approach requires systematic analysis and estimations, justifying the decisions taken from conception to production. To do so, performance evaluation in our approach reflects two aspects: cost and quality. In order to estimate the cost in design stage, three essential needs are awaited. The applied method is expected to be:
Precise enough to provide an accurate performance evaluation. Coherent in evaluation approach to be applicable in different design stages with variant granularity of information.
Flexible enough to be expanded and to incorporate the tolerance impacts, process uncertainties and variations. ABC seems responding to these requirements. Its
analytic model permits to be adaptable and to treat the variations as well as the cost. In order to obtain an analytic expression for the variation cost relationship, it is required to retrieve and designate the evolution of cost through the activities. ABC method proposes to dissociate the activities and to follow the evolution of direct and indirect costs.
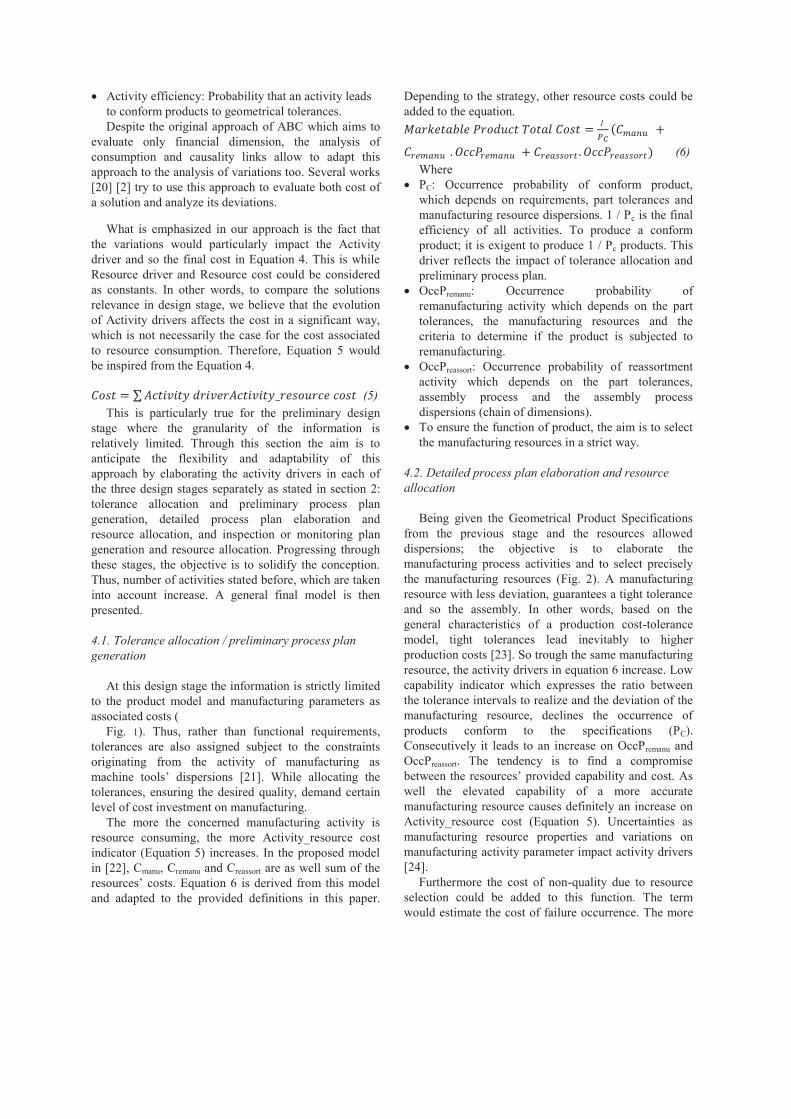
Thus an activity and a resource view associated to product life cycle would be required. As a general rule [19] the final cost will be calculated through the (Equation 4):
(4) A generic view encompasses the activities to
completion of a product from the design stage and manufacturing to maintenance and product retirement. It permits us to rely our approach on design stage where we take into account the impacts of conception on the subsequent activities of products life cycle. To investigate the applicability of ABC, we conduct our study on particular activities, taken into account in design stage, which directly affect the cost:
Product remanufacturing Reassortment (multiple assembly tries) Process monitoring (detective / corrective) Process maintenance (regular / preventive) Product inspection (sampling rate / total inspection) Apart from these direct activities, but naturally linked to them, two other important expense sources which increase the final cost, are due to the emergence of: Internal failure (product scraping, product recycling,
External failure (product maintenance, customer loss, customer claim)
Proposed quality-driven ABC aims to balance the manufacturing cost and successive expenses, and product satisfaction throughout the tolerance and variations analysis. Certain concepts are associated to activity, resource and cost drivers in ABC; the uncertainty, activities occurrence probabilities and
Activity occurrence: Probability that an activity appears in the process (for example, the probability of a reprocessing activity occurs in the manufacturing process).
0
1
2
3
4
5
0
1
2
3
4
5Sensibility
Accuracy
DeploiementSpeed
Genericity
0
1
2
3
4
5
Analytical Analogical Parametric
Fig. 5. Comparisons between three cost assessment approaches
Activity efficiency: Probability that an activity leads to conform products to geometrical tolerances. Despite the original approach of ABC which aims to
evaluate only financial dimension, the analysis of consumption and causality links allow to adapt this approach to the analysis of variations too. Several works [20] [2] try to use this approach to evaluate both cost of a solution and analyze its deviations.
What is emphasized in our approach is the fact that the variations would particularly impact the Activity driver and so the final cost in Equation 4. This is while Resource driver and Resource cost could be considered as constants. In other words, to compare the solutions relevance in design stage, we believe that the evolution of Activity drivers affects the cost in a significant way, which is not necessarily the case for the cost associated to resource consumption. Therefore, Equation 5 would be inspired from the Equation 4.
(5) This is particularly true for the preliminary design
stage where the granularity of the information is relatively limited. Through this section the aim is to anticipate the flexibility and adaptability of this approach by elaborating the activity drivers in each of the three design stages separately as stated in section 2: tolerance allocation and preliminary process plan generation, detailed process plan elaboration and resource allocation, and inspection or monitoring plan generation and resource allocation. Progressing through these stages, the objective is to solidify the conception. Thus, number of activities stated before, which are taken into account increase. A general final model is then presented.
4.1. Tolerance allocation / preliminary process plan generation
At this design stage the information is strictly limited to the product model and manufacturing parameters as associated costs (
Fig. 1). Thus, rather than functional requirements, tolerances are also assigned subject to the constraints originating from the activity of manufacturing as
[21]. While allocating the tolerances, ensuring the desired quality, demand certain level of cost investment on manufacturing.
The more the concerned manufacturing activity is resource consuming, the more Activity_resource cost indicator (Equation 5) increases. In the proposed model in [22], Cmanu, Cremanu and Creassort are as well sum of the
and adapted to the provided definitions in this paper.
Depending to the strategy, other resource costs could be added to the equation.
(6) Where PC: Occurrence probability of conform product, which depends on requirements, part tolerances and manufacturing resource dispersions. 1 / Pc is the final efficiency of all activities. To produce a conform product; it is exigent to produce 1 / Pc products. This driver reflects the impact of tolerance allocation and preliminary process plan. OccPremanu: Occurrence probability of remanufacturing activity which depends on the part tolerances, the manufacturing resources and the criteria to determine if the product is subjected to remanufacturing. OccPreassort: Occurrence probability of reassortment activity which depends on the part tolerances, assembly process and the assembly process dispersions (chain of dimensions). To ensure the function of product, the aim is to select the manufacturing resources in a strict way.
4.2. Detailed process plan elaboration and resource allocation
Being given the Geometrical Product Specifications from the previous stage and the resources allowed dispersions; the objective is to elaborate the manufacturing process activities and to select precisely the manufacturing resources (Fig. 2). A manufacturing resource with less deviation, guarantees a tight tolerance and so the assembly. In other words, based on the general characteristics of a production cost-tolerance model, tight tolerances lead inevitably to higher production costs [23]. So trough the same manufacturing resource, the activity drivers in equation 6 increase. Low capability indicator which expresses the ratio between the tolerance intervals to realize and the deviation of the manufacturing resource, declines the occurrence of products conform to the specifications (PC). Consecutively it leads to an increase on OccPremanu and OccPreassort. The tendency is to find a compromise
rovided capability and cost. As well the elevated capability of a more accurate manufacturing resource causes definitely an increase on Activity_resource cost (Equation 5). Uncertainties as manufacturing resource properties and variations on manufacturing activity parameter impact activity drivers [24].
Furthermore the cost of non-quality due to resource selection could be added to this function. The term would estimate the cost of failure occurrence. The more
it is contributed to manufacturing cost, the less is the probability of failure occurrence. To calculate the failure cost (Equation 7), Activity-resource costs (Equation 5) associated to failures, as the cost of recycling or client reclamation, are usually fixed. So the objective is usually to decrease two activity drivers and failure emergence probabilities through:
OccPIntFailure: Occurrence probability of internal failures, OccPExtFailure: Occurrence probability of external failures, could be estimated through FMEA method [25].
Total Failure Cost = (Cprd scrp + Cprd recycle + ). OccPInt.Failure.Occ + (Cprd mntc + Crclmntn + ). OccPExt.Failure.Occ (7)
Where Cprd scrap: Cost of internal product scraping Cprd recycl: Cost of product recycling Cprd mntc: Cost of external product maintenance Cprd rclmtn: Cost of customer reclamation The failure cost is minimal if occurrence and
detection of problems are in the same phase. As a delayed detection increases the cost, the worst case would be a failure detected by client, originated from design phase. In Equation 8 external failure cost (product maintenance, customer loss, and customer claim) is often more elevated than internal failure cost
external failure and minimise the failure cost, general tendency in manufacturing resource selection is to increase the capability. In Equation 4, it leads to increase the resource and so the manufacturing cost. The objective is to minimise the total final cost. Process monitoring, maintenance and product inspection are essential activities to prevent failure occurrence and cost increases.
4.3. Inspection / monitoring plan generation and resource allocation
Being given the manufacturing process plan and Geometrical Product Specifications to respect, this design stage is dedicated to the generation of monitoring and inspection plan (Fig. 3). The non-conformity of product to specifications elaborated by design, and also the problems encountered during the production will be detected by product inspection. Furthermore process monitoring or preventive maintenance policy, could provide an effective reduction of cost due to intervention related to the degradation or failure on production means [26]. The choices during product and process design, strongly impact the frequency and cost of these latter. The objective in this stage is to limit the level of
and to find a compromise between them. At this stage
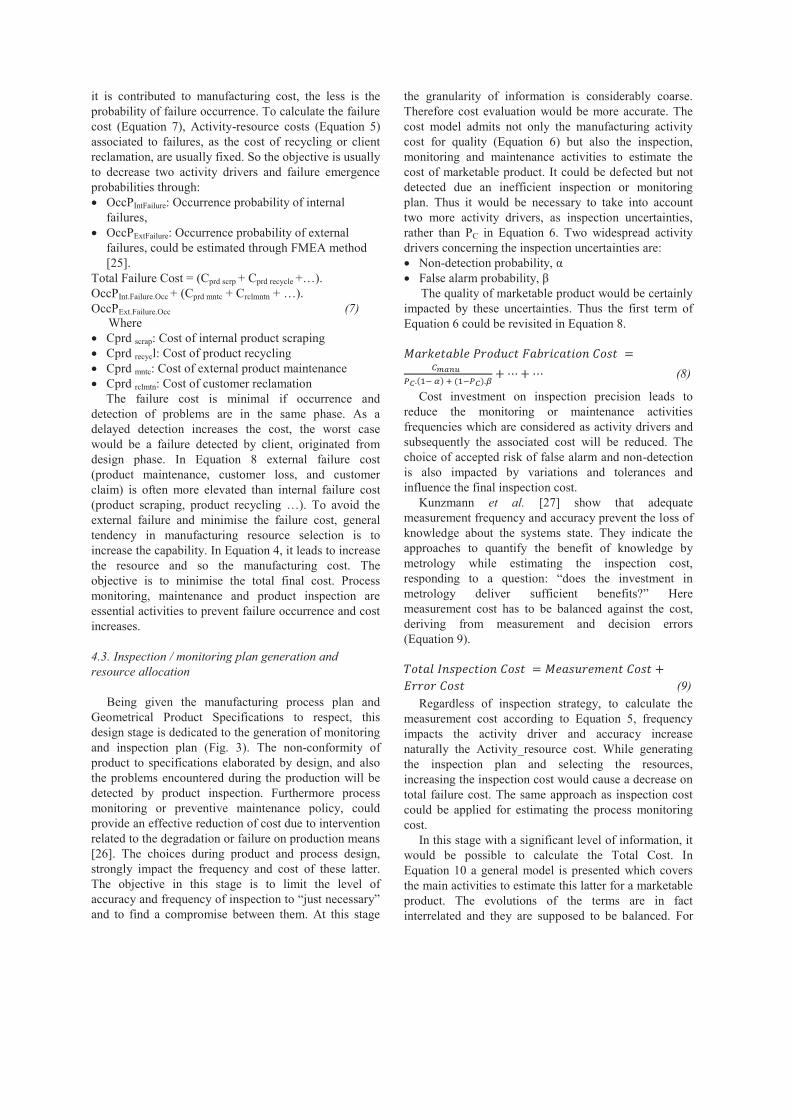
the granularity of information is considerably coarse. Therefore cost evaluation would be more accurate. The cost model admits not only the manufacturing activity cost for quality (Equation 6) but also the inspection, monitoring and maintenance activities to estimate the cost of marketable product. It could be defected but not detected due an inefficient inspection or monitoring plan. Thus it would be necessary to take into account two more activity drivers, as inspection uncertainties, rather than PC in Equation 6. Two widespread activity drivers concerning the inspection uncertainties are:
Non-
The quality of marketable product would be certainly impacted by these uncertainties. Thus the first term of Equation 6 could be revisited in Equation 8.
(8)
Cost investment on inspection precision leads to reduce the monitoring or maintenance activities frequencies which are considered as activity drivers and subsequently the associated cost will be reduced. The choice of accepted risk of false alarm and non-detection is also impacted by variations and tolerances and influence the final inspection cost.
Kunzmann et al. [27] show that adequate measurement frequency and accuracy prevent the loss of knowledge about the systems state. They indicate the approaches to quantify the benefit of knowledge by metrology while estimating the inspection cost,
measurement cost has to be balanced against the cost, deriving from measurement and decision errors (Equation 9).
(9) Regardless of inspection strategy, to calculate the
measurement cost according to Equation 5, frequency impacts the activity driver and accuracy increase naturally the Activity_resource cost. While generating the inspection plan and selecting the resources, increasing the inspection cost would cause a decrease on total failure cost. The same approach as inspection cost could be applied for estimating the process monitoring cost.
In this stage with a significant level of information, it would be possible to calculate the Total Cost. In Equation 10 a general model is presented which covers the main activities to estimate this latter for a marketable product. The evolutions of the terms are in fact interrelated and they are supposed to be balanced. For

instance it is possible to relate the causes (the interest of process monitoring and maintenance) and consequences (the interest of product conformity control). The aim is to ensure the conformity of final product to specifications with a minimal associated Total Cost.
(10)
In this section the approach to the cost estimation in three design stages was provided by treating certain cost models. Activities decomposition and activity drivers definition, could be expanded and adapted, following different strategies in enterprises. Next section demonstrates the applicability of model to an industrial case.
5. Illustration of cost model employment
As mentioned before the objective in this section is toillustrate the employment of proposed model. To ease this latter the general model is applied on a single automotive part (Cover Intermediate Shaft) (Fig. 6), called CAI.
Fig. 6. Functional plan of CAI part
For the sake of brevity and clarity of application, the example is a simplified version of the industrial case. Limited information on this part does not permit us to consider all the activities mentioned in section 4. Among them, certain points associated to costs and occurrence probabilities are taken into account as well as internal
failure emergence, causing product recycling activity in the case study (Table 1).
Table 1. Final Cost estimation data on CAI
Activity Associated Cost / Part
Occurrence probability
Manufacturing (milling) Cmanu -
Product remanufacturing Cremanu 0.000008
Product inspection Cinspctn 1
Product recycling Cprd recyclng 0.000020
The costs associated to Reassortment (in assembly cases), monitoring and maintenance are neglected (Not Available). Available activity drivers, required to final cost estimation are presented (Table 2).
Table 2. Activity driver data on CAI
Activity Driver Occurrence probability
Non- 0.00005
False alarm 0.00005
Conform product PC 0.999972
Thus regarding the Equation 10, through the application of experimental values, the Final Total cost
the evolution of cost through the activities involved in the process, permits to compare the solutions. Based on design stages mentioned in 2, admitting that the appropriate tolerances are allocated for CAI part. Thus the efficiency of manufacturing process and inspection plan is to be discussed. Generated process and inspection plans as well as their resources seem to be a non-efficient solution for an industrial case due to low inspection accuracy and maximal inspection frequency. It would be better to balance the contribution to the manufacturing cost and the inspection cost.
The flexibility of model as well as the utility of associating the cost estimation with the Activity drivers
through this section.
6. Conclusion
As shown in the previous example, proposed modeltends not only to estimate the cost but also to investigate the efficiency of solutions, either on tolerance allocation or process and inspection plan generation, and the roots of non-efficiencies based on activity drivers. It could be
The feasibility of activity-based costing method in quality management is undoubtedly one of the first assumptions in this paper. Consequently, the proposed model, based on ABC, seems to be compatible for
accounting quality cost, providing an accurate estimation.
The decisions taken in different design stages, impact in a significant way the final cost. Regardless of design stage, its objectives and accuracy level of information, it
relevance. It is certainly insufficient to treat solely the financial dimension of their performance but also the variations. Investigated quality-driven ABC is flexible enough to involve the variation in analytical models even if this aspect is not treated in the original approach. This ability to evaluate at different design stages, a
indicator could be the objective function of an optimization. Combined with a complete manufacturing and inspection process generation algorithm, this performance indicator permits to design the fittest process.
References
[1] K. Sivakumar, C. Balamurugan, and S. Ramabalan, -objective tolerance allocation of mechanical
The International Journal of Advanced Manufacturing Technology, vol. 53, no. 5-8, pp. 711-732, Aug. 2010.
[2] A. Etienne, J.-y Dantan, J. Qureshi, and A. Siadat,
International Journal on Interactive Design and Manufacturing, vol. 2, no. 4, pp. 207-218, 2008.
[3] process tolerance design based on minimum product manufacturing
The International Journal of Advanced Manufacturing Technology, vol. 25, no. 7-8, pp. 714-722, Nov. 2004.
[4] Modeling of Conceptual Process Planning Integrated with Conceptual
Manufacturing Engineering, 2000. [5] Co-evolution of products,
processes and production systems, CIRP Annals - Manufacturing Technology, vol. 59, no. 2, pp. 672-693, 2010.
[6] analyses of Cost- and Risk optimal Tolerance Allocations based on
Proceedings of the 10th CIRP International Seminar on Computer Aided Tolerancing, 2007.
[7] K. W. Chase, W. H. Greenwood, B. G. Loosli, and L. .
Manufacturing review, vol. 3, no. 1, pp. 49-59, 1990.
[8] solution to the discrete least-cost tolerance allocation problem with
The 9th CIRP International Seminar on Computer Aided Tolerancing, 2005.
[9] -aided group technology integrated CIRP Journal of Manufacturing Science and Technology,
pp. 1-38, 1988. [10]
and process planning system for sheet metal produc Journal of Materials Processing Technology, vol. 107, pp. 88-95, 2000.
[11] Expert process planning for manufacturingAddison-We. USA , 1990.
[12] International journal of advanced
manufacturing technology, vol. 10, pp. 389-395, 1995. [13]
International journal of advanced manufacturing technology, vol. 15, pp. 895-906, 1999.
[14] cost estimating models based on regression analysis, neural networks, and case- Building and environment, vol. 39, pp. 1235-1242, 2004.
[15] M. Journal of Engineering for Industry ASME, vol. 95, pp.
762-764. [16]
Journal of Engineering for Industry ASME, vol. 94, pp. 447-453.
[17] Accounting for manufacturing tolerances and costs in function
Journal of Engineering for Industry, vol. 97, pp. 283-286.
[18] evaluation in Computer aided design, Elsevier science
ldt, vol. 28, no. 11, pp. 879-885, 1996. [19] Relevance Lost: The Rise and
Fall of Management Accounting Harvard Business Review Press, 1991.
[20] -Based Tolerance Allocation (ABTA) - driving tolerance synthesis by
International Journal of Production Research, vol. 47, no. 18, pp. 4971-4989, 2009.
[21] C. Wu, Z. Computers
in Industry, vol. 35, no. 3, pp. 223-232, Apr. 1998. [22]
estimation for tolerance allocati Proceedings of the 10th CIRP International Seminar on Computer Aided Tolerancing, 2007.
[23] M. Pillet, Appliquer la maîtrise statistique des processus ( MSP / SPC ), Éditions organisation, 4th ed. 2005.
[24] J. Y. Dantan, A. Hassan, A. Etienne, A. Siadat, and P.
International Journal on Interactive Design and Manufacturing (IJIDeM), vol. 2, no. 2, pp. 107-118, Apr. 2008.
[25] A. Hassan, A. Siadat, J.-quality/cost-based improvement approach for conceptual process

International Journal of Management Science and Engineering Management, vol. 4, no. 3, pp. 188-197, 2009.
[26] A. Mousrij, H. Gziri, and E. B. Contrôle des processus de fabrication pour une meilleure qualité du produit,Sciences-New York, 2007. [27] H. Kunzmann, T. Pfeifer, R. Schmitt, H. Schwenke, and A.
-CIRP Annals-Manufacturing Technology, vol. 54, no. 2, pp. 691-713, 2005.