Cost Analysis on L-Shape Composite Component ... - CiteSeerX
95
Cost Analysis on L-Shape Composite Component Manufacturing Ruoshi Tong A Thesis in The Department of Mechanical and Industrial Engineering Presented in Partial Fulfillment of the Requirements for the Degree of Master of Applied Science (Industrial Engineering) at Concordia University Montreal, Quebec, Canada January 2012 © Ruoshi Tong, 2012
-
Upload
khangminh22 -
Category
Documents
-
view
1 -
download
0
Transcript of Cost Analysis on L-Shape Composite Component ... - CiteSeerX

Cost Analysis on L-Shape Composite Component Manufacturing
Ruoshi Tong
A Thesis
in
The Department
of
Mechanical and Industrial Engineering
Presented in Partial Fulfillment of the Requirements
for the Degree of Master of Applied Science (Industrial Engineering) at
Concordia University
Montreal, Quebec, Canada
January 2012
© Ruoshi Tong, 2012

CONCORDIA UNIVERSITY
School of Graduate Studies
This is to certify that the thesis prepared
By: Ruoshi Tong
Entitled: Cost Analysis on L-shape Composite Component Manufacturing
and submitted in partial fulfillment of the requirements for the degree of
MASc. in Industrial Engineering
complies with the regulations of the University and meets the accepted standards with
respect to originality and quality.
Signed by the final examining committee:
TBD Chair
Dr. Z. Chen Examiner
Dr. T. Zayed Examiner
Dr. S. V. Hoa Co-Supervisor
Dr.M. Chen Co-Supervisor
Approved by ___________________________________________
Chair of Department or Graduate Program Director
___________________________________________
Dean of Faculty
Date ____________________June 6 2012____________________________

III
ABSTRACT
Cost Analysis on L-shape Composite Component Manufacturing
Ruoshi Tong
In this research, the cost analysis of L-shape composite parts by using Autoclave and
Out-of-Autoclave (OOA) techniques was made. The L-shape components were made
using convex mold and concave mold respectively. In addition, production time,
manufacturing process and product quality are considered in the cost analysis. The
considered cost includes material cost, labor cost, tool and equipment costs (purchasing,
maintenance and depreciation cost) and energy consumption cost. The cost analysis
results indicate that the production time and production cost can be reduced by using
parallel steps. The results of the cost analysis conclude that using OOA will lead to least
cost production cost. Quality tests, include stretch test, void content test and compression
test, on the manufactured composites were conducted in this research. We also developed
a mathematical model for optimal production planning based on the studied
manufacturing techniques.
Keywords: Cost Analysis; L-shape Components, Composites manufacturing, Aggregate
Production Planning

IV
ACKNOWLEDGEMENTS
I am honored to express my sincere gratitude to my supervisors, Dr. Suong Van Hoa and
Dr. Mingyuan Chen, for their invaluable support and guidance through all the phases of
my graduate study and the preparation of this thesis. Their encouragement, insight, and
patience made this entire effort possible.
I would like to thank my colleagues from Concordia University and McGill University
for their precious comments and critiques in fulfillment of my thesis.
I am appreciative of financial assistance received from the Faculty of Engineering and
Computer Science, Concordia University, Concordia Centre for Composites, CRIAQ,
NSERC, Bell Helicopter, and Bombardier Aerospace.
Finally, I would like to thank my parents, and numerous friends who have supported me
technically and spiritually. Without their help and encouragement, I could not have
overcome the difficulties I encountered in successfully completing this thesis.

V
Table of Contents
ABSTRACT................................................................................................. 错误!未定义书签。
ACKOWNLEGEMENTS .......................................................................... 错误!未定义书签。
LIST OF FIGURES .................................................................................... 错误!未定义书签。
LIST OF TABLES .....................................................................................错误!未定义书签。I
CHAPTER ONE INTRODUCTION .......................................................................................... 1
1.1 FOREWORD ............................................................................................................................ 1
1.2 INTRODUCTION OF COMPOSITE MATERIALS........................................................................... 1
1.2.1 Constituents of Composite Materials............................................................................. 2
1.2.2 Applications of Composite Materials ............................................................................ 2
1.2.3 Composites Manufacturing Technology........................................................................ 2
1.2.4 Composite Manufacturing Cost Analysis ...................................................................... 3
1.4 AGGREGATE PRODUCTION PLANNING.................................................................................... 3
1.5 SCOPE OF THE THESIS............................................................................................................. 4
1.6 RESEARCH CONTRIBUTIONS................................................................................................... 4
1.7 ORGANIZATION OF THE THESIS .............................................................................................. 5
CHAPTER TWO .......................................................................................................................... 6
LITERATURE REVIEW ............................................................................................................ 6
2.1 INTRODUCTION....................................................................................................................... 6
2.2 OUT-OF-AUTOCLAVE COMPOSITES MANUFACTURING TECHNIQUE ....................................... 6
2.3 COMPOSITES MANUFACTURING COST ANALYSIS................................................................... 8

VI
2.4 QUALITY TEST TECHNIQUES FOR COMPOSITES SAMPLES ...................................................... 9
2.7 SUMMARY............................................................................................................................ 11
CHAPTER THREE.................................................................................................................... 12
MANUFACTURING THE L-SHAPE COMPOSITES PARTS ............................................ 12
3.1 THE RAW MATERIALS.......................................................................................................... 13
3.2 PREPARE PREPREGS AND CUTTING....................................................................................... 14
3.3 TOOLS PREPARATION........................................................................................................... 14
3.3.1 Autoclave Process........................................................................................................ 15
3.3.2 Out of Autoclave Processing ....................................................................................... 17
3.4 LAYING UP THE PREPREGS ................................................................................................... 18
3.5 VACUUM BAG ...................................................................................................................... 18
3.6 COMPOSITE CURING CYCLE ................................................................................................. 20
3.6.1 Curing in the Autoclave ............................................................................................... 20
3.6.2 Curing with OOA......................................................................................................... 20
3.7 REMOVING THE PART FROM THE MOLD, INSPECTION, AND FINISHING................................. 21
3.8 SUMMARY............................................................................................................................ 21
CHAPTER FOUR....................................................................................................................... 23
L-SHAPE COMPOSITE MANUFACTURING COST ANALYSIS..................................... 23
4.1 L-SHAPE COMPOSITE MANUFACTURING PRODUCTION COST ESTIMATION .......................... 23
4.1.1 Material Cost................................................................................................................ 23
4.1.2 Cutting and Layup Cost for Autoclave Samples.......................................................... 24
4.1.3 Cutting and Layup Cost for OOA Samples ................................................................. 27

VII
4.1.4 Equipment and Tools Cost........................................................................................... 28
4.1.6 Total Cost..................................................................................................................... 30
4.2 PROCESS IMPROVEMENT FOR THE SAMPLE MANUFACTURING ............................................. 30
4.3 COST ANALYSIS AND COMPARISON ..................................................................................... 35
CHAPTER FIVE ........................................................................................................................ 38
QUALITY TEST FOR L-SHAPE COMPOSITE COMPONENTS...................................... 38
5.1 TENSILE TEST ...................................................................................................................... 38
In conducting the tensile test, we used the following process. ............................................. 38
5.2 COMPRESSION TEST ............................................................................................................. 43
5.3 VOID CONTENT TEST FOR L-SHAPE COMPOSITE COMPONENTS............................................ 48
5.4 SUMMARY............................................................................................................................ 52
CHAPTER SIX ........................................................................................................................... 53
COST ANALYSIS OF COMPOSITE BUS SEAT .................................................................. 53
6.1 COMPOSITES BUS SEAT........................................................................................................ 53
6.2 COMPOSITE BUS SEAT MANUFACTURING COST ESTIMATION .............................................. 55
6.2.1 Material Cost................................................................................................................ 56
6.2.2 Cutting and Layup Cost ............................................................................................... 56
6.2.3 Equipment and Tool Cost ............................................................................................ 56
6.2.4 Total Composite Samples Cost.................................................................................... 56
6.3 COST COMPARISON AND ANALYSIS ..................................................................................... 65
6.4 SUMMARY............................................................................................................................ 66
CHAPTER SEVEN..................................................................................................................... 67

VIII
AGGREGATE PRODUCTION PLANNING FOR COMPOSITE
MANUFACTURING.................................................................................................................. 67
7.1 PROBLEM DEFINITION .......................................................................................................... 67
7.2 MANUFACTURING MODEL ................................................................................................... 68
7.3 NUMERICAL EXAMPLES AND ANALYSIS............................................................................... 70
7.5 SOLUTION AND ANALYSIS.................................................................................................... 71
7.6 SUMMARY............................................................................................................................ 72
CHAPTER EIGHT..................................................................................................................... 73
CONCLUSIONS AND FUTURE RESEARCH....................................................................... 73
8.1 CONCLUSION........................................................................................................................ 73
8.2 FUTURE RESEARCH .............................................................................................................. 74
REFERENCES............................................................................................................................ 75
APPENDIX A: TENSILE TEST LOAD DATA ...................................................................... 80
APPENDIX B: COMPRESSION TEST LOAD DATA.......................................................... 82

IX
List of Figures
Figure 3.1: Autoclave sample ....................................................................................................... 12
Figure 3.2: OOA concave samples ............................................................................................... 13
Figure 3.3: L-shape mold size....................................................................................................... 16
Figure 3.4: Schematic drawing of an autoclave............................................................................ 16
Figure 3.5: Autoclave photo ......................................................................................................... 17
Figure 3.6: The assembly of all layers .......................................................................................... 19
Figure 3.7: Consolidation with vacuum bag ................................................................................. 19
Figure 3.8: Cure cycle of autoclave process ................................................................................. 20
Figure 3.9: Cure cycle of OOA process........................................................................................ 21
Figure 4.1: Cost breakdown for the 4 types of manufacturing process ........................................ 35
Figure 4.2 Cost breakdowns for the 4 types of manufacturing process........................................ 37
Figure 4.3: Compare of the process in steps and process in parallel ............................................ 37
Figure 5.1: Coupon with holes for fixing...................................................................................... 39
Figure 5.2: Setting up the test ....................................................................................................... 40
Figure 5.3 : Stress for autoclave concave sample ......................................................................... 41
Figure 5.4: Stress for autoclave convex sample............................................................................ 41
Figure 5.5: Stress for OOA concave sample................................................................................. 42
Figure 5.6: Stress for OOA convex sample .................................................................................. 42
Figure 5.7: Coupon for compression test...................................................................................... 44
Figure 5.8: Compression test with MTS....................................................................................... 45
Figure 5.9: Compression stress for autoclave convex and concave samples................................ 46
Figure 5.10: Compression stress for OOA convex and concave samples .................................... 46

X
Figure 5.11: Compression stress for OOA and autoclave samples............................................... 47
Figure 5.12: Model for mounting.................................................................................................. 49
Figure 5.13: Samples after demold ............................................................................................... 49
Figure 5.14: Automatic grinding machine LECO VP-150 ........................................................... 50
Figure 5.15: Optical microscope machine .................................................................................... 51
Figure 5.16: Corner section structure OOA concave sample ....................................................... 51
Figure 5.17: Corner section structure autoclave concave sample................................................. 52
Figure 6.1: Bus seat mold ............................................................................................................. 53
Figure 6.2: Vacuum bag for bus seat ............................................................................................ 54
Figure 6.3: Bus seat samples......................................................................................................... 54
Figure 6.4: Honeycomb application of bus seat layup steps......................................................... 55
Figure 6.5: Bus seat samples made with honeycomb ................................................................... 55
Figure 6.6: Cost breakdown of 6 kinds of composite bus seats manufacturing process .............. 66

XI
List of Tables
Table 4.1: Materials cost for OOA concave sample ..................................................................... 23
Table 4.2: Material cost for OOA convex sample ....................................................................... 24
Table 4.3:Material cost for autoclave concave sample................................................................. 24
Table 4.4: Materials cost for autoclave convex samples .............................................................. 24
Table 4.5: Process of autoclave concave sample .......................................................................... 25
Table 4.6: Layup steps of autoclave concave sample ................................................................... 26
Table 4.7: Layup process of OOA convex sample ....................................................................... 27
Table 4.8: Layup process of OOA concave sample...................................................................... 28
Table 4.9: Equipment used for autoclave curing .......................................................................... 29
Table4.10: Depreciation and maintenance cost for samples cured by autoclave ......................... 29
Table 4.11: Equipment used for OOA curing............................................................................... 29
Table 4.12: Autoclave convex sample improved manufacturing process .................................... 31
Table 4.13: Autoclave concave sample improved manufacturing process................................... 32
Table 4.14: OOA convex sample improved manufacturing process ............................................ 33
Table 4.15: OOA concave sample improved manufacturing process........................................... 34
Table 4.16: Labor cost for improved process of composite samples manufacturing ................... 34
Table 4.17: Total cost for the four types of samples..................................................................... 35
Table 4.18: Total cost for the 4 samples with improved process.................................................. 35
Table 5.1: Thickness and section area of the samples .................................................................. 38
Table 5.2: Thickness and section area of the samples .................................................................. 44
Table 5.3: Void content of corner section of composite L-shape samples ................................... 50
Table 6.1: Materials cost for OOA MTM 45-1 sample ................................................................ 57

XII
Table 6.2: Materials cost for OOA MTM 45-1 sandwich sample ................................................ 57
Table 6.3: Materials cost for OOA Cycom 5320 sample.............................................................. 58
Table 6.4: Materials cost for OOA Cycom 5320 sandwich sample ............................................. 58
Table 6.5: Materials cost for autoclave Cycom 5276-1 sample.................................................... 59
Table 6.6: Materials cost for autoclave Cycom 5276-1sandwich sample .................................... 59
Table 6.7: Layup steps for MTM 45-1 bus seat............................................................................ 60
Table 6.8: Layup steps for MTM 45-1 sandwich Bus seat ........................................................... 61
Table 6.9: Layup steps for Cycom 5320 bus seat ......................................................................... 62
Table 6.10: Layup steps for Cycom 5320 sandwich bus seat ....................................................... 62
Table 6.11: Layup steps for Cycom 5267-1 bus seat.................................................................... 63
Table 6.12: Layup steps for Cycom 5267-1 sandwich bus seat.................................................... 63
Table 6.13: Labor cost for bus seat samples ................................................................................. 64
Table 6.14: Equipments cost for OOA bus seats .......................................................................... 64
Table 6.15: Daily equipment depreciation cost and maintenance cost......................................... 64
Table 6.16: Equipment cost for MTM 45-1 and MTM 45-1 sandwich bus seat .......................... 64
Table 6.17: Equipment cost for Cycom 5320 and Cycom 5320 sandwich bus seats ................... 64
Table 6.18: Equipment for autocalve bus seats ............................................................................ 65
Table 6.19: Equipment cost for autoclave bus Seat...................................................................... 65
Table 6.20: Total cost for bus seats .............................................................................................. 65
Table 7.1: Unit manufacturing cost for each kind of samples ...................................................... 70
Table 7.2: Product demand for each period .................................................................................. 70
Table 7.3: Solution for product quantity for each period.............................................................. 71

1
Chapter One
Introduction
1.1 Foreword
Applications of composite materials have had rapid growth in recent years due to
technological advances and much improved manufacturing processes. Composite
materials have a series of excellent features such as light weight, high mechanical
properties among others. These features make them widely used in modern product
structures. Composites are used in aerospace, automotive, marine, boating, sporting
goods and other industries. Improved manufacturing technologies have reduced the cost
of composite materials in aerospace industry. However, costs of composites in general
are still higher than equivalent metal materials in most applications (Mazumdar, 2002). In
order to further reduce manufacturing cost, many researchers have made significant
efforts in developing new manufacturing techniques and tools for producing composite
materials and products. For example, out-of-autoclave (OOA) composite manufacturing
method was developed to reduce manufacturing cost, due to the low cost of equipment
(oven) compared to autoclave method. In this research, we compare the cost of making L-
shape components cured by autoclave and OOA processes. Quality of these composite
products was analyzed and compared. An aggregate production planning model for
optimal composite production was also developed.
1.2 Introduction of Composite Materials
This section presents a general introduction to composite materials.

2
1.2.1 Constituents of Composite Materials
Advanced composites are made of three main constituents: fibers, matrix and interface
between fibers and matrix. Fibers, usually glass, carbon or Kevlar, provide strength and
stiffness to the composite materials. Matrix can be polymer, metal, or ceramic, all of
which serve several functions in the composite structure for satisfactory performance of
the structure (Hoa, 2009).
1.2.2 Applications of Composite Materials
Composites have fast growing market share because of their light weight, good damage
tolerance and corrosion resistance. Composites are widely used in aerospace, energy,
automotive and other industries.
1.2.3 Composites Manufacturing Technology
Modern composites manufacturing techniques include autoclave molding, filament
winding, pultrusion, liquid composite molding, and thermoplastic composites (Hoa,
2009). In this study, we focus on autoclave and out-of autoclave (OOA) layup techniques.
OOA is a manufacturing technique that has received much attention over the past several
years. The main difference between autoclave manufacturing and OOA is that pressure is
applied in autoclave while only vacuum is used in OOA. Ovens used in OOA process are
less expensive than autoclave.
Raw materials, machines, layup methods and curing cycles for autoclave and OOA are
different. In this research, materials used in autoclave are unidirectional graphite/epoxy

3
prepregs. Material used in OOA in this study is woven carbon/epoxy prepregs. Materials
used in OOA can provide autoclave-type material performance with the benefit of lower
processing costs and better manufacturing flexibility. Layup methods and curing cycles
are also different for autoclave and OOA.
1.2.4 Composite Manufacturing Cost Analysis
Composite materials are more expensive comparing to traditional materials due to higher
cost of raw materials and extensive labor costs involved in composite manufacturing
(Mazumdar, 2002). Cost of composite products may be reduced by selecting proper raw
materials, using efficient production process and improving product quality. Many cost
models have been developed for cost analysis of composite manufacturing. These models
usually include labor cost, materials cost, equipment cost, energy cost and tool cost. In
this research, a cost analysis model for autoclave and OOA composite manufacturing is
developed to compare manufacturing costs of different processes. Several composite
samples were made for the purpose of cost and quality analysis.
1.3 Quality Test
Quality of L-shape composite components fabricated by different methods is tested and
analyzed in this research. The quality tests in this study include tensile test, compression
test, and void content test. The results are compared. Stronger compression strength is an
important requirement for many applications. Void formation can cause stiffness and
strength reduction. It is crucial to measure the void content of composite products.
1.4 Aggregate Production Planning

4
Aggregate production planning is the process of designing a production scheme to meet
the medium to long term forecasted demands. Its purpose is to allocate different
manufacturing resources to satisfy the demands and to minimize production costs in the
planning time horizon. In developing an aggregate production planning model,
production variables such as production level and inventory level are determined to
accommodate production capacity in each period (usually weeks, months, or seasons)
over the planning time horizon (usually 6 months to 18 months). In this research, a multi-
product aggregate production planning model is developed.
1.5 Scope of the Thesis
In this thesis, cost analysis in connection with quality of L-shape composite parts made
by autoclave and OOA techniques was carried out. The cost components include material
cost, labor cost, tool and equipment costs (purchasing, maintenance and depreciation
costs) and energy cost. Quality test results for the components by different manufacturing
methods are compared. A multi-product aggregate production planning model is
developed to decide the optimal production quantity and inventory level.
1.6 Research Contributions
A detailed analysis on L-shape composite manufacturing process is developed. The
developed model is for comprehensive cost analysis of manufacturing L-shape composite
products. The model can be easily modified for cost analysis on similar products
manufactured by composite materials in aerospace or other industries. In addition, an
aggregate production planning model is proposed for optimal allocation of resources to
satisfy demand.

5
1.7 Organization of the Thesis
This thesis is organized into eight chapters. Following the introductory Chapter 1,
Chapter 2 provides a review of the literature in cost analysis models, composites
manufacturing, quality testing, and production planning. Chapter 3 presents an
introduction of L-shape composites manufacturing process using out-of-autoclave and
autoclave. Details about L-shape composite manufacturing cost breakdown and analysis
are presented in Chapter 4. Mechanical property tests and comparisons are presented in
Chapter 5. A composite bus seat (a practical example) production process and cost
analysis are presented in Chapter 6. Problem description, model formulation and result
analysis of aggregate production planning are presented in Chapter 7. Chapter 8 presents
concluding remarks and discusses possible future research topics in this area.

6
Chapter Two
Literature Review
2.1 Introduction
Many different composite manufacturing processes have been developed to improve
product performance and to reduce production cycle time and production cost. In recent
years, composite manufacturing process using oven and vacuum bags was utilized. In this
chapter, research articles on the following topics will be reviewed as they are related to
the work conducted in this research:
Out of Autoclave Composites Manufacturing Technique.
Cost Analysis Techniques in Composites Manufacturing
Manufacturing Cost Estimation
Quality Tests Techniques for Composites
2.2 Out-of-Autoclave Composites Manufacturing Technique
Dang et al (2011) presented several composite components produced by out-of-autoclave
(OOA) process. They are equivalent to those made of 90 psi autoclave prepreg system.
The baseline sample using autoclave process was fabricated from IM7/8552 material.
This same part was remade using CYCOM 5320 OOA prepreg. The research focused on
two autoclave methods of fabrication: hand layup and automated layup. The OOA part
with hand layup used the male tool with Torr reusable vacuum bag. Mechanical testing
results showed that the OOA system is mechanically comparable to that of the IM7/8552

7
system. The laminate quality was acceptable, and there were no observed ply wrinkling,
voids and resin pooling.
Gao and Stevenson (2007) investigated the influence of different composite
manufacturing processes on the drop-weight impact damage in woven carbon/epoxy
laminate. Autoclave and the Quickstep processes were compared. Quickstep is an OOA
process to produce high-quality composite parts at lower cost. The laminates were
inspected by visual observation, dye-penetrant X-ray technique and optical microscopy
observation. With these testing methods, voids, fiber/resin debonding and cracks can be
detected. The damage of composite laminate under drop-weight impact loading was
evaluated. The responses to this low velocity impact loading of composite laminates
produced by Quickstep process and autoclave process were compared.
Davies et al (2006) assessed the Quickstep method for composite parts manufacturing
and compared physical properties of the cured laminates with those produced by
autoclave. Details about the Quickstep material, Quickstep and autoclave cure and
Quickstep vacuum bag process were described. Due to the increased ramp rates the cure
cycle time was significantly reduced by Quickstep process. The effect of cure cycle heat
transfer rates in the cure cycle on physical and mechanical properties of the composite
products was presented. The mechanical test results of autoclave and oven cured
processes were compared and analyzed.
Akayet et al (1996) explored the non-autoclave vacuum-bag process for certain sandwich
structures. They observed that the non-autoclave process of honeycomb sandwich
structures have poor compaction and high porosity of the skins with decreased skin-core

8
adhesion. The honeycomb inside pressure was measured. An optimal range of pressure
inside the honeycomb was found. And an optimum process window was determined for
time frame determination leading to an optimal initial honeycomb pressure level.
2.3 Composites Manufacturing Cost Analysis
Verrey et al (2005) used the TCM (technical cost model) approach to carry out cost
analysis for thermoplastic and thermoset RTM (resin transfer molding) processes. Cost
segmentation and comparison for thermoplastic RTM and thermoset RTM were made.
The comparison was made using a cost breakdown diagram. Alternate strategies were
also studied. Their study showed that reduction in non-crimp fabric scrap can lead to
major cost savings.
Ǻkermo and Ǻström (1999) developed a program to predict component cost for different
component sizes and complexities. The raw material cost strongly dominates the
component costs. The compression molding manufacturing process for thermoplastic
composite and sandwich component were described. Other related issues were discussed
including the formula and the expression of how to calculate the cost.
Klanšek and Kravanja (2005) presented a method for manufacturing cost estimation and
optimization for different composite floor systems. Details of each cost component were
described. An approximation function was proposed for processing time and material
consumption calculation. Structural optimization was applied for precise comparison of
three different composite floor systems.
Stockton et al (1998) presented a time estimate model for advanced composite
manufacturing cost analysis. They conducted the cost analysis for various activities, such

9
as mold development and automated tape laying. The developed model can also be used
for component designs and process optimization.
Rajadurai and Thanigaiyarasu (2008) presented structural analysis, failure prediction and
cost analysis of different materials for manufacturing wind turbine blades. They proposed
that some properties should be considered during material selection. A finite element
analysis was made for turbine blade failure prediction. The cost analysis showed that
certain type of blades are structurally efficient and offer the least expensive solution in all
loading cases.
Pantelakis et al (2009) introduced a method for manufacturing composite components
with regard to product quality and cost. This method was applied in making thermoplastic
composite helicopter canopies. Quality and cost sensitivity were analyzed to derive
material dependent quality functions and process dependent cost estimation relationships.
2.4 Quality Test Techniques for Composites Samples
Lomovet et al (2007) used auniaxial tensile test to characterize damages in textile
composites. The test was applied to different textile composites: carbon/epoxy triaxial
braids, quasi-UD woven, and NCF. The tensile test was accompanied with acoustic
emission (AE) and full-field strain mapping. The sample was examined by X-ray and
ultrasonic C-scan. X-ray was used to detect very fine matrix cracks occurred within the
yarns. Ultrasonic C-scan test was used to reveal the overall damage pattern. Cross-
sectioning and microscopically examination of samples identified local damage modes.
Bhatnagar et al (2006) developed a low-cost method for biaxial tension tests for loading
an in-plane reinforced composite laminate. Different experimental techniques and

10
specimen shapes were used in their study. Details about the design and development of
biaxial tensile testing fixture were illustrated. The load measurement and the assembly of
the test fixture were also described. The equi-biaxial and non-equi-biaxial stresses with
different stretch ratios can be incorporated in this new biaxial fixture design. The fixture
can be used to estimate the interaction of the coefficients between the two principal
stresses in an orthotropic or fiber-reinforced material system.
Bech et al (2008) developed a compression test method under static and fatigue loading.
The new MCL (mechanical combined loading) fixture was described in detail. Quasi-
static compression and compression-compression fatigue tests were performed on
unidirectional carbon/epoxy and glass/polyester laminate specimens. The result of these
experiments indicated that the MCL fixture is stable and reliable for industrial use and the
test can measure compressive fatigue parameters.
Tant (1993) analyzed mini-sandwich specimen compression test using finite element
method with quadrilateral isoparametric elements. The initial and final tangent properties
were presented. He used nonlinear analysis in an iterative way with incremental loading.
It reveals that considering the final tangent or secant material properties is important for
obtaining accurate stress distributions of the specimen.
Gaoet al (2006) presented an experimental program to characterize the effect of voids on
the strength of composite laminates. In the void content measurement experiments, C-
scan ultrasonic inspection and microscopic images were used to analyze void content and
characterize the void shape, location and size. Interlinear shear strength flexure strengths

11
and tensile strength were measured to assess the effect of voids. The effects of cure
pressure conditions and dwell times on the critical void contents were described.
Paciornik and Almeida (2009) used digital optical microscopy techniques to measure
volume fraction and distribution of voids in composite parts. Volume fraction was
measured by using object measurement technique and mosaic images formed by
assembling low magnification fields. Quantitative measure of void spatial distribution
was provided to reveal homogeneity or clustering of the void population. The results
provide a global view of the complex microstructure of the material.
2.7 Summary
In this chapter, many research works were reviewed. The literature covers the area of
autoclave and OOA composite manufacturing processes, manufacturing cost analysis and
aggregated production planning. Among the reviewed articles, a few of them have
researched on cost analysis of OOA process. We used both autoclave and OOA processes
to manufacture L-shape composite parts and made cost analysis based on these processes.
A cost analysis model will be established to compare the total cost of different parts and
combined with aggregate production planning for multiple products. Moreover, tensile
test, compression test, and void content test are conducted in our research for testing the
mechanical characters of the samples.

12
Chapter Three
Manufacturing the L-Shape Composites Parts
In this chapter, we describe in detail the autoclave and out-of-autoclave (OOA) processes
used to manufacturing the components considered in this research.
The autoclave process steps include cutting the materials (NCT 301), preparing tools,
laying up prepregs, putting the materials into autoclave and curing, removing the sample
from mold, inspecting the products, and finishing the surfaces.
The OOA process steps include cutting the materials (Cycom 5320) and other steps,
similar to those of the autoclave process. The only difference is that the raw material and
curing cycle are different. In this research, several L-shape samples are made using
autoclave and OOA processed. Some of the samples are shown in Figures 3.1 and 3.2.
Figure 3.1: Autoclave sample

13
3.1 The Raw Materials
To manufacture composite samples, we used the following materials at different stages of
the process. These materials are provided by suppliers.
As discussed earlier, different materials are used to make the samples for
autoclave and out-of-autoclave processes. Due to the lack of pressure in out-
of-autoclave process, it is important that the resin has sufficiently low
viscosity to flow and wet the fibers. New types of prepregs need to be
available.
In this study, we used convex and concave sides of a mold to make the L-
shape samples. The size of each ply for the convex sample is 12"×4". The size
of each ply for the concave sample is 10.5"×4".
After removing the samples from the mold, some resin usually sticks on the
mold. Mold cleaning fluid was used to clean the surface of the mold.
Figure 3.2: OOA concave samples

14
Release agent was applied on the surface of the mold, in removing the
samples from the mold easily. On sample surfaces, release films were applied.
Bleeder materials were used to absorb the resin that leaks out during the
curing process in the autoclave. Normally, bleeder materials are polyester mat,
fiberglass, and cotton. For out-of-autoclave curing process, no bleeder
material was used.
A vacuum pump was applied to create a consistent compaction across the
structure.
Sealant tape was used to seal the margin of the mold and the vacuum bag.
3.2 Prepare Prepregs and Cutting
Prepregs are usually stored in a freezer at about -5°C. Before cutting, we need to take out
the materials from the freezer and left them in the room temperature for several hours.
3.3 Tools Preparation
In this research, the L-shape concave and convex samples were made with two mold
sides using autoclave and out-of-autoclave manufacturing methods. The mold shown in
Figure 3.3 is made of aluminum, designed according to the shape of the samples and
provides the surface finish for the samples. Autoclave makes the samples using high
temperature and pressure. Oven makes the samples with high temperature and normal
pressure. After curing, the mold surface may not be smooth. This will affect the quality of
next samples to be made by the mold. Mold cleaning fluid is needed for cleaning the

15
mold. Release agent and release films were used for removing the samples from the mold
without affecting their surface quality.
3.3.1 Autoclave Process
Tools and equipment used in autoclave processing are autoclave, mold, and vacuum
pump.
An autoclave can be considered as a vessel with heating unit and high
pressure. To provide high pressure, the autoclave is usually manufactured as a
large cylindrical tube. A door is set up at the end of the tube. Since high
temperature must be supplied during the curing process, the autoclave is
usually made of welded steel. Commonly, autoclaves are very expensive and
their capacities are limited. Figure 3.3 and Figure 3.4 show a schematic
drawing of autoclave and a photo of an autoclave (Hoa, 2009), respectively.
Roller is used for layup to remove the wrinkles. It is also useful to bond the
prepreg layers.
Molds used in autoclave processing are usually made by stainless steel or
aluminum. To design the mold, the expansion and contraction of the mold and
the part shrinkage must be considered.
A vacuum pump is used for debulking.

16
Figure 3.3: L-shape mold size
Figure 3.4 Schematic drawing of an autoclave

17
Figure 3.5 Autoclave photo (Hoa, 2009)
3.3.2 Out of Autoclave Processing
Tools and equipment used in the oven process are oven, mold, and vacuum pump.
An oven can supply high temperature during the curing process. Compared
with autoclave, oven cannot supply pressure. The prepreg is debulked by
vacuum pump with 28.5 Hg, during oven curing process.
Roller was used in layup to remove the wrinkles. It is also useful to bond the
prepregs layers.
Molds used in the out-of-autoclave process are the same as the one used in
autoclave process.
A vacuum pump was used for debulking.

18
3.4 Laying up the Prepregs
Similar to most composite manufacturing, prepregs are placed by hands. The orientations
of the laminates of the prepregs cured by autoclave follow the sequence of
[0/90/0/90/90/0/90/0]. Material used for OOA samples is Cycom 5320. Cycom 5320 is
woven prepregs. To make the OOA samples have the same thickness with autoclave
samples, samples cured by OOA follow the sequence [0/90/0/90]. Because the part is L-
shape, the corner should be laid up carefully to make the layer smooth and to touch each
other closely.
3.5 Vacuum Bag
To breathe the air off the samples and well pack the layers of the prepregs, “debulking” is
necessary after certain layers are laid down. For the samples made by autoclave, the 8
layers need to be debulked after laying up every 2 layers. For the samples made by oven,
the total 4 layers need to be debunked after laying up each layer. For each “debulking”,
the vacuum bag and breather materials were placed. Vacuum was applied using a vacuum
pump. We need to place the bleeder materials and breather materials again, after we
complete all the layers. During the curing process the vacuum needs to be maintained.
Figure 3.5 shows the assembly of all layers (Hoa, 2009). Using the vacuum bag can
provide pressure to compact the laminate. Figure 3.6 shows the consolidation with
vacuum bag. At the same time, void between laminate can be absorbed. Applying
vacuum bag can also make it easy for the resin to flow.

19
Figure 3.6: The assembly of all layers
Figure 3.6 The assembly of all layers (Hoa, 2009)
Figure 3.7 Consolidation with vacuum bag

20
3.6 Composite Curing Cycle
The curing cycles of the autoclave technique and OOA technique will be presented below.
3.6.1 Curing in the Autoclave
Autoclave provides high pressure and heat to bond the adjacent layers strongly. Heat
transfer and energy balance, resin flow and consolidation, and void suppression are
considered for deciding the curing cycle. The composite L-shape sample which is made
of NCT 301 materials needs to be cured in the autoclave for 2 hours, the temperature
ranges from 24°C to 140°C as shown in Figure 3.7. The pressure is 60 psi.
3.6.2 Curing with OOA
Oven provides high temperature but no pressure for the composite products. To achieve
the same quality with samples made by autoclave, the curing cycle for the Cycom 5320
materials was set at 25°C for 2 hours, then at 93°C for 2 hours 45minuts, and at 143°C
for 2hour 15minuts as shown in Figure 3.8.
Figure 3.8 Cure cycle of autoclave process

21
3.7 Removing the Part from the Mold, Inspection, and Finishing
The composite samples are removed from the mold after they are cured. The next step is
to make the quality test. Void of the composite samples can be detected using microscope
inspection. Strength and compression tests should also be conducted to check the
sample’s mechanical properties.
3.8 Summary
This chapter presents a brief description of the composite manufacturing processes to
make the sample components in this study. Information on raw materials, manufacturing
steps, equipment and tools which are needed in the manufacturing process is introduced.
Figure 3.9 Cure cycle of OOA process

22
Cost analysis for composite samples manufacturing include the costs associated with
each step of the manufacturing process. Cost analysis for the concave and convex
samples made in autoclave and OOA will be studied and discussed in the next chapter.
23
Chapter Four
L-Shape Composite Manufacturing Cost analysis
In this chapter, we will discuss composite manufacturing cost analysis and production.
Production cost normally includes manufacturing cost and inventory cost. Cost analysis
model for composite manufacturing needs to consider material cost, labor cost, tools cost
and equipment cost (Ye et al, 2009). In this chapter, we will compare costs of
manufacturing concave and convex L-shape composite samples made by autoclave and
out-of-autoclave (OOA).
4.1 L-Shape Composite Manufacturing Production Cost Estimation
We will discuss the L-shape composite manufacturing production cost estimation in this
section.
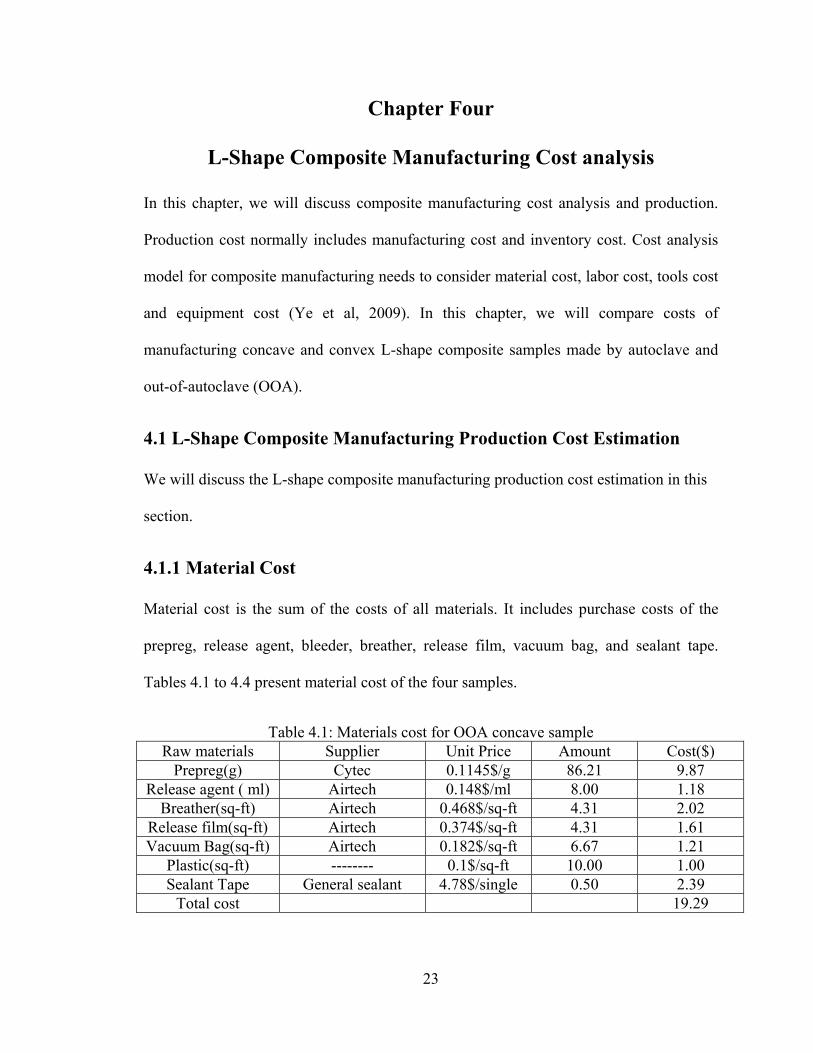
4.1.1 Material Cost
Material cost is the sum of the costs of all materials. It includes purchase costs of the
prepreg, release agent, bleeder, breather, release film, vacuum bag, and sealant tape.
Tables 4.1 to 4.4 present material cost of the four samples.
Table 4.1: Materials cost for OOA concave sample Raw materials Supplier Unit Price Amount Cost($)
Prepreg(g) Cytec 0.1145$/g 86.21 9.87 Release agent ( ml) Airtech 0.148$/ml 8.00 1.18
Breather(sq-ft) Airtech 0.468$/sq-ft 4.31 2.02 Release film(sq-ft) Airtech 0.374$/sq-ft 4.31 1.61 Vacuum Bag(sq-ft) Airtech 0.182$/sq-ft 6.67 1.21
Plastic(sq-ft) -------- 0.1$/sq-ft 10.00 1.00 Sealant Tape General sealant 4.78$/single 0.50 2.39
Total cost 19.29

24
Table 4.2: Material cost for OOA convex sample Raw materials Supplier Unit Price Amount Cost($)
Prepreg(g) Cytec 0.1145$/g 98.53 11.28 Release agent ( ml) Airtech 0.148$/ml 8.00 1.18
Breather(sq-ft) Airtech 0.468$/sq-ft 4.31 2.02 Release film(sq-ft) Airtech 0.374$/sq-ft 4.31 1.61 Vacuum Bag(sq-ft) Airtech 0.182$/sq-ft 6.67 1.21
Plastic(sq-ft) -------- 0.083$/sq-ft 10.00 1.00 Sealant Tape General sealant 4.78$/single 0.50 2.39
Total cost 20.70
Table 4.3: Material cost for autoclave concave sample Raw materials Supplier Unit Price Amount Cost($)
Prepreg(g) Newpote 0.05$/g 51.73 2.59 Release agent ( ml) Airtech 0.0148$/ml 8.00 0.12
Breather(sq-ft) Airtech 0.483$/sq-ft 0.29 0.14 Release film(sq-ft) Airtech 0.468$/sq-ft 1.67 0.78 Vacuum Bag(sq-ft) Airtech 0.374$/sq-ft 0.29 0.11
Plastic(sq-ft) Airtech 0.182$/sq-ft 6.67 1.21 Sealant Tape General sealant 4.78$/single 0.50 2.39
Total cost 7.34
Table 4.4: Materials cost for autoclave convex samples Raw materials Supplier Unit Price Amount Cost($)
Prepreg(g) Newport 0.05$/g 59.13 2.96 Release agent ( ml) Airtech 0.0148$/ml 8.00 0.12
Breather(sq-ft) Airtech 0.483$/sq-ft 0.33 0.16 Release film(sq-ft) Airtech 0.468$/sq-ft 1.67 0.78 Vacuum Bag(sq-ft) Airtech 0.374$/sq-ft 0.33 0.12
Plastic(sq-ft) Airtech 0.182$/sq-ft 6.67 1.21 Sealant Tape General sealant 4.78$/single 0.50 2.39
Total cost 7.75
4.1.2 Cutting and Layup Cost for Autoclave Samples
In this study, cutting and layup are performed by hand. The cutting and layup time
depends on the size and number of the plies, the thickness of the material and the shape
of the mode. In this study, the size of the samples made by autoclave is 4”×12”. We need

25
to layup 8 plies of the prepregs following the direction [0/90/0/90/90/0/90/0], and debulk
the sample after laying the first ply and then for every 2 plies. The steps and layup time
for autoclave concave and convex samples are shown in Tables 4.5 and 4.6.
Table 4.5: Process of autoclave convex sample Process Time (min)
Cleaning the mold 5 Cutting Prepregs 5 Cutting Bleeder 2 Cutting Breather 2
Cutting Release film 2 Cutting Vacuum bag 3
Applying release agent 32 Lay up 1st Prepregs 4.45
Applying consolidation bag 15 Consolidation 5 Remove bag 5
2nd and 3rd prepregs down 8.9 Replace bag 5
Consolidation 10 Remove bag 5
4th and 5th prepregs down 8.9 Replace bag 5
Consolidation 10 Remove bag 5
6th and 7th prepregs down 8.9 Replace bag 5
Consolidation 10 Remove bag 5
8th prepregs down 4.45 Preparing Cure Bag 15 Testing bag sealing 5
Placing the tool in the Autoclave 8 Removing The tool from the Autoclave 8 Removing Composite from the Mold 5
Total 212.6

26
Table 4.6: Layup Steps of autoclave concave sample
Labor cost can be obtained by multiplying the labor rate, assuming $15/hour, by the total
labor time shown at the end of the table. Therefore, the labor cost for autoclave convex
sample is $50.5 and the labor cost for autoclave concave sample is $53.15.
Process Time(min) Cleaning the mold 5 Cutting Prepregs 5 Cutting Bleeder 2 Cutting Breather 2
Cutting Release film 2 Cutting Vacuum bag 3
Applying release agent 32 Layup 1st prepreg 3
Applying consolidation bag 15 Consolidation 5 Remove bag 5
2nd and 3rd prepregs down 6 Replace bag 5
Consolidation 10 Remove bag 5
4th and 5th prepregs down 6 Replace bag 5
Consolidation 10 Remove bag 5
6th and 7th prepregs down 6 Replace bag 6
Consolidation 10 Remove bag 5
8th prepregs down 3 Preparing Cure Bag 15 Testing bag sealing 5
Placing the tool in the Autoclave 8 Removing The tool from the Autoclave 8 Removing Composite from the Mold 5
Total 202

27
4.1.3 Cutting and Layup Cost for OOA Samples
The size of the samples made by OOA is 4” ×12”. We need to layup 4 plies of woven
Cycom 5320 prepregs, and debulk the sample for each ply. The steps and labor cost for
OOA concave and convex samples are shown in Tables 4.7 and 4.8.
Table 4.7: Layup process of OOA convex sample Process Time(min)
Cutting Prepregs 3 Cutting Breather 1
Cutting Release film 1 Cutting Vacuum bag 1
Cutting Plastic 0.5 Cleaning the mold 5
Applying release agent 32 Layup 1st ,2nd prepreg 8
Preparing consolidation bag 10 Applying consolidation bag
place bag 5 Consolidation for 10min 10
Remove bag 5 3rd prepreg down 4
Replace bag 5 Consolidation for 10min 10
Remove bag 5 4rd prepreg down 4
Preparing consolidation bag 10 Applying consolidation bag
place bag 5 Testing bag sealing 5
Placing the tool in the Autoclave 8 Removing The tool from the Autoclave 8 Removing Composite from the Mold 5
Total time 150.5

28
Table 4.8: Layup process of OOA concave sample
The labor cost can be obtained by multiplying the labor rate, assuming $15/hour, by the
total labor time shown at the end of the table. Therefore, the labor cost for OOA convex
sample is $37.63 and the labor cost for OOA concave sample is $38.38.
4.1.4 Equipment and Tools Cost
Equipment and tool cost is comprised of energy operation cost, depreciation cost and
maintenance cost. Energy cost is the cost of the electric energy which is used during the
Process Time(min)Cutting Prepregs 2 Cutting Breather 1
Cutting Release film 1 Cutting Vacuum bag 1
Cutting Plastic 0.5 Cleaning the mold 5
Applying release agent 32 Layup 1st ,2nd prepreg 10
Preparing consolidation bag 10 Applying consolidation bag
place bag 5 Consolidation for 10min 10
Remove bag 5 3rd prepreg down 5
Replace bag 5 Consolidation for 10min 10
Remove bag 5 4rd prepreg down 5
Preparing consolidation bag 10 Applying consolidation bag
place bag 5 Testing bag sealing 5
Placing the tool in the Autoclave 8 Removing The tool from the Autoclave 8 Removing Composite from the Mold 5
Total 153.5

29
composite sample manufacturing process. We use the electric rate to multiply the time
used in the process. The straight line method is used to calculate the depreciation cost of
the machines used to make the samples. The value of the equipment decreases by usage.
For this study, the depreciation cost for each sample is the daily depreciation cost of the
equipment, because it takes one day to make one sample. The next is the maintenance
cost of the equipment. Tables 4.9 to 4.11 show the total equipment related cost. The total
equipment related cost is the sum of these three terms:
Equipment and tool cost=depreciation cost + energy cost +maintenance cost (4.1)
Where:
Depreciation cost=(purchase price-salvage value)/(life cycle×300 (days)) (4.2)
Energy cost=electric rate × process time (4.3)
Maintaining cost= annual maintaining cost/300 days (4.4)
Table 4.9: Equipment cost
Process Equipment Lifetime(years) Purchase($) Salvage($) Autoclave 20 233500 23350
Autoclave Pump 10 1000 100 Oven 20 19980 2000
OOA Pump 10 1000 100
Table 4.10: Depreciation and maintenance cost Depreciation cost ($) Maintenance cost ($)
Autoclave and pump Oven and pump Autoclave and pump Oven and pump 35.32 3.33 3.63 0.33
Table 4.11: Energy cost Process Equipment Time (hour) Cost ($)
Autoclave 2 2.7 Autoclave
Compression Air 2.67 0.1 Oven 8 10.8
OOA Compression Air 8.67 0.33

30
4.1.6 Total Cost
The total cost for each sample is the sum of material cost, cutting and layup cost and
equipment and tool cost (Ye et al 2009).
Total cost=material cost+ cutting and layup cost+ equipment and tool cost
=amount of the material× unit cost+ labor rate× total process time+
(purchase price-salvage value)/life cycle+ annual maintaining cost/300+electric rate
×process time (4.5)
4.2 Process Improvement for the Sample Manufacturing
From the manufacturing process steps shown in Tables 4.12 to Tables 4.15, we can find
that there is certain waiting time. We can use this time to carry out other steps such as
cutting materials and preparing the vacuum bags. Thus, the total manufacturing time
could be reduced. Tables 4.12 to 4.15 show the improved manufacturing process. Take
the OOA-convex manufacturing process as an example. Table 4.7 shows that it requires
32 minutes to apply release agent, 2 minutes for applying and 30 minutes for waiting.
This waiting time can be used to carry out other steps at the same time. Table 4.14 shows
that during the waiting time the mold is occupied and one can only operate the steps
which do not need the mold. Figure 4.3 shows that the total manufacturing time and cost
will be reduced by using parallel process. Table 4.12 shows the improvement of
manufacturing process.

31
Table 4.12: Autoclave convex sample improved manufacturing process
Process Time (min)
Cleaning the mold 5 Cutting Prepregs Cutting Breather
Cutting Release film Cutting Vacuum bag
Cutting Bleeder
Applying release agent(Time:32min)
Preparing consolidation bag1
32
Lay up 1st prepreg 3 Consolidation for 5min 5
2nd and 3rd prepregs down 6 Replace bag 5
Consolidation for 10min Preparing consolidation bag2 10 Remove bag 5
4th and 5th prepregs down 6 Replace bag 5
Consolidation for 10min 10 Remove bag 5
6th and 7th prepregs down 6 Replace bag 6
Consolidation for 10min 10 Remove bag 5
8th prepregs down 3 Preparing Cure Bag 5 Testing bag sealing 5
Placing the tool in the Autoclave 8 Removing The tool from the Autoclave 8 Removing Composite from the Mold 5
Total 158

32
Table 4.13: Autoclave concave sample improved manufacturing process
Process Time (min)
Cleaning the mold 5 Cutting Prepregs Cutting Breather
Cutting Release film Cutting Vacuum bag
Cutting Bleeder
Applying release agent(Time:32min)
Preparing consolidation bag1
32
Lay up 1st prepreg 4.45 Consolidation for 5min 5
2nd and 3rd prepregs down 8.9 Replace bag 5
Consolidation for 10min Preparing consolidation bag2 10 Remove bag 5
4th and 5th prepregs down 8.9 Replace bag 5
Consolidation for 10min 10 Remove bag 5
6th and 7th prepregs down 8.9 Replace bag 6
Consolidation for 10min 10 Remove bag 5
8th prepregs down 4.45 Preparing Cure Bag 5 Testing bag sealing 5
Placing the tool in the Autoclave 8 Removing The tool from the Autoclave 8 Removing Composite from the Mold 5
Total 169.6

33
Table 4.14: OOA convex sample improved manufacturing process Process Time (min)
Cleaning the mold 5 Cutting Prepregs Cutting Breather
Cutting Release film Cutting Vacuum bag
Cutting Plastic Preparing consolidation
bag1
Applying release agent(Time:32min)
Preparing consolidation bag2
32
Lay up 1st ,2nd prepreg 8 Place the bag 1 5
Consolidation for 10min 10 Remove bag 5
3rd prepreg down 4 Replace bag 5
Consolidation for 10min 10 Remove bag 5
4rd prepreg down 4 Place the bag 2 5
Testing bag sealing 5 Placing the tool in the Autoclave 8
Removing The tool from the Autoclave 8 Removing Composite from the Mold 5
Total time 124

34
Table 4.15: OOA concave sample improved manufacturing process Process Time (min)
Cleaning the mold 5 Cutting Prepregs Cutting Breather
Cutting Release film Cutting Vacuum bag
Cutting Plastic Preparing consolidation
bag1
Applying release agent
(Time:32min)
Preparing consolidation bag2
32
Lay up 1st ,2nd prepreg 10 Place the bag 1 5
Consolidation for 10min 10 Remove bag 5
3rd prepreg down 5 Replace bag 5
Consolidation for 10min 10 Remove bag 5
4rd prepreg down 5 Place the bag 2 5
Testing bag sealing 5 Placing the tool in the Autoclave 8
Removing The tool from the Autoclave 8 Removing Composite from the Mold 5
Total 128
Table 4.16: Labor cost for improved process of composite samples manufacturing
OOA-
convex
OOA-
concave
Autoclave-
convex
Autoclave-
concave
Layup time (min) 124 128 158 169.6
Labor($) 31 32 39.5 42.4

35
4.3 Cost Analysis and Comparison
The total cost for each sample is the sum of material cost, cutting and layup (labor) cost
and equipment and tool cost. The cost breakdown for samples OOA-convex, OOA-
concave, autoclave-convex and autoclave-concave are shown in Table 4.17 and Figure
4.1.
Table 4.17: Total cost for the four types of samples
0
20
40
60
80
100
120
OOA-conv
ex
OOA-conc
ave
Autocla
ve-co
nvex
Autocla
ve-co
ncav
e
equipment labor
material
Figure 4.1: Cost breakdown for the 4 types of manufacturing process
Figure 4.1 shows how different cost categories contribute to the total cost. For OOA and
autoclave samples, equipment and labor costs dominate the total cost. So decreasing the
equipment cost is a crucial factor to reduce the total manufacturing cost. The results show
Cost($) OOA-convex OOA-concave Autoclave-convex Autoclave-concaveMaterial 20.7 19.29 7.74 7.34 Labor 37.63 38.88 50.5 53.15
Equipment 15.09 15.09 41.45 41.45 Total 73.42 73.26 99.69 101.94

36
that OOA has lower total cost due to lower equipment and labor cost, though material
cost is higher than autoclave parts.
From the cost breakdown shown in Figure 4.1 and Figure 4.2, one can find that for each
type of manufacturing method, labor cost occupies a large part of the total cost. Thus,
improving the layup process is also an important way to reduce the total cost. From the
data in Tables 4.12, 4.13, 4.14 and 4.15, we can get the total cost for the 4 samples with
improved process where certain steps are done in parallel. The total cost of the process in
parallel for each manufacturing process is calculated and shown in Table 4.18. The
comparison of the cost for the process with series steps and process in parallel is shown
in Figure 4.3.
It shows that the cost can be reduced by using parallel production process. The cost
analysis indicates that using parallel steps would save production time and hence
processing time related cost. The results of the experiments and analysis conclude that
using OOA will lead to least total production cost. The higher material cost associated
with the OOA process will be compensated mainly by the savings on equipment cost.
4.4 Summary
A cost estimate model was proposed in this chapter. Cost breakdown for manufacturing
the L-shape composites parts was analyzed. The comparison for each cost component and
the total cost was conducted. And the comparison between the process in series steps and
the process in parallel showed that the total cost can be reduced by using process in
parallel.

37
Table 4.18 Total cost for the 4 samples with improved process OOA-convex OOA-concave Autoclave-convex Autoclave-concave
material 20.7 19.29 7.74 7.34 labor 31 32 39.5 42.4
equipment 15.09 15.09 41.45 41.45 Total 66.79 66.38 88.69 91.19
0
10
20
30
40
50
60
70
80
90
100
equipment
labor
material
Cost($)
Figure 4.2 Cost breakdowns for the 4 types of improved manufacturing process
Figure 4.3: Compare of the process in steps and process in parallel
73.42 73.26
99.69 101.94
66.79 66.38
88.6991.19
0
20
40
60
80
100
120
OOA‐convex
OOA‐concave
Autoclave‐convex
Autoclave‐concave
process in steps
process inparallel
Cost($)

38
Chapter Five
Quality Test for L-shape Composite Components
Due to light weight and high quality, composite materials have been widely used in a
variety of applications. Quality tests are conducted on the samples manufactured in this
study. They include tensile test, compression test, and microscope for void content test.
The results will be compared and showed in this chapter.
5.1 Tensile Test
In conducting the tensile test, we used the following process.
Cut the edge of the samples. Measure the thickness of each coupon. The
thickness of each coupon is shown in Table 5.1. In this study, one coupon for
each sample is used.
Make two holes on the sample arm for fixture to hold as shown in Figure 5.1.
Put the coupon accurately on fixture, then tight it with bolts and nuts.
Fix the above coupon on the Universal Tensile Machine as shown in Figure
5.2.
Apply the load on the specimen with the speed of 10mm/min.
Note down the data about Axial Force and Axial Displacement.
Calculate stress and generate graph using the data.

39
Table 5.1: Thickness and section area of the sample
Dimension Autoclave
Convex Autoclave Concave
OOA-convex OOA-concave
Thickness (mm) 1.28 1.25 1.52 1.54 Area (sq-mm) 97.54 95.25 115.82 117.35
Figure 5.1: Coupon with holes for fixing

40
Figure 5.2: Setting up the test

41
The force-displacement data from the 4 tests are plotted in Figures 5.3 to 5.6.
Figure 5.3: Stress for autoclave concave sample
Figure 5.4: Stress for autoclave convex sample

42
Figure 5.6: Stress for OOA convex sample
Figure 5.5: Stress for OOA concave sample

43
It can be seen that the stresses for the four samples are similar.
5.2 Compression Test
Compression tests are done using the same MTS machine with a special fixture. Many L-
shape composite parts are used in airplanes, boats and buses. Therefore, compression
strength is an important parameter. In this study, we conducted compression tests on the
samples following the steps stated below.
Measure the thickness of each L-shape sample. Cut the arm off from L-shape
sample.
Make the surface of the arms rough. Then, bond tab to the specimen. Applying
tab can prevent stripping.
Cut the coupon of size 0.5” × 4.5” shown as Figure 5.7. The thickness and
section area data are in Table 5.2.
Put the coupon accurately on fixture shown as Figure 5.8, then tight it with
Universal Tensile Machine.
Apply load on the specimen with speed of 1.5mm/min.
Keep on applying the load until the specimen is broken.
Calculate stress and plot the data
The force is applied at its longitudinal direction and the resulting displacement is
recorded. Compression stress is the load divided by the cross section area. The L-shape

44
sample compression stress graphs are shown in Figures 5.9 to 5.11. The recorded data are
presented in Appendix B.
Table 5.2: Thickness and section area of the sample
Dimension Autoclave Convex Autoclave Concave OOA-convex OOA-concave Thickness(mm) 1.25 1.30 1.54 1.64 Area(sq-mm) 15.88 15.24 19.56 20.83
Figure 5.7: Coupon for compression test

45
Figure 5.8: Compression test with MTS

46
0
100
200
300
400
500
0 0.5 1 1.5 2 2.5 3
AutoclaveconvexAutoclaveconcave
Displacement(mm)
F/S(MPa)
0
100
200
300
400
500
0 0.5 1 1.5 2 2.5 3
OOA convex
OOA concave
Figure 5.9: Compression stress for autoclave convex and concave samples
Figure 5.10: Compression stress for OOA convex and concave samples

47
It can be seen from Figure 5.9, there are differences in compression stress between the
samples made by concave and convex molds. Figure 5.9 indicates that the stiffness of the
autoclave convex sample is higher than that of the autoclave concave sample. Convex
sample is easier to layup and autoclave can supply the pressure to the sample, so stiffness
of autoclave convex is higher than that of the autoclave concave sample. Also we can see
that the stiffness of the OOA convex sample is higher than that of the OOA concave
sample, as shown in Figure 5.10.
As shown in Figure 5.11, autoclave-convex sample is the stiffest amount the four samples.
Although autoclave manufacturing method can result in higher quality, the properties of
the raw materials can also affect the product quality. Figure 5.11 shows that the OOA
convex sample has smallest displacement under compression force. This is because that
OOA prepregs (Cycom 5320) are probably stronger than that of autoclave prepregs (NCT
301).
Figure 5.11: Compression stress for OOA and autoclave samples

48
5.3 Void Content Test for L-shape Composite Components
Void inside of L-shape composite components comes from wandering tow, broken fibers
or air pockets and wrinkles created during the layup process. The void formation can
cause stiffness and strength reduction (Grunenfelder and Nutt 2010). It is crucial to
measure the void content of composite samples. L-shape components are difficult to
layup because of the corner. We choose the corner section for void content test.
We followed the steps stated below in conducting the void tests.
Apply the release agent to surface of the mold shown in Figure 5.12. The
purpose to do this is to make it easy to release the sample from the model.
Wait 10 minutes for it to completely dry.
Mix Epon Resin 828 and Cure Agent 3046 with the ratio of 100:45. Pour the
mix liquid into the mold for mounting. In this experiment, we cut the sample
into several small mounting samples.
Hold the samples in the vacuum oven at 35ºC for 18 hours. Then take the
samples out of the oven and release the samples from the mounting mold.
Hold the samples at 100ºC for 2 hours in vacuum oven. Samples after demold
are shown in Figure 5.13.
Automatic grinding machine LECO VP-150 (Figure 5.14) was used for
grinding and polishing. #120, #240, #320, #600, and #800 sandpapers were
used for grinding. Monocrystalline diamond suspension and polishing cloths

49
were used for initial polishing. Colloidal silica suspension and Imperial
polishing cloths were used for final polishing.
Microstructure of each piece was examined using an optical microscope
(Figure 5.15).
Figure 5.12: Model for mounting
Figure 5.13: Samples after demold

50
In this study, the void content percentage was calculated. For the void percentage, we
used the void area divided by the sample section area. The results are shown in Table 5.3.
Microscope pictures are shown in Figures5.16 and 5.17. We can see clearly the fiber,
resin and voids from the microscope images.
Table 5.3: Void content of corner section of composite L-shape samples Void Content of Corner Section of L-shape Samples
Autoclave convex OOA Convex Autoclave Concave OOA ConcaveAmount 4 5 9 12
Percentage 0.066% 0.004% 0.022% 0.119%
Figure 5.14: Automatic grinding machine LECO VP-150

51
Figure 5.15: Optical microscope machine
Figure 5.16: Corner section structure OOA concave sample

52
5.4 Summary
In this research, we performed mechanical tests on the composite samples. They include
tensile test, compression test and void content test. Details of the experiments are
illustrated in this chapter. For each test, the results are analyzed and compared. The
results show that the samples made using different processes have high mechanical
properties and are of good quality.
Figure 5.17: Corner section structure autoclave concave sample

53
Chapter Six
Cost Analysis of Composite Bus Seat
In this chapter, a practical example is presented to illustrate the cost analysis models
presented in Chapter Four. The example is a bus seat, an L-shape composite product. The
bus seat manufacturing experiment is conducted by student from McGill, in this study we
complete the cost analysis for the composite bus seat manufacturing. We also compare
the manufacturing costs of different composite bus seats made by autoclave and out-of-
autoclave.
6.1 Composites Bus Seat
Manufacturing of the bus seat is more complicated than manufacturing the L-shape parts
discussed in Chapter Four. As shown in Figure 6.1, there are small corners on the edge of
the bus seat. The prepregs were cut into the required shape using a programmable cutting
machine.
Figure 6.1: Bus seat mold

54
In total, six bus seats were made using different raw materials and manufacturing
methods. These material and method combinations are OOA with MTM 45-1, OOA with
MTM 45-1 sandwich, OOA Cycom 5320, OOA Cycom 5320 sandwich, Autoclave
Cycom 5276-1 and Autoclave Cycom 5276-1 sandwich. Figure 6.2 shows how the
vacuum bag for bus seat is applied. A bus seat sample is shown in Figure 6.3. Sandwich
bus seat samples are shown in Figures 6.4 and 6.5.
Figure 6.2: Vacuum bag for bus seat
Figure 6.3: Bus seat samples

55
6.2 Composite Bus Seat Manufacturing Cost Estimation
The cost components considered in this analysis include: raw material cost, labor cost,
tool and equipment costs including purchasing, maintenance and depreciation costs and
energy consumption cost.
Figure 6.4: Honeycomb application of bus seat layup steps
Figure 6.5: Bus seat samples made with honeycomb

56
6.2.1 Material Cost
The raw material cost includes those to purchase the prepreg, release agent, bleeder,
breather, release film, vacuum bag, and sealant tape. Tables 6.1 to 6.6 present detailed
material cost data to make the 6 bus seat samples.
6.2.2 Cutting and Layup Cost
Layup were performed by hand. Three different woven prepregs were used to make the
six types of bus seats: MTM 45-1, MTM 45-1 sandwich, Cycom 5320, Cycom 5320
sandwich, Cycom 5276-1 and Cycom 5276-1 sandwich. Amount them, bus seats made of
MTM 45-1 and Cycom 5320 were cured by OOA, and those made of Cycom 5276-1
were cured by autoclave. Detailed layup steps are shown in Tables 6.7 to 6.12. We used
$15/hour as the labor wage to multiply the total labor time at the end of Tables 6.7 to 6.12
to obtain the labor costs. These cost values are summarized in Table 6.13.
6.2.3 Equipment and Tool Cost
Equipment and tool cost include depreciation cost and maintenance cost. Energy cost is
the cost of electricity used in the manufacturing process sample. Straight line method is
used to calculate the depreciation cost. For this study, the depreciation cost for each
sample is the daily depreciation cost of the equipment, because it took one day to make
each sample. The total equipment and tool cost calculated according to the Equation 4.1
to 4.4.
Tables 6.14 to 6.19 present equipment cost, depreciation cost and maintenance cost for
manufacturing the bus seat samples.
6.2.4 Total Composite Samples Cost

57
The total cost for manufacturing each sample is the sum of material cost, cutting and
layup cost and equipment and tool cost. Table 6.20 shows the total costs of the samples
made from different materials and processes.
Table 6.1: Materials cost for OOA MTM 45-1 sample
Item Supplier Unit Price Amount Cost($) Prepreg(sq-ft) ACG 0.47/sq-ft 76.50 35.96
Release agent ( ml) Airtech 0.12 /ml 10.00 1.20 Release agent ( ml) Airtech 0.026 /ml 20.00 0.52
Breather(sq-ft) Airtech 0.20 / sq-ft 38.00 7.60 Release film(sq-ft) Airtech 0.33 /sq-ft 20.00 6.60 Vacum Bag(sq-ft) Airtech 0.19 /sq-ft 105.00 19.95 Sealant Tape(feet) General sealant 0.17 /feet 50.00 8.50 Fiber glass(feet) ----- 0.20/ feet 8.30 1.66
Total Cost 81.99
Table 6.2: Material cost for OOA MTM 45-1 sandwich sample
Item Supplier Unit Price Amount Cost($) Prepreg(sq-ft) ACG 0.47 /sq-ft 76.50 35.96
Release agent ( ml) Airtech 0.12 /ml 10.00 1.20 Release agent ( ml) Airtech 0.026 /ml 20.00 0.52
Breather(sq-ft) Airtech 0.20/sq-ft 40.00 8.00 Release film(sq-ft) Airtech 0.33 /sq-ft 17.90 5.91 Vacum Bag(sq-ft) Airtech 0.19 /sq-ft 36.50 6.94
Strety vacuum bag (sq-ft) Airtech 0.18 /sq-ft 41.00 7.38 Honeycomb (sq-ft) ----- 17.5/sq-ft 0.70 12.25
Adhesive (sq-ft) 3M 6.2/sq-ft 1.40 8.68 Sealant Tape (feet) General sealant 0.17 /feet 33.40 5.68 Fiber glass (feet) ----- 0.20 /feet 8.30 1.66
Total 94.17

58
Table 6.3: Materials cost for OOA Cycom 5320 sample Item Supplier Unit Price Amount Cost($)
Prepreg(sq-ft) Cytec 0.47 /sq-ft 76.50 35.96 Release agent ( ml) Airtech 0.12 / ml 10.00 1.20 Release agent ( ml) Airtech 0.026 /ml 20.00 0.52
Breather(sq-ft) Airtech 0.20 /sq-ft 25.80 5.16 Release film(sq-ft) Airtech 0.33 /sq-ft 10.00 3.30 Vacum Bag(sq-ft) Airtech 0.33/sq-ft 10.00 3.30
Strety vacuum bag (sq-ft) Airtech 0.18 /sq-ft 90.00 16.20 Sealant tape(sq-ft) General sealant 0.17 /feet 500.00 85.00 Adhesive (sq-ft) ----- 0.05 /feet 90.00 4.50
Total 155.14
Table 6.4: Materials cost for OOA Cycom 5320 sandwich sample Item Supplier Unit Price Amount Cost($)
Prepreg(sq-ft) ACG 0.47 /sq-ft 76.50 35.96 Release agent ( ml) Airtech 0.12 /ml 10.00 1.20 Release agent ( ml) Airtech 0.026/ ml 20.00 0.52
Breather(sq-ft) Airtech 0.20/ sq-ft 32.00 6.40 Perforated release film (sq-ft) Airtech 0.33 /sq-ft 10.00 3.30
Non-perforated release film(sq-ft) Airtech 0.33 /sq-ft 10.00 3.30 Vacuum bag (sq-ft) Airtech 0.18 /sq-ft 92.00 16.56 Honeycomb (sq-ft) ----- 17.5/sq-ft 0.70 12.25
Adhesive (sq-ft) 3M 6.2/sq-ft 1.40 8.68 Sealant Tape(inch) General sealant 0.17/feet 500.00 85.00
Fiberglass tow (inch) ----- 0.05 /feet 90.00 4.50 Total 177.67

59
Table 6.5: Materials cost for autoclave Cycom 5276-1 sample Item Supplier Price Amount Cost($)
Prepreg(sq-ft) Cytec 0.47 /sq-ft 76.50 35.96 Release agent ( ml) Airtech 0.12 /ml 10.00 1.20 Release agent ( ml) Airtech 0.026/ ml 20.00 0.52
Breather(sq-ft) Airtech 0.20 /sq-ft 25.80 5.16 Non-perforated release film (sq-ft) Airtech 0.33 /sq-ft 9.70 3.20
Perforated release film(sq-ft) Airtech 0.33 /sq-ft 9.70 3.20 Stretchy Vacuum Bag(sq-ft) Airtech 0.18 /sq-ft 90.00 16.20
Sealant Tape(inch) General sealant 0.17 /feet 488.00 6.91 Fiberglass tow(inch) ----- 0.05 /feet 90.00 0.38
Total 72.73
Table 6.6: Materials cost for autoclave Cycom 5276-1 sandwich sample
Item Supplier Price Amount Cost($)Prepreg(sq-ft) ACG 0.47/sq-ft 76.50 35.96
Release agent ( ml) Airtech 0.12/ml 10.00 1.20 Release agent ( ml) Airtech 0.026/ml 20.00 0.52
Breather(sq-ft) Airtech 0.20 /sq-ft 32.00 6.40 Perforated release film (sq-ft) Airtech 0.33 /sq-ft 9.00 2.97
Non-perforated release film(sq-ft) Airtech 0.33 /sq-ft 9.00 2.97 Vacuum bag Stretchlon 800 (sq-ft) Airtech 0.19 /sq-ft 92.00 17.48
Honeycomb (sq-ft) 17.5/sq-ft 0.70 12.25 Adhesive (sq-ft) 3M 6.2/sq-ft 1.40 8.68
Sealant Tape (inch) General sealant 0.17/feet 524.00 7.42 Fiberglass tow (inch) ----- 0.05 /feet 90.00 0.38
Total Cost 96.22

60
Table 6.7: Layup steps for MTM 45-1 bus seat
Process Time(min) Cut Prepregs 10.00 Cut Breather 2.00
Cut Release film 2.00 Cut Vacuum bag 1.00
Layup 1st ply 36.00 Apply consolidation bag 35.00
Consolidation 10.00 Remove bag 5.00
2nd , 3rd and 4th plies down 85.00 Apply consolidation bag 8.00
Consolidation 10.00 Remove bag 3.00
5th , 6th, 7th and 8th plies 135.00 Edge breathing 63.00
Final Bag 45.00 Test bag sealing 15.00
Place the tool in the Oven 3.00 Remove The tool from the Oven 3.00
Remove Composite from the Mold 5.00 Total time 476.00

61
Table 6.8: Layup steps for MTM 45-1 sandwich bus seat
Process Time(min) Cut Prepregs 10.00
Cut Breather, release film and vacuum bag 10.00 1st ply 25.00
1st debulk (apply bag + debulk + remove bag) 108.00 2nd and 3rd plies 59.00
2nd debulk (apply bag + debulk + remove bag) 29.00 4th ply 23.00
Partial plies 10.00 Honeycomb 15.00
5th ply 27.00 3rd debulk (apply bag + debulk + remove bag) 29.00
6th, 7th and 8th plies 83.00 Edge trimming 60.00 Edge breathing 12.00
Final bag + leak test 71.00 Place the tool in the Oven 3.00
Remove The tool from the Oven 3.00 Remove Composite from the Mold 5.00
Total time 582.00

62
Table 6.9: Layup steps for Cycom 5320 bus seat Process Time(min)
Cut Prepregs 10.00 Cut Breather, release film and vacuum bag 10.00
1st ply 22.53 1st debulk (apply bag + debulk + remove bag) 77.00
2nd ply and 3rd ply 61.06 2nd debulk (apply bag + debulk + remove bag) 29.13
4th ply and 5th ply 70.06 3rd debulk (apply bag + debulk + remove bag) 26.00
6th ply, 7th ply and 8th ply 94.53 Place fiberglass tow 5.00 Final bag + leak test 79.48
Place the tool in the autoclave 10.00 Remove The tool from the autoclave 5.00 Remove Composite from the Mold 5.00
Total time 494.85
Table 6.10: Layup steps for Cycom 5320 sandwich bus seat Process Time(min)
Cut Prepregs 10.00 Cut Breather, release film and vacuum bag 10.00
1st ply 28.50 1st debulk (apply bag + debulk + remove bag) 70.90
2nd ply and 3rd ply 57.00 2nd debulk (apply bag + debulk + remove bag) 29.76
4th ply and 5th ply 70.66 Partial plies 10.00 Honeycomb 14.00
3rd debulk (apply bag + debulk + remove bag) 31.85 6th ply, 7th ply and 8th ply 126.48
Place fiberglass tow 5.00 Final bag + leak test 95.00
Place the tool in the autoclave 10.00 Remove The tool from the autoclave 5.00 Remove Composite from the Mold 5.00
Total time 569.15

63
Table 6.11: Layup steps for Cycom 5267-1 bus seat Process Time(min)
Cut Prepregs 10.00 Cut Breather, release film and vacuum bag 10.00
1st ply 23.00 1st debulk (apply bag + debulk + remove bag) 77.00
2nd ply and 3rd ply 58.00 2nd debulk (apply bag + debulk + remove bag) 26.00
4th ply and 5th ply 95.00 3rd debulk (apply bag + debulk + remove bag) 30.00
6th ply, 7th ply and 8th ply 83.00 Place fiberglass tow 5.00 Final bag + leak test 81.00
Place the tool in the autoclave 10.00 Remove The tool from the autoclave 5.00 Remove Composite from the Mold 5.00
Total time 508
Table 6.12: Layup steps for Cycom 5267-1 sandwich bus seat Process Time(min)
Cut Prepregs 10.00 Cut Breather, release film and vacuum bag 10.00
1st ply 27.00 1st debulk (apply bag + debulk + remove bag) 76.00
2nd ply and 3rd ply 60.00 2nd debulk (apply bag + debulk + remove bag) 38.00
4th ply and 5th ply 55.00 Partial plies 10.00 Honeycomb 14.00
3rd debulk (apply bag + debulk + remove bag) 37.00 6th ply, 7th ply and 8th ply 101.00
Edge breathing 3.00 Final bag + leak test 95.00
Place the tool in the autoclave 10.00 Remove The tool from the autoclave 5.00 Remove Composite from the Mold 5.00
Total time 546.00

64
Table 6.13: Labor cost for bus seat samples
MTM45-1 MTM45-1
with Honeycomb
CYCOM 5320
CYCOM 5320 with
Honeycomb
CYCOM 5276-1
CYCOM 5276-1 with Honeycomb
Cost($) 119 145.5 123.71 142.29 136.5 127
Table 6.14: Equipment cost for OOA bus seats Equipment Lifetime (years) Purchase ($) Salvage ($)
Oven 20 42000 4200 Pump 20 11000 1100
Ply cutter 20 200,000 20,000
Table 6.15: Daily Equipment Depreciation and Maintenance Cost ($/day) Depreciation Cost (oven+pump+ply cutter) 37.95 Maintenance Cost (oven+pump+ply cutter) 7.00
Depreciation Cost (autoclave+pump+ply cutter) 181.65 Maintenance Cost (autoclave+pump+ply cutter) 33.33
Table 6.16: Equipment cost for MTM 45-1 and MTM 45-1 sandwich bus seat Time (hr) Cost ($)
Ply cutter 0.167 0.47595 Oven 12 81
Energy Consumption Cost
Compression Air 22 2.4618 Depreciation Cost 37.95 Maintenance Cost 7
Total 128.89
Table 6.17: Equipment cost for Cycom 5320 and Cycom 5320 sandwich bus seats Time (hr) Cost ($)
Ply cutter 0.167 0.47595 Oven 3.6 24.3
Energy Consumption Cost
Compression Air 5 0.5595 Depreciation Cost 37.95 Maintenance Cost 7
Total 63.29

65
Table 6.18: Equipment for autoclave bus seats Equipment Lifetime (years) Purchase ($) Salvage ($) Autoclave 20 1,000,000 100,000
Pump 20 11000 1100 Ply cutter 20 200,000 20,000
Table 6.19: Equipment cost for autoclave bus seat Time (hr) Cost ($)
Ply cutter 0.167 0.47595 Autoclave 5.8 43.5
Energy Consumption Cost
Compression Air 7.0 0.7833 Depreciation Cost 181.65 Maintenance Cost 33.33
Total 259.74
Table 6.20: Total cost for bus seats
MTM45-1 MTM45-1
with Honeycomb
CYCOM 5320
CYCOM 5320 with
Honeycomb
CYCOM 5276-1
CYCOM 5276-1 with Honeycomb
Material 81.99 94.17 155.14 177.67 96.22 72.73 Labor 119 145.5 123.71 142.29 136.5 127
Equipment
128.89 128.89 63.29 63.29 259.74 259.74
TOTAL 329.88 368.56 342.14 383.25 492.46 459.47
6.3 Cost Comparison and Analysis
Figure 6.6 shows the different cost components contributing to the total manufacturing
cost. For making the bus seats, autoclave equipment cost and labor cost dominate the
total cost using MTM 45-1 and Cycom 5276-1. Reducing equipment cost is crucial for
reducing the total manufacturing cost. The figure also shows that OOA has lower total
manufacturing cost due to lower equipment cost, although material cost is higher than

66
those made by autoclave. Among the 6 combinations in making the sample bus seats,
OOA MTM 45-1 has the lowest cost.
Figure 6.6 also shows that for all manufacturing methods, labor cost occupies a large part
of the total cost. So improving the layup process is also an important way to reduce the
total cost.
6.4 Summary
Cost estimation and analysis for manufacturing composite bus seats are illustrated in this
chapter. Cost breakdowns for different processes in making the bus seats are described in
detail. The manufacturing process is also presented in detail. In the end, the cost results
are compared and analyzed.
Figure 6.6: Cost breakdown of 6 composite bus seats

67
Chapter Seven
Aggregate Production Planning for Composite Manufacturing
In this chapter, we propose an aggregate production planning model for composite
manufacturing. Production cost analysis presented in Chapter Four is to identify main
factors affecting composite production cost. The aggregate production planning model
for multiple products presented in this chapter can be used for medium-term (6 to 18
months) production planning. It allocates production resources to satisfy customer
demand and minimizes production costs in the planning horizon.
The multi-product production planning problem considered in this chapter is similar to
that in Christou et al 2007. The problem features are consistent with the cost analysis
presented in the previous chapters. In addition, the parameter values used in the example
problem are derived from the cost analysis in the previous chapters. Details about the cost
structure, assumptions for the model, notations, explanations and model formulation are
presented next.
7.1 Problem Definition
In this study, we consider different types of composite components fabricated by
different methods. Products by either autoclave process or OOA process can satisfy the
customer. The customer requires certain number of products each month. They can be
made by autoclave or by OOA. The production planning model is to determine the
number of products to produce to satisfy the demand with minimized total cost. The
following assumptions are used in formulating the aggregate production planning model.

68
1. Customer demand may be different in different time periods.
2. Product orders are received at the beginning of each period.
3. Products are delivered at the end of each period.
4. If product delivery is delayed, penalty cost will incur.
The objective function of the model is to minimize total production cost, inventory cost
and penalty cost.
7.2 Manufacturing Model
Before the mathematical model is presented, we first give notations used in formulating
the model.
Index sets: 错误!未找到引用源。 : Index of product types, 错误!未找到引用源。 错误!未找到引用源。 : Index of time periods, 错误!未找到引用源。
Parameters: 错误!未找到引用源。: Demand in period t; 错误!未找到引用源。 : Unit production cost; 错误!未找到引用源。: Unit inventory holding cost for one period; 错误!未找到引用源。: Unit penalty cost for each month late products;
Decision variables: 错误!未找到引用源。 : Production quantity of product 错误!未找到引用源。during time period t; 错误!未找到引用源。 : Inventory quantity of product 错误!未找到引用源。 at the end of time period t; 错误!未找到引用源。: Delayed quantity of product 错误!未找到引用源。 at the end of period t;

69
The objective function of the math model is to minimize total production cost in
considered time periods.错误!未找到引用源。错误!未找到引用源。错误!未找到
引用源。
The objective function is to be minimized subject to the following constraint functions:
Constraint (7.2) ensures that the total production of autoclave and OOA plus the
inventory at the end of the previous period plus the delay quantity minus the inventory
level in this period is equal to the customer demand in the period. Constraints (7.4) ~ (7.7)
ensures that the autoclave production and OOA production are limited by the production
capacity. Constraints (7.8) and (7.9) indicate that the sum of production and penalty in

70
the period should not be over the production capacity. Constraint (7.10) shows that the
initial value of delayed products is 0.
7.3 Numerical Examples and Analysis
An example problem is presented to test the model. This example problem is based on the
information of the composite manufacturing processes discussed in Chapter 3 and
Chapter 4. The example problem considers 4 different ways in making autoclave-convex,
autoclave concave, OOA –convex and OOA-concave. The end products are considered
the same in satisfying customer demands.
The unit manufacturing cost is obtained from the process discussed in Chapter 4. The
number of the production period is 7 months. The manufacturing costs of autoclave-
convex and OOA-convex component and equipment capacities are shown in Table 7.1.
The holding cost is $0.78 per product. The penalty for each delayed product is $7.8.
Customer demands for the 7 months are shown in Table 7.2.
Table 7.1: Unit manufacturing cost for each kind of samples OOA-convex Autoclave-convex
Cost ($) 66.79 88.69 Capacities (unit/per month) 20 40
Table 7.2: Product demand for each period Month 1 2 3 4 5 6 7
Demand(unit) 77 33 25 75 107 100 45

71
7.5 Solution and Analysis
The example problem is solved using optimization software LINGO. The optimal
solution: how many units to product, inventory and how many backlog is shown in Table
7.3. The total production cost is $ 38,579.10 with manufacturing cost, inventory cost and
penalty cost being $27,233.2, $66.3 and $11,279.6 respectively.
Table 7.3: Solution for product quantity for each period Solution Inventory Backlog
Period Autoclave OOA Autoclave OOA Autoclave OOA 1 40 20 0 0 0 17 2 40 3 10 0 0 0 3 40 20 45 0 0 0 4 40 20 30 0 0 0 5 40 20 0 0 0 17 6 40 3 0 0 40 17 7 0 3 0 0 22 20
It can be seen that production will be up to the maximum of the capacity, when the
customer demand is high. At the same time, inventory will be used and backlog will be
occurred. Because OOA-convex is less expensive than autoclave-convex, when demand
is not very high, capacity of OOA-convex is always used first. When demand is higher, to
satisfy the demand, autoclave-convex will be used first because of its fast production rate.
Moreover, the shortage cost occurs only when the customer demand is very high in this
problem.

72
7.6 Summary
A multi-product production planning model was established for allocating production
resources to minimize total production costs is composite manufacturing. Production
level, inventory level and penalty level of the products were determined to minimize the
total cost. Details of the cost structure, assumptions for the model, notations, explanations
and model formulation were described. The mathematical model is programmed in
LINGO. A numerical example is solved to validate the developed model.

73
Chapter Eight
Conclusions and Future Research
In this chapter we present a summary of the research conclusion based on the composite
manufacturing and the problem modeling presented in the previous chapters. Future
research directions in this area are also discussed.
8.1 Research Summary
In this study, out-of-autoclave and autoclave composite manufacturing processes are
studied. We proposed a cost model to analyze the costs of manufacturing L-shape
composite components. The total manufacturing cost of the OOA L-shape components
was compared with the autoclave L-shape components. We identified the factors that
have major impact on production cost. The study also shows that the process can be
improved if certain manufacturing steps take place in parallel.
Tests were conducted for testing quality of the manufacturing L-shape components.
Tensile and compression tests were conducted for testing the mechanical properties.
Microscope tests were used in checking the corner section of the samples to detect void
content of the corner section.
An aggregate production planning model was developed for large scale production of
composite manufacturing. Production cost, inventory cost and penalty cost were
considered in the production planning model. We used the L-shape composite
manufacturing production as an example. The model was solved using simple linear
programming optimization to obtain optimal production quantities and inventory
quantities were obtained in this research.

74
Both the production cost and aggregate production planning model developed in this
study can be easily modified for cost analysis on similar composite manufacturing
processes in different industries.
8.2 Contribution
Four different kinds of composite L-shape samples were fabricated in this study:
autoclave concave, autoclave convex, OOA-concave and OOA-convex. And a multiple
product cost analysis model was developed for the composite L-shape manufacturing
production.
8.3 Future Research
The research presented in this thesis can be extended in several aspects such as:
1. Consider the uncertainties involved in composites manufacturing.
2. Extend the model to include sensitivity analysis and other post-optimality analysis.
3. Develop cost analysis model which can be used for manufacturing different composite
products at the same time.

75
REFERENCES
1. ASTM D3410/D3410M-03(2008). Standard test method for compressive properties of
polymer matrix composite materials with unsupported gage section by shear loading,
vol.15.03. Annual book of standards, American Society for Testing and Materials. Doi:
10.1520/D3410M-03R08.
2. Ǻkermo and Ǻstrӧm “Modelling component cost in compression moulding of
thermoplastic”. Composites Part A, Vol. 31,pp.319-333, 2000.
3. D.Abraham and R. Mcllhagger “Investigations into various methods of liquid injection to
achieve mouldings with minimum void contents and full wet out”. Composites Part A,
Vol. 29A,pp. 533-539,1998.
4. L. Angelo and P. Stefano “Parametric cost anlyasis for web-based e-commerce of layer
manufactured objects”. International Journal of Production Research, Vol.48, pp.2127-
2140,2010.
5. M. Åkermo and B.T. Aström “Modelling Component Cost in Compression Moulding of
Thermoplastic Composite and Sandwich Components”. Composite Part A, Vol.31,
pp319-333, 2000.
6. S.M.J.M. Alehashem, H. Malekly and M.B. Aryanezhad “A multi-objective robust
optimization model for multi-product multi-site aggregate production planning in a
supply chain under uncertainty”. International Journal of Production Economics,
doi:10.1016/j.ijpe.2011.01.027.
7. J.I. Bech, S. Goutianos, T.L.Andersen,R.K. Torekov and P. Brøndsted “A New Static and
Fatigue Compression Test Method for Composites”. Strain, Vol.47, pp. 21-28, 2011.

76
8. N. Bhatnagar, R. Bhardwaj ,P. Selvakumar and M. Brieu “Development of a biaxial
tensile test fixture for reinforced thermoplastic composites”. Polymer Testing, Vol.26, pp.
154-161,2007.
9. Cycom 5320 Toughened Epoxy for Structural Applications, Cytec Engineered Materials,
Out-of-Autoclave Manufacturing, Information Sheet Revision, 1.3 – 03.18.09.
10. D.A.Crump and J.M.Dulieu-Barton “The Manufacturing procedure for Aerospace
Secondary Sandwich Structure Panel”. Journal of Sandwich Structures and Materials,
Vol.12, pp421-447, 2010.
11. S.Chen and L.K.Keys “ A cost analysis model for heavy equipment”. Computers &
Industrial Engineering, Vol.56, pp.1276-1288,2009.
12. I.T.Christou, A.G.Lagodimos and D.Lycopoulou “Hierarchical production planning for
multi-product lines in the beverage industry”. Production Planning & Control, Vol.18,
pp.367-376,2007.
13. R.Y.K.Fung J.Tang and D.Wang “Multiproduct Aggregate Production Planning with
Fuzzy Demands and Fuzzy Capacities”. IEEE Transaction on systems, Man and
Cybernetics-Part A: Systems and Humans, Vol. 33, pp.302-313, 2003.
14. L.K.Grunenfelder and S.R. Nutt “Void formation in composite prepregs-Effect of
dissolved moisture”. Composites Science and Technology, Vol.70,pp. 2304-2309,2010.
15. Z.S.Guo, L.Liu, B.M.Zhang and S. Du “Critical Void Content for Thermoset Composite
Laminates”. Journal of Composites Material, Vol.43, No.17 pp.1775-1790,2009.
16. S. V. Hoa, Principles of the manufacturing of composite materials”. Destech Publications,
2009.

77
17. H. Jens and B. Cesar “The Challenge of Reducing Both Airframe Weight and
Manufacturing Cost”. Air & Space Europe, Vol.3, pp119-121, 2001.
18. U,Klanšek and S.Kravanja “Cost estimation, optimization and competitiveness of
different composite floor systems”. Journal of Constructional Steel Research, Vol.62,
pp.434-448, 2006.
19. L.Liu, H.Cheng,Z.Ma,Z.Zhu, J.Zhang and L.Yao “Life Cycle Cost Estimate of Power
System Planning”. International Conference on Power System Technology ,2010.
20. S.V.Lomov, D.S. Ivanov, T.C. Truong, I.Verposest, F.Baudry, K.V.Bosche and H.Xie
“Experimental methodology of study of damage initiation and development in textile
composite in uniaxial tensile test”. Composites Science and Technology, Vol.68, pp.
2340-2349,2008.
21. S. K. Mazumdar, Composites Manufacturing: Materials, Product and Process
Engineering. CRC Press, 2002.
22. M.Özbayrak, M. Akgün and A.K.Türker “Activity-based cost estimation in a push/pull
advanced manufacturing system”. International journal of Production Economics, Vol. 87,
pp. 49-65, 2004.
23. D. Purslow “On the optical assessment of the void content in composite materials”.
Composites, Vol.15, No.3,pp.207-210,1984
24. G. Palfinger, B. Bitnar,W. Durish, J. Mayor,D.Grützmacher and J. Gobrecht “ Cost
estimate of electricity produced by TPV”. Semicond Science and Technology,
Vol.18,pp.S254-S261,2003.

78
25. S. Paciornik and J.R.M.D’Almeida “Measurement of Void Content and Distribution in
Composite Maerials through Digital Microscopy”. Journal of Composite Materials,
Vol.43,No.02 pp.101-112,2009.
26. S.G.Pantelakis, C.V. Katsiropoulos, G.N.Labeas and H Sibois “A concept to optimize
quality and cost in thermoplastic composite components applied to the production of
helicopter canopies”. Composites Part A, Vol.40, pp. 595-606, 2009.
27. J.S. Rajadurai and G. Thanigaiyarasu “Structural Analysis, Failure Prediction and Cost
Analysis of Alternative Material for Composite Wind Turbine Blades”. Mechanics of
Advanced Materials and Structures, Vol. 16, pp.467-487,2009.
28. D.J. Stockton, R, Forster and B. Messner “Developing time estimating models for
advanced composite manufacturing processes”. Aircraft Engineering and Aerospace
Technology, Vol. 70,pp. 445-450, 1998.
29. A. Techawiboonwong and P. Yenradee “Aggregate production planning with workforce
transferring plan for multiple product types”. Production planning & control, Vol. 14,
pp.447-458, 2003.
30. S. Thomas and S. R. Nutt “Temperature Dependence of Resin Flow in a Resin Film
Infusion (RFI) Process by Ultrasound Imaging”. Appl Compos Mater, Vol.16, pp183-196,
2009.
31. S.C. Tan “Analysis of a Mini-sandwich Compression Test Specimen”. Composites
Science and Technology, Vol. 47, pp. 369-382,1993.
32. J. Verrey, M.D. Wakeman, V. Michaud and J.-A.E. Månson “Manufacturing Cost
Comparison of Thermoplastic and Thermoset RTM for an Automotive Floor Pan”.
Composite Part A, Vol.37, pp9-22, 2006.

79
33. R. Wang and T. Liang “Application of fuzzy multi-objective linear programming to
aggregate production planning”. Computers & Industrial Engineering, Vol.46,pp.17-
41,2004.
34. C.Yang and T.S. Lin “ Developing an integrated framework for feature-based early
manufacturing cost estimation”. Advanced Manufacturing Technology, Vol.13, pp.618-
629,1997.
35. J. Ye, B. Zhang and H. Qi “Cost Estimates to Guide Manufacturing of Composite Waved
Beam”. Materials and Design, Vol.30, pp452-458, 2009.
36. B. Zhao and R.H. Fang “A Study on Principal Strain Direction Measurement in the
Uniaxial Tensile Test of Composite”. Mechanics Research Communications, Vol.23, No.
5, pp. 531-536, 1996.

80
APPENDIX A: Tensile Test Load Data
0
100
200
300
400
500
600
700
800
900
1000
0 20 40 60 80
Tensileload forautoclaveconvexsample
Displacement(mm)
Load(N)
Figure A1: Tensile load for autoclave convex sample
0
100
200
300
400
500
600
700
800
900
1000
0 20 40 60 80
Tensileload forautoclaveconcavesample
Load(N)
Displacement(mm)
Figure A2: Tensile load for autoclave concave sample

81
Figure A3: Tensile load for OOA convex sample
0100200300400500600700800900
1000
0 20 40 60 80
Tensileload forOOAconcavesample
Load(N)
Displacement(mm)
Figure A4: Tensile load for OOA concave sample

82
APPENDIX B: Compression test load data
0
2000
4000
6000
8000
10000
12000
0 1 2 3 4 5
autoclaveconvex
Load(N)
Displacement(mm)
Figure B1: Autoclave convex compression Load
0
2000
4000
6000
8000
10000
12000
0 1 2 3 4 5
autoclaveconcave
Load(N)
Displacement(mm)
Figure B2: Autoclave concave compression load

83
0
2000
4000
6000
8000
10000
12000
0 1 2 3 4 5
OOAconvex
Load(N)
Displacement(mm)
Figure B3: OOA convex compression load
0
2000
4000
6000
8000
10000
12000
0 1 2 3 4 5
OOAconcave
Load(N)
Displacement(mm)
Figure B4: OOA concave compression load