Cortical Anatomy in Autism Spectrum Disorder: An In Vivo MRI Study on the Effect of Age
9
Cerebral Cortex June 2010;20:1332--1340 doi:10.1093/cercor/bhp198 Advance Access publication October 9, 2009 Cortical Anatomy in Autism Spectrum Disorder: An In Vivo MRI Study on the Effect of Age Armin Raznahan 1 , Roberto Toro 2 , Eileen Daly 3 , Dene Robertson 3 , Clodagh Murphy 3 , Quinton Deeley 3 , Patrick F. Bolton 4 , Toma´sˇ Paus 2,5 and Declan G. M. Murphy 3 1 Department of Child and Adolescent Psychiatry, Institute of Psychiatry, King’s College London, SE5 8AF, UK, 2 Brain and Body Center, University of Nottingham, NG7 2RD, UK, 3 Department of Psychological Medicine, Section of Brain Maturation, Institute of Psychiatry, King’s College London, SE5 8AF, UK, 4 MRC Center for Social Genetic and Developmental Psychiatry, Institute of Psychiatry, King’s College London, SE5 8AF, UK and 5 Montreal Neurological Institute, McGill University, H3A 2B4, Canada There is increasing evidence that children with autism spectrum disorder (ASD) have age-related differences from controls in cortical volume (CV). It is less clear, however, if these persist in adulthood and whether these reflect alterations in cortical thickness (CT) or cortical surface area (SA). Hence, we used magnetic resonance imaging to investigate the relationship between age and CV, CT, and SA in 127 males aged 10 through 60 years (76 with ASD and 51 healthy controls). ‘‘Regional’’ analyses (using cortical parcellation) identified significant age-by-group interactions in both CV and CT (but not SA) in the temporal lobes and within these the fusiform and middle temporal gyri. Spatially nonbiased ‘‘vertex-based’’ analysis replicated these results and identified additional ‘‘age-by-group’’ interactions for CT within superior temporal, inferior and medial frontal, and inferior parietal cortices. Here, CV and CT were 1) significantly negatively correlated with age in controls, but not in ASD, and 2) smaller in ASD than controls in childhood but vice versa in adulthood. Our findings suggest that CV dysmaturation in ASD extends beyond childhood, affects brain regions crucial to social cognition and language, and is driven by CT dysmaturation. This may reflect primary abnormalities in cortical plasticity and/or be secondary to disturbed interactions between individuals with ASD and their environment. Keywords: age, autism, brain, cortical thickness, MRI Introduction Autism spectrum disorder (ASD) is an increasingly recognized (Baird et al. 2006) group of life span persistent neuro- developmental disorders of early onset that are characterized by abnormalities in language, social interaction, and a range of stereotyped and repetitive behaviors (WHO 1993). The brain basis of ASD is poorly understood. However, longitudinal studies report that children with ASD have accelerated growth in head circumference as compared with controls (Hazlett et al. 2005; Dawson et al. 2007; Webb et al. 2007). In addition, many in vivo magnetic resonance imaging (MRI) studies have reported that young children with ASD have a significant increase in total brain volume (TBV) compared with typically developing controls (e.g., see Hazlett et al. 2005). In contrast, findings regarding differences in total brain volume (TBV) between individuals with ASD and controls during later childhood, adolescence, and adulthood have been less consis- tent. Some groups report no group difference in TBV (e.g., see Hallahan et al. 2008), and others find increased TBV in ASD (e.g., see Hazlett et al. 2008). Given that findings of altered TBV in ASD have been more consistently reported in pediatric compared with adult populations, some have suggested that people with ASD have differences in the trajectory of brain growth that are limited to early childhood (for a meta-analysis, see Redcay and Courchesne 2005). Abnormal maturation of the cerebral cortex could contribute to age-related differences in brain volume between people with ASD and typically developing controls. For example, Courchesne et al. (2001) compared children with autism to typically developing controls aged between 2 and 16 years and reported age-related differences in total cortical gray matter volume. In a later study using the same sample, Carper et al. (2002) compared lobar cerebral gray matter volume in children with autism and controls. Their measure of cerebral gray matter volume excluded subcortical structures and therefore reflected cortical volume (CV). They found age-related differences in CV between children with autism and controls that varied by lobe. In the preschool years (2--4 years), children with autism had significantly increased CV in the frontal and temporal lobes as compared with controls. However, due to greater age-related CV increase in controls compared with children with autism, these differences were not apparent in older children. Also, there was a significant ‘‘age-by-group’’ interaction in the CV of these regions, and children with autism had a significantly smaller age- related increase in CV than controls. Thus, prior work suggests that in early childhood, people with ASD have significant differences from controls in the maturation of CV. However, it is unclear if these maturational differences normalize or persist into adolescence and adulthood and if they vary by brain region. We previously reported that adults (aged 18--45 years) with ASD have significant age-related differences from controls in whole-brain gray matter volume (those with Asperger syndrome had a significantly smaller age-related reduction than controls) (McAlonan et al. 2002). Our work provides pre- liminary evidence that differences in brain maturation extend beyond childhood. However, we did not directly measure CV or include people from across the life span (i.e., children and older adults). Furthermore, CV has 2 sole determinants—cortical thick- ness (CT) and surface area (SA). It is important to investigate how abnormalities in CV relate to CT and SA because these 2 measures have distinct genetic determinants (Panizzoni et al. 2007) contrasting phylogeny (Rakic 1995) and differing developmental trajectories (Armstrong et al. 1995; Sowell et al. 2007). CT has been hypothesized to reflect dendritic arborization/pruning within gray matter (Huttenlocher 1990) or changing myelination at the gray/white matter interface (Sowell et al. 2004), whereas SA is influenced by division of Ó The Author 2009. Published by Oxford University Press. All rights reserved. For permissions, please e-mail: [email protected] at NIH Library on April 19, 2011 cercor.oxfordjournals.org Downloaded from
Transcript of Cortical Anatomy in Autism Spectrum Disorder: An In Vivo MRI Study on the Effect of Age
Cerebral Cortex June 2010;20:1332--1340
doi:10.1093/cercor/bhp198
Advance Access publication October 9, 2009
Cortical Anatomy in Autism SpectrumDisorder: An In Vivo MRI Study on theEffect of Age
Armin Raznahan1, Roberto Toro2, Eileen Daly3,
Dene Robertson3, Clodagh Murphy3, Quinton Deeley3,
Patrick F. Bolton4, Tomas Paus2,5 and Declan G. M. Murphy3
1Department of Child and Adolescent Psychiatry, Institute of
Psychiatry, King’s College London, SE5 8AF, UK, 2Brain and
Body Center, University of Nottingham, NG7 2RD, UK,3Department of Psychological Medicine, Section of Brain
Maturation, Institute of Psychiatry, King’s College London,
SE5 8AF, UK, 4MRC Center for Social Genetic and
Developmental Psychiatry, Institute of Psychiatry, King’s
College London, SE5 8AF, UK and 5Montreal Neurological
Institute, McGill University, H3A 2B4, Canada
There is increasing evidence that children with autism spectrumdisorder (ASD) have age-related differences from controls in corticalvolume (CV). It is less clear, however, if these persist in adulthoodand whether these reflect alterations in cortical thickness (CT) orcortical surface area (SA). Hence, we used magnetic resonanceimaging to investigate the relationship between age and CV, CT, andSA in 127 males aged 10 through 60 years (76 with ASD and51 healthy controls). ‘‘Regional’’ analyses (using cortical parcellation)identified significant age-by-group interactions in both CV and CT (butnot SA) in the temporal lobes and within these the fusiform andmiddle temporal gyri. Spatially nonbiased ‘‘vertex-based’’ analysisreplicated these results and identified additional ‘‘age-by-group’’interactions for CT within superior temporal, inferior and medialfrontal, and inferior parietal cortices. Here, CV and CT were 1)significantly negatively correlated with age in controls, but not inASD, and 2) smaller in ASD than controls in childhood but vice versain adulthood. Our findings suggest that CV dysmaturation in ASDextends beyond childhood, affects brain regions crucial to socialcognition and language, and is driven by CT dysmaturation. This mayreflect primary abnormalities in cortical plasticity and/or besecondary to disturbed interactions between individuals with ASDand their environment.
Keywords: age, autism, brain, cortical thickness, MRI
Introduction
Autism spectrum disorder (ASD) is an increasingly recognized
(Baird et al. 2006) group of life span persistent neuro-
developmental disorders of early onset that are characterized
by abnormalities in language, social interaction, and a range of
stereotyped and repetitive behaviors (WHO 1993).
The brain basis of ASD is poorly understood. However,
longitudinal studies report that children with ASD have
accelerated growth in head circumference as compared with
controls (Hazlett et al. 2005; Dawson et al. 2007; Webb et al.
2007). In addition, many in vivo magnetic resonance imaging
(MRI) studies have reported that young children with ASD have
a significant increase in total brain volume (TBV) compared
with typically developing controls (e.g., see Hazlett et al. 2005).
In contrast, findings regarding differences in total brain volume
(TBV) between individuals with ASD and controls during later
childhood, adolescence, and adulthood have been less consis-
tent. Some groups report no group difference in TBV (e.g., see
Hallahan et al. 2008), and others find increased TBV in ASD
(e.g., see Hazlett et al. 2008). Given that findings of altered TBV
in ASD have been more consistently reported in pediatric
compared with adult populations, some have suggested that
people with ASD have differences in the trajectory of brain
growth that are limited to early childhood (for a meta-analysis,
see Redcay and Courchesne 2005).
Abnormal maturation of the cerebral cortex could contribute
to age-related differences in brain volume between people with
ASD and typically developing controls. For example, Courchesne
et al. (2001) compared children with autism to typically
developing controls aged between 2 and 16 years and reported
age-related differences in total cortical gray matter volume. In
a later study using the same sample, Carper et al. (2002)
compared lobar cerebral gray matter volume in children with
autism and controls. Their measure of cerebral gray matter
volume excluded subcortical structures and therefore reflected
cortical volume (CV). They found age-related differences in CV
between children with autism and controls that varied by lobe.
In the preschool years (2--4 years), children with autism had
significantly increased CV in the frontal and temporal lobes as
compared with controls. However, due to greater age-related CV
increase in controls compared with children with autism, these
differences were not apparent in older children. Also, there was
a significant ‘‘age-by-group’’ interaction in the CV of these
regions, and children with autism had a significantly smaller age-
related increase in CV than controls. Thus, prior work suggests
that in early childhood, people with ASD have significant
differences from controls in the maturation of CV. However, it
is unclear if these maturational differences normalize or persist
into adolescence and adulthood and if they vary by brain region.
We previously reported that adults (aged 18--45 years) with
ASD have significant age-related differences from controls in
whole-brain gray matter volume (those with Asperger
syndrome had a significantly smaller age-related reduction than
controls) (McAlonan et al. 2002). Our work provides pre-
liminary evidence that differences in brain maturation extend
beyond childhood. However, we did not directly measure CV
or include people from across the life span (i.e., children and
older adults).
Furthermore, CV has 2 sole determinants—cortical thick-
ness (CT) and surface area (SA). It is important to investigate
how abnormalities in CV relate to CT and SA because these
2 measures have distinct genetic determinants (Panizzoni et al.
2007) contrasting phylogeny (Rakic 1995) and differing
developmental trajectories (Armstrong et al. 1995; Sowell
et al. 2007). CT has been hypothesized to reflect dendritic
arborization/pruning within gray matter (Huttenlocher 1990)
or changing myelination at the gray/white matter interface
(Sowell et al. 2004), whereas SA is influenced by division of
� The Author 2009. Published by Oxford University Press. All rights reserved.
For permissions, please e-mail: [email protected]
at NIH
Library on April 19, 2011
cercor.oxfordjournals.orgD
ownloaded from
progenitor cells in the embryological periventricular area
(Chenn and Walsh 2002) and varies as a function of brain
volume and cortical folding (gyrification). Establishing the
relative contribution of CT and SA disturbances could therefore
clarify the neurobiological mechanisms underlying CV abnor-
malities in people with ASD. New methods allow simultaneous
measurement of CV, CT, and SA from MRI scans (Fischl and
Dale 2000; MacDonald et al. 2000). These have not yet been
applied to examine age-related differences in CV between
people with ASD and controls or to establish the relative
contribution of CT and SA alterations to these. Hence, it is
unknown how abnormalities in CV relate to those in CT and SA,
which may reflect different neurobiological processes.
The methods currently available for examining the relative
contribution of CT and SA to alterations in CV require that
these 3 measures are taken from a set of predefined cortical
regions (that can be combined to give lobar estimates) (Fischl
et al. 2004). However, such ‘‘lobar’’ approaches to the study of
cortical maturation may be confounded because abnormalities
in neurodevelopment may alter traditional lobar boundaries
and/or extend across them. Therefore, a complementary
strategy is to assess cortical anatomy in a spatially nonbiased
manner by taking measures of CT at several thousand points
across the cortical sheet. To date, however, this approach has
never been applied to investigate cortical maturation in people
with ASD.
In summary, it has been proposed that young children with
ASD have age-related differences from controls in CV.
However, it is unclear if these normalize or persist into
adolescence and adulthood. Moreover, recent advances in MRI
data analysis make it possible to measure differences in the
2 determinants of CV (CT and SA)—which reflect very different
neurobiological processes. We therefore measured CV, CT, and
SA in people with ASD (n = 76) and controls (n = 51) aged
between 10 and 60 years. We tested the main hypothesis that
age-related differences in CV between people with ASD and
controls extend into adulthood. We also examined if matura-
tional differences in CV related to those in CT, SA, or both.
Finally, we carried out the first spatially nonbiased assessment
of age-related differences in CT between people with ASD and
controls in recognition of the fact that cortical abnormalities in
ASD may not conform to traditional lobar boundaries.
Materials and Methods
SampleWe included 127 male volunteers aged between 10 and 60 years: 76 with
ASD and 51 healthy controls. People with ASD were recruited through
a hospital-based national clinic and a university department specializing
in the assessment of ASD. The controls were drawn from the local
community through advertisement. Of those with ASD, 62 (82%) had
a diagnosis of Asperger syndrome, 10 (13%) autism, and 4 (5%) pervasive
developmental disorder not otherwise specified (PDD-NOS) or PDD
other. All were diagnosed clinically according to ICD-10 research criteria
(WHO 1993) by a team of senior clinicians trained in the autism
diagnostic interview revised (ADI-R) (Le Couteur et al. 1989) and the
autism diagnostic observation schedule (ADOS-G) (Lord et al. 2000). ASD
diagnoses were based on clinical interviews, collateral information from
family members, and review of other information available, such as
school reports. Forty-three (57%) of the participants, and/or their family
members, also agreed to confirmation of clinical diagnosis using the ADI-
R or ADOS. Thirty-three (43%) people were unable/unwilling to undergo
the ADI or ADOS. There were no significant demographic (age and
gender) or full-scale intelligence quotient (FSIQ) differences between
those with and without ADI/ADOS confirmation of ASD diagnosis.
Furthermore, there were no significant differences in mean age, FSIQ,
gender, or the proportion of participants with ADI/ADOS confirmation
of ASD diagnosis between ASD subgroups (i.e., Asperger vs. autism vs.
PDD-NOS). Despite this, we checked the robustness of our findings to
the exclusion of the 33 individuals with ASD who had been unable/
unwilling to undergo the ADI/ADOS.
All participants had FSIQs greater than 70. Participants in the study
underwent structured physical and psychiatric examination. No
participants had a history of neurological disorder affecting brain
function (e.g., epilepsy and stroke), major mental illness (e.g., psychosis,
major affective episode, or substance abuse), genetic disorder
associated with ASD (e.g., Fragile X syndrome), or a clinically abnormal
finding on MRI. No participants were taking psychotropic medication at
the time of the study. After complete description of the study to the
subjects, written informed consent was obtained.
Image Acquisition and AnalysisBrain MRIs were acquired using a GE Signa 1.5-T neuro-optimized MR
system (General Electric, Milwaukee, WI). ‘‘Freesurfer’’ freeware
(http://surfer.nmr.mgh.harvard.edu/fswiki) was used to derive models
of the cortical sheet in each T1-weighted image and parcellate out the
cortex into 35 regions. These well-validated (Fischl et al. 2004; Desikan
et al. 2006) and fully automated procedures have been extensively
described elsewhere (Fischl and Dale 2000; Fischl et al. 2004), and we
will only provide a brief description here. First, a single filled white
matter volume was generated for each cerebral hemisphere after
intensity normalization, the removal of extracerebral tissues using
a ‘‘skull stripping’’ algorithm, and image segmentation using a connected
components algorithm (Dale et al. 1999). Then, a surface tessellation
was generated for each white matter volume by fitting a deformable
template. The gray matter/cerebrospinal fluid (CSF) surface was also
modeled using a similar process. Given explicit models for the white/
gray and gray/CSF surfaces, the measure of absolute CT at any given
point on the white/gray matter surface was then taken to be the
shortest distance between that point and the gray/CSF surface.
This measurement was made at approximately 150 000 points across
each hemisphere for each scan.
Automated parcellation of each individual cortical hemispheric sheet
into 35 regions (Fischl et al. 2004) was achieved by aligning each scan
to a probabilistic atlas placed within a surface-based coordinate system.
Total CV, total SA, and average CT measures for these 35 subregions
were combined to generate lobar (frontal, temporal, parietal, and
occipital) estimates of total CV, total SA, and average CT.
For all analyses, CV was expressed as a proportion of TBV—corrected
cortical volume (cCV). Average TBV did not differ between cases and
controls nor was there significant age-by-group interaction for TBV. We
adjusted CV for TBV in order to remove variance in CV that was
associated with global differences in brain size and thus increase
statistical power to detect relationships between CV and our main
variables of interest (i.e., age, group, and their interaction).
Data Analysis
Analysis 1
Regional measures from automated parcellation of the cortical sheet.
In our first set of analyses, we used regional measures of cCV, CT, and
SA derived from automated parcellation of the cortical sheet. These
allowed us to examine the lobar and sublobar regional distribution of
age-related cCV difference in ASD and the interrelationship between
cCV, CT, and SA. We initially used multivariate analysis of variance
(MANOVA) to examine how variance in cCV, CT, and SA was explained
by a model including 1 between-group (group) and 2 within-group (age
and lobe) independent variables and their interaction terms. Next, for
those measures (i.e., cCV, CT, or SA) where significant variance was
explained by the ‘‘age-by-group-by-lobe’’ or age-by-group MANOVA
terms, we carried out post hoc analyses of age-by-group effects for that
measure within each lobe. Next, but only in those lobes where
a significant age-by-group effect for a cortical measure was found, we
examined age-by-group effects in each lobar subregion. Note that in all
Cerebral Cortex June 2010, V 20 N 6 1333
at NIH
Library on April 19, 2011
cercor.oxfordjournals.orgD
ownloaded from
these analyses, a significant main effect of ‘‘group’’ was not further
explored if it was accompanied by a significant age-by-group
interaction term. This is because the presence of a significant
interaction indicates that the effect of each term in the interaction is
dependent on the other and as such it is not coherent to consider the
main effect of each term in isolation. Also—the sole purpose of our
study was to investigate age-related group differences.
Analysis 2
A spatially nonbiased ‘‘vertex-based’’ approach. In our second set of
analyses, we examined the regional distribution of age-related differ-
ences in CT in people with ASD in a spatially nonbiased manner. This
additional analytic approach was adopted because cortical abnormal-
ities in ASD may well not conform to traditional lobar boundaries and in
order to provide the most spatially fine-grained analysis of CT
maturation in ASD available to date. At each of the approximately 150
000 points (vertices) in each hemisphere, the proportion of total
variance in CT accounted for by 2 linear regression models was
compared: One that did not include an age-by-group interaction term
[CT = intercept + (group 3 b1) + (age 3 b2)] and one that did [CT =intercept + (group 3 b1) + (age 3 b2) + (group 3 age 3 b3)]. This
resulted in an F ratio map for each hemisphere showing the degree to
which the inclusion of an age-by-group term increased the proportion
of CT variance that was accounted for.
The F ratio map was then thresholded using the false discovery rate
(FDR) method to correct for multiple comparison (Genovese et al.
2002)—with q (the proportion of rejected null hypotheses that would
be false rejections per family of tests) set at 0.05. We then examined
which of the regions also survived the more stringent FDR with q = 0.01.
A linear term for age was used for both ‘‘regional’’ and vertex-based
analyses. Higher order age terms (i.e., cubic and quadratic) were not
included because preliminary analyses indicated that in our cross-
sectional data set, the addition of these terms did not consistently
improve prediction of CV, CT, and SA. It is clear that large longitudinal
structural imaging data sets are required to properly model the linear,
quadratic, and cubic patterns of age-related change that occur in
different regions of the cortex (Shaw et al. 2008).
Results
Subject Characteristics
Subjects with ASD and controls did not differ in mean age.
There was, however, a significant group difference in FSIQ
(healthy controls had a significantly higher mean FSIQ than the
ASD group: P < 0.005). Please see Table 1 for full details.
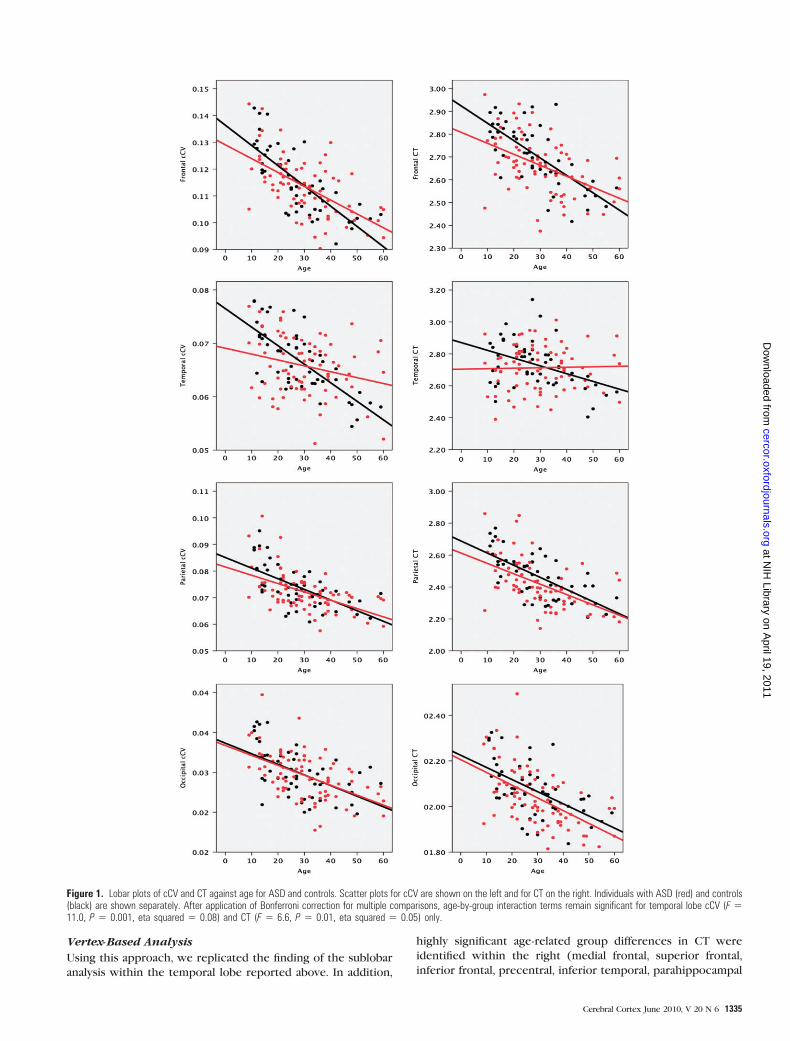
Lobar and Sublobar Analyses of cCV, CT, and SA
MANOVA revealed a significant age-by-group-by-lobe interac-
tions for cCV (F = 3.4, P = 0.03, partial eta squared = 0.03) and
a significant age-by-group interaction for CT (F = 3.4, P = 0.03,
partial eta squared = 0.03) but not SA (P = 0.8) (see Table 2). We
therefore carried out post hoc lobar analysis of covariance
(ANCOVAs) for cCV and CT only (see Fig. 1). Significant age-by-
group effects were identified for temporal lobe cCV (F = 11.0,
P = 0.001, eta squared = 0.08) and CT (F = 6.6, P = 0.01, eta
squared = 0.05). We next examined within which temporal
lobe subregion this effect was most pronounced. ANCOVAs for
bilateral cCV and CT in each of the 9 temporal lobe subregions
revealed (after correction for multiple comparisons) significant
age-by-group effects for middle temporal cCV (F = 12.6, P =0.001, eta squared = 0.09) and CT (F = 16.3, P = 0.0005, eta
squared = 0.12) and for CT of fusiform gyrus (F = 8.3, P = 0.005,
eta squared = 0.06). Also, there was a trend toward significance
for fusiform cCV (F = 6.4, P = 0.01, eta squared = 0.05). Scatter
plots of cCV and CT against age for these temporal lobe
subregions revealed an identical pattern to that seen for total
temporal cCV and mean temporal CT. Controls showed age-
related reductions in cCV and CT, whereas in ASD, cCV and CT
were not significantly correlated with age. In younger
participants, cCV and CT were less in ASD than in controls,
but in older participants, this relationship was reversed. This
pattern of CV and CT decreases in ASD followed by increases
reflects the relative lack of age-related CT and cCV reduction in
people with ASD compared with controls.
The same pattern of age-by-group interactions for cCV and CT
being most marked within the temporal lobes held when we
limited our analysis to controls and the 43 people with ASD in
whom ADI-R or ADOS confirmation of diagnosis was available.
Plots of CT and CV for each lobe against age within this
subsample are available as supplementary material (Supplemen-
tary Figure 1). Furthermore, as in our larger sample, the temporal
lobe subregional measures showing most marked age-by-group
interactions were middle temporal cCV (F = 18.6, P = 0.0005)
and CT (F = 18.5, P = 0.0005) and fusiform cCV (F = 9.4, P =0.003) and CT (F = 6.9, P = 0.01). Our findings also held
when FSIQ was entered as a covariate. Age-related differences in
lobar cCV and CT between people with ASD and controls in
our data set do not reflect group differences in the variance of
these measures as assessed by Levene’s test for equality of
variances.
Table 1Subject characteristics
Characteristic Group
Cases (n 5 76) Controls (n 5 51)
Male 76 51Age
Mean 31.7 28.6Range 10--60 11--59Standard deviation 12.1 12.6
FSIQMeana 105 122Range 73--145 83--155Standard deviation 16.5 16.8
ASD diagnosisAsperger syndrome 62 —Autism 10 —PDD other 4 —
ADI/ADOS available 43 —
aSignificant difference P\ 0.005.
Table 2Multiple analysis of variance for cCV, CT, and SA
Term Measure
cCV CT SA
F P F P F P
Lobe 1733.3 0.0005 208.3 0.0005 1128.0 0.0005Age 97.0 0.0005 63.4 0.0005 4.8 0.03Group 4.7 0.03 5.2 0.03 0.3 0.5Age 3 lobe 49.3 0.0005 10.6 0.0005 3.9 0.03Group 3 lobe 3.0 0.04 2.4 0.09 0.4 0.6Group 3 age 4.4 0.04 2.8 0.1 0.3 0.6Group 3 age 3 lobe 3.4 0.03 3.4 0.03 0.2 0.8
Note: Significant test statistics are shown in bold. Note that SA across lobes does not vary as
a function of group. Group differences exist for lobar cCV and CT, but these vary as a function of
age and lobe.
1334 Cortical Maturation in ASD d Raznahan et al.
at NIH
Library on April 19, 2011
cercor.oxfordjournals.orgD
ownloaded from
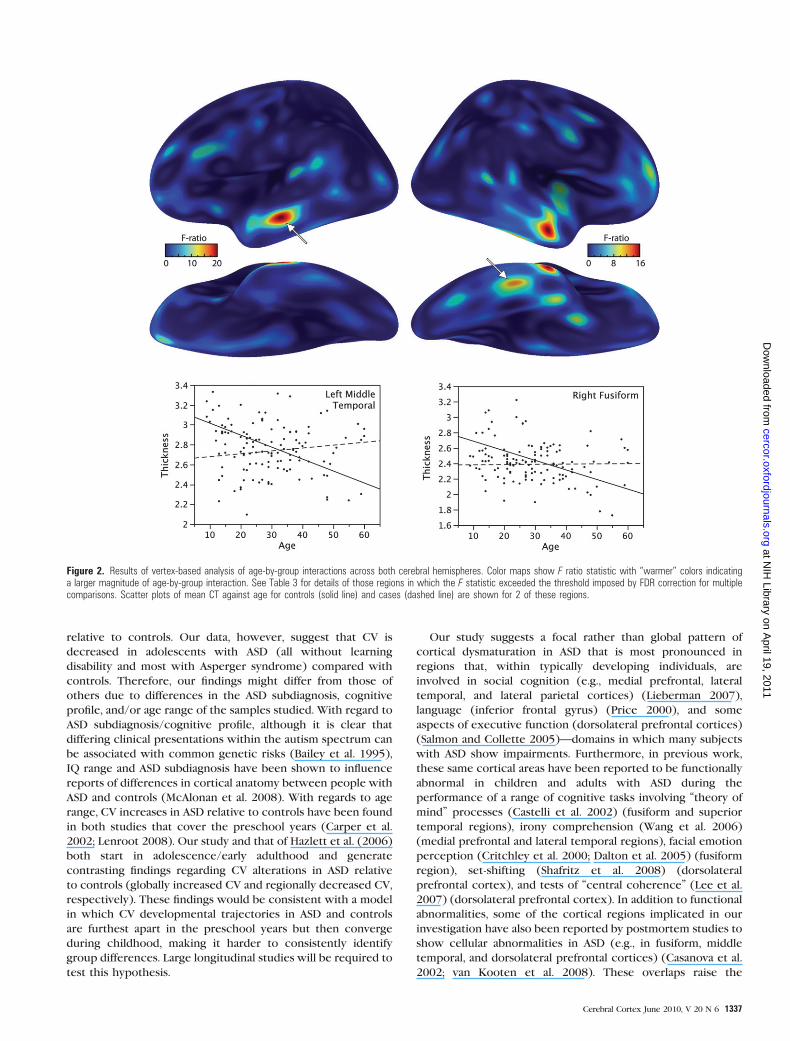
Vertex-Based Analysis
Using this approach, we replicated the finding of the sublobar
analysis within the temporal lobe reported above. In addition,
highly significant age-related group differences in CT were
identified within the right (medial frontal, superior frontal,
inferior frontal, precentral, inferior temporal, parahippocampal
Figure 1. Lobar plots of cCV and CT against age for ASD and controls. Scatter plots for cCV are shown on the left and for CT on the right. Individuals with ASD (red) and controls(black) are shown separately. After application of Bonferroni correction for multiple comparisons, age-by-group interaction terms remain significant for temporal lobe cCV (F 511.0, P 5 0.001, eta squared 5 0.08) and CT (F 5 6.6, P 5 0.01, eta squared 5 0.05) only.
Cerebral Cortex June 2010, V 20 N 6 1335
at NIH
Library on April 19, 2011
cercor.oxfordjournals.orgD
ownloaded from
gyri, fusiform and inferior parietal lobule) and the left (medial
frontal, middle frontal, and superior temporal gyri) cortical
sheet. In all these regions, CT reduced as a function of age
among controls, but there was little or no relationship between
age and CT within the ASD group (see Table 3 and Figure 2).
Also, similar to the results from the ‘‘lobar analysis’’ above, in
younger participants, CT was less in ASD than in controls but in
older participants the relationship was reversed. These results
were much the same when we only included controls and
people with ASD in whom ADI-R or ADOS confirmation of
diagnosis was available (see Supplementary Figure 3 and
Supplementary Table 2). There remained regions of prominent
age-by-group interaction for CT within lateral temporal,
fusiform, and prefrontal cortices, and additionally peaks of
significant age-by-group interaction were identified within
right precuneus and superior temporal cortices. Also, age-by-
group interactions for mean CT within the identified cortical
regions remained highly significant with a model that included
FSIQ as a covariate.
Discussion
We compared maturation of the cerebral cortex and its
2 determinants (CT and SA) between people with ASD and
healthy controls aged from 10 to 60 years. We used 2 analytic
approaches—one which examined lobar and sublobar measures
of CV, CT, and SA derived from automated parcellation of the
cortical sheet and another which examined CT at several
thousand points across the cortical sheet in a spatially nonbiased
manner.
Both analytic techniques revealed that people with ASD have
significant age-related differences in cortical anatomy as
compared with controls. Our ‘‘regional analysis’’ identified
significant differences bilaterally in temporal lobe total cCV and
mean CT. Also within temporal lobe, those subregional
measures that differentiated ASD most from controls were
middle temporal cCV and CT and fusiform cCV. This finding
was replicated by the second spatially nonbiased analysis.
However, this latter approach also revealed significant age-by-
group interactions for CT in a number of other temporal,
frontal, and parietal cortical areas. All these regions demon-
strated the same phenomena: 1) in young people, cCV and CT
were increased in controls relative to ASD but 2) in controls
cCV and CT reduced significantly with increasing age, whereas
it did not in ASD, so that 3) by middle age/late adulthood cCV
and CT were greater in ASD compared with controls. In
contrast, SA showed minimal age-related differences within
either group, and this relationship did not differ across lobes or
between people with ASD and controls.
Hence, our results suggest that cortical dysmaturation in
ASD is not restricted to childhood but extends across the life
span. It is likely therefore that age is a very important variable
that may confound studies of brain anatomy (and particularly
those investigating subtle differences in cortical architecture)
in ASD. For example, our findings suggest that, a priori, studies
of CT that include only school-aged children will have very
different findings than those that include only adults (and vice
versa). To date, 3 published studies have compared CT in ASD
and controls—but without directly modeling the effects of age
(Chung et al. 2005; Hadjikhani et al. 2006; Hardan et al. 2006).
Two of these were carried out in youth, and the findings of one
are in keeping with what would be predicted from our study
(Chung et al. 2005), but the findings of the other (Hardan et al.
2006) are not. The third of these studies examined a relatively
small number of adults (14 cases and 14 controls) falling within
a wide age range (21--45 years) (Hadjikhani et al. 2006) and
identified regional CT reductions in ASD compared with
typically developing controls. Our data suggest that in the
absence of longitudinally characterized samples extending
across the life span, cross-sectional studies of CT in ASD will
not only need to be much larger than most of those carried out
to date but should also take into account the modulatory effect
of age.
In our sample, CT dysmaturation in ASD appeared to drive
age-related differences in CV between individuals with ASD and
typically developing individuals. Although the statistical signif-
icance of group (i.e., ASD vs. controls) differences in CV within
discreet age subgroups was not assessed, our data suggest that
in late childhood, CV within frontal and temporal lobes is
reduced in individuals with ASD compared with controls. This
is in apparent conflict with existing reports of brain volumetric
increases in ASD relative to controls in pediatric samples (Piven
et al. 1995; Courchesne et al. 2001; Sparks et al. 2002; Waiter
et al. 2004; Palmen et al. 2005; Hazlett et al. 2006; Lenroot
2008). However, many of these reports relate to whole-brain
volume (Piven et al. 1995; Sparks et al. 2002) or total gray
matter volume (CV and subcortical gray combined) (Waiter
et al. 2004; Palmen et al. 2005). It is possible for CV within
a given lobe to be reduced in individuals with ASD relative to
controls, whereas TBV or total gray matter volume shows no
significant group differences or significant increases in ASD.
There are 3 available studies of lobar CV in ASD (Carper et al.
2002; Hazlett et al. 2006; Lenroot 2008). These report CV
increases in preschool-aged children (Carper et al. 2002;
Lenroot 2008) and adolescents/young adults (Hazlett et al.
2006) with autism (including comorbid learning disabilities)
Table 3Cortical regions where age-by-group effects on vertex-based analyses exceeded correction for
multiple comparisons
Region Brodmannarea
Talairach coordinate
x y z
Left hemisphereMedial frontal gyrus 10 �9 49 �6Middle frontal gyrus 9 �34 21 26Superior temporal gyrus 41 �41 �39 6
22 �55 �51 13Middle temporal gyrus 21 �56 �23 213
21 �47 �1 �15Right hemisphere
Medial frontal gyrus 6 10 �11 62Superior frontal gyrus 8 6 29 50Precentral gyrus 6 45 �2 31Middle frontal gyrus 46 23 44 15
6 35 11 47Inferior frontal gyrus 46 39 34 5Middle temporal gyrus 21 53 �5 �22
21 56 �30 �1021 46 �49 422 58 �32 3
Inferior temporal gyrus 37 32 �68 �16Uncus 36 27 �4 �34Parahippocampal gyrus 34 19 0 �10Fusiform gyrus 20 43 �30 �23Inferior parietal lobule 40 45 �29 31
Note: All regions survived an FDR correction with q set at 0.05. Those regions in bold italics
survived correction with q 5 0.01.
1336 Cortical Maturation in ASD d Raznahan et al.
at NIH
Library on April 19, 2011
cercor.oxfordjournals.orgD
ownloaded from
relative to controls. Our data, however, suggest that CV is
decreased in adolescents with ASD (all without learning
disability and most with Asperger syndrome) compared with
controls. Therefore, our findings might differ from those of
others due to differences in the ASD subdiagnosis, cognitive
profile, and/or age range of the samples studied. With regard to
ASD subdiagnosis/cognitive profile, although it is clear that
differing clinical presentations within the autism spectrum can
be associated with common genetic risks (Bailey et al. 1995),
IQ range and ASD subdiagnosis have been shown to influence
reports of differences in cortical anatomy between people with
ASD and controls (McAlonan et al. 2008). With regards to age
range, CV increases in ASD relative to controls have been found
in both studies that cover the preschool years (Carper et al.
2002; Lenroot 2008). Our study and that of Hazlett et al. (2006)
both start in adolescence/early adulthood and generate
contrasting findings regarding CV alterations in ASD relative
to controls (globally increased CV and regionally decreased CV,
respectively). These findings would be consistent with a model
in which CV developmental trajectories in ASD and controls
are furthest apart in the preschool years but then converge
during childhood, making it harder to consistently identify
group differences. Large longitudinal studies will be required to
test this hypothesis.
Our study suggests a focal rather than global pattern of
cortical dysmaturation in ASD that is most pronounced in
regions that, within typically developing individuals, are
involved in social cognition (e.g., medial prefrontal, lateral
temporal, and lateral parietal cortices) (Lieberman 2007),
language (inferior frontal gyrus) (Price 2000), and some
aspects of executive function (dorsolateral prefrontal cortices)
(Salmon and Collette 2005)—domains in which many subjects
with ASD show impairments. Furthermore, in previous work,
these same cortical areas have been reported to be functionally
abnormal in children and adults with ASD during the
performance of a range of cognitive tasks involving ‘‘theory of
mind’’ processes (Castelli et al. 2002) (fusiform and superior
temporal regions), irony comprehension (Wang et al. 2006)
(medial prefrontal and lateral temporal regions), facial emotion
perception (Critchley et al. 2000; Dalton et al. 2005) (fusiform
region), set-shifting (Shafritz et al. 2008) (dorsolateral
prefrontal cortex), and tests of ‘‘central coherence’’ (Lee et al.
2007) (dorsolateral prefrontal cortex). In addition to functional
abnormalities, some of the cortical regions implicated in our
investigation have also been reported by postmortem studies to
show cellular abnormalities in ASD (e.g., in fusiform, middle
temporal, and dorsolateral prefrontal cortices) (Casanova et al.
2002; van Kooten et al. 2008). These overlaps raise the
Figure 2. Results of vertex-based analysis of age-by-group interactions across both cerebral hemispheres. Color maps show F ratio statistic with ‘‘warmer’’ colors indicatinga larger magnitude of age-by-group interaction. See Table 3 for details of those regions in which the F statistic exceeded the threshold imposed by FDR correction for multiplecomparisons. Scatter plots of mean CT against age for controls (solid line) and cases (dashed line) are shown for 2 of these regions.
Cerebral Cortex June 2010, V 20 N 6 1337
at NIH
Library on April 19, 2011
cercor.oxfordjournals.orgD
ownloaded from
possibility that atypical cortical maturation in ASD may partially
explain differences in cortical function (and/or vice versa).
Our combined analysis of CV, CT, and SA indicates that CV
dysmaturation in ASD is probably driven by differences in CT
rather than SA. Although relatively little is known of the factors
that shape age-related changes in CT during typical develop-
ment, interindividual differences in maturation of CT have been
related to IQ (Shaw et al. 2006), rate of improvement in
phonological processing (Lu et al. 2007), and single nucleotide
genetic polymorphisms (Shaw et al. 2007). Twin studies
suggest that at a group level, the relative role played by genetic
and environmental factors in CT variance differs both by
cortical region and age (Lenroot et al. 2009). The processes
influencing cortical maturation in ASD may be very distinct
from those that shape the typically developing cortex.
Therefore, we can only speculate as to what might underlie
atypical cortical maturation in ASD. One potential explanation
is that structural dysmaturation represents the direct influence
of genetic and environmental risk factors for ASD on cortical
plasticity. For example, genetically mediated abnormalities of
synaptic function in ASD (Garber 2007) could modulate
dendritic development and hence CT. Alternatively, dysmatu-
ration within a region could reflect the ‘‘secondary’’ impact that
growing up with ASD has on the developing brain. For example,
age-related reductions in CT may represent differences in
‘‘activity/experience-dependent’’ processes such as synaptic
pruning. Dysmaturation could therefore reflect ‘‘underuse’’ of
a cortical region that initially has normal developmental
potential. Candidate mechanisms for regional abnormalities of
cortical engagement in ASD include atypical patterns of eye
gaze to faces (Dalton et al. 2005). These 2 proposed accounts
for cortical dysmaturation in ASD raise distinct and testable
hypotheses.
Our study has several limitations. First, our study was cross-
sectional in design and thus susceptible to cohort effects in
which apparently age-related phenomena are an artifact of age
being nonrandomly distributed with respect to another variable
(e.g., IQ) that is associated with the outcome of interest (e.g.,
brain size). Of such potential confounders that were measured
in our study, age was not associated with FSIQ in our sample
nor were people with different ASD subdiagnoses differentially
distributed across the age range. Nevertheless, longitudinal
studies are central in the study of brain development—as
indicated by the dramatic interindividual variation and non-
linear growth trajectories identified by the few available large
longitudinal projects examining typical and atypical brain
maturation in humans (Giedd et al. 1999). Our pragmatic
design did, however, allow us to examine a very wide age range
(10--60 years) that would not be practically possible using
longitudinal approaches and represents the largest age range
studied to date in ASD using structural MRI. A second limitation
of our study is that confirmation of ASD diagnosis in our clinic-
based sample using ADI-R/ADOS was only possible in 57% of
cases. The validity of the ASD diagnoses made in the remaining
43% of cases is supported by the fact that multiple sources
of information were considered by a multidisciplinary team of
clinicians trained in ADI/ADOS before reaching a consensus
diagnosis. Moreover, our results did not change when we
excluded people without ADI/ADOS confirmation of clinical
ASD diagnosis. Finally, mean FSIQ in cases was significantly
lower than in controls. This reflects the fact that FSIQ
distribution within our controls was right-shifted relative to
the samples upon which IQ tests were standardized. This
phenomenon is also seen in some of the largest longitudinal
MRI data sets used to compare typically and atypically
developing populations (Shaw et al. 2006). Its potential impact
on our findings is lessened by the fact that current mean
population FSIQs are probably above 100 (Flynn 2000). Also,
the reduction in FSIQ typically seen in ASD complicates the
issue of group matching for FSIQ in ASD research (Szatmari
et al. 2004). Further, the possibility that our results were driven
by IQ differences between cases and controls rather than ASD
status per se is limited by the fact that 1) our findings remained
unaltered when we controlled for FSIQ and 2) the only
available longitudinal study relating FSIQ to cortical anatomy in
healthy controls (Shaw et al. 2006) found that maturational
differences in the cortices of groups defined by IQ were largely
restricted to frontal regions, whereas the age-related differ-
ences reported in our study are most marked in temporal
regions. Finally, as noted above, there was no significant group
difference in the relationship between age and IQ. Neverthe-
less, some cross-sectional studies (Narr et al. 2006) in healthy
controls have found an association between IQ and cortical
anatomy in regions that overlap with those identified in our
study, and as such, it is still conceivable that group differences
in IQ are a potential confound in our study. For the reasons
outlined above, however, we do not think that they can fully
explain the age-related differences in cortical anatomy that we
identified between individuals with ASD and controls.
In summary, we found that people with ASD have focal
rather than global age-related differences in cortical anatomy
from controls that extend into adulthood. Also, these are
mainly associated with variation in CT and not SA. This suggests
that, within people with ASD, differences in specific neurobi-
ological processes are not ‘‘fixed,’’ rather they may continue to
change across the life span.
Funding
UK Medical Research Council Clinical Research Training
Fellowship (A.R. to G0701370).
Supplementary Material
Supplementary material can be found at http://www.cercor.
oxfordjournals.org/
Notes
The authors wish to thank the MRC UK AIMS network for in-
frastructure support and the participants and their families for making
this study possible. Conflict of Interest : None declared.
Address correspondence to Dr Armin Raznahan. Email: armin.razna-
References
Armstrong E, Schleicher A, Omran H, Curtis M, Zilles K. 1995. The
ontogeny of human gyrification. Cereb Cortex. 5:56--63.
Bailey A, Le Couteur A, Gottesman I, Bolton P. 1995. Autism as
a strongly genetic disorder: evidence from a British twin study.
Psychol Med. 25:63--77.
Baird G, Simonoff E, Pickles A, Chandler S, Loucas T, Meldrum D,
Charman T. 2006. Prevalence of disorders of the autism spectrum in
a population cohort of children in South Thames: the Special Needs
and Autism Project (SNAP). Lancet. 368:210--215.
1338 Cortical Maturation in ASD d Raznahan et al.
at NIH
Library on April 19, 2011
cercor.oxfordjournals.orgD
ownloaded from
Carper RA, Moses P, Tigue ZD, Courchesne E. 2002. Cerebral lobes in
autism: early hyperplasia and abnormal age effects. Neuroimage.
16:1038--1051.
Casanova MF, Buxhoeveden DP, Switala AE, Roy E. 2002. Minicolumnar
pathology in autism. Neurology. 58:428--432.
Castelli F, Frith C, Happe F, Frith U. 2002. Autism, Asperger syndrome
and brain mechanisms for the attribution of mental states to
animated shapes. Brain. 125:1839--1849.
Chenn A, Walsh CA. 2002. Regulation of cerebral cortical size by
control of cell cycle exit in neural precursors. Science.
297:365--369.
Chung MK, Robbins SM, Dalton KM, Davidson RJ, Alexander AL,
Evans AC. 2005. Cortical thickness analysis in autism with heat
kernel smoothing. Neuroimage. 25:1256--1265.
Courchesne E, Karns CM, Davis HR, Ziccardi R, Carper RA, Tigue ZD,
Chisum HJ, Moses P, Pierce K, Lord C, et al. 2001. Unusual brain
growth patterns in early life in patients with autistic disorder: an
MRI study. Neurology. 57:245--254.
Critchley HD, Daly EM, Bullmore ET, Williams SCR, van Amelsvoort T,
Robertson DM, Rowe A, Phillips M, McAlonan G, Howlin P, et al.
2000. The functional neuroanatomy of social behaviour: changes in
cerebral blood flow when people with autistic disorder process
facial expressions. Brain. 123:2203--2212.
Dale AM, Fischl B, Sereno MI. 1999. Cortical surface-based analysis. I.
Segmentation and surface reconstruction. Neuroimage. 9:
179--194.
Dalton KM, Nacewicz BM, Johnstone T, Schaefer HS, Gernsbacher MA,
Goldsmith HH, Alexander AL, Davidson RJ. 2005. Gaze fixation and
the neural circuitry of face processing in autism. Nat Neurosci.
8:519--526.
Dawson G, Munson J, Webb SJ, Nalty T, Abbott R, Toth K. 2007. Rate of
head growth decelerates and symptoms worsen in the second year
of life in autism. Biol Psychiatry. 61:458--464.
Desikan RS, Segonne F, Fischl B, Quinn BT, Dickerson BC, Blacker D,
Buckner RL, Dale AM, Maguire RP, Hyman BT, et al. 2006. An
automated labeling system for subdividing the human cerebral
cortex on MRI scans into gyral based regions of interest. Neuro-
image. 31:968--980.
Fischl B, Dale AM. 2000. Measuring the thickness of the human cerebral
cortex from magnetic resonance images. Proc Natl Acad Sci USA.
97:11050--11055.
Fischl B, Van Der KA, Destrieux C, Halgren E, Segonne F, Salat DH,
Busa E, Seidman LJ, Goldstein J, Kennedy D, et al. 2004.
Automatically parcellating the human cerebral cortex. Cereb
Cortex. 14:11--22.
Flynn JR. 2000. IQ gains, WISC subtests and fluid g: g theory and the
relevance of Spearman’s hypothesis to race. Novartis Found Symp.
233:202--216.
Garber K. 2007. Neuroscience. Autism’s cause may reside in abnormal-
ities at the synapse. Science. 317:190--191.
Genovese CR, Lazar NA, Nichols T. 2002. Thresholding of statistical
maps in functional neuroimaging using the false discovery rate.
Neuroimage. 15:870--878.
Giedd JN, Blumenthal J, Jeffries NO, Castellanos FX, Liu H, Zijdenbos A,
Paus T, Evans AC, Rapoport JL. 1999. Brain development during
childhood and adolescence: a longitudinal MRI study. Nat Neurosci.
2:861--863.
Hadjikhani N, Joseph RM, Snyder J, Tager-Flusberg H. 2006. Anatomical
differences in the mirror neuron system and social cognition
network in autism. Cereb Cortex. 16:1276--1282.
Hallahan B, Daly EM, McAlonan G, Loth E, Toal F, O’Brien F,
Robertson D, Hales S, Murphy C, Murphy KC, et al. 2008. Brain
morphometry volume in autistic spectrum disorder: a magnetic
resonance imaging study of adults. Psychol Med. 39:337--346.
Hardan AY, Muddasani S, Vemulapalli M, Keshavan MS, Minshew NJ.
2006. An MRI study of increased cortical thickness in autism. Am J
Psychiatry. 163:1290--1292.
Hazlett HC, Poe M, Gerig G, Smith RG, Provenzale J, Ross A, Gilmore J,
Piven J. 2005. Magnetic resonance imaging and head circumference
study of brain size in autism: birth through age 2 years. Arch Gen
Psychiatry. 62:1366--1376.
Hazlett HC, Poe MD, Gerig G, Smith RG, Piven J. 2006. Cortical gray and
white brain tissue volume in adolescents and adults with autism.
Biol Psychiatry. 59:1--5.
Huttenlocher PR. 1990. Morphometric study of human cerebral cortex
development. Neuropsychologia. 28:517--527.
Le Couteur A, Rutter M, Lord C, Rios P. 1989. Autism diagnostic
interview: a standardized investigator-based instrument. J Autism
Dev Disord. 19:363--387.
Lee PS, Foss-Feig J, Henderson JG, Kenworthy LE, Gilotty L,
Gaillard WD, Vaidya CJ. 2007. Atypical neural substrates of
embedded figures task performance in children with autism
spectrum disorder. Neuroimage. 38:184--193.
Lenroot R. 2008. Increased cortical thickness and gray matter volume in
young children with autism. In: International Meeting for Autism
Research; 2008, May 15, London.
Lenroot RK, Schmitt JE, Ordaz SJ, Wallace GL, Neale MC, Lerch JP,
Kendler KS, Evans AC, Giedd JN. 2009. Differences in genetic and
environmental influences on the human cerebral cortex associated
with development during childhood and adolescence. Hum Brain
Mapp. 30:163--174.
Lieberman MD. 2007. Social cognitive neuroscience: a review of core
processes. Annu Rev Psychol. 58:259--289.
Lord C, Risi S, Lambrecht L, Cook EH, Jr, Leventhal BL, DiLavore PC,
Pickles A, Rutter M. 2000. The autism diagnostic observation
schedule-generic: a standard measure of social and communication
deficits associated with the spectrum of autism. J Autism Dev
Disord. 30:205--223.
Lu L, Leonard C, Thompson P, Kan E, Jolley J, Welcome S, Toga A,
Sowell E. 2007. Normal developmental changes in inferior frontal
gray matter are associated with improvement in phonological
processing: a longitudinal MRI analysis. Cereb Cortex. 17:1092--1099.
MacDonald D, Kabani N, Avis D, Evans AC. 2000. Automated 3-D
extraction of inner and outer surfaces of cerebral cortex from MRI.
Neuroimage. 12:340--356.
McAlonan GM, Daly E, Kumari V, Critchley HD, van AT, Suckling J,
Simmons A, Sigmundsson T, Greenwood K, Russell A, et al. 2002.
Brain anatomy and sensorimotor gating in Asperger’s syndrome.
Brain. 125:1594--1606.
McAlonan GM, Suckling J, Wong N, Cheung V, Lienenkaemper N,
Cheung C, Chua SE. 2008. Distinct patterns of grey matter
abnormality in high-functioning autism and Asperger’s syndrome. J
Child Psychol Psychiatry. 49:1287--1295.
Narr KL, Woods RP, Thompson PM, Szeszko PR, Robinson D,
Dimtcheva T, Gurbani M, Toga AW, Bilder RM. 2006. Relationships
between IQ and regional cortical gray matter thickness in healthy
adults. Cereb Cortex. 17:263--271.
Palmen SJ, Hulshoff Pol HE, Kemner C, Schnack HG, Durston S,
Lahuis BE, Kahn RS, van EH. 2005. Increased gray-matter volume in
medication-naive high-functioning children with autism spectrum
disorder. Psychol Med. 35:561--570.
Panizzoni CF-N, Eyer L, Jerningan T, Prom-Wormley E, Neale M,
Jacobsen K, Lyons MJ, Grant MD, Franz CE, Xian H, et al. 2007.
Distinct genetic influence on cortical surface area and cortical
thickness. Cereb Cortex. Advance Access published March 18,
doi:10.1093/cercor/bhp026.
Piven J, Arndt S, Bailey J, Havercamp S, Andreasen NC, Palmer P. 1995.
An MRI study of brain size in autism. Am J Psychiatry.
152:1145--1149.
Price CJ. 2000. The anatomy of language: contributions from functional
neuroimaging. J Anat. 197:335--359.
Rakic P. 1995. A small step for the cell, a giant leap for mankind:
a hypothesis of neocortical expansion during evolution. Trends
Neurosci. 18:383--388.
Redcay E, Courchesne E. 2005. When is the brain enlarged in autism?
A meta-analysis of all brain size reports. Biol Psychiatry. 58:
1--9.
Salmon E, Collette F. 2005. Functional imaging of executive functions.
Acta Neurol Belg. 105:187--196.
Shafritz KM, Dichter GS, Baranek GT, Belger A. 2008. The neural
circuitry mediating shifts in behavioral response and cognitive set in
autism. Biol Psychiatry. 63:974--980.
Cerebral Cortex June 2010, V 20 N 6 1339
at NIH
Library on April 19, 2011
cercor.oxfordjournals.orgD
ownloaded from
Shaw P, Gornick M, Lerch J, Addington A, Seal J, Greenstein D, Sharp W,
Evans A, Giedd JN, Castellanos FX, et al. 2007. Polymorphisms of the
dopamine d4 receptor, clinical outcome, and cortical structure in
attention-deficit/hyperactivity disorder. Arch Gen Psychiatry.
64:921--931.
Shaw P, Greenstein D, Lerch J, Clasen L, Lenroot R, Gogtay N, Evans A,
Rapoport J, Giedd J. 2006. Intellectual ability and cortical de-
velopment in children and adolescents. Nature. 440:676--679.
Shaw P, Kabani NJ, Lerch JP, Eckstrand K, Lenroot R, Gogtay N,
Greenstein D, Clasen L, Evans A, Rapoport JL, et al. 2008.
Neurodevelopmental trajectories of the human cerebral cortex. J
Neurosci. 28:3586--3594.
Sowell ER, Peterson BS, Kan E, Woods RP, Yoshii J, Bansal R, Xu D,
Zhu H, Thompson PM, Toga AW. 2007. Sex differences in cortical
thickness mapped in 176 healthy individuals between 7 and 87
years of age. Cereb Cortex. 17:1550--1560.
Sowell ER, Thompson PM, Leonard CM, Welcome SE, Kan E, Toga AW.
2004. Longitudinal mapping of cortical thickness and brain growth
in normal children. J Neurosci. 24:8223--8231.
Sparks BF, Friedman SD, Shaw DW, Aylward EH, Echelard D, Artru AA,
Maravilla KR, Giedd JN, Munson J, Dawson G, et al. 2002. Brain
structural abnormalities in young children with autism spectrum
disorder. Neurology. 59:184--192.
Szatmari P, Zwaigenbaum L, Bryson S. 2004. Conducting genetic
epidemiology studies of autism spectrum disorders: issues in
matching. J Autism Dev Disord. 34:49--57.
van Kooten I, Palmen SJ, von CP, Steinbusch HW, Korr H, Heinsen H,
Hof PR, van EH, Schmitz C. 2008. Neurons in the fusiform gyrus are
fewer and smaller in autism. Brain. 131:987--999.
Waiter GD, Williams JH, Murray AD, Gilchrist A, Perrett DI, Whiten A. 2004.
A voxel-based investigation of brain structure in male adolescents with
autistic spectrum disorder. Neuroimage. 22:619--625.
Wang AT, Lee SS, Sigman M, Dapretto M. 2006. Neural basis of irony
comprehension in children with autism: the role of prosody and
context. Brain. 129:932--943.
Webb SJ, Nalty T, Munson J, Brock C, Abbott R, Dawson G. 2007. Rate of
head circumference growth as a function of autism diagnosis and
history of autistic regression. J Child Neurol. 22:1182--1190.
WHO 1993. Mental disorders: a glossary and guide to their classification
in accordance with the 10th revision of the international
classification of diseases-research diagnostic criteria (ICD-10).
Geneva (Switzerland): WHO.
1340 Cortical Maturation in ASD d Raznahan et al.
at NIH
Library on April 19, 2011
cercor.oxfordjournals.orgD
ownloaded from