Corruption in Ukraine 2007-2009 2011 Engl
48
KYIV, 2011 CORRUPTION IN UKRAINE COMPARATIVE ANALYSIS OF NATIONAL SURVEYS: 2007– 2009, 2011 All MS World ENG.indd 1 09.08.2011 23:29:28
-
Upload
independent -
Category
Documents
-
view
4 -
download
0
Transcript of Corruption in Ukraine 2007-2009 2011 Engl

KYIV, 2011
CORRUPTION IN UKRAINECOMPARATIVE ANALYSIS OF NATIONAL SURVEYS: 2007–
2009, 2011
All MS World ENG.indd 1 09.08.2011 23:29:28

Corruption in Ukraine. Comparative Analysis of National Surveys: 2007–2009, 2011
Kyiv – 47 p.
This report was prepared by the European Research Association in cooperation with Kyiv International Institute of Sociology in the framework of the USAID funded project «The Ukraine National Initiatives to Enhance Reforms (UNITER)» implemented by Pact Inc. Ukraine. Presented in the report are comparative results of National sociological surveys on the state of corruption in Ukraine conducted in 2007, 2008, 2009 and 2011. The survey was targeted at measuring public perception of the problem of corruption and its experience with it. This report is intended to reach a wide readership.
All MS World ENG.indd 2 09.08.2011 23:29:28

3
CONTENT CONTENT ............................................................................................................................................................3
SUMMARY ..........................................................................................................................................................5
KEY FINDINGS ....................................................................................................................................................5
I. INTRODUCTION ............................................................................................................................................10
Survey methodology .....................................................................................................................................10
General characteristics of the 2011 survey sample .......................................................................................11
Qualitative survey .........................................................................................................................................12
2. ATTITUDES TOWARD THE GOVERNMENT .................................................................................................13
Trust in government .......................................................................................................................................13
Responsibility for the fight against corruption .............................................................................................15
Will of the government to fight corruption ....................................................................................................16
3. PERCEPTIONS OF KEY PROBLEMS ..............................................................................................................17
4. PERCEPTIONS OF CORRUPTION .................................................................................................................18
Sources of information on cases of corruption .............................................................................................18
Leading causes of corruption ........................................................................................................................19
Can corruption be justified? ..........................................................................................................................20
Changes in the level of corruption since 2004 ..............................................................................................21
Spread of corruption and the effectiveness of preventative measures ........................................................23
Overall corruption perceptions index by region ............................................................................................26
5. CITIZENS’ EXPERIENCES WITH CORRUPTION ...........................................................................................27
Citizens’ transactions with government agencies and functions ..................................................................27
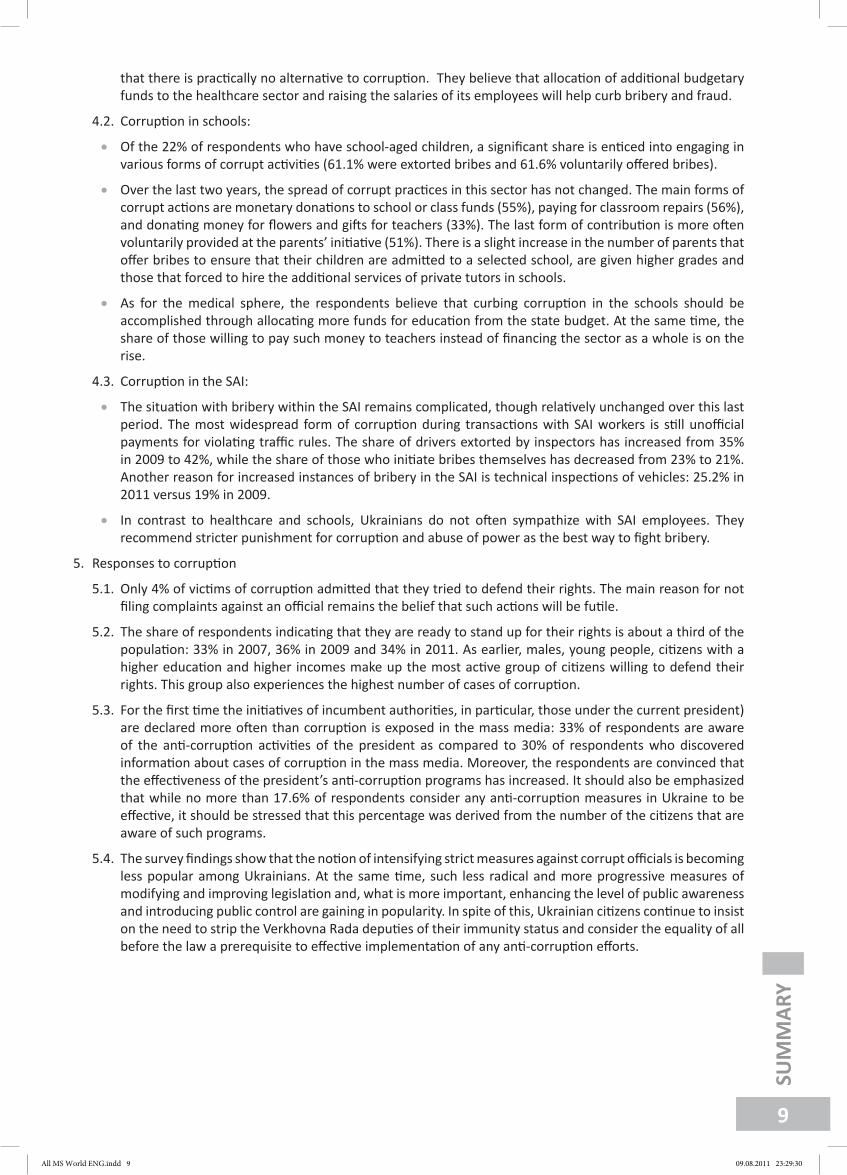
Extortion, voluntary bribes and use of personal connections (by sector) ....................................................28
Corruption by types of bribery .....................................................................................................................29
Citizen victimization by corruption ................................................................................................................32
Overall corruption experience indices by region ...........................................................................................34
Corruption within the healthcare system ......................................................................................................37
Corruption in schools ....................................................................................................................................39
Corruption within institutions of higher education .......................................................................................40
Corruption within the state auto inspection (sai) agency .............................................................................41
6. CITIZEN RESPONSES TO CORRUPTION ......................................................................................................43
Filing complaints and standing up for one’s rights ........................................................................................43
Effectiveness of anticorruption programs .....................................................................................................45
Anticorruption measures ..............................................................................................................................46
All MS World ENG.indd 3 09.08.2011 23:29:28

4
All MS World ENG.indd 4 09.08.2011 23:29:28

5
SUMMARY In March – May 2011 a large scale national survey of public opinion on corruption in Ukraine was conducted under the aegis of the UNITER project financed by the United States Agency for International Development (USAID). The survey was based on the methodology used in 2007–2009, when three surveys were conducted in Ukraine, which were specifically targeted at measuring public perception of the problem of corruption and its experience with it.
The 2007-2009 surveys were of a monitoring nature, therefore their findings enabled to trace the changes in perceptions and experience with corruption in Ukraine over an extended period of time. The baseline survey was conducted at the beginning of 2007 and created the basis for further comparison of the findings of the surveys at the beginning of 2008 and 2009, as well as the latest data obtained in early 2011. All four surveys were conducted by the Kyiv International Institute of Sociology (KIIS): in 2007-2009 under the leadership of Management Systems International (MSI) and in 2011 – in cooperation with the European Research Association and UNITER Project implemented by PACT, Inc. Ukraine.
During 2009-2010 different branches of government, the donor community, non-government organizations and other agencies drafted and partially implemented reforms and different activities aimed at the fight against corruption in Ukraine. In addition to that, many significant political and economic events that are likely to have had an impact on public perception of corruption and trends of corrupt behaviors have occurred in Ukraine during this period. In particular, there were several phases of reshuffling of staff in the government. The financial crisis precipitated a halt to economic growth and a decrease in industrial output over the period 2009 – 2010, which resulted in a decrease in business activity on the whole and a drop in people’s standards of living. The results of the 2011 survey confirmed the previous years’ findings, sustainability of the perceptions of corruption (in most cases) and reflected certain changes.
Key findingsPerceptions and experience of corruption. A comparative analysis of the survey data between 2007 and 2009 indicates a decrease in the actual corruption experiences, though an increase in the perception that corruption is widespread. In 2011, i.e. almost two years after the last survey, the situation changed slightly: citizens’ perception of the spread of corruption has remained almost at the level of two years ago, while the corruption experience has not spread, it has increased in its intensity, which is primarily due to the increase in the number of government bodies where citizens are confronted with open extortion on the part of the bureaucrats.
While the overall level of corruption remains extremely high in Ukraine, the 2009 and 2011 surveys show that the level has slightly dropped off. Indeed, in 2011 a total of 60.1% of respondents said they were involved in corrupt transactions with government officials over the past 12 months as compared to 62.5% in 2009 and 67% in 2007.
Involved in Corruption over the Past 12 Months
67,8%67,0%62,5%
60,1%
2007 2008 2009 2011
N(2007)=10528; N(2008)=1993; N(2009)=10511; N(2011)=10600
Specific forms of corruption. When looking at the specific forms of corruption that have been encountered, the results show that extortion has returned to the 2007 level (25.8% in 2011 and 25.6% in 2007), even though in 2009 it declined to 22.1%. Voluntary offering of bribes, after decreasing to 9.9% in 2009 from 13.1% in 2007, remains
All MS World ENG.indd 5 09.08.2011 23:29:29

6
SUM
MAR
Yat the same level of 10.0% in 2011. The use of personal connections has increased from 13.7% in 2009 to 15.3% in 2011. As earlier, there is a variance across government functions – in some of them, corruption transactions increased, while in the others they decreased (for more details see the report).
Corruption Indices for Ukraine: 2007-2011
13,1
25,6
35,4
9,9
22,1
13,7
38,1
10,0
25,8
15,3
39,4
Voluntary Bribes Extortion Personal Connections Perceived Spread
2007
2009
2011
Note: Indices represent mean values for corruption experience and perception across the entire sample for all sectors and institutions monitored in the survey
Victimization by corruption. Those who experience the most corruption remain the same as in previous years: young people, persons with a higher education and individuals with a higher income. At the same time, citizens from these groups usually are the most active in fighting corruption. However, only by a third of the adult population of Ukraine declared their readiness to actively fight corruption.
Basic corruption trends observed in Ukrainian society as a whole also extend to the spheres that the Ukrainian government defined in 2006 as requiring the most significant anti-corruption measures (see table below).1
Sphere
CORRUPTION INDICES
Perceptions of Widespread Corruption
Extortion Experience
Experience using Personal
Connections
Cases of Voluntary
Bribery
Business regulation and inspection 29,3% 34,0% 35,4% 40,2% 25,2% 24,9% 19,9% 14,5%
Courts 59,3% 60,3% 31,8% 30,2% 17,7% 21,2% 8,6% 10,7%
Customs 38,6% 42,1% 29,5% 36,1% 14,0% 10,0% 16,6% 10,7%
Government permits 42,2% 42,1% 40,1% 47,1% 25,9% 30,3% 14,8% 16,1%
Land privatization and ownership 47,1% 45,9% 25,3% 32,0% 18,7% 18,4% 7,1% 9,9%
Registration or privatization of real estate
35,4% 33,5% 22,6% 32,2% 17,1% 22,0% 8,8% 11,6%
State notaries 26,2% 26,8% 12,7% 11,1% 11,5% 11,1% 5,1% 6,7%
Universities 49,0% 47,1% 43,8% 49,7% 26,9% 20,5% 27,3% 25,5%
.
1 It was in these spheres that the MCC Threshold Program initiated its major activities in 2007-2009.
Note: Symbol denotes a negative trend (increase in corruption); symbol denotes a positive trend (decrease in corruption); and no symbols - no change in 2011 compared to 2009
All MS World ENG.indd 6 09.08.2011 23:29:29

7
SUM
MAR
Y
As perceived by citizens, in 2011 compared to 2009 increase in corruption was observed in the sphere of business regulations, tax inspections and customs procedures, while its level was lower in universities and real estate transactions. However, respondents believe that actual cases of corruption slightly differ. The use of personal connections and voluntary bribe-giving is negligible, while a decrease in the level of extortion in any of the aforementioned sectors was not observed. In fact, half of the respondents point to a rise in the level of extortion.
Based on the findings of the 2001 survey corruption trends are as follows:
1. Attitudes toward the government
1.1. The changes that took place in the central executive bodies and at the political Olympus as a result of the 2010 presidential elections were viewed by Ukrainians as a prospect of changes promised in the election campaign. This expectation is reflected in the increase in trust to the key bodies of power, which could be called a “credit of trust”, with the most evident increase of trust in the President (from 4.7% in 2009 to 14% in 2011). As earlier, the highest level of public trust is in local authorities at the rural level (20.1%).
1.2. No more than 17% of the population believes in the desire of government authorities to fight corruption. However, the share of respondents that would like to believe so saw a considerable increase after it had sharply dropped in 2009. 16.8% of respondents are convinced that the President is demonstrating a strong desire to overcome corruption. And though the belief in the desire of other government bodies to overcome corruption slightly increased, it still remains extremely low.
1.3. Citizens continue to depend on the President to take on a leadership role in the fight against corruption (77.6% of respondents), and this indicator is on the rise together with an increase of trust in this institution of power and the hope in the president’s desire to truly fight corruption. According to one-third of respondents, the Cabinet of Ministers, the law enforcement bodies and the Prosecutor General’s Office have approximately the same responsibility for fighting corruption. No more than 18% respondents perceive the fight against corruption as the responsibility and duty of average citizens.
1.4. Citizens’ views of these problems, a list of which was provided in the questionnaire, are undoubtedly highly important and relevant, with corruption among government authorities traditionally ranked in the top four. As found in the previous surveys, 94.9% of the respondents believe the main problem in Ukraine is low standards of living, while 93.5% responded that the high costs and low quality of healthcare are a major problem. The only problem that citizens see as having become more urgent over the past two years is the unjustified correlation in the cost and quality of public utilities precipitated by a considerable increase in tariffs for such services.
2. Changes in the perception of corruption
2.1. Electronic mass media remains the main source of information regarding corruption. 30.4% of respondents receive this information through television and radio. Print media outlets continue losing their positions, which is accompanied by the increasing number of Internet users. According to the respondents, the mass media’s level of objectivity regarding corruption has increased from 32% to 37.5%. Informal communication also remains a significant source of information on corruption (25.4%).
2.2. Ukrainian views about the main reasons for corruption are quite entrenched. As earlier, the most significant reasons are abuse of power by officials, the absence of proper government control, the absence of the political will to reduce corruption and confusing legislation.
2.3. Although the population’s customary approach to settling problems through corruption is often referred to as the main engine of corruption, over time the number of those believing that corruption is in no way justifiable, even if it is the quickest way settling important matters, slightly increased to 41.2% from 36.9% in 2009. Moreover, the number of those willing to use dishonest schemes any time and at any cost is in decline. It should be noted that the share of respondents that view corruption as unacceptable is unfailingly growing with the age of respondents/ In 2011, the share of such respondents increased in every age category.
2.4. Supporters of the Party of Regions and the political force that supports the Speaker of the Verkhovna Rada are inclined to believe the current level of corruption in Ukraine is lower than it was before the Orange Revolution, while over 60% of the supporters of the “orange” forces are convinced that compared to 2004 the level of corruption has increased.
2.5. After a notable increase in citizens’ perceptions of corruption widely observed in 2009, the level of perception
All MS World ENG.indd 7 09.08.2011 23:29:29

8
SUM
MAR
Yhas practically returned the level in 2007 in all government bodies surveyed. As earlier, Ukrainians feel that the most corrupt bodies of government are the Verkhovna Rada, while the perception of corruption inside the Presidential Administration has decreased more than that inside the Cabinet of Ministers. As regards specific institutions and sectors, Ukrainian citizens are convinced that the most corrupt officials work for the State Auto Inspection (SAI) (64%), the judicial system (60%), the medical/healthcare system (60%) and the militsiya (police -59%).
2.6. Ukrainians perceive corruption at approximately the same level as it was in 2009. The cumulative Corruption Perception Index increased from 38.1% in 2009 to 39.4% in 2011.
3. Changes in experiences of corruption
3.1. The share of respondents who had personal experience with various forms of corruption over the past year has decreased from 62.5% to 60.1% since 2009.
3.2. A statistically significant decrease in the level of extortion was not observed in any sector. On the contrary, a considerable increase in extortion practices was observed in such public services as registration or privatization of real estate (from 22.6% to 32.2%), the State Auto Inspection (from 39.7% to 45.1%), tax authorities (from 19.6% to 28.7%), the militsiya (from 46.1% to 53.1%), etc. Findings of the 2011 survey show that most frequently bribes are indirectly demanded in the following areas: state healthcare institutions (66%), secondary learning institutions (61%), the militsiya (53%) and institutions of higher education (50%), obtaining various government permits (47%), the State Auto Inspection (45%) and agencies that regulate entrepreneurial activities (40%).
3.3. The last two years show a certain decline in the frequency of voluntary bribery, but we can only assume what has caused it to a greater extent –enhanced public consciousness or the economic crisis. Most often bribes are proposed to those working in secondary learning institutions (62%), the state healthcare system (36%) and the SAI (30%). In spite of a general decrease in voluntary bribe-giving, a statistically significant improvement was observed in only one sector – public utilities (from 11.1% to 7.5%). Conversely, problems of bribery have been observed in government subsidized housing (from 16% to 29.5%), applying for a job with state institutions (from 10.4% to 15.3%), registering ownership of land (from 7.1% to 9.9%) and real estate (from 8.8% to 11.6%).
3.4. The use of personal connections as a “soft” form of corruption is somewhere between extortion and voluntary bribe-giving. The only sector in which the use of personal ties has considerably declined over the last two years is higher education, which can be indirect proof the introduction of the External Independent Testing system. On the other hand, there has been an increase in the use of personal ties when registering or privatizing real estate, dealing with the militsiya and customs officials and applying for a job with state institutions.
3.5. Extortion is 2.5 times more frequent than the voluntary offer of bribes. This ratio has increased considerably since 2009 when it was 2:1. Citizens typically experience extortion in one of every four transactions with officials, but engage in voluntary bribe-giving only 10% of the time. Ukrainians use personal ties more often than voluntary offering bribes – about 15% of the time.
3.6. Young people and citizens with a higher education and higher income experience greater extortion and they account for the majority of case of voluntarily offering bribes. Conversely, a lower level of extortion is observed only in the senior age group, which is in the low-income group of pensioners.
4. Changes in experiences of corruption in three sectors
4.1. Corruption within the healthcare system:
• Healthcare institutions are greatest in demand with almost two-thirds of the population visiting them over a period of one year.
• Over the years of monitoring, bribery within the healthcare system has gone practically unchanged: almost half of ailing citizens must provide their own medications and instruments when admitted by a doctor, while 26% feel it as their obligation even when they are not forced to do so. More than a half of patients (52%) were forced to make monetary contributions to hospital funds, while 16% of patients did so voluntarily. One third of patients were immediately asked to make unofficial payments for services rendered, while 15% of patients voluntarily offered such payments to medical personnel.
• Ukrainian citizens continue to feel sympathy for staff in the healthcare sector understanding perfectly well
All MS World ENG.indd 8 09.08.2011 23:29:30
9
SUM
MAR
Y
that there is practically no alternative to corruption. They believe that allocation of additional budgetary funds to the healthcare sector and raising the salaries of its employees will help curb bribery and fraud.
4.2. Corruption in schools:
• Of the 22% of respondents who have school-aged children, a significant share is enticed into engaging in various forms of corrupt activities (61.1% were extorted bribes and 61.6% voluntarily offered bribes).
• Over the last two years, the spread of corrupt practices in this sector has not changed. The main forms of corrupt actions are monetary donations to school or class funds (55%), paying for classroom repairs (56%), and donating money for flowers and gifts for teachers (33%). The last form of contribution is more often voluntarily provided at the parents’ initiative (51%). There is a slight increase in the number of parents that offer bribes to ensure that their children are admitted to a selected school, are given higher grades and those that forced to hire the additional services of private tutors in schools.
• As for the medical sphere, the respondents believe that curbing corruption in the schools should be accomplished through allocating more funds for education from the state budget. At the same time, the share of those willing to pay such money to teachers instead of financing the sector as a whole is on the rise.
4.3. Corruption in the SAI:
• The situation with bribery within the SAI remains complicated, though relatively unchanged over this last period. The most widespread form of corruption during transactions with SAI workers is still unofficial payments for violating traffic rules. The share of drivers extorted by inspectors has increased from 35% in 2009 to 42%, while the share of those who initiate bribes themselves has decreased from 23% to 21%. Another reason for increased instances of bribery in the SAI is technical inspections of vehicles: 25.2% in 2011 versus 19% in 2009.
• In contrast to healthcare and schools, Ukrainians do not often sympathize with SAI employees. They recommend stricter punishment for corruption and abuse of power as the best way to fight bribery.
5. Responses to corruption
5.1. Only 4% of victims of corruption admitted that they tried to defend their rights. The main reason for not filing complaints against an official remains the belief that such actions will be futile.
5.2. The share of respondents indicating that they are ready to stand up for their rights is about a third of the population: 33% in 2007, 36% in 2009 and 34% in 2011. As earlier, males, young people, citizens with a higher education and higher incomes make up the most active group of citizens willing to defend their rights. This group also experiences the highest number of cases of corruption.
5.3. For the first time the initiatives of incumbent authorities, in particular, those under the current president) are declared more often than corruption is exposed in the mass media: 33% of respondents are aware of the anti-corruption activities of the president as compared to 30% of respondents who discovered information about cases of corruption in the mass media. Moreover, the respondents are convinced that the effectiveness of the president’s anti-corruption programs has increased. It should also be emphasized that while no more than 17.6% of respondents consider any anti-corruption measures in Ukraine to be effective, it should be stressed that this percentage was derived from the number of the citizens that are aware of such programs.
5.4. The survey findings show that the notion of intensifying strict measures against corrupt officials is becoming less popular among Ukrainians. At the same time, such less radical and more progressive measures of modifying and improving legislation and, what is more important, enhancing the level of public awareness and introducing public control are gaining in popularity. In spite of this, Ukrainian citizens continue to insist on the need to strip the Verkhovna Rada deputies of their immunity status and consider the equality of all before the law a prerequisite to effective implementation of any anti-corruption efforts.
All MS World ENG.indd 9 09.08.2011 23:29:30

10
I. INTRODUCTION In 2007 – 2009, three series of public opinion surveys entitled Corruption in Ukraine were was conducted as a part of the project Promoting Active Citizen Engagement in Fighting Corruption in Ukraine (ACTION) with the aim of increasing public involvement in fighting corruption in Ukraine. To complement the corruption monitoring, another large scale public opinion survey was conducted in 2011. This report presents the comparative results of identical corruption surveys conducted in 2007 – 2009 and 2011 to monitor trends in corruption perceptions and the experience of Ukrainian citizens.
Four nationwide surveys were conducted by the Kyiv International Institute of Sociology (KIIS) and financed by the United States Agency for International Development (USAID). The baseline survey was conducted in February - March 2007 (N = 10580) . A mid-term survey was conducted in March – April 2008 (N = 2013) and February – March 2009 (N = 10577). Those three surveys were conducted under the leadership of Management Systems International (MSI). The last survey was conducted in March – April 2011 (N = 10639) under the leadership of the UNITER project implemented by PACT Inc. Ukraine and in cooperation with the European Research Association (ERA).
In most cases, the analysis in this report focuses on the comparison of the 2007, 2009 and 2011 surveys, while the large sample size of the three surveys offers a more sound analysis in separate oblasts (provinces) of Ukraine. However, the 2008 mid-term survey results are included when they offer additional insight or reveal interesting dynamics.
Survey methodology
All four surveys collected quantitative information on the following issues:
• Attitudes of the adult population in Ukraine towards the problem of corruption;
• Citizen experiences with corruption;
• Citizen assessments of the effectiveness of anti-corruption measures taken by authorities and other anti-corruption activists;
• The public’s willingness to engage in anti-corruption activities.
The sample developed for each of the four surveys is representative of the adult population of Ukraine (18 years and older) as a whole and separate regions. Data from the 2007, 2009 and 2011 surveys are also representative of each oblast of Ukraine, including the Autonomous Republic of Crimea and the city of Kyiv. The methodology developed a multistage probability sample with quota selection at the final stage. During the first stage of sampling, random settlements were selected within every oblast and the AR of Crimea proportional to their populations. The second stage used random selection of postal districts within the selected settlements. In these postal districts random streets, buildings, and apartments were selected. The final stage consisted of respondent selection within a household. The data obtained was compared to that of the 2001 All-Ukrainian Population Census. Table 1.1 presents the basics characteristics of all four surveys
Table 1.1
Basic Survey Characteristics
Baseline survey(2007)
Mid-term survey(2008)
Mid-term survey (2009)
Final survey(2011)
Field interviews21 February –
21 March26 March –
9 April19 February –
24 March18 March —
26 April
Sample size 10 580 2 013 10 577 10 639
Margin of error (for Ukraine as a whole) 1,0% 2,2% 1,0% 1,0%
2Management Systems International (2007) Corruption in Ukraine: 2007 Baseline National Survey for the MCC Threshold Country Program. Kyiv: MSI
All MS World ENG.indd 10 09.08.2011 23:29:30

11
1. I
NTR
OD
UCT
ION
Each survey was conducted using individual interviews and identical methodology instruments. A total of 50 questions were asked, including public trust in various levels of government, serious problems facing Ukraine, the spread of corruption across levels of government and key sectors and institutions, actual first-hand experience with corruption, sources of information about corruption, the effectiveness of various government responses to corruption, and personal readiness to fight corruption.
general characteriSticS of the 2011 Survey Sample
Overall, the distribution of respondents according to key demographic characteristics corresponds to the population’s make-up in official statistics. Among those surveyed, 55% were female and 45% were male. Almost 32% of respondents were of retirement age (55 years and older for females and 60 years and older for males). Respondents from all educational categories were represented. The average size of a household size was 3 individuals. Charts 1.1 present the respondents’ distribution by major demographic characteristics.
Chart 1.1
Respondents’ distribution by demographic characteristics
RESPONDENTS’ GENDER AGE GROUP OF RESPONDENTS
Male; 45%
Female; 55% 45-59;
23%
60 and more;
27%
18-29; 22%
30-44; 28%
EDUCATION LEVEL OF RESPONDENTS SIZE OF RESPONDENTS’ FAMILY
High School; 22%
Elementary or Some Secondary ; 8%
High Specialized; 28%
High School or Start-Up Professional;
14%
University Graduate;
22%
University Undergraduate;
5%
2 persons; 27%
1 person; 12%
4 persons; 20%
3 persons; 28%
5 persons and more;
13%
44.2% of all surveyed were gainfully employed, 2.5% of which said they were self-employed and 2.4% were working pensioners. In terms of the form of enterprise, 11.5% were employed by state enterprises, 32.8% were employed by other state institutions, 46.7% were employed by private businesses and 6.4% were employed by mixed enterprises. The remaining 55.7% of respondents that do not work include pensioners (30.2%), unemployed (11.1%), housewives (8.9%), students (4.0%) and the disabled (1.5%).
All MS World ENG.indd 11 09.08.2011 23:29:31

12
1. I
NTR
OD
UCT
ION
Households fall into the following categories based on their total income (Table 1.2).Table 1.2
Total household’s income
Groups by income %Less than 500 UAH 1,6%
500 – 800 UAH 5,1%800 – 1,000 UAH 9,4%
1,000 – 1,500 UAH 10,9%1,500 – 2,000 UAH 17,2%2,000 – 2,500 UAH 12,9%2,500 – 3,000 UAH 12,4%3,000 – 4,000 UAH 12,7%
More than 4,000 UAH 7,5%Don’t know 10,2%
Charts 1.2 present the distribution of respondents by regions and types of settlements in which they reside. The oblasts are distributed among the regions as follows:
Western Region – Volyn, Zakarpattia, Ivano-Frankivsk, Lviv, Rivne, Ternopil, Khmelnytsk and Chernivtsi oblasts. Central Region – The city of Kyiv, Vinnytsia, Zhytomyr, Kyiv, Kirovohrad, Poltava, Sumy, Cherkasy and Chernihiv
oblasts.Southern Region – The Autonomous Republic of Crimea, Dnipropetrovsk, Zaporizhzhia, Mykolayiv, Odesa and
Kherson oblasts. Eastern Region – Donetsk, Luhansk and Kharkiv oblasts.
Chart 1.2
Respondents’ distribution by regions and settlement’s type
REGIONS TYPE OF SETTLMENT
Southern; 27%
Eastern; 22%
Western; 22%
Central;30%
Rural; 32%
Urban; 68%
Qualitative Survey The 2011 qualitative survey was conducted in 5 cities – centers of regions of Ukraine: Kyiv, Lviv, Donetsk, Simferopil and Chernihiv. The selected methodology was focus-group discussions (FGD) with females /males over 18 years of age. Overall, 5 FGDs were conducted.
The purpose of this stage was to collect information on actual acts of corruption and the problems of citizens’ interaction with government authorities and other state institutions financed from budgets of different levels. FGDs on the whole enabled to clearly identify the mechanisms, causes and dynamics of corruption activities in Ukraine and understand the causes behind the citizens’ lack of readiness or unwillingness to defend their rights3
3 The findings of the qualitative survey are highlighted and the quotations in the text are given in italics with the vocabulary and syntax of the respondents preserved
All MS World ENG.indd 12 09.08.2011 23:29:31

13
2. ATTITUDES TOWARD THE GOVERNMENT To put attitudes and experiences with corruption into context, respondents were asked a series of questions at the outset regarding their opinions of government work at various levels, their trust in the government and the government’s responsibilities in fighting corruption and the political will to overcome this negative phenomenon.
truSt in government
Trust in government is influenced by many factors: the perceived effectiveness of government work, economic growth, administrative efficiency, openness and transparency of officials’ activities, perceptions of corruption and actual experiences with corruption.
Between 2007 and 2008 there were no tangible changes in trust in the government, but 2009 saw a significant decline in the level of public trust in the government at all levels (see Chart 2.1). The 2011 survey showed a slight growth of trust in all levels of government and government bodies included in the list. The most trusted level of government, as in previous years, is the local/municipal level. It should be noted though that to a varying degree only about one-fifth of respondents expressed their trust in local authorities, which has been the case for many years.
Chart 2.1
Trust in Government
7,0%
7,7%
9,2%
10,0%
14,0%
20,1%
5,3%
4,2%
6,7%
9,3%
4,7%
19,4%
8,6%
9,0%
18,1%
12,7%
14,6%
23,6%
10,0%
10,8%
16,4%
12,9%
15,3%
22,7%
Судовасистема
Верховна РадаУкраїни
КабінетМіністрівУкраїни
Обласніоргани влади
Президент тайого
Адміністрація
Міська /Сільська влада
2007
2008
2009
2011
Question: To what extent do you trust the following government bodies and branches?
The greatest increase is witnessed in attitudes towards the President and his Administration, which, for the first time in the survey put President in second place (+10 p.p. as compared to year 2009). It should be noted though that the incumbent President in 2011 is Viktor Yanukovych and accordingly it was the level of trust in him that was determined, whereas in the period when the previous three series of surveys (2007-2009) were conducted, the incumbent President was Viktor Yushchenko.
After the radical decline in trust in the Cabinet of Ministers and the Verkhovna Rada in 2009, as compared to 2007 and 2008, insignificant positive changes were observed in 2011. However, as earlier, the Verkhovna Rada and the Judicial System of Ukraine enjoy the least trust of citizens.
Regional differences in trust towards the President and the Cabinet of Ministers generally correspond to the structure of electoral preferences over the period of 2007-2011. Thus, the years of Victor Yushchenko’s presidency (2007 and 2009), though with a sharp decline in trust in 2009, were characterized by an expressed support of the population of the western and central oblasts of Ukraine. The situation in 2011 is exactly the opposite. Yanukovych, as earlier, is mainly supported by the Eastern and Southern oblasts.
4 Percentage points (p.p.) indicate the difference between the percentages of one and the same index, measured over different periods of time
All MS World ENG.indd 13 09.08.2011 23:29:31

14
2. A
TTIT
UD
ES T
OW
ARD
TH
E G
OVE
RNM
ENT
As for the level of trust in the Cabinet of Ministers the same trends can be clearly observed: the by regional chart of trust in the white-blue coalition governments in 2007 and 2011 coincides with that of the trust in President Yanukovych, while the 2009 survey was conducted during the second term of the Yulia Tymoshenko government – the by region chart of trust in her government coincides with that of trust in the President Yushchenko and the orange team on the whole.
Another trend that has not changed for years is a greater show of trust in the local authorities in western oblasts and a minimum trust in the eastern oblasts. Chart 2.2 reflects major regional differences with regard to trust in the government.
Chart 2.2
Trust in Government (by region)
7,9%
10,5%
16,5%
21,6%
5,3%
7,4%
10,4%
14,0%
28,8%
18,0%
19,0%
15,9%
9,0%
5,7%
2,5%
1,9%
9,4%
9,0%
4,7%
3,2%
28,1%
19,5%
16,9%
13,8%
24,8%
17,6%
12,2%
6,6%
7,8%
11,4%
21,7%
25,4%
30,2%
22,3%
20,6%
18,2%
West
Central
South
East
West
Central
South
East
West
Central
South
East
2007
2009
2011
Pres
iden
t and
His
Adm
inis
trati
onCa
bine
t of M
inist
ers o
f Ukr
aine
City
/ Vi
llage
Gov
ernm
ent
Question: To what extent do you trust the following government bodies and branches?
All MS World ENG.indd 14 09.08.2011 23:29:31

15
2. A
TTIT
UD
ES T
OW
ARD
TH
E G
OVE
RNM
ENT
reSponSibility for the fight againSt corruption Despite the low level of trust in government institutions, the majority of Ukrainians continue to feel that the highest bodies of government should assume the greatest responsibility in the fight against corruption. As earlier, the majority believes that the fight against corruption is the responsibility of the President – the share of such respondents increases year by year (61.1% in 2007, 68.8% in 2009 and 77.6% in 2011).
In comparison to prior years, the share of those who feel that Verkhovna Rada should be responsible for fighting corruption has practically not changed (48.8% in 2009 and 45.5% in 2011). Less expectations fall upon the Azarov government to be responsible for anti-corruption activities (33.0%) as compared to the Tymoshenko government in 2009 (45.2%).
Therefore, to date and since the period when the baseline survey was conducted, citizens believe that the Cabinet of Ministers, the militsiya force and the Prosecutor General’s Office share approximately an equal degree of responsibility for fighting corruption (a third of the respondents is confident in this).
The hierarchical breakdown of the remainder of authorities responsible for fighting corruption has not changed over the years of monitoring. No more than 18% of respondents feel that average Ukrainian citizens should be responsible for the fight against corruption, while only 2% place their expectations on non-government organizations (NGOs).
Chart 2.3
Most Responsible for Fighting Corruption
2,0%
5,0%
10,4%
13,3%
18,0%
33,2%
33,0%
45,5%
77,6%
1,9%
4,7%
7,3%
15,4%
17,8%
31,7%
44,2%
48,8%
68,8%
2,8%
7,2%
10,6%
12,9%
15,8%
37,0%
38,2%
42,8%
61,1%
Non-Government Organizations
Tax Administration and Customs Service
Local Authorities
Courts
We, Ordinary Citizens
Militia and Prosecutors’ Office
Prime Minister and Cabinet of Ministers
Verkhovna Rada of Ukraine
President of Ukraine
2007
2009
2011
Question: In your opinion, who is primarily responsible for overcoming corruption in Ukraine?
All MS World ENG.indd 15 09.08.2011 23:29:32

16
2. A
TTIT
UD
ES T
OW
ARD
TH
E G
OVE
RNM
ENT
Will of the government to fight corruption
Firstly, no more than 17% of the citizens believe that the government authorities are demonstrating the political will to fight corruption. After tangible disappointment demonstrated by the 2009 survey findings, Ukrainians are making another effort to show their trust in the new government’s willingness to fight corruption. It is the president, who showed the strongest desire to fight corruption. Indeed, it is the president, as was the case four years ago, should be the leader in the fight against corruption. Second place, as earlier, goes to the local authorities, although their willingness to fight corruption is practically at the same level as it was two years ago (13.5%). The current premier is also demonstrating greater will to fight corruption than his predecessor (11.0% versus 7.8%), though this percentage can hardly be considered sufficient. Even though the level of trust in the willingness on the part of the rest of government authorities to fight corruption is slightly increasing, it still remains very low – from 6.9% to 8.0%.
Chart 2.4
Willingness to Overcome Corruption
6,9%
7,9%
8,0%
11,0%
13,5%
16,8%
5,8%
5,7%
7,4%
7,8%
12,8%
7,3%
11,2%
11,1%
11,4%
13,7%
17,3%
20,9%
Judicial System
Verkhovna Rada of Ukraine
Oblast Government
Cabinet of Ministers of Ukraine
City / Village Government
President and His Administration
2007
2009
2011
Question: Do you think [ANY BODY OR BRANCH OF GOVERNMENT] are willing to overcome corruption in Ukraine?
Based on the results of the qualitative survey, the government’s fight against corruption is perceived as nonsense and none other than a theatrical performance by a corrupt government for the electorate. The participants of the FGDs spontaneously mentioned the President as the first person responsible for overcoming corruption. Then comes the Verkhovna Rada, law enforcement authorities, other government bodies and only in the process of discussions was an inference made that citizens are indirectly responsible for initiating and spreading corruption.
“The President, as the guarantor of constitutional rights of each citizen. If it is written that healthcare and education are free of charge in our country, then, please, guarantee it, do it. And if one thing is on the paper and another one is in real life... He is not the only one to blame, this situation has been observed for 20 years. And no one has done a stroke of work”.
All MS World ENG.indd 16 09.08.2011 23:29:32

17
3. PERCEPTIONS OF KEY PROBLEMS Before analyzing the state of corruption in detail, how does it rank among many other problems that Ukraine faces today?
Chart 3.1
Severity of Problems
76,8%
77,3%
82,9%
83,7%
86,0%
86,4%
87,9%
88,8%
92,2%
93,2%
93,5%
94,9%
77,8%
76,3%
84,8%
87,4%
88,3%
92,1%
92,5%
86,1%
93,5%
94,6%
94,0%
96,0%
77,9%
73,6%
81,2%
79,2%
89,1%
84,4%
92,8%
87,9%
90,4%
83,4%
91,5%
94,5%
Housing Shortage
Limited Access to Free Higher Education
Excessive Bureaucracy
Unfairness in the System of Justice
Drug Abuse / Drug Trafficking
Uncontrol of the Actions of Authorities
Crime
High Cost / Low Quality of Public Services
Corruption in Government
Unemployment
High Cost / Low Quality of Health Care
High Cost of Living
2007
2009
2011
Question: How serious are the following problems in Ukraine today?
As seen from Chart 3.1, the severity and relevance of the problems remain unchanged from year to year. In 2011, as in previous years, no less than 77% of respondents evaluated all of the problems on the list as extremely significant for the country. The hierarchy of these problems also remains almost unchanged – as previously, the greatest anxiety among the surveyed relates to the high cost of living (94.9%) and the high cost and low quality of healthcare (93.5%). The problem of unemployment, which became one of the top three problems during the crisis in 2009, remains on this list, 93.2% of the respondents perceiving it as a very serious problem.
The most evident change over the past year is related to the price/quality ratio and the quality of public utilities, which is today considered among the top four most pressing issues. This fact can be attributed to a steady and continual increase in the cost of public utilities over the last year. According to public opinion, the problems of crime and uncontrolled actions of the authorities have become less acute and are considered serious by 87.9% and 86.4% of citizens, respectively, as compared to 92.5% and 92.1% in 2009.
All MS World ENG.indd 17 09.08.2011 23:29:32

18
4. PERCEPTIONS OF CORRUPTION Public perceptions of the spread of corruption in society are formed by personal experience, as well as by informa-tion acquired from the mass media, family members and acquaintances. In this way, even information which is not corroborated by facts can significantly influence people’s opinions about the serious level of corruption and the government’s effectiveness in fighting it.
SourceS of information on caSeS of corruption
Certain trends can be observed in the sources of information that Ukrainians use to stay informed about corruption issues over the period between 2007 and 2011. As in prior years, the best source of information on corruption is the mass media, with electronic mass media clearly taking the lead – almost a third (30%) of respondents obtain information on corruption through television and radio, while almost a fourth of them receive similar information from print media. Informal discussions on bribery have become the second most significant source of information with one-fourth of the respondents (25.4%) obtaining information about bribes from family or friends. Contrary to electronic media, print media is gradually decreasing in terms of its readership. Indeed, their audience representing one-fourth (25.2%) of the population in 2007 fell to one-fifth (21.6%) in 2011.
Chart 4.1
Major Sources of Information about Corruption
2,2%
4,4%
7,7%
21,6%
25,4%
30,4%
2,5%
2,9%
9,5%
22,7%
25,8%
30,8%
2,6%
1,9%
7,5%
25,2%
24,0%
30,2%
Non-Government Organizations (Public or Professional)
Internet
Reports and Statements of State Bodies Officials
Printed Media
Personal Experience and Experience of Family Members, Friends, and Acquaintances
TV and Radio
2007
2009
2011
Question: From what sources do you mostly receive information about cases of corruption?
The share of respondents obtaining information on corruption via the Internet is slowly growing, – from 1.9% in 2007 to 4.4% in 2011. In addition, people seem to have grown tired of hearing government statements about corruption. After an increase in the politicization of citizens from 7.5% in 2007 to 9.5% in 2009, in 2011 this indicator fell to previous level of 7.7%.
Taking into consideration that the mass media is the major source of information on corruption, it is critical that citizens believe in the objectivity of these sources. The share of respondents who believe that the media is objective has grown from 32% in 2009 to 37.5%, while another 39.2% believe it is partially objective.
All MS World ENG.indd 18 09.08.2011 23:29:33

19
4. P
ERCE
PTIO
NS
OF
CORR
UPT
ION
Findings of the qualitative study further corroborate that mass media is the primary source of information on corruption. However, the media’s effectiveness in its coverage of corruption and efforts in fighting corruption had less enthusiastic assessments due to the fact that both print and broadcasting media are not always perceived as a free and objective source of information (as noted above 39.2% of respondents expressed this view). It is interesting that the majority of participants of discussions tend to trust the Internet as it is perceived as an independent and ‘free’ source of information.
“Media are paid money to report that somebody is “evil”. Almost all the press is bought. They write on special order and all TV channels are also bought.”
“Nowadays, the Internet remains the only honest and transparent source of information.”
“But, it is not the job of the mass media [to fight corruption]. This is the reason that anti-corruption laws and respective government bodies exist.”
leading cauSeS of corruption
Public opinion on the leading causes of corruption has also remained fairly stable over the past years. Just as in 2007 and 2009, almost an equal number of respondents among Ukrainian citizens were quoted year after year as saying that corruption has been rampant for a number of reasons.
Chart 4.2
Leading Causes of Corruption
2,1%
4,5%
6,8%
7,1%
7,5%
9,2%
10,4%
12,0%
15,1%
18,1%
1,9%
4,3%
6,2%
7,4%
6,5%
9,3%
10,3%
14,1%
15,7%
19,2%
3,0%
4,7%
6,5%
7,6%
7,2%
9,2%
10,9%
10,5%
14,7%
17,4%
Low Salaries for Public Officials
Non-Transparent for Public Governmental Decision Making
Too Much Government Bureaucracy
Poor Internal Controls in Government
Low Level of Public Awareness about Procedures and Rules in Governmental Institutions
Citizen Habits to Solve Their Problems Using Corruption Including Bribery
Complicated and Imperfect Legislation
Absents of the Political Will in the Highest Levels of Government (President, Prime Minister) to Fight Corruption
No Adequate Control of the Law Enforcement over the Officials
Desire of Politics and Public Officials to Use Public Office for Personal Gain
2007
2009
2011
Question: What are the three main causes of corruption? Name them starting with the most important one?
The two most often referred to causes of corruption have sustained their positions – abuse of public office for personal gains (18.1%) and inadequate enforcement of the law by law enforcement bodies (15.1%).
Notwithstanding, the public is becoming skeptical that the lack of political of Ukraine’s leadership in the fight against corruption by is the main cause of corruption (12% vs. 14.1% in 2009 vs. 10% in 2007), which was also discussed in the previous section of this report. As earlier, 10% of respondents are convinced that Ukraine’s legislation is too confusing and flawed, allowing for corrupt officials to take advantage of its loopholes. According to 9% of
All MS World ENG.indd 19 09.08.2011 23:29:33

20
4. P
ERCE
PTIO
NS
OF
CORR
UPT
ION
respondents, the traditionally commonplace nature of corruption in Ukrainian society is another important reason for the troubles the country faces today.
The qualitative interviews complemented findings on the major causes of corruption in Ukraine, among which are massive bureaucratic red-tape in formal procedures and processes, thus forcing people in their daily life to opt for “fast-track” mechanisms, such as bribery, reluctance to make honest efforts to accomplish tasks and looking for easier ways to get an education and various services and the commonplace practice of extortion.
“I’d rather pay. Yes, I’d rather pay in this particular case than spend two or three months running around town from one committee or public service to another.”
“In my view, the mentality of many people is that it is much easier and faster to give some civil servant a bribe, rather than trying to get things done on their own and legally. This is true both in the education sphere and in seeking gainful employment.”
“This fact of life is engrained in the people’s minds. It is genetically inherent and is difficult to eradicate. This does not have to do only with poverty or greed. This is the system throughout.”
“If a person gets into this system, they must live by the laws of the system and cannot help but accept cash in the pocket for rendering a given service.
“To me, extortion is a deeply entrenched pattern. And whenever somebody tries to break this pattern, they are driven out of the system. It all goes through the people and if somebody goes against the grain, they are fired and somebody more suitable is hired”
can corruption be juStified?A significant change over the last two years is that many people do not justify corruption as a way for them to resolve important matters. Compared to 36.9% in 2009, the percentage of such respondents increased to 41.2% (a statistically significant difference at the level p=0.001). In parallel, a group of people that can use bribes or personal ties for their own personal interests decreased from 8.1% in 2007 to 7.6% in 2009 and to 6.1% in 2011 (a statistically significant difference at the level p=0.001). Noteworthy is the fact that the number of respondents inclined to exploit corruption from time to time if it helps resolve personal problems quickly remains practically unchanged (42%).
Chart 4.3
Can Corruption be Justified?
8,1%
43,1%36,8%
7,6%
43,5%36,9%
6,1%
41,9% 41,2%
Always Justified Sometimes Justified Never Justified
2007
2009
2011
Question: Do you believe that giving bribes, unofficial services or gratuities can be justified if it is necessary for resolving
a problem that is important for you?
As in earlier surveys, there is still a clear correlation between age and the inclination to justify corruption. The older a person is, the stronger their conviction that corruption can never be justified. Younger people tend to perceive corruption as a very useful tool. At the same time, it should be noted that the number of those against corruption increased in all age groups, in correspondence with the growing number of opponents in society as a whole. In other words, both older and younger people are increasingly less inclined to justify corruption.
All MS World ENG.indd 20 09.08.2011 23:29:33

21
4. P
ERCE
PTIO
NS
OF
CORR
UPT
ION
Chart 4.4
Believe that Corruption is Never Justified
39,3% 43,9%
34,0%30,3%37,9%
44,6%
34,2%
29,7%
42,5%48,0%
38,6%34,8%
18-29 30-44 45-59 60+
20072009
2011
Age groups
Findings of the qualitative survey show that citizens are well aware of the negative consequences of corruption. Corrupt behavior is perceived as widely spread legalized racket affecting primarily the quality of life of average citizens.
“Another negative factor is that even if you pay for a university diploma, you’ve got to work with it and you don’t have the necessary qualifications. Let’s assume a person bought a diploma of a medical doctor and somebody turns to them for medical treatment. This is absolutely horrific.”
“A similar situation is when a person applies for a job as a chef in a restaurant or café, which requires a medical examination certificate. And they are told, “No worries. Come to work and we will take care of it”. Then, some clients fall ill from food poisoning.”
“This may be good for me personally, if I have more money than everybody else sitting at this table and I can resolve my problems quicker. For me personally this is good, but generally speaking it is not good and it’s unfair.”
“Or they sell a gun to a sick person for money. The man goes and shoots himself one day. He was a drug addict. He went to see a therapist and gave him money. Then he went to see a psychiatrist and also gave him money. And both of specialists issued him a certificate.
“It also may be due to the lobbying of somebody’s interests. In order to get rich through criminal channels, one may be forced to lobby somebody else’s interests”.
“I recall the beginning of perestroika, when the word “racket» could be heard everywhere. I’ve got a feeling that we are sliding back into that era. But this time it is more legal and on a government level.”
On the other hand, the participants of the discussions claimed that corruption may have some positive effects, provided that bribes are extorted in “reasonable” amounts. In this case, corruption could be justified:
“When applying to obtain any official document, applicants are told they will be ready by a certain date. If they need it sooner, a bribe or a gratuity is demanded and the document will be ready in a matter of a few hours”
“This fuels competition and allows people to climb the career ladder not based on their professional qualifications, rather on the amount of a bribe they pay some civil servant.”
“100 hryvnia is not enough. 1,000 or a minimum of 500 will be sufficient. So, where does somebody find such big money?”
changeS in the level of corruption Since 2004As noted earlier, there is a reverse correlation between the level of trust in the government and the population’s perception of corruption. Findings of the 2011 survey show differences in perception of corruption according to political preferences of the respondents. Results of the survey demonstrate that over a half of the surveyed supporters of the current administration (the Party of Regions, which is the party of the current president and government, and the political force of the Speaker of the Ukrainian Parliament Volodymyr Lytvyn, believe the level of corruption either has not changed or has fallen compared to 2004.
All MS World ENG.indd 21 09.08.2011 23:29:34

22
4. P
ERCE
PTIO
NS
OF
CORR
UPT
ION
Chart 4.5
Perceived Change in Level of Corruption in Ukraine since 2004 Depending on the Respondents’ Political Preferences
1%
1%
4%
4%
4%
6%
7%
11%
14%
27%
24%
24%
30%
27%
35%
36%
49%
40%
7%
4%
11%
9%
9%
10%
15%
11%
17%
65%
70%
62%
58%
60%
49%
42%
29%
29%
All-Ukrainian union 'Liberty' (O.Tyagnybok)
Political force of Anatoliy Hrytsenko 'Civic position'
Political force of Yulia Tymoshenko
Political force of Arseniy Yatsenyuk 'Front for change'
Political force of Vitaliy Klychko
Communist party of Ukraine (P.Symonenko)
Party 'Strong Ukraine' (S.Tigipko)
Political force of Volodymyr Lytvyn
Party of regions (V.Yanukovych)
Decreased
Not changed
Hard to say
Increased
Question: In your opinion, has the level of corruption changed in Ukraine compared to 2004 and how?
The situation is slightly more complicated when it comes to followers of Serhiy Tihipko’s Strong Ukraine and the Communist Party of Ukraine led by Petro Symonenko. Here, less than half of the respondents believe that corruption is worse today than it was before the Orange Revolution. As for the supporters of the “orange” forces, more than 60% are convinced that the level of corruption has increased compared to 2004.
For a more precise assessment of the effectiveness of the MCC Threshold anti-corruption programs, we asked respondents in this survey about their perceptions of changes in corruption over the last two years after the previous survey in 2009.
Overall, the assessment of such changes is not as flat as two years ago: almost 40% of respondents are convinced that the situation has not changed, although 41.7% said the level of corruption has increased. Another 5% of the respondents said the level of corruption is lower than in 2009. Noteworthy is that 55.8% of respondents of the 2009 survey said the level of corruption has increased over the past two years.
Chart 4.6
Perceived Change in Level of Corruption in Ukraine Two Years Prior to the Survey
2,2%
29,0%
55,8%
5,0%
39,0% 41,7%
Decreased Remained the Same Increased
2009
2011
Question: How has the level of corruption in Ukraine changed to-date compared to early 2009 (2007)?
All MS World ENG.indd 22 09.08.2011 23:29:34

23
4. P
ERCE
PTIO
NS
OF
CORR
UPT
ION
Spread of corruption and the effectiveneSS of preventative meaSureS
The results of the survey show that public perceptions of corruption at all levels of government have decreased over this past year and are almost the same as in 2007. 54.5% of respondents believe that the highest level corruption is in the Verkhovna Rada of Ukraine. Slightly less than half of the respondents perceive the President, his Secretariat and the Cabinet of Ministers of Ukraine as highly corrupt entities.
The incumbent president apparently managed to convince his voters of his commitment to eradicating corruption, which gives him a better image than the current government as to the level of perceived corruption. As earlier, respondents believe that the lowest level of corruption is among local authorities (32.7%).
.Chart 4.7
Spread of Corruption by Level of Government
32,7%
39,0%
40,7%
46,8%
54,6%
38,7%
46,5%
58,8%
57,1%
65,0%
32,4%
37,5%
36,8%
44,9%
54,2%
City / Village Government
Oblast Government
President and His Administration
Cabinet of Ministers of Ukraine
Verkhovna Rada of Ukraine
2007
2009
2011
Question: in your opinion, to what extent is corruption rampant among government authorities at various levels?
Just as in the previous years, respondents were asked to evaluate the spread of corruption in 20 sectors. As earlier, there are increased perceptions of corruption in the State Auto Inspection agency (64.4%) and the judicial system (60.3%). It is important to note that this year the state healthcare system has caught up with the judicial system (60.3%) and the [p;oce (59.1%), which earlier ranked third in this anti-rating list.
Amidst all proposed sectors, only three demonstrated a slight decrease in the level of corruption compared to 2009: university management and faculty (from 49% to 47.1%), obtaining government subsidized housing (from 40.2% to 38.3%) and registration or privatization of real estate (from 35.4% to 33.5%) – all changes are statistically significant at the level of p=0.01.
In the majority of sectors, perceptions of corruption have increased.
The most tangible increase in the public perceptions of corruption was revealed in such sectors as healthcare services (from 54.2% to 60.3%), passing through customs control and obtaining customs documents (from 38.6% to 42.1%), being hired for a government job (from 31% to 36.2%), regulation of business activity (from 29.3% to 34%) and applying for and obtaining unemployment and other social assistance (from 16.3% to 20.4%).
In the opinion of respondents, corruption also increased in the sphere of public utility services, specifically state subsidized installation and repair of equipment in schools and among tax inspectors.
Perceived corruption in the other eight sectors remained at the level of two years ago.
All MS World ENG.indd 23 09.08.2011 23:29:34

24
4. P
ERCE
PTIO
NS
OF
CORR
UPT
ION
Chart 4.8
Spread of Corruption
18,1%
18,7%
20,4%
21,4%
26,8%
27,2%
33,5%
34,0%
36,2%
38,3%
42,0%
42,1%
42,1%
45,9%
47,1%
51,1%
59,1%
60,3%
60,3%
64,4%
16,6%
16,8%
16,3%
19,4%
26,2%
26,1%
35,4%
29,3%
31,0%
40,2%
40,4%
38,6%
42,2%
47,1%
49,0%
51,6%
58,4%
54,2%
59,3%
63,3%
15,5%
17,6%
14,4%
23,8%
22,8%
30,2%
29,1%
27,6%
29,3%
38,6%
40,3%
42,8%
35,0%
37,6%
46,3%
42,9%
54,2%
54,0%
49,0%
57,5%
To Apply for a Loan to the State Institution
Schools Administration and Teachers
To Obtain Unemployment Aid and Other Social Aid (Pensions, etc.)
To Have Utilities Installed or Repaired (Phone, Gas, Electricity or Water)
State Notaries
Drafting into Army Bodies
To Register or Privatize Real Estate (House, Apartment)
Business Regulations and Inspections
To Get a Job at a State or Government Institution
To Get Government Subsidized Housing
Tax Authorities
Bringing Goods Through Customs or Obtaining Customs Permission to Bring Goods
To Request Different Governmental Permits (Including Building Permit)
Land Privatization, Ownership, and Use
Universities and Their Educators
Prosecutors’ Office
Militzia (Without DAI)
To Get Health Care (Including Doctors and Staff at Hospitals and Clinics, Pharmacies)
Court System
State Auto Inspection (DAI)
2007
2009
2011
Question: in your opinion, to what extent corruption is spread in [Sectors of life]?
A comparative analysis of the results of the survey shows a certain correlation between the growing perceptions of the spread of corruption in certain spheres and a reduced level of the government’s countermeasures and their ineffectiveness. The most recent survey demonstrates an even higher level of the public perception of the government’s anti-corruption measures.
As in previous years, a rather low number of respondents are aware of any anti-corruption measures applied by the government in various sectors: according to the findings of the 2011 survey, the share of these (depending on sector) varied between 6.6% and 28% (7.4% and 29.1% in 2009, and 8.8% and 27.3% in 2007, respectively). Changes in the levels of awareness observed in certain areas are insignificant: from 2.7 p.p. decrease to a 3.5 p.p. increase. Most of those who heard about such measures (from 49% to 76,9% in 2011), believe they are somewhat effective, which corresponds to the findings of surveys conducted in 2009 and 2007, though the maximum index in the previous surveys even exceeded 80%.
All MS World ENG.indd 24 09.08.2011 23:29:34

25
4. P
ERCE
PTIO
NS
OF
CORR
UPT
ION
Table 4.1
Dynamics of the perceived spread of corruption and the effectiveness of preventive measures5
Sphere Spread of corruption
Government application of anti-corruption measures
Countermeasures are effective6
Militsiya (not including the SAI) (+ 0,7) (– 0,3) (+ 3,5)
Healthcare (+ 6,1) (– 1,3) (+ 0,1)
Universities (– 1,9) (– 2,3) (– 4,8)
State Tax Administration (+ 1,6) (+ 2,3) (– 4,7)
Customs inspection and obtaining customs documents (+ 3,5) (+ 2,4) (– 2,5)
Getting a government job (+ 5,2) (– 1,2) (– 7,0)
Business regulation and inspection (+ 4,7) (+ 3,5) (– 8,6)
State notaries (+ 0,6) (– 2,0) (– 10,4)
Army draft (+ 1,1) (– 2,7) (– 11,7)
Installation or repair of communal services (+ 2,0) (– 1,8) (– 9,0)
Schools (+ 1,9) (– 2,3) (– 4,3)
Applying for a loan from a state institution (+ 1,5) (– 0,8) (– 10,1)
Unemployment and other social aid (+ 4,1) (– 0,1) (– 8,9)
Respondents of the last survey more critically assess the effectiveness of the new governments’ anti-corruption measures in certain spheres. The only sector in which the effectiveness of countermeasures was perceived as being slightly more effective was the police (without SAI), where 53.6% of the respondents said they were somewhat effective vis-à-vis 50.1% in 2009 (a statistically significant difference at the level of p=0.05). Meanwhile, the significant reduction in effectiveness of counter measures is perceived in as many as 10 sectors (in the range from 4.3 to 11.9 p.p.).
Thus, although the respondents do not believe that the government has curtailed its anti-corruption activities compared to 2009, they do perceive them as less effective.
It is interesting that regulation of business activity is the only sector where significant changes are noted in all three indices: the respondents note increased corruption in this sphere (from 29.3% to 34%) simultaneously with the growth of public awareness of the government’s anti-corruption measures (from 8.7% to 12.2%) and reduced effectiveness of such measures (from 65.3% to 56.7%). The close attention to this sphere was clearly evident in the events following the adoption and implementation of the new Tax Code.
Therefore, it cannot be said that the spread of corruption is definitely perceived to be the result of government’s inactivity, but more the lack of active government reforms in fighting corruption within various sectors that influence public perception of the spread of corruption.
5 The table shows changes ( — increase, — decrease) in corresponding indices for 2011 in comparison to 2009 (changes over 3 percentage points (p.p.)
are shown with double simbolsor . All of these changes are statistically significant at a level of р=0.05). The list of sectors is sorted according to decreases in the perceptions of the level of corruption.6 Percentage of those who feel that the government applies measures within the corresponding sector.
All MS World ENG.indd 25 09.08.2011 23:29:35

26
4. P
ERCE
PTIO
NS
OF
CORR
UPT
ION
overall corruption perceptionS index by region
The Corruption Perceptions Index (CPI) is calculated based on respondents’ answers to the question of how widespread they believe corruption to be within Ukraine’s governing bodies and among public officials. The more respondents believe that corruption is widespread across the 20 different functions and sectors, the higher the CPI value (which ranges from 100 – the highest perceived corruption to 0 – the least perceived corruption). The median value for the CPI in Ukraine increased from 33 in 2007 to 37 in 2008 and has remained at this level to date. Therefore, respondents perceive that the spread of corruption within the country has not changed over the last two years. Currently, on average, Ukrainians perceive that more than one-third of all of the country’s major sectors and institutions are highly corrupted.
In terms of regional distribution, the worst situations have appeared in the Kirovohrad oblast, joined now by the Sumy, Volyn and Donetsk oblasts, as well as Crimea, where the population considers more than half the sectors of the economy to be corrupt and believes that the corruption situation has significantly worsened over the last two years.
Overall, in eleven Ukraine’s oblasts (districts), the CPI has grown, while growing more than five points in ten of them. A significant decline in the corresponding index (by more than 5 points) has been witnessed in only five oblasts: Kharkiv (-14.1), Chernihiv (-9.9), Zaporizhzhia (-9.0), Kherson (-4.5) and Luhansk (-3.9). The remaining 10 oblasts did not show any change in the level of perceived corruption.
Chart 4.9
Corruption Perception Index
0
10
20
30
40
50
60
70
Zhytomyrs
ka
Poltavsk
a
Vinnytska
Zaporiz
ka
Chernihivska
Ternopilsk
a
Zaka
rpatska
Mykolay
ivska
Cherkaska
Rivnenska
Khersonsk
a
Dnipropetrovsk
a
Luhansk
a
Chernivetsk
a
Kharkivska
Kyiv (c
ity)
Khmelnitska
Ivano-Frankiv
ska
Lvivs
ka
Odeska
Kyivska
Donetska
Crimea
Volynska
Sumska
Kirovo
gradska
2009
2011
Median 2011 = 37,0Median 2009 = 37,1
Overall, an analysis of correlations in previous surveys is corroborated by the findings of the last survey. They indicated that the perception of corruption (as measured by the CPI) is strongly related to a number of factors:
• The perception of the spread of corruption is strongly related to the lack of trust in government at all levels. • The greater the Corruption Perception Index, the less one believes that authorities are doing as much as they
can to reduce corruption. • Society seems more corrupt to citizens who are able to profit from corruption for personal gains, as opposed to
those who are less inclined to justify corruption.• The higher the CPI, the more citizens feel that the level of corruption has grown over the last two years.• The more respondents see the state sector as being corrupt, the more they express their readiness to defend
their rights against dishonest officials. • Perceptions of the level of corruption are strongly related to past corruption experience. Those who have
personal experience with corrupt transactions are more convinced of its spread within government.• Middle-aged people, educated citizens, higher income groups, and those who live in cities tend to perceive that
there is a wider spread of corruption than the average respondent. This may be explained, in part, by the fact that these socio-demographic groups experience corruption more often than the average respondent.
All MS World ENG.indd 26 09.08.2011 23:29:35

27
5. CITIZENS’ EXPERIENCES WITH CORRUPTION Contrary to the perception of corruption, the actual spread of this phenomenon is evaluated based on specific cases of bribery and abuse of power reported by citizens. Therefore, reports of actual first-hand experiences of citizens with corruption are quite telling about the nature, level and trends in this phenomenon and are more reliable than perceptions.
citizenS’ tranSactionS With government agencieS and functionS
Over the entire period of monitoring of the status of corruption in Ukraine, there have been no significant changes in citizens’ transactions with government agencies or state institutions. Traditionally, the largest share of respondents have dealings with state medical institutions (66.2%), the SAI (23.7%), schools (22.2%), installation or repair of municipal utilities services (20.7%) and applying for or receiving state social assistance (18.4%). Only less than 10% of the respondents contacted any of the remaining agencies. The portion of families reporting that they did not have any transactions with state institutions remained unchanged at 15%.
Chart 5.1
Citizen Interaction with Government Agencies and Functions
1,3%
1,8%
1,9%
2,2%
2,6%
2,7%
4,3%
4,5%
5,1%
5,6%
6,4%
8,2%
8,6%
8,6%
9,7%
18,4%
20,7%
22,2%
23,7%
66,2%
1,3%
1,9%
2,6%
3,9%
2,8%
2,9%
5,0%
4,3%
5,0%
4,6%
8,8%
8,2%
8,8%
8,9%
8,2%
16,7%
19,6%
22,7%
23,2%
67,4%
1,7%
1,9%
3,3%
5,2%
2,3%
3,6%
5,1%
5,3%
4,7%
4,9%
8,6%
8,1%
9,5%
10,2%
8,0%
18,6%
22,6%
23,6%
19,7%
68,7%
Government subsidized housing
Prosecutors’ office
Customs
Applying for loan from state institution
Business regulation and inspection
Army draft
Tax authorities
Getting government job
Government permits
Court system
State notaries
Militzia (without DAI)
Universities
Register and privatize real estate
Land privatization and ownership
Unemployment and other social aid
Utilities installed and repaired
Schools
State auto inspection (DAI)
Healthcare
2007
2009
2011
There was a noticeable decline in the share of applicants for government loans. Interaction with other institutions remained unchanged.
Question: Over the last 12 months, have you or anyone in your family dealt with government authorities or with any of the state institutions to get the following services?
All MS World ENG.indd 27 09.08.2011 23:29:35

28
5. C
ITIZ
ENS’
EXP
ERIE
NCE
S W
ITH
CO
RRU
PTIO
Nextortion, voluntary bribeS and uSe of perSonal connectionS (by Sector) Despite the fact that Ukrainian perceptions of the spread of corruption within various sectors and institutions has not changed, the level of real corruption experiences is decreasing. Overall, compared to 2009, the share of those who encountered any form of corruption over the last year decreased by more than 2.4 p.p (a statistically significant difference at the level of p=0.001). Over the last 12 months, 60.1% of respondents or their family members were involved in some form of corrupt transactions when dealing with state officials (in comparison to 62.5% in 2009 and 67% in 2007).
Chart 5.2
Involved in Corruption over the Past 12 Months
62,5%
67,0%
60,1%
2007 2009 2011
N(2007)=10528; N(2009)=10511; N(2011)=10600
Question: Over the last 12 months have you or members of your family had to deal with any corrupt behavior of representatives of
government authorities, including educational, healthcare and other organizations?
A qualitative survey complements the picture of quantitative data with real life examples of encounters with corruption. Participants of the discussions are convinced that there is hardly any sector in which corruption does not exist:
“Healthcare, education, judges, militsiya. Corruption is everywhere and all the way through. It’s everywhere, where there is room for rent-seeking. If there is no room, there is no corruption. In a store, a cheaper good may be held back and later on sold at a higher price. There are sectors where corruption is impossible altogether.”
“If in university we had to pass an exam in a not so important discipline, we just agreed to how much everyone will chip in.”
“He says to me: Dad, let’s pass a motor vehicle inspection honestly. I say, let’s do it son. And we went there and tried to pass the inspection honestly. We were passing it for a whole week and we did not manage to complete it. Eventually we were forced to get it done the dishonest way”.
“We are planning a trip to Crimea with my friends. I approach a ticket booth at the railway station and ask the clerk if there are tickets to Simferopol. No tickets. To Sevastopol? No tickets. I said I will pay double the price. She gives me her telephone number and asks to call her in 10 minutes. I call her in 10 minutes. She asks, “How many of you are going?” I respond, “Six persons”. She says, “I have found tickets for you, come pick them up”.
“He paid money to work as a deputy judge for a meager salary and a long tenure. He was forced to pay a huge amount of money to get this job, because a deputy judge is just one step away from becoming a judge”.
“Or get in line for government subsidized housing. Your number in the line does not matter. For example, you may be 120th, then they dole out apartments, and after that you find out that your number is now 130th. This is what I call corruption: somebody has paid to skip ahead of the line. I personally encountered that. This is my own experience”.
“And when you cross the country’s border you have to pay. Otherwise you will stand in line for two days and your goods will spoil. And you need money to get into a hospital and have contact with any government institution”.
All MS World ENG.indd 28 09.08.2011 23:29:35

29
5. C
ITIZ
ENS’
EXP
ERIE
NCE
S W
ITH
CO
RRU
PTIO
N
corruption by typeS of bribery A more detailed review of corruption experiences by sectors that provide service with funding from the budgets of all levels shows some variation. Some sectors show decreases in extortion, while others show increases. In Chart 5.3, the sectors are sorted by changes in extortion experiences (from the highest decrease to the highest increase).
55.2% of respondents encountered extortion at least in one sector and this value does not differ from the 2009 findings. No statistically significant decrease was recorded in any of the sectors. Quite to the contrary, a notable increase in bribery was reported by users of such services as registration or privatization of real estate (from 22.6% to 32.2%), SAI (from 39.7% to 45.1%), state tax administration (from 19.6% to 28.7%) and the militsiya (from 46.1 to 53.1%).
Chart 5.3
Bribes Extorted(percent of respondents who had contacted respective state institutions)
32,2%
28,7%
47,1%
53,1%
32,0%
36,1%
36,1%
49,7%
26,0%
45,1%
40,2%
66,0%
8,9%
28,2%
61,1%
6,7%
38,4%
29,6%
11,1%
26,3%
22,6%
19,6%
40,1%
46,1%
25,3%
29,5%
29,5%
43,8%
20,2%
39,7%
35,4%
62,7%
6,8%
26,4%
59,7%
6,7%
38,6%
30,3%
12,7%
30,2%
24,4%
24,1%
36,0%
42,8%
24,9%
36,5%
32,1%
47,3%
32,1%
41,3%
41,1%
65,1%
8,8%
36,6%
59,5%
9,0%
39,2%
26,3%
12,4%
31,8%
Register and privatize real estate
Tax authorities
Government permits
Militzia (without DAI)
Land privatization and ownership
Customs
Getting government job
Universities
Army draft
State auto inspection (DAI)
Business regulation and inspection
Healthcare
Unemployment and other social aid
Utilities installed and repaired
Schools
Applying for loan from state institution
Government subsidized housing
Prosecutors’ office
State notaries
Court system
2007
2009
2011
Question: Have you or members of your family been extorted a bribe (payment, gratuity, protection, service)?
Extortion reduced above this line
All MS World ENG.indd 29 09.08.2011 23:29:36

30
5. C
ITIZ
ENS’
EXP
ERIE
NCE
S W
ITH
CO
RRU
PTIO
NIt is important to remember that it takes two to generate corruption. Citizens can offer bribes if they help them resolve their personal matters. The share of those who offered voluntary bribes decreased by an average of 2 percentage points since 2009 (from 42.6% to 40.6%). In Chart 5.4, the sectors are also sorted by changes in experiences with voluntary bribery (from the highest decrease to the highest increase).
Chart 5.4
Bribes Given Voluntarily(percent of respondents who had contacted respective state institutions)
29,5%
15,3%
9,9%
11,6%
10,7%
6,7%
16,1%
3,9%
12,5%
14,0%
30,4%
20,6%
25,5%
61,6%
36,4%
2,2%
6,9%
7,5%
14,5%
10,7%
16,0%
10,4%
7,1%
8,8%
8,6%
5,1%
14,8%
3,2%
12,5%
14,2%
31,0%
21,7%
27,3%
63,8%
38,6%
5,3%
10,0%
11,1%
19,9%
16,6%
17,5%
14,2%
7,0%
11,9%
13,7%
11,3%
18,5%
6,6%
14,4%
15,3%
35,4%
21,7%
29,0%
60,8%
36,5%
4,3%
9,9%
14,9%
21,8%
18,1%
Government subsidized housing
Getting government job
Land privatization and ownership
Register and privatize real estate
Court system
State notaries
Government permits
Unemployment and other social aid
Army draft
Tax authorities
State auto inspection (DAI)
Militzia (without DAI)
Universities
Schools
Healthcare
Applying for loan from state institution
Prosecutors’ office
Utilities installed and repaired
Business regulation and inspection
Customs
2007
2009
2011
Question: Have you or members of your family voluntarily offered a bribe (payment, gift, protection, services) to obtain services?
Disregarding the fact that voluntary bribe-giving has overall become less frequent, statistically significant changes for the better were reported in the sector of public utility services (a decrease from 11.1% to 7.5%). Conversely, significant worsening of the situation was reported in such sectors as government subsidized housing (from 16% to 29.5%), getting a government job (from 10.4% to 15.3%), land privatization and ownership (from 7.1% to 9.9%) and registration of real estate (from 8.8% to 11.6%).
Changes in the remaining sectors are not statistically significant.
As earlier, voluntary bribe-giving now happens less often than incidences of extortion, therefore the correlation between the two has changed over the last two years from 1:2 to 1:2.5
.
Bribe-giving reduced above this line
All MS World ENG.indd 30 09.08.2011 23:29:36

31
5. C
ITIZ
ENS’
EXP
ERIE
NCE
S W
ITH
CO
RRU
PTIO
N
Chart 5.5
Use of Personal Connections(percent of respondents who had contacted respective state institutions)
37,7%
23,5%
30,0%
25,2%
22,0%
30,3%
21,2%
13,6%
8,8%
24,9%
22,5%
18,4%
20,2%
11,1%
6,9%
10,0%
20,5%
27,5%
14,2%
23,5%
19,2%
17,1%
25,9%
17,7%
11,4%
7,5%
25,1%
22,7%
18,7%
20,5%
11,5%
8,9%
14,0%
26,9%
Getting government job
Tax authorities
Government subsidized housing
Militzia (without DAI)
Register and privatize real estate
Government permits
Court system
Utilities installed and repaired
Unemployment and other social aid
Business regulation and inspection
Army draft
Land privatization and ownership
Prosecutors’ office
State notaries
Applying for loan from state institution
Customs
Universities
2009
2011
Question: Have you or members of your family or a state official ever used personal connection, nepotism or favoritism to obtain services?
Additional types of corrupt behavior, such as use of personal connections, nepotism and/or favoritism to obtain services, were not researched in 2007 survey . The findings of 2009 and surveys in 2001 indicate that this type of corrupt behavior occurs less frequently than extortion, however more often than offering bribes. In other words, prior to offering a bribe, citizens try to first find a useful connection in the necessary sphere.
The overall share of those who use personal connections in resolving problems has changed slightly over the last two years: 22.9% in 2011 versus 21.8% in 2009. However, if we look at different sectors, higher education appears to be the only sector in which the use of personal connections has decreased significantly, by 6.6 p.p. Obviously, this can be partially explained by the introduction of the External Independent Testing (EIT) system. Conversely, nepotism has become more widespread in such sectors as registration and ownership of real estate (+4.9 p.p.), interactions with the militsiya (without SAI) (+6 p.p.), the tax authorities (+9.2 p.p.) and applying for state employment (+10.2 p.p.).
The findings of the qualitative survey offer additional proof that voluntary bribe-givers are tolerated or even silently approved. An opinion was voiced that when a person chooses to offer a bribe, it means such a person can afford to pay, and is unlikely to face negative consequences as opposed to situations when a person is forced to pay.
“A person comes to a hospital to get a certificate. They tell him, come in a week. And the person wants to get the certificate earlier, in 2-3 days.”
Use of personal connections reduced above this line
7 The use of personal connections was not measured for the following sectors– healthcare, schools, and the SAI.
All MS World ENG.indd 31 09.08.2011 23:29:36

32
5. C
ITIZ
ENS’
EXP
ERIE
NCE
S W
ITH
CO
RRU
PTIO
N“If he had a good salary in the first place, that would be a different thing. But I know that this doctor hardly makes ends meet and she indeed saved my life and has helped me, my family and friends, I’d rather repay her for her kindness.”
“If I am giving something away, I must have more in stock. And if a person has nothing, they will borrow. Such a person will take out a loan and then will have to repay it”.
“Relatively speaking, if a doctor saves life and you want to repay him for his kindness, this is your initiative. The doctor may refuse, but you will still want to show your gratitude. And it’s quite a different story from that when a doctor abuses his or her position and demands a bribe from patients, but is not attending to them helping them recover from severe injury, for example…”
There is a clear correlation between extortion and voluntary bribe-giving. That is why participants of the discussions suggest that extortion should be eradicated first and then voluntary bribery will cease to exist:
“It would be good to overcome extortion. It’s easier to beat voluntary bribery, though...»
“When there is no extortion, there will be no voluntary bribes”
“Voluntary bribes will cease to exist in due course...»
Nepotism in Ukrainian tradition is a positive thing, even if used for personal gains. It’s interesting that in focus group discussion in Lviv, nepotism used to be associated with President Viktor Yushchenko.
“Nepotism in everyday life is nothing bad”
“It depends. Nepotism may be a good thing and may be a bad thing.
citizen victimization by corruption
Results of the 2007 baseline survey revealed and findings of 2009 survey showed once again that the people most drawn into corruption are young citizens, people with higher levels of education and people with higher incomes. The survey results dispelled certain stereotypes that corruption persecutes the most vulnerable groups, thus leading to their even greater marginalization.
Chart 5.68
Experience with Corruption over Past 12 Month
59,7%
51,5%
70,3%58,8%
62,8% 67,9%56,4%
42,7%
59,3%
69,2%
55,6%52,7%
0%
10%
20%
30%
40%
50%
60%
70%
80%
1 2 3 4
AgeEducation
Income
increasing of age, education level, income (by quartile)
The socio-demographic profile of those who found themselves in corruption situations over the last 12 months in most cases coincides with the findings of the previous surveys (see Chart 5.6). To date, the group with greater experience in corruption includes young and middle-aged people with higher levels of education and higher incomes. Representatives of the younger age groups invariably appear most drawn to corruption.
8 Quartiles by age are: I. 18-29 years old; II. 30-44 years old; III. 45-59 years old; IV. 60 years old and older
Quartiles by education are: I. Elementary or some secondary; II. High school or vocational school; III. High specialized; IV. University undergraduate or graduate
Quartiles by income are: I. Less than 1000 UAH; II. From 1000 to 1500 UAH; III. From 1500 to 2500 UAH; IV. More than 2500 UAH
All MS World ENG.indd 32 09.08.2011 23:29:37

33
5. C
ITIZ
ENS’
EXP
ERIE
NCE
S W
ITH
CO
RRU
PTIO
N
The following charts (Charts 5.7-5.9) track corruption perception and experience trends of these socio-demographic groupings, comparing 2009 and 2011 survey results. Corruption perception, which has changed negligibly over the last three years across the board, remains almost unchanged by groups of population. The same is true for voluntary bribes. However, growth of extortions observed across the board is of varying rates by groups. Thus, the most notable increase in extortion was observed in the age group of 45-59. While in 2007 and 2009 there was a clear tendency where older people were less likely to face extortion. Today, government officials appear to “neglect” and not extort only from pensioners (age group 60+).
Chart 5.7
Corruption Perception and Experience Indices by Age Group
36,9 39,0
28,9
37,3
39,4 41,8
32,4
39,139,3
42,7
33,9
42,3
19,223,4
27,7
30,9
16,521,4
24,326
17,8
28,528,328,7
7,7
1214,7
17,1
5,0
9,711,9
12,5
5,69,711,1
13,5
18-29 30-44 45-59 60+
Corruption Perception Index 2007
Corruption Perception Index 2009
Corruption Perception Index 2011
Corruption Experience Index - Extortion 2007
Corruption Experience Index - Extortion 2009
Corruption Experience Index - Extortion 2011
Corruption Experience Index - Voluntary Bribes 2007
Corruption Experience Index - Voluntary Bribes 2009
Corruption Experience Index - Voluntary Bribes 2011
Age groups
Chart 5.8
Corruption Perception and Experience Indices by Income Level
32,1
38,3
44,0
34,537,2
41,6
33,5 35,7
43,9
34,3
28,321,6
24,221,2
16,9
30,4
20,220,1 21,5
14,69,3
12,58,1
5,8
11,5
6,86,2
Less than 1000 UAH 1000-2000 UAH More than 2000 UAH
Corruption Perception Index 2007Corruption Perception Index 2009Corruption Perception Index 2011Corruption Experience Index - Extortion 2007Corruption Experience Index - Extortion 2009Corruption Experience Index - Extortion 2011Corruption Experience Index - Voluntary Bribes 2007Corruption Experience Index - Voluntary Bribes 2009Corruption Experience Index - Voluntary Bribes 2011
Income groups
All MS World ENG.indd 33 09.08.2011 23:29:37

34
5. C
ITIZ
ENS’
EXP
ERIE
NCE
S W
ITH
CO
RRU
PTIO
NChart 5.9
Corruption Perception and Experience Indices by Education Level
30,1
40,839,8
23,6
32,4
37,437,6
41,539,7
29,1
36,8 39,039,642,9
39,6
25,3
36,0
42,142,6
27,9
32,8
26,725,7
23,2
18,225,2
31,2
2225
17,215,8
33,4
27,726,1
20
12,4
21,4
14,514,112,711
7,1
1811,4
10,310,6
7,53,9
13,611,4
10,7
9,48,8
3
Elementary High School
High School *
High Specialized
University Undegrade
University Grade
Corruption Perception Index 2007Corruption Perception Index 2009Corruption Perception Index 2011Corruption Experience Index - Extortion 2007Corruption Experience Index - Extortion 2009Corruption Experience Index - Extortion 2011Corruption Experience Index - Voluntary Bribes 2007Corruption Experience Index - Voluntary Bribes 2009Corruption Experience Index - Voluntary Bribes 2011
Education groups
overall corruption experience indiceS by region
As in our previous surveys, two indices were calculated that aggregate Ukrainians’ corruption experience across 17 institutional/sector settings. These indices were based on responses regarding actual instances of corruption within 17 different sectors. The first index, known as the Corruption Experience Index–Extortion (CEI-E), measures the degree of bribery initiated by state officials. The second – the Corruption Experience Index–Voluntary Bribes (CEI-V) –measures the degree of bribery offered by citizens to state officials. Both indices range in value from 0 to 100: the greater the number of sectors in which a respondent was a victim of extortion or proposed a voluntary bribe, the higher the value of the corresponding index.
As reported in 2007 and replicated by 2009 data, extortion occurs two times more frequently than voluntary bribe-giving. This correlation somewhat increased in 2011 to 2.5:1. This change was driven by changes on both sides: an overall increase in the level of extortion and a certain reduction in instances of voluntary bribe-giving observed in this survey, which may have stemmed both from stronger perceptions of unacceptability of corruption behaviors, as well as from the economic crisis that affected the potential of voluntary corruption.
The median value for the CEI-E, which decreased from 22.1 in 2007 to 20.1 in 2009, is now 25.3, which is higher than in 2007. It means that practically every fourth contact with an official results in extortion. When we divide Ukraine into two camps: extortion prevails in southern (29.5) and eastern oblasts (29.1), but is less common in western (23.3) and central (21.3) oblasts of Ukraine.
Due to increased extortion and decreased voluntary bribe-giving, the median value for the CEI-V is one-third of the CEI-E, while in 2009 the median value for the CEI-V was half of the CEI-E. In 2011, the decreasing trend in bribe-offering continued: on average a Ukrainian offers a bribe in 8.2% of contacts with state officials, compared to 9.6% in 2009 and 11.1% in 2007, which is a statistically significant difference at the level of p=0.05. This means that when an average Ukrainian initiates a bribe, he or she feels that a bribe is expected of him or that it is customary. Other motives may include: a bribe as a means of expediting the outcome of a matter or concealing violations. There was an opposite trend in the regions also observed in 2009: the CEI-V value decreases while moving from the west (12.2) to the central region (10.6), and further to the south (9.1) and to the east (8.3).
All MS World ENG.indd 34 09.08.2011 23:29:37

35
5. C
ITIZ
ENS’
EXP
ERIE
NCE
S W
ITH
CO
RRU
PTIO
N
Chart 5.10
Corruption Experience Index – Extortion
0
10
20
30
40
50
60
Chernihivska
Chernivetsk
a
Cherkaska
Khersonsk
a
Poltavsk
a
Rivnenska
Vinnytska
Ivano-Frankiv
ska
Zaporiz
ka
Ternopilsk
a
Luhansk
a
Zhytomyrs
ka
Volynska
Dnipropetrovsk
a
Zaka
rpatska
Lvivs
ka
Kyiv (c
ity)
Kirovo
gradska
Kharkivska
Donetska
Kyivska
Mykolay
ivska
Odeska
Khmelnitska
Sumska
Crimea
200720092011
Median 2011 = 25,3
Median 2009 = 20,1Median 2007 = 22,1
Chart 5.11
Corruption Experience Index – Voluntary Bribes
0
10
20
30
40
Cherkaska
Zaka
rpatska
Zaporiz
ka
Vinnytska
Chernivetsk
a
Ternopilsk
a
Ivano-Frankiv
ska
Kirovo
gradska
Khersonsk
a
Mykolay
ivska
Crimea
Poltavsk
a
Kharkivska
Donetska
Luhansk
a
Dnipropetrovsk
a
Rivnenska
Sumska
Chernihivska
Kyiv (c
ity)
Odeska
Lvivs
ka
Khmelnitska
Volynska
Kyivska
Zhytomyrs
ka
200720092011
Median 2011 = 8,2Median 2009 = 9,6
Median 2007 = 11,1
Overall, the results of the 2011 survey confirm the enduring characteristics of corrupt behavior within the regional divisions: more than 60% of oblasts (districts) with high levels of extortion also have high levels of voluntary bribes. It is evident once again that corruption develops in two ways.
The third index, developed based on 2009 and 2011 data – is the Corruption Experience Index–Use of Personal Connections, Nepotism and Favoritism when dealing with state officials (CEI-P). This index has the same characteristics as the other two. The median value for the given index in 2011 is 16.4, which is 2.6 p.p. up from 2009, meaning that it finds itself between the CEI-E and CEI-V values. Thus, the use of personal connections in Ukraine occurs more often than extortion, but less often than voluntary bribery.
In a regional breakdown, the chart for this index is similar to that of the CEI-V: the highest usage of personal connections was revealed in western Ukraine (18.8) and in the central oblasts (18). This practice is less widespread in the south (12.6) and in the east (12.3). It is important to note that there was no change in this index in western oblasts over the last two years, meaning that the countrywide rise in the index is driven by its growth in the rest of Ukraine. Voluntary bribes are often supplemented by the use of personal connections. With respect to individual oblasts, the Volyn (40.7) and Sumy (38.2) oblasts lead the rating, while Zaporizhzhia (1.3) and Kherson (3.9) showed the lowest scores.
All MS World ENG.indd 35 09.08.2011 23:29:38
36
5. C
ITIZ
ENS’
EXP
ERIE
NCE
S W
ITH
CO
RRU
PTIO
NChart 5.12
Corruption Experience Index – Use of Personal Connection
0
10
20
30
40
50
Zaporiz
ka
Khersonsk
a
Cherkaska
Zaka
rpatska
Luhansk
a
Zhytomyrs
ka
Dnipropetrovsk
a
Kharkivska
Vinnytska
Kirovo
gradska
Poltavsk
a
Donetska
Ternopilsk
a
Rivnenska
Lvivs
ka
Mykolay
ivska
Chernivetsk
a
Chernihivska
Odeska
Ivano-Frankiv
ska
Khmelnitska
Kyivska
Crimea
Kyiv (c
ity)
Sumska
Volynska
2009
2011
Median 2011 = 16,4Median 2009 = 13,7
The correlation between the CEI-E, CEI-V, CEI-P and several other exponents revealed in the 2007 results and replicated by 2009 results, has been maintained in the results of the follow-up survey:
• Disregarding certain variations of values, the level of corruption within state structures is perceived by citizens as notably worse than they actually encounter during personal contacts with state officials. This means that the perceived level of corruption always exceeds any index of actual experience with corruption.
• CEI-E has the maximum and CEI-V has the minimum value among the Corruption Experience Indices. Meanwhile, according to the survey findings, CEI-P finds itself between the two abovementioned indices. Therefore, most often, a corruption situation is provoked by a state official, and in situations where there is no direct extortion, Ukrainians try to first find a useful connection, rather than offer a bribe right away.
• Urban dwellers have more experience coming into contact with all three forms of corruption in comparison to rural dwellers.
• The higher the CEI-E, CEI-V, and CEI-P, the greater the likelihood that citizens feel that the government-led fight against corruption is inadequate. This pertains especially to extortion.
• Citizens who demonstrate higher CEI-E, CEI-V, and CEI-P scores are less inclined to trust the government.
• Citizens with the highest CEI-V and CEI-P values tend to be the ones who justify the use of corruption when it is convenient for them
All MS World ENG.indd 36 09.08.2011 23:29:38

37
5. C
ITIZ
ENS’
EXP
ERIE
NCE
S W
ITH
CO
RRU
PTIO
N
Chart 5.13
Corruption Indices for Ukraine: 2007-2011
13,1
25,6
35,4
9,9
22,1
13,7
38,1
10,0
25,8
15,3
39,4
Voluntary Bribes Extortion Personal Connections Perceived Spread
2007
2009
2011
Note: Indeces represent mean values for corruption experience and perceprion across entire sample for all sectors and institutions monitored in questionnaire. Values for use personal connections are from 2009 and 2011 surveys
Therefore, last year’s general trend in corruption practices in Ukraine looks as follows: in parallel with the steady growth of perceptions on the spread of corruption in various sectors and a slight decrease in the share of citizens who experienced corrupt behavior, to a certain degree extortion has intensified. Its manifestations are found in an increasingly higher number of sectors. Noteworthy is that this intensification is driven primarily by an increase in cases of extortion on the part of state officials, while voluntary giving of bribes and use of personal connections remain on the level of the past years.
corruption Within the healthcare SyStem
As demonstrated by Charts 5.1, the state healthcare system has been and is the leader in terms of the number of citizens’ contacts: almost two thirds of respondents or members of their family turned to state medical institutions for services. Over the years of the surveys, there was no significant change in corrupt practices in this sector. As earlier, more than half of the respondents indicated that they participated in corrupt transactions in order to obtain medical services:
• Over a half (55%) of respondents who visited clinics or hospitals were extorted to buy medicines or instruments to get service; 26% of respondents did so on their own initiative (in 2009 – 52% and 29%, respectively).
• 52% of respondents were extorted to give “charitable” donations to healthcare facilities, while 16% contributed voluntarily (compared to 49% and 16% in 2009, respectively).
• 32% of respondents were extorted for free services or were asked to make unofficial payments (that is, payments were not given directly to the official cashier) in exchange for medical services, while 14% of the surveyed did this voluntarily (compared to 28% and 15% in 2009, respectively).
Charts 5.14 refer to those respondents who had approached state medical institutions within 12 months prior to the interview (n (2007) = 7270; n (2009) = 7122); n (2011) =7036).
All MS World ENG.indd 37 09.08.2011 23:29:38

38
5. C
ITIZ
ENS’
EXP
ERIE
NCE
S W
ITH
CO
RRU
PTIO
NChart 5.14
Corruption in Healthcare
Question: Were you forsed to…… provide free services or pay unofficially
(outside the cash desk) in hospitals or policlinics in exchange for medical cervice?
…deliver money into “charitable” funds of the hospital, cabinet or
other funds?
…buy medicines or instruments before going to
doctor or hospital?
32,0%
13,5%
3,2%
47,8%
28,0%
15,1%
3,3%
51,2%
27,1%
12,0%
4,4%
53,3%
Yes – I was forced
Yes – I did it on my own
No – but I was forced
No – and nobody forced me
48,9%
16,2%
3,5%
30,0%
46,3%
16,2%
3,1%
33,0%
46,8%
14,7%
2,2%
33,6%
53,9%
25,9%
1,5%
17,6%
49,9%
28,7%
1,8%
18,7%
53,9%
26,5%
1,4%
16,6%
2007
2009
2011
These results suggest that the level of extortion within the healthcare system has somewhat increased compared to 2009. As earlier, very small percentages (3.5%) resisted from being extorted for bribes. Overall, the results of the follow-up survey testify to the fact that corruption within the healthcare system is a widespread and deeply entrenched practice. It appears to be customary to pay extra for services that are supposed to be provided by the state for free.
Similarly, there was little change in citizens’ views as to what methods should be applied to fight corruption within the healthcare system. As earlier, citizens sympathize with medical professionals, believing that they are forced to engage in corrupt behavior by the severely underfunded healthcare system. That is why most respondents felt that in order to curb corruption, more money needs to be allocated from the national budget to support the healthcare system (50.3%) and the salaries of medical professionals should be raised (42.6%). The share of those who support stricter measures for medical professionals involved in corruption, such as dismissal and prohibition from professional practice (41.3%) and imposing of criminal sanctions for corruption (37.1%) has practically not changed, although these measures appear to be less popular among the respondents.
Chart 5.15
Steps to Reduce Corruption in Healthcare
19,8%
21,6%
29,2%
37,1%
41,3%
42,6%
50,3%
15,9%
21,3%
29,8%
38,3%
40,3%
39,1%
53,5%
21,1%
24,7%
31,0%
32,6%
37,5%
45,8%
51,3%
Introduce 100% official payments for all the services through the cash desk
To introduce the system of medical insurance
To raise professional level and conduct more strict professional recruitment of the doctors
To enforce administrative and criminal responsibility for corruption
To fire those exposed in corruption from work with future prohibition on professional activity
To raise the salaries to the healthcare workers
To allot more money on healthcare
2007
2009
2011
Question: In your opinion, what measures should be taken to curb corruption in the state healthcare system?
All MS World ENG.indd 38 09.08.2011 23:29:39

39
5. C
ITIZ
ENS’
EXP
ERIE
NCE
S W
ITH
CO
RRU
PTIO
N
corruption in SchoolS
Questions regarding corruption in schools in the 2011 survey were answered by 23% of respondents, primarily those who had school-aged children in their families. Corruption experiences linked with school services have remained generally the same as in the earlier surveys. The most typical corrupt practices linked to education in schools are:
• Donations to the school or class fund (extorted from 55% and paid voluntarily by 32%)
• Payments for classroom repairs (separate from the school fund) (extorted from 56% of respondents, while 31% gave voluntarily);
• Donations for flowers or gifts for teachers (extorted from 33%, 51% gave voluntarily).
Charts 5.16 refer to the respondents who have children of school age (n (2007) = 2497; n (2009) = 2403; n (2011) = 2355).
Chart 5.16
Corruption in Schools
Question: Were you forsed to……pay unofficially for school admission?
…deliver money into school or class fund?
…pay for class repair? …deliver money for flower or gifts for teachers?
11,3%
3,9%
2,5%
80,6%
5,9%
2,2%
2,2%
88,8%
6,9%
1,7%
0,8%
87,7%
Yes – I was forced
Yes – I did it on my own
No – but I was forced
No – and nobody
forced me
55,1%
32,4%
0,9%
10,7%
55,0%
30,9%
1,7%
11,8%
51,9%
32,8%
0,7%
11,9%
55,7%
30,9%
0,8%
11,6%
55,1%
33,3%
1,4%
9,8%
54,0%
34,5%
0,9%
8,6%
32,5%
50,8%
0,8%
14,4%
29,9%
52,9%
1,3%
14,9%
32,1%
48,9%
0,8%
15,7%
2007
2009
2011
…pay for receiving godlen or silver medal?
…pay for positive exam passing?
…pay for “better” marks for the child?
…pay for “forsed tutoring”?
2,6%
1,1%
1,5%
91,7%
1,5%
0,9%
0,8%
95,4%
1,9%
0,9%
0,5%
92,5%
Yes – I was forced
Yes – I did it on my own
No – but I was forced
No – and nobody
forced me
4,7%
3,1%
1,7%
88,1%
3,1%
2,1%
2,1%
90,5%
2,8%
2,5%
1,4%
90,8%
4,9%
3,7%
1,2%
87,2%
2,6%
2,4%
1,8%
92,0%
2,6%
3,1%
1,7%
87,4%
8,2%
4,1%
2,4%
82,1%
4,6%
3,3%
2,2%
88,3%
4,8%
3,3%
2,0%
85,5%
2007
2009
2011
The share of parents who were forced to or voluntarily made payments for classroom repairs or for the overall benefit of the school (the so-called school or class funds) has not changed over the years and amounted to more than 85%. With regard to voluntary donations, these are targeted primarily towards collecting contributions for flowers or gifts for teachers.
Compared to 2009, the share of parents that admitted they engaged in dishonest practices to have their child admitted to a specific school has doubled (from 3.1% to 6.2%). Also, the share of those who agreed or were forced
All MS World ENG.indd 39 09.08.2011 23:29:40

40
5. C
ITIZ
ENS’
EXP
ERIE
NCE
S W
ITH
CO
RRU
PTIO
Nto pay to ensure higher grades for their children (by 1.3. p.p. and 2.3 p.p., respectively) and those who were forced to pay for in-house “compulsory tutoring” have increased.
As earlier, in general, parents did not make unofficial payments to ensure higher grades for the general education curriculum or awards for their children. To a certain extent, this can be attributed to the introduction of the External Independent Testing (EIT).
What do parents think are the most effective means of reducing corruption in schools and has this changed over the past years? Similar to healthcare system, more than half of the parents (57%) continue to support an increase in funding for the education sector and an increase in teachers’ salaries as a method of curtailing corruption in schools.
Meanwhile, the increased share of those who believe that more money should be paid to teachers directly as opposed to the sector in general might also be an indicator of perceived corruption. However, just as in the healthcare sector citizens have been forced to become more tolerant towards education professionals engaged in corruption compared to 2009. Therefore, support of stricter measures to fight corruption has somewhat dwindled. Specifically, 36% of the surveyed parents (versus 40% in 2009) supported stricter administrative and criminal sanctions; while 35% of the parents (versus 40% in 2009) were in favor of dismissal of those involved in corruption and discontinuing their professional careers.
Chart 5.17
Steps to Reduce Corruption in Schools
17,9%
29,5%
35,2%
36,0%
57,5%
61,4%
15,6%
32,4%
40,3%
39,6%
51,2%
66,8%
16,9%
33,9%
33,3%
32,3%
55,0%
61,9%
Introduce 100% official payments for all the services through the cash desk
To raise professional level and conduct more strict professional recruitment of the teachers
To fire those exposed in corruption from work with future prohibition on professional activity
To enforce administrative and criminal responsibility for corruption
To raise the salaries to the teachers
To allot more money on education
2007
2009
2011
Question: in your opinion, which measures should be taken to overcome corruption in the system of general (secondary) state education?
corruption Within inStitutionS of higher education
The majority (64.5%) of respondents who had dealings with representatives of institutions of higher learning over the past 12 months were faced with some sort of corruption. These findings correspond to the findings of the 2009 survey. 49.7% were extorted, 25.5% gave bribes voluntarily to settle an issue or problem and 20.5% used personal connections. Of those respondents who encountered corruption within the sphere of higher education, 41% stated that their experience was in connection with admissions. This percentage has not changed substantially since 2009 (39% - a statistically insignificant difference. The figures refer to the respondents who had contacts with state universities within 12 months prior to the interview: n (2007) = 1007; n (2009) = 932); n (2011) = 912.)
All MS World ENG.indd 40 09.08.2011 23:29:40

41
5. C
ITIZ
ENS’
EXP
ERIE
NCE
S W
ITH
CO
RRU
PTIO
N
corruption Within the State Auto InSpection (SAI) agency
The share of respondents who came into contact with SAI representatives over the last 12 months, which increased from 19.7% in 2007 to 23.2% in 2009, remained at the same level in 2011 (23.7%). There remains a significant share of respondents who encountered corruption in this sphere.
As earlier, the most typical form of corruption practiced by the SAI is unofficial payments made to SAI employees for violating traffic rules: approximately 42% of those who committed traffic violations were extorted for bribes and this is significantly higher compared to the 35% in 2009 (a statistically significant difference at the level of p=0.001), while the share of drivers who initiated bribes decreased from 23% in 2009 to 20.5%.
Another important reason for contacting SAI with regard to which share of extortion increased was passing technical inspection of a vehicle: 25.2% in 2011 versus 19% in 2009.
Charts 5.18 refer to the respondents who had contacted workers of the SAI within 12 months prior to the interview (n (2007) = 2087; n (2009) = 2451; n (2011) = 2522).
Chart 5.18
Corruption at SAI
Question: Were you forsed to…… pay unofficially to SAI
worker when you violated traffic rules?
…pay unofficially for conducting “correct” examination at the
accident?
…pay unofficially for receiving/ re-
regestering driving license?
… pay unofficially for receiving/ re-regestering car
permission?
…pay unofficially for passing
technical examination of the
car?
41,9%
20,5%
4,4%
29,3%
35,0%
23,2%
3,7%
34,1%
38,3%
24,8%
2,5%
28,9%
Yes – I was forced
Yes – I did it on my own
No – but I was forced
No – and nobody
forced me
11,2%
5,4%
3,7%
72,7%
9,4%
5,4%
2,7%
76,0%
7,5%
4,9%
1,2%
77,5%
18,0%
11,2%
2,2%
63,3%
16,0%
12,1%
3,5%
64,3%
16,1%
9,8%
2,9%
66,2%
13,7%
8,4%
3,3%
68,3%
11,6%
7,9%
2,7%
72,1%
10,7%
6,3%
2,4%
72,8%
25,2%
19,3%
3,6%
47,1%
19,0%
15,0%
3,1%
57,8%
17,6%
19,2%
2,5%
55,1%
2007
2009
2011
The rest of the changes are insignificant: as earlier, 18% of drivers were forced to pay to obtain a driver’s licenses or when taking technical exams, while 14% were forced to pay to have their vehicle registered. Another 11% are pressed to “finance” false results of technical inspection of the vehicle. Voluntary bribe-giving is less common than extortions in reference to all mentioned occasions. Overall, corruption within the SAI sphere remains widespread and typical and obviously its existence is reinforced by SAI employees as much as it is by drivers.
Contrary to other government funded sectors, such as healthcare and education, citizens express no sympathy to SAI employees and therefore propose application of punitive measures to curb corruption in this body.
All MS World ENG.indd 41 09.08.2011 23:29:41

42
5. C
ITIZ
ENS’
EXP
ERIE
NCE
S W
ITH
CO
RRU
PTIO
NChart 5.19
Steps to Reduce Corruption at SAI
18,4%
19,9%
45,0%
63,6%
63,5%
18,7%
20,7%
48,0%
69,4%
70,9%
26,5%
28,2%
43,5%
61,5%
60,8%
Introduce 100% official payments for all the services through the cash desk
To raise the salaries to the ordinary SAI workers
To raise professional level and conduct more strict professional recruitment of the SAI workers
To fire those exposed in corruption from work with future prohibition on professional activity
To enforce administrative and criminal responsibility for corruption
2007
2009
2011
Question: What steps in your opinion should be made to curb corruption in the system of SAI?
Also, the share of those who see stricter sanctions as the best way to reduce corruption has slightly decreased. As in earlier years, the majority of respondents supported firing those involved in corruption with further prohibition of professional activity (63.6%) and stricter administrative and criminal liability for acts of corruption (63.5%).
In addition, drivers suggest that more attention should be paid to the selection process of SAI employees (45%) and only then salaries may be raised for SAI workers (20%). Generally speaking, the hierarchy of suggestions remains unchanged.
All MS World ENG.indd 42 09.08.2011 23:29:41

43
6. CITIZEN RESPONSES TO CORRUPTION
filing complaintS and Standing up for one’S rightS
While the share of citizens that file complaints against corrupt officials remains extremely low, it varies on a year-to-year basis. Over 12 months preceding the last survey, a very small share of corruption victims who were extorted (4.1%) officially filed complaints against the authorities This is more than results of findings in the 2009 survey (2.7%) and almost equal to what was revealed in 2007 (4.3%). The practice of filing complaints with government authorities or law enforcement agencies related to corruption continues to be quite uncommon. The reasons for not filing complaints remain the same as before: a majority of the people feels that filing a complaint is futile (55%), while about one-quarter (21%) feel there was no need to do so.
Chart 6.1
Reasons for not Complaining about Corruption Experience
16,0%
7,9%
20,7%
55,4%
14,3%
7,3%
21,9%
56,5%
20,4%
8,0%
21,1%
50,5%
Other
It was not safe
In was not necessary
It was futile
2007
2009
2011
Question: What was the reason for not filing a complaint?
Only one-third of Ukrainians are becoming more willing to stand up for their rights (34.1%). Therefore, we observe no significant progress in the development of a civil society, although in 2009 the share of those who were ready to actively counter corruption increased to 35.9% from 33.2% in 2007. On the other hand, nearly as many respondents as earlier (33% in 2007 and nearly 34% in 2009 and 2011) stated they were not ready to defend their rights.
The socio-demographic portrait of a typical corruption fighter remains unchanged. The majority of those who most often declare they are ready to fight against corrupt officials are males, young people, as well as well-educated and wealthy citizens. These are the same groups that demonstrated the highest scores in the perception and experience indices. This tends to confirm the conclusions of the previous surveys that the more a person experiences corruption, the more they demonstrate their willingness to fight against it.
All MS World ENG.indd 43 09.08.2011 23:29:42

44
6. C
ITIZ
EN R
ESPO
NSE
S TO
CO
RRU
PTIO
NChart 6.2
9
Citizens Believe They are Ready to Stand for Their Rights
40,1% 39,2%
22,7%
34,8%
17,8%
32,4%
41,1%33,7%
28,7%31,4%
37,3%32,6%
0%
10%
20%
30%
40%
50%
60%
1 2 3 4
AgeEducation
Income
Increasing levels of education, income and age (by quartile)
Unfortunately, the most tangible change in citizens’ responses to what they would actually do to defend their rights, is an increase (from 30.8% to 32.9%) in the share of those who said they would not do anything (a statistically significant difference at the level of p=0.001). This is followed by a decrease in the number of citizens, who said they would appeal to a court or law enforcement bodies (from 19.6% to 17.6%).
At the same time, the people’s readiness to participate in demonstrations or protests in order to defend their rights is waning – the low share of people willing to participate in demonstrations decreased further from 8.4% to 6.8%. No other changes in responses to this question were noted. As earlier, 7% of respondent admitted they would try to reach an informal agreement with an official.
Chart 6.3
Measures You Would Take to Stand for Your Rights
6,6%
6,8%
7,1%
17,6%
22,9%
26,7%
32,9%
7,2%
8,4%
6,9%
19,6%
22,3%
26,7%
30,8%
6,7%
6,0%
8,0%
20,7%
22,8%
26,7%
27,7%
Seek help from NGO
Participate indemonstrations
Come to agreementunofficially
Apply to enforcementbodies or court
Complain to supervisor
Demand rights fromofficials
Do nothing
2007
2009
2011
Question: In what way are you ready to act when a state official coarsely violates your rights?
The main reason for inactivity in cases of corruption remains the lack of certainty that such actions will truly have the desired effect. This notion is maintained by two thirds (67.2%) of respondents who are not ready to commit to any kind of action to stand up for their rights.
9 Quartiles by age are: I. 18-29 years old; II. 30-44 years old; III. 45-59 years old; IV. 60 years old and older
Quartiles by education are: I. Elementary or some secondary; II. High school or vocational school; III. High specialized; IV. University undergraduate or graduate
Quartiles by income are: I. Less than 1000 UAH; II. From 1000 to 1500 UAH; III. From 1500 to 2500 UAH; IV. More than 2500 UAH
All MS World ENG.indd 44 09.08.2011 23:29:42

45
6. C
ITIZ
EN R
ESPO
NSE
S TO
CO
RRU
PTIO
N
Given the low expectations as to the effectiveness of efforts in the fight against corruption, participants of focus group discussions showed a low level of readiness to even start the discussion. The conclusion derived from the qualitative survey is the following: the need to fight corruption arises only when a person is victimized by a bribe-taker, all the more if the extorted bride is considered “unfair.” In other instances this would be an ineffective waste of efforts. Generally, fighting against corruption on individual level is perceived as something impractical and a risky adventure with no chances of victory.
“To complain or not to complain? Why would I care about complaints? Why should I waste my time and energy?”
“I believe that this also depends on a person. If a person wants to accomplish something, the person does so, albeit in this case at the cost of his or her well-being. One should think hard whether it makes sense to risk it at all?”
“You don’t bear responsibility only for yourself. You’ve got to care about your children, family and parents”.
“This is like dashing against a rock. Lack of confidence in one’s capabilities to do so
“Answering you previous question, I would rather say that I wouldn’t fight against corruption, because to me this little thing is convenient»
“Well, voices of ordinary people, who are not gainfully employed and are not climbing the career ladder, in principle will not be heard. It is like a dog barking, for example.”
“I personally have no time for that. If I keep going every day to complain, I will lose my job. Like I have an appointment today - please come tomorrow.”
“Let’s take, for example, education... If a teacher clearly extorts a bribe from me, either with his actions or verbally, but I know the subject and I can pass the exam without a bribe, they won’t let me go. In this case, some kind of justice must be sought against such a teacher.”
effectiveneSS of anticorruption programS
Were there changes in public awareness of anti-corruption programs implemented by different organizations and did the perception of their effectiveness change? As was observed in earlier sections, analysis of the survey findings confirms the credit of trust given by the population to the incumbent President of Ukraine regarding the fight against corruption.
Compared to 2009, the share of citizens who heard at least something about measures applied by the President’s Secretariat to curtail the level of corruption has increased from 19.3% to 32.6%. Thus, for the first time, more citizens learned about the President’s initiatives than about corruption exposures presented by the mass media (30.2%).
In addition, parliament members apparently speak more in public about anti-corruption measures, driving the share of public awareness about the Verkhovna Rada’s activities up from 18.7% to 23.7%. Finally, twice as many citizens heard about the anti-corruption activities of private businesses (10.5% vs. 5.1% in 2009). Awareness of the Cabinet of Ministers’ activity, regardless of changes in its membership, remains at the previous level (21.5%) and the same is true for other organizations and institutions.
Has public awareness of organized anti-corruption programs increased and have citizens begun to evaluate the effectiveness of these programs differently? Partially, the response to this question is a yes, and this is true for the majority of the surveyed officials and bodies, mainly the President of Ukraine (from 2.7% to 9.7%) and the mass media (from 10.8% to 15.3%). It should also be emphasized that no more than 17.6% of respondents describe any anti-corruption measures in Ukraine as effective and that this percentage was derived from the number of citizens aware of such programs.
On the other hand, there is no agent with regard to which citizens believe that the effectiveness of these anti-corruption activities has been declining. The only exception to this is private businesses, whose anti-corruption activity is perceived as having a declarative nature: despite a significant growth of public awareness about the anti-corruption measures on the part of private businesses, the assessment of their effectiveness has dwindled.
All MS World ENG.indd 45 09.08.2011 23:29:42

46
6. C
ITIZ
EN R
ESPO
NSE
S TO
CO
RRU
PTIO
NChart 6.4
Awareness about and Effectivenes of Anticorruption Programs
Awareness about Anticorruption Programs
Effectiveness of Anticorruption Programs
Mass Media
10,5%
9,9%
10,0%
11,1%
23,7%
32,6%
21,5%
30,2%
5,1%
8,3%
9,0%
10,4%
18,7%
19,3%
21,7%
27,2%
5,6%
10,2%
10,5%
12,7%
19,3%
20,9%
18,9%
29,6%
11,9%
8,4%
17,6%
13,7%
9,1%
9,7%
5,9%
15,3%
13,0%
5,1%
17,0%
11,0%
5,9%
2,7%
4,5%
10,8%
15,6%
12,4%
22,1%
14,3%
11,3%
8,1%
8,9%
13,7%
2007
2009
2011
Cabinet of Ministers
President and Secretariat
Verkhovna Rada
Civil Society and NGOs
City / Village Government
Oblast Government
Private Sector
Question: 1) Are you aware of any anti-corruption activities, reforms, or campaigns that have been implemented (organized) over the past 12 months by any of the following entities?
2) How effective were these activities?
A qualitative survey revealed a low level of public awareness about the government’s actions and organized fight against corruption. The development and adoption of anti-corruption legislation is perceived with distrust and considered an ineffective means of reducing the level of corruption. Respondents were rather skeptical about the prospects of fighting corruption both at the state and individual levels. Respondents vest the highest probability of reducing corruption in business entities:
“A system is changed by the people. And the people that work in that system today are its originators. Even if they did not give birth to it, they bolstered it”.
“It is difficult here because our government benefits from it in the first place. The government is well off when there is a shadow economy”.
“In business, it seems to be more realistic.”
anticorruption meaSureS Ukrainians are convinced that immunity status of members of parliament is the stumbling block preventing Ukraine from effective implementation of reforms in the fight against corruption. People believe that stripping deputies of their immunity status is the most effective way of fighting corruption. It is true that the share of citizens convinced in the effectiveness of this measure is gradually decreasing, however, it is still one third of the respondents (32.2%).
All MS World ENG.indd 46 09.08.2011 23:29:43

47
6. C
ITIZ
EN R
ESPO
NSE
S TO
CO
RRU
PTIO
N
Chart 6.5
Measures that are Most Likely to be Effective in Fighting Corruption
22,1%
9,0%
8,2%
13,1%
15,4%
32,2%
18,8%
7,5%
9,0%
13,2%
15,7%
35,8%
21,2%
7,1%
11,1%
9,4%
14,9%
36,3%
Other (improve citizens' legal literacy, investigationsand prosecutions, and citizen watchdogs; impose
monetary fines)
Improve laws and regulations
Better define authority of officials and improvecontrols
Fire corrupt officials and ban them in the future
Enforce criminal sanctions for corruption
Remove immunity from Rada deputies
2007
2009
2011
Question: Which of the listed below measures in your opinion might be the most effective in curbing and preventing corruption?
Overall, the palette of proposed measures remains unchanged. Stripping of deputy immunity status is followed by more radical measures such as strengthening criminal liability for corruption (15.4%), dismissal of corrupt officials and prohibiting them from working in other government jobs (13.1%).
Therefore, the survey findings are testimony to the fact that lately the idea of intensifying strict measures against corrupt officials is becoming less popular among Ukrainians. At the same time, such less radical and more progressive activities as modifying and improving legislation and, what is more important, enhancing the level of public legal awareness and introducing public control are gaining popularity. This is true with respect to both reducing corruption in individual sectors and overcoming this phenomenon in society at large.
Findings of the qualitative survey corroborate quantitative data. The respondents’ first spontaneous response with regard to the means of reducing corruption – ranging from perplexity and impossibility to fighting corruption to the use of violent methods – is followed by more reasonable ideas such as transparency of the work of state officials, public declaration of their incomes, public law suits against corrupt officials, and, finally, raising public awareness about measures to fight corruption and the results:
“We are more down-to-earth people, all we are capable of doing is gathering in the smoking area and proclaiming “what an old git!”.
“We do not see a way out of this situation”.
“There are no remedies, because both the government and the prosecutor’s office are involved…»
“Only through physical liquidation by means of a riot or a revolution”.
“Transparency of their work just as they install see-through doors in militsiya precincts. Or make their work known to the public”.
“More programs on this subject in the mass media, on TV and so on; different discussions, more “success stories”. So that people hear about them. And plenty of options, as they come out, progress will be achieved.”
“I think there must be some public awareness programs, so that people become aware of their rights and know who they can contact when their rights are flouted. Our people do not know their rights. A person is being extorted and has no clue that they can file a complaint with a higher ranking institution and what other measures are available…”
“Clearly, information should be disseminated, so that people have no fear.”
All MS World ENG.indd 47 09.08.2011 23:29:43

All MS World ENG.indd 48 09.08.2011 23:29:43