Corrosion studies of stainless steel blades - CORE
183
New Jersey Institute of Technology Digital Commons @ NJIT eses eses and Dissertations Spring 2017 Corrosion studies of stainless steel blades S. Kothari Dhruv New Jersey Institute of Technology Follow this and additional works at: hps://digitalcommons.njit.edu/theses Part of the Materials Science and Engineering Commons is esis is brought to you for free and open access by the eses and Dissertations at Digital Commons @ NJIT. It has been accepted for inclusion in eses by an authorized administrator of Digital Commons @ NJIT. For more information, please contact [email protected]. Recommended Citation Dhruv, S. Kothari, "Corrosion studies of stainless steel blades" (2017). eses. 24. hps://digitalcommons.njit.edu/theses/24
-
Upload
khangminh22 -
Category
Documents
-
view
3 -
download
0
Transcript of Corrosion studies of stainless steel blades - CORE

New Jersey Institute of TechnologyDigital Commons @ NJIT
Theses Theses and Dissertations
Spring 2017
Corrosion studies of stainless steel bladesS. Kothari DhruvNew Jersey Institute of Technology
Follow this and additional works at: https://digitalcommons.njit.edu/theses
Part of the Materials Science and Engineering Commons
This Thesis is brought to you for free and open access by the Theses and Dissertations at Digital Commons @ NJIT. It has been accepted for inclusionin Theses by an authorized administrator of Digital Commons @ NJIT. For more information, please contact [email protected].
Recommended CitationDhruv, S. Kothari, "Corrosion studies of stainless steel blades" (2017). Theses. 24.https://digitalcommons.njit.edu/theses/24

Copyright Warning & Restrictions
The copyright law of the United States (Title 17, United States Code) governs the making of photocopies or other
reproductions of copyrighted material.
Under certain conditions specified in the law, libraries and archives are authorized to furnish a photocopy or other
reproduction. One of these specified conditions is that the photocopy or reproduction is not to be “used for any
purpose other than private study, scholarship, or research.” If a, user makes a request for, or later uses, a photocopy or reproduction for purposes in excess of “fair use” that user
may be liable for copyright infringement,
This institution reserves the right to refuse to accept a copying order if, in its judgment, fulfillment of the order
would involve violation of copyright law.
Please Note: The author retains the copyright while the New Jersey Institute of Technology reserves the right to
distribute this thesis or dissertation
Printing note: If you do not wish to print this page, then select “Pages from: first page # to: last page #” on the print dialog screen

The Van Houten library has removed some of the personal information and all signatures from the approval page and biographical sketches of theses and dissertations in order to protect the identity of NJIT graduates and faculty.

ABSTRACT
CORROSION STUDIES OF STAINLESS STEEL BLADES
by Dhruv Shrenikkumar Kothari
Corrosion is a subject of interest to interdisciplinary research communities that
includes fields of materials science, chemistry, physics, metallurgy and chemical
engineering. In order to understand the mechanisms of corrosion and the function of
corrosion inhibitors, the reactions at the interfaces between the corrosive electrolyte
and a steel surface, particularly at the initial stages of the corrosion process, need to
be described. Naturally, these reactions are strongly affected by the nature and
properties of the steel surfaces. It is however seen that the majority of recent corrosion
and corrosion-inhibition investigations are limited to electrochemical testing, with ex
situ analysis of the treated steels (post-exposure analysis). The characterization of
materials and their surface properties, such as texture and morphology, are not being
considered in most of the studies.
Similarly, in situ investigations of the initial stages of the corrosion reactions,
using advanced surface characterization techniques, are scarce. In this thesis, attention
is brought to the importance of surface features of carbon steels, such as texture and
surface energy, along with defects and dislocation related to mechanical processing of
carbon steels. This work is extended to a critical review of surface analytical
techniques that are used for characterization of carbon steels in corrosive media with
particular focus on examining steel surfaces treated with corrosion inhibitors. Further,
emerging surface analysis techniques and their applicability to analyses of carbon
steels in corrosive media are discussed.
Due to their good corrosion resistance, favorable mechanical properties, and

reasonable price regarding their excellent properties, martensitic stainless steels have,
over recent decades, become one of the alloys that are increasingly used in blade
manufacturing industry. Architects often design stainless steel exterior elements with
higher polished surface, which are resistant to corrosion processes. The aim of this
work is to investigate the influence of different types of surface finishes to stainless
steel of quality AISI 440 on the corrosion properties of this steel. In order to achieve
this goal, tests are performed on surface finishes in two different environments: in an
NaCl aqueous solution, and in Acetic Acid. In addition to the methods used, surface
roughness is also measured, and SEM-EDS surface analyses are performed. Based on
the results of the performed analyses, it is found that, in the NaCl solution, the pitting
potential depends strongly on the surface roughness and the surface finish. The
evolution of the passive films on Martensitic 440 stainless steel in seawater and in
pure 3.5 % NaCl and 3.5% acetic acid is studied using Scanning Electron Microscopy
(SEM) and Energy Dispersive Spectroscopy (EDS). This thesis describes and
evaluates the comparison of the effects of pure 3.5 % NaCl with acetic acid through
surface and corrosion measurements.

CORROSION STUDIES OF STAINLESS STEEL BLADES
by Dhruv S. Kothari
A Thesis Submitted to the Faculty of
New Jersey Institute of Technology in Partial Fulfillment of the Requirements for the Degree of
Master of Science in Materials Science and Engineering
Interdisciplinary Program in Materials Science and Engineering
May 2017


APPROVAL PAGE
CORROSION STUDIES OF STAINLESS STEEL BLADES
Dhruv S. Kothari
Dr. Nuggehalli M. Ravindra, Thesis Advisor Date Professor, Department of Physics, NJIT
Dr. Michael Jaffe, Committee Member Date Research Professor, Department of Biomedical Engineering, NJIT
Dr. Sagnik Basuray, Committee Member Date Assistant Professor, Department of Chemical, Biological and Pharmaceutical Engineering, NJIT Dr. Alex Stein, Committee Member Date Chief Executive Officer, Harmon Sensors Inc.

BIOGRAPHICAL SKETCH
Author: Dhruv Shrenikkumar Kothari
Degree: Masters of Science
Date: May 2017
Undergraduate and Graduate Education:
• Master of Science in Materials Science and Engineering New Jersey Institute of Technology, Newark, NJ, 2017
• Bachelor of Engineering in Metallurgy Engineering, Indus Institute of Technology and Engineering, GTU, Ahmedabad, Gujarat, India, 2015
Major: Materials Science and Engineering
iv

v
This Thesis is dedicated to my Mother Shilpa S. Kothari, Father Shrenikkumar Kothari and Sister Sweta S. Kothari. It is their love and support that gave me the ability to complete this work.

vi
ACKNOWLEDGEMENT
I want to express my deepest gratitude to my supervisor, Dr. N.M. Ravindra, a
respectable scholar, whose encouragement, guidance, and support from the beginning
to the end enabled me to develop an understanding of the subject and also for giving
me the privilege of working under his supervision. The knowledge and skills that I
have learned from him especially those wonderful conversations about research,
coursework and overall life, will be motivating me continuously in my future
endeavors. I would also like to appreciate my committee members, Dr. Michael Jaffe,
Dr. Sagnik Basuray and Dr. Alex Stein, for their precious support and time.
Special thanks to Dr Somenath Mitra from Chemistry Department and Ms.
Samar Azizighannad, PhD Candidate, Interdisciplinary Program in Materials Science
& Engineering, for helping me to perform the SEM-EDS analysis. Also, I would like
to extend special thanks to my lab mates, Ms. Sita Rajyalaxmi Marthi and Mr. Asahel
Banobre. I enjoyed working with them.
I thank my parents, Mr. Shrenikkumar Kothari and Mrs. Shilpa Kothari,
whose help and emotional support has been of immense value to me. I thank my
sister, Mrs. Sweta Kothari who encouraged me throughout my study.
Last but not least, thanks to my friends, Urvil Khatri, Javishk Shah, Jatin
Jalora, Nirjar Shah, Aakash Sanghavi, Saloni Suthar, Bhargav Mehta, Harsh Desai
and Pooja Devaraju, whose patience and encouragement played the greatest role in
sustaining me through the challenge of this work. I will always be thankful to them.

vii
TABLE OF CONTENTS
Chapter Page
1 INTRODUCTION………………………………………………………. 1
1.1 Definition of Corrosion………………..…………………………... 3
1.2 Corrosion of Metals and Alloys…………………………………… 4
1.3 Classification of Corrosion………………………………………… 6
1.4 Types of Corrosion….……………………………………………... 7
1.5 Principle of Electrochemical Corrosion..…………………..……… 8
1.6 Corrosion of Thermodynamics and Kinetics…………………….... 10
1.6.1 Thermodynamics of Electrochemical Corrosion…………. 10
1.6.2 Kinetics of Electrochemical Corrosion…………………… 12
1.7 Passivity to Corrosion……………………..…………………......... 17
1.7.1 Introduction……………………………………………….. 17
1.7.2 Definition of Passivity…………………………...……….. 17
1.7.3 Active-Passive Behavior………………………………….. 18
2 PITTING AND CREVICE CORROSION OF STAINLESS STEEL….... 20
2.1 Introduction………………………………………………………... 20
2.2 Pitting Corrosion..…………………………………………………. 20
2.2.1 Principle of Pitting Corrosion…………………………….. 22
2.2.2 Pit Initiation………………………………………………. 23
2.2.3 Pitting Growth…………………………………………….. 24
2.2.4 Metastable Pitting………………………………...………. 26
2.2.5 Transition from Pitting to Fatigue Crack Nucleation……... 27

viii
TABLE OF CONTENTS (continued)
Chapter Page
2.2.6 Short Crack Growth……………......…………………. 28
2.2.7 Crack Coalescence…………..…...…………………... 28
2.3 Pitting Corrosion Behavior………………….……...……………. 28
2.4 Electron Fractography of Fatigue Fracture with Pitting Corrosion 30
2.5 Initial Pitting Deep and Pitting Corrosion Behavior…….……..... 37
2.5.1 Corrosion Pit Shapes……………..……...…………… 37
2.5.2 Pitting Shapes by ASTM……………...…..………….. 37
2.6 Experimenting Pitting Shape………………….………..………... 38
2.7 Pitting Corroding Rate………………....…....…………………… 40
2.8 Effect of Temperature…………………..…..……………………. 41
2.9 Effect of pH……………………….…………..…………………. 43
2.10 Effect of Velocity…………….……………..…………………… 44
2.10.1 Low Velocity Effects…………………………..……... 45
2.10.2 High Velocity Effects……………………….………... 45
2.11 Effect of Surface Condition……………………………………… 47
2.12 Evaluation of Pitting Damage...…………………………………. 48
2.13 Pitting Resistance Equivalent Number (PREN)…………………. 49
2.14 Crevice of Corrosion……...………………………….…………... 50
2.15 Mechanism of Crevice Corrosion………………………………... 51
2.16 Other Types of Corrosion……...…………………….…………… 55
2.16.1 Intergranular Corrosion…………………..…………… 55

ix
TABLE OF CONTENTS (continued)
Chapter Page
2.16.2 Stress Corrosion………….……………………….…... 55
2.16.3 Uniform Corrosion....……………………….…….…... 58
3 STAINLESS STEELS………………………………………….….……… 61
3.1 Introduction……………………………………………….…….... 61
3.2 Classification of Stainless Steels………………...…….…………. 63
3.2.1 Ferritic Stainless Steels..………………………….…… 66
3.2.2 Precipitation-Hardening Stainless Steels……..….……. 66
3.2.3 Duplex Stainless Steels……………………..….……… 67
3.2.4 Austenitic Stainless Steels……….……………….…… 67
3.3 Martensitic Stainless Steels…………………...…………….……. 73
3.3.1 440 Martensitic Stainless Steel……………..….…...…. 74
3.3.2 410 Martensitic Stainless Steel……………….……..… 77
3.4 Corrosion of Stainless Steel……………………………...…..…… 79
3.4.1 Introduction…………………………………….……… 79
3.4.2 Effects of Alloying Elements………..………………... 81
3.5 Corrosion of Acetic Acid……………………...………….……… 84
3.5.1 Introduction…………….……………………….…….. 84
3.5.2 Corrosivity…………………….……………….……… 84
4 CARBON STEEL CORROSION………………………………….….….. 87
4.1 Introduction…………………………...…………………….……. 87
4.2 Role of Texture in Corrosion of Carbon Steels……………….…... 89

x
TABLE OF CONTENTS (continued)
Chapter
Page
4.3 Effects of Surface Energy and Morphology on Corrosion of carbon
Steels..................................................................................................
96
4.4 Carbon Martensitic Stainless Steels…………...…………………... 104
4.5 Corrosion Characteristics- High Temperature…………...………… 108
4.5.1 Oxidation…..………………….………………………... 109
4.5.2 Effect of Atmosphere……………………………..…..... 110
5 Razor Blade Steel and Materials…………………………………………… 113
5.1 Introduction………...……………………………………………… 113
5.2 Elements of Razor Blade Materials………………………...……… 114
5.3 Technology………………………………………………………… 119
5.4 Raw Materials.………… ………………………………………..... 122
5.5 Machinery and Equipment…………………………...……………. 126
6 Experimental Techniques and Instrumentation……………………………. 127
6.1 Introduction………………………………...……………………… 127
6.2 Weight Loss Tests……………………………...………………...... 127
6.3 Scanning Electron Microscope and Energy Dispersive X-Ray
Spectroscopy………………………………………………………..
131
7 Results and Discussion……………………………………………….…...... 134
7.1 NaCl and Acetic Acid……………………………………………… 134
7.2 Microstructural Analysis of Blades by SEM………………………. 138
7.2.1 Surface Analysis of Blades in NaCl………….………… 138
7.2.2 Surface Analysis of Blades in Acetic Acid……….……. 142

xi
TABLE OF CONTENTS (continued)
Chapter Page
7.3 EDX Analysis of Blades…………………………………………… 145
7.3.1 Martensitic 440 Razor Blade…………………………… 145
7.3.2 Analysis of Blade After Exposure to NaCl…………...... 147
7.3.3 Analysis of Blade After Exposure to Acetic Acid…….... 149
8 Conclusions and Recommendations………………………………………... 151
8.1 General Conclusions……………………………………………...... 151
8.2 Recommendations…………………………………………………. 153
References…………………………………………………………………...... 154

xii
LIST OF FIGURES
Figure Page
1.1 Percentage of stainless steel consumption by application in 2009;
includes all grades………………………………………………....
3
1.2 Simple model describing the electrochemical nature of corrosion
processes…………………………………………………………..
5
1.3 The basic corrosion process………………………………………. 6
1.4 Example of basic corrosion process………………………………. 9
1.5 Simplified E/pH diagram (pourbaix diagram) for the iron water
system at 25oC. The potentials are given vs. normal hydrogen
electrodes…………………………………………………………..
12
1.6 Schematic Evans diagram for zinc in acid solution shows the
corrosion potential (Ecorr) and corrosion current density (icorr)…
16
1.7 Schematic diagram showing current density vs. potential curve
(anodic polarization curve) for metal with active, passive and
transpassive potential range……...………………………………..
19
2.1 Deep pits in metal…………………………………………………. 21
2.2 Models on passivity breakdown by Cl……………………………. 24
2.3 Pitting corrosion deep growth……………………...……………... 25
2.4 Measuring depth of pitting …………………………...…………... 25
2.5 Typical potential current curve of stainless steel in Cl showing the
different stages of localized corrosion……………...……………..
27
2.6 Interior pitting depth………………...……………………………. 30

xiii
LIST OF FIGURES (continued)
Figure Page
2.7 Fatigue Failure arrester at interior pitting depth………………….. 31
2.8 Equalized dimples around interior pitting depth …………….…… 31
2.9 Elongated dimples around interior pitting depth ………………… 32
2.10 Typical cleavage fractures in fracture area (3000 times)…….…… 32
2.11 Typical cleavage fractures in fracture area (1000 times)…………. 33
2.12 River pattern in fatigue propagation area (1500 times)…………... 33
2.13 Tongue pattern in fatigue propagation area (1000 times)……...…. 34
2.14 Cleavage with transgranular fracture in fatigue propagation area... 34
2.15 Cleavage with brittle particles in particular area……...………….. 35
2.16 Quasi-cleavage in fracture area…………………………………… 35
2.17 Quasi-cleavage in fracture area (II)…………………………...….. 36
2.18 Tree pattern fracture caused by interior pitting depth……..……… 36
2.19 Sub-crack caused by interior pitting depth………………..……… 36
2.20 ASTM-G46 a standard visual chart for rating of pitting corrosion. 38
2.21 Pitting deep shape…………………………………………...……. 39
2.22 Pitting deep shape…………………………………………...……. 39
2.23 Transgranular fracture at interior pitting depth………………...…. 40
2.24 Intergranular fracture in the fracture area…………………...……. 41
2.25 Pitting and repassivation potentials for three different stainless
steels in 1 M NaCl as a function of solution temperature…...…….
42
xiv
LIST OF FIGURES (continued)
Figure Page
2.26 Variation in the critical pitting temperature and critical crevice
corrosion temperature……………………………………………..
43
2.27 Pourbaix diagram for iron in water (298K)………………………. 44
2.28 Effect of velocity of sea water at atmospheric temperature on the
corrosion rate of steel……………………………………………...
46
2.29 Sketch of deepest pit with relation to average metal penetration and the pitting factor……………………………………….……...
49
2.30 Confined zone acidification………………………………………. 50
2.31 Break in passive layer attack…………………………...………… 50
2.32 Diagram presenting the corrosion rate of crevice corrosion
against time ………………...……………………………………..
53
2.33 Crevice corrosion deep growth…………………...………………. 54
2.34 The metallurgical stricture of stainless steel influences their
behavior in this type of configuration……………………………..
56
2.35 Effect of nickel content on the resistance to stress corrosion of
Stainless steel containing from 18-20% chromium in magnesium
chloride at 154 °C……………………………...………………….
57
2.36 Polarization curve in an acidic medium……………………...…… 59
2.37 Critical current <<icrit>> at the peak maximum in H2SO4 2M de
aerated at 23 °C……………………………………………………
60
3.1 Schaeffler diagram, effect of alloying elements on the basic
structure of Cr-Ni stainless steels………………………...……….
65

xv
LIST OF FIGURES (continued)
Figure Page
3.2 Austenitic Stainless steel family……………………………...…... 69
3.3 Martensitic Stainless steel family…………………...……………. 74
3.4 Schematic summary of the effects of alloying elements on the
anodic polarization curve of stainless steel……………...………...
83
4.1 Effect of Chromium content on Corrosion rate………..…………. 92
4.2 (a) Comparison of the corrosion rates of cold and hot rolled steel
by weight loss(WL), potentiodynamic polarization (PD) and
electrochemical impedance spectroscopy (EIS) measurements; (b)
comparison of weight loss measurements for cold and hot rolled
steel after 6h immersion in 16.9vol% H2SO4 and 0.3vol% HCl
solution at 60 °C (pH-0.3)……………………………………...…
94
4.3 (a) Comparison of ferrite and austenite surface energy under
hydrogen and hydrogen free condition, exhibiting hydrogen
addition caused reduction on surface energy for both ferrite and
austenite; (b) computed surface energy of ferrite and austenite
[under pure (metallic form) and hydrogen, carbon containing
system] exhibited lower surface energy for hydrogen containing
system for ferrite and austenite than Fe and Fe–C system….…….
98
xvi
LIST OF FIGURES (continued)
Figure Page 4.4 Contact angle measurements on (a) the bare steel, (b) the textured
steel, (c) the modified bare steel, and (d) the modified textured
steel. Modification of textured steel depicted its hydrophobic
nature………………………………………………………………
99
4.5 Morphological images recorded via SEM clearly elucidate the
differences for (a) the bare steel and (b) the textured steel surface.
(c and d) Magnified images of (b).[101]………………………….
100
4.6 4.7
Surface profile variations in (a) the bare steel and (b) the textured
steel surface.[101]………………………………………………...
a) Establishing relationship between the contact angle and sliding
angle of the super hydrophobic surface with the immersion time
(3.5% NaCl solution); (b) exhibited the effect of surface
modification on polarization behavior as polarization curves for
the bare steel, the textured steel, the modified bare steel, and the
modified textured steel are found different.[101]…………………
100
101
4.8 Effect of Chromium Content on Scaling resistance………………. 110
6.1 Theoretical mass loss of a corroded sample resulting from
repeated cleaning cycles………………………………………….
129
6.2 Schematic diagram of major components of SEM………………. 133
7.1 Color Change in solution when Blade dissolved in NaCl solution for 144hrs…………………………………………………………
135
7.2 7.3
Blade dissolved in 100ml of NaCl in glass beaker……………….. Weight blade before exposure to acid…………………………….
136
136

xvii
LIST OF FIGURES
(continued)
Figure Page
7.4 Weight of blade after exposure to acetic acid…………..……….. 137
7.5 Weight of blade after exposure to NaCl…………………………. 137
7.6 Represents increased oxide porosity near the boundaries of blade 139
7.7 Represents surface crack………………………………………… 140
7.8 Segregated particles in the bulk…………………...…………….. 141
7.9 Shows the depth of pit hole on the surface………...…………….. 141
7.10 Describes pit holes all over the surface of blade……………….... 142
7.11 Represents the surface deterioration as well as pit and crevice
corrosion………………………………………………………….
143
7.12 Pit holes are clearly visible on surface of blade……………….… 144
7.13 Surface exposed for EDX analysis………………………………. 145
7.14 7.15 7.16 7.17 7.18
EDX analysis showing the chemical analysis of blade…………..
Surface exposed for EDX analysis……………………………….
EDX analysis showing the chemical analysis of blade……..…....
Surface exposed for EDX analysis……………………………….
EDX analysis showing the chemical analysis of blade...………..
145
147 147
149
149

xviii
LIST OF TABLES Table Page
3.1
3.2
3.3
Stainless Steel Alloying Element and their Purpose…………..
Metallurgical Characteristics…...…………………..…………
The Composition of Stainless Steels………………..………...
63
64
72
4.1 Chromium 400 series……………………………………...….. 104
4.2 Chemical Analysis of Martensitic Steels………………...…… 108
4.3 Suggested Maximum Temperature…………………………… 112
6.1 Conversion factors Between Some Units Commonly Used For
Corrosion Rates………………………………………………..
130
7.1 First Set up for NaCl………………………………………….. 134
7.2 First Set up for Acetic Acid…………………………………... 134
7.3
7.4
7.5
7.6
7.7
7.8
7.9
Weight Loss of Blade……………………….............................
Standard Elements in Blade…………………………...………
Elements Composition in Blade…………….............................
Standard Elements of Blade in NaCl ……..……………..……
Elements Composition of Blade in NaCl…………………...…
Standard Elements of Blade in Acetic Acid…………...………
Elements Composition of Blade in Acetic Acid……………....
135
146
146
148
148
150
150

1
CHAPTER 1
INTRODUCTION
Corrosion engineering is the application of science and art to prevent or control
corrosion damage economically and safely. In order to perform this function
properly, the corrosion engineer must be well versed in the following: practices and
principles of corrosion; the chemical, metallurgical. physical and mechanical
properties of materials; corrosion testing; the nature of corrosive environments; the
availability and fabrication of materials; and design. The expert must also have the
usual attributes of the engineer-a sense of human relations, integrity, the ability to
think and analyze an awareness of the importance of safety, common sense of
organization and of prime importance, a solid feeling for economics. In solving
corrosion problems, the corrosion engineer must select the method that will
maximize profits [1]. The importance of corrosion studies is three folds [2].
The first area of significance is economics including the objective of
reducing material losses resulting from the corrosion of piping, tanks, metal
components of machines, ships, bridges, marine structures, and so on.
The second area is improved safety of operating equipment which, through
corrosion, may fail with catastrophic consequences. Examples are pressure vessels,
boilers, metallic containers for toxic materials, turbine blades and rotors, bridges,
airplane components, and automotive steering mechanisms. Safety is a prime
consideration in the design of equipment for nuclear-power plants and disposal of
nuclear wastes.
The third is conservation, applied primarily to metal resources - the world's
supply of these is limited, and the wastage includes corresponding losses of energy

2
and water reserves that are associated with the production and fabrication of metal
structures.
In the chemical, petrochemical, food processing, construction and
transportation industries where corrosion and high temperature oxidation are major
concerns, stainless steels are ubiquitous due to their high toughness and resistance to
general corrosion (Fig 1). Despite advancements in steel making technology, these
materials require a greater initial investment due to the high costs and low tolerances
of alloying elements. The presence of a strongly adhering, several nanometer thick
chromium oxide (passive) layer on the surface limits reaction kinetics and gives this
class of materials the resistance to general corrosion and oxidation. However,
stainless steels are susceptible to various forms of localized attack in chloride-
containing environments including: stress corrosion cracking (SCC), pitting corrosion,
crevice corrosion and inter-granular corrosion (IGC). A fundamental understanding of
the influence of microstructure on these mechanisms will allow modifications of alloy
chemistry, plastic deformation, heat treatment, service environment and maintenance
so that localized corrosion can be mitigated, making this class of material a more
sustainable alternative.

3
Figure 1.1 Percentage of stainless steel consumption by application in 2009; includes all grades [1].
.
1.1 Definition of Corrosion
Corrosion may be defined in several ways [1-3].
• Destruction or deterioration of a material because of reaction with its
environment.
• Destruction of materials by means other than straight mechanical effect.
• Extractive metallurgy in reverse.
• Undesirable interaction of a material with its environment.

4
1.2 Corrosion of Metals and Alloys
The corrosion occurs because of the natural tendency for most metals to return to their
natural state; e.g., iron in the presence of moist air will revert to its natural state, iron
oxide. Metals can be corroded by the direct reaction of metal to a chemical and
electrochemical reaction. The driving force that makes metals corrode is a natural
sequence of their temporary existence in the metallic form.
Thermodynamically, corrosion is the ability of the metal to revert to
compounds which are more stable, i.e., present in the nature initially [4].
Wagner and Traud, in 1938, utilized the mixed-potential theory, which consists of
two simple hypotheses:
• Any electrochemical reaction can be divided into two or more partial oxidation and reduction reactions.
• There can be no net accumulation of electric charge during an electrochemical
reaction.
From this, it follows that during the corrosion of an electrically isolated metal
sample, the total rate of oxidation must equal the total rate of reduction [1].
Electrochemical corrosion, as shown in Fig. (1.2), is the most important
classification of corrosion. Four conditions must exist before electrochemical
corrosion can proceed:
• There must be something that corrodes (the metal anodes).
• There must be a cathode.
• There must be a continuous conductive liquid path (electrolyte, usually liquid, condensate, salts, other contaminations).
• There must be a conductor to carry the flow of electrons from anode to cathode.

5
This conductor is usually in the form of metal-to-metal contact as in bolted or riveted joints.
The rates of oxidation reaction may equal the rate of reduction reaction[1,5].
Figure 1.2 Simple model describing the electrochemical nature of corrosion processes. [1,5]
Figure 1.3 shows the basics of corrosion and the elimination of any one of the five
conditions will stop corrosion. An unbroken (perfect) coating on the surface of the
metal will prevent the electrolyte from connecting the cathode and anode so that the
current cannot flow. Therefore, no corrosion will occur as long as the coating is
unbroken.

6
Figure 1.3 The basic corrosion process. [1]
1.3 Classification of Corrosion
Corrosion has been classified in many different ways. One method divides corrosion
into low-temperature and high temperature corrosion. Another separates corrosion
into direct chemical and electrochemical corrosion. The preferred classification here
is:
• Wet corrosion.
• Dry corrosion.
Wet corrosion occurs when a liquid is present. This usually involves aqueous
solutions or electrolytes and accounts for the greatest amount of corrosion by far. A
common example is corrosion of steel in water or acid.
Dry corrosion occurs in the absence of a liquid phase or above the dew point of
the environment. Vapors and gases are usually the corroding agents. Dry corrosion is
most often associated with high temperatures. An example is attack on steel by
furnace gases. The presence of even small amounts of moisture could change the
corrosion completely. For example, dry chlorine is practically non corrosive to

7
ordinary steel but moist chlorine, or chlorine dissolved in water, is extremely
corrosive and attacks most of the common metals and alloys. The reverse is true
for titanium - dry chlorine gas is more corrosive than wet chlorine [1,4].
1.4 Types of Corrosion
It is convenient to classify corrosion by the forms in which it manifests itself, the
basic for classification being the appearance of corroded metal. Each form can be
identified by mere visual observation. In most cases, the naked eye is sufficient but
sometimes magnification is helpful or required. Valuable information for the solution
of a corrosion problem can often be obtained through careful observation of the
corroded test specimens or failed equipment. Examination before cleaning is
particularly desirable [1,4].
Some of the eight forms of corrosion are unique, but all of them are more or
less interrelated. The eight forms are:
• Uniform (or General) attack
• Galvanic (or Two-metal) corrosion
• Crevice corrosion
• Pitting
• Intergranular corrosion
• Selective leaching, or parting
• Erosion corrosion
• Stress corrosion.

8
1.5 Principle of Electrochemical Corrosion
Corrosion in aqueous environments occurs by an electrochemical mechanism. The
phenomenon involves electrons and ions and can be separated into two partial
reactions, anodic (oxidation) and cathodic (reduction) [6]. At anodic sites, an
oxidation reaction occurs which is the loss of electrons. For this reaction to take place,
a simultaneous reduction process – a net gain of electrons – will occur at cathodic
sites [7, 8]. The anodic reaction of the metal is of the form
M → M n+ + ne (1.1)
Depending on the corroded metals, examples of some anodic reaction are:
Zn → Zn2+ + 2e- Zinc corrosion (1.2)
Fe → Fe2+ + 2e- Iron corrosion (1.3)
Al → Al3+ + 3e- Aluminum corrosion (1.4)
Fe2+ → Fe3+ + e- Ferrous ionoxidation (1.5)
H2 → 2H+ + 2e- Hydrogen oxidation (1.6)
2H2O → O2 + 4H+ + 4e- Oxygen evolution (1.7)
Cathodic reaction of the metal is of the form:
Xx+ + xe- → X (1.8)
The reduction of dissolved oxygen and release of hydrogen gas by the reduction of

9
hydrogen ions are the most common reactions during aqueous corrosion of metals [7].
However, there are other cathodic reactions encountered during the corrosion process.
Examples of these are:
O2 + 2H2O + 4e → 4OH Oxygen reduction (neutral solution) (1.9)
→ H2 Hydrogen evolution (in acid solution) (1.10)
→ Cu Copper plating (metal deposition) (1.11)
→ Fe2+ Ferric ion reduction (1.12)
2H+ + 2e
Cu2+ + 2e
Fe3+ + e
The two reactions, anodic and cathodic, are complementary events and must proceed
at the same rate. Anodic and cathodic sites can form on the surface of the metal for
many reasons: composition or grain size differences, discontinuities on the surface,
impurities or inclusions in the metal, local differences in the environment (e.g.,
temperature, oxygen, or salt concentration), localized stresses. The basic corrosion
process is shown in Figure 1.16. For electrochemical corrosion to take place, there are
four fundamental requirements [9]: An anode, a cathode, a conducting environment
for ionic movement (electrolyte), and an electrical connection between the anode and
cathode for the flow of (electron) current. If any of these elements is missing or
disabled, electrochemical corrosion cannot occur.
Figure 1.4 Example of basic corrosion process.[1]

10
1.6 Corrosion Thermodynamics and Kinetics
When considering a metal in a specific environment, a number of questions need to be
addressed, including: will the metal corrode in this environment, and if yes, how fast
will it corrode? These questions can be answered by studying the thermodynamics
and kinetics of corrosion.
1.6.1 Thermodynamics of Electrochemical Corrosion Thermodynamics gives an understanding of the energy changes involved in the
electrochemical reactions of corrosion. These energy changes provide the driving
force and control the direction for a chemical reaction. Therefore, thermodynamics
shows how conditions may be adjusted to make the corrosion impossible; when
corrosion is possible, thermodynamics cannot predict the rate; corrosion may range
from fast to very slow process [3].
A metal will exhibit a potential with respect to its environment. This potential is
dependent on the ionic strength and composition of the electrolyte, the temperature,
the metal or the alloy itself, and other subsidiary factors. The potential of a galvanic
cell is the sum of the potentials of the anodic and cathodic half cells in the
environment surrounding it. From thermodynamic considerations, the potential of an
electrochemical reaction can be related to the change in Gibbs free energy , ΔG = G
(products) – G (reactants), as shown in the equation below [5]:
ΔG= nFE (1.1)
where, n is the number of electrons participating in the reaction, F is Faraday’s
constant (96,500 Coulomb/mole), and E is the electrode potential. The potential of the
Galvanic cell will depend on the concentrations of the reactants and products of the

11
respective partial reactions, and on the pH of the aqueous solutions in contact with the
metal. Corrosion will not occur unless the spontaneous direction of the reaction (that
is, Δ G < 0) indicates metal oxidation. A negative free energy change (Δ G) indicates
that the stability of the products is greater than that of the reactants. The change in
electrode potential as a function of concentration is given by the Nernst equation [3,
5]:
E = Eo +2.3(RT / n F) log (ox)x/ (red) (1.2)
where Eo is the standard electrode potential, (ox) is the activity of an oxidized species,
(red) is the activity of the reduced species, and x and r are stoichiometric coefficients
involved in the respective half cell reactions. The application of thermodynamics to
corrosion phenomena has been generalized by the use of potential-pH plots (Pourbaix
diagrams). Such diagrams are constructed from calculations based on the Nernst
equation, above, and the solubility data for various metal compounds. From these
diagrams, it is possible to differentiate regions of potential as a function of pH in
which metal is either immune (no corrosion) or will be passivated by a thin film [10,
11]. Example of such diagrams is shown in Figure 1.5 which represents iron in an
aqueous solution. The diagram gives regions of existence: iron is inert and stable
(region A), actively dissolve (region B) or the oxide layer can form (region C).

12
Figure 1.5 Simplified E/pH diagram (Pourbaix diagram) for iron-water system at 25oC. The potentials are given vs. normal hydrogen electrode (NHE) [2].
1.6.2 Kinetics of Electrochemical Corrosion
Corroding systems are not in equilibrium; the oxidation and reduction reactions in the
corroding metal each occur at a potential displaced from its equilibrium value [12].
Thus, kinetic studies of the processes are necessary. A system is out of equilibrium
when the potential is displaced from the equilibrium potential by the application of an
external voltage or by the spontaneous production of a voltage away from
equilibrium. This deviation in potential is defined as polarization (η) [5].
η = | E – Eeq| (1.3)

13
where, Eeq is the equilibrium potential.
There are mainly three types of polarization in any electrochemical cell: (1)
Activation polarization, (2) Concentration polarization, and/or (3) Resistance
polarization [13, 14].
1.6.2.1 Activation Polarization. A system is referred to be as activation controlled
when the rate of the electrochemical process is controlled by the charge transfer
across the metal solution interface. For anodic and cathodic polarization on activation
controlled system, the activation polarization for the anodic reaction (ηa (A)) can be
expressed as:
ηa (A) = βA log iA / io (1.4)
where,
iA = Anodic current density (A/cm2)
io = Exchange current density (A/cm2)
βA = Tafel slope for the anodic reaction
An identical expression can be written for the cathodic reaction.
1.6.2.2 Concentration Polarization. When the transport of ions or molecules to or
away from the metal surface determines the rate of the electrochemical process, the
system is said to be under concentration polarization (ηc), or transport control. For
example, when the cathodic process in corroded system depends on the reduction of
dissolved oxygen, the diffusion of oxygen to the metal surface will often limit the rate
of corrosion.

14
The concentration polarization can be expressed as:
ηc = 2.3RT/nF * log (1 i/ilim) (1.5)
where, ilim = Limiting current density
1.6.2.3 Resistance Polarization. Resistance polarization (ηr) is a consequence of the
Ohmic resistance in the system. It is the sum of the resistance in the electrolyte (Rsol.)
and the resistance of any apparent scale on the surface (Rscale):
ηr = i Σ R (1.6)
where, Σ R = Rsol. + Rscale
High-resistivity solutions and insulating films deposited at either the cathode
or anode restrict or completely block contact between the metal and the solution and
will promote a high-resistance polarization. The total polarization (ηtotal) across an
electrochemical cell is the sum of the above individual polarizations:
ηtotal = ηa + ηc + ηr (1.7)
1.6.2.4 Rate of Corrosion and Faraday’s law. The rate of electron flow to or from a
reacting interface is a measurement of the reaction rate [3]. The electron flow is
conveniently measured as the magnitude of a current; therefore, the current can be
used to determine the reaction rate of the process through Faraday’s law. If we
consider the anodic metal oxidation reaction in equation 1.1 (M → M n+ +ne-)

15
Q = nFm/M (1.8)
where,
Q = the electrical charge (coulomb)
F= Faraday’s constant (96500 coulombs/mole)
n= Number of electrons transferred
m = Mass of metal oxidized (g)
M= Atomic weight of metal (g/mole)
Also, this can be expressed in terms of the rate of the reaction:
I = nFK/M (1.9)
where,
I = Corrosion current (A)
K = Rate of corrosion (g/s)
1.6.2.5 Mixed Potential Theory. Kinetic information of corroded surface is usually
presented in graphical forms called Evans or polarization diagrams that represent the
relation between the electrode potential and current density [15]. These diagrams are
developed based on the principles of mixed potential theory. The theory of mixed
potential was developed by Wagner and Traud in 1938 [16]. The theory proposes that
the electron released during oxidation process (anodic) is consumed by a
corresponding reduction process (cathodic). Therefore, the total rate of the oxidation
reaction will equal the total rate of the reduction [17]. The cause of the entire process

16
is based on two factors. The oxidation and reduction reactions each have a unique
half-cell electrode potential and exchange current density (Io). The second factor is
that, the half-cell potentials cannot coexist separately in the same conductive
environment. There must be a polarization in potential to a common intermediate
value referred to as the mixed potential.
Figure 1.6 illustrates the two half-cell reactions occurring when zinc is placed
in an acid solution. The two half-cell potentials are plotted with respect to the
corresponding current density of the half-cell reactions (Io). The corrosion potential
(Ecorr) and the corrosion current density (icorr) values are located where hydrogen
reduction line and zinc oxidation line converge.
Figure 1.6 Schematic Evans diagram for zinc in acid solution shows the corrosion
potential (Ecorr) and corrosion current density (icorr).[3]

17
1.7 Passivity to Corrosion
1.7.1 Introduction
All metals and alloys (commonly, gold is exception) have a thin protective corrosion
product film present on their surface due to the reaction with the environment [18].
Some of these films are passive and on some metals and alloys have certain
characteristics that enable them to provide more corrosion resistant metal surfaces.
These protective surface films are responsible for the phenomenon of passivity [4, 19]
which is the reason a metal does not corrode when it would be expected to corrode.
1.7.2 Definition of passivity
Two generally accepted definitions of the passivity have been reported [18, 20]
• A metal is passive if, on increasing its potential to more positive values, the rate of dissolution decreases (low corrosion rate, noble potentials)
• A metal is passive if it substantially resists corrosion in an environment where there is a large thermodynamic tendency to react (low corrosion rate, active potential).
Also, an additional definition has been provided by NACE/ASTM [21]; passive is the
state of a metal surface characterized by low corrosion rates in potential region that is
strongly oxidizing for the metal.

18
1.7.3 Active-passive Behavior
During anodic polarization, metals and alloys with a passivated surface will typically
display a polarization curve of the shape shown in Figure 1.7. At a relatively low
potential within the active region, when the potential value is plotted against log
current density, the behavior is linear for normal metals. With the beginning of the
formation of a passive layer, the measured current begins to decrease. The turning
point on the curve, marking the beginning of this decrease, is known as the active-
passive transition and the corresponding value of the applied potential is the primary
passivation potential (Epp). Also, in Figure 1.7, the current density decreases rapidly to
a very low value called the passive current density (ip) due to the formation of quite a
passive layer.
With the presence of a stable uniform non-conducting layer (passive oxide) on
the surface of the metal, the system enters a region where further increase in potential
causes no noticeable increase in current density; this is the passive region. This
current density remains relatively independent of the potential because it is controlled
by the rate of dissolution of the passive film. In environments without aggressive
species such as Cl-, with further increase in potential to more positive value, most of
the metal passive oxides can be further oxidized to a more soluble state. Therefore,
the effectiveness of the passivation layer is reduced and/or removed; so corrosion can
re-occur. This region where the current density begins to increase again is called the
transpassive region [22, 23]. For example, in the case of the protective layer of
stainless steel containing chromium as Cr (III), when the potential is raised to the
transpassive region, Cr (III) is oxidized to Cr (VI). However, for metals such as
aluminum and tantalum, that can form electronically insulating passive oxide films,
the passive region extends to very positive potentials and neither transpassive metal

19
dissolution nor oxygen evolution will occur [24]. Hoar [25] stated that four
conditions, are usually, but not always, required for the passivity breakdown that
initiates localized attack:
1) Critical potential: a certain critical potential must be exceeded.
2) Damaging species: such as chloride or higher atomic weight halides, are needed in the environment to initiate breakdown and propagate localized corrosion processes like pitting. 3) Induction time: an induction time exists, which starts with the initiation of the breakdown process (introduction of breakdown conditions) and ends when the localized corrosion density begins to rise. 4) Local sites: the presence of highly localized sites such as inclusions and second-phase precipitates.
Irrespective of the causes of the breakdown of the passive film, the result will
be a fresh metal surface exposed to the environment leading to localized attack such
as pitting, crevice, inter-granular corrosion or stress corrosion cracking [19, 26].
Further details will be discussed in the later section on pitting corrosion.
Figure 1.7 Schematic diagram showing current density vs. potential curve (anodic polarization curve) for metal with active, passive and transpassive potential range.

20
CHAPTER 2
PITTING AND CREVICE CORROSION OF STAINLESS STEEL
2.1 Introduction
Crevice and pitting corrosion are forms of localized corrosion, which means that the
corrosion occurs in a limited area on the blades. The corrosion rate is often high and
is generally higher than that for uniform corrosion, due to a large cathode/anode
ratio. A severe attack is therefore usually observed, and the pit or crevice may cut
through the pipe wall thickness to form a hole.
2.2 Pitting Corrosion
Pitting corrosion is defined as "localized corrosion of a metal surface, confined to a
point or small area, that takes the form of cavities"[17]. Pitting is a deleterious form of
localized corrosion and it occurs mainly on metal surfaces which owe their corrosion
resistance to passivity. The major consequence of pitting is the breakdown of
passivity; i.e. pitting, in general, occurs when there is breakdown of surface films
when exposed to pitting environment. Pitting corrosion is complicated in nature
because ''oxide films formed on different metals vary one from another in electronic
conduction, porosity, thickness, and state of hydration"[18].
Many engineering alloys, such as stainless steels and aluminum alloys, are
useful only because of passive films, which are thin (nanometer-scale) oxide layers
that form naturally on the metal surface and greatly reduce the rate of corrosion of the
alloys. Such passive films, however, are often susceptible to localized breakdown,

21
resulting in accelerated dissolution of the underlying metal. If the attack initiates on an
open surface, it is called pitting corrosion; at an occluded site, it is called crevice
corrosion. These closely related forms of localized corrosion can lead to accelerated
failure of structural components by perforation or by acting as an initiation site for
cracking. Fig. (2.1) shows an example of deep pits on a metal surface[19].
Figure 2.1 Deep pits in a metal. [19,20]
It should be noted that, whereas localized dissolution following breakdown of
an otherwise protective passive film is the most common and technologically
important type of pitting corrosion, pits can form under other conditions as well. For
instance, pitting can occur during active dissolution if certain regions of the sample
are more susceptible and dissolve faster than the rest of the surface.
Pitting corrosion is influenced by many different parameters, including the
environment, metal composition, potential, temperature, and surface condition.
Important environmental parameters include aggressive ion concentration, pH, and
inhibitor concentration. Other phenomenological aspects of localized corrosion
include the stochastic nature of the processes and the stages of localized attack,

22
including passive film breakdown, metastable attack, stable growth, and perhaps
eventual arrest [21,22].
2.2.1 Principle of Pitting Corrosion
Pitting corrosion is an electrochemical oxidation-reduction process, which occurs
within localized depths on the surface of metals coated with a passive film.
Anodic reactions inside the pit:
Fe = Fe2+ + 2e- (dissolution of iron) (2.1)
The electrons given up by the anode flow to the cathode where they are discharged in
the cathodic reaction:
1/2O2 + H2O + 2e-= 2(OH) (2.2)
As a result of these reactions, the electrolyte enclosed in the pit gains positive
electrical charge in contrast to the electrolyte surrounding the pit, which becomes
negatively charged.
The positively charged pit attracts negative ions of chlorine Cl-, increasing
acidity of the electrolyte according to the reaction:
FeCl2 + 2H2O = Fe(OH)2 + 2HCl (2.3)
pH of the electrolyte inside the pit decreases from 6 to 2-3, which causes further
acceleration of the corrosion process. Large ratio between the anode and cathode areas

23
favors increase of the corrosion rate. Corrosion products (Fe(OH)3) form around the
pit resulting in further separation of its electrolyte.
Pitting corrosion is treated as a time-dependent stochastic damage process
characterized by an exponential or logarithmic pit growth. Data from propulsion shaft
of high-speed craft is used to simulate the sample functions of pit growth on metal
surfaces. Perforation occurs when the deepest pit extends through the thickness of the
propulsion shaft. Because the growth of the deepest pit is of stochastic nature, the
time-to-perforation is modeled as a random variable that can be characterized by a
suitable reliability model. It is assumed that corrosion will occur at multiple pits on
both sides of the rivet depths and will cause multiple fatigue cracks. Therefore,
system failure could occur due to the linkage between any two neighboring cracks.
2.2.2 Pit Initiation
An initial pit may form on the surface covered by a passive oxide film as a result of
the following:
a. Mechanical damage of the passive film is caused by scratches. Anodic reaction starts on the metal surface exposed to the electrolyte. The passivity surrounding the surface acts as the cathode.
b. Particles of a second phase emerging on the metal surface. These particles precipitating along the grain boundaries may function as local anodes causing localized galvanic corrosion and formation of initial pits.
c. Localized stresses in the form of dislocations emerging on the surface may become anodes and initiate pits.
d. Non-homogeneous environment may dissolve the passive film at certain locations where initial pits form.

24
Figure 2.2 Models on passivity breakdown by Cl-. [20]
2.2.3 Pitting Growth
In the presence of chlorine ions, pits are growing by autocatalytic mechanism. Pitting
corrosion of stainless steel is illustrated in Figure 2.3. The actual pitting corrosion
phenomenon is shown on propeller shaft of high speed craft, and the pit depth is
measured with dial gauge as shown in Figure 2.4

25
Figure 2.3 Pitting corrosion deep growth. [19,20]
Figure 2.4 Measuring depth of pitting. [19,20]

26
2.2.4 Metastable Pitting
Metastable pits are pits that initiate and grow for a limited period before repassivating
(Figure 2.5). Large pits can stop growing for a variety of reasons, but metastable pits
are typically considered to be those of micron size, at most, with a lifetime on the
order of seconds or less. Metastable pits are important to understand because, under
certain conditions, they continue to grow to form large pits. Metastable pits can form
at potentials far below the pitting potential (which is associated with the initiation of
stable pits) and during the induction time, before the onset of stable pitting at
potentials above the pitting potential. These events are characterized by potential
transients in the active direction at open circuit or under an applied anodic current, or
anodic current transients under an applied anodic potential. Such transients have been
reported in stainless steels [27,28-33] and aluminum [34,35] for many years.
Individual metastable pit current transients can be analyzed for pit current density,
and stochastic approaches can be applied to groups of metastable pits.

27
Figure 2.5 Typical potential current curve of stainless steel in Cl- showing the different stages of localized corrosion. [20]
2.2.5 Transition from Pitting to Fatigue Crack Nucleation
The third stage is the transition from pit growth to fatigue crack nucleation, where
mechanical effects such as the stress intensity factor come into play. The nucleation of
the corrosion crack is essentially a competition between the processes of pit growth
and crack growth. Two criteria are used to describe the transition process.

28
2.2.6 Short Crack Growth
The short crack growth stage involves chemical and microstructural factors and their
interactions. Although much research has been done in this area, it has been difficult
to derive an explicit formula for short crack growth, especially in corrosive
environment. For computational simplicity, a probabilistic power law model is
presented here to describe the relationship between the stress intensity factor and the
growth rate. In this method, an empirically based probabilistic relationship is used to
model the corrosion short crack growth.
2.2.7 Crack Coalescence
The linkage between any two neighboring cracks is considered to be the failure
criterion at this stage.
2.3 Pitting Corrosion Behavior
Corrosion of metals and alloys by pitting constitutes one of the very major failure
mechanisms. Pits cause failure through perforation and engender stress corrosion
cracks. Pitting is a failure mode common to many metals. It is generally associated
with particular anions in solution, notably the chlorine ion. The origin of pitting is
small. Pits are nucleated at the microscopic scale and below. Detection of the earliest
stages of pitting requires techniques that measure tiny events [24,25].
Stainless steels are used in countless diverse applications for their corrosion
resistance. Although stainless steels have extremely good general resistance, stainless
steels are nevertheless susceptible to pitting corrosion. This localized dissolution of an

29
oxide-covered metal in specific aggressive environments is one of the most common
and catastrophic causes of failure of metallic structures. The pitting process has been
described as random, sporadic and stochastic and the prediction of the time and
location of events remains extremely difficult. Many contested models of pitting
corrosion exist, but one undisputed aspect is that manganese sulphide inclusions play
a critical role.
The chromium in steel combines with oxygen in the atmosphere to form a
thin, invisible layer of chrome-containing oxide, called the passive film. The sizes of
chromium atoms and their oxides are similar; so they pack neatly together on the
surface of the metal, forming a stable layer only a few atoms thick. If the metal is cut
or scratched and the passive film is disrupted, more oxide will quickly form and
recover the exposed surface, protecting it from oxidative corrosion.
The passive film requires oxygen to self-repair; so stainless steels have poor
corrosion resistance in low-oxygen and poor circulation environments. In seawater,
chlorides from the salt will attack and destroy the passive film more quickly than it
can be repaired in a low oxygen environment.
Some metals show preferential sites of pit nucleation with metallurgical
microstructural and micro compositional features defining the susceptibility.
However, this is not the phenomenological origin of pitting per se, since site
specificity is characteristic only of some metals. A discussion of mechanisms of
nucleation is presented; it is shown that the events are microscopically violent. The
ability of a nucleated event to survive a series of stages that it must go through in
order to achieve stability is discussed. Nucleated pits that do not propagate must
repassivate. However, there are several states of propagation, each with a finite
survival probability. Several variables contribute to this survival probability.

30
2.4 Electron Fractography of Fatigue Fracture with Pitting Corrosion
The evolution of corrosion pits on stainless steel immersed in chloride solution occurs
in three distinct stages: nucleation, metastable growth and stable growth. A micro
crack generated by pitting corrosion, forms the initial origin for fatigue fracture. But
in fact, fatigue failure is not certainly caused at the deepest interior pitting depth. Due
to the different shape of interior pitting depths as shown in Figure 2.6, some of them
are hard to start or to continue the crack propagation and play a role of crack arrester,
as shown in Figure 2.7. If the fracture is caused by the pitting depth as an inclusion,
then continuous plastic deformation can be found around the pitting depth[26]. The
dimples are generally equalized by overloaded tension, and elongated by shear or
tearing, as shown in Figures 2.8 and 2.9.
Figure 2.6 Interior pitting depth.

31
Figure 2.7 Fatigue failure arrester at interior pitting depth.
Figure 2.8 Equalized dimples around interior pitting depth.

32
Figure 2.9 Elongated dimples around interior pitting depth.
Figure 2.10 Typical cleavage fractures in fracture area (3000 times).
The features of cleavage failure can be seen by flat fractography as shown in Figure
2.10 and Figure 2.11 with 3000 and 1000 times magnification of Scanning Electron
Microscopy (SEM) images respectively. Cleavage failure occurs by separation along
crystallographic planes. This transgranular fracture is categorized to be the brittle
fracture in the fracture area. There are several features that can be identified to be
cleavage, namely, herringbone, tongues and river stream. Figure 2.12 and Figure 2.13
show the microscopic fractographics of river stream and tongue patterns, which have
been seen in the study. At grain boundaries, the fracture plane or cleavage plane

33
changes because of the differences in crystallographic orientations. Cleavages are not
only associated with transgranular fracture, but also with brittle particles as shown in
Figure 2.14 and Figure 2.15 respectively.
Figure 2.11 Typical cleavage fractures in fracture area (1000 times).
Figure 2.12 River pattern in fatigue propagation area (1500 times).

34
Figure 2.13 Tongue pattern in fatigue propagation area (1000 times).
Some metals can fail in brittle manner, but do not cleave. These fractures are
identified as quasi-cleavage. They are similar to cleavage but their features are usually
fairly flat and smaller, as shown in Figure 2.16 and Figure 2.17.
Figure 2.14 Cleavage with transgranular fracture in fatigue propagation area.

35
Figure 2.15 Cleavage with brittle particles in fracture area.
Figure 2.16 Quasi-cleavage in fracture area (I).
Also the intergranular fracture can occur by a number of causes; but it is generally
possible to be identified fractographically by the features of grain contours, grain
boundaries and triple points. Examples of this kind in intergranular fractures are tree
pattern fracture and sub crack caused by the interior pitting depths, as shown in Figure
2.18 and Figure 2.19.

36
Figure 2.17 Quasi-cleavage in fracture area (II).
Figure 2.18 Tree pattern fracture caused by interior pitting depth.
Figure 2.19 Sub-crack caused by interior pitting depth.

37
2.5 Initial Pitting Depth and Pitting Corrosion Behavior
Pitting corrosion is a localized form of corrosion by which cavities or depths are
produced in the material. Pitting is considered to be more dangerous than uniform
corrosion damage because it is more difficult to detect, predict and design against.
Corrosion products often cover the pits. A small, narrow pit, with minimal overall
metal loss, can lead to the failure of an entire engineering system.
2.5.1 Corrosion Pit Shapes
Pitting corrosion forms on passive metals and alloys like stainless steel when the
ultra-thin passive film is chemically or mechanically damaged and does not
immediately re-passivate. The resulting pits can become wide and shallow or narrow
and deep which can rapidly perforate the wall thickness of a metal.
2.5.2 Pitting Shape by ASTM
Pitting corrosion can produce pits with their mouth open or covered with a semi-
permeable membrane of corrosion products. Pits can be either hemispherical or cup-
shaped. In some cases, they are flat-walled, revealing the crystal structure of the
metal, or they may have a completely irregular shape. Pitting corrosion occurs when
discrete areas of a material undergo rapid attack while most of the adjacent surface
remains virtually unaffected.

38
Figure 2.20 ASTM-G46 has a standard visual chart for rating of pitting corrosion. Source: (http://www.corrosionclinic.com)
2.6 Experiment Pitting Shape
Localized chemical or mechanical damage to the protective oxide film and water
chemistry factors which can cause breakdown of a passive film are acidity, low
dissolved oxygen concentrations and high concentrations of chloride in seawater. The
actual pitting shape was investigated by Scanning Electron Microscopy as shown in
Figure 2.21 and Figure 2.22.

39
Figure 2.21 Pitting depth shape.
Figure 2.22 Pitting depth shape.

40
2.7 Pitting Corroding Rate
The grey systems are the systems that lack information, such as architecture,
parameters, operation mechanism and system behavior, for example, for estimating
the tendency of Typhoon landing in Taiwan [8]. There are a number of factors that
affect the pitting corrosion rate of stainless alloys. The grey correlation analysis
explains uncertain correlations between one main factor and all other factors in a
given system. The grey correlation analysis method is based on the clustering
approach in which the time factor is varied during the experiment period [23].
Figure 2.23 Transgranular fracture at interior pitting depth.

41
Figure 2.24 Intergranular fracture in the fracture area.
2.8 Effect of Temperature
Temperature is also a critical factor in pitting corrosion, because many materials will
not pit at temperature below certain value, which is extremely sharp and reproducible
[36-42]. This effect can be seen either by varying the temperature at a range of fixed
applied potentials or by varying the potential for a range of constant temperature
experiments. Fig. (2.25) is a plot of pitting and repassivation potentials for three
different stainless steels in 1 M NaCl as a function of solution temperature [41-42]. At
low temperatures, extremely high breakdown potentials are observed, corresponding
to transpassive dissolution, and not localized corrosion. Just above the critical pitting
temperature (CPT), pitting corrosion occurs at a potential that is far below the
transpassive breakdown potential. This value of CPT is independent of the
environmental parameters and applied potential over a wide range and is a measure of
the resistance to stable pit propagation [57]. At higher temperatures, the pitting
potential decreases with increasing temperature and chloride concentration. The CPT
can be used, similar to pitting potential, as a means for ranking susceptibility to pitting

42
corrosion; the higher the CPT, the more resistant the alloy is to pitting [57]. If crevice
corrosion is the primary concern, creviced samples can be used to determine a critical
crevice temperature (CCT), which is typically lower than the corresponding CPT, Fig.
(2.26). Aluminum alloys do not exhibit a CPT in aqueous chloride solutions at
temperatures down to 0 °C (32 °F).
Figure 2.25 Pitting and repassivation potentials for three different stainless steels in 1 M NaCl as a function of solution temperature.[19]

43
Figure 2.26 Variation in the critical pitting temperature and critical crevice corrosion temperature.[20]
2.9 Effect of pH
The effect of pH on the breakdown potential has not been much investigated. It is
found with the exclusion of Pourbaix work(43) that the Eb value is almost constant
within a large range of pH values [44-46].
Figure (2.27) shows that iron is thermodynamically immune in neutral and
acid solutions (below line a) when Fe+2 < 10-6 M. The metal goes passive on the right
of line d. Iron does not dissolve at all at pH values between 9 and 13, owing to a
passivating film of Fe3O4 or Fe2O3.

44
Figure 2.27 Pourbaix diagram for iron in water (298 K).[47]
2.10 Effect of Velocity
The attack on metal immersed in water may vary greatly, depending on the relative
velocity between the water and the metal surface. For metals that show passive
behavior or form other protective films in water, as most metals do, attack will occur
where the changes in water velocity are most pronounced. Water corrosivity can be
dramatically increased by dissolved gases, acids, salts, strong bases, entrained
abrasives, high temperature, fluctuating pressure, cavitation, or impingement.
Relative difference in velocity between the metal and the aqueous corrosive
medium influence any of the common varieties of iron or steel, including low-carbon
or high-carbon steel, low-alloy steel, wrought iron, and cast iron. These corrode in
slow-moving freshwater or seawater at almost the same rate, which is about 0.13
mm/year (0.005 in./year). At higher temperatures, with equal values of dissolved gas
concentration, the rate tends to increase, but remains relatively low. Therefore, steel
can be used for boilers in contact with deaerated water. Commercially pure aluminum
typically corrodes less in aerated or deaerated fresh water than iron and carbon steels,
making it a suitable material for handling distilled water [1,6,48].

45
2.10.1 Low Velocity Effects
Slow-moving and stagnant waters can prevent, damage, or remove passive films. The
low velocity allows loosely adherent solid corrosion products to form on metal
surfaces and allows debris to collect, which facilitates further corrosion damage. In
closed systems, if a corrosion inhibitor is used, its effectiveness is often reduced
where the water is stagnant or quiet.
In designing for corrosion control, stagnant zones should be eliminated by the
following methods:
• Circulation of stagnant liquids or relative movement of metallic surfaces
• Allowing free drainage of water
• Filtering suspended solids
• Providing a N2 blanket (carbon steels) or free access to O2 (stainless steels). Weakly passivating metals such as carbon steels are attacked by high O2, whereas strongly passivating metals such as stainless steels are protected by uniform O2 distributions. • Maintaining concentration of dissolved passivating chemicals such as O2 by infusion or injection [6,48].
2.10.2 High-Velocity Effects
Swift-moving water may carry dissolved metal ions away from corroding areas before
the dissolved ions can be precipitated as protective layers. Gritty suspended solids in
water scour metal surfaces and continually expose fresh metal to corrosive attack.
In fresh water, as water velocity increases, it is expected that corrosion of steel
first increases, then decreases, and then increases again. The latter occurs because
erosive action serves to breakdown the passive state.
The corrosion of steel by seawater increases as the water velocity increases. The
effect of water velocity at moderate levels is shown in Fig. (2.28), which illustrates

46
that the rate of corrosive attack is a direct function of the velocity until some critical
velocity is reached, beyond which there is little further increase in corrosion. At much
higher velocities, corrosion rates may be substantially higher. The effect of changes in
water velocity on the corrosion resistance of stainless steels, copper alloys, and nickel
alloys shows much variation from alloy to alloy at intermediate velocities. Type 440
Martensitic stainless steel may pit severely in typical seawater especially when
stagnant and at velocities of less than 1 or 1.5 m/s (4 or 5 ft/s), but is usually very
corrosion resistant at higher velocities. In seawater at high velocity, metals fall into
two distinctly different groups: those that are velocity limited (carbon steels and
copper alloys).and those that are not velocity limited (stainless steels and many nickel
alloys).
Metals that are not velocity limited are subject to virtually no metal loss from
velocity effects or turbulence short of cavitation conditions. The barrier films that
form on these metals seem to perform best at high velocities with the full surface
exposed and clean. Crevices and under deposit form from low-moving or stagnant
seawater because of local breakdown of the film and pitting begins [48-51].
Figure 2.28 Effect of velocity of sea water at atmospheric temperature on the corrosion rate of steel. [48]

47
2.11 Effect of Surface Condition
The exact condition of a surface can have a large influence on the pitting behavior of
a material. In general, samples prepared with a rough surface finish are more
susceptible to pitting and exhibit a lower pitting potential. For example, the pitting
potential of type 302 stainless steel with a 120-grit finish was shown to be
approximately 150 mV lower than that for the same material with a 1200-grit finish
over a range of chloride concentrations [75]. The effect of surface roughness on
pitting is related to the stabilization criteria described subsequently. Rougher surfaces
have more occluded sites, which can sustain the conditions that are required for active
dissolution at lower current densities and thus lower potentials because of the longer
diffusion path length and slower rate of diffusion.
For stainless steels, heat treatment, grinding, and abrasive blasting have been
reported to be detrimental to pitting resistance, whereas pickling in HNO3 + HF scales
or passivation in HNO3 is beneficial [57]. Heat treatments in air generate a chromium
oxide scale and a chromium-depleted region under the scale. The seal is typically
removed mechanically, and the chromium-depleted region is removed by
pickling[57]. Other common surface defects include heat tint from welding,
embedded iron particles from machining, and MnS inclusions. The detrimental effects
of these defects are minimized and the overall-surface condition improved by
passivation in nitric acid, which increases the chromium content of surface oxide film.
The effects of surface condition on localized corrosion are significant enough
that care must be taken not to apply experimental data collected on samples with
special preparation to a real application without taking the surface condition into
account [56].

48
2.12 Evaluation of Pitting Damage
Pitting is a localized type of attack, in which the rate of corrosion is greater at some
areas than at others. If appreciable attack is confined to a relatively small fixed area of
the metal, acting as anode, the resultant pits are described as deep. If the area of attack
is relatively larger and not so deep, the pits are called shallow [2].
Since pitting is a localized form of corrosion, conventional weight loss tests
cannot be used for evaluation of pitting damage because metal loss is very small and
the instrument does not measure it. The depth of pits are complicated by the fact that
there is a statistical variation in the depths of pits. Note that, the average pit depth is a
poor way to estimate pit damage, since it is the deepest pit that causes failure.
Therefore, a measurement of maximum pit depth over time would be a reliable way of
expressing pitting corrosion.
However, once pitting starts, penetration of the metal at an ever increasing rate
will take place. In addition, pits tend to undermine or cut the surface as they grow [1].
Depth of pitting is sometimes expressed by the term (pitting factor). This is the
ratio of deepest metal penetration to average metal penetration as determined by the
weight loss of the specimen. A pitting factor of unity represents uniform attack as
shown in Figure. (2.29). Iron buried in the soil corrodes with formation of shallow
pits, whereas stainless steels immersed in seawater characteristically corrode with
formation of deep pits [2].

49
Figure 2.29 Sketch of deepest pit with relation to average metal penetration and the pitting factor. [24]
2.13 Pitting Resistance Equivalent Number (PREN)
In order to quantify the effect of alloying elements on the pitting resistance of the
stainless steels alloys, Pitting Resistance Equivalent Number (PREN) can be used and
this number can give a good indication of the pitting resistance of stainless steels
based on their compositions. However, PREN cannot be used to predict whether a
particular grade of materials will be suitable for a given application where pitting
corrosion may be a hazard. The most commonly used formula to calculate the PREN
value is [95-98].
PREN = %Cr + 3.3 x %Mo + 16 x %N (2.1)
Other formulas give greater weight to nitrogen, with factor of 27 or 30. But because
nitrogen level is relatively modest in most of stainless steels alloys, this factor does
not have a dramatic effect on ranking. From the formula, it is clear that grades with
high chromium, molybdenum and nitrogen content are more resistant to pitting
corrosion.

50
2.14 Crevice Corrosion
In an electrolyte high in chloride, a confined (occluded) zone linked, for example, to
bad design, favors the accumulation of chloride ions. The progressive acidification of
the medium in this zone facilitates the de-stabilization of the passive layer. When the
pH in this zone reaches a critical value called « depassivation pH »,corrosion starts.
Figure 2.30 Confined zone acidification Figure 2.31 Break in passive layer attack.
Source:https://www.google.com/search?q=google+images+corrosion+steel&source=lnms&tbm=isch&sa=X&ved=0ahUKEwjL5XPjNnTAhUB4yYKHcscBawQ_AUICigB&biw=800&bih=547
Once corrosion is initiated, its propagation occurs by active dissolution of the
material in the crevice. In the laboratory, we simulate this type of corrosion by
recording the potentiodynamic scans in chloride mediums of increasing acidity.
If, on a recording, we detect a current peak (activity), crevice corrosion is
starting; in the opposite case, repassivation takes place. Activity peak measurement
for a pH lower than the depassivation pH can then be considered to quantitatively
compare the speed of crevice corrosion propagation for different grades. This value is
sensitive to the alloy elements which improve the passivation and limit active
dissolution, principally molybdenum, nickel and chromium. The speed of propagation
is also a function of local aggressiveness and temperature of the medium.

51
2.15 Mechanism of Crevice Corrosion
The crevice corrosion mechanism is dependent on several parameters and it may
change accordingly with a change in the parameters. This attack happens in a
restricted area, often a narrow fissure with a width of normally only a few
micrometers. These fissures can occur where there are external agents such as paint
remnants, tape or insulation, that forms a crevice against the pipe surface. The
chemistry within the fissure develops differently from the rest of the bulk solution.
Several mechanisms were proposed for crevice corrosion, since any single
mechanism fails to explain all aspects of crevice corrosion. Here, only
deoxygenation-acidification, also called the passive dissolution mechanism, of
crevice corrosion proposed by Oldfield and Sutton is briefly explained to give an
introduction to crevice corrosion. In fissures, the most common reduction reaction,
which is a requirement in order to introduce crevice corrosion, is the oxygen
reduction reaction. Other reduction reactions may also occur, for example, reduction
by chloride ions. The only reduction reaction at the cathode is the proton ( H+) or
water reduction reaction; in the case where no oxidizing agent is left in the pit, or
depletion of oxygen is called deoxygenation. This is caused by very slow oxygen
diffusion into the crevice and, therefore, a concentration gradient builds up between
the crevice and the outer passive surface of the material. Hydroxide forms in the
crevice in alkaline seawater, causing a rise in the pH. This is the first part of the
initiation phase.
The second step is hydrolysis-acidification, which is directly induced by the
deoxygenation. The depletion of oxygen causes the cathode reaction to move to the
outer passive surface, where oxygen is more easily accessible, while the oxidation of

52
the components of the alloy continues in the crevice. The components in AISI 440
that dissolve are Cr, Fe, Mo and Ni, where the formation of chromium hydroxide
seems to exert the most influence on the pH. The dissolution causes a predominance
of cations; so anions, that is, chlorides, start migrating into the crevice to restore
electro neutrality. These components of the alloy hydrolyze simultaneously
producing protons which lower the pH in the crevice, thereby causing acidification.
The last step in the initiation phase is activation, which is when the critical solution
chemistry is aggressive enough to cause oxide film breakdown. The time until all the
three steps have occurred is normally called the initiation time and is discussed in
this section. There is no attack of the crevice in this phase; the attack occurs in the
propagation phase. The initiation phase consists of the evolution of an aggressive
crevice solution in which a steady state develops and this phase is assumed to occur
much faster than the propagation phase that follows.
The propagation phase that comes after initiation is shown in Figure 2.32. It
can be seen from the graph that the corrosion current rapidly increases. As the
crevice continues to corrode, its growth is directed towards the mouth of the crevice.
It is the IR (I = Current; R = Resistance) drop that limits its growth. The resistance
decreases as the corrosion progresses towards the crevice mouth, causing an increase
in the current. It can be seen from the graph that IR limits the growth. The resistance
decreases as it grows towards the mouth, while the current increases. The anodic
current limit is attained when the growth of the crevice reaches the mouth, and the IR
drop no longer limits the corrosion reaction. The dissolution of metal or the cathodic
reaction at the surface are the limiting factors of corrosion. After a while, the
corrosion rate starts decreasing due to an increased resistance in the solution between
the oxidation of the metal in the crevice and the cathode reaction on the bare surface.

53
The products of corrosion that build up at the crevice mouth are the reason for this
behavior. Another reason that limits the corrosion rate is the cathodic reaction
reducing proton to hydrogen, which increases the pH of the solution.
Figure 2.32 Diagram presenting the corrosion rate of crevice corrosion against time. Source:https://www.google.com/search?q=google+images+corrosion+steel&source=lnms&tbm=isch&sa=X&ved=0ahUKEwjL5XPjNnTAhUB4yYKHcscBawQ_AUICigB&biw=800&bih=547
The Oldfield and Sutton model is criticized due to tests of changes in solution
composition during the initiation stage of crevice corrosion. The three elements
tested were Cr, Fe and Ni. It was shown that Cr does occur in very small amounts
before breakdown of the passive film, compared to the actual amount of Cr in the
alloy. After breakdown, the Cr content increased considerably and the possible
reasons for this were tested. Adsorption and pH drop were evaluated during only one
experiment and thereafter ruled out as possible reasons for the corrosion behavior.

54
Acidification (pH drop) did not occur in the crevice before breakdown, unlike in the
Oldfield and Sutton model and is therefore a result and not a reason for the
occurrence of breakdown. It was concluded from the results that the only possible
reasons could be that the dissolved oxygen developed a surface oxide of chromium,
or that chromium did not dissolve at all.
Figure 2.33 Crevice Corrosion Deep Growth.
Our first recommendation to avoid crevice corrosion is to optimize the design of the
piece to avoid all artificial crevices. An artificial crevice can be created by a badly
made joint, a rough or bad weld, deposits, gaps between two plates etc. If the confined
zone is unavoidable, it is preferable to enlarge this zone and not to make it smaller. If
the design of the pièce is not modifiable or if the fabrication process makes it difficult
to avoid confined zones, the risk of crevice corrosion is very high. We recommend, in
this case, choosing an appropriate grade, in particular a stainless steel austenitic or
duplex phase when the product will be in contact with corrosive media or part of the
process equipment.

55
2.16 Other Types of Corrosion
2.16.1 Intergranular Corrosion
At temperatures greater than 1035°C, the carbon is in solid solution in the matrix of
the austenitic stainless steels. However, when these materials are cooled slowly from
these temperatures or even heated between 425 and 815 °C, chromium carbide
precipitates at the grain boundaries. These carbides have a higher chromium content
in comparison to the matrix.
Consequently, the zone directly adjacent to the grain boundaries is greatly
impoverished. The sensitization state takes place in several environments by
privileged initiation and the rapid propagation of corrosion on the de-chromed sites.
For unstabilized ferritic stainless steels, the sensitization temperature is higher
than 900°C.
In practice, this case of corrosion can be encountered in welded zones. The
solution for the austenitic phase consists of using a low carbon grade called « L »
(Low C%<0.03%) or a stabilized grade, and titanium or niobium stabilized ferritic
grades. The volume of the piece permitting a thermal treatment of the quenching type
(rapid cooling) at 1050/1100°C or a tempering of the welded piece can be performed.
2.16.2 Stress Corrosion
We mean by « stress corrosion » the formation of cracks which start after a period of
long incubation and which, afterwards, can propagate very rapidly and provoke
downtime of the equipment by cracking. This particularly dangerous phenomenon is
the result of the combined effects of 3 parameters:
• temperature, since stress corrosion rarely develops under 50°C
• applied or residual stresses

56
• corrosiveness of the medium: presence of Cl-, H2S
• caustic media NaOH.
Figure 2.34 The metallurgical structure of stainless steels influences their behavior in this type of configuration. [58]
Although stress corrosion of ferritic can be provoked by particularly aggressive tests
in the laboratory, their body cubic centered structure rarely renders them subject to
this type of phenomena in practice. The face cubic centered structure of austenitic
stainless steels can present a risk. In effect, it favors a mode of planar deformation
which can generate very strong stress concentrations locally. As shown in the graph in
Figure 2.36, this is particularly true for classic austenitic stainless steels with 8%
nickel; an increase in nickel above 10% is beneficial. In austenitic stainless steels, the

57
austenitic stainless steels with manganese perform worse. The austeno-ferritic
structure of the duplex gives them an intermediate behavior, very close to the ferritic
in the chloride medium and even better in the H2S medium.
Figure 2.35 Effect of nickel content on the resistance to stress corrosion of stainless steel containing 18-20% chromium in magnesium chloride at 154°C. Source: From a study by Copson [ref]. Physical Metallurgy of Stress Corrosion Cracking, Interscience, New York, 247 (1959). In order to avoid this type of corrosion, the following steps must be taken:
• suppress the stresses or have a better redistribution, by optimizing the design or by a stress relieving treatment after forming and welding of the pieces concerned
• lower the temperature if possible
• if not practicable, choose the grade most adapted, favoring as a solution a ferritic or duplex phase but bearing in mind the other corrosion problems encountered.

58
2.16.3 Uniform Corrosion
This is the dissolution of all the affected points on the surface of the material which
are attacked by the corrosive medium. On the micrographic scale, this corresponds to
a regular uniform loss of thickness or loss of weight (uniform or generalized corrosion
as opposed to localized corrosion). We see this corrosion in acid media. Indeed, below
a critical pH value, the passive layer protecting the stainless steel is no longer stable
and the material suffers a generalized active dissolution. The more acidic the medium,
the faster the corrosion and the loss of thickness of the stainless steel. In the
laboratory, we measure this speed of corrosion in an acid medium by examining the
polarization curve (see Figure 2.37). An increasing potential scan is imposed on the
metal and the corresponding intensity is recorded [58].

59
Figure 2.36 Polarization curve in an acidic medium.
• In a low oxidizing medium, the cathodic curve (M) cuts the anodic curve below the pitting potential; metal remains intact.
• In a strong oxidizing medium, the cathodic curve (B) cuts the anodic curve above
the pitting potential; pits appear on the surface of the metal.
The maximum current reading of the activity peak allows us to classify the resistance
of different grades to this type of corrosion. Generally, the higher the current, the
faster and greater the dissolution, thus the less the grade the higher the resistance.

60
Figure 2.37 Critical current «icrit» at the peak maximum in H2SO4 2M de-aerated at 23°C.
In order to avoid this type of corrosion, appropriate grade is chosen in regard to the
acid medium used. We note the favorable impact of chromium and molybdenum
which reinforce the existing passive film but also the combined effect of the noble
alloys (nickel, molybdenum and copper) which slow down the dissolution of the
material when the stability is passive.

61
CHAPTER 3
STAINLESS STEELS
3.1 Introduction
For years, the food, beverage and pharmaceutical industries have used stainless steels
in their process piping systems. Most of the time, stainless steel components provide
satisfactory results. Occasionally, a catastrophic failure will occur [59].
Stainless steel is not a single alloy, but a large family of alloys with different
properties that are characteristic of the alloys. There are hundreds of grades and
subgrades in the stainless steel family, each designed for a special application.
Chromium is the magic element that transforms iron into stainless steel. Stainless
steel must contain at least 10.5% chromium to provide adequate resistance to rusting,
and the more chromium the alloy contains, the better the corrosion resistance
becomes. There is, however an upper limit to the amount of chromium the iron can
hold. Therefore, additional alloying elements are necessary to develop corrosion
resistance to specific media [1,22,59,60].
Stainless steels are iron based alloys containing a minimum of 12wt %
chromium and up to 25wt % nickel with minor additions of carbon, nitrogen,
molybdenum, tungsten, titanium, niobium, copper and selenium. Stainless steels are a
class of versatile materials, which can be tailored to exhibit a wide range of
engineering properties by alloy design and controlled mechanical treatments to meet
the demanding conditions. This versatility has resulted in an enhanced demand for
stainless steels in a broad variety of applications ranging from small pins to the
construction of automobiles, petrochemical, space, aeronautics, ship building
industries and nuclear power stations. Certain grades of stainless steel, because of

62
their biocompatibility, are used for the manufacture of biomedical implants.
Stainless steel is an alloy of iron. According to its definition, stainless steel
must contain a minimum of 50% iron. If it contains less iron, the alloy system is
named for the next major element. For example, if the iron is replaced with nickel-so
that the iron is less than 50%-then it is called a nickel alloy. Chromium imparts a
special property to the iron that makes it corrosion resistant. When the chromium is in
excess of 10.5%, the corrosion barrier changes from an active film to a passive film.
While the active film continues to grow over time in the corroding solution until the
base metal is consumed, the passive film will form and stop growing. This passive
layer is extremely thin, in the order of 10 to 100 atoms thick, and is composed mainly
of chromium oxide which prevents further diffusion of oxygen into the base metal.
But, chromium is also stainless steel’s Achilles heel, and the chloride ion is stainless
steel’s nemesis. The chloride ion combines with chromium in the passive layer,
forming soluble chromium chloride. As the chromium dissolves, free iron is exposed
on the surface and reacts with the environment forming rust. Alloying elements like
molybdenum will minimize this reaction. [61-63]
Other elements, as illustrated in Table (3.1), may be added for special
purposes. These purposes include: high temperature oxidation resistance, sulfuric acid
resistance, greater ductility, high temperature creep resistance, abrasion resistance, or
high strength. Of all these elements, only chromium is required in order for stainless
steel to be stainless. [62-63]

63
Table 3.1 Stainless steel alloying element and their purpose [64]
Chromium Oxidation Resistance
Nickel Austenite former - increases resistance to mineral acids and
produces tightly adhering high temperature oxides
Molybdenum Increases resistance to chlorides
Copper Provides resistance to sulfuric acid precipitation hardener
together with titanium and aluminum
Manganese Austenite former - combines with sulfur, increases the solubility
of nitrogen
Sulphur Austenite former - improves resistance to chlorides, improves
weldability of certain austenitic stainless steels, and improves
the machinability of certain austenitic stainless steels
Titanium Stabilizes carbides to prevent formation of chromium carbide
precipitation hardener
Niobium Carbide stabilizer - precipitation hardener
Aluminum Deoxidizer - precipitation hardener
Carbon Carbide former and strengthener
3.2 Classification of Stainless Steels
There are five classes of stainless steel: austenitic, ferritic, martensitic, duplex, and
precipitation hardening. They are named in accordance with their microstructure
resemblance to a similar microstructure in steel. The properties of these classes differ
but are essentially the same within the same class. Table (3.2) lists the metallurgical
characteristics of each class of stainless steel [64].

64
Table 3.2 Metallurgical Characteristics [64]
Austenite Non-magnetic Non-hardenable by heat treatment Single phase from 0 (K) to melting point crystallographic form – face centered cubic Very easy to weld
Ferrite Magnetic Non-hardenable by heat treatment crystallographic form - body centered cubic Low carbon grades easy to weld
Duplex Magnetic Non-hardenable by heat treatment Contains both austenite and ferrite Easy to weld
Martensitic Magnetic Heat treatable to high hardness levels crystallographic form – distorted tetragonal Hard to impossible to weld
Precipitation
Hardening
Magnetic Crystallographic form - martensitic with microprecipitates Heat treatable to high strength levels Weldable
Stainless steels can be classified into five main groups in accordance with their
metallurgical structure [19, 33, 34]:
• Austenitic
• Ferritic
• Martensitic
• Duplex (austenite/ferrite) and
• Precipitation-hardening alloy
Schaeffler diagram, as shown in Figure 3-3, is a useful way to determine the likely
structure of a stainless steel. This diagram is based on the presence of ferrite or
austenite in the stainless steel in terms of nickel and chromium equivalents [35].

65
The chromium equivalent (Cr eq.) has been determined using the most common
ferrite forming elements [35]:
Cr eq. = (Cr) + 2(Si) + 1.5(Mo) + 5(V) + 5.5(Al) + 1.75(Nb) + 1.5(Ti) +
0.75(W)
(3.1)
The nickel equivalent (Nieq.) has likewise been determined with the familiar austenite
forming elements:
Ni eq. = (Ni) + (Co) + 0.5(Mn) + 0.3(Cu) + 25(N) + 30(C) (3.2)
In this thesis, the stainless steel alloys, 440, which are considered as martensitic type,
were used. Thus, this group of martensitic stainless steels will be further described.
Figure 3.1 Schaeffler diagram, effect of alloying elements on the basic structure of Cr- Ni stainless steels. [35]

66
3.2.1 Ferritic Stainless Steels
Ferritic stainless steels (FSS) normally contain high chromium content (11 to 30 wt
%), with carbon content in the range of 0.04 to 0.12 wt %. Apart from the basic
elements, other alloying elements are added to ferritic stainless steels to improve the
corrosion resistance or other special properties.
Ferrite stainless steels, because of their low carbon content and high chromium
content, do not undergo the austenite to ferrite transformation, and therefore, they are
not considered for hardening treatment.
3.2.2 Precipitation-Hardening Stainless Steels
Precipitation hardening stainless steels usually contain chromium 10 to 30wt % and
nickel 4 - 7 wt % along with small amounts of molybdenum (1-3wt %). Precipitates in
these alloys are formed by additions of small amount of Cu, Al, Ti and Nb. These
alloys generally have high mechanical strength without significant loss of corrosion
resistance due to the presence of precipitates. These steels are used in various
applications, where high strength along with corrosion resistance are needed.
Precipitation hardening stainless steels can be grouped into three types namely
martensitic, semi-austenitic and austenitic based on their martensitic start and finish
temperatures and the resultant behavior upon cooling from a suitable solution
treatment temperature.

67
3.2.3 Duplex Stainless Steels
Duplex stainless steels are a mixture of ferrite and austenite crystal structures. The
percentage of each phase is dependent on the chemical composition and heat
treatment. Most duplex stainless steels are intended to contain ~ equal amounts of
ferrite and austenite phases in annealed conditions. The primary alloying elements are
Cr, Ni, Mo and N. Duplex stainless steels have similar corrosion resistance to
austenitic stainless steels except that they typically have better stress corrosion
cracking resistance. Duplex stainless steels generally have greater tensile and yield
strengths, but poorer toughness than austenitic stainless steels (Martins et al 2009).
The higher amount of ferrite content in the duplex stainless steels enhances the
resistance to stress corrosion cracking (Fargas et al 2009).
3.2.4 Austenitic Stainless Steels
Austenitic stainless steels are essentially ternary Fe-Cr-Ni alloys containing a
minimum of 16wt % Cr and 7 to 20wt % Ni. They also contain small amounts of Mo
(2-4wt %) and N (0.1-0.2wt %). These alloys are called as “austenite stainless steel”.
since their structure remain austenitic (FCC, -iron type) at all normal heat treated
condition. The most widely used austenitic stainless steels are the 300 series wrought
material (304, 316, 317 etc.) and their cast counterparts (CF8, CF8M, CG8M etc.).
They are widely used in various applications such as nuclear, power plants, petro-
chemical industries and paper-pulp industries. Because of their versatile properties
such as (i) outstanding strength and toughness, (ii) superior corrosion resistance, (iii)
ease of fabrication and iv) good weldability, they are mainly considered for many
engineering applications (Marshal, 1984). However, there are applications in which
they do not have sufficient corrosion resistance in environments containing hot

68
concentrated chlorides and strength at the elevated temperatures, that is, above 400C.
To overcome these problems, alloys with high nickel and high molybdenum contents
have been developed for such high critical applications. Alloy 20 containing high Ni
content is commonly used for these applications (Davison et al 1983).
Over the years, there has been continuous development and improvement of
the austenitic stainless steel grades frequently resulting in higher alloyed variants. The
first step in the sequence of new grades was quite logical to enhance high strength and
resistance to pitting corrosion by increasing the amounts of: (i) molybdenum from 2wt
% to 4wt%, (ii) chromium from 18 to 25wt % and (iii) nickel to 20wt %. For example,
904L grade was one of the first corrosion resistant grades of austenitic stainless steels
developed for petro-chemical industries, which contains normally 4-5wt % Mo and
0.2wt % N. Subsequently, alloys with higher amounts of Mo content (6.5wt %) were
developed to improve the resistance to crevice and pitting corrosion in chloride (3000
ppm) environments (Mats Liljas 1995). Increasing Mo content to ASS is represented
somewhat of a technical challenge on the high alloyed austenitic stainless steel,
because higher amount of Mo content promotes intermetallic phases at various
temperatures (Maurer et al 1982). In the late 1970s, Avesta developed a high alloyed
steel of 254 SMO with high amount of Mo (6.5wt %) and N (0.25wt %). This high
nitrogen content permits high Mo content (about 6wt %) for the production of
austenitic stainless steel over a wider range of section thicknesses and with excellent
response to most types of welding (Wallen et al 2001). The direction of further
developments in stainless steels is clearly the usage of nitrogen for its own merits and
for its stability to permit higher chromium and molybdenum additions (Speidel 1991).
Recently, a major advancement that has taken place in austenitic stainless steel
is the Avesta 654 SMO grade with increased Mo (7wt %) and nitrogen (0.3wt %)

69
contents. In this steel, the addition of higher amount of nitrogen (0.5wt % N) to SASS
provides a significant increase in: (i) strength, (ii) toughness, (iii) pitting resistance
and (iv) resistance to crevice corrosion. These enhanced properties of high alloyed
SASS are achieved by the addition of appropriate combination of Cr, Mo and N
(Speidel 1991). These steels offer a chloride resistant stainless steel that approaches
the resistance of some nickel-based alloys (Wallen et al 2001).
Fig 3.2 Austenitic Stainless steel family. Source: www.asminternational.org

70
3.2.4.1 316 Austenitic Stainless Steel
The processing industries are experiencing unexpectedly short service life with
equipment and piping fabricated from 316L stainless steel. It is speculated that the
alloy is being produced with concentrations of chromium, nickel and molybdenum at
the low end of the range specified for the 316L stainless steel. Consequently, the
present 316L alloy is less resistant to corrosion, particularly to crevice corrosion. The
situation raises several questions. How aware is the steel industry of the uncertainty
with respect to the 316L alloy? Would simply increasing the concentration of
molybdenum in the alloy, to the high end of the specified range, improve the
resistance to localized corrosion? Is it possible to produce a 316L stainless steel (a
“new” alloy) with the highest specified concentrations of chromium, nickel and
molybdenum to obtain performance equivalent to the earlier 316L alloy? Assuming
that sanitary tubing and the associated fittings in this “new” alloy became readily
available, does it represent a cost effective alternative to the 904L, 2205 and AL6XN
alloys? There is a concern in the processing industries, particularly in the food
industry, that a significantly shorter service life is presently obtained from the 316L
stainless steel equipment and piping. Industries use stainless steels to meet the
standards that have been established for sanitary or hygienic processes, e.g., “3-A
Accepted Practices for Product and Solution Pipelines.” The austenitic stainless steels,
304, 304L, 316 and 316L, have become the workhorses of the food, beverage and
dairy industries, representing a highly versatile and cost effective choice for the
fabrication of process systems.
All stainless steels contain iron and chromium, with other elements such as
nickel, manganese, molybdenum nitrogen and copper, introduced to further modify

71
the physical properties of the material. Advances in the techniques used in the
manufacture of stainless steels have resulted in cleaner, purer products, the
compositions of which can be closely controlled. Chromium imparts unique corrosion
properties to the stainless steel, properties that are significantly different from those of
carbon steels, low alloy steels and cast iron. For example, at concentrations of
chromium above 11% by weight, the rate of general corrosion of a stainless steel is
practically negligible. This corrosion resistance is attributed to the formation of a thin,
passive film, generally considered to be chromium oxide, at the surface of the
stainless steel. The addition of nickel stabilizes the austenite crystal structure in the
steel, making it more weldable, less brittle and easier to shape and bend than the other
crystal structures in which a stainless steel may exist. Manganese also stabilizes the
crystal structure of the stainless steel and this metal is frequently used as a partial
substitute for nickel. Molybdenum and nitrogen both enhance the resistance to pitting
and crevice corrosion and nitrogen also tends to stabilize the austenite crystal
structure. The carbon content of 304L, 316L and 317L stainless steels is specified to
be 0.03% (maximum), reduced from 0.08% in the 304,316 and 317 steels. This is
important since carbon reacts to form chromium carbide during annealing, welding
and forming processes and the presence of carbide at grain boundaries leads to the
onset of intergranular corrosion when the alloy is in service.
The concentrations of carbon, chromium, nickel and molybdenum in the
stainless steels, that are used extensively in the fabrication of process equipment,
process piping and process systems, are summarized in Table 3.4.

72
Table 3.3 The Composition of Stainless Steel
SS Carbon Chromium Nickel Molybdenum Manganese Nitrogen
Copper
304 0.08 18-20 8-15 --- 2 --- ---
304L 0.03 18-20 8-15 --- 2 --- ---
316 0.08 16-18 10-14 2-3 2 --- ---
316L 0.03 16-18 10-14 2-3 2 --- ---
317 0.08 18-20 11-15 3-4 2 --- ---
317L 0.03 18-20 11-15 3-4 2 --- ---
904L 0.02 19-23 23-28 4-5 --- --- 1.5
AL6XN 0.03 20-22 25 6-7 0.4 0.2 0.2
2205 0.03 21-23 4.5-6.5 2.5-3.5 --- 0.15 ---
The alloys also contain 0.03% sulfur, 1% silicon, 0.045% phosphorus, with the
balance being iron.
All the alloys have the austenitic crystal structure, except for 2205, which
contains both austenitic and ferritic structures and is referred to as a duplex alloy.

73
3.3 Martensitic stainless steels
Martensitic stainless steels (MSS) are essentially alloys of chromium (12-16wt %)
and carbon (0.06-0.15wt %) that exhibit martensitic structure of body centered
tetragonal (BCT) crystal in the hardened condition. They are ferromagnetic,
hardenable by heat treatment and they are generally less resistance to corrosion than
some other grades of stainless steels. Elements such as niobium, silicon, tungsten, and
vanadium can be added for MSS to modify the tempering response after hardening.
Small amounts of nickel may also be added to improve the toughness. Sulfur or
selenium is added to some grades to improve the machinability. Based on ASTM
standards, the grades of martensitic stainless steels are referred as A410, A420, etc.
Martensitic stainless steels are specified when the application requires good tensile
strength, creep and fatigue strength in combination with moderate corrosion resistance
and heat resistance up to approximately 650oC. Martensitic stainless steels are also
used in petrochemical equipment, stream turbine, gas turbine, etc., (Davis 1996).

74
Figure 3.3 Martensitic Stainless Steel Family. (Davis 1996).
3.3.1 440 Martensitic Stainless Steel
Type 440 Stainless Steel, known as “razor blade steel,” is a hardenable high-carbon
chromium steel. When subjected to heat treatment, it attains the highest hardness
levels of any grade of stainless steel. Type 440 Stainless Steel, which comes in four
different grades, 440A, 440B, 440C, 440F, offers good corrosion resistance along
with abrasion resistance. All grades can be easily machined in their annealed state;

75
they also offer resistance to mild acids, alkalis, foods, fresh water, and air. Type 440
can be hardened to Rockwell 58 hardness.
Stainless steels are high-alloy steels which have high corrosion resistance
compared to other steels due to the presence of large amounts of chromium. Based on
their crystalline structure, they are divided into three types such as ferritic, austenitic,
and martensitic steels. Another group of stainless steels are precipitation-hardened
steels. They are a combination of martensitic and austenitic steels.
Grade 440 stainless steel is a high carbon martensitic stainless steel. It has
high strength, moderate corrosion resistance, and good hardness and wear resistance.
Grade 440 is capable of attaining, after heat treatment, the highest strength, hardness
and wear resistance of all the stainless alloys. Its very high carbon content is
responsible for these characteristics, which makes 440 particularly suited to
applications such as ball bearings and valve parts [65].
Corrosion resistance implies good resistance to the atmosphere, fresh water,
foods, alkalis and mild acids; best resistance in the hardened, tempered and passivated
condition. A smooth polished surface also assists in improving corrosion resistance.
The corrosion resistance of grade 440C approximates that of grade 304 in many
environments.
Heat resistance implies not recommended for use in temperatures above the
relevant tempering temperature, because of reduction in mechanical properties by
over-tempering.
Thanks to the outstanding properties of each of the grades, all grades of Type 440
Stainless Steel can be found in a number of products including:

76
• Pivot pins
• Dental and surgical instruments
• High quality knife blades
• Valve seats
• Nozzles
• Oil pumps
• Rolling element bearings
Each grade of Type 440 Stainless Steel is made up of a unique chemical composition. It should be noted that the only major difference between the grades is the level of carbon.
Type 440A
• Cr 16-18%
• Mn 1%
• Si 1%
• Mo 0.75%
• P 0.04%
• S 0.03%
• C 0.6-0.75%
Type 440B
• C 0.75-0.95%
Type 440C and 440F
• C 0.95-1.20%
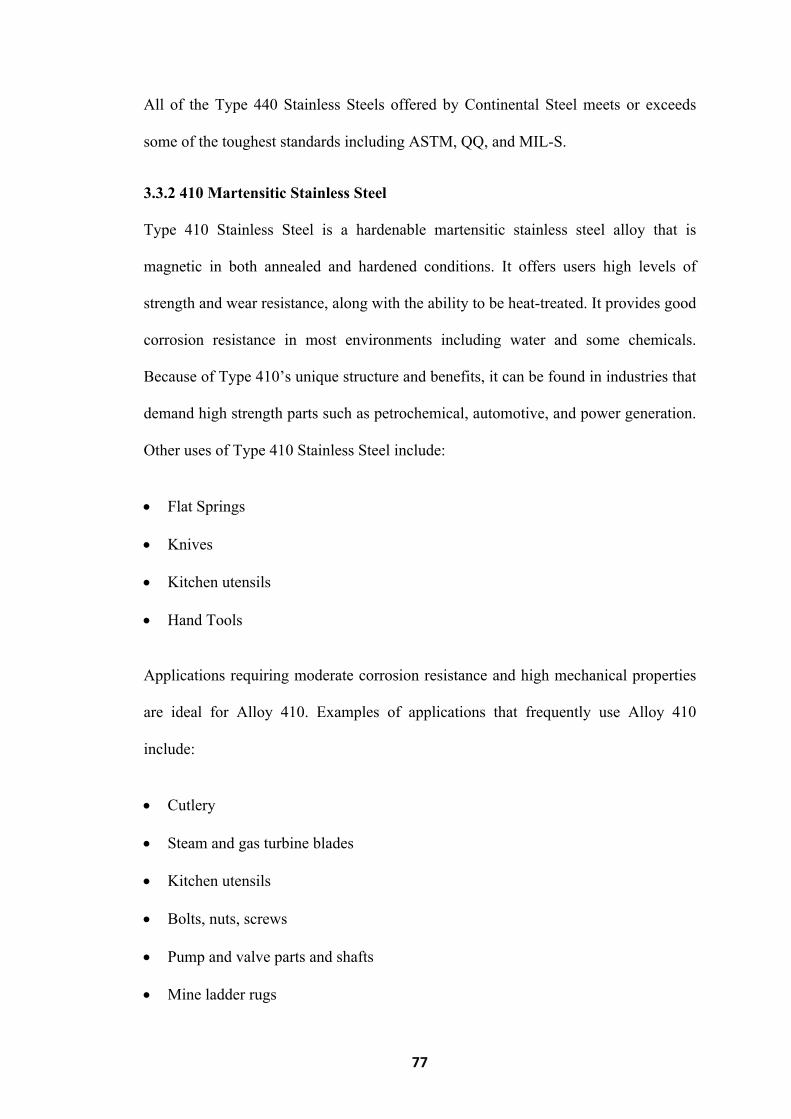
77
All of the Type 440 Stainless Steels offered by Continental Steel meets or exceeds
some of the toughest standards including ASTM, QQ, and MIL-S.
3.3.2 410 Martensitic Stainless Steel
Type 410 Stainless Steel is a hardenable martensitic stainless steel alloy that is
magnetic in both annealed and hardened conditions. It offers users high levels of
strength and wear resistance, along with the ability to be heat-treated. It provides good
corrosion resistance in most environments including water and some chemicals.
Because of Type 410’s unique structure and benefits, it can be found in industries that
demand high strength parts such as petrochemical, automotive, and power generation.
Other uses of Type 410 Stainless Steel include:
• Flat Springs
• Knives
• Kitchen utensils
• Hand Tools
Applications requiring moderate corrosion resistance and high mechanical properties
are ideal for Alloy 410. Examples of applications that frequently use Alloy 410
include:
• Cutlery
• Steam and gas turbine blades
• Kitchen utensils
• Bolts, nuts, screws
• Pump and valve parts and shafts
• Mine ladder rugs

78
• Dental and surgical instruments
• Nozzles
To be sold as Type 410 Stainless Steel, an alloy must have a certain chemical
composition, which includes:
• Cr 11.5-13.5%
• Mn 1.5%
• Si 1%
• Ni 0.75%
• C 0.08-0.15%
• P 0.040%
• S 0.030%
Continental Steel offers high-quality Type 410 Stainless Steel in a wide range of sizes
and shapes including coils and cut lengths. As with all the stainless steel supplied by
Continental Steel, their Type 410 meets all the toughest industry specifications
including AMS, and ASTM.
General Properties: Alloy 410 is the basic, general purpose martensitic stainless
steel that is used for highly stressed parts and provides good corrosion resistance plus
high strength and hardness. Alloy 410 contains a minimum of 11.5% chromium which
is just sufficient enough to demonstrate corrosion resistance properties in mild
atmospheres, steam, and many mild chemical environments. It is a general purpose
grade that is often supplied in the hardened but still machineable condition for
applications where high strength and moderate heat and corrosion resistance are

79
required. Alloy 410 displays maximum corrosion resistance when it has been
hardened, tempered, and then polished [65].
Specifications: UNS S41000
Standards
• ASTM/ASME: UNS S41000
• EURONORM: FeMi35Cr20Cu4Mo2
• DIN: 2.4660
Corrosion Resistance
• Good corrosion resistance to atmospheric corrosion, potable water, and to mildly corrosive environments
• Its exposure to everyday activities (sports, food preparation) is generally satisfactory when proper cleaning is performed after exposure during use.
• Good corrosion resistance to low concentrations of mild organic and mineral acids [65].
3.4 Corrosion of Stainless Steel
3.4.1 Introduction
Harry Brearley of the Brown-Firth research laboratory in Sheffield, England is
credited as inventing stainless steel in 1913, [27]. Stainless steel alloys are commonly
used as construction materials for key rust-resistant components in most of the major
industries: chemical, construction, petroleum, power, process, etc.
Stainless steel is a general term for a large group of corrosion resistant alloy
steels. These stainless steels are iron-based alloys containing at least 11wt%

80
chromium [16]. This amount of chromium gives the stainless steel the ability to form
a protective or passive film that resists corrosion. This protective film is self-forming
and self-healing and this makes stainless steel resistant to corrosion [28]. The stability
of the passive film is enhanced by increasing the chromium content [29]. At about
10.5% chromium, a weak film is formed and will provide mild atmospheric
protection. By increasing the chromium to 17-20%, which is a typical concentration in
type 440 series of martensitic stainless steels, the stability of the passive film is
increased and therefore more corrosion resistance is gained. However, stainless steels
cannot be considered to be 100% corrosion resistant. The passive state can be broken
down under certain conditions and corrosion can result [30].
As stated above, stainless steel has a good corrosion resistance, but is not
resistant to corrosion in all environments and might suffer from certain types of
corrosion in some media. Corrosion of stainless steels can be categorized as one of:
crevice corrosion, general corrosion, inter-granular corrosion, pitting corrosion, stress
corrosion cracking and/or galvanic corrosion [48].
General and pitting corrosion are the most likely types of corrosion and most relevant
to our present study; so further information about these two types of corrosion will be
described in this thesis. The general corrosion is a uniform attack and is the most
commonly encountered type of corrosion. It is characterized by a chemical or
electrochemical reaction which proceeds uniformly over the entire surface of the
exposed material. This general corrosion happens where none of the alloying elements
in the material could form a protective layer and normally this is the case during the
active and transpassive dissolution of materials [49]. Thus, the metal becomes thinner
and eventually fails. The general corrosion of stainless steels normally occurs in acids
and hot caustic solutions, and corrosion resistance of the stainless steel usually

81
increases with increasing levels of chromium, nickel and molybdenum. Moreover,
other alloying elements are added to the stainless steel alloys to modify their structure
and enhance properties such as formability, strength and cryogenic toughness. Further
information about the effects of alloying elements will be covered in the next section.
3.4.2 Effects of Alloying Elements
The properties of metals can be modified by adding alloying elements. In this way,
the properties of stainless steel can be adapted so that it can be used in specific
environments. In the following section, brief information about the benefits of each
ingredient added to stainless steel is presented [31]:
Chromium: is the main element that improves the corrosion resistance of the alloy by
forming a passive film on the surface. Chromium provides resistance to oxidizing
environments and resistance to pitting and crevice attack. Other elements in the alloy
can influence the effectiveness of chromium in forming or maintaining the surface
film.
Nickel: is added to stabilize the austenitic structure of the stainless steel and enhance
the mechanical properties and fabrication characteristics. Nickel also promotes re-
passivation if the film is damaged.
Molybdenum: next to chromium, molybdenum provides the largest increase in
corrosion resistance in stainless steel. Molybdenum, in combination with chromium,
is very effective in stabilizing the passive film in the presence of chlorides. It is
effective in preventing crevice or pitting corrosion.

82
Manganese: also stabilizes the austenite. In association with nickel, it performs many
of the functions attributed to nickel but by substituting manganese for nickel, and then
combining it with nitrogen, strength is also increased.
Nitrogen: It is used to stabilize the austenitic structure of stainless steel. It enhances
the resistance of stainless steel to pitting and crevice corrosion especially in the
presence of molybdenum [32].
Carbon: it increases the strength of steel and is considered as a very strong
austenitizer. In low carbon grades stainless steels, carbon is kept in 0.005% to 0.03%
level to maintain the desired properties and mechanical characteristics. Carbon can
combine with chromium forming chromium carbide precipitation usually at grain
boundaries. This may have a negative effect on corrosion resistance by removing
some of the chromium from solid solution in the alloy and, as a result, reducing the
amount of chromium available to ensure corrosion resistance [31].
Titanium and Niobium: They are used to reduce the sensitization of stainless steel to
reduce the possibility of inter-granular corrosion when the stainless steel is welded or
heat treated. Titanium and niobium interact with carbon to form carbides, leaving the
chromium in solution so that a passive film can form.
Copper and Aluminum: These materials, along with titanium, can be added to
stainless steel to precipitate its hardening. These elements form a hard intermetallic
microstructure during the soaking process at an elevated temperature.

83
Silicon: It is added to some alloys for high temperature oxidation resistance. Figure 3-
5 summarizes how these elements can influence the corrosion behavior of stainless
steel [33].
Figure 3.4 Schematic summary of the effects of alloying elements on the anodic polarization curve of stainless steel [33].

84
3.5 Corrosion by Acetic Acid
3.5.1 Introduction
Acetic acid (CH3COOH) is one of the most important intermediates and the most
frequently used carboxylic acid. When pure, acetic acid is a clear, colorless liquid
with the smell of vinegar. At ambient temperature, 25oC, pure acetic acid boils at
118oC and its freezing point is only slightly below room temperature at 16.7oC [99].
Acetic acid is classified as a weak acid, because it does not completely
dissociate into its component ions when dissolved in aqueous solution [100]. Acid
dissociation constant (Ka) is a quantitative measure of the strength of the acid in
solution. It is equal to the concentration of the products divided by the concentration
of reactants. For acetic acid, it can be written as:
CH3COOH (aq) → CH3COOH-(aq) + H+ (aq) (3.3)
Ka = [CH3COO] * [H+] / [CH3COOH] (3.4)
The acid dissociation constant (Ka) value for acetic acid is 1.8 Å~ 10-5 (mol/L) at
25oC.
3.5.2 Corrosivity
In general terms, carboxylic acid aggressiveness increases with decreasing number of
carbon atoms in the alkyl chain [101, 102]:
C4H9COOH < C3H7COOH < C2H5COOH < CH3COOH < HCOOH (3.5)

85
Usually, acetic acid is not considered to be a highly aggressive medium; however, it
can severely attack most materials at higher temperatures, near its boiling point, upon
aeration and if it contains impurities, for example oxidizing agents, chlorides, formic
acid or acetic anhydride [33].
In acetic acid systems, steel is attacked quite rapidly at all concentrations and
temperatures and is normally unacceptable for use in acetic acid environment. Also,
field experience with the 400 series stainless steel group indicates high rates of
corrosion and pitting attack [103].
The 440 stainless steel alloy is most commonly used in equipment for
processing acetic acid. However, the behavior of this alloy is greatly affected by
impurities in the acid. Contamination with chloride ions can cause pitting, rapid stress
corrosion cracking and accelerated corrosion of 440 stainless steel [104]. Similar to
chloride, the presence of other halides such as bromide (Br) in the acetic acid
environment may lead to corrosion problems for stainless steel alloys [105]. A
number of field failure investigations and laboratory studies, carried out on 440
stainless steel type, in acetic acid environments have been reported in the open
literature.
Sekine et al. [106, 107] worked extensively on the corrosion behavior of
stainless steels in different concentrations of acetic acid. They concluded that the
corrosion rate depends markedly on concentration, temperature, solution conductivity,
water and oxygen content. It was found that 316 stainless steel had sufficient
corrosion resistance at room temperature in each acid concentration. In boiling acetic
acid, a maximum corrosion rate of 0.09 mm/year was measured for the 316 stainless

86
steel and this was in 90 vol. % acid concentrations. Also, they concluded that
chromium and molybdenum mainly contribute to corrosion resistance in aqueous
solution, while nitrogen contributes only slightly. In the presence of aggressive ions
such as chloride and bromide in acetic acid environments, Ashiru et al. reported
severe pitting corrosion problems in terephthalic acid production plant [108]. The
materials of construction were 316L stainless steel and 2205 duplex stainless steel. It
was concluded that pitting corrosion was caused by process upset and the presence of
aggressive chloride contaminant in the acetic acid media. Also, Li et al. [109] reported
relatively serious intergranular corrosion and pitting in 316L stainless steel packing of
a solvent recovery tower in a terephthalic acid plant. Inter-granular corrosion attack
was due to the lack (depletion) of chromium in the grain boundaries while the pitting
problem was caused by the damage to the local passivation film due to the presence of
bromide ions in the acetic acid solution.

87
CHAPTER 4
CARBON STEEL CORROSION
4.1 Introduction
The high cost of corrosion affects numerous industries, domestic applications and
public sectors worldwide and highlights the need for improved corrosion resistance
measures. Effective corrosion inhibition has a high economic value as the annual
corrosion cost is estimated to reach 3–4% GDP in developed countries.[59] In oil, gas
and chemical industries alone, corrosion is one of the most challenging tasks, and it is
assumed that it costs 170 billion USD per year.[60,61] It is not only the high cost of
corrosion, but also the health and environmental risks associated with potential failure
of the oil and gas equipment that drive the developments of corrosion resistant
materials and improved corrosion mitigation strategies worldwide. Low-cost carbon
steels are used as the preferred construction material across industries and are
considered the more economical option than the costly corrosion resistant alloys.
Carbon steels typically contain less than 1.5% carbon content along with the minute
presence of Mn, Si, P and S. Based on the percentage of carbon, the classification is
further divided into three forms, namely low carbon steels (<0.25% C), medium
carbon steels (0.25–0.70% C) and high carbon steels (0.70– 1.05% C). Variation in
the percentage of carbon content allows to attain different mechanical properties such
as strength, ductility, hardness, etc. Based on the steel properties, related to carbon
content, plain carbon steels are further divided into certain grades, such as grade 1008
(0.08wt% C), which is good for forming and has good ductility; grade 1018 (0.18wt%
C); it is useful for general applications and good for welding; grade 1030 (0.30wt%

88
C), which has low hardenability; grade 1045 (0.45wt% C), which has applications in
power transmission and shafting; and X-65, which is a seamless grade and weldable.
Carbon steels are used in a wide range of applications, such as structural
components, industrial pipes, and kitchen appliances. With regard to applications in
the oil and gas industry, the two major forms of corrosion are carbon dioxide (CO2)
corrosion, which is also known as sweet corrosion, and hydrogen sulphide (H2S)
corrosion, which is most commonly known as sour corrosion. Among these two, CO2
corrosion has attracted a lot of attention to researchers since 1949 because oil wells
normally contain CO2.
Carbon steels, in general, are susceptible to corrosion under the conditions at
industrial operations and high levels of corrosion inhibition are important for safe and
cost-effective operations that extend the limits of use of carbon steels alone. In oil and
gas industries, corrosion inhibition can occur naturally through crude oils due to the
presence of certain chemical species such as nitrogen, sulphur, aromatic resins, etc.
[66,67] The most utilized corrosion inhibition measure is however the use of organic
or inorganic inhibitors that protect the steel surface by forming a protective film of a
passive nature.[68] Corrosion inhibitors typically contain nitrogen, sulphur and
oxygen, and hydrophobic hydrocarbon chains in their structures. Corrosion inhibitors
adsorb on the steel surface (either through physical or chemical adsorption) and
change the surface and interface free energies. It is postulated from earlier studies that
inhibitors alter the wettability of a surface. [69] Physical adsorptions is an
electrostatic change whereas chemical adsorption occurs through a bond formation by
sharing an electron. As the use of inhibitors for preventing corrosion of carbon is
often the most economical option, it is of significant interest to the industry to define
the application limits of film forming corrosion inhibitors. Commercial inhibitor

89
formulations virtually never use a single molecule due to the observed synergistic
effects that enhance their performance. However, there is no clear explanation in the
open literature as to how chemical components of the corrosion inhibitor formulations
self-assemble on metal surfaces to protect synergistically against corrosion. Most
importantly, the formation of corrosion-protective films is expected to be strongly
affected by the nature of the metallic substrate, i.e. carbon steel. It is clear that a
definition of limits and potential extension of the use of carbon steels in different
corrosive environments is only achievable with a detailed understanding of the
mechanisms of carbon steel corrosion and its inhibition. This review therefore focuses
on the importance of texture, surface morphology, surface energy and defects for the
corrosion of carbon steels. We discuss in detail the methods of analysis of carbon
steel surfaces under corrosive conditions, and in the absence and presence of
corrosion inhibitors. In particular, we assess the applicability and limitations of
analytical methods that have been utilized on carbon steels; and those that have been
applied to other metallic substrates, but could have potential applications for studies
on carbon steel substrates.
4.2 Role of Texture in Corrosion of Carbon Steels
Surface texture, also addressed as preferred orientations, is one of the important
parameters investigated in relation to corrosion. Surface texture develops in alloys and
metals during their mechanical deformation such as rolling, forging, drawing, etc. and
the established preferred orientations can introduce significant changes to the material
properties, including changes in friction and wear properties. Besides mechanical
deformation, texture development can also occur during phase transformation,

90
recrystallization, grain growth, etc. [70,71] Surface texture can also be associated with
special morphology and roughness of the surface, but this review uses the term
surface texture with relation to crystallographic orientation. The importance of texture
in corrosion investigations lies in its relation to corrosion resistivity of the materials. It
is an established fact that the activation energy for dissolution of a densely packed
surface is higher than that of a loosely packed surface. The opposite effect is known
for surface energy, with a dense plane having a lower surface energy than a loosely
packed surface. It is expected that dense planes dissolve at relatively slow rates
compared to the low dense (loose) planes. [72] It has been established that crystals
that are oriented towards low surface energy (i.e. highly dense planes) can result in
increase in corrosion resistance [73].
Texture is also important for welded structures as crystallographic orientation
and crystallite interface are strongly correlated with corrosion resistance. The
microstructural difference in the weld nugget and the surrounding area, due to
precipitation, affects the texture of the steel through microstructural gradient
generation. As many failures in the industry are related to the corrosion at welded
areas, it is highly desirable to understand and examine the texture at weldments in
corrosion investigations. [74,75] Similarly, texture is an important parameter in
surface chemical reactions as highly textured crystal faces promote the solid–liquid
interfacial reactions. [75,76] The significance of texture in corrosion has been proven
by numerous researchers. This thesis focuses on establishing the role of texture in
corrosion behavior of carbon steels in corrosive environments.
Bateni et al. [79] investigated the effect of carbon-steel texture on the corrosion
process. Under corrosive conditions, the fiber texture and cube texture developed,

91
which was different from the texture developed in dry wear test, i.e. Goss texture and
gamma fiber. In a corrosive environment, NaCl behaves as a lubricant and develops a
different orientation distribution function (ODF) by reducing the metallic contact. It is
noticed that the same load (9.6 N) applied for dry wear test and the test under
corrosive media depicted different ODF. It was stated that shear stress reduction leads
to less shear texture formation and resulted in the disappearance of Goss and brass
texture in corrosion wear situation. This is due to NaCl acting as a lubricant and
reducing frictional force. It was also observed that the weight loss rate under corrosive
wear condition was lower than the dry wear condition because of the same lubrication
formation by NaCl.
Recently, Baik et al.[80] studied sulphide stress corrosion cracking of carbon steels
with the help of strain rate measurement and found strong correlation between
sulphide stress corrosion cracking and strain rate test results, which is indirectly
related to the surface texture. This is because the movement of dislocations is easier at
a certain plane of crystals, known as dense pack plane ((111) (for FCC metals with
high atomic density) in BCC iron. This is in agreement with an earlier study showing
that pit initiation occurs in sequence of (110) > (100) > (111) whereas pit propagation
takes place in the following order (100) > (110) > (111). [24]
Texture generation can be influenced by numerous factors, such as impurities,
stacking fault, inherently stored deformation energy, casting and rolling conditions,
grain size and shape, grain boundary angle, shear bending, precipitation. Rabbe et al.
[84] observed cube type fiber orientation in low carbon steels and showed that active
slip system steel which got hot rolled in the austenitic regime shows random
austenitic texture and texture gradient across the thickness, and undergoes

92
recrystallization due to low stacking fault energy. It has been observed that Si and Cr
affect the texture in terms of the generation of alpha fiber.
Park et al. [81] investigated corrosion of steels samples, alloyed with Cu and Sb,
under aggressive corrosion environment (16.9 vol% H2SO4 and 0.35 vol% HCl at 60
°C, pH 0.3). The authors compared corrosion properties of the steels formed by hot
rolling and cold rolling. The interesting facts revealed by this study were that the
corrosion rate of cold rolled steel was higher than the hot rolled steel. This study again
proved the importance of mechanical deformation in corrosion behavior of steels as
well as alloys. This was linked closely with the texture of steel as in cold rolled steel,
the grain refinement and orientation were the key factors for corrosion. [85] It was
observed that a large number of grains were oriented with {001} along with {101}
and {111} in cold rolled steel whereas in the case of hot rolled steel {111}
crystallographic orientation, it was found dominant along with {101} and {001}.
Lower corrosion resistance of cold rolled steel compared to hot rolled steel is related
to the high surface energy in {100} direction as low surface energy plane offers slow
dissolution rate of atoms due to its closed atomic packing and results in high corrosion
resistance.
Figure 4.1 Effect of Chromium content on Corrosion Rate.

93
It has been demonstrated that deformation conditions, such as hot rolling and
cold rolling parameters, affect the texture development in steel. Rolling schedule,
rolling temperature, reheating time and temperature, etc. are some of the important
parameters to consider for texture development. Texture varies over the entire
thickness of the specimen
Cold rolled low carbon steel was studied by Xu et al. [82] with four different
microstructures, namely ferritic, acicular ferritic, coarse polygonal ferritic and
bainitic. All specimens were cold rolled and annealed in the temperature range of
853–953 K. Polygonal ferrite exhibited string texture along {223} <110>, similarly
acicular and bainitic showed string texture along {001} <110> and during annealing,
all samples exhibited fibrous texture ({111} <uvw>) (with 70–90 reduction). This
study elucidated the importance of microstructure and deformation condition with
texture.
The deformation procedure affects corrosion such as in cold rolled steel,
showing low corrosion resistance due to externally applied tension as well as due to
texture. Cold deformation often introduces deformation twinning and dislocation
arrays, which are accepted as one-dimensional crystal defects. The defects generated
on the surface during cold deformations may be more important than texture for cold
rolled steels. Cold worked stainless steel (316 type) exhibits high diffusivity for Cr
and easy carbide nucleation by offering low free energy barrier. Earlier explanations
in this section have already established the relationship between the deformation
process with texture and corrosion resistance. [83]

94
Figure 4.2 (a) Comparison of the corrosion rates of cold and hot rolled steel by
weight loss (WL), potentiodynamic polarization (PD) and electrochemical impedance
spectroscopy (EIS) measurements; (b) comparison of weight loss measurements for
cold and hot rolled steel after 6 h immersion in 16.9vol% H2SO4 and 0.35vol% HCl
solution at 60 _°C (pH-0.3).
Deformation conditions also affect stacking fault energy. This is responsible for the
change in the phase stability and phase transformation. Volume fraction and
distribution of phases are other specific parameters that affect the corrosion properties
of steels.
The importance of phases in the structure of carbon steels is further
highlighted by their effect on the inhibitor applications for enhanced corrosion
resistance. Oblonsky et al. [86] explained the importance of phases in the inhibitor
molecules’ attachment to carbon steel, showing that octadecyldimethyl
benzylammonium chloride (ODBAC) attached to ferritic–pearlitic microstructures
through physical adsorption, but did not adsorb to the martensitic phase in the carbon
steel.

95
Naderi et al. [87] studied the effect of inhibitors on differently heat treated steels and
found slightly lower corrosion in pearlitic steel due to the protective oxide film
formation compared to martensitic steel in 1 M HCl solution, whereas in the presence
of inhibitors N,N'-ortho-phenylen acetyle acetone imine (S1) and 4-[(3-{[1-(2-
hydroxy phenyl)methylidene]amino}propyl)ethanemidol]- 1,3-benzenediol (S2),
pearlitic steel exhibited better adsorption of inhibitors than martensitic steel.
The effect of texture on inhibitor adsorption could be very useful to study in
the near future as Herrera et al. [88] have shown that heat treatment affects texture
evolution. It was observed that cold rolling with large thickness reduction changed the
texture of steel (SAE 1050) such as gamma <111>//ND, alpha <110>//RD and gamma
prime <223>//ND, whereas after annealing with 50 and 80% reduction, gamma and
gamma prime were completely invisible. As explained earlier, heat treatment affects
the corrosion resistance and this could be related to texture evolution and the
adsorption of inhibitors might be influenced by certain specific textures. This
highlights the need for extensive investigations in this area in order to get deep
insights into the mechanism of corrosion inhibitor adsorption.
Kandeil et al. [89] investigated the effect of surface texture on corrosion behavior of
carbon steel and developed a regression equation for corrosion potential and
polarization potential, correlating the corrosion rate, corrosion potential and
polarization potential with surface properties.
In the assessment of texture and its role in corrosion, one needs to consider
dislocation effects. Dislocations are considered as one dimensional defects in
materials and are closely related to the texture development as high dislocation
density introduced by tensile deformation causes weakening of the crystallographic

96
orientation. This phenomenon is closely related to corrosion as high corrosion rates
were obtained at sites where dislocations intersect the surface.
4.3 Effects of Surface Energy and Morphology on Corrosion of Carbon Steels
In the previous section, we have described the importance of texture for corrosion of
carbon steels and also proposed the ways through which texture could be controlled.
There are however other parameters such as microstructure, chemical composition,
defects (e.g. stacking fault energy, dislocation, precipitates, point defects) and surface
energy of crystal planes, etc. that also affect the corrosion properties of steel. The
relationship of texture with microstructure, phase composition and the relation of
texture with stacking fault and defects are critical. Passive films contain a number of
point defects such as interstitial cations (donors) and oxygen vacancies (donor) and/or
cation vacancies (acceptor). Movement of cations through the oxide film contribute to
the formation of a passive film and increased oxygen leads to an incompact passive
film. An interstitial cation can render a metal more easily dissolvable, resulting in
decreasing corrosion resistance. [90,91] Corrosion, texture and surface energy are
interrelated as shown in the case of aluminum alloys, where the surface energy of
aluminum was at maximum when low corrosion resistance was observed. [92]
Crystallographic planes with high surface energy offer adsorption sites for
atoms and thus assist with the development of surface films. Film formation could
occur due to the effect of the surface energy or through variations in the surface
texture as shown by Perlovich et al. [93] It has been observed that texture-induced
stress results in the formation of a film on the steel substrate. A high surface energy
(low atomic density) crystallographic plane offers sites for water adsorption or proton
adsorption and causes hydrogen evolution (hydrogen reaction process), whereas a low

97
surface energy plane (high atomic density) presents a site for hydrogen-reduction
reaction. [94] Adsorption of hydrogen in a high surface energy plane causes corrosion
with dissolution of atoms in that plane. Also, the evolution of hydrogen leads to
development of pores on the surface, which is detrimental for corrosion resistance of
the steel substrate. Similarly, an increase in the carbon content in grain boundary
increases the chances of cleavage fracture by increasing the surface energy. The
surface energy of pure austenite was found to be higher than that of pure ferrite,
whereas, in the case of a hydrogen-containing system, a decrease in surface energy
was observed for both austenite and ferritic phases (Fig. 4a). This study described the
role of chemical constituents of steel in contributing to its surface energy as well as
the durability of steel in relation to its surface energy as incorporation of carbon in
austenitic steel widely affected its surface energy, but had lesser effect on ferritic steel
(Fig. 4b).
Surface energy can be altered by alteration of texture, as discussed earlier,
which in turn influences the corrosion resistivity of the steel substrate. Another aspect
of addressing surface energy is hydrophobicity. A well-established concept of
hydrophobicity is very important for corrosion studies of metals or alloys. It is proven
that high hydrophobicity prevents liquids from staying on the solid surface for an
extended period of time and leads to less exposure of solid surface with liquid by
decreasing the contact area between them. Therefore, it is required to understand the
surface energy and morphology effects for corrosion studies. Hydrophobicity is
related to surface energy as high hydrophobicity requires low surface energy. [95] It is
however important to understand that low surface energy alone cannot be considered
as the deciding factor for a super-hydrophobic surface. There are other factors that
need to be considered, such as surface morphology, including hierarchical

98
morphology as described earlier in this section, [95–96], surface roughness as
increasing surface roughness causes high hydrophobic surface generation [97,98].
Figure 4.3 (a) Comparison of ferrite and austenite surface energy under hydrogen and hydrogen free condition, exhibiting hydrogen addition caused reduction on surface energy for both ferrite and austenite; (b) computed surface energy of ferrite and austenite [under pure (metallic form) and hydrogen, carbon containing system] exhibited lower surface energy for hydrogen containing system for ferrite and austenite than Fe and Fe–C system. [99]
For corrosion protection, it is necessary that a steel surface has little contact with
corrosive media and a surface must have hydrophobic characteristics that can be
developed either by increasing the roughness of a surface, which has low surface
energy or by low surface energy material coatings on a rough surface. However, a
study by Yu et al. [100] showed that super hydrophobic surfaces cannot always
prevent corrosion. Certain rolling characteristics should be maintained. Rolling is a
mechanical deformation process, which is a well-known process for texture
development of materials as discussed in the previous section, but its relation to
surface energy in terms of hydrophobicity has not been largely addressed. The
development of a hydrophobic surface film using film forming corrosion inhibitors is
nowadays rather a conventional way of increasing resistivity of carbon steel surfaces.

99
An important emerging alternative to the conventional formation of corrosion-
protective surface films is morphological modification of the steel and the consequent
development of hierarchical morphology generation. Zhang et al. [101] developed a
super hydrophobic surface in steel by texturing with the help of a hydrogen fluoride
(HF) and a hydrogen peroxide (H2O2) solution mixture and the super-hydrophobicity
was examined by contact angle measurements (Fig 4.4), which depicts the
transformation of hydrophilic bare steel surface to hydrophobic surface.
Morphological observation through scanning electron microscopy (Fig 4.5) revealed
that the surface contained islands covered with nano-flakes that lead to the
hierarchical-surface generation, which is very important for securing hydrophobic
nature of the surface. A hierarchical surface is a surface of multiple roughness, which
is the origin for the observed hydrophobicity of this surface (Fig 4.6). After 24-hour
immersion of textured (modified) steel in 3.5% NaCl solution, the contact angle was
not significantly changed which suggested stability of the surface for long duration,
while Fig 4.6b shows high corrosion resistance of modified steel surface due to the
“cushion” and capillarity effect. Super hydrophobic textured steel does not allow
water and Cl_ to reach the bare steel surface.
Figure 4.4 Contact angle measurements on (a) the bare steel, (b) the textured steel, (c) the modified bare steel, and (d) the modified textured steel. Modification of textured steel depicted its hydrophobic nature. [101]

100
Fig. 4.5 Morphological images recorded via SEM clearly elucidate the differences for (a) the bare steel and (b) the textured steel surface. (c and d) Magnified images of (b). [101]
Fig. 4.6 Surface profile variations in (a) the bare steel and (b) the textured steel surface. [101]

101
Fig. 4.7 (a) Establishing relationship between the contact angle and sliding angle of the super hydrophobic surface with the immersion time (3.5% NaCl solution); (b) exhibited the effect of surface modification on polarization behavior as polarization curves for the bare steel, the textured steel, the modified bare steel, and the modified textured steel are found different. [101]
A similar approach, involving a template and chemical etching of the substrate was
adopted by Yuan et al. [102] This study is beyond the scope of this review as it dealt
with iron, but is highly significant as it establishes chemical etching as an important
technique for the development of hydrophobic surfaces. It has been observed that the
hydrophobic surface has a hierarchical structure. [103] Wu et al.[104] protected mild
steel by a one-step electro deposition process of a SiO2 film, which was hydrophobic
in nature. Deposition was done through sol–gel process with tetra-ethoxysilane and
dodecyltriethoxysilane precursors. A rough surface with low surface energy was
achieved and this study brought attention to the importance of surface roughness in
corrosion science. Atomic force microscopy is a technique suitable for identification
of the surface roughness, which is discussed in this review. The importance of
morphology of the protective surface layer as well as its hydrophobicity have been
established. A surface layer with significant roughness and less surface energy, that is

102
hierarchically structured, can increase the corrosion resistivity of the steel. The
adherence of the surface film to the substrate (an alloy or metal) also plays a
significant role as low adherence of the surface film to the steel substrate always
causes high interface energy and thus provides instability of the interface.
Ramachandran et al. [105] investigated corrosion resistive properties of a super-
hydrophobic surface of cast iron and identified the relation between surface energy
and electric potential by application of the Lippmann law of electro-wetting and
Lechatelier principle. This study described the behavior of a hydrophobic surface in
terms of the observed decreasing corrosion potential for hydrophobic surfaces. The
methodology could be adopted for plane carbon steels when investigating the
behavior of a hydrophobic surface in terms of corrosion potential.
As far as the mechanism of corrosion prevention through hydrophobic surface
formation is concerned, it has been documented that a super-hydrophobic surface can
trap air in its structure, due to its hierarchical nature. This leads to improved corrosion
protection of the underneath surface through restricting the corrosive ions to strike the
surface of the steel substrate [106].
It is certainly an emerging field in corrosion science to determine the behavior
of carbon steel morphology and texture with respect to both the surface energy and
interface energy. Furthermore, we realize that a clear relationship between the
hydrophobicity and rolling texture of carbon steels has not been established. We
observe from the literature that hierarchical morphology of surface films improves the
corrosion resistance due to the multiple-roughness structure. Hierarchical structures
can be developed through residue or particle deposition. Another method of
generating hierarchical structures is to modify the steel surface, which is typically

103
achieved through etching. [108] It is also important to note that the mechanical
stability and phase stability of the films and structures have not been investigated, but
are of significance to the mechanistic studies on corrosion inhibition of carbon steels.
Mechanical stability of hierarchical films or morphology could be determined using
atomic force microscopy (AFM), where the force required to remove surface film
with the AFM tip is measured (scratch test), whereas phase stability could be
determined through X-ray diffraction spectroscopy (XRD) or high-temperature XRD.
Another area which is yet to be investigated is the effect of the metallic, non-
metallic inclusions and intermetallic phases on the hierarchical structure development.
These areas demand extensive investigation as far as carbon steel corrosion is
concerned. Furthermore, the mechanistic investigations into the formations of the
hierarchical structures on steel surfaces and their corrosion inhibition properties
should consider other influencing factors, such as porosity and surface roughness, that
are already described for development of surface films (of nonhierarchical structure)
on carbon steels. It has been shown, for example, that the formation of iron carbonate
layer on carbon steel exposed to carbon dioxide media is affected by the velocity of
the carbon dioxide gas. This in effect changes the porosity of the iron carbonate
surface film and its protectiveness against corrosion. [109] Future developments of
hydrophobic carbon steel surfaces and the mechanistic studies on their formations and
modifications will require advanced investigations that consider the properties of
carbon steel structures addressed in this review. Such advanced studies, combined
with competent theoretical techniques, could reveal the mechanisms involved in the
process of corrosion of carbon steels.

104
4.4 Carbon Martensitic stainless steels
The data presented in Table 4.1 are straight-chromium 400 Series types that are
hardenable by heat treatment. They are magnetic. They resist corrosion in mild
environments. They have fairly good ductility, and some can be heat treated to tensile
strengths exceeding 200,000 psi (1379 MPa). Type 410 is the general-purpose alloy
of the martensitic group.
Table 4.1 Chromium 400 Series
Martensitic Stainless Steel
Type Equivalent UNS Type Equivalent UNS
403 S40300 420F S42020
410 S41000 422 S42200
414 S41400 431 S43100
416 S41600 440A S44002
416Se S41623 440B S44003
420 S42000 440C S44004
4.4.1 Mechanical properties
The martensitic grades are so named because when they are heated above their critical
temperature (1600ºF or 870ºC) and cooled rapidly, a metallurgical structure known as
martensite is obtained. In the hardened condition, the steel has very high strength and
hardness, but to obtain optimum corrosion resistance, ductility, and impact strength,
the steel is given a stress- relieving or tempering treatment (usually in the temperature
range of 300-700ºF (149-371ºC)).

105
Tables 4.1 and 4.2 give the chemical compositions and mechanical properties of
martensitic grades in the annealed and hardened conditions.
The martensitic stainless steels fall into two main groups that are
associated with two ranges of mechanical properties: low- carbon
compositions with a maximum hardness of about Rockwell C45 and the
higher-carbon compositions, which can be hardened up to Rockwell C60.
(The maximum hardness of both groups in the annealed condition is
about Rockwell C24.) The dividing line between the two groups is a
carbon content of approximately 0.15%.
In the low-carbon class are Types 410, 416 (a free-machining grade) and 403
(a ''turbine-quality'' grade). The properties, performance, heat treatment, and
fabrication of these three stainless steels are similar except for the better machinability
of Type 416. On the high-carbon side are Types 440A, B, and C. Types 420, 414, and
431, however, do not fit into either category. Type 420 has a minimum carbon
content of 0.15% and is usually produced to a carbon specification of 0.3-0.4%.
While it will not harden to such high values as the 440 types, it can be tempered
without substantial loss in corrosion resistance. Hence, a combination of hardness
and adequate ductility (suitable for cutlery or plastic molds) is attained. Types
414 and 431 contain 1.25–2.50% nickel, which is enough to increase hardenability,
but not enough to make them austenitic at ambient temperature. The addition of
nickel serves two purposes: (1) it improves corrosion resistance because it permits
a higher chromium content, and (2) it enhances toughness. Martensitic stainless
steels are subject to temper embrittlement and should not be heat treated or used in the
range of 800 to 1050ºF (427-566ºC) if toughness is important.

106
Impact tests on martensitic grades show that toughness tends to decrease with
increasing hardness. High-strength (high- carbon) Type 440A exhibits lower
toughness than Type 410. Nickel increases toughness, and Type 414 has a higher
level of toughness than Type 410 at the same strength level.
Martensitic grades exhibit a ductile-brittle transition temperature at which notch
ductility drops very suddenly. The transition temperature is near room temperature,
and at low temperature of about -300ºF (-184ºC), they become very brittle. This effect
depends on composition, heat treatment, and other variables.
Clearly, if notch ductility is critical at room temperature or below, and the
steel is to be used in the hardened condition, careful evaluation is required. If the
material is to be used much below room temperature, the chances are that
quenched-and-tempered Type 410 will not be satisfactory. While its notch ductility
is better in the annealed condition down to -100ºF (-73ºC), another type of stainless
steel is probably more appropriate.
The fatigue properties of the martensitic stainless steels depend on heat
treatment and design. A notch in a structure or the effect of a corrosive environment
can do more to reduce fatigue limit than alloy content or heat treatment. Another
important property is abrasion or wear resistance. Generally, the harder the material,
the more resistance to abrasion it exhibits. In applications where corrosion occurs,
however, such as in coal handling operations, this general rule may not hold, because
the oxide film is continuously removed, resulting in a high apparent
abrasion/corrosion rate. Other mechanical properties of martensitic stainless steels,
such as compressive yield and shear strength, are generally similar to those of
carbon and alloy steels at the same strength level. The property of most interest is

107
modulus of elasticity. The moduli of the martensitic stainless steels (29 x 106 psi)
(200 GPa) are slightly less than the modulus of carbon steel (30 x 106 psi) (207
GPa) but are markedly higher than the moduli of other engineering materials, such
as aluminum (10 x 106 psi) (67 GPa). The densities of the martensitic stainless
steels (about 0.28 lb. per cu. in.) (7780 Kg/m3) are slightly lower than those of the
carbon and alloy steels. As a result, they have excellent vibration damping
capacity.
The martensitic stainless steels are generally selected for moderate resistance
to corrosion, relatively high strength, and good fatigue properties after suitable heat
treatment. Type 410 is used for fasteners, machinery parts and press plates. If greater
hardenability or higher toughness is required, Type 414 may be used, and for better
machinability, Types 416 or 416 Se are used. Springs, flatware, knife blades, and
hand tools are often made from Type 420, while Type 431 is frequently used for
aircraft parts requiring high yield strength and resistance to shock. Cutlery consumes
most of Types 440A and B, whereas Type 440C is frequently used for valve parts
requiring good wear resistance.
High-carbon martensitic stainless steels are generally not recommended for
welded applications, although Type 410 can be welded with relative ease. Hardening
heat treatments should follow forming operations because of the poor forming
qualities of the hardened steels.

108
Table 4.2 Chemical Analysis of Martensitic Steels
Martensitic Stainless Steels
Chemical Analysis %
Type C Mn P S Si Cr Ni Mo other
410 0.15 1.00 0.040 0.030 1.00 11.50/13.50
440A 0.60/0.75 1.00 0.040 0.030 1.00 16.00/18.00 0.75
440B 0.75/0.95 1.00 0.040 0.030 1.00 16.00/18.00 0.75
440C 0.95/1.20 1.00 0.040 0.030 1.00 16.00/18.00 0.75
4.5 Corrosion characteristics – High Temperature
Corrosion Resistance
When stainless steels are exposed at elevated temperatures, changes can occur in the
nature of the surface film. For example, at mildly elevated temperatures in an
oxidizing gas, a protective oxide film is formed.
In more aggressive environments, with temperatures above 1600ºF (871ºC),
the surface film may break down with sudden increase in scaling. Depending on alloy
content and environment, the film may be self-healing for a period of time followed
by another breakdown.
Under extreme conditions of high temperature and corrosion, the surface
film may not be protective at all. For these reasons, the following data should
serve only as a starting point for material selection, not as a substitute for service
tests. Stainless steel has been widely used for elevated-temperature service;
therefore, fundamental and practical data concerning their resistance to corrosion
are available.

109
4.5.1 Oxidation
In non-fluctuating-temperature conditions, the oxidation resistance (or scaling
resistance) of stainless steels depends on chromium content. Steels with less than
18% chromium (ferritic grades primarily) are limited to temperatures below
1500ºF (816ºC). Those containing 18-20% chromium are useful to temperatures
of 1800ºF (982ºC), while adequate resistance to scaling at temperatures up to
2000ºF (1093ºC) requires a chromium content of at least 22%, such as Types 309,
310 or 446. The maximum service temperature based on a rate of oxidation of 10
mg. per sq. cm. in 1000 hours is given for several stainless steels in Table III for
non- fluctuating temperature. The corrosion resistance of several stainless steels in
steam and oxidizing flue gases are compared with their corrosion resistance in
air. In many processes, isothermal (constant temperature) conditions are not
maintained and process temperatures vary. Expansion and contraction differences
between the base metal and the protective film (or scale) during heating and
cooling cause cracking and Spalling of the protective scale. This allows the
oxidizing media to attack the exposed metal surface. The Spalling resistance of
the Martensitic stainless steels is greatly improved at higher nickel levels. Nickel
reduces the thermal expansion differential between the alloy and the oxide film
and thereby reduces stresses at the alloy-oxide interface during cooling. Also,
Type 446 and the proprietary ferritic chromium-molybdenum stainless steels
have a fairly low coefficient of thermal expansion, which tends to enhance
Spalling resistance.
A number of proprietary austenitic stainless steels that rely on silicon,
aluminum, or cerium additions for improved oxidation resistance are listed in
ASTM A240 and other product specifications.

110
Figure 4.8 Effect of Chromium Content on Scaling resistance.
4.5.2 Effect of Atmosphere
Much attention has been given to the compatibility of stainless steels with air or
oxygen. However, trends in the design of steam and other forms of power
generation have resulted in a growing interest in oxidation in such environments
as carbon monoxide, carbon dioxide, and water vapor. Exposure to mild
conditions in these environments leads to the formation of the protective oxide
film described earlier, but when conditions become too severe, film breakdown
can occur. The onset of this transition is unpredictable and is sensitive to alloy
composition. Although the reaction mechanisms are probably similar in air,
oxygen, water vapor, and carbon dioxide, reaction rates may vary considerably.
For example, similar scaling behavior has been observed in air and oxygen except
that the scale break-down occurs more rapidly in oxygen. For this reason, results
obtained in air should be applied with care when considering service in pure

111
oxygen. An increase in corrosion rates can be expected in the presence of water
vapor. Type 302 undergoes rapid corrosion in wet air at 2000ºF (1093ºC),
whereas a protective film is formed in dry air. The higher nickel Type 330 is less
sensitive to the effects of moisture; so it is assumed that increased chromium and
nickel permits higher operating temperatures in moist air. Types 309 and 310 are
superior at temperatures greater than 1800ºF (982ºC), and Type 446 is usable at
temperatures approaching 2000ºF (1093ºC).
It is difficult to indicate maximum service temperatures in steam, one
reason being the sensitivity of corrosion rate to surface condition. (Cold worked
surfaces tend to exhibit reduced corrosion effects in steam service.) Most
austenitic stainless steels can be used at temperatures up to 1600ºF (871ºC), and
Types 309, 310, and 446 at higher temperatures. Types 304, 321, and 347 are being
used in low- pressure steam systems at temperatures approaching 1400ºF (760ºC).
Scale on Types 304, 347, and 316 tends to exfoliate at higher temperatures The
oxidation of stainless steels in carbon dioxide and carbon dioxide- carbon monoxide
atmospheres at temperatures in the range of 1100- 1800ºF (593-982ºC) is of interest
because of their use in gas-cooled nuclear reactors. Type 304 is serviceable in this
environment, although some proprietary stainless steels offer better resistance.
A note of caution about stainless steels at high temperatures in stagnant
oxidizing environments: The protective film breaks down in the presence of
certain metal oxides, causing accelerated attack. For instance, austenitic types are
susceptible to attack in the presence of lead oxide at temperatures as low as 1300ºF
(704ºC). Vanadium oxide, found in fuel ash, may cause failure of Types 309 and
310 at 1900ºF (1038ºC) when water vapor is present. Molybdenum oxide behaves
in a similar manner.

112
Table 4.3 Suggested Maximum Temperature
Suggested Maximum Service Temperatures in Air
AISI
Type
Intermittent Service Continuous Serivce
°C F °C F
410 815 1500 705 1300
416 760 1400 675 1250
420 735 1350 620 1150
440 815 1500 705 1300
442 1035 1900 980 1800
4.5.3 Flue Gases
The corrosivity of flue gas containing sulfur dioxide or hydrogen sulfide is similar to
that of most sulfur-bearing gases. Accordingly, the corrosion resistance of stainless
steels in flue gas environments is improved by increased chromium content.

113
CHAPTER 5
Razor Blade Steel and Material
5.1 Introduction
Cr-Mo stainless steel is used for making razor blades and exhibits a high resistance to
corrosion, and also to a process for manufacturing razor blades. High carbon steel
containing 1.2% by weight of carbon and 0.4% by weight of chromium are usually
used for making razor blades. This material shows a high degree of hardness when
heat treated and could make a blade having a high level of cutting quality, but has the
drawback of being poorly resistant to corrosion and of rusting easily.
Every razor is normally used in a more or less humid environment. When it is
used, it is brought into contact with corrosive substances, such as the constituents of
sweat, soap, and shaving foam. Moreover, the nature of water which is used for
shaving, and the temperature of the place where the razor is used, are likely to
promote the rusting of its blade. The high carbon steel razor blade was primarily
intended for providing a high level of cutting quality, and did not usually withstand
any repeated use under the conditions as herein stated. Therefore, 13 Cr martensitic
stainless steel has come to be used widely as a rust-resisting material for making a
razor blade having a high level of cutting quality. Martensitic stainless steel
containing 0.6 to 0.7% of carbon and 12 to 13% of chromium, both by weight, is used
more often for making razor blades than any other stainless steel. This material has a
hardness of HV 620 to 650 when heat treated, and is superior to high carbon steel in
rusting and corrosion resistance owing to the 13% Cr it contains.
This material is, however, not completely free from the problem of rusting,

114
either; when it is used for making razor blades, it is usual a practice to form a coating
of e.g. platinum, chromium or chromium nitride (CrN) on the surface of the material
by sputtering to improve its corrosion resistance. Although the coating does certainly
improve the corrosion resistance of the material, a razor blade made of this material
still has an undesirably short life due to the corrosion which occurs at the grain
boundary, and the rust which forms between the coating and the substrate. Moreover,
the formation of the coating requires additional equipment and incurs an additional
cost.
The razor blade is preferably coated with a layer of polytetrafluoroethylene (PTFE) or
silicone which reduces friction and renders the blade smoother to the skin.
5.2 Elements of Razor Blade Material
A description of the component elements of the razor blade material and the contents
of alloying elements are described here.
(a) C: not less than 0.5%
Carbon is an element necessary for improving the strength of the material. An
appropriate carbon content lowers the melting point of the material and improves its
productivity. Thus, the carbon content is set to be not less than 0.5%. Preferably, the
carbon content is not more than 5.0% in order to inhibit crystallization of graphite.
Carbon is an element which is important for the hardness of steel as heat treated, but
lowers its corrosion resistance as its proportion increases. We have looked into the
optimum proportion of carbon that ensures that the steel has a Vickers hardness of at
least 620 when hardened and tempered, as measured under a load of 0.5 kg, while also
takes the proportions of the other elements (mainly chromium) into consideration. As
a result, the presence of more than 0.45% of carbon has been found to be essential

115
from the standpoint of hardness as set forth above. The presence of 0.55% or more of
carbon has, however, been found to lower the corrosion resistance of steel and
necessitate surface treatment for making up its lower corrosion resistance as has been
given to the presently available steel containing 0.65% of carbon and 13% of
chromium. Therefore, the steel of this type contains more than 0.45%, but less than
0.55%, of carbon. According to a salient feature of the steel of this invention, it has an
improved corrosion resistance due to its carbon content which is lower than that of the
presently available stainless steel, and nevertheless, a satisfactorily high level of
hardness as heat treated owing to its specific carbide density, as will be described.
(b) Cr: 9.0 to 14.0%
Cr is a basic element necessary for providing the material with corrosion resistance,
and is required to be not less than 9.0% Cr in order to ensure substantially the same
level of corrosion resistance as that of stainless steel. However, Cr content exceeding
14.0% makes the material not only expensive but also susceptible to crystallize coarse
network carbides resulting in deteriorated hot-workability and low productivity. In
order to prevent the crystallization of carbides, quick quenching is necessary for the
material. Therefore, the Cr content is set to be 9.0 to 14.0%. Chromium is one of the
most important elements for the rusting and corrosion resistance of steel. At least 12%
of chromium is necessary to form a sufficiently passive film to render the steel of this
invention resistant to corrosion. The use of too much chromium must, however, be
avoided, since its formation of carbide at the temperature employed for austenitizing
steel brings about a reduction in the carbon content of the steel and thereby in its
hardness as heat treated. The hardness, which the steel of this invention is required to
exhibit when heat treated, can be attained only when it contains not more than 14% of
chromium.

116
(c) Mo: not more than 8.0%
Mo improves corrosion resistance. Mo is effective for not only preventing coarsening
of Cr-containing carbides but also preventing precipitation of other carbides, since it
occupies precipitation sites of Cr-containing carbides that are susceptible to be coarse
and is effective for lowering a diffusion activity of carbon because of a high affinity
for carbon. However, when the Mo content is significant, a brittle phase precipitates
to deteriorate the material’s corrosion resistance and toughness, the brittle phase
comprising Mo-containing carbides (including Mo2C) and composite borides
(including Mo2(Fe, Cr)B2, Fe13Mo2B5, Mo3B and Mo2B). Thus, an upper limit value
is set to be 8.0%. Preferably, the Mo content is not less than 0.5% in order to obtain
the above effects. While the invented material is directed to an Fe-based alloy
containing the above components with specific contents, respectively, it is effective
for the material to contain B (boron) and Si in order to further improve characteristics
of the material.
(d) B+Si: not more than 8.0%
Both the elements B and Si promote a transformation of the alloy structure of the
material into amorphous phase. However, a significant amount of the elements
prevents such a structural transformation and causes brittle phase to precipitate
resulting in deteriorated toughness, the brittle phase comprising composite borides
(including Mo2(Fe, Cr) B2,
Fe13Mo2B5, Mo3B and Mo2B), Fe3Si. Thus, an upper limit of a total content of one or
both of the elements is set to be 8.0%. Preferably, the content is not less than 0.5% in
order to obtain the above effects.
It should also be noted that other elements promoting the structural

117
transformation into amorphous phase can be added into the material as long as basic
actions by the above chemical composition and a microstructure described below are
not deteriorated. Such elements may be P, Nb, Zr, Ta, Al, Ga, Ni, Co and Cu.
(e) Coating With polytetrafluoroethylene (PTFE)
The razor blade material is characterized by that it may be used with a coating of
polytetrafluoroethylene (PTFE). Thereby, a shaving feel, which is one of important
properties of the razor blade, can be remarkably improved.
As mentioned above, it is effective to use the quenching solidification method
in order to obtain the invention razor blade material. In this case, When the
solidification rate is a level of critical cooling rate of 5><104 K/second, the invention
razor blade material may be as solidified by quenching, and it is possible to attain the
blade material having a thickness of not less than 30 pm. However, it should be noted
that an excess thickness is inappropriate in order to attain the amorphous structure,
and that the upper limit of thickness of the material as solidified by quenching, which
is attainable at the cooling rate mentioned above, is an order of 100 pm. Therefore, the
thickness of the invention material is set to be a range of 30 to 100 pm.
A razor blade is usually coated with a resin, such as polytetrafluoroethylene
(PTFE) or silicon, after a cutting edge has been formed on it, so that it may be smooth
to the skin, and on that occasion, it is heated at a temperature of 350° C. to 400° C.
Silicon is the most, effective element for restraining any reduction that occurs to the
hardness of steel when it is heated when a resin coating is formed. In this connection,
the presence of at least 0.4% of silicon is essential to ensure that the steel maintain a
Vickers hardness of at least 620.

118
(f) Silicon and Manganese
Silicon, however, forms a solid solution in steel, and thereby embrittles it and lowers
its cold workability. It also forms hard non-metallic inclusions, such as Si02. The
addition of too much silicon is, therefore, likely to make the formation of a proper
cutting edge difficult, or result in an edge which is easily broken. Under these
circumstances, the addition of more than 1.0% of silicon has been found undesirable.
Therefore, the steel of this invention contains 0.4 to 1.0% of silicon.
Manganese is also used as a deoxidizing agent. It exists in the form of a solid
solution in steel, and also forms manganese sulfide and manganese silicate as non
metallic inclusions. The hard inclusions formed by silicon must be removed from the
steel, as they remain unchanged even by a strong force applied for cold working the
steel, and eventually disable the formation of a proper cutting edge on a razor blade
and also have an adverse effect on its properties. On the other hand, manganese
sulfide and manganese silicate hardly present any problem in the formation of a razor
blade or from the standpoint of its properties, since they are sufficiently soft to be
deformable into a very small thickness by cold working. It, therefore, follows that any
and all unavoidable non-metallic inclusions need be fixed in the form of soft ones,
such as those formed by manganese. At least 0.5% of manganese is necessary to form
manganese sulfide. At least 0.5% of manganese is necessary to form manganese
silicate when the proportion of silicon as herein above defined is taken into
consideration. The addition of too much manganese must, however, be avoided, as it
lowers the hot workability of steel. Therefore, the steel of this invention contains 0.5
to 1.0% of manganese.

119
5.3 TECHNOLOGY
The technology for the manufacture of safety razor blades is a closely held trade
secret with a few manufacturers in the world.
Manufacture of safety razor blades is a technology by itself and utilizes state-of
the-art equipment and machinery. Brief outline of the process of manufacture
includes the following:
1. Drawing of the blade strips from the spools;
2. High Speed Punching of the blade blanks in high speed punch presses (950- 1000
SPM (Splits Per Minute);
3. Bliss Press operations;
4. Heat Treatment - (automatic electric hardening systems);
5. Cutting operations;
6. Grinding;
7. Stropping (lapping with leather belts);
8. Coating;
9. Printing (rotogravure printing of brand name, etc.);
10. Quality Check;
11. Packing and Dispatch (automated).
From a historic perspective, the Indian male had to put up with the so-called "safety"
razor blades, which gave more cuts on the face than the number of good shaves each
morning. A mandate that safety razor blades, manufactured in the country, should be
covered by the certification implementing a scheme of the Indian Standards
Institution (now Bureau of Indian Standards) and carries the ISI mark.
Tests conducted by the institution revealed that all major brands of safety
razor blades failed to come up to the relevant Indian standards. This failure of the

120
manufacturers was despite the imported raw material, imported machinery (even the
dies were imported) and, as some claimed, imported know-how.
Notwithstanding the "imported technology", while one blade would just give
a single, satisfactory shave, the best performance seldom exceeded five shaves.
The price differential between the lowest and the highest brand was in the ratio of
1:6. The reason was that the defective pieces and rejects, segregated during the
online quality checks, were earmarked and graded for the lower priced brands.
One particular brand X of carbon steel blade did not even give one nick free
shave. The manufacturer, when confronted, cleverly retorted that what was labeled
was meant to be a "blade", not a "shaving blade". On further questioning regarding
its use, the manufacturer recommended it "for pencil sharpening".
The Bureau of Indian Standards (BIS) certification scheme was introduced in
1956 and later various items of mass consumption, which had health and safety
implications, were brought under compulsory ISI marking through different
enactments.
The blades are produced in accordance with the following specifications:
• Stainless Steel Safety Razor Blades (Second Revision Amendments 3) - Reaffirmed – 1996 IS 7371 – 1982
• Safety Razors Amendments 3 - Reaffirmed –1991 IS 7370 1974
• Twin Blade Razor Handles Hermal - Reaffirmed-1998 IS 13777 – 1993
• Twin Blade Cartridges Shaving Systems Amendments 2 - Reaffirmed 1996 -IS 13031-1990
Since there are only two major multinational companies manufacturing the above
item under foreign collaboration and having monopoly in the market, the detailed
technological aspects of manufacture is almost a trade secret. Safety razor blades

121
currently are produced in large scale sector only. There are many types of blades in
the market, for e.g., single edge, double edge, sandwiched and bonded. Safety razor
blades are items of consumption. Being a commodity of mass and daily consumption,
the industry provides good scope for investment.
The manufacture of razor blades involves a variety of operations such as punching
and hardening. List of plant and machineries required are as follows:
1. Punch machine
2. Fully automatic press
3. Automatic electric hardening machine
4. Automatic etching machine
5. Varnishing machine
6. Cutting machine
7. Grinding and polishing machine
8. Tool grinder and miscellaneous tools and accessories.
The razor blades are mostly being manufactured by the foreign firms in India,
although Indian firms are also in the field but their product is not up to the mark.
Therefore, high quality razor blades have ample scope in Indian as well as foreign
market.

122
5.4 Raw Materials
BLADE MATERIAL PROPERTIES
The material properties that are generally of most interest when choosing the
optimum material for a particular cutting application include the following:
• Wear Resistance
• Toughness or Shock Resistance
• Corrosion Resistance
• Influence on Edge Characteristics
• Shape Control during Heat Treat
• Cost
• Availability
Materials most commonly used in blade applications include the following:
• 1095 Carbon Steel
• Heat-Treated Stainless Steels
• 301 Stainless, 17-4 & 17-7 PH Stainless
• High Speed Steels
• Tool Steels
• Extreme-Wear Tool Steels
• Tungsten Carbide
• High-Performance Zirconia Ceramic
• Coatings
• Martensitic Stainless Steels.

123
1095 Carbon Steel
Available in either Rc 50 spring temper or custom hardened and tempered up to Rc
62, AISI 1095 is an economical material choice where corrosion is not expected to be
a problem. While most blade manufacturers use AISI 1095, normally 1.25 Carbon
Steel is used. 1095 steel has 0.95% carbon while 1.25 steel has 1.25% carbon.
This increased carbon content allows the blades to be heat treated to a higher
hardness and offers better wear resistance. This steel is a good, economical choice
when fair wear resistance is required and corrosion is not a problem.
Heat-Treated Stainless Steels
Suitable for industrial and medical applications, these 400 series martensitic steels
are much more corrosion-resistant than carbon steels and can be sharpened to
equally-keen edge sharpness. Razor Blade Stainless steel in thicknesses from 0.010”-
0.062” thick can also be used.
High-Speed Steels
High-speed steels also have excellent temper resistance, holding their hardness even
when exposed to temperatures up to 1,000 ° F, which can also be considered.
Coatings
With many materials, desirable qualities can be enhanced by applying wear resistant
TiN, TiC, TiCN, ceramic (aka boron carbide), or Armoloy® coatings or dry film
lubricant coatings such as Teflon. However, the following coatings are used
extensively for safety razor blade manufacturing.

124
TITANIUM NITRIDE (TIN) - This familiar gold-like coating is economical as it
adds some lubrication and wear-resistance.
SOLID TUNGSTEN CARBIDE - Unique grades, ultra-fine and sub-micron grain
tungsten carbide, offer the best blend of wear resistance and toughness. Polishing all
edges and surfaces to a 2 RMS finish is possible. Each cutting edge is
microscopically inspected at 50X, to assure customers a perfect blade. Carbide
blades can last hundreds of times longer; so they can be an excellent choice in high
production applications or where a superior cut is needed. These blades can be re-
sharpened, further increasing their cost effectiveness.
SAPPHIRE - Sapphire has superior sharpness and durability characteristics than
that of even carbide or ceramic. Sapphire's true benefit is that is can withstand much
higher heat applications than solid carbide or ceramic materials. This translates into
even faster production speeds for increased productivity, decreased down time,
decreased scrap, and higher profits. Classified grades of this precious stone for razor
blade applications have been developed recently.
The raw materials that are used for the manufacture of safety razor blades are the
following:
• Carbon Steel for safety razor blade - Amendments-2 Reaffirmed 1994 IS 10198 – 1982.
• Cold Rolled Steel Strips for Carbon Steel Razor Blades - Reaffirmed 1992 IS
9476 – 1980.
• Cold Rolled Stainless Steel Strips for razor blades - Amendments 2 – Reaffirmed
1990 IS 9294 – 1971

125
Raw material required for razor blade is steel strip which is imported from other
countries. The commonly used dimensions of steel strip are as follows:
• 0.881 x 0.0024" thick
• 0.881 x 0.004" thick
• 0.881 x 0.0032" thick
• 0.881 x 0.005" thick
There is no single thin blade material that is appropriate for all cutting applications.
There are a wide range of hardened stainless steels, flat ground tool steels, and many
other wear resistant materials from which to choose from various manufacturers
across the globe. "Optimize, not Compromise" when selecting a blade material to
ensure the right mix of properties for each individual application should be the
watchword in selecting materials for manufacture.
The ideal blade material would be highly wear and shock resistant,
economical, available in a wide range of thickness and finish, readily sharpened to a
fine quality edge, possess outstanding corrosion resistance, and have no distortion
after heat- treatment.

126
5.5 MACHINERY AND EQUIPMENT
The selection of machinery and equipment generally depends on the
product/products to be manufactured and their processes of manufacture. Since the
product is being manufactured under monopolistic lines, with state-of-the-art
machinery and equipment, it is suggested that new units which intend to be
manufactured can be designed and developed using the state-of-the-art machinery
and equipment..
The following process operations have to be taken into consideration during selection
and installation of the machinery & equipment for manufacturing:
• Drawing of the blade strips from the spools
• Bliss Press operations
• Heat Treatment - (automatic electric hardening systems)
• Cutting operations
• Grinding
• Stropping (lapping with leather belts)
• Coating
• Printing (rotogravure printing of brand name, etc.)
• Quality Check
• Packing and Dispatch (automated)
• High Speed Punching of the blade blanks in high speed punch presses (950-1000 SPM (Splits Per Minute).

127
CHAPTER 6
EXPERIMENTAL TECHNIQUES AND INSTRUMENTATION
6.1 Introduction
The primary motivation of the experimental work was to draw comparisons and
characterize the corrosion behavior of martensitic stainless steel blades, when
immersed in concentrations of 3.5% NaCl and 3.5% of acetic acid in room
temperature. The experimentation and instrumentation that were employed in this
research can be grouped as follows:
1) Weight loss measurements,
2) Scanning electron microscopy (SEM) and energy-dispersive X-ray (EDX spectroscopy).
6.2 Weight Loss Tests
Weight loss tests are a very widely used corrosion measurement and monitoring
technique. They are simple to understand and provide a direct measure of the
corrosion rate, allow a direct comparison of the relative resistance to corrosion of one
sample with another under comparable or standard conditions, and provide a sound
basis for estimating the likely active life of process equipment. There are numerous
standard techniques for weight loss testing [4, 23].
The samples of razor blades may have one of a given number of geometries
(usually a small flat rectangular sheet or cylinder). The samples are surface finished,
and the surface area is determined. Care should be taken to avoid cross-

128
contamination, for example, new polishing paper should be used to avoid
contamination of the metal surface. The blade is degreased (washed in a suitable
solvent) after which it should not be touched directly; it is then dried and accurately
weighed. The blade should then be exposed to the corrosive environment of interest.
If the sample is to be stored, it should be kept in a desiccator.
Given that surface preparation can be achieved by any one of a number of
methods, it is very important that comparisons be made only between coupons that
were prepared in a similar manner. Various methods can be used to support the
samples when they are in a corrosive medium. These include plastic wire, glass
holders and test racks. Once a blade is immersed into a corrosive environment, a
notable consideration is the length of time of exposure to the environment. Misleading
results may be obtained if an incorrect choice is made, due in part to the fact that the
initial rate of attack is often greater than the average over a longer period [5]. There
are standard procedures that can be used to plan exposure test time, such as ASTM
and NACE Standards [4, 23].
Following its immersion in the test solution, the sample should be closely
inspected for, e.g. visual signs of localized attacks such as pitting or deposits which
can help identify the causes of corrosion. Next, any corrosion products adhering to the
sample should be removed from the surface to allow accurate determination of
corrosion weight loss. Cleaning methods are either mechanical (scraping or brushing)
or chemical (using solvents). Chemical cleaning is generally preferable, but the
solution used will be specific to the metal being cleaned. Normally, the sample
undergoes a number of equivalent cleaning cycles with the sample being weighed
after each one [4]. Mass loss is plotted against the number of cleaning cycles, see
Figure 6.1. Two lines are obtained; AB and BC. The former corresponds to removal

129
of corrosion products, the latter to removal of base metal. The required corrosion
mass loss (W) occurs at point B, the intercept of the two lines [4]. More accurate
results will be obtained by testing more than one blade and averaging the mass lost.
Figure 6.1 Theoretical mass loss of a corroded sample resulting from repeated cleaning cycles.
Corrosion rate can be calculated from the measured weight loss as [4, 24]:
Corrosion Rate (g/cm2.d) = (K x W)/ (A x T x D).
K is a constant [4], W is the mass lost from sample in g, T is the exposure time in
days, A is the sample exposure area in cm2, and D is the sample density in g/cm3.
Corrosion rate can be expressed in millimeters per year (mm/y), mils per year
(mpy) or milligrams per square centimeter per day (mg/cm2d). Conversion between
these units can be seen in Table 6.1 [25].

130
Table 6.1 Conversion factors between some of the units commonly used for corrosion
rates.
Unit Mdd g/m2/d um/yr Mm/yr Mils/yr In./yr
Milligrams
per square
decimeter
per day
(mdd)
1 0.2 36.5/d 0.365/d 1.144/d 0.00144/d
Grams per
square
meter per
day (g/m2/d)
10 1 365/d 0.365/d 14.4/d 0.0144/d
Micrometers
per year
(µm/yr)
0.0274d 0.00274d 1 0.001 0.0394 0.0000394
Millimeters
per yr
(mm/yr)
27.4d 2.74d 1000 1 39.4 0.0394
Mils per
year
(mils/yr)
0.696d 0.0696d 0.0696d 0.0254 1 0.001
Inches per
year (in/yr)
696d 69.6d 25400 25.4 1000 1
Note: d is metal density in grams per cubic centimeter (g/cm3).

131
6.3 Scanning electron microscopy (SEM) and energy-dispersive X-ray (EDX
spectroscopy).
Figure 6.2 shows a schematic diagram of the major components of the SEM.
Generally, a beam of electrons are generated by the electron gun (located at the top of
the column of the SEM instrument). This electron beam travels through a series of
electromagnetic fields and lenses, which focus the electron beam onto the surface of
the sample. For stable operation, a high vacuum is normally essential for the operation
of the SEM. If the SEM contained a gas, the electron beam could react with it,
ionizing the gas with the possibility that it could react with both the electron beam
source causing burn out and contaminate the sample.
The interaction between the beam and the sample surface will result in
emission of electrons and photons. The emitted electrons include back scattered
electrons (BSE) and secondary electrons (SE), while the emitted photons include X-
rays that can be used for elemental analysis (details given below). Various detectors
are employed to record these emissions and the output of these is processed to
produce relevant images/data [26, 27]. The backscattered electrons are most valuable
for showing variation in surface composition of the analyzed sample [27, 28]. The
secondary electron is an electron which has escaped from the sample with energy of
less than 50 eV. These electrons provide information about the morphology and
topography of the sample surface. If the specimen experiences a net loss or gain of
electrons, it will gain a positive or negative charge causing image distortion and loss
of resolution. Such effects can be overcome simply by earthing the specimen and
using an electrically conducting sample or coating the specimen with a gold or carbon

132
film [29]. In our work, the detection was performed by using a SEM interfaced with
EDX machine to observe the sample surfaces before and after corrosion.
Energy Dispersive X-ray Spectroscopy (EDS)
The surface analysis performed on backscatter electrons (BES) displays
compositional contrast that results from different atomic number elements and their
distribution. Energy Dispersive Spectroscopy (EDS) allows one to identify what those
particular elements are and obtain compositional information of various elements
(Atomic % for example).
Energy-dispersive X-ray spectroscopy (EDS, EDX, or XEDS), sometimes
called as energy dispersive X-ray analysis or energy dispersive X-ray microanalysis
(EDXMA), is a surface analytical technique used for the elemental analysis or
chemical characterization of a sample. EDS analysis often relies on the fact that each
element has a unique atomic structure allowing unique set of peaks on its X-ray
emission spectrum. The excitation caused by the incident beam leads to the ejection of
an electron from an inner shell, while creating an electron hole pair. An electron from
an outer, higher-energy shell then fills the hole. The difference in energy between the
higher-energy shell and the lower energy shell may be released in the form of an X-
ray. As the energies of the X-rays are characteristic of the difference in energy
between the two shells and of the atomic structure of the emitting element, EDS
allows the elemental composition of the specimen to be measured.
Bombardment of a specimen with high energy electrons produces X-rays; the
wavelength of these X-rays depends on the elements that are present in the sample.
An electron in the primary beam with sufficient energy can excite an electron in an
inner shell of one of the atoms of the sample causing it to leave the atom entirely or

133
move to a higher unoccupied energy level. The hole, as a result of this process, can be
filled by an outer (higher energy) electron, an X-ray photon is emitted of energy equal
to the energy difference between the two atomic shells and thus is characteristic of the
atom from which the photon was emitted. This is the basis of Energy Dispersive X-
Ray Spectroscopy (EDX), which is often used together with SEM [27]. EDX is a
useful technique for elemental analysis or chemical characterization of the sample.
EDX can be used for spot analysis in which the electron beam is positioned carefully
onto a point of interest on the sample surface. Also, it may be employed for analysis
of selected area as well as for line scans. In our work, the detection was performed by
using SEM interfaced with EDX to observe the sample surfaces before and after
corrosion.
Figure 6.2 Schematic diagram of major components of SEM. [3]

134
CHAPTER 7
RESULTS AND DISCUSSION
7.1 NaCl and Acetic Acid
Upon retrieval of the blades after a period of 6 days, the blades were cleaned and
analyzed to determine the metal loss and surface morphology. The results showed that
generally, weight loss in both the blades is equal but creates a huge impact on surface
morphology of both the blades.
First approach
This approach is a modified version of ASTM G48 test. Specimen’s resistance to
pitting corrosion were tested in sodium chloride solution and acetic acid to examine
their weight loss.
Table 7.1 First set up for NaCl
Duration of Exposure 144 hrs
Temperature Room Temperature
Table 7.2 First set up for Acetic Acid
Duration of Exposure 144 hrs
Temperature Room Temperature

135
Second approach
This approach follows exact guidelines of the ASTM G 48 test. Examination on
weight loss of specimen in NaCl and Acetic Acid is carried out.
Table 7.3 Weight Loss of Blade
Duration of Exposure 144hrs
Blade in Solution Initial weight (gm) Final weight (gm) Weight loss in (gm)
NaCl 0.2288 0.2255 0.0033
Acetic Acid 0.2288 0.2254 0.0034
In Figures 7.1 and 7.2, the change in color of the solution due to the corrosion of the
blade in NaCl, for 144 hrs, are shown. Change in color of the solution shows that the
blade is corroded.
Figure 7.1 Color Change in solution when Blade is dissolved in NaCl solution for 144hrs.

136
Figure 7.2 Blade dissolved in 100ml of NaCl in glass beaker.
After treating the blade in the solution for 144 hours, it was taken out. Mass loss of
blade were measured on weighing scale, as shown in Figures 7.3 -7.5, to get the idea
of corrosion and surface deterioration.
Figure 7.3 Weight of blade before exposure to acid.

137
Figure 7.4 Weight of blade after exposure to acetic acid.
Figure 7.5 Weight of blade after exposure to NaCl.

138
Figure 7.3 shows the weight of a new untreated blade. Figure 7.4 shows the weight
loss of blade when it is exposed to acid for several hours. The corrosion rate and
weight loss in blade increases with increase in time of exposure to acid.
7.2 Microstructural Analysis of Blades By SEM
7.2.1 Surface Analysis of Blades in NaCl
Figures 7.6-7.10 show the SEM micrographs of the blade after 144hrs of exposure.
The morphology of the upper oxide layer in the micrograph is seen in the surface-
view images. After 144h, the oxide layer was mostly flat, while increased oxide
porosity was observed only in the thicker regions. The oxide layer was rougher and
there were more porous regions. Fig 7.8 shows images of the bulk. Segregated
particles were found in the bulk or at the grain boundaries.

139
Figure 7.6 Represents increased oxide porosity near the boundaries of blade.

140
Figure 7.7 Represents surface crack.

141
Figure 7.8 Segregated particles in the bulk.
Figure 7.9 shows the depth of pit hole on the surface.

142
Figure 7.10 Pit holes over the surface of blade.
7.2.2 Surface analysis of Blades in Acetic Acid
In this experiment, blades have been exposed in 3.5% acetic acid for 144 hours. After
cleaning the blades, they were observed under SEM as shown in Figure 7.11 and 7.12.

143
Figure 7.11 Represents the surface deterioration as well as pit and crevice corrosion.

144
Figure 7.12 Pit holes on surface of blade.

145
7.3 EDX Analysis of Blades
7.3.1 Martensitic 440 razor blade
EDX spectra were acquired on the surface of the blade.
Figure 7.13 EDX analysis of the surface of the blade.
Figure 7.14 EDX analysis showing the chemical analysis of blade.

146
DATA FROM EDX:
Spectrum processing: No peaks omitted
Processing option: All elements analyzed (Normalized)
Number of iterations = 2
Table 7.4 Standard Elements in Blade:
C CaCO3 1-Jun-1999 12:00 AM
Si SiO2 1-Jun-1999 12:00 AM
P GaP 1-Jun-1999 12:00 AM
S FeS2 1-Jun-1999 12:00 AM
Cr Cr 1-Jun-1999 12:00 AM
Mn Mn 1-Jun-1999 12:00 AM
Fe Fe 1-Jun-1999 12:00 AM
Ni Ni 1-Jun-1999 12:00 AM
Table 7.5 Composition of Elements in Blade
Elements C K Si K P K S K Cr L Mn
L
Fe L Ni L Totals
Weight% 6.02 0.51 0.02 0.00 21.61 1.60 66.65 3.59 100.00
Atomic% 22.59 0.82 0.03 0.00 18.72 1.31 53.77 2.76

147
7.3.2 Analysis of blade after exposure to NaCl
Figure 7.15 EDX analysis of surface of blade.
Figure 7.16 EDX analysis showing the chemical analysis of blade.

148
Data from EDX
Spectrum processing: No peaks omitted
Processing option : All elements analyzed (Normalized)
Number of iterations = 1
Table 7.6 Standard Elements in Blade treated in NaCl
Standard
C CaCO3 1-Jun-1999 12:00 AM
Al Al2O3 1-Jun-1999 12:00 AM
Si SiO2 1-Jun-1999 12:00 AM
P GaP 1-Jun-1999 12:00 AM
S FeS2 1-Jun-1999 12:00 AM
Cl KCl 1-Jun-1999 12:00 AM
Cr Cr 1-Jun-1999 12:00 AM
Mn Mn 1-Jun-1999 12:00 AM
Fe Fe 1-Jun-1999 12:00 AM
Ni Ni 1-Jun-1999 12:00 AM
Table 7.7 Composition of Elements in Blade treated in NaCl
Elements C K Al
K
Si
K
P K S K Cl
K
Cr L Mn
L
Fe L Ni
L
Totals
Weights% 7.81 0.61 0.53 0.18 0.18 0.18 19.55 2.08 65.16 3.71 100
Atomic% 27.63 0.97 0.80 0.25 0.24 0.2 15.99 1.61 49.60 2.68

149
7.3.3 Analysis of blades after exposure to Acetic Acid
Figure 7.17 EDX analysis of surface of blade.
Figure 7.18 EDX analysis showing the chemical analysis of blade.

150
DATA FROM EDX:
Spectrum processing: No peaks omitted
Processing option: All elements analyzed (Normalised)
Number of iterations = 2
Table 7.8 Standard Elements in Blade treated in Acetic Acid
Standard
C CaCO3 1-Jun-1999 12:00 AM
Al Al2O3 1-Jun-1999 12:00 AM
Si SiO2 1-Jun-1999 12:00 AM
P GaP 1-Jun-1999 12:00 AM
S FeS2 1-Jun-1999 12:00 AM
Cr Cr 1-Jun-1999 12:00 AM
Mn Mn 1-Jun-1999 12:00 AM
Fe Fe 1-Jun-1999 12:00 AM
Ni Ni 1-Jun-1999 12:00 AM
Table 7.9 Elements Composition in Blade treated in Acetic Acid
Elements C K Al
K
Si
K
P K S K Cr L Mn
L
Fe L Ni
L
Total
Weight% 4.99 0.19 0.45 0.04 0.08 21.02 1.20 68.57 3.45 100.00
Atomic% 19.29 0.33 0.75 0.06 0.11 18.76 1.01 56.96 2.73

151
CHAPTER 8
CONCLUSION AND RECOMMENDATION
8.1 General Conclusions
In this research, corrosion performance of Martensitic stainless steels, 440 Razor
blade, after immersion in 3.5% of Acetic acid and 3.5% of NaCl, is presented. The
major conclusions are as follows:
1. Corrosion behavior of Martensitic 440 razor blade stainless steels at room temperature changes significantly with increase in acetic acid concentration and NaCl acid.
2. In NaCl and acetic acid, steels exhibit a much greater corrosion rate. 3. Blade experiences uniform and pitting corrosion in acid and no passive surface
film is formed. The EDX results indicate a continual oxidation of C, Fe, Cr, Mo and Ni on the surface of the 440 stainless steel blade subsequent to emersion in acids. Also, the contribution of the pits to the total weight loss was at least 60 % after 6 days of immersion.
4. As steel undergoes corrosion in acids, there tends to be an inverse relationship in
the weight loss and corrosion rate. While weight loss tends to increase over time, the highest being at the time that the corrosion process is initiated, corrosion rate tends to decrease simultaneously.
After 6 days of exposure to corrosive environments, synthetic seawater gives pitting
and crevice corrosion results on stainless steels that are comparable to one month of
exposure in natural seawater. Mechanism of pitting corrosion of stainless steel blade
in sodium chloride solution involves the formation of an intermediate complex of
chloride ion with the passive metal followed by successive dissolution.

152
The susceptibility of pitting corrosion of Martensitic stainless steel increases with the
increase in chloride ion concentration in acidic chloride media. The pitting potential
(Epit) decreases with increase in chloride ion concentration. The pit formed under
droplets of chloride solutions was a shallow type, which indicates that the pit
propagates preferentially to horizontal direction. The pitting corrosion mechanism of
Type 440 steel, under thin droplet layers containing chloride ions, has been proposed
on the basis of these experimental results.
The results obtained in the present work revealed that the passive film formed on the
surface of the AISI 440 blade in the chloride solutions and acetic acid contains oxides
of the two main elements, i.e., Cr and Fe as Cr-oxides and Fe-oxides. A slight
decrease in the chromium oxide content, close to the oxide/solution interface, after
144 h exposure in NaCl and acetic acid was observed.
This thesis presents corrosion data and microstructural analysis data of martensitic
stainless steel blade exposed to NaCl and acetic acid. The corrosion tests lasted for
144h.The microstructural data have been collected through SEM analysis in the grain
interior and at grain boundaries of the bulk of the materials and at the superficial
oxide layer developed during the corrosion exposure. The microstructural
characterization of the materials, subjected to corrosion tests, provides insight into the
corrosion behavior of such materials where the surface deterioration of blade, crack
and pit holes on surfaces can be observed. These are of interest to industries and
research laboratories that are focused on developing better performing materials to be
used in harsh environments.

153
8.2 RECOMMENDATION
1. Further experiments can be carried out to provide better understanding of the
corrosion performance of the two stainless steels 316 and 440 in acetic acid
environments in the presence of Br ions. Below are some of the proposed future
works:
• Follow the polarization technique to measure the corrosion rate and analyze the sample with SEM prior to passivation; this may give more insight into surface processes at this stage. Studying any possible effect(s) of flow rate on the corrosion behavior of these alloys would be interesting.
• In order to evaluate the extent of metallic dissolution from the surface of steels,
the content of dissolved elements, Fe, Cr, Mo or Ni, in the test solution could be evaluated by using Atomic Absorption Spectrometer (AAS).
• Study the behavior of the constituent elements: iron, chromium, nickel and
molybdenum in their pure state and compare with typical alloys with the aim of knowing which element(s) may possibly facilitate the passivity to corrosion in test solutions.
• Study the depth of pit holes by using depth profilometery.
2. Apply Nano-titanium and diamond like carbon thin film coating on blades to
reduce the corrosivity and protect it from pitting corrosion. Measure the coated
blades and compare with the results of uncoated blades.
3. Perform corrosion studies on blades from various manufacturers and compare
corrosion rates of blades in NaCl and acetic acid with bromide ions.

154
REFERENCES
1. Fotana N.D., M.G. and Green, "Corrosion Engineering", 3rd, McGraw-Hill, Singapore.
2. Uhlig, H.H. and Revie, R.W., "Corrosion and Corrosion control", 3 ed., McGraw-Hill, New York (1987).
3. Shreir, L.L., Jarman, R.A. & Burstein, G.T., "Corrosion" Vol.1, Metal/ Environment Reactions, 3 ed. John Wiley, New York, (1984). 3rd edition 1994
4. West, J.M., "Basic Corrosion and Oxidation", Ellis Horwood Ltd., West Sussex (1980).
5. Roberge, P.R., “Handbook of Corrosion Engineering” McGraw- Hill, U.S.A., (2000).
6. Stansbury, E.E. and Buchanan, R.A., “Fundamentals of Electrochemical Corrosion”, ASM International, (2000).
7. Tretheway, K. R. and Chamberlain," J. Corrosion Science and Engineering", 2nd
8. Shreir,L.L.,"Corrosion", Metal/Environment Reactions, Newnes Butten worths, 2 Edition. , Longman, London, (1996).
9. West, J. M., "Electrode position and Corrosion Processes", Van Nostrand Reinhold
Company, 2 ed., vol.1, (1976). 10. Steigerwald, R. F.," Corrosion", No.24,p. 1, (1968). ed.,(1971).
11. From internet on, Technical Hand book of Stainless, Atlas steels, Corrosion resistance at the http://www.corrosion.ksc.nasa.gov, (2001).
12. Hoar T.P.," Corrosion Science" ,7 , 341 , (1967)
13. Uhlig H.H,"History of passivity, Experiments and Theories" , Passivity of the 4th Sysmposium on Passivity , edited by Frankenthal and J. Kruger, Electrochemical. Soc. Princton, N.J (1978).
14. Wagner C.," Corrosion Science" ,(1965)
15. Kabanove B., Burstein R., and Frumkin A., "Discussions Faraday Society, 1, 259,(1947)(as quoted in 2).
16. Frankenthal,R., "Journal of the Electrochemical Society",114,542, (1967)
17. Mc Adam, D. J. and Gell, G.W., "Pitting and its Effect on the Fatigue Limit of Steels Corroded Under Various Conditions" Journal of the Proceedings of the American

155
Society for Testing Materials, Vol.41,(1928). 18. Nguyen, T.H. and Foley, R.T." On the Mechanism of Pitting of Aluminum," Journal of
the Electrochemical Society, Vol.126, No.11,1979. 19. Frankel G.S., "Pitting Corrosion of Metal"; A Review of the Critical Factors, J.
Electrochemical Society, Vol. 145, 1998.
20. From internet on “Pitting Corrosion” ch.9, KAIST, at http://corrosion.kaist.ac.kr.
21. Baroux B., Further Insights on the Pitting Corrosion of Stainless Steels, "Corrosion Mechanisms in Theory and Practice", 2nd Edition
22. Smialowska- Szklarska Z., "Pitting Corrosion of Metals", NACE,(1986). ed. ,P. Marcus,
Ed,.
23. George E. Dieter, Mechanical Metallurgy, McGraw-Hill Book Company, 1988.
24. G.S. Frankel, Pitting Corrosion Metals Handbook, Ohio State University 1994
25. Japanese Standards Association, JIS Handbook, Ferrous Materials and Metallurgy I,
2002.
26 Fong-Yuan Ma (2012). Corrosive Effects of Chlorides on Metals, Pitting Corrosion, Prof. Nasr Bensalah (Ed.), ISBN: 978-953-51-0275-5, InTech, Available from: http://www.intechopen.com/books/pittingcorrosion/ corrosive-effects-of-chlorides-on-metals
27. Frankel G.S., Stockert L., Hunkeler F., and Boehmi H., " Corrosion", Vol.43, (1987)
(cited in 19).
28. Pessall N.and Liu C.," Electrochemical Acta", Vol.16,(1971)(cited in 19).
29.Hisamatsu Y. Yoshii T., and Matsumura Y.," Electrochemical and Microscopical Study of Pitting Corrosion of Austenitic Stainless Steel", Localized Corrosion, Vol.NACE-3,R.W. Staeble ,B,F. Brown, J. Kruger and A. Agrawal, Ed.,NACE,(1974)(cited in 19).
30.Williams D.E., Stewar J., and Balkwill P.H., Corrosion Science, Vol.36,(1994) (cited in
19).
31. Ezuber H. and Newman R.C., Growth-Rate Distribution of Metastable Pits. Critical Factors in Localized Corrosion, Vol. PV 92-9,(1992) (cited in 19).

156
32. Pistorius P.C. and Burstein G.T.," Corrosion Science", Vol. 33 (1992) (cited in 19
33. Pistorius P.C. and Burstein G.T.," Corrosion Science", Vol. 36 (1994) (cited in 19).
34.Wood G.C., Sutton W.H., Richardson J.A, Riley T.N.K., and Malherb A.G.," The
Mechanism of Pitting of Aluminum and Its Alloys", Localized 130 Corrosion, R.W.
Staehle, B.F. Brown, J. Kruger, and A.Agrawal, Ed.,NACE,(1974) (cited in 19).
35. Pride S.T., Scully J.R, and Hudson J.L.," J. Electrochemical society" Vol.141,(1994) (cited in 19).
36 57.Arnvig P.E. and Biogard A.D., Paper 437," Corrosion 96", NACE,(1996) (cited in 19).
37. Arnvig P.E. and Davision R.M., Paper 209," Process 12th
38. Brigham R.J. and Tozer E.W.," Corrosion", Vol.29,(1973) (cited in 19). International Corrosion Congress",(Houston, TX),(1993) (cited in 19).
39. Brigham R.J. and Tozer E.W., Corrosion, Vol.30,(1974) (cited in 19).
40.Qvarfort R.," Corrosion Science", Vol.28,(1988) (cited in 19).
41.Qvarfort R.," Corrosion Science", Vol.29,(1989) (cited in 19).
42. Laycock N.J., Moayed M.H., and Newman R.C.," Prediction of Pitting Potentials and Critical Pitting Temperatures", Critical Factors in Localized Corrosion II,Vol.PV95-15(1995) (cited in 19).
43. Pourbaix M., et al.," Corrosion science",Vol.3,(1963).
44. Leckie H.P. and Uhlig H.H.,"J. Electrochemical Society", Vol.113,(1966) (cited in 19).

157
45.Kolotyrkin J.M., Golovina G.V., and Florianovich G.M., SSSR D.A.N., Vol.148,(1963).
46. Fokin M.N., Kurtepov M.M., and Bachkareva V.J., Sbornik Pokorrozji, Moskov(1965).
47. Pourbaix, M.," Corrosion Science". 30,963, (1990).
48. Sandwith Colin and Randy K. Kent, University of Washington, MDE Engineers, Inc."Corrosion – Related Failures".
49. Tuthill A.H. and Schillmoler C.M.," Guidelines for Selection of Marine Materials", Ocean Science and Engineering Conference, Marine Technology Society, Washington, (1965)(cited in 71).
50. Stein A.A., MIC in the Power Industry," Microbiologically Influenced Corrosion", Korbin G., Ed., NACE International, (1993)(cited in 6).
51. Little B., Wagner P., and Mansfeld F.," Microbiological influenced Corrosion of Metals and Alloys", Int. Mater. Rev., Vol.36,(1991)(cited in 6).
52. Laycock N. J. and Newman R.C.,"Corrosion Science",Vol. 39,(1997) (cited in 19).
56. Shibata T.and Takeyama T.," Corrosion" , Vol.33,(1977) (cited in 19).
57. Sedriks A. J.," Corrosion of Stainless Steels", Wiley-Inter science , (1996) (cited in 19).
58 http://www.arcelormittal.com/stainlesseurope
59 F. U. Renner, A. Stierle, H. Dosch, D. M. Kolb, T. L. Lee and J. Zegenhagen, Nature, 2006, 707–710.
60 S. D. Cramer and B. S. Covino, Corrosion: fundamentals, testing and protection, ASM International Handbook, 2003, vol. 13A.
61 F. M. Song, D. W. Kirk, J. W. Graydon and D. E. Cormack, Corrosion, 2004, 60, 736–
748.
62 W. Villamizar, M. Casales, J. G. Gonzalez-Rodriguez and L. Martinez, J. Solid State Electrochem., 2006, 11, 619–629.

158
63 J. L. Crolet, Predicting CO2 corrosion in oil and gas industry, European Federation of Corrosion Publications, Work. Party Report, Inst. Mater, London, 1994, SSN 1354–5116, No. 13.
64 A. Ikeda, M. Ueda and S. Mukai, Corrosion, 1983, 83.
65 L. A. I. Kestens and R. Petrov, Ceram. Trans., 2009, 200, 207– 216.
66 S. Nesic, Corros. Sci., 2007, 49, 4308–4338.
67 H. S. Hernandez, F. L. Linares, J. Bruzual and J. G. Luzon, NACE International, 2003, 1, 03330.
68 M. A. Migahed, Prog. Org. Coat., 2005, 54, 91–98.
69 S. Papavinasam, A. Doiron, T. Panneerselvam and R. W. Revie, Corrosion, 2007, 63, 704–712.
70 M. Godec and M. Jenko, Mater. Tehnol., 2000, 34, 359–364.
71 Z. N. Farhat, Wear, 2001, 250–251, 401–408.
72 M. Liu, D. Qiu, M.-C. Zhao, G. Song and A. Atrens, Scr. Mater., 2007, 58, 421–424.
73 R. Xin, Y. Luo, A. Zuo, J. Gao and Q. Liu, Mater. Lett., 2012, 72, 1–4
74 Y. S. Sato, H. Kokawa, K. Ikeda, M. Enomoto, S. Jogan and T. Hashimoto, Metall. Mater. Trans. A, 2001, 32, 941–948.
75 D. P. Field, T. W. Nelson, Y. Hovanski and K. V. Jata, Metall. Mater. Trans. A, 2001, 32, 2869–2877.
76 M. F. Suarez and R. G. Compton, J. Phys. Chem. B, 1998, 102, 7156–7162.
77 E. Hill, R. R. Lloyd-Williams, R. G. Compton and J. H. Atherton, J. Solid State Electrochem., 1999, 3, 327–330.
78 K. Y. Tam, R. G. Compton, J. H. Atherton, C. M. Brennan and R. Docherty, J. Am. Chem. Soc., 1996, 118, 4419–4426.
79 M. R. Bateni, J. A. Szpunar, X. Wang and D. Y. Li, Wear, 2005, 259, 400–404.
80 Y. Baik and Y. Choi, Phys. Met. Metallogr., 2014, 115, 1318– 1325.

159
81 S. A. Park, J. G. Kim, Y. S. He, K. S. Shin and J. B. Yoon, Phys. Met. Metallogr., 2014, 115, 1285–1294.
82 W. Xu andM. Ferry,Mater. Sci. Technol., 2010, 26, 1159–1172.
83 W. Ozgowicz, A. Grajcar and A. Kurc-Lisiecka, in Corrosion Behaviour of Cold-Deformed Austenitic Alloys, INTECH Open Access Publisher, 2012.
84 D. Raabe, Crystallographic textures of hot rolled steels, 2003,http://pubman.mpdl.mpg.de/pubman/item/escidoc:2018381/
component/escidoc:2018380/Raabe%20textures%20of% 20hot%20rolled%20steels.pdf.
85 J. M. Hallen, V. Venegas and F. Caleyo, International Conference on Fracture, Beijin, China, 16–21 June 2013
86 L. J. Oblonsky, G. R. Chesnut and T. M. Devine, Corrosion, 1995, 51, 891–900.
87 E. Naderi, A. H. Jafari, M. Ehteshamzadeh and M. G. Hosseini, Mater. Chem. Phys., 2009, 115(2–3), 852–858.
88 C. Herrera, N. B. Lima, A. Ferreira Filho, R. L. Plaut and A. F. Padilha, J. Mater. Process. Technol., 2009, 209(7), 3518–3524.
89 A. Y. Kandeil and M. Y. Mourad, Surf. Coat. Technol., 1989, 37(2), 237–250.
90 C. Y. Chao, L. F. Lin and D. D. Macdonald, J. Electrochem. Soc., 1981, 128, 1187–1194.
91 S. M. Moon and S. I. Pyun, Electrochim. Acta, 1998, 43, 3117– 3126.
92 L. Jinlong and L. Hongyun, Surf. Coat. Technol., 2013, 235, 513–520.
93 Y. A. Perlovich, M. G. Isaenkova, P. N. Medvedev, V. A. Fesenko and S. San Thu, Inorganic Materials: Applied Research, 2015, 6, 259–266.
94 G. L. Song, R. Mishra and Z. Xu, Electrochem. Commun., 2010, 12, 1009–1012.
95 J. T. Woodward, H. Gwin and D. K. Schwartz, Langmuir, 2000, 16, 2957–2961.
96 P. Roach, N. J. Shirtcliffe and M. I. Newton, So� Matter, 2008, 4, 224–240.
97 W. Xu, T. Ning, X. Yang and S. Lu, Appl. Surf. Sci., 2011, 257, 4801–4806.
98 R. N. Wenzel, Ind. Eng. Chem., 1936, 28, 988–994.

160
99 E. J. Song, H. Bhadeshia and D. W. Suh, Corros. Sci., 2013, 77, 379–384.
100 D. Yu and J. Tian, Colloids Surf., A, 2014, 445, 75–78.
101 H. Zhang, J. Yang, B. Chen, C. Liu, M. Zhang and C. Li, Appl. Surf. Sci., 2015, 359, 905–910.
102 Z. Yuan, J. Bin, X. Wang, M. Wang, C. Peng, S. Xing, J. Xiao, J. Zeng, X. Xiao and X. Fu, Surf. Topogr.: Metrol.Prop., 2014, 2, 25003.
103 L. K. Wu, X. F. Zhang and J. M. Hu, Corros. Sci., 2014, 85, 482–487.
104 R. Ramachandran and M. Nosonovsky, Phys. Chem. Chem. Phys., 2015, 17, 24988–24997.
105 W. Xu, J. Song, J. Sun, Y. Lu and Z. Yu, ACS Appl. Mater. Interfaces, 2011, 3, 4404–4414.
106 T. Liu, S. Chen, S. Cheng, J. Tian, X. Chang and Y. Yin, Electrochim. Acta, 2007, 52, 8003–8007
107 J. Y. Lee, J. Han, J. Lee, J. S. Yeo, J. Y. Lee and J. Han, Nanoscale Res. Lett., 2015, 10(1), 505.
108 L. Li, V. Breedveld and D. W. Hess, ACS Appl. Mater. Interfaces, 2012, 4, 4549–4556.
109 S. Seal, K. Sapre, A. Kale, V. Desai, M. Gopal and P. Jepson, Corros. Sci., 2000, 42(9), 1623–1634.