
Corrosion behaviour in salt spray and in 3.5% NaCl solution saturated with Mg (OH) 2 of as-cast and...
21
Corrosion behaviour in salt spray and in 3.5% NaCl solution saturated with Mg(OH) 2 of as-cast and solution heat-treated binary Mg–RE alloys: RE = Ce, La, Nd, Y, Gd Zhiming Shi a , Fuyong Cao a , Guang-Ling Song a,b , Ming Liu c , Andrej Atrens a,⇑ a The University of Queensland, Materials Engineering, Brisbane, Qld 4072, Australia b Oak Ridge National Lab, Corros Sci & Technol, Oak Ridge, TN 37831-6156, USA c GM China Science Lab, 56 Jinwan Road, Pudong, Shanghai 201206, China article info Article history: Received 27 March 2013 Accepted 18 June 2013 Available online 28 June 2013 Keywords: A. Magnesium A. Rare earth elements B. Weight loss B. SEM B. EIS abstract Corrosion behaviour was characterised in salt spray and in 3.5% NaCl solution saturated with Mg(OH) 2 of as-cast and solution heat-treated binary Mg–RE alloys. The corrosion rate in the immersion test for the solution heat-treated Mg–RE alloys was substantial, and was greater than that of high-purity Mg. These corrosion rates were probably caused by the particles in the microstructure and/or by Fe rich particles precipitated during the solution heat-treatment. The corrosion rate in the immersion tests for each as- cast Mg–RE alloy was greater than that of high-purity Mg, attributed to micro-galvanic acceleration caused by the second phase. Corrosion rates in salt spray had a general correlation with corrosion rates in the immersion tests, but there were differences. The values of apparent valence were always less than 2 consistent with Mg corrosion being only partly under electrochemical control. Ó 2013 Elsevier Ltd. All rights reserved. 1. Introduction 1.1. Mg alloys The corrosion rate of magnesium (Mg) alloys [1–7] is typically higher than that of high-purity (HP) Mg, because typical Mg alloys are used as-cast, and the second phases in Mg alloys typically accelerate the corrosion by micro-galvanic coupling with the ma- trix alpha-Mg phase. This is particularly the case for corrosion in technically relevant solutions of which 3.5% NaCl solution is a typ- ical example. Such solutions are widely used to simulate the worst conditions that might occur in auto service close to the sea, or where road salt is widely used in winter. Table 1 compares corrosion rate data for HP Mg [7–14] with some data for Mg alloys containing rare earth (RE) alloying elements [15–26]. Corrosion rate measurements for HP Mg range from 0.38 to 1.8 mm y 1 . Shi and Atrens [12] maintain that the lowest measurements (0.34 ± 0.24 mm y 1 ) represent the intrinsic corrosion rate. Re- cently, Cao et al. [14] found that the intrinsic corrosion rate was 0.25 ± 0.07 mm y 1 for ultra-pure Mg produced by distillation. Table 1 indicates that some of the RE containing Mg have corro- sion rates comparable with than of HP Mg. Of particular interest are the low corrosion rates measured by Liu et al. [21,22] for AM60 and AZ91 containing various amounts of La and Ce, evalu- ated from the measured amount of hydrogen evolution. The corro- sion rates were comparable to, or in some cases apparently less, than the corrosion rates for HP Mg. The lowest corrosion rates measured by Liu et al. [21,22] were most probably underestimates of the actual corrosion rate, because recent research [5,14] has shown that corrosion rates are significant under estimates when evaluated using the measured evolved hydrogen at low corrosion rates, in which case the amount of hydrogen dissolved in the Mg specimen gives an appreciable error in the measurement of the corrosion rate. Taking this factor into account, the corrosion rates of all the Mg alloys are each equal to or greater than the corrosion rate of HP Mg, as has been repeatedly found in reviews of the liter- ature [1–4]. Nevertheless, the corrosion rates measured by Liu et al. [21,22] were low and comparable to those of HP Mg. They argued that the RE alloying elements (i) decreased the micro-galvanic influence of the second phases by modifications of those phases and (ii) in- creased the protectiveness of the surface films. Similar influences might be present in the alloys (MgGdNdZr, MgDyNdZr) investi- gated by Kiryuu et al. [16], MgGd investigated by Hort et al. [25] and MgY investigated by Liu et al. [26]. Thus, an important aim in the present work was to study the influence on corrosion of the alloying elements in solid solution in binary Mg–RE alloys, with some expectation that these alloys in the solution heat-treated condition would have corrosion rates comparable to that of high-purity Mg. If the surface films were significantly more protective than that on high-purity Mg, then 0010-938X/$ - see front matter Ó 2013 Elsevier Ltd. All rights reserved. http://dx.doi.org/10.1016/j.corsci.2013.06.032 ⇑ Corresponding author. Tel.: +61 7 3365 3748. E-mail address: [email protected] (A. Atrens). Corrosion Science 76 (2013) 98–118 Contents lists available at SciVerse ScienceDirect Corrosion Science journal homepage: www.elsevier.com/locate/corsci
-
Upload
independent -
Category
Documents
-
view
4 -
download
0
Transcript of Corrosion behaviour in salt spray and in 3.5% NaCl solution saturated with Mg (OH) 2 of as-cast and...
Corrosion Science 76 (2013) 98–118
Contents lists available at SciVerse ScienceDirect
Corrosion Science
journal homepage: www.elsevier .com/locate /corsc i
Corrosion behaviour in salt spray and in 3.5% NaCl solution saturatedwith Mg(OH)2 of as-cast and solution heat-treated binary Mg–RE alloys:RE = Ce, La, Nd, Y, Gd
0010-938X/$ - see front matter � 2013 Elsevier Ltd. All rights reserved.http://dx.doi.org/10.1016/j.corsci.2013.06.032
⇑ Corresponding author. Tel.: +61 7 3365 3748.E-mail address: [email protected] (A. Atrens).
Zhiming Shi a, Fuyong Cao a, Guang-Ling Song a,b, Ming Liu c, Andrej Atrens a,⇑a The University of Queensland, Materials Engineering, Brisbane, Qld 4072, Australiab Oak Ridge National Lab, Corros Sci & Technol, Oak Ridge, TN 37831-6156, USAc GM China Science Lab, 56 Jinwan Road, Pudong, Shanghai 201206, China
a r t i c l e i n f o
Article history:Received 27 March 2013Accepted 18 June 2013Available online 28 June 2013
Keywords:A. MagnesiumA. Rare earth elementsB. Weight lossB. SEMB. EIS
a b s t r a c t
Corrosion behaviour was characterised in salt spray and in 3.5% NaCl solution saturated with Mg(OH)2 ofas-cast and solution heat-treated binary Mg–RE alloys. The corrosion rate in the immersion test for thesolution heat-treated Mg–RE alloys was substantial, and was greater than that of high-purity Mg. Thesecorrosion rates were probably caused by the particles in the microstructure and/or by Fe rich particlesprecipitated during the solution heat-treatment. The corrosion rate in the immersion tests for each as-cast Mg–RE alloy was greater than that of high-purity Mg, attributed to micro-galvanic accelerationcaused by the second phase. Corrosion rates in salt spray had a general correlation with corrosion ratesin the immersion tests, but there were differences. The values of apparent valence were always less than2 consistent with Mg corrosion being only partly under electrochemical control.
� 2013 Elsevier Ltd. All rights reserved.
1. Introduction
1.1. Mg alloys
The corrosion rate of magnesium (Mg) alloys [1–7] is typicallyhigher than that of high-purity (HP) Mg, because typical Mg alloysare used as-cast, and the second phases in Mg alloys typicallyaccelerate the corrosion by micro-galvanic coupling with the ma-trix alpha-Mg phase. This is particularly the case for corrosion intechnically relevant solutions of which 3.5% NaCl solution is a typ-ical example. Such solutions are widely used to simulate the worstconditions that might occur in auto service close to the sea, orwhere road salt is widely used in winter. Table 1 comparescorrosion rate data for HP Mg [7–14] with some data for Mg alloyscontaining rare earth (RE) alloying elements [15–26]. Corrosionrate measurements for HP Mg range from 0.38 to 1.8 mm y�1.Shi and Atrens [12] maintain that the lowest measurements(0.34 ± 0.24 mm y�1) represent the intrinsic corrosion rate. Re-cently, Cao et al. [14] found that the intrinsic corrosion rate was0.25 ± 0.07 mm y�1 for ultra-pure Mg produced by distillation.
Table 1 indicates that some of the RE containing Mg have corro-sion rates comparable with than of HP Mg. Of particular interestare the low corrosion rates measured by Liu et al. [21,22] forAM60 and AZ91 containing various amounts of La and Ce, evalu-
ated from the measured amount of hydrogen evolution. The corro-sion rates were comparable to, or in some cases apparently less,than the corrosion rates for HP Mg. The lowest corrosion ratesmeasured by Liu et al. [21,22] were most probably underestimatesof the actual corrosion rate, because recent research [5,14] hasshown that corrosion rates are significant under estimates whenevaluated using the measured evolved hydrogen at low corrosionrates, in which case the amount of hydrogen dissolved in the Mgspecimen gives an appreciable error in the measurement of thecorrosion rate. Taking this factor into account, the corrosion ratesof all the Mg alloys are each equal to or greater than the corrosionrate of HP Mg, as has been repeatedly found in reviews of the liter-ature [1–4].
Nevertheless, the corrosion rates measured by Liu et al. [21,22]were low and comparable to those of HP Mg. They argued that theRE alloying elements (i) decreased the micro-galvanic influence ofthe second phases by modifications of those phases and (ii) in-creased the protectiveness of the surface films. Similar influencesmight be present in the alloys (MgGdNdZr, MgDyNdZr) investi-gated by Kiryuu et al. [16], MgGd investigated by Hort et al. [25]and MgY investigated by Liu et al. [26].
Thus, an important aim in the present work was to study theinfluence on corrosion of the alloying elements in solid solutionin binary Mg–RE alloys, with some expectation that these alloysin the solution heat-treated condition would have corrosion ratescomparable to that of high-purity Mg. If the surface films weresignificantly more protective than that on high-purity Mg, then
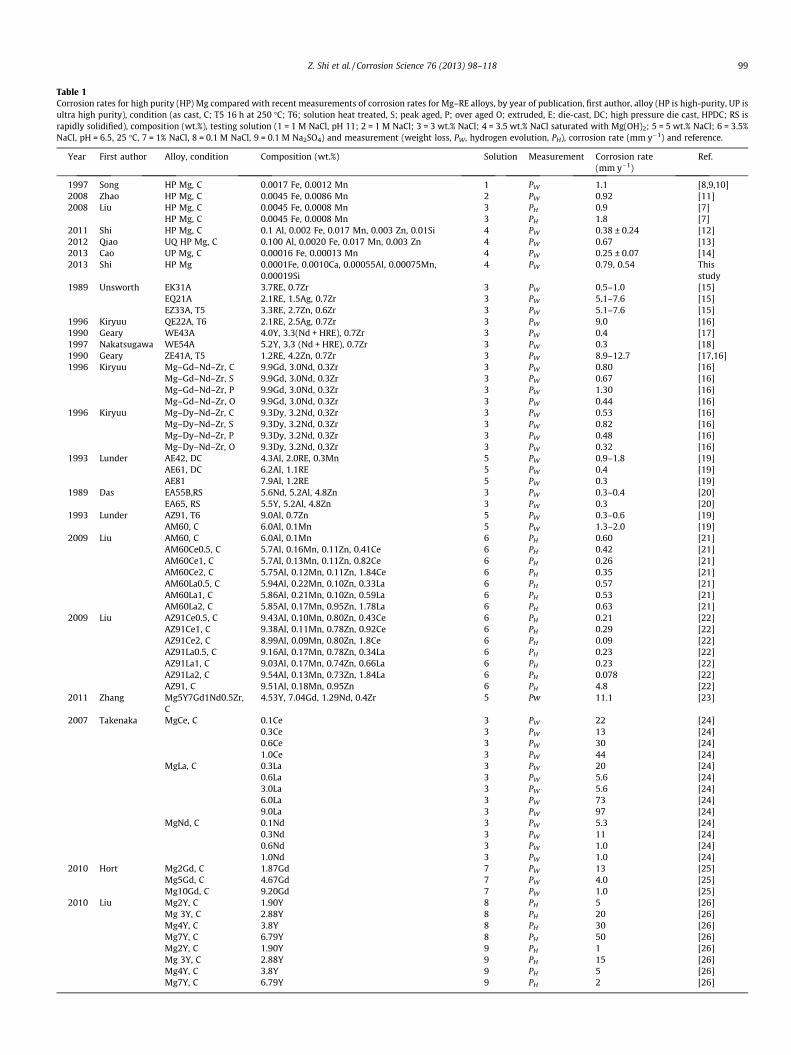
Table 1Corrosion rates for high purity (HP) Mg compared with recent measurements of corrosion rates for Mg–RE alloys, by year of publication, first author, alloy (HP is high-purity, UP isultra high purity), condition (as cast, C; T5 16 h at 250 �C; T6; solution heat treated, S; peak aged, P; over aged O; extruded, E; die-cast, DC; high pressure die cast, HPDC; RS israpidly solidified), composition (wt.%), testing solution (1 = 1 M NaCl, pH 11; 2 = 1 M NaCl; 3 = 3 wt.% NaCl; 4 = 3.5 wt.% NaCl saturated with Mg(OH)2; 5 = 5 wt.% NaCl; 6 = 3.5%NaCl, pH = 6.5, 25 �C, 7 = 1% NaCl, 8 = 0.1 M NaCl, 9 = 0.1 M Na2SO4) and measurement (weight loss, PW, hydrogen evolution, PH), corrosion rate (mm y�1) and reference.
Year First author Alloy, condition Composition (wt.%) Solution Measurement Corrosion rate(mm y�1)
Ref.
1997 Song HP Mg, C 0.0017 Fe, 0.0012 Mn 1 PW 1.1 [8,9,10]2008 Zhao HP Mg, C 0.0045 Fe, 0.0086 Mn 2 PW 0.92 [11]2008 Liu HP Mg, C 0.0045 Fe, 0.0008 Mn 3 PH 0.9 [7]
HP Mg, C 0.0045 Fe, 0.0008 Mn 3 PH 1.8 [7]2011 Shi HP Mg, C 0.1 Al, 0.002 Fe, 0.017 Mn, 0.003 Zn, 0.01Si 4 PW 0.38 ± 0.24 [12]2012 Qiao UQ HP Mg, C 0.100 Al, 0.0020 Fe, 0.017 Mn, 0.003 Zn 4 PW 0.67 [13]2013 Cao UP Mg, C 0.00016 Fe, 0.00013 Mn 4 PW 0.25 ± 0.07 [14]2013 Shi HP Mg 0.0001Fe, 0.0010Ca, 0.00055Al, 0.00075Mn,
0.00019Si4 PW 0.79, 0.54 This
study1989 Unsworth EK31A 3.7RE, 0.7Zr 3 PW 0.5–1.0 [15]
EQ21A 2.1RE, 1.5Ag, 0.7Zr 3 PW 5.1–7.6 [15]EZ33A, T5 3.3RE, 2.7Zn, 0.6Zr 3 PW 5.1–7.6 [15]
1996 Kiryuu QE22A, T6 2.1RE, 2.5Ag, 0.7Zr 3 PW 9.0 [16]1990 Geary WE43A 4.0Y, 3.3(Nd + HRE), 0.7Zr 3 PW 0.4 [17]1997 Nakatsugawa WE54A 5.2Y, 3.3 (Nd + HRE), 0.7Zr 3 PW 0.3 [18]1990 Geary ZE41A, T5 1.2RE, 4.2Zn, 0.7Zr 3 PW 8.9–12.7 [17,16]1996 Kiryuu Mg–Gd–Nd–Zr, C 9.9Gd, 3.0Nd, 0.3Zr 3 PW 0.80 [16]
Mg–Gd–Nd–Zr, S 9.9Gd, 3.0Nd, 0.3Zr 3 PW 0.67 [16]Mg–Gd–Nd–Zr, P 9.9Gd, 3.0Nd, 0.3Zr 3 PW 1.30 [16]Mg–Gd–Nd–Zr, O 9.9Gd, 3.0Nd, 0.3Zr 3 PW 0.44 [16]
1996 Kiryuu Mg–Dy–Nd–Zr, C 9.3Dy, 3.2Nd, 0.3Zr 3 PW 0.53 [16]Mg–Dy–Nd–Zr, S 9.3Dy, 3.2Nd, 0.3Zr 3 PW 0.82 [16]Mg–Dy–Nd–Zr, P 9.3Dy, 3.2Nd, 0.3Zr 3 PW 0.48 [16]Mg–Dy–Nd–Zr, O 9.3Dy, 3.2Nd, 0.3Zr 3 PW 0.32 [16]
1993 Lunder AE42, DC 4.3Al, 2.0RE, 0.3Mn 5 PW 0.9–1.8 [19]AE61, DC 6.2Al, 1.1RE 5 PW 0.4 [19]AE81 7.9Al, 1.2RE 5 PW 0.3 [19]
1989 Das EA55B,RS 5.6Nd, 5.2Al, 4.8Zn 3 PW 0.3–0.4 [20]EA65, RS 5.5Y, 5.2Al, 4.8Zn 3 PW 0.3 [20]
1993 Lunder AZ91, T6 9.0Al, 0.7Zn 5 PW 0.3–0.6 [19]AM60, C 6.0Al, 0.1Mn 5 PW 1.3–2.0 [19]
2009 Liu AM60, C 6.0Al, 0.1Mn 6 PH 0.60 [21]AM60Ce0.5, C 5.7Al, 0.16Mn, 0.11Zn, 0.41Ce 6 PH 0.42 [21]AM60Ce1, C 5.7Al, 0.13Mn, 0.11Zn, 0.82Ce 6 PH 0.26 [21]AM60Ce2, C 5.75Al, 0.12Mn, 0.11Zn, 1.84Ce 6 PH 0.35 [21]AM60La0.5, C 5.94Al, 0.22Mn, 0.10Zn, 0.33La 6 PH 0.57 [21]AM60La1, C 5.86Al, 0.21Mn, 0.10Zn, 0.59La 6 PH 0.53 [21]AM60La2, C 5.85Al, 0.17Mn, 0.95Zn, 1.78La 6 PH 0.63 [21]
2009 Liu AZ91Ce0.5, C 9.43Al, 0.10Mn, 0.80Zn, 0.43Ce 6 PH 0.21 [22]AZ91Ce1, C 9.38Al, 0.11Mn, 0.78Zn, 0.92Ce 6 PH 0.29 [22]AZ91Ce2, C 8.99Al, 0.09Mn, 0.80Zn, 1.8Ce 6 PH 0.09 [22]AZ91La0.5, C 9.16Al, 0.17Mn, 0.78Zn, 0.34La 6 PH 0.23 [22]AZ91La1, C 9.03Al, 0.17Mn, 0.74Zn, 0.66La 6 PH 0.23 [22]AZ91La2, C 9.54Al, 0.13Mn, 0.73Zn, 1.84La 6 PH 0.078 [22]AZ91, C 9.51Al, 0.18Mn, 0.95Zn 6 PH 4.8 [22]
2011 Zhang Mg5Y7Gd1Nd0.5Zr,C
4.53Y, 7.04Gd, 1.29Nd, 0.4Zr 5 Pw 11.1 [23]
2007 Takenaka MgCe, C 0.1Ce 3 PW 22 [24]0.3Ce 3 PW 13 [24]0.6Ce 3 PW 30 [24]1.0Ce 3 PW 44 [24]
MgLa, C 0.3La 3 PW 20 [24]0.6La 3 PW 5.6 [24]3.0La 3 PW 5.6 [24]6.0La 3 PW 73 [24]9.0La 3 PW 97 [24]
MgNd, C 0.1Nd 3 PW 5.3 [24]0.3Nd 3 PW 11 [24]0.6Nd 3 PW 1.0 [24]1.0Nd 3 PW 1.0 [24]
2010 Hort Mg2Gd, C 1.87Gd 7 PW 13 [25]Mg5Gd, C 4.67Gd 7 PW 4.0 [25]Mg10Gd, C 9.20Gd 7 PW 1.0 [25]
2010 Liu Mg2Y, C 1.90Y 8 PH 5 [26]Mg 3Y, C 2.88Y 8 PH 20 [26]Mg4Y, C 3.8Y 8 PH 30 [26]Mg7Y, C 6.79Y 8 PH 50 [26]Mg2Y, C 1.90Y 9 PH 1 [26]Mg 3Y, C 2.88Y 9 PH 15 [26]Mg4Y, C 3.8Y 9 PH 5 [26]Mg7Y, C 6.79Y 9 PH 2 [26]
Z. Shi et al. / Corrosion Science 76 (2013) 98–118 99
100 Z. Shi et al. / Corrosion Science 76 (2013) 98–118
the corrosion rates of the solution heat-treated MgRE alloys wouldbe expected to be significantly lower than that of high-purity Mg.This is the same principle whereby a more protective surface filmproduces stainless alloys (stainless steels, and similarly in Ni–Cr,Co–Cr, Fe–Si, and Fe–Ti alloys) [27–39]. However, an importantconsideration in the study of Mg alloys is the alloy impurity assummarised in the next section.
1.2. Ultra-high-purity Mg–RE alloys
Low-purity Mg can have corrosion rates orders of magnitudegreater than that of HP Mg [1,7]. This is particularly importantfor Mg alloys containing a concentration of Fe greater than thetolerance limit. In these cases, the Fe impurity can dominatethe corrosion behaviour, despite the fact that completely differ-ent influences were being studied [7]. Furthermore, pickup ofFe is relatively easy because molten Mg is widely handled usingsteel vessels, and mechanical working of Mg uses steel tools[40]. Liu et al. [7] explained the Fe tolerance limit in terms ofthe Mg–Fe phase diagram. Liu et al. [7] predicted that heat-trea-ted Mg alloys have a Fe tolerance limit less than 2 ppm. If thisprediction is correct, the study of the influence on corrosion ofalloying elements in solid solution in Mg alloys requires the pro-duction of each Mg alloy in an ultra-high-purity version with theFe content less than 2 ppm, so that the corrosion behaviour isinfluenced by the alloying element, rather than being dominatedby the Fe impurity content [7,41].
Prasad et al. [42] recently showed that Zr can be used to re-move the Fe impurity element from the melt for Mg alloys,allowing for the first time the opportunity of the production ofultra-high-purity (UP) Mg–X alloys. There is the possibility ofthe production of stainless magnesium as proposed by Songand Atrens [2], if an alloying element Z can be found that pro-duces a surface passive film based on the element Z, rather thanthe poorly protective film that naturally forms on the surface ofMg. Cao et al. [43] explored the possibility that corrosion rateslower than that of HP Mg might be produced by solution heat-treated Mg–X alloys, where X = Mn, Sn, Ca, Zn, Al, Zr, Si, andSr. However, corrosion rates of the solution heat-treated Mg–Xalloys were not lower than those of high-purity Mg as had beenexpected. Particles in the microstructure were the likely cause ofthe higher than expected corrosion rates. This present work fol-lows on from that of Cao et al. [43].
The primary aim of this research was to elucidate the influenceof the rare earth (RE) alloying elements RE = Ce, La, Nd, Y and Gd insolid solution on the corrosion of binary Mg–RE alloys, usingimmersion tests and salt spray tests. To complement the primaryaim, the corrosion behaviour of these binary Mg–RE alloys was alsocharacterised in the as-cast condition. The corrosion behaviour ofas-cast high-purity Mg (HP Mg) was also measured as a compari-son standard.
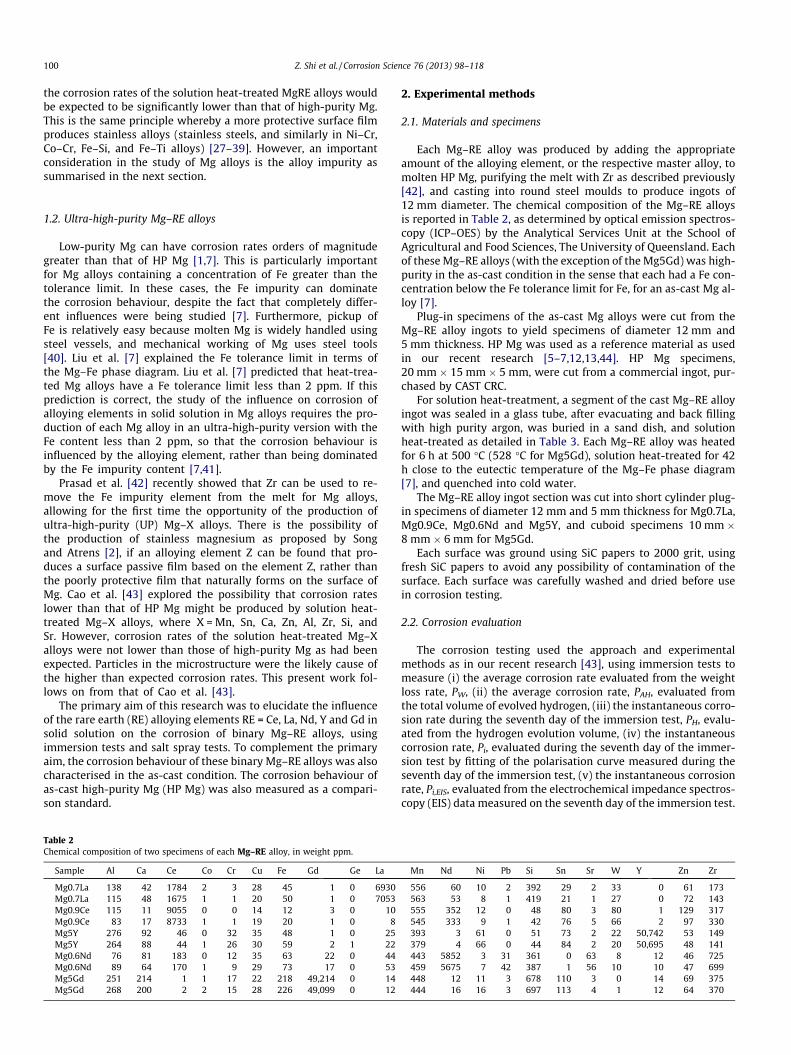
Table 2Chemical composition of two specimens of each Mg–RE alloy, in weight ppm.
Sample Al Ca Ce Co Cr Cu Fe Gd Ge La
Mg0.7La 138 42 1784 2 3 28 45 1 0 6930Mg0.7La 115 48 1675 1 1 20 50 1 0 7053Mg0.9Ce 115 11 9055 0 0 14 12 3 0 10Mg0.9Ce 83 17 8733 1 1 19 20 1 0 8Mg5Y 276 92 46 0 32 35 48 1 0 25Mg5Y 264 88 44 1 26 30 59 2 1 22Mg0.6Nd 76 81 183 0 12 35 63 22 0 44Mg0.6Nd 89 64 170 1 9 29 73 17 0 53Mg5Gd 251 214 1 1 17 22 218 49,214 0 14Mg5Gd 268 200 2 2 15 28 226 49,099 0 12
2. Experimental methods
2.1. Materials and specimens
Each Mg–RE alloy was produced by adding the appropriateamount of the alloying element, or the respective master alloy, tomolten HP Mg, purifying the melt with Zr as described previously[42], and casting into round steel moulds to produce ingots of12 mm diameter. The chemical composition of the Mg–RE alloysis reported in Table 2, as determined by optical emission spectros-copy (ICP–OES) by the Analytical Services Unit at the School ofAgricultural and Food Sciences, The University of Queensland. Eachof these Mg–RE alloys (with the exception of the Mg5Gd) was high-purity in the as-cast condition in the sense that each had a Fe con-centration below the Fe tolerance limit for Fe, for an as-cast Mg al-loy [7].
Plug-in specimens of the as-cast Mg alloys were cut from theMg–RE alloy ingots to yield specimens of diameter 12 mm and5 mm thickness. HP Mg was used as a reference material as usedin our recent research [5–7,12,13,44]. HP Mg specimens,20 mm � 15 mm � 5 mm, were cut from a commercial ingot, pur-chased by CAST CRC.
For solution heat-treatment, a segment of the cast Mg–RE alloyingot was sealed in a glass tube, after evacuating and back fillingwith high purity argon, was buried in a sand dish, and solutionheat-treated as detailed in Table 3. Each Mg–RE alloy was heatedfor 6 h at 500 �C (528 �C for Mg5Gd), solution heat-treated for 42h close to the eutectic temperature of the Mg–Fe phase diagram[7], and quenched into cold water.
The Mg–RE alloy ingot section was cut into short cylinder plug-in specimens of diameter 12 mm and 5 mm thickness for Mg0.7La,Mg0.9Ce, Mg0.6Nd and Mg5Y, and cuboid specimens 10 mm �8 mm � 6 mm for Mg5Gd.
Each surface was ground using SiC papers to 2000 grit, usingfresh SiC papers to avoid any possibility of contamination of thesurface. Each surface was carefully washed and dried before usein corrosion testing.
2.2. Corrosion evaluation
The corrosion testing used the approach and experimentalmethods as in our recent research [43], using immersion tests tomeasure (i) the average corrosion rate evaluated from the weightloss rate, PW, (ii) the average corrosion rate, PAH, evaluated fromthe total volume of evolved hydrogen, (iii) the instantaneous corro-sion rate during the seventh day of the immersion test, PH, evalu-ated from the hydrogen evolution volume, (iv) the instantaneouscorrosion rate, Pi, evaluated during the seventh day of the immer-sion test by fitting of the polarisation curve measured during theseventh day of the immersion test, (v) the instantaneous corrosionrate, Pi,EIS, evaluated from the electrochemical impedance spectros-copy (EIS) data measured on the seventh day of the immersion test.
Mn Nd Ni Pb Si Sn Sr W Y Zn Zr
556 60 10 2 392 29 2 33 0 61 173563 53 8 1 419 21 1 27 0 72 143555 352 12 0 48 80 3 80 1 129 317545 333 9 1 42 76 5 66 2 97 330393 3 61 0 51 73 2 22 50,742 53 149379 4 66 0 44 84 2 20 50,695 48 141443 5852 3 31 361 0 63 8 12 46 725459 5675 7 42 387 1 56 10 10 47 699448 12 11 3 678 110 3 0 14 69 375444 16 16 3 697 113 4 1 12 64 370
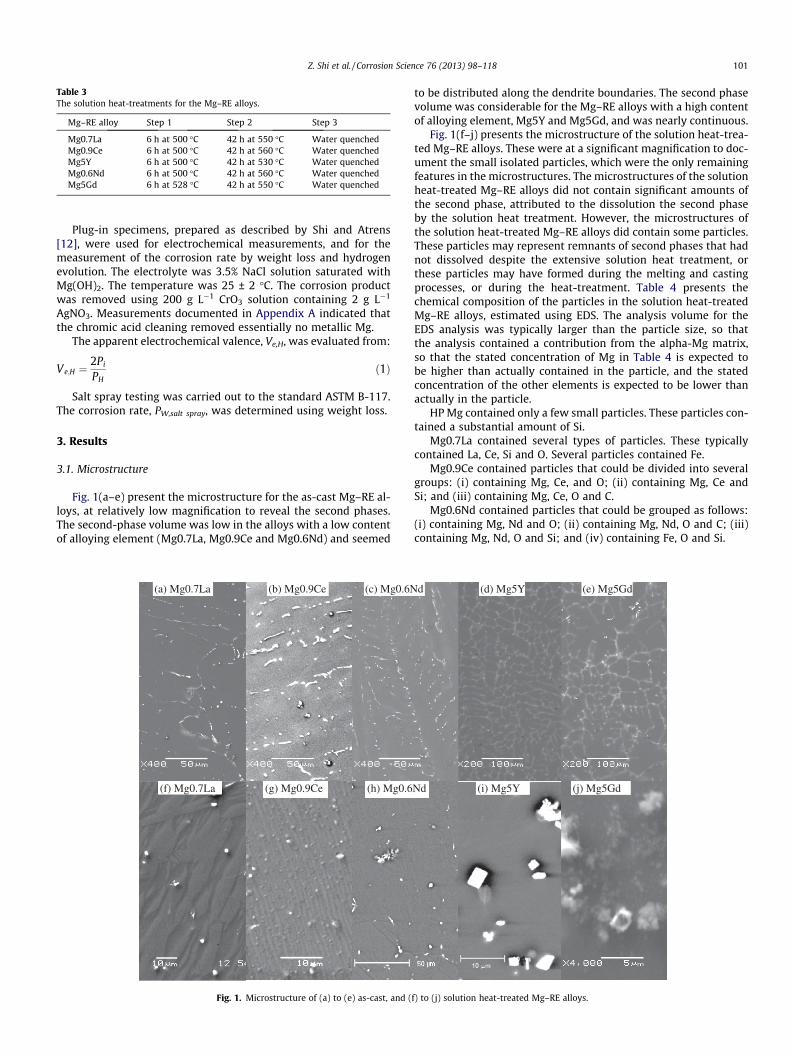
Table 3The solution heat-treatments for the Mg–RE alloys.
Mg–RE alloy Step 1 Step 2 Step 3
Mg0.7La 6 h at 500 �C 42 h at 550 �C Water quenchedMg0.9Ce 6 h at 500 �C 42 h at 560 �C Water quenchedMg5Y 6 h at 500 �C 42 h at 530 �C Water quenchedMg0.6Nd 6 h at 500 �C 42 h at 560 �C Water quenchedMg5Gd 6 h at 528 �C 42 h at 550 �C Water quenched
Z. Shi et al. / Corrosion Science 76 (2013) 98–118 101
Plug-in specimens, prepared as described by Shi and Atrens[12], were used for electrochemical measurements, and for themeasurement of the corrosion rate by weight loss and hydrogenevolution. The electrolyte was 3.5% NaCl solution saturated withMg(OH)2. The temperature was 25 ± 2 �C. The corrosion productwas removed using 200 g L�1 CrO3 solution containing 2 g L�1
AgNO3. Measurements documented in Appendix A indicated thatthe chromic acid cleaning removed essentially no metallic Mg.
The apparent electrochemical valence, Ve,H, was evaluated from:
Ve;H ¼2Pi
PHð1Þ
Salt spray testing was carried out to the standard ASTM B-117.The corrosion rate, PW,salt spray, was determined using weight loss.
3. Results
3.1. Microstructure
Fig. 1(a–e) present the microstructure for the as-cast Mg–RE al-loys, at relatively low magnification to reveal the second phases.The second-phase volume was low in the alloys with a low contentof alloying element (Mg0.7La, Mg0.9Ce and Mg0.6Nd) and seemed
(c) Mg0.6N
(h) Mg0.6
(b) Mg0.9Ce
(g) Mg0.9Ce
(a) Mg0.7La
(f) Mg0.7La
Fig. 1. Microstructure of (a) to (e) as-cast, and (
to be distributed along the dendrite boundaries. The second phasevolume was considerable for the Mg–RE alloys with a high contentof alloying element, Mg5Y and Mg5Gd, and was nearly continuous.
Fig. 1(f–j) presents the microstructure of the solution heat-trea-ted Mg–RE alloys. These were at a significant magnification to doc-ument the small isolated particles, which were the only remainingfeatures in the microstructures. The microstructures of the solutionheat-treated Mg–RE alloys did not contain significant amounts ofthe second phase, attributed to the dissolution the second phaseby the solution heat treatment. However, the microstructures ofthe solution heat-treated Mg–RE alloys did contain some particles.These particles may represent remnants of second phases that hadnot dissolved despite the extensive solution heat treatment, orthese particles may have formed during the melting and castingprocesses, or during the heat-treatment. Table 4 presents thechemical composition of the particles in the solution heat-treatedMg–RE alloys, estimated using EDS. The analysis volume for theEDS analysis was typically larger than the particle size, so thatthe analysis contained a contribution from the alpha-Mg matrix,so that the stated concentration of Mg in Table 4 is expected tobe higher than actually contained in the particle, and the statedconcentration of the other elements is expected to be lower thanactually in the particle.
HP Mg contained only a few small particles. These particles con-tained a substantial amount of Si.
Mg0.7La contained several types of particles. These typicallycontained La, Ce, Si and O. Several particles contained Fe.
Mg0.9Ce contained particles that could be divided into severalgroups: (i) containing Mg, Ce, and O; (ii) containing Mg, Ce andSi; and (iii) containing Mg, Ce, O and C.
Mg0.6Nd contained particles that could be grouped as follows:(i) containing Mg, Nd and O; (ii) containing Mg, Nd, O and C; (iii)containing Mg, Nd, O and Si; and (iv) containing Fe, O and Si.
(e) Mg5Gd
(j) Mg5Gd
(d) Mg5Y
(i) Mg5Y
d
Nd
f) to (j) solution heat-treated Mg–RE alloys.
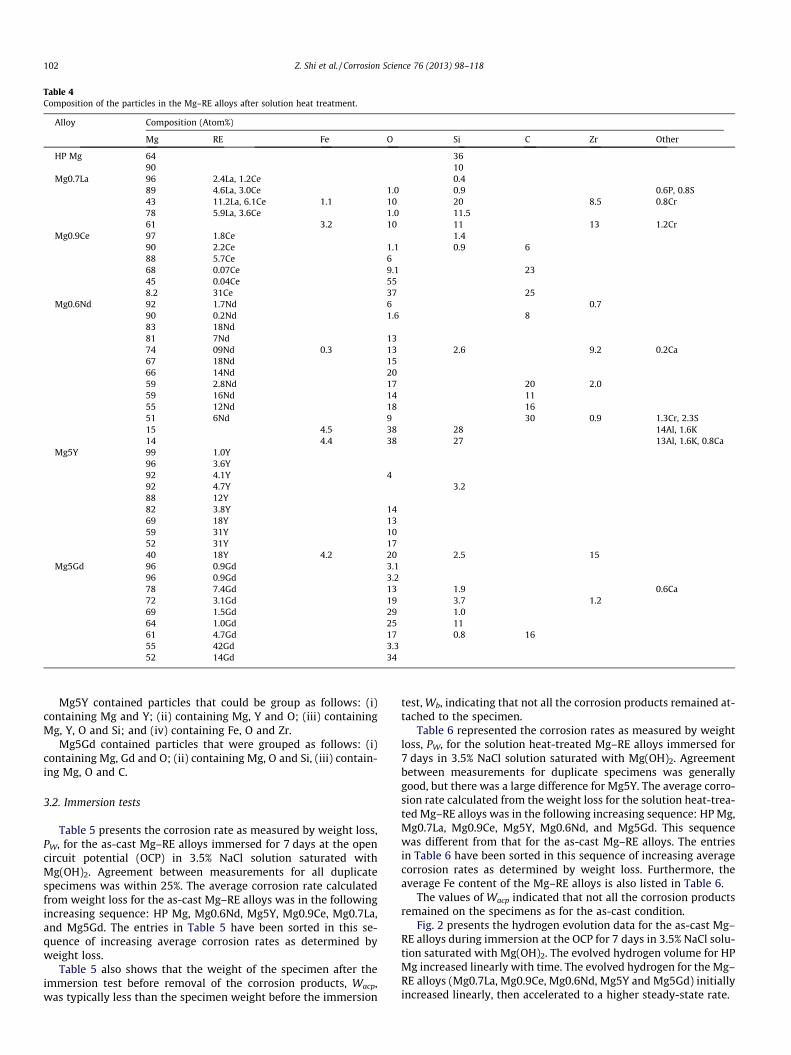
Table 4Composition of the particles in the Mg–RE alloys after solution heat treatment.
Alloy Composition (Atom%)
Mg RE Fe O Si C Zr Other
HP Mg 64 3690 10
Mg0.7La 96 2.4La, 1.2Ce 0.489 4.6La, 3.0Ce 1.0 0.9 0.6P, 0.8S43 11.2La, 6.1Ce 1.1 10 20 8.5 0.8Cr78 5.9La, 3.6Ce 1.0 11.561 3.2 10 11 13 1.2Cr
Mg0.9Ce 97 1.8Ce 1.490 2.2Ce 1.1 0.9 688 5.7Ce 668 0.07Ce 9.1 2345 0.04Ce 558.2 31Ce 37 25
Mg0.6Nd 92 1.7Nd 6 0.790 0.2Nd 1.6 883 18Nd81 7Nd 1374 09Nd 0.3 13 2.6 9.2 0.2Ca67 18Nd 1566 14Nd 2059 2.8Nd 17 20 2.059 16Nd 14 1155 12Nd 18 1651 6Nd 9 30 0.9 1.3Cr, 2.3S15 4.5 38 28 14Al, 1.6K14 4.4 38 27 13Al, 1.6K, 0.8Ca
Mg5Y 99 1.0Y96 3.6Y92 4.1Y 492 4.7Y 3.288 12Y82 3.8Y 1469 18Y 1359 31Y 1052 31Y 1740 18Y 4.2 20 2.5 15
Mg5Gd 96 0.9Gd 3.196 0.9Gd 3.278 7.4Gd 13 1.9 0.6Ca72 3.1Gd 19 3.7 1.269 1.5Gd 29 1.064 1.0Gd 25 1161 4.7Gd 17 0.8 1655 42Gd 3.352 14Gd 34
102 Z. Shi et al. / Corrosion Science 76 (2013) 98–118
Mg5Y contained particles that could be group as follows: (i)containing Mg and Y; (ii) containing Mg, Y and O; (iii) containingMg, Y, O and Si; and (iv) containing Fe, O and Zr.
Mg5Gd contained particles that were grouped as follows: (i)containing Mg, Gd and O; (ii) containing Mg, O and Si, (iii) contain-ing Mg, O and C.
3.2. Immersion tests
Table 5 presents the corrosion rate as measured by weight loss,PW, for the as-cast Mg–RE alloys immersed for 7 days at the opencircuit potential (OCP) in 3.5% NaCl solution saturated withMg(OH)2. Agreement between measurements for all duplicatespecimens was within 25%. The average corrosion rate calculatedfrom weight loss for the as-cast Mg–RE alloys was in the followingincreasing sequence: HP Mg, Mg0.6Nd, Mg5Y, Mg0.9Ce, Mg0.7La,and Mg5Gd. The entries in Table 5 have been sorted in this se-quence of increasing average corrosion rates as determined byweight loss.
Table 5 also shows that the weight of the specimen after theimmersion test before removal of the corrosion products, Wacp,was typically less than the specimen weight before the immersion
test, Wb, indicating that not all the corrosion products remained at-tached to the specimen.
Table 6 represented the corrosion rates as measured by weightloss, PW, for the solution heat-treated Mg–RE alloys immersed for7 days in 3.5% NaCl solution saturated with Mg(OH)2. Agreementbetween measurements for duplicate specimens was generallygood, but there was a large difference for Mg5Y. The average corro-sion rate calculated from the weight loss for the solution heat-trea-ted Mg–RE alloys was in the following increasing sequence: HP Mg,Mg0.7La, Mg0.9Ce, Mg5Y, Mg0.6Nd, and Mg5Gd. This sequencewas different from that for the as-cast Mg–RE alloys. The entriesin Table 6 have been sorted in this sequence of increasing averagecorrosion rates as determined by weight loss. Furthermore, theaverage Fe content of the Mg–RE alloys is also listed in Table 6.
The values of Wacp indicated that not all the corrosion productsremained on the specimens as for the as-cast condition.
Fig. 2 presents the hydrogen evolution data for the as-cast Mg–RE alloys during immersion at the OCP for 7 days in 3.5% NaCl solu-tion saturated with Mg(OH)2. The evolved hydrogen volume for HPMg increased linearly with time. The evolved hydrogen for the Mg–RE alloys (Mg0.7La, Mg0.9Ce, Mg0.6Nd, Mg5Y and Mg5Gd) initiallyincreased linearly, then accelerated to a higher steady-state rate.
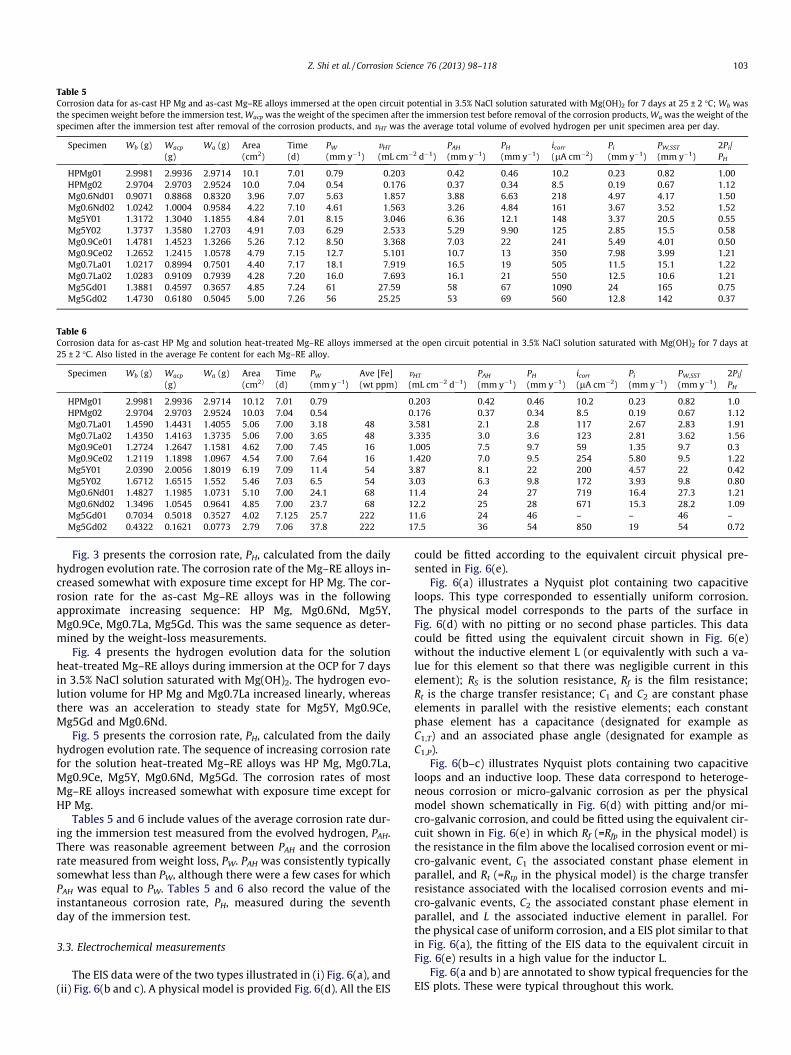
Table 5Corrosion data for as-cast HP Mg and as-cast Mg–RE alloys immersed at the open circuit potential in 3.5% NaCl solution saturated with Mg(OH)2 for 7 days at 25 ± 2 �C; Wb wasthe specimen weight before the immersion test, Wacp was the weight of the specimen after the immersion test before removal of the corrosion products, Wa was the weight of thespecimen after the immersion test after removal of the corrosion products, and vHT was the average total volume of evolved hydrogen per unit specimen area per day.
Specimen Wb (g) Wacp
(g)Wa (g) Area
(cm2)Time(d)
PW
(mm y�1)vHT
(mL cm�2 d�1)PAH
(mm y�1)PH
(mm y�1)icorr
(lA cm�2)Pi
(mm y�1)PW,SST
(mm y�1)2Pi/PH
HPMg01 2.9981 2.9936 2.9714 10.1 7.01 0.79 0.203 0.42 0.46 10.2 0.23 0.82 1.00HPMg02 2.9704 2.9703 2.9524 10.0 7.04 0.54 0.176 0.37 0.34 8.5 0.19 0.67 1.12Mg0.6Nd01 0.9071 0.8868 0.8320 3.96 7.07 5.63 1.857 3.88 6.63 218 4.97 4.17 1.50Mg0.6Nd02 1.0242 1.0004 0.9584 4.22 7.10 4.61 1.563 3.26 4.84 161 3.67 3.52 1.52Mg5Y01 1.3172 1.3040 1.1855 4.84 7.01 8.15 3.046 6.36 12.1 148 3.37 20.5 0.55Mg5Y02 1.3737 1.3580 1.2703 4.91 7.03 6.29 2.533 5.29 9.90 125 2.85 15.5 0.58Mg0.9Ce01 1.4781 1.4523 1.3266 5.26 7.12 8.50 3.368 7.03 22 241 5.49 4.01 0.50Mg0.9Ce02 1.2652 1.2415 1.0578 4.79 7.15 12.7 5.101 10.7 13 350 7.98 3.99 1.21Mg0.7La01 1.0217 0.8994 0.7501 4.40 7.17 18.1 7.919 16.5 19 505 11.5 15.1 1.22Mg0.7La02 1.0283 0.9109 0.7939 4.28 7.20 16.0 7.693 16.1 21 550 12.5 10.6 1.21Mg5Gd01 1.3881 0.4597 0.3657 4.85 7.24 61 27.59 58 67 1090 24 165 0.75Mg5Gd02 1.4730 0.6180 0.5045 5.00 7.26 56 25.25 53 69 560 12.8 142 0.37
Table 6Corrosion data for as-cast HP Mg and solution heat-treated Mg–RE alloys immersed at the open circuit potential in 3.5% NaCl solution saturated with Mg(OH)2 for 7 days at25 ± 2 �C. Also listed in the average Fe content for each Mg–RE alloy.
Specimen Wb (g) Wacp
(g)Wa (g) Area
(cm2)Time(d)
PW
(mm y�1)Ave [Fe](wt ppm)
vHT
(mL cm�2 d�1)PAH
(mm y�1)PH
(mm y�1)icorr
(lA cm�2)Pi
(mm y�1)PW,SST
(mm y�1)2Pi/PH
HPMg01 2.9981 2.9936 2.9714 10.12 7.01 0.79 0.203 0.42 0.46 10.2 0.23 0.82 1.0HPMg02 2.9704 2.9703 2.9524 10.03 7.04 0.54 0.176 0.37 0.34 8.5 0.19 0.67 1.12Mg0.7La01 1.4590 1.4431 1.4055 5.06 7.00 3.18 48 3.581 2.1 2.8 117 2.67 2.83 1.91Mg0.7La02 1.4350 1.4163 1.3735 5.06 7.00 3.65 48 3.335 3.0 3.6 123 2.81 3.62 1.56Mg0.9Ce01 1.2724 1.2647 1.1581 4.62 7.00 7.45 16 1.005 7.5 9.7 59 1.35 9.7 0.3Mg0.9Ce02 1.2119 1.1898 1.0967 4.54 7.00 7.64 16 1.420 7.0 9.5 254 5.80 9.5 1.22Mg5Y01 2.0390 2.0056 1.8019 6.19 7.09 11.4 54 3.87 8.1 22 200 4.57 22 0.42Mg5Y02 1.6712 1.6515 1.552 5.46 7.03 6.5 54 3.03 6.3 9.8 172 3.93 9.8 0.80Mg0.6Nd01 1.4827 1.1985 1.0731 5.10 7.00 24.1 68 11.4 24 27 719 16.4 27.3 1.21Mg0.6Nd02 1.3496 1.0545 0.9641 4.85 7.00 23.7 68 12.2 25 28 671 15.3 28.2 1.09Mg5Gd01 0.7034 0.5018 0.3527 4.02 7.125 25.7 222 11.6 24 46 – – 46 –Mg5Gd02 0.4322 0.1621 0.0773 2.79 7.06 37.8 222 17.5 36 54 850 19 54 0.72
Z. Shi et al. / Corrosion Science 76 (2013) 98–118 103
Fig. 3 presents the corrosion rate, PH, calculated from the dailyhydrogen evolution rate. The corrosion rate of the Mg–RE alloys in-creased somewhat with exposure time except for HP Mg. The cor-rosion rate for the as-cast Mg–RE alloys was in the followingapproximate increasing sequence: HP Mg, Mg0.6Nd, Mg5Y,Mg0.9Ce, Mg0.7La, Mg5Gd. This was the same sequence as deter-mined by the weight-loss measurements.
Fig. 4 presents the hydrogen evolution data for the solutionheat-treated Mg–RE alloys during immersion at the OCP for 7 daysin 3.5% NaCl solution saturated with Mg(OH)2. The hydrogen evo-lution volume for HP Mg and Mg0.7La increased linearly, whereasthere was an acceleration to steady state for Mg5Y, Mg0.9Ce,Mg5Gd and Mg0.6Nd.
Fig. 5 presents the corrosion rate, PH, calculated from the dailyhydrogen evolution rate. The sequence of increasing corrosion ratefor the solution heat-treated Mg–RE alloys was HP Mg, Mg0.7La,Mg0.9Ce, Mg5Y, Mg0.6Nd, Mg5Gd. The corrosion rates of mostMg–RE alloys increased somewhat with exposure time except forHP Mg.
Tables 5 and 6 include values of the average corrosion rate dur-ing the immersion test measured from the evolved hydrogen, PAH.There was reasonable agreement between PAH and the corrosionrate measured from weight loss, PW. PAH was consistently typicallysomewhat less than PW, although there were a few cases for whichPAH was equal to PW. Tables 5 and 6 also record the value of theinstantaneous corrosion rate, PH, measured during the seventhday of the immersion test.
3.3. Electrochemical measurements
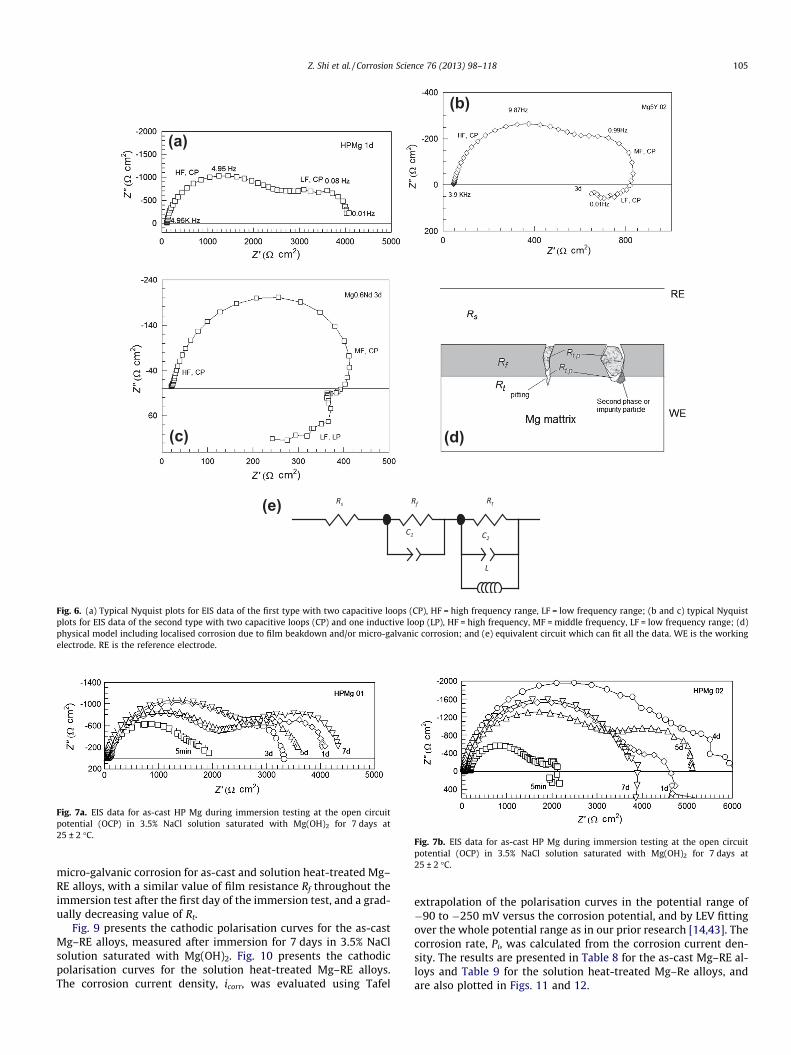
The EIS data were of the two types illustrated in (i) Fig. 6(a), and(ii) Fig. 6(b and c). A physical model is provided Fig. 6(d). All the EIS
could be fitted according to the equivalent circuit physical pre-sented in Fig. 6(e).
Fig. 6(a) illustrates a Nyquist plot containing two capacitiveloops. This type corresponded to essentially uniform corrosion.The physical model corresponds to the parts of the surface inFig. 6(d) with no pitting or no second phase particles. This datacould be fitted using the equivalent circuit shown in Fig. 6(e)without the inductive element L (or equivalently with such a va-lue for this element so that there was negligible current in thiselement); RS is the solution resistance, Rf is the film resistance;Rt is the charge transfer resistance; C1 and C2 are constant phaseelements in parallel with the resistive elements; each constantphase element has a capacitance (designated for example asC1,T) and an associated phase angle (designated for example asC1,P).
Fig. 6(b–c) illustrates Nyquist plots containing two capacitiveloops and an inductive loop. These data correspond to heteroge-neous corrosion or micro-galvanic corrosion as per the physicalmodel shown schematically in Fig. 6(d) with pitting and/or mi-cro-galvanic corrosion, and could be fitted using the equivalent cir-cuit shown in Fig. 6(e) in which Rf (=Rfp in the physical model) isthe resistance in the film above the localised corrosion event or mi-cro-galvanic event, C1 the associated constant phase element inparallel, and Rt (=Rtp in the physical model) is the charge transferresistance associated with the localised corrosion events and mi-cro-galvanic events, C2 the associated constant phase element inparallel, and L the associated inductive element in parallel. Forthe physical case of uniform corrosion, and a EIS plot similar to thatin Fig. 6(a), the fitting of the EIS data to the equivalent circuit inFig. 6(e) results in a high value for the inductor L.
Fig. 6(a and b) are annotated to show typical frequencies for theEIS plots. These were typical throughout this work.
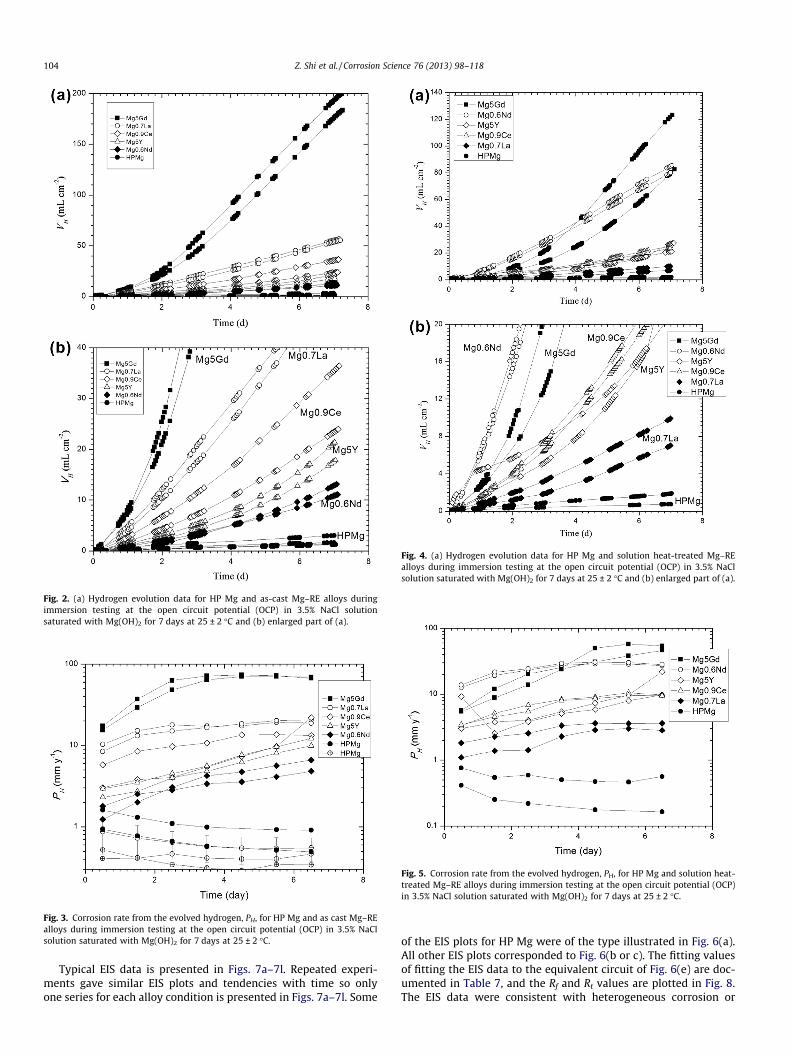
Fig. 2. (a) Hydrogen evolution data for HP Mg and as-cast Mg–RE alloys duringimmersion testing at the open circuit potential (OCP) in 3.5% NaCl solutionsaturated with Mg(OH)2 for 7 days at 25 ± 2 �C and (b) enlarged part of (a).
Fig. 3. Corrosion rate from the evolved hydrogen, PH, for HP Mg and as cast Mg–REalloys during immersion testing at the open circuit potential (OCP) in 3.5% NaClsolution saturated with Mg(OH)2 for 7 days at 25 ± 2 �C.
Fig. 4. (a) Hydrogen evolution data for HP Mg and solution heat-treated Mg–REalloys during immersion testing at the open circuit potential (OCP) in 3.5% NaClsolution saturated with Mg(OH)2 for 7 days at 25 ± 2 �C and (b) enlarged part of (a).
Fig. 5. Corrosion rate from the evolved hydrogen, PH, for HP Mg and solution heat-treated Mg–RE alloys during immersion testing at the open circuit potential (OCP)in 3.5% NaCl solution saturated with Mg(OH)2 for 7 days at 25 ± 2 �C.
104 Z. Shi et al. / Corrosion Science 76 (2013) 98–118
Typical EIS data is presented in Figs. 7a–7l. Repeated experi-ments gave similar EIS plots and tendencies with time so onlyone series for each alloy condition is presented in Figs. 7a–7l. Some
of the EIS plots for HP Mg were of the type illustrated in Fig. 6(a).All other EIS plots corresponded to Fig. 6(b or c). The fitting valuesof fitting the EIS data to the equivalent circuit of Fig. 6(e) are doc-umented in Table 7, and the Rf and Rt values are plotted in Fig. 8.The EIS data were consistent with heterogeneous corrosion or
(a)
(c)
(b)
(d)
(e)
Fig. 6. (a) Typical Nyquist plots for EIS data of the first type with two capacitive loops (CP), HF = high frequency range, LF = low frequency range; (b and c) typical Nyquistplots for EIS data of the second type with two capacitive loops (CP) and one inductive loop (LP), HF = high frequency, MF = middle frequency, LF = low frequency range; (d)physical model including localised corrosion due to film beakdown and/or micro-galvanic corrosion; and (e) equivalent circuit which can fit all the data. WE is the workingelectrode. RE is the reference electrode.
Fig. 7a. EIS data for as-cast HP Mg during immersion testing at the open circuitpotential (OCP) in 3.5% NaCl solution saturated with Mg(OH)2 for 7 days at25 ± 2 �C.
Fig. 7b. EIS data for as-cast HP Mg during immersion testing at the open circuitpotential (OCP) in 3.5% NaCl solution saturated with Mg(OH)2 for 7 days at25 ± 2 �C.
Z. Shi et al. / Corrosion Science 76 (2013) 98–118 105
micro-galvanic corrosion for as-cast and solution heat-treated Mg–RE alloys, with a similar value of film resistance Rf throughout theimmersion test after the first day of the immersion test, and a grad-ually decreasing value of Rt.
Fig. 9 presents the cathodic polarisation curves for the as-castMg–RE alloys, measured after immersion for 7 days in 3.5% NaClsolution saturated with Mg(OH)2. Fig. 10 presents the cathodicpolarisation curves for the solution heat-treated Mg–RE alloys.The corrosion current density, icorr, was evaluated using Tafel
extrapolation of the polarisation curves in the potential range of�90 to �250 mV versus the corrosion potential, and by LEV fittingover the whole potential range as in our prior research [14,43]. Thecorrosion rate, Pi, was calculated from the corrosion current den-sity. The results are presented in Table 8 for the as-cast Mg–RE al-loys and Table 9 for the solution heat-treated Mg–Re alloys, andare also plotted in Figs. 11 and 12.
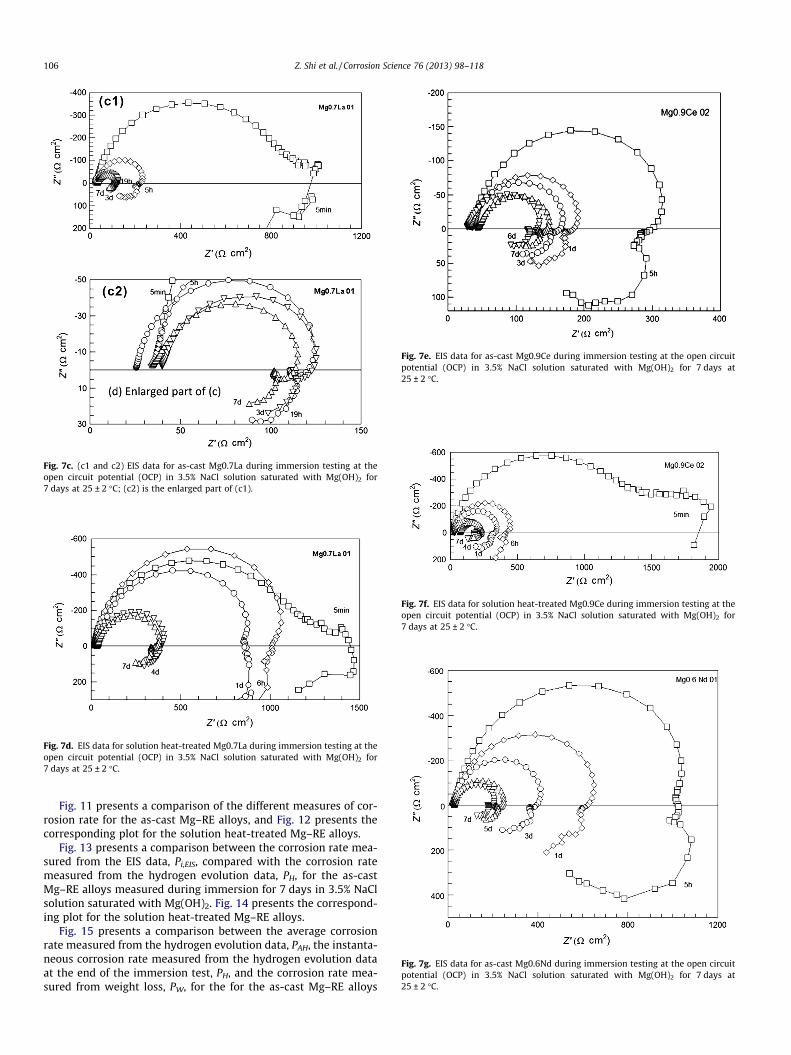
Fig. 7c. (c1 and c2) EIS data for as-cast Mg0.7La during immersion testing at theopen circuit potential (OCP) in 3.5% NaCl solution saturated with Mg(OH)2 for7 days at 25 ± 2 �C; (c2) is the enlarged part of (c1).
Fig. 7d. EIS data for solution heat-treated Mg0.7La during immersion testing at theopen circuit potential (OCP) in 3.5% NaCl solution saturated with Mg(OH)2 for7 days at 25 ± 2 �C.
Fig. 7e. EIS data for as-cast Mg0.9Ce during immersion testing at the open circuitpotential (OCP) in 3.5% NaCl solution saturated with Mg(OH)2 for 7 days at25 ± 2 �C.
Fig. 7f. EIS data for solution heat-treated Mg0.9Ce during immersion testing at theopen circuit potential (OCP) in 3.5% NaCl solution saturated with Mg(OH)2 for7 days at 25 ± 2 �C.
Fig. 7g. EIS data for as-cast Mg0.6Nd during immersion testing at the open circuitpotential (OCP) in 3.5% NaCl solution saturated with Mg(OH)2 for 7 days at25 ± 2 �C.
106 Z. Shi et al. / Corrosion Science 76 (2013) 98–118
Fig. 11 presents a comparison of the different measures of cor-rosion rate for the as-cast Mg–RE alloys, and Fig. 12 presents thecorresponding plot for the solution heat-treated Mg–RE alloys.
Fig. 13 presents a comparison between the corrosion rate mea-sured from the EIS data, Pi,EIS, compared with the corrosion ratemeasured from the hydrogen evolution data, PH, for the as-castMg–RE alloys measured during immersion for 7 days in 3.5% NaClsolution saturated with Mg(OH)2. Fig. 14 presents the correspond-ing plot for the solution heat-treated Mg–RE alloys.
Fig. 15 presents a comparison between the average corrosionrate measured from the hydrogen evolution data, PAH, the instanta-neous corrosion rate measured from the hydrogen evolution dataat the end of the immersion test, PH, and the corrosion rate mea-sured from weight loss, PW, for the for the as-cast Mg–RE alloys
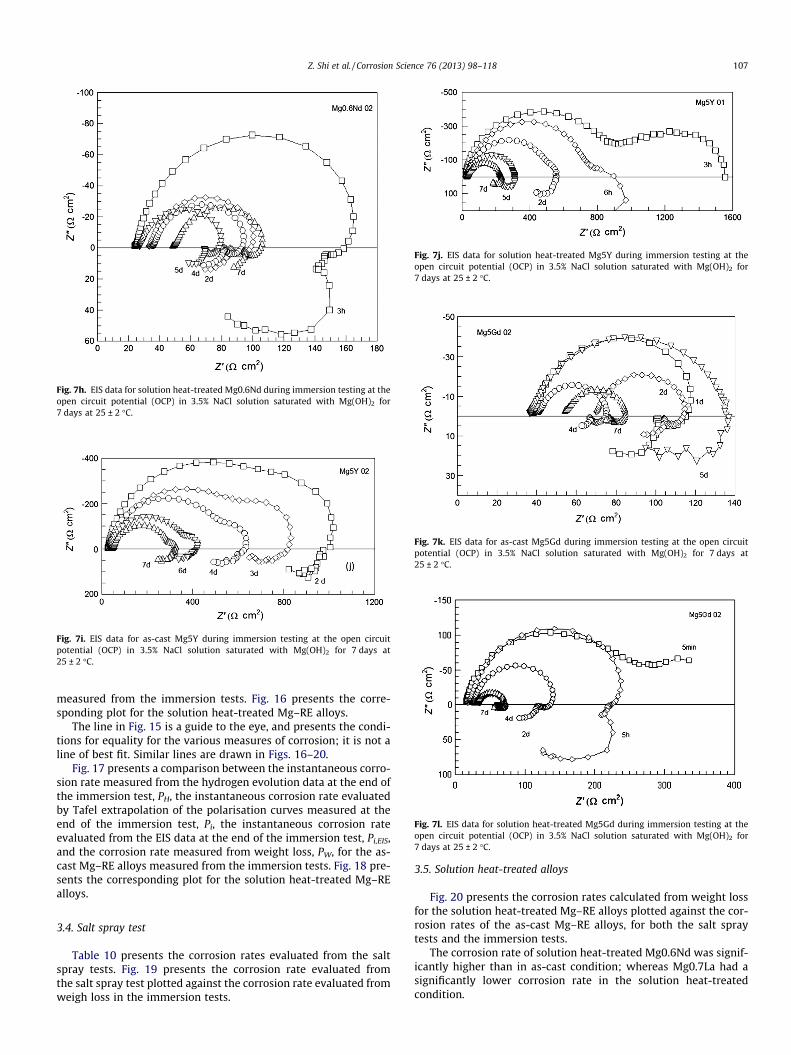
Fig. 7h. EIS data for solution heat-treated Mg0.6Nd during immersion testing at theopen circuit potential (OCP) in 3.5% NaCl solution saturated with Mg(OH)2 for7 days at 25 ± 2 �C.
Fig. 7i. EIS data for as-cast Mg5Y during immersion testing at the open circuitpotential (OCP) in 3.5% NaCl solution saturated with Mg(OH)2 for 7 days at25 ± 2 �C.
Fig. 7j. EIS data for solution heat-treated Mg5Y during immersion testing at theopen circuit potential (OCP) in 3.5% NaCl solution saturated with Mg(OH)2 for7 days at 25 ± 2 �C.
Fig. 7k. EIS data for as-cast Mg5Gd during immersion testing at the open circuitpotential (OCP) in 3.5% NaCl solution saturated with Mg(OH)2 for 7 days at25 ± 2 �C.
Fig. 7l. EIS data for solution heat-treated Mg5Gd during immersion testing at theopen circuit potential (OCP) in 3.5% NaCl solution saturated with Mg(OH)2 for7 days at 25 ± 2 �C.
Z. Shi et al. / Corrosion Science 76 (2013) 98–118 107
measured from the immersion tests. Fig. 16 presents the corre-sponding plot for the solution heat-treated Mg–RE alloys.
The line in Fig. 15 is a guide to the eye, and presents the condi-tions for equality for the various measures of corrosion; it is not aline of best fit. Similar lines are drawn in Figs. 16–20.
Fig. 17 presents a comparison between the instantaneous corro-sion rate measured from the hydrogen evolution data at the end ofthe immersion test, PH, the instantaneous corrosion rate evaluatedby Tafel extrapolation of the polarisation curves measured at theend of the immersion test, Pi, the instantaneous corrosion rateevaluated from the EIS data at the end of the immersion test, Pi,EIS,and the corrosion rate measured from weight loss, PW, for the as-cast Mg–RE alloys measured from the immersion tests. Fig. 18 pre-sents the corresponding plot for the solution heat-treated Mg–REalloys.
3.4. Salt spray test
Table 10 presents the corrosion rates evaluated from the saltspray tests. Fig. 19 presents the corrosion rate evaluated fromthe salt spray test plotted against the corrosion rate evaluated fromweigh loss in the immersion tests.
3.5. Solution heat-treated alloys
Fig. 20 presents the corrosion rates calculated from weight lossfor the solution heat-treated Mg–RE alloys plotted against the cor-rosion rates of the as-cast Mg–RE alloys, for both the salt spraytests and the immersion tests.
The corrosion rate of solution heat-treated Mg0.6Nd was signif-icantly higher than in as-cast condition; whereas Mg0.7La had asignificantly lower corrosion rate in the solution heat-treatedcondition.
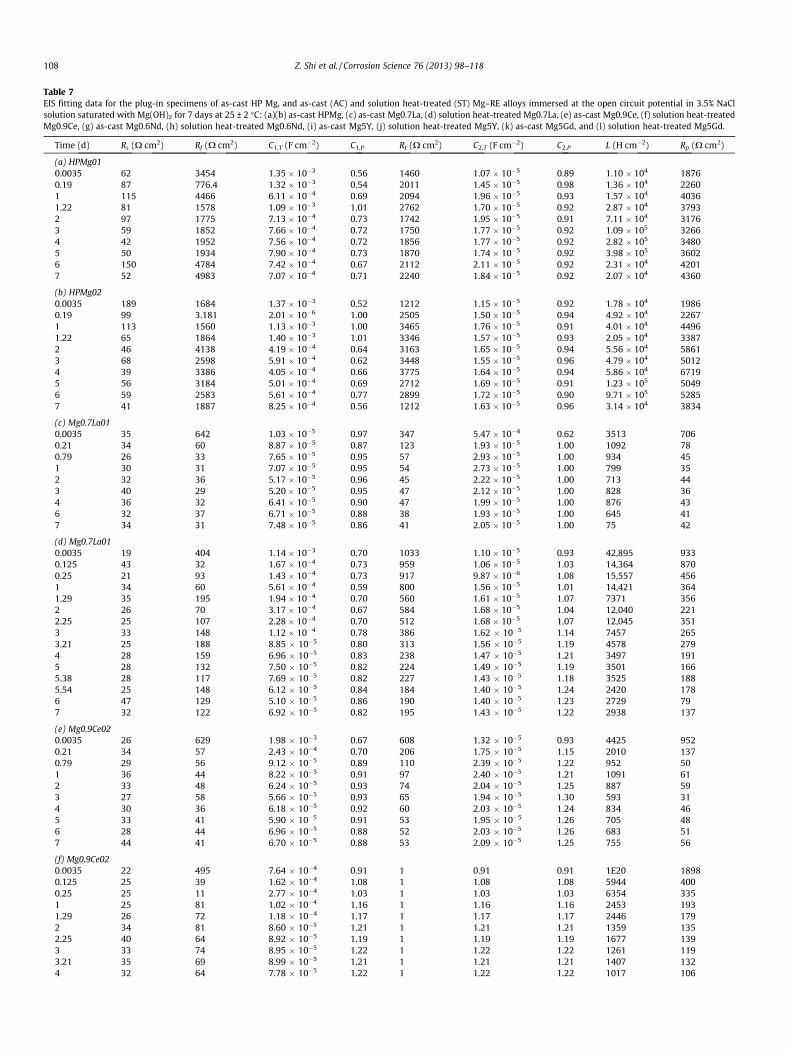
Table 7EIS fitting data for the plug-in specimens of as-cast HP Mg, and as-cast (AC) and solution heat-treated (ST) Mg–RE alloys immersed at the open circuit potential in 3.5% NaClsolution saturated with Mg(OH)2 for 7 days at 25 ± 2 �C: (a)(b) as-cast HPMg, (c) as-cast Mg0.7La, (d) solution heat-treated Mg0.7La, (e) as-cast Mg0.9Ce, (f) solution heat-treatedMg0.9Ce, (g) as-cast Mg0.6Nd, (h) solution heat-treated Mg0.6Nd, (i) as-cast Mg5Y, (j) solution heat-treated Mg5Y, (k) as-cast Mg5Gd, and (l) solution heat-treated Mg5Gd.
Time (d) Rs (X cm2) Rf (X cm2) C1,T (F cm�2) C1,P Rt (X cm2) C2,T (F cm�2) C2,P L (H cm�2) Rp (X cm2)
(a) HPMg010.0035 62 3454 1.35 � 10�3 0.56 1460 1.07 � 10�5 0.89 1.10 � 104 18760.19 87 776.4 1.32 � 10�3 0.54 2011 1.45 � 10�5 0.98 1.36 � 104 22601 115 4466 6.11 � 10�4 0.69 2094 1.96 � 10�5 0.93 1.57 � 104 40361.22 81 1578 1.09 � 10�3 1.01 2762 1.70 � 10�5 0.92 2.87 � 104 37932 97 1775 7.13 � 10�4 0.73 1742 1.95 � 10�5 0.91 7.11 � 104 31763 59 1852 7.66 � 10�4 0.72 1750 1.77 � 10�5 0.92 1.09 � 105 32664 42 1952 7.56 � 10�4 0.72 1856 1.77 � 10�5 0.92 2.82 � 105 34805 50 1934 7.90 � 10�4 0.73 1870 1.74 � 10�5 0.92 3.98 � 105 36026 150 4784 7.42 � 10�4 0.67 2112 2.11 � 10�5 0.92 2.31 � 104 42017 52 4983 7.07 � 10�4 0.71 2240 1.84 � 10�5 0.92 2.07 � 104 4360
(b) HPMg020.0035 189 1684 1.37 � 10�3 0.52 1212 1.15 � 10�5 0.92 1.78 � 104 19860.19 99 3.181 2.01 � 10�6 1.00 2505 1.50 � 10�5 0.94 4.92 � 104 22671 113 1560 1.13 � 10�3 1.00 3465 1.76 � 10�5 0.91 4.01 � 104 44961.22 65 1864 1.40 � 10�3 1.01 3346 1.57 � 10�5 0.93 2.05 � 104 33872 46 4138 4.19 � 10�4 0.64 3163 1.65 � 10�5 0.94 5.56 � 104 58613 68 2598 5.91 � 10�4 0.62 3448 1.55 � 10�5 0.96 4.79 � 104 50124 39 3386 4.05 � 10�4 0.66 3775 1.64 � 10�5 0.94 5.86 � 104 67195 56 3184 5.01 � 10�4 0.69 2712 1.69 � 10�5 0.91 1.23 � 105 50496 59 2583 5.61 � 10�4 0.77 2899 1.72 � 10�5 0.90 9.71 � 105 52857 41 1887 8.25 � 10�4 0.56 1212 1.63 � 10�5 0.96 3.14 � 104 3834
(c) Mg0.7La010.0035 35 642 1.03 � 10�5 0.97 347 5.47 � 10�4 0.62 3513 7060.21 34 60 8.87 � 10�5 0.87 123 1.93 � 10�5 1.00 1092 780.79 26 33 7.65 � 10�5 0.95 57 2.93 � 10�5 1.00 934 451 30 31 7.07 � 10�5 0.95 54 2.73 � 10�5 1.00 799 352 32 36 5.17 � 10�5 0.96 45 2.22 � 10�5 1.00 713 443 40 29 5.20 � 10�5 0.95 47 2.12 � 10�5 1.00 828 364 36 32 6.41 � 10�5 0.90 47 1.99 � 10�5 1.00 876 436 32 37 6.71 � 10�5 0.88 38 1.93 � 10�5 1.00 645 417 34 31 7.48 � 10�5 0.86 41 2.05 � 10�5 1.00 75 42
(d) Mg0.7La010.0035 19 404 1.14 � 10�3 0.70 1033 1.10 � 10�5 0.93 42,895 9330.125 43 32 1.67 � 10�4 0.73 959 1.06 � 10�5 1.03 14,364 8700.25 21 93 1.43 � 10�4 0.73 917 9.87 � 10�6 1.08 15,557 4561 34 60 5.61 � 10�4 0.59 800 1.56 � 10�5 1.01 14,421 3641.29 35 195 1.94 � 10�4 0.70 560 1.61 � 10�5 1.07 7371 3562 26 70 3.17 � 10�4 0.67 584 1.68 � 10�5 1.04 12,040 2212.25 25 107 2.28 � 10�4 0.70 512 1.68 � 10�5 1.07 12,045 3513 33 148 1.12 � 10�4 0.78 386 1.62 � 10�5 1.14 7457 2653.21 25 188 8.85 � 10�5 0.80 313 1.56 � 10�5 1.19 4578 2794 28 159 6.96 � 10�5 0.83 238 1.47 � 10�5 1.21 3497 1915 28 132 7.50 � 10�5 0.82 224 1.49 � 10�5 1.19 3501 1665.38 28 117 7.69 � 10�5 0.82 227 1.43 � 10�5 1.18 3525 1885.54 25 148 6.12 � 10�5 0.84 184 1.40 � 10�5 1.24 2420 1786 47 129 5.10 � 10�5 0.86 190 1.40 � 10�5 1.23 2729 797 32 122 6.92 � 10�5 0.82 195 1.43 � 10�5 1.22 2938 137
(e) Mg0.9Ce020.0035 26 629 1.98 � 10�3 0.67 608 1.32 � 10�5 0.93 4425 9520.21 34 57 2.43 � 10�4 0.70 206 1.75 � 10�5 1.15 2010 1370.79 29 56 9.12 � 10�5 0.89 110 2.39 � 10�5 1.22 952 501 36 44 8.22 � 10�5 0.91 97 2.40 � 10�5 1.21 1091 612 33 48 6.24 � 10�5 0.93 74 2.04 � 10�5 1.25 887 593 27 58 5.66 � 10�5 0.93 65 1.94 � 10�5 1.30 593 314 30 36 6.18 � 10�5 0.92 60 2.03 � 10�5 1.24 834 465 33 41 5.90 � 10�5 0.91 53 1.95 � 10�5 1.26 705 486 28 44 6.96 � 10�5 0.88 52 2.03 � 10�5 1.26 683 517 44 41 6.70 � 10�5 0.88 53 2.09 � 10�5 1.25 755 56
(f) Mg0.9Ce020.0035 22 495 7.64 � 10�4 0.91 1 0.91 0.91 1E20 18980.125 25 39 1.62 � 10�4 1.08 1 1.08 1.08 5944 4000.25 25 11 2.77 � 10�4 1.03 1 1.03 1.03 6354 3351 25 81 1.02 � 10�4 1.16 1 1.16 1.16 2453 1931.29 26 72 1.18 � 10�4 1.17 1 1.17 1.17 2446 1792 34 81 8.60 � 10�5 1.21 1 1.21 1.21 1359 1352.25 40 64 8.92 � 10�5 1.19 1 1.19 1.19 1677 1393 33 74 8.95 � 10�5 1.22 1 1.22 1.22 1261 1193.21 35 69 8.99 � 10�5 1.21 1 1.21 1.21 1407 1324 32 64 7.78 � 10�5 1.22 1 1.22 1.22 1017 106
108 Z. Shi et al. / Corrosion Science 76 (2013) 98–118
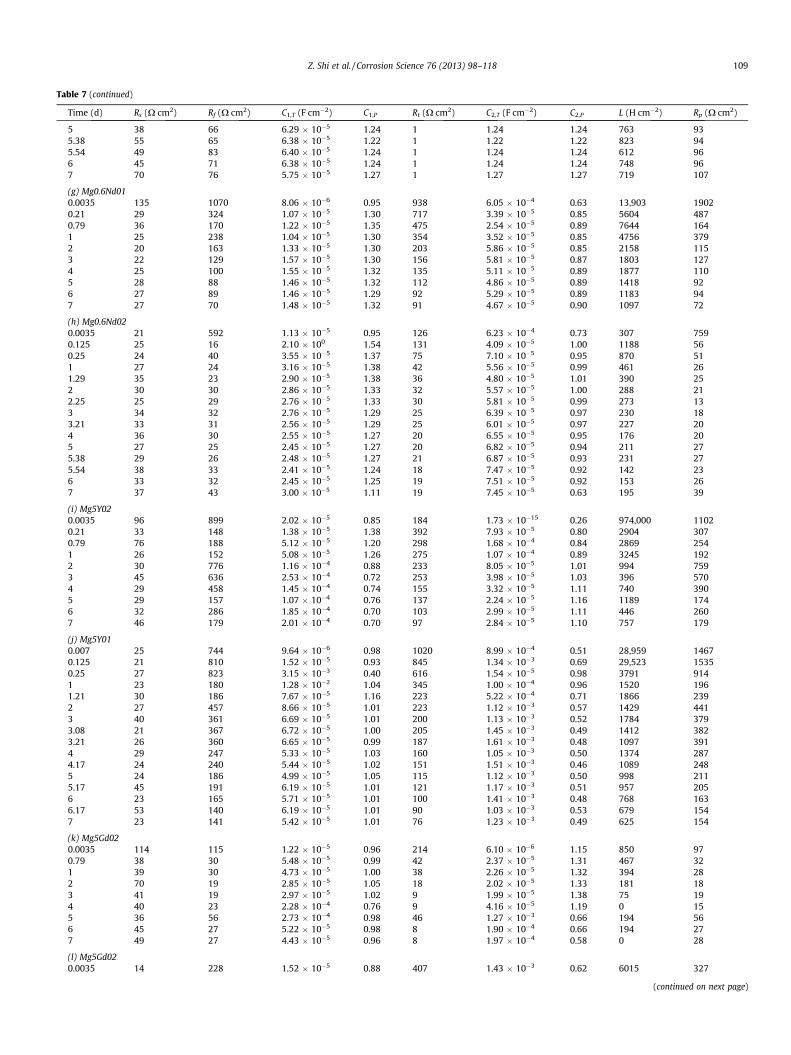
Table 7 (continued)
Time (d) Rs (X cm2) Rf (X cm2) C1,T (F cm�2) C1,P Rt (X cm2) C2,T (F cm�2) C2,P L (H cm�2) Rp (X cm2)
5 38 66 6.29 � 10�5 1.24 1 1.24 1.24 763 935.38 55 65 6.38 � 10�5 1.22 1 1.22 1.22 823 945.54 49 83 6.40 � 10�5 1.24 1 1.24 1.24 612 966 45 71 6.38 � 10�5 1.24 1 1.24 1.24 748 967 70 76 5.75 � 10�5 1.27 1 1.27 1.27 719 107
(g) Mg0.6Nd010.0035 135 1070 8.06 � 10�6 0.95 938 6.05 � 10�4 0.63 13,903 19020.21 29 324 1.07 � 10�5 1.30 717 3.39 � 10�5 0.85 5604 4870.79 36 170 1.22 � 10�5 1.35 475 2.54 � 10�5 0.89 7644 1641 25 238 1.04 � 10�5 1.30 354 3.52 � 10�5 0.85 4756 3792 20 163 1.33 � 10�5 1.30 203 5.86 � 10�5 0.85 2158 1153 22 129 1.57 � 10�5 1.30 156 5.81 � 10�5 0.87 1803 1274 25 100 1.55 � 10�5 1.32 135 5.11 � 10�5 0.89 1877 1105 28 88 1.46 � 10�5 1.32 112 4.86 � 10�5 0.89 1418 926 27 89 1.46 � 10�5 1.29 92 5.29 � 10�5 0.89 1183 947 27 70 1.48 � 10�5 1.32 91 4.67 � 10�5 0.90 1097 72
(h) Mg0.6Nd020.0035 21 592 1.13 � 10�5 0.95 126 6.23 � 10�4 0.73 307 7590.125 25 16 2.10 � 100 1.54 131 4.09 � 10�5 1.00 1188 560.25 24 40 3.55 � 10�5 1.37 75 7.10 � 10�5 0.95 870 511 27 24 3.16 � 10�5 1.38 42 5.56 � 10�5 0.99 461 261.29 35 23 2.90 � 10�5 1.38 36 4.80 � 10�5 1.01 390 252 30 30 2.86 � 10�5 1.33 32 5.57 � 10�5 1.00 288 212.25 25 29 2.76 � 10�5 1.33 30 5.81 � 10�5 0.99 273 133 34 32 2.76 � 10�5 1.29 25 6.39 � 10�5 0.97 230 183.21 33 31 2.56 � 10�5 1.29 25 6.01 � 10�5 0.97 227 204 36 30 2.55 � 10�5 1.27 20 6.55 � 10�5 0.95 176 205 27 25 2.45 � 10�5 1.27 20 6.82 � 10�5 0.94 211 275.38 29 26 2.48 � 10�5 1.27 21 6.87 � 10�5 0.93 231 275.54 38 33 2.41 � 10�5 1.24 18 7.47 � 10�5 0.92 142 236 33 32 2.45 � 10�5 1.25 19 7.51 � 10�5 0.92 153 267 37 43 3.00 � 10�5 1.11 19 7.45 � 10�5 0.63 195 39
(i) Mg5Y020.0035 96 899 2.02 � 10�5 0.85 184 1.73 � 10�15 0.26 974,000 11020.21 33 148 1.38 � 10�5 1.38 392 7.93 � 10�5 0.80 2904 3070.79 76 188 5.12 � 10�5 1.20 298 1.68 � 10�4 0.84 2869 2541 26 152 5.08 � 10�5 1.26 275 1.07 � 10�4 0.89 3245 1922 30 776 1.16 � 10�4 0.88 233 8.05 � 10�5 1.01 994 7593 45 636 2.53 � 10�4 0.72 253 3.98 � 10�5 1.03 396 5704 29 458 1.45 � 10�4 0.74 155 3.32 � 10�5 1.11 740 3905 29 157 1.07 � 10�4 0.76 137 2.24 � 10�5 1.16 1189 1746 32 286 1.85 � 10�4 0.70 103 2.99 � 10�5 1.11 446 2607 46 179 2.01 � 10�4 0.70 97 2.84 � 10�5 1.10 757 179
(j) Mg5Y010.007 25 744 9.64 � 10�6 0.98 1020 8.99 � 10�4 0.51 28,959 14670.125 21 810 1.52 � 10�5 0.93 845 1.34 � 10�3 0.69 29,523 15350.25 27 823 3.15 � 10�3 0.40 616 1.54 � 10�5 0.98 3791 9141 23 180 1.28 � 10�2 1.04 345 1.00 � 10�4 0.96 1520 1961.21 30 186 7.67 � 10�5 1.16 223 5.22 � 10�4 0.71 1866 2392 27 457 8.66 � 10�5 1.01 223 1.12 � 10�3 0.57 1429 4413 40 361 6.69 � 10�5 1.01 200 1.13 � 10�3 0.52 1784 3793.08 21 367 6.72 � 10�5 1.00 205 1.45 � 10�3 0.49 1412 3823.21 26 360 6.65 � 10�5 0.99 187 1.61 � 10�3 0.48 1097 3914 29 247 5.33 � 10�5 1.03 160 1.05 � 10�3 0.50 1374 2874.17 24 240 5.44 � 10�5 1.02 151 1.51 � 10�3 0.46 1089 2485 24 186 4.99 � 10�5 1.05 115 1.12 � 10�3 0.50 998 2115.17 45 191 6.19 � 10�5 1.01 121 1.17 � 10�3 0.51 957 2056 23 165 5.71 � 10�5 1.01 100 1.41 � 10�3 0.48 768 1636.17 53 140 6.19 � 10�5 1.01 90 1.03 � 10�3 0.53 679 1547 23 141 5.42 � 10�5 1.01 76 1.23 � 10�3 0.49 625 154
(k) Mg5Gd020.0035 114 115 1.22 � 10�5 0.96 214 6.10 � 10�6 1.15 850 970.79 38 30 5.48 � 10�5 0.99 42 2.37 � 10�5 1.31 467 321 39 30 4.73 � 10�5 1.00 38 2.26 � 10�5 1.32 394 282 70 19 2.85 � 10�5 1.05 18 2.02 � 10�5 1.33 181 183 41 19 2.97 � 10�5 1.02 9 1.99 � 10�5 1.38 75 194 40 23 2.28 � 10�4 0.76 9 4.16 � 10�5 1.19 0 155 36 56 2.73 � 10�4 0.98 46 1.27 � 10�3 0.66 194 566 45 27 5.22 � 10�5 0.98 8 1.90 � 10�4 0.66 194 277 49 27 4.43 � 10�5 0.96 8 1.97 � 10�4 0.58 0 28
(l) Mg5Gd020.0035 14 228 1.52 � 10�5 0.88 407 1.43 � 10�3 0.62 6015 327
(continued on next page)
Z. Shi et al. / Corrosion Science 76 (2013) 98–118 109
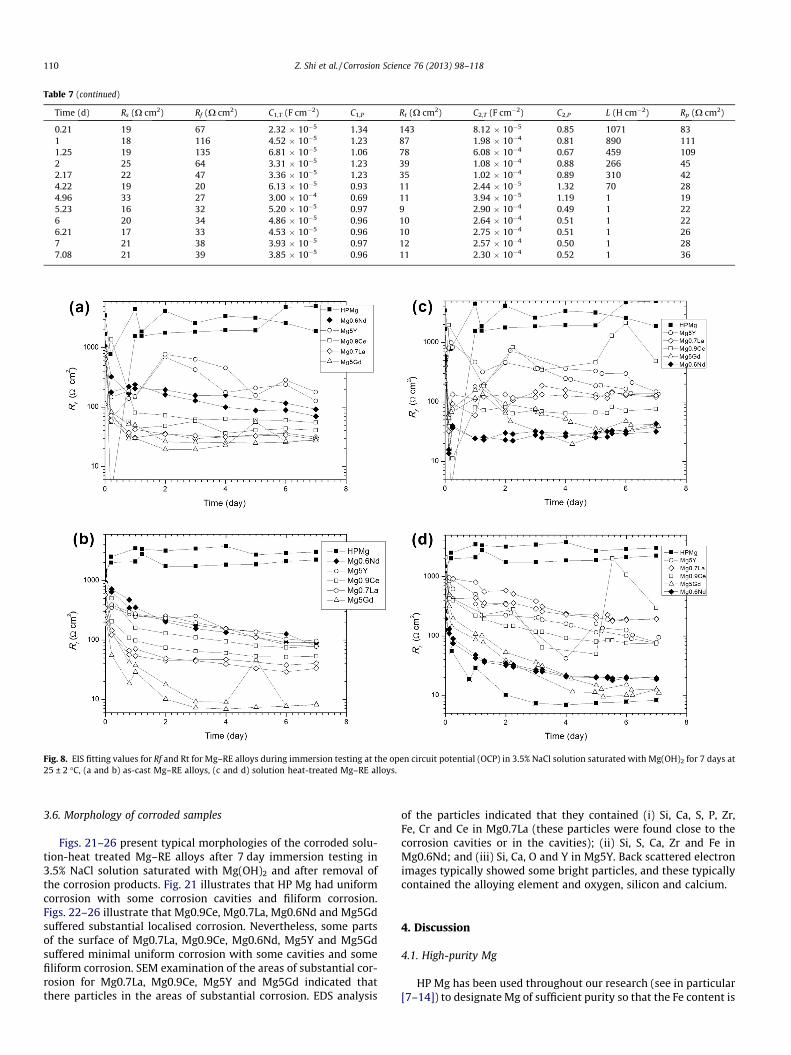
Table 7 (continued)
Time (d) Rs (X cm2) Rf (X cm2) C1,T (F cm�2) C1,P Rt (X cm2) C2,T (F cm�2) C2,P L (H cm�2) Rp (X cm2)
0.21 19 67 2.32 � 10�5 1.34 143 8.12 � 10�5 0.85 1071 831 18 116 4.52 � 10�5 1.23 87 1.98 � 10�4 0.81 890 1111.25 19 135 6.81 � 10�5 1.06 78 6.08 � 10�4 0.67 459 1092 25 64 3.31 � 10�5 1.23 39 1.08 � 10�4 0.88 266 452.17 22 47 3.36 � 10�5 1.23 35 1.02 � 10�4 0.89 310 424.22 19 20 6.13 � 10�5 0.93 11 2.44 � 10�5 1.32 70 284.96 33 27 3.00 � 10�4 0.69 11 3.94 � 10�5 1.19 1 195.23 16 32 5.20 � 10�5 0.97 9 2.90 � 10�4 0.49 1 226 20 34 4.86 � 10�5 0.96 10 2.64 � 10�4 0.51 1 226.21 17 33 4.53 � 10�5 0.96 10 2.75 � 10�4 0.51 1 267 21 38 3.93 � 10�5 0.97 12 2.57 � 10�4 0.50 1 287.08 21 39 3.85 � 10�5 0.96 11 2.30 � 10�4 0.52 1 36
Fig. 8. EIS fitting values for Rf and Rt for Mg–RE alloys during immersion testing at the open circuit potential (OCP) in 3.5% NaCl solution saturated with Mg(OH)2 for 7 days at25 ± 2 �C, (a and b) as-cast Mg–RE alloys, (c and d) solution heat-treated Mg–RE alloys.
110 Z. Shi et al. / Corrosion Science 76 (2013) 98–118
3.6. Morphology of corroded samples
Figs. 21–26 present typical morphologies of the corroded solu-tion-heat treated Mg–RE alloys after 7 day immersion testing in3.5% NaCl solution saturated with Mg(OH)2 and after removal ofthe corrosion products. Fig. 21 illustrates that HP Mg had uniformcorrosion with some corrosion cavities and filiform corrosion.Figs. 22–26 illustrate that Mg0.9Ce, Mg0.7La, Mg0.6Nd and Mg5Gdsuffered substantial localised corrosion. Nevertheless, some partsof the surface of Mg0.7La, Mg0.9Ce, Mg0.6Nd, Mg5Y and Mg5Gdsuffered minimal uniform corrosion with some cavities and somefiliform corrosion. SEM examination of the areas of substantial cor-rosion for Mg0.7La, Mg0.9Ce, Mg5Y and Mg5Gd indicated thatthere particles in the areas of substantial corrosion. EDS analysis
of the particles indicated that they contained (i) Si, Ca, S, P, Zr,Fe, Cr and Ce in Mg0.7La (these particles were found close to thecorrosion cavities or in the cavities); (ii) Si, S, Ca, Zr and Fe inMg0.6Nd; and (iii) Si, Ca, O and Y in Mg5Y. Back scattered electronimages typically showed some bright particles, and these typicallycontained the alloying element and oxygen, silicon and calcium.
4. Discussion
4.1. High-purity Mg
HP Mg has been used throughout our research (see in particular[7–14]) to designate Mg of sufficient purity so that the Fe content is
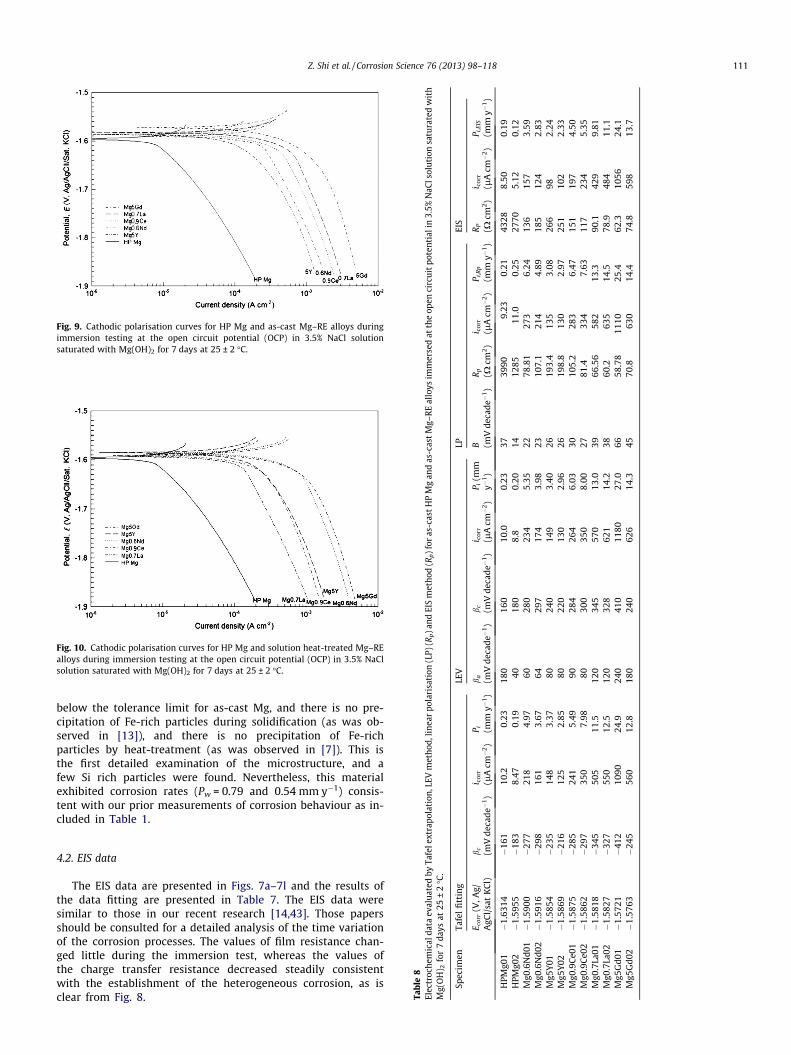
Fig. 9. Cathodic polarisation curves for HP Mg and as-cast Mg–RE alloys duringimmersion testing at the open circuit potential (OCP) in 3.5% NaCl solutionsaturated with Mg(OH)2 for 7 days at 25 ± 2 �C.
Fig. 10. Cathodic polarisation curves for HP Mg and solution heat-treated Mg–REalloys during immersion testing at the open circuit potential (OCP) in 3.5% NaClsolution saturated with Mg(OH)2 for 7 days at 25 ± 2 �C.
apol
atio
n,LE
Vm
etho
d,lin
ear
pola
risa
tion
(LP)
(Rp)a
ndEI
Sm
etho
d(R
p)f
oras
-cas
tH
PM
gan
das
-cas
tMg–
REal
loys
imm
erse
dat
the
open
circ
uit
pote
ntia
lin
3.5%
NaC
lsol
utio
nsa
tura
ted
wit
h
LEV
LPEI
S
cade�
1)
i co
rr
(lA
cm�
2)
P i (mm
y�1)
ba (m
Vde
cade�
1)
bc (m
Vde
cade�
1)
i co
rr
(lA
cm�
2)
P i(m
my�
1)
B (mV
deca
de�
1)
R p (Xcm
2)
i co
rr
(lA
cm�
2)
P i,R
p
(mm
y�1)
R P (Xcm
2)
i co
rr
(lA
cm�
2)
P i,E
IS
(mm
y�1)
10.2
0.23
180
160
10.0
0.23
3739
909.
230.
2143
288.
500.
198.
470.
1940
180
8.8
0.20
1412
8511
.00.
2527
705.
120.
1221
84.
9760
280
234
5.35
2278
.81
273
6.24
136
157
3.59
161
3.67
6429
717
43.
9823
107.
121
44.
8918
512
42.
8314
83.
3780
240
149
3.40
2619
3.4
135
3.08
266
982.
2412
52.
8580
220
130
2.96
2619
8.8
130
2.97
251
102
2.33
241
5.49
9028
426
46.
0330
105.
228
36.
4715
119
74.
5035
07.
9880
300
350
8.00
2781
.433
47.
6311
723
45.
3550
511
.512
034
557
013
.039
66.5
658
213
.390
.142
99.
8155
012
.512
032
862
114
.238
60.2
635
14.5
78.9
484
11.1
1090
24.9
240
410
1180
27.0
6658
.78
1110
25.4
62.3
1056
24.1
560
12.8
180
240
626
14.3
4570
.863
014
.474
.859
813
.7
Z. Shi et al. / Corrosion Science 76 (2013) 98–118 111
below the tolerance limit for as-cast Mg, and there is no pre-cipitation of Fe-rich particles during solidification (as was ob-served in [13]), and there is no precipitation of Fe-richparticles by heat-treatment (as was observed in [7]). This isthe first detailed examination of the microstructure, and afew Si rich particles were found. Nevertheless, this materialexhibited corrosion rates (Pw = 0.79 and 0.54 mm y�1) consis-tent with our prior measurements of corrosion behaviour as in-cluded in Table 1.
Tabl
e8
Elec
troc
hem
ical
data
eval
uate
dby
Tafe
lext
rM
g(O
H) 2
for
7da
ysat
25±
2�C
.
Spec
imen
Tafe
lfi
ttin
g
E cor
r(V
,Ag/
AgC
l/sa
tK
Cl)
bc (m
Vde
HPM
g01
�1.
6314
�16
1H
PMg0
2�
1.59
55�
183
Mg0
.6N
d01�
1.59
00�
277
Mg0
.6N
d02�
1.59
16�
298
Mg5
Y01
�1.
5854
�23
5M
g5Y
02�
1.58
69�
216
Mg0
.9C
e01
�1.
5875
�28
5M
g0.9
Ce0
2�
1.58
62�
297
Mg0
.7La
01�
1.58
18�
345
Mg0
.7La
02�
1.58
27�
327
Mg5
Gd0
1�
1.57
21�
412
Mg5
Gd0
2�
1.57
63�
245
4.2. EIS data
The EIS data are presented in Figs. 7a–7l and the results ofthe data fitting are presented in Table 7. The EIS data weresimilar to those in our recent research [14,43]. Those papersshould be consulted for a detailed analysis of the time variationof the corrosion processes. The values of film resistance chan-ged little during the immersion test, whereas the values ofthe charge transfer resistance decreased steadily consistentwith the establishment of the heterogeneous corrosion, as isclear from Fig. 8.
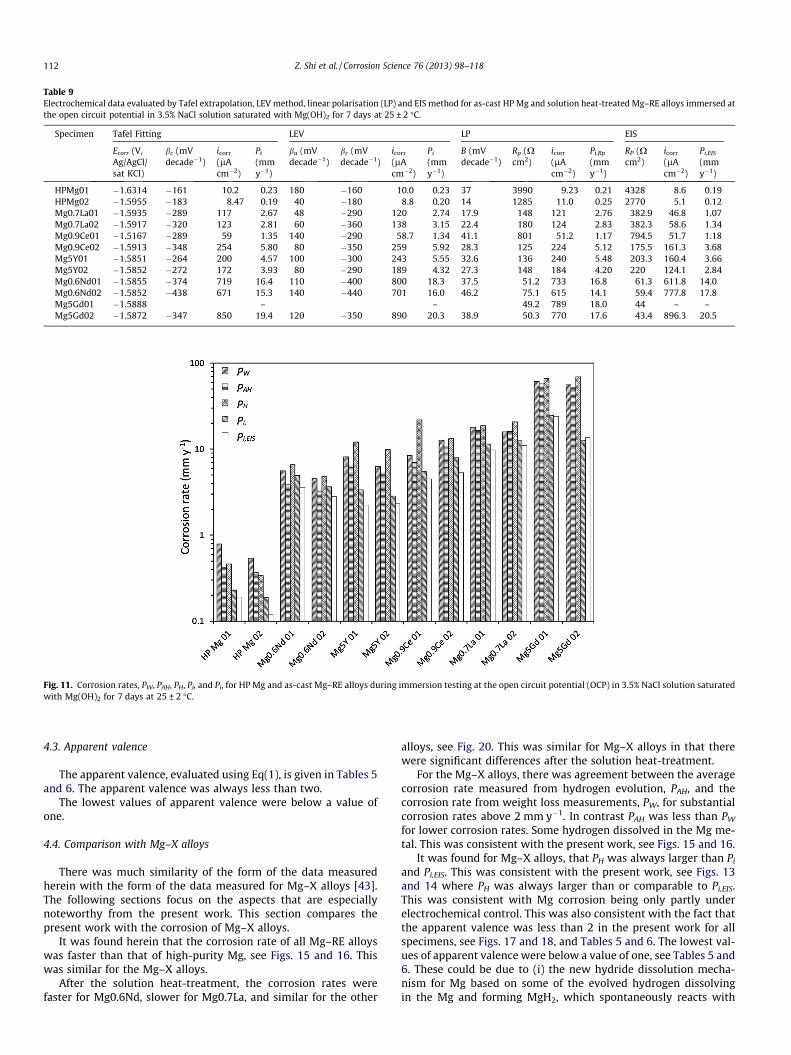
Table 9Electrochemical data evaluated by Tafel extrapolation, LEV method, linear polarisation (LP) and EIS method for as-cast HP Mg and solution heat-treated Mg–RE alloys immersed atthe open circuit potential in 3.5% NaCl solution saturated with Mg(OH)2 for 7 days at 25 ± 2 �C.
Specimen Tafel Fitting LEV LP EIS
Ecorr (V,Ag/AgCl/sat KCl)
bc (mVdecade�1)
icorr
(lAcm�2)
Pi
(mmy�1)
ba (mVdecade�1)
bc (mVdecade�1)
icorr
(lAcm�2)
Pi
(mmy�1)
B (mVdecade�1)
Rp (Xcm2)
icorr
(lAcm�2)
Pi,Rp
(mmy�1)
RP (Xcm2)
icorr
(lAcm�2)
Pi,EIS
(mmy�1)
HPMg01 �1.6314 �161 10.2 0.23 180 �160 10.0 0.23 37 3990 9.23 0.21 4328 8.6 0.19HPMg02 �1.5955 �183 8.47 0.19 40 �180 8.8 0.20 14 1285 11.0 0.25 2770 5.1 0.12Mg0.7La01 �1.5935 �289 117 2.67 48 �290 120 2.74 17.9 148 121 2.76 382.9 46.8 1.07Mg0.7La02 �1.5917 �320 123 2.81 60 �360 138 3.15 22.4 180 124 2.83 382.3 58.6 1.34Mg0.9Ce01 �1.5167 �289 59 1.35 140 �290 58.7 1.34 41.1 801 51.2 1.17 794.5 51.7 1.18Mg0.9Ce02 �1.5913 �348 254 5.80 80 �350 259 5.92 28.3 125 224 5.12 175.5 161.3 3.68Mg5Y01 �1.5851 �264 200 4.57 100 �300 243 5.55 32.6 136 240 5.48 203.3 160.4 3.66Mg5Y02 �1.5852 �272 172 3.93 80 �290 189 4.32 27.3 148 184 4.20 220 124.1 2.84Mg0.6Nd01 �1.5855 �374 719 16.4 110 �400 800 18.3 37.5 51.2 733 16.8 61.3 611.8 14.0Mg0.6Nd02 �1.5852 �438 671 15.3 140 �440 701 16.0 46.2 75.1 615 14.1 59.4 777.8 17.8Mg5Gd01 �1.5888 – – 49.2 789 18.0 44 – –Mg5Gd02 �1.5872 �347 850 19.4 120 �350 890 20.3 38.9 50.3 770 17.6 43.4 896.3 20.5
Fig. 11. Corrosion rates, PW, PAH, PH, Pi, and Pi, for HP Mg and as-cast Mg–RE alloys during immersion testing at the open circuit potential (OCP) in 3.5% NaCl solution saturatedwith Mg(OH)2 for 7 days at 25 ± 2 �C.
112 Z. Shi et al. / Corrosion Science 76 (2013) 98–118
4.3. Apparent valence
The apparent valence, evaluated using Eq(1), is given in Tables 5and 6. The apparent valence was always less than two.
The lowest values of apparent valence were below a value ofone.
4.4. Comparison with Mg–X alloys
There was much similarity of the form of the data measuredherein with the form of the data measured for Mg–X alloys [43].The following sections focus on the aspects that are especiallynoteworthy from the present work. This section compares thepresent work with the corrosion of Mg–X alloys.
It was found herein that the corrosion rate of all Mg–RE alloyswas faster than that of high-purity Mg, see Figs. 15 and 16. Thiswas similar for the Mg–X alloys.
After the solution heat-treatment, the corrosion rates werefaster for Mg0.6Nd, slower for Mg0.7La, and similar for the other
alloys, see Fig. 20. This was similar for Mg–X alloys in that therewere significant differences after the solution heat-treatment.
For the Mg–X alloys, there was agreement between the averagecorrosion rate measured from hydrogen evolution, PAH, and thecorrosion rate from weight loss measurements, PW, for substantialcorrosion rates above 2 mm y�1. In contrast PAH was less than PW
for lower corrosion rates. Some hydrogen dissolved in the Mg me-tal. This was consistent with the present work, see Figs. 15 and 16.
It was found for Mg–X alloys, that PH was always larger than Pi
and Pi,EIS. This was consistent with the present work, see Figs. 13and 14 where PH was always larger than or comparable to Pi,EIS.This was consistent with Mg corrosion being only partly underelectrochemical control. This was also consistent with the fact thatthe apparent valence was less than 2 in the present work for allspecimens, see Figs. 17 and 18, and Tables 5 and 6. The lowest val-ues of apparent valence were below a value of one, see Tables 5 and6. These could be due to (i) the new hydride dissolution mecha-nism for Mg based on some of the evolved hydrogen dissolvingin the Mg and forming MgH2, which spontaneously reacts with
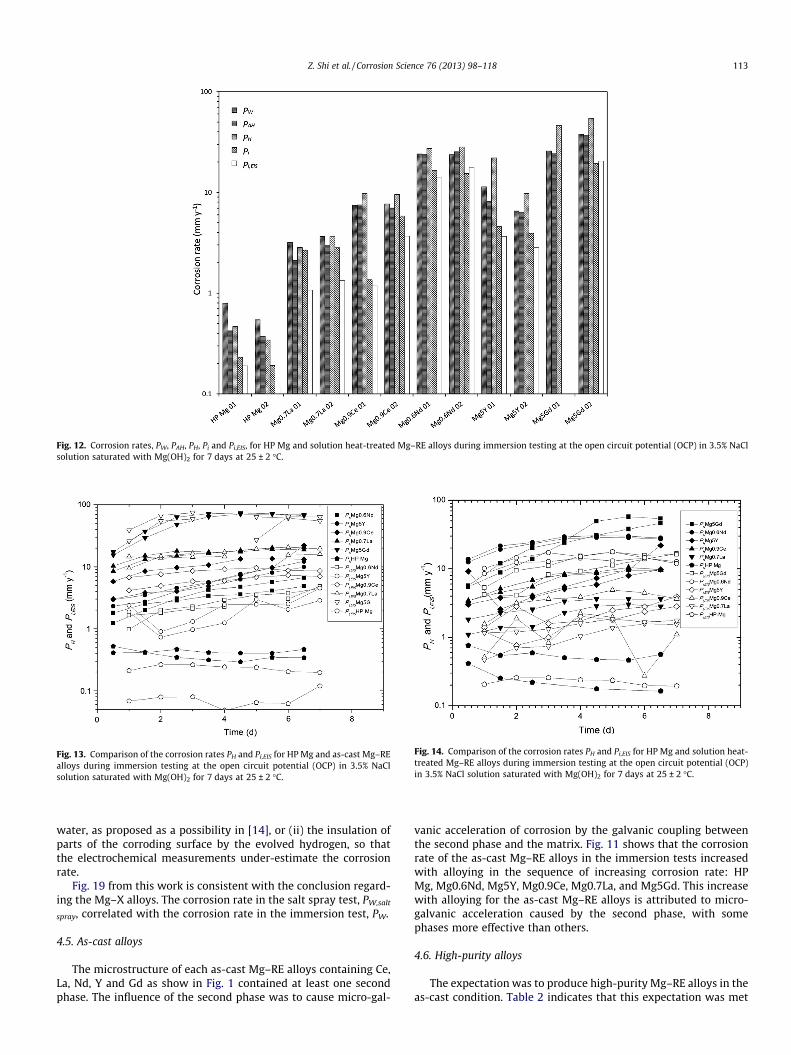
Fig. 12. Corrosion rates, PW, PAH, PH, Pi and Pi,EIS, for HP Mg and solution heat-treated Mg–RE alloys during immersion testing at the open circuit potential (OCP) in 3.5% NaClsolution saturated with Mg(OH)2 for 7 days at 25 ± 2 �C.
Fig. 13. Comparison of the corrosion rates PH and Pi,EIS for HP Mg and as-cast Mg–REalloys during immersion testing at the open circuit potential (OCP) in 3.5% NaClsolution saturated with Mg(OH)2 for 7 days at 25 ± 2 �C.
Fig. 14. Comparison of the corrosion rates PH and Pi,EIS for HP Mg and solution heat-treated Mg–RE alloys during immersion testing at the open circuit potential (OCP)in 3.5% NaCl solution saturated with Mg(OH)2 for 7 days at 25 ± 2 �C.
Z. Shi et al. / Corrosion Science 76 (2013) 98–118 113
water, as proposed as a possibility in [14], or (ii) the insulation ofparts of the corroding surface by the evolved hydrogen, so thatthe electrochemical measurements under-estimate the corrosionrate.
Fig. 19 from this work is consistent with the conclusion regard-ing the Mg–X alloys. The corrosion rate in the salt spray test, PW,salt
spray, correlated with the corrosion rate in the immersion test, PW.
4.5. As-cast alloys
The microstructure of each as-cast Mg–RE alloys containing Ce,La, Nd, Y and Gd as show in Fig. 1 contained at least one secondphase. The influence of the second phase was to cause micro-gal-
vanic acceleration of corrosion by the galvanic coupling betweenthe second phase and the matrix. Fig. 11 shows that the corrosionrate of the as-cast Mg–RE alloys in the immersion tests increasedwith alloying in the sequence of increasing corrosion rate: HPMg, Mg0.6Nd, Mg5Y, Mg0.9Ce, Mg0.7La, and Mg5Gd. This increasewith alloying for the as-cast Mg–RE alloys is attributed to micro-galvanic acceleration caused by the second phase, with somephases more effective than others.
4.6. High-purity alloys
The expectation was to produce high-purity Mg–RE alloys in theas-cast condition. Table 2 indicates that this expectation was met
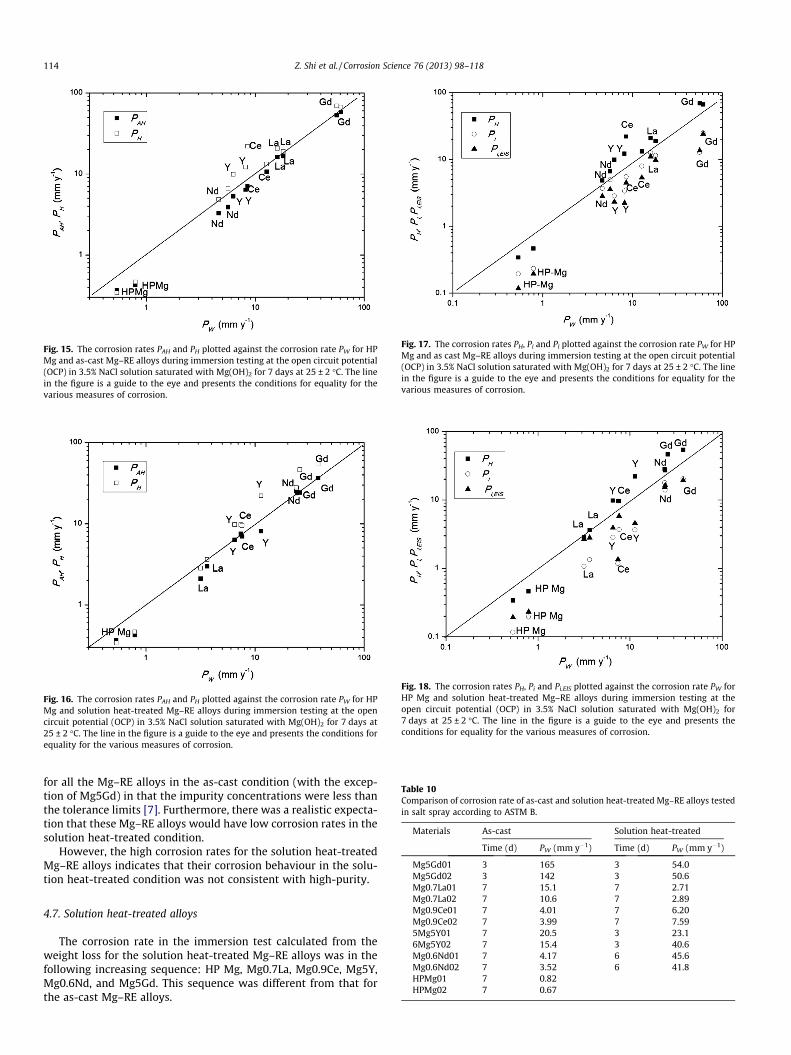
Fig. 15. The corrosion rates PAH and PH plotted against the corrosion rate PW for HPMg and as-cast Mg–RE alloys during immersion testing at the open circuit potential(OCP) in 3.5% NaCl solution saturated with Mg(OH)2 for 7 days at 25 ± 2 �C. The linein the figure is a guide to the eye and presents the conditions for equality for thevarious measures of corrosion.
Fig. 16. The corrosion rates PAH and PH plotted against the corrosion rate PW for HPMg and solution heat-treated Mg–RE alloys during immersion testing at the opencircuit potential (OCP) in 3.5% NaCl solution saturated with Mg(OH)2 for 7 days at25 ± 2 �C. The line in the figure is a guide to the eye and presents the conditions forequality for the various measures of corrosion.
Fig. 17. The corrosion rates PH, Pi and Pi plotted against the corrosion rate PW for HPMg and as cast Mg–RE alloys during immersion testing at the open circuit potential(OCP) in 3.5% NaCl solution saturated with Mg(OH)2 for 7 days at 25 ± 2 �C. The linein the figure is a guide to the eye and presents the conditions for equality for thevarious measures of corrosion.
Fig. 18. The corrosion rates PH, Pi and Pi,EIS plotted against the corrosion rate PW forHP Mg and solution heat-treated Mg–RE alloys during immersion testing at theopen circuit potential (OCP) in 3.5% NaCl solution saturated with Mg(OH)2 for7 days at 25 ± 2 �C. The line in the figure is a guide to the eye and presents theconditions for equality for the various measures of corrosion.
Table 10Comparison of corrosion rate of as-cast and solution heat-treated Mg–RE alloys testedin salt spray according to ASTM B.
Materials As-cast Solution heat-treated
Time (d) PW (mm y�1) Time (d) PW (mm y�1)
Mg5Gd01 3 165 3 54.0Mg5Gd02 3 142 3 50.6
114 Z. Shi et al. / Corrosion Science 76 (2013) 98–118
for all the Mg–RE alloys in the as-cast condition (with the excep-tion of Mg5Gd) in that the impurity concentrations were less thanthe tolerance limits [7]. Furthermore, there was a realistic expecta-tion that these Mg–RE alloys would have low corrosion rates in thesolution heat-treated condition.
However, the high corrosion rates for the solution heat-treatedMg–RE alloys indicates that their corrosion behaviour in the solu-tion heat-treated condition was not consistent with high-purity.
Mg0.7La01 7 15.1 7 2.71Mg0.7La02 7 10.6 7 2.89Mg0.9Ce01 7 4.01 7 6.20Mg0.9Ce02 7 3.99 7 7.595Mg5Y01 7 20.5 3 23.16Mg5Y02 7 15.4 3 40.6Mg0.6Nd01 7 4.17 6 45.6Mg0.6Nd02 7 3.52 6 41.8HPMg01 7 0.82HPMg02 7 0.67
4.7. Solution heat-treated alloys
The corrosion rate in the immersion test calculated from theweight loss for the solution heat-treated Mg–RE alloys was in thefollowing increasing sequence: HP Mg, Mg0.7La, Mg0.9Ce, Mg5Y,Mg0.6Nd, and Mg5Gd. This sequence was different from that forthe as-cast Mg–RE alloys.
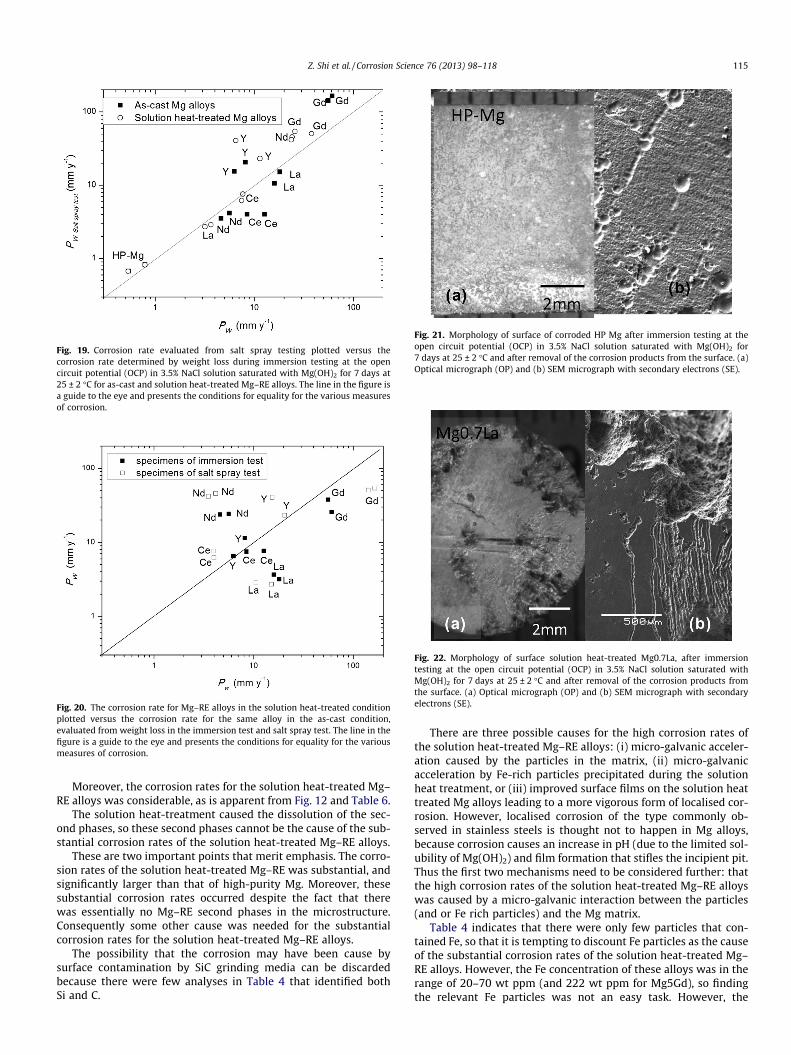
Fig. 19. Corrosion rate evaluated from salt spray testing plotted versus thecorrosion rate determined by weight loss during immersion testing at the opencircuit potential (OCP) in 3.5% NaCl solution saturated with Mg(OH)2 for 7 days at25 ± 2 �C for as-cast and solution heat-treated Mg–RE alloys. The line in the figure isa guide to the eye and presents the conditions for equality for the various measuresof corrosion.
Fig. 20. The corrosion rate for Mg–RE alloys in the solution heat-treated conditionplotted versus the corrosion rate for the same alloy in the as-cast condition,evaluated from weight loss in the immersion test and salt spray test. The line in thefigure is a guide to the eye and presents the conditions for equality for the variousmeasures of corrosion.
Fig. 21. Morphology of surface of corroded HP Mg after immersion testing at theopen circuit potential (OCP) in 3.5% NaCl solution saturated with Mg(OH)2 for7 days at 25 ± 2 �C and after removal of the corrosion products from the surface. (a)Optical micrograph (OP) and (b) SEM micrograph with secondary electrons (SE).
Fig. 22. Morphology of surface solution heat-treated Mg0.7La, after immersiontesting at the open circuit potential (OCP) in 3.5% NaCl solution saturated withMg(OH)2 for 7 days at 25 ± 2 �C and after removal of the corrosion products fromthe surface. (a) Optical micrograph (OP) and (b) SEM micrograph with secondaryelectrons (SE).
Z. Shi et al. / Corrosion Science 76 (2013) 98–118 115
Moreover, the corrosion rates for the solution heat-treated Mg–RE alloys was considerable, as is apparent from Fig. 12 and Table 6.
The solution heat-treatment caused the dissolution of the sec-ond phases, so these second phases cannot be the cause of the sub-stantial corrosion rates of the solution heat-treated Mg–RE alloys.
These are two important points that merit emphasis. The corro-sion rates of the solution heat-treated Mg–RE was substantial, andsignificantly larger than that of high-purity Mg. Moreover, thesesubstantial corrosion rates occurred despite the fact that therewas essentially no Mg–RE second phases in the microstructure.Consequently some other cause was needed for the substantialcorrosion rates for the solution heat-treated Mg–RE alloys.
The possibility that the corrosion may have been cause bysurface contamination by SiC grinding media can be discardedbecause there were few analyses in Table 4 that identified bothSi and C.
There are three possible causes for the high corrosion rates ofthe solution heat-treated Mg–RE alloys: (i) micro-galvanic acceler-ation caused by the particles in the matrix, (ii) micro-galvanicacceleration by Fe-rich particles precipitated during the solutionheat treatment, or (iii) improved surface films on the solution heattreated Mg alloys leading to a more vigorous form of localised cor-rosion. However, localised corrosion of the type commonly ob-served in stainless steels is thought not to happen in Mg alloys,because corrosion causes an increase in pH (due to the limited sol-ubility of Mg(OH)2) and film formation that stifles the incipient pit.Thus the first two mechanisms need to be considered further: thatthe high corrosion rates of the solution heat-treated Mg–RE alloyswas caused by a micro-galvanic interaction between the particles(and or Fe rich particles) and the Mg matrix.
Table 4 indicates that there were only few particles that con-tained Fe, so that it is tempting to discount Fe particles as the causeof the substantial corrosion rates of the solution heat-treated Mg–RE alloys. However, the Fe concentration of these alloys was in therange of 20–70 wt ppm (and 222 wt ppm for Mg5Gd), so findingthe relevant Fe particles was not an easy task. However, the
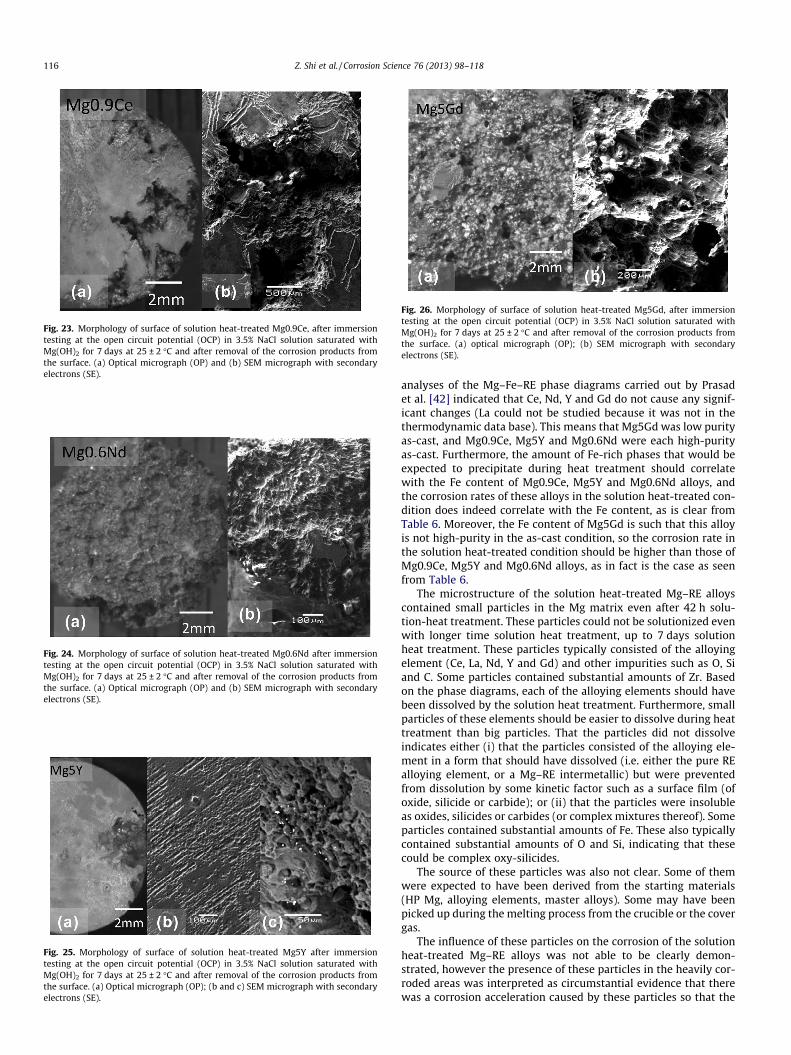
Fig. 23. Morphology of surface of solution heat-treated Mg0.9Ce, after immersiontesting at the open circuit potential (OCP) in 3.5% NaCl solution saturated withMg(OH)2 for 7 days at 25 ± 2 �C and after removal of the corrosion products fromthe surface. (a) Optical micrograph (OP) and (b) SEM micrograph with secondaryelectrons (SE).
Fig. 24. Morphology of surface of solution heat-treated Mg0.6Nd after immersiontesting at the open circuit potential (OCP) in 3.5% NaCl solution saturated withMg(OH)2 for 7 days at 25 ± 2 �C and after removal of the corrosion products fromthe surface. (a) Optical micrograph (OP) and (b) SEM micrograph with secondaryelectrons (SE).
Fig. 25. Morphology of surface of solution heat-treated Mg5Y after immersiontesting at the open circuit potential (OCP) in 3.5% NaCl solution saturated withMg(OH)2 for 7 days at 25 ± 2 �C and after removal of the corrosion products fromthe surface. (a) Optical micrograph (OP); (b and c) SEM micrograph with secondaryelectrons (SE).
Fig. 26. Morphology of surface of solution heat-treated Mg5Gd, after immersiontesting at the open circuit potential (OCP) in 3.5% NaCl solution saturated withMg(OH)2 for 7 days at 25 ± 2 �C and after removal of the corrosion products fromthe surface. (a) optical micrograph (OP); (b) SEM micrograph with secondaryelectrons (SE).
116 Z. Shi et al. / Corrosion Science 76 (2013) 98–118
analyses of the Mg–Fe–RE phase diagrams carried out by Prasadet al. [42] indicated that Ce, Nd, Y and Gd do not cause any signif-icant changes (La could not be studied because it was not in thethermodynamic data base). This means that Mg5Gd was low purityas-cast, and Mg0.9Ce, Mg5Y and Mg0.6Nd were each high-purityas-cast. Furthermore, the amount of Fe-rich phases that would beexpected to precipitate during heat treatment should correlatewith the Fe content of Mg0.9Ce, Mg5Y and Mg0.6Nd alloys, andthe corrosion rates of these alloys in the solution heat-treated con-dition does indeed correlate with the Fe content, as is clear fromTable 6. Moreover, the Fe content of Mg5Gd is such that this alloyis not high-purity in the as-cast condition, so the corrosion rate inthe solution heat-treated condition should be higher than those ofMg0.9Ce, Mg5Y and Mg0.6Nd alloys, as in fact is the case as seenfrom Table 6.
The microstructure of the solution heat-treated Mg–RE alloyscontained small particles in the Mg matrix even after 42 h solu-tion-heat treatment. These particles could not be solutionized evenwith longer time solution heat treatment, up to 7 days solutionheat treatment. These particles typically consisted of the alloyingelement (Ce, La, Nd, Y and Gd) and other impurities such as O, Siand C. Some particles contained substantial amounts of Zr. Basedon the phase diagrams, each of the alloying elements should havebeen dissolved by the solution heat treatment. Furthermore, smallparticles of these elements should be easier to dissolve during heattreatment than big particles. That the particles did not dissolveindicates either (i) that the particles consisted of the alloying ele-ment in a form that should have dissolved (i.e. either the pure REalloying element, or a Mg–RE intermetallic) but were preventedfrom dissolution by some kinetic factor such as a surface film (ofoxide, silicide or carbide); or (ii) that the particles were insolubleas oxides, silicides or carbides (or complex mixtures thereof). Someparticles contained substantial amounts of Fe. These also typicallycontained substantial amounts of O and Si, indicating that thesecould be complex oxy-silicides.
The source of these particles was also not clear. Some of themwere expected to have been derived from the starting materials(HP Mg, alloying elements, master alloys). Some may have beenpicked up during the melting process from the crucible or the covergas.
The influence of these particles on the corrosion of the solutionheat-treated Mg–RE alloys was not able to be clearly demon-strated, however the presence of these particles in the heavily cor-roded areas was interpreted as circumstantial evidence that therewas a corrosion acceleration caused by these particles so that the
Z. Shi et al. / Corrosion Science 76 (2013) 98–118 117
corrosion of the solution heat-treated Mg–RE alloys was signifi-cantly greater than that of HP Mg.
Nevertheless, there was strong circumstantial evidence that thesubstantial corrosion rates for the solution heat-treated Mg–RE al-loys was caused by the presence in the microstructure of the par-ticles and/or Fe-rich particles as follows: (i) the corrosion rateswere substantial, significantly greater than those of HP Mg andcomparable to those of the as-cast Mg–RE alloys; (ii) the solutionheat-treatment dissolved essentially all the Mg–RE phases so thatthere were few particles in the microstructure (typically much lessthan in the as-cast microstructure) and few of these particles con-tained just Mg and the RE; (iii) there were particles in the micro-structure of each of the Mg–RE alloy in the solution heat-treatedcondition; (iv) there were particles often associated with the heav-ily corroded areas and (v) the corrosion rates in the solution heattreated condition correlated with Fe content (except for Mg0.7La).
Fig. 20 shows that that there were different influences of thealloying elements in the Mg–RE alloys in the as-cast and solutionheat-treated states. For Mg0.6Nd the corrosion rate increased afterbeing solution heat-treated. For Mg0.7La, the corrosion rate re-duced after the solution heat-treatment, whereas for the otherMg–RE binary alloys the corrosion rate after the solution heat-treatment was similar to that in the as-cast condition.
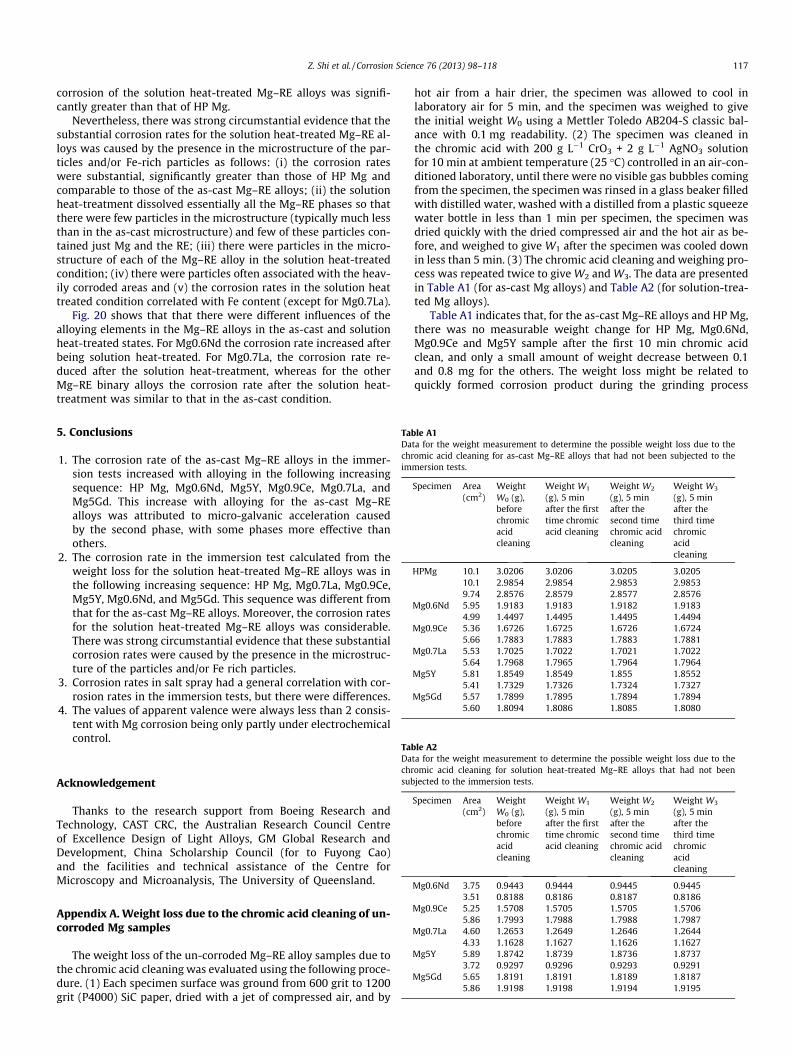
Table A1Data for the weight measurement to determine the possible weight loss due to thechromic acid cleaning for as-cast Mg–RE alloys that had not been subjected to theimmersion tests.
Specimen Area(cm2)
WeightW0 (g),beforechromicacidcleaning
Weight W1
(g), 5 minafter the firsttime chromicacid cleaning
Weight W2
(g), 5 minafter thesecond timechromic acidcleaning
Weight W3
(g), 5 minafter thethird timechromicacidcleaning
HPMg 10.1 3.0206 3.0206 3.0205 3.020510.1 2.9854 2.9854 2.9853 2.98539.74 2.8576 2.8579 2.8577 2.8576
Mg0.6Nd 5.95 1.9183 1.9183 1.9182 1.91834.99 1.4497 1.4495 1.4495 1.4494
Mg0.9Ce 5.36 1.6726 1.6725 1.6726 1.67245.66 1.7883 1.7883 1.7883 1.7881
Mg0.7La 5.53 1.7025 1.7022 1.7021 1.70225.64 1.7968 1.7965 1.7964 1.7964
Mg5Y 5.81 1.8549 1.8549 1.855 1.85525.41 1.7329 1.7326 1.7324 1.7327
Mg5Gd 5.57 1.7899 1.7895 1.7894 1.78945.60 1.8094 1.8086 1.8085 1.8080
Table A2Data for the weight measurement to determine the possible weight loss due to thechromic acid cleaning for solution heat-treated Mg–RE alloys that had not beensubjected to the immersion tests.
Specimen Area(cm2)
WeightW0 (g),beforechromicacidcleaning
Weight W1
(g), 5 minafter the firsttime chromicacid cleaning
Weight W2
(g), 5 minafter thesecond timechromic acidcleaning
Weight W3
(g), 5 minafter thethird timechromicacidcleaning
Mg0.6Nd 3.75 0.9443 0.9444 0.9445 0.9445
5. Conclusions
1. The corrosion rate of the as-cast Mg–RE alloys in the immer-sion tests increased with alloying in the following increasingsequence: HP Mg, Mg0.6Nd, Mg5Y, Mg0.9Ce, Mg0.7La, andMg5Gd. This increase with alloying for the as-cast Mg–REalloys was attributed to micro-galvanic acceleration causedby the second phase, with some phases more effective thanothers.
2. The corrosion rate in the immersion test calculated from theweight loss for the solution heat-treated Mg–RE alloys was inthe following increasing sequence: HP Mg, Mg0.7La, Mg0.9Ce,Mg5Y, Mg0.6Nd, and Mg5Gd. This sequence was different fromthat for the as-cast Mg–RE alloys. Moreover, the corrosion ratesfor the solution heat-treated Mg–RE alloys was considerable.There was strong circumstantial evidence that these substantialcorrosion rates were caused by the presence in the microstruc-ture of the particles and/or Fe rich particles.
3. Corrosion rates in salt spray had a general correlation with cor-rosion rates in the immersion tests, but there were differences.
4. The values of apparent valence were always less than 2 consis-tent with Mg corrosion being only partly under electrochemicalcontrol.
Acknowledgement
Thanks to the research support from Boeing Research andTechnology, CAST CRC, the Australian Research Council Centreof Excellence Design of Light Alloys, GM Global Research andDevelopment, China Scholarship Council (for to Fuyong Cao)and the facilities and technical assistance of the Centre forMicroscopy and Microanalysis, The University of Queensland.
3.51 0.8188 0.8186 0.8187 0.8186Mg0.9Ce 5.25 1.5708 1.5705 1.5705 1.5706
5.86 1.7993 1.7988 1.7988 1.7987Mg0.7La 4.60 1.2653 1.2649 1.2646 1.2644
4.33 1.1628 1.1627 1.1626 1.1627Mg5Y 5.89 1.8742 1.8739 1.8736 1.8737
3.72 0.9297 0.9296 0.9293 0.9291Mg5Gd 5.65 1.8191 1.8191 1.8189 1.8187
5.86 1.9198 1.9198 1.9194 1.9195
Appendix A. Weight loss due to the chromic acid cleaning of un-corroded Mg samples
The weight loss of the un-corroded Mg–RE alloy samples due tothe chromic acid cleaning was evaluated using the following proce-dure. (1) Each specimen surface was ground from 600 grit to 1200grit (P4000) SiC paper, dried with a jet of compressed air, and by
hot air from a hair drier, the specimen was allowed to cool inlaboratory air for 5 min, and the specimen was weighed to givethe initial weight W0 using a Mettler Toledo AB204-S classic bal-ance with 0.1 mg readability. (2) The specimen was cleaned inthe chromic acid with 200 g L�1 CrO3 + 2 g L�1 AgNO3 solutionfor 10 min at ambient temperature (25 �C) controlled in an air-con-ditioned laboratory, until there were no visible gas bubbles comingfrom the specimen, the specimen was rinsed in a glass beaker filledwith distilled water, washed with a distilled from a plastic squeezewater bottle in less than 1 min per specimen, the specimen wasdried quickly with the dried compressed air and the hot air as be-fore, and weighed to give W1 after the specimen was cooled downin less than 5 min. (3) The chromic acid cleaning and weighing pro-cess was repeated twice to give W2 and W3. The data are presentedin Table A1 (for as-cast Mg alloys) and Table A2 (for solution-trea-ted Mg alloys).
Table A1 indicates that, for the as-cast Mg–RE alloys and HP Mg,there was no measurable weight change for HP Mg, Mg0.6Nd,Mg0.9Ce and Mg5Y sample after the first 10 min chromic acidclean, and only a small amount of weight decrease between 0.1and 0.8 mg for the others. The weight loss might be related toquickly formed corrosion product during the grinding process
118 Z. Shi et al. / Corrosion Science 76 (2013) 98–118
and inner defects (such as pores or crevice) in some specimens.After the second 10 minute chromic acid cleaning, the weight W2
for most of the samples changed in a range of 0.1 mg which isthe readability of the balance. Compared with W1 and W2, the va-lue of weight W3 obtained after the third time cleaning showed noobvious weight loss. All the weight changes were in the range ofthe readability of the balance. Table A2, for the solution heat-trea-ted Mg–RE alloys, showed the same tendency.
Table A1 and A2 showed that the removal of metallic magne-sium by the chromic acid cleaning was typically less than 0.2 mgfor each Mg–RE alloy specimen, even after 3 repeated 10 mincleaning processes.
References
[1] G.L. Song, A. Atrens, Corrosion mechanisms of magnesium alloys, Adv. Eng.Mater. 1 (1999) 11–33.
[2] G. Song, A. Atrens, Understanding magnesium corrosion—a framework forimproved alloy performance, Adv. Eng. Mater. 5 (2003) 837–858.
[3] A. Atrens, M. Liu, N.I. Zainal Abidin, G. Song, Corrosion of Magnesium (Mg)Alloys and Metallurgical Influence, in: G. Song (Ed.) Corrosion of MagnesiumAlloys, 2011, pp. 117–165.
[4] A. Atrens, M. Liu, N.I. Zainal Abidin, Corrosion mechanism applicable tobiodegradable magnesium implants, Mater. Sci. Eng.: B 176 (2011) 1609–1636.
[5] N.I. Zainal Abidin, A.D. Atrens, D. Martin, A. Atrens, Corrosion of high purityMg, Mg2Zn0.2Mn, ZE41 and AZ91 in Hank’s solution at 37 �C, Corros. Sci. 53(2011) 3542–3556.
[6] M.-C. Zhao, M. Liu, G. Song, A. Atrens, Influence of the b-phase morphology onthe corrosion of the Mg alloy AZ91, Corros. Sci. 50 (2008) 1939–1953.
[7] M. Liu, P.J. Uggowitzer, A.V. Nagasekhar, P. Schmutz, M. Easton, G. Song, A.Atrens, Calculated phase diagrams and the corrosion of die-cast Mg–Al alloys,Corros. Sci. 51 (2009) 602–619.
[8] G.L. Song, A. Atrens, D. StJohn, X. Wu, J. Nairn, The anodic dissolution ofmagnesium in chloride and sulphate solutions, Corros. Sci. 39 (1997) 1981–2004.
[9] G.L. Song, A. Atrens, D.H. StJohn, J. Nairn, Y. Lang, electrochemical corrosion ofpure magnesium in 1N NaCl, Corros. Sci. 39 (1997) 855–875.
[10] G.L. Song, A. Atrens, X. Wu, B. Zhang, Corrosion behaviour of AZ21, AZ501 andAZ91 in sodium chloride, Corros. Sci. 40 (1998) 1769–1791.
[11] M.C. Zhao, M. Liu, G. Song, A. Atrens, Influence of microstructure on corrosionof as-cast ZE41, Adv. Eng. Mater. 10 (2008) 104–111.
[12] Z. Shi, A. Atrens, An innovative specimen configuration for the study of Mgcorrosion, Corros. Sci. 53 (2011) 226–246.
[13] Z. Qiao, Z. Shi, N. Hort, N. Zainal Abidin, A. Atrens, Corrosion behaviour of anominally high purity Mg ingot produced by permanent mould direct chillcasting, Corros. Sci. 61 (2012) 185–207.
[14] F. Cao, Z. Shi, J. Hofstetter, P.J. Uggowitzer, G. Song, M. Liu, A. Atrens, Corrosionof ultra-high-purity Mg in 3.5% NaCl solution saturated with Mg(OH)2, Corros.Sci. (2013), http://dx.doi.org/10.1016/j.corsci.2013.05.018.
[15] W. Unsworth, The role of rare earth elements in the development ofmagnesium base alloys, Int. J. Mater. Prod. Technol. 4 (1989) 359–378.
[16] M. Kiryuu, H. Okumura, S. Kamado, Y. Kojima, R. Ninomiya, I. Nokatsugawa,Corrosion resistance of heat resistant magnesium alloys containing heavy rareearth elements, J. Jap. Inst. Light Met. 46 (1996) 39–44.
[17] B. Geary, Corrosion resistant magnesium casting alloys, in: Proc. Int. Conf. Adv.Aluminium and Magnesium Alloys, ASM Europe, Amsterdam, 1990, pp. 773–780.
[18] I. Nakatsugawa, S. Kamado, Y. Kojima, R. Ninomiya, K. Kubota, Corrosionbehaviour of magnesium alloys containing heavy rare earth elements, in: G.W.Lorimer (Ed.), Proc. 3rd Int. Magnesium Conf., Manchester, Inst. Mater., 1997,pp. 687–689.
[19] O. Lunder, K. Nisancioglu, R.S. Hansen, Corrosion of die cast magnesium–aluminum alloys, Soc. Auto. Eng., SAE Tech. Paper No. 930755, 1993.
[20] S.K. Das, C.F. Chang, D. Raybould, High strength corrosion resistancemagnesium alloys, in: Proc. P/M in Aerospace and Defence Technol., MetalPowder Industries Federation, vol. 1, 1989, pp. 63–66.
[21] W. Liu, F. Cao, L. Chang, Z. Zhang, J. Zhang, Effect of rare earth element Ce andLa on corrosion behaviour of AM60 magnesium alloy, Corros. Sci. 51 (2009)1334–1343.
[22] W. Liu, F. Cao, L. Zhong, L. Zheng, B. Jia, Z. Zhang, J. Zhang, Influence of rareearth element Ce and La addition on corrosion behaviour of AZ91 magnesiumalloy, Mater. Corros. 60 (2009) 795–803.
[23] X. Zhang, K. Zhang, X.G. Li, C. Wang, H.W. Li, C.S. Wang, X. Deng, Corrosion andelectrochemical behavior of as-cast Mg–5Y–7Gd–1Nd–0.5Zr magnesiumalloys in 5% NaCl aqueous solution, Prog. Nat. Sci.: Mater. Int. 21 (2011)314–321.
[24] T. Takenaka, T. Ono, Y. Narazaki, Y. Naka, M. Kawakami, Improvement ofcorrosion resistance of magnesium metal by rare earth elements, Electrochim.Acta 53 (2007) 117–121.
[25] N. Hort, Y. Huang, D. Fechner, M. Stormer, C. Blawert, F. Witte, C. Vogt, H.Drucker, R. Willumeit, K.U. Kainer, F. Feuerabend, Acta Biomater. 6 (2010)1714–1725.
[26] M. Liu, P. Schmutz, P.J. Uggowitzer, G. Song, A. Atrens, The influence of yttrium(Y) on the corrosion of Mg–Y binary alloys, Corros. Sci. 52 (2010) 3687–3701.
[27] I. Olefjord, B.-O. Elfstrom, The composition of the surface during passivation ofstainless steels, Corrosion 38 (1982) 47–52.
[28] G.T. Burstein, B.T. Daymond, The remarkable passivity of austenitic stainlesssteel in sulphuric acid solution and the effect of repetitive temperature cycling,Corros. Sci. 51 (2009) 2249–2252.
[29] P. Bruesch, A. Atrens, K. Muller, H. Neff, Corrosion of stainless steels in chloridesolutions – an examination of the passive film by XPS, Fresen. Z. Anal. Chem.319 (1984) 812–821.
[30] P. Bruesch, K. Muller, A. Atrens, H. Neff, Corrosion of stainless steels in chloridesolution: an XPS investigation of passive films, Appl. Phys. A 38 (1985) 1–18.
[31] S. Jin, A. Atrens, ESCA – studies of the structure and composition of the passivefilm formed on stainless steels by various immersion times in 0.1 M NaClsolution, Appl. Phys. A 42 (1987) 149–165.
[32] S. Jin, A. Atrens, ESCA – studies of the surface film formed on stainless steels byexposure to 0.1 M NaCl solution at various controlled potentials, Appl. Phys. A46 (1988) 51–65.
[33] R. Kirchheim, B. Heine, H. Fischmeister, S. Hofmann, H. Knote, U. Stolz, Thepassivity of iron–chromium alloys, Corros. Sci. 29 (1989) 899–917.
[34] A. Schneider, D. Kuron, S. Hofmann, R. Kirchheim, AES analysis of pits andpassive films formed on Fe–Cr Fe–Mo and Fe–Cr–Mo Alloys, Corros. Sci. 31(1990) 191–196.
[35] B. Heine, R. Kirchheim, Dissolution rates of iron and chromium and Fe–Cr–alloys in the passive state, Corros. Sci. 31 (1990) 533–538.
[36] A.S. Lim, A. Atrens, ESCA Studies of Fe–Ti, Appl. Phys. A 54 (1992) 500–507.[37] A.S. Lim, A. Atrens, ESCA studies of Ni–Cr, Appl. Phys. A 54 (1992) 343–349.[38] A.S. Lim, A. Atrens, ESCA studies of Cr–Co, Appl. Phys. A 54 (1992) 270–278.[39] A.S. Lim, A. Atrens, ESCA studies of Si–Fe, Appl. Phys. A. 53 (1991) 273–281.[40] G.L. Song, Z.Q. Xu, The surface, microstructure and corrosion of magnesium
alloy AZ31 sheet, Electrochim. Acta 55 (2010) 4148–4161.[41] G. Song, D. StJohn, The effect of zirconium grain refinement on the corrosion
behaviour of magnesium-rare earth alloy MEZ, J. Light Met. 2 (2002) 1–16.[42] A. Prasad, P.J. Uggowitzer, Z. Shi, A. Atrens, Production of high purity
magnesium alloys by melt purification with Zr, Adv. Eng. Mater. 14 (2012)477–490.
[43] F. Cao, Z. Shi, G.L. Song, M. Liu, A. Atrens, Corrosion behaviour in salt spray andin 3.5% NaCl solution saturated with Mg(OH)2 of as-cast and solution heat-treated binary Mg–X alloys: X = Mn, Sn, Ca, Zn, Al, Zr, Si, Sr, submitted toCorros. Sci, http://dx.doi.org/10.1016/j.corsci.2013.06.030.
[44] Z. Shi, J.X. Jia, A. Atrens, Galvanostatic anodic polarisation curves and galvaniccorrosion of high purity Mg in 3.5%NaCl saturated with Mg(OH)2, Corros. Sci.60 (2012) 296–308.