The 2dF Galaxy Redshift Survey: Luminosity dependence of galaxy clustering
Upload
independentCategory
view
1download
0
arX
iv:a
stro
-ph/
0209
029v
1 2
Sep
200
2Astronomy & Astrophysics manuscript no.(will be inserted by hand later)
Correlations in the Orientations of Galaxy Clusters
A. Faltenbacher1, S. Gottlober1, M. Kerscher2, and V. Muller1
1 Astrophysikalisches Institut Potsdam, An der Sternwarte 16 14482 Potsdam, Germany2 Sektion Physik, Ludwig-Maximilians-Universitat, Theresienstraße 37, 80333 Munchen, Germany
the date of receipt and acceptance should be inserted later
Abstract. The relative orientation of clusters’ major elongation axes and clusters’ angular momenta is studied
using a large N-body simulation in a box of 500 h−1Mpc base length for a standard ΛCDM model. Employing
the technique of mark correlation functions, we successfully separated the correlations in the orientation from
the well known clustering signal traced by the two-point correlation function. The correlations in the orientation
are highly significant for our sample of 3000 clusters. We found an alignment of neighboring clusters, i.e. an
enhanced probability of the major elongation axes of neighboring cluster pairs to be in parallel with each other.
At 10 h−1Mpc separation the amplitude of this signal is ∼ 10% above the value expected from random orientations,
and it vanishes on scales larger than 15 h−1Mpc. The “filamentary” alignment between cluster’s major elongation
axes and the lines pointing towards neighboring clusters shows even stronger deviations from random orientation,
which can be detected out to scales of 100 h−1Mpc, both in 2D and 3D analyses. Similarly, strong correlations of
the angular momentum were seen. Also a clear signal in the scalar correlation of the absolute value of the angular
momentum, the spin parameter and the mass was found. They extend up to 50 h−1Mpc and have an amplitude
of 40%, 15%, and 10% above a random distribution at 10 h−1Mpc separation, respectively.
Key words. large-scale structure of the Universe – methods: statistical – galaxies:clusters,general
1. Introduction
The study of orientation effects between galaxy clustershas a long and controversial history in cosmology. In aseminal study Binggeli (1982) claimed that galaxy clustersare highly eccentric and oriented relative to neighboringclusters if lying at separations smaller than 15 h−1Mpc.Further he found anisotropies in the cluster distributionon scales up to 50 h−1Mpc. Following studies found noor weak statistical significance for orientation effects be-tween neighboring clusters or between cluster orienta-tion and the orientation of the central dominant galaxy,cp. Struble & Peebles (1985), Flin (1987), and Rhee &Katgert (1987). Remarkable was the apparent absence(Ulmer et al. 1989) or weakness (Rhee & Latour 1991)of orientation effects in projected X-ray contours of clus-ters, but it should be noted that the cluster samples atthis time were small. Analyzing a large set of 637 Abellclusters, Plionis (1994) found highly significant alignmenteffects on scales below 10 h−1Mpc that become weaker butextend up to 150 h−1Mpc. More objectively selected, butsmaller cluster samples seemed to put into question the re-ality of this signal, cp. Fong et al. (1990) and Martin et al.(1995). However, Chambers et al. (2000) found significantnearest neighbor alignment of cluster X-ray isophotes us-ing data from Einstein and ROSAT. With the advent of
new rich cluster catalogues as the optical Enacs survey(Katgert et al. 1996) and the X-ray based Reflex survey(Bohringer et al. 1998), the question of orientation effectsin clusters should attract renewed attention. Sufficientlylarge and well defined cluster samples showing only weakcontamination by projection effects seem to be necessaryto clarify this uncertain situation.
Strong stimulus to study orientation effects in clusterscame from early ideas that a possible relative orientationbetween neighboring clusters or of clusters in the samesupercluster should reflect the underlying structure for-mation mechanism. Binney & Silk (1979) proposed thattidal interactions of evolving protocluster systems maylead to the growth of anisotropies of clusters and to rel-ative orientation effects. Later, van Haarlem et al. (1997)used numerical simulations of CDM models to demon-strate that clusters are elongated along the incoming di-rection of the last major merger. In the same spirit, West(1994) found that clusters grow by accretion and mergingof surrounding matter that falls into the deep cluster po-tential wells along sheet-like and filamentary high densityregions. Therefore, the cluster formation is tightly con-nected with the supercluster network that characterizesthe large-scale matter distribution in the universe. High-resolution simulations showing this effect are described bythe Virgo collaboration, cp. Colberg et al. (2000). Onuora

2 Faltenbacher et al.: Correlation in the Orientations of Galaxy Clusters
& Thomas (2000) found a significant alignment signal upto scales of 30 h−1Mpc for a ΛCDM model, whereas ina τCDM model the signal extended only up to scales of15h−1Mpc.
To quantify the alignment of the galaxy clusters, weuse a large ΛCDM simulation in a box of 500 h−1Mpcside length. We identify a set of 3000 clusters. As statisti-cal tools we employ mark correlation functions (MCF), asintroduced to cosmology by Beisbart & Kerscher (2000).In this article we will extend this formalism to allow forvector valued marks. The direction of the major axis ofthe mass ellipsoid serves as the vector mark. Tightly con-nected with the elongation of clusters is its internal rota-tion. According to Doroshkevich (1973) and White (1984),the primary angular momentum of bound objects is dueto tidal interaction between the elongated protostructuresafter decoupling from cosmic expansion and before turn-around. More recent studies find that the angular momen-tum of dark matter halos is later modified by the merginghistory of their building blocks, cp. Vitvitska et al. (2001)and Porciani et al. (2002a,b). Therefore, we utilise the an-gular momentum as an additional mark for the study ofthe correlation of inner properties of simulated clusters,and we compare it with the orientation effects.
The plan of the paper is as follows. In the next sec-tion, we describe our numerical simulation, the selectionof a cluster sample and the precision with which we candetermine structure parameters from it. Next we discussthe MCFs that are relevant for our studies. In particular,we use special MCFs for vector marks to quantify correla-tions of orientation. In Sect. 4 we investigate correlationsin the spatial orientation of clusters both in 3D and inthe projected mass distribution. In Sect. 5 we present aMCF analysis using the angular momentum, mass andspin taken as vector and scalar marks, respectively. Weconclude with a summary of the results.
2. Cluster sample in numerical simulations
We utilize the AP3M code of Couchman (1991) to followthe dynamics of 2563 particles in a box of 500 h−1Mpcwith periodic boundary conditions. We employ a cold darkmatter model with a cosmological constant ΩΛ = 0.7,a matter density Ωm = 1 − ΩΛ, and a Hubble constantH0 = 100h km/s/Mpc with h = 0.7. The age of theuniverse in this model is ≈ 13.5 Gyrs. The normaliza-tion, given by the linear mass variance of dark matter on8 h−1Mpc scale, σ8 = 0.87, is in accordance with the fouryear COBE DMR observations as well as the observedabundance of galaxy clusters. The code uses glass-like ini-tial conditions, cp. Knebe & Muller (1999). The initialpower spectrum was calculated with the CMBFAST code(Seljak & Zaldarriaga 1996). We start the simulations atan initial redshift z = 25. Up to this time the Zeldovichapproximation provides accurate results on the scales con-sidered here. We employ a comoving softening length of100 h−1 kpc, and 1000 integration steps that are enoughto avoid strong gravitational scattering effects on small
scales, cp. Knebe et al. (2000). With this softening length,the inner cores or break radii of the cluster sized halos areresolved. For our statistical analysis the big simulationvolume provides us with a sufficient number of clustersembedded into the large scale structure network. In par-ticular an accurate representation of the large scale tidalfield is important for getting stable orientation results.The particle mass in the simulation is 6.2 × 10¹¹h−1M⊙,comparable to the mass of one single galaxy. For reliablecluster orientations and angular momenta, the number ofparticles per cluster should not drop below a minimum ofa few hundred of particles.
We search for bound systems using a friends-of-friendsalgorithm. In our ΛCDM model the virialization over-density ρ/ρmean at z = 0 is ≃ 330 (Kitayama & Suto1996) which corresponds (for spherical isothermal sys-tems) to a linking length of 0.17 times the mean interparticle distance. These bound systems are our clusters ofgalaxies, i.e. our cluster sized halos. The 3000 most mas-sive ones are the constituents of our mock cluster sam-ple. The mean distance between clusters in this sample is34.7 h−1Mpc, which is in agreement with the mean dis-tance of clusters in the Reflex cluster survey (Bohringeret al. 1998). The most massive cluster has a mass of2.3 × 1015h−1M⊙, resolved with 3700 particles, the light-est still has 1.4 × 10¹⁴h−1M⊙ which corresponds to 224particles.
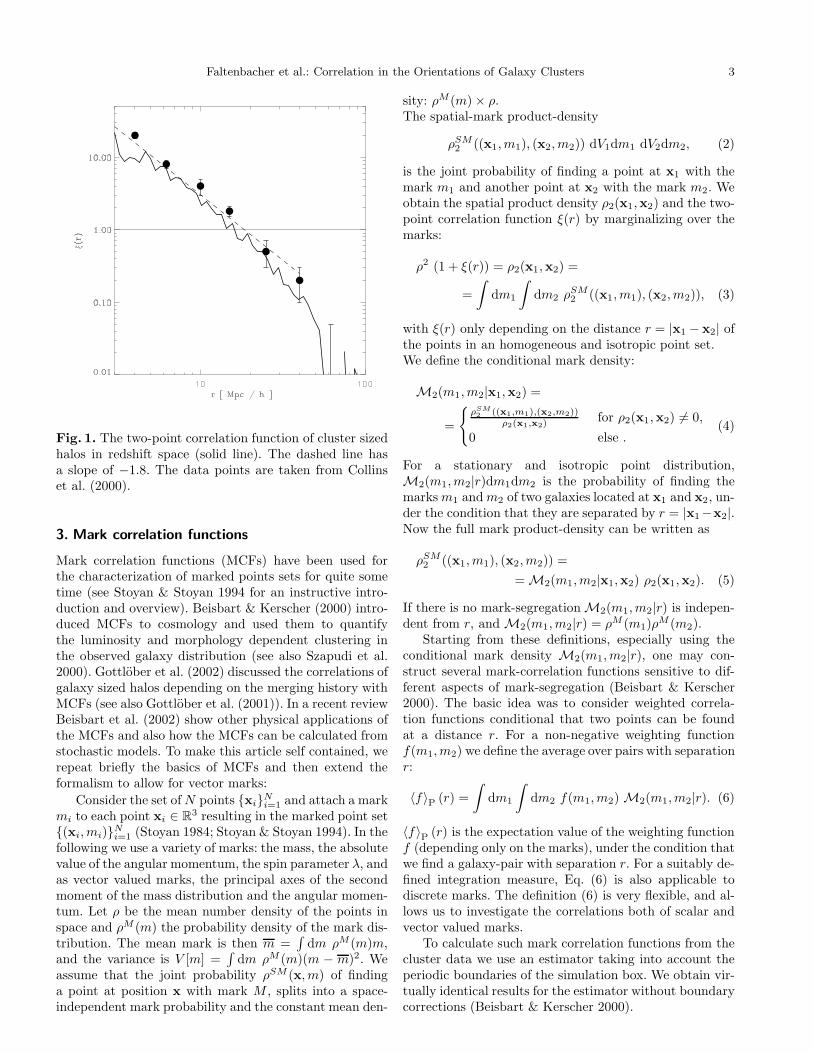
The two-point correlation function ξ(r) of the clustersized halos in redshift space shows the expected behav-ior (Fig. 1) compatible with the correlation function ofthe Reflex clusters determined in Collins et al. (2000).The correlation length is 16 h−1Mpc, quantifying the am-plitude of the correlation function. At scales of about70 h−1Mpc ξ(r) becomes negative.
The principal axes of a cluster are determined bymeans of the eigenvectors of the inertial tensor using allhalo mass points. Assuming an ellipsoidal shape these vec-tors can be uniquely transformed into the three axes of theunderlying mass ellipsoid. Subsequently the three axes areassumed to be ordered by size as a ≥ b ≥ c . In additionto the mass ellipsoid, the angular momentum vector L andthe spin parameter λ can be utilized to characterize thedynamical state of a cluster sized halo. L is calculated bysumming up the angular momenta of all mass particlesof the respective halo. The spin parameter is defined byλ = ω/ωsup, where ω denotes the actual angular velocityand ωsup the angular velocity needed for the system to berotationally supported against gravity. This ratio can beexpressed as
λ = L/(G1/2M3/2R1/2), (1)
where L is the absolute value of the angular momentum L,M the total mass of the system and R its radius, respec-tively (e.g. Padmanabhan 1993). The radius R is taken asthe radius of a sphere with the same volume as the halo(estimated on a fine grid).
Faltenbacher et al.: Correlation in the Orientations of Galaxy Clusters 3
Fig. 1. The two-point correlation function of cluster sizedhalos in redshift space (solid line). The dashed line hasa slope of −1.8. The data points are taken from Collinset al. (2000).
3. Mark correlation functions
Mark correlation functions (MCFs) have been used forthe characterization of marked points sets for quite sometime (see Stoyan & Stoyan 1994 for an instructive intro-duction and overview). Beisbart & Kerscher (2000) intro-duced MCFs to cosmology and used them to quantifythe luminosity and morphology dependent clustering inthe observed galaxy distribution (see also Szapudi et al.2000). Gottlober et al. (2002) discussed the correlations ofgalaxy sized halos depending on the merging history withMCFs (see also Gottlober et al. (2001)). In a recent reviewBeisbart et al. (2002) show other physical applications ofthe MCFs and also how the MCFs can be calculated fromstochastic models. To make this article self contained, werepeat briefly the basics of MCFs and then extend theformalism to allow for vector marks:
Consider the set of N points xiNi=1 and attach a mark
mi to each point xi ∈ R3 resulting in the marked point set
(xi, mi)Ni=1 (Stoyan 1984; Stoyan & Stoyan 1994). In the
following we use a variety of marks: the mass, the absolutevalue of the angular momentum, the spin parameter λ, andas vector valued marks, the principal axes of the secondmoment of the mass distribution and the angular momen-tum. Let ρ be the mean number density of the points inspace and ρM (m) the probability density of the mark dis-tribution. The mean mark is then m =
∫
dm ρM (m)m,and the variance is V [m] =
∫
dm ρM (m)(m − m)2. Weassume that the joint probability ρSM (x, m) of findinga point at position x with mark M , splits into a space-independent mark probability and the constant mean den-
sity: ρM (m) × ρ.The spatial-mark product-density
ρSM2 ((x1, m1), (x2, m2)) dV1dm1 dV2dm2, (2)
is the joint probability of finding a point at x1 with themark m1 and another point at x2 with the mark m2. Weobtain the spatial product density ρ2(x1,x2) and the two-point correlation function ξ(r) by marginalizing over themarks:
ρ2 (1 + ξ(r)) = ρ2(x1,x2) =
=
∫
dm1
∫
dm2 ρSM2 ((x1, m1), (x2, m2)), (3)
with ξ(r) only depending on the distance r = |x1 − x2| ofthe points in an homogeneous and isotropic point set.We define the conditional mark density:
M2(m1, m2|x1,x2) =
=
ρSM
2((x1,m1),(x2,m2))
ρ2(x1,x2)for ρ2(x1,x2) 6= 0,
0 else .(4)
For a stationary and isotropic point distribution,M2(m1, m2|r)dm1dm2 is the probability of finding themarks m1 and m2 of two galaxies located at x1 and x2, un-der the condition that they are separated by r = |x1−x2|.Now the full mark product-density can be written as
ρSM2 ((x1, m1), (x2, m2)) =
= M2(m1, m2|x1,x2) ρ2(x1,x2). (5)
If there is no mark-segregation M2(m1, m2|r) is indepen-dent from r, and M2(m1, m2|r) = ρM (m1)ρ
M (m2).Starting from these definitions, especially using the
conditional mark density M2(m1, m2|r), one may con-struct several mark-correlation functions sensitive to dif-ferent aspects of mark-segregation (Beisbart & Kerscher2000). The basic idea was to consider weighted correla-tion functions conditional that two points can be foundat a distance r. For a non-negative weighting functionf(m1, m2) we define the average over pairs with separationr:
〈f〉P (r) =
∫
dm1
∫
dm2 f(m1, m2) M2(m1, m2|r). (6)
〈f〉P (r) is the expectation value of the weighting functionf (depending only on the marks), under the condition thatwe find a galaxy-pair with separation r. For a suitably de-fined integration measure, Eq. (6) is also applicable todiscrete marks. The definition (6) is very flexible, and al-lows us to investigate the correlations both of scalar andvector valued marks.
To calculate such mark correlation functions from thecluster data we use an estimator taking into account theperiodic boundaries of the simulation box. We obtain vir-tually identical results for the estimator without boundarycorrections (Beisbart & Kerscher 2000).

4 Faltenbacher et al.: Correlation in the Orientations of Galaxy Clusters
3.1. Correlations of scalar marks
For scalar marks the following mark correlation functionshave proven to be useful (Beisbart & Kerscher 2000):
– The simplest weight to be used is the mean mark,
km(r) ≡〈m1 + m2〉P (r)
2 m. (7)
that quantifies the deviation of the mean mark ofpairs with separation r from the overall mean markm. A km > 1 indicates mark segregation for pointpairs with a separation r, specifically their mean markis larger than the overall mark average.
– Accordingly, higher moments of the marks may beused to quantify mark segregation. The mark variancevar(r)
var(r) ≡⟨
(m1 − 〈m1〉P (r))2⟩
P(r). (8)
gives information about the fluctuations of the marksof points which are separated by a distance r to othermembers of the set. A var(r)/V [m] larger than oneindicates a substantially increased scattering of themarks compared to the overall variance.
– The mark covariance (Cressie 1991) is
cov(r) ≡⟨(
m1 − 〈m1〉P (r))(
m2 − 〈m2〉P (r))⟩
P(r)
= 〈m1m2〉P (r) − 〈m1〉P (r) 〈m2〉P (r). (9)
Mark segregation can be detected by looking whethercov(r) differs from zero. A cov(r) larger than zero, e.g.,indicates that points with separation r tend to havesimilar marks.
3.2. Correlations of vector marks
To study the alignment effects between the clusters we at-tach to each cluster the orientation as a vector mark l with|l| = 1. The orientation is either given by the direction ofthe major half-axis of the mass ellipsoid, or the directionof the angular momentum. The distance vector betweentwo clusters is r, and the normalized direction is r = r/r.We consider the following MCFs:
A(r) = 〈|l1 · l2|〉P (r),
F(r) =1
2〈|l1 · r| + |l2 · r|〉P (r),
(10)
where “·” denotes the scalar product. Due to the spatialsymmetry of the mass ellipsoids we use the absolute valuesof these scalar products.
– A(r) quantifies the direct Alignment of the vectors l1and l2 (see also Stoyan & Stoyan 1994 and their kd).A(r) is proportional to the cosine of the angle betweenl1 and l2.
– F(r) quantifies the F ilamentary alignment of the vec-tors l1 and l2 with the line connecting both clusters.F(r) is proportional to the cosine of the angle betweenl1 and the direction vector r connecting the points.
In three dimensions no mark segregation implies A(r) =F(r) = 0.5, in two dimensions A(r) = F(r) = 2/π.Beisbart et al. (2002) provide some further explanationsand discuss in which sense A(r), F(r) provide a completecharacterization of the vector correlations.
4. Correlations in the orientation of clusters’
shape
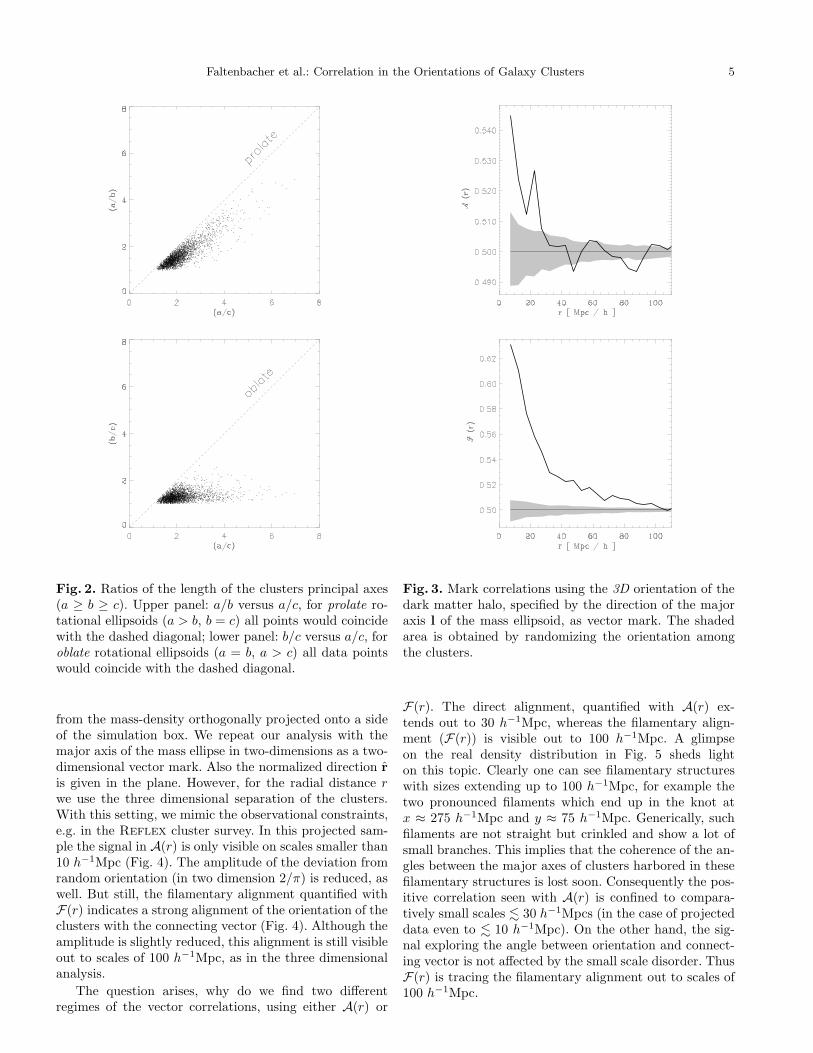
As described in Sect. 2 we determine the mass ellipsoidfor each of the cluster sized halos. The distribution of theintrinsic shapes of clusters in our sample is illustrated inFig. 2. There we plot the ratios between the lengths ofthe three principal axes a ≥ b ≥ c: the upper panel showsthe ratios a/b versus a/c, whereas the lower panel showsb/c versus a/c. For prolate rotational ellipsoids (a > b,b = c) all points would coincide with the dashed diagonalon the upper panel. In the case of oblate rotational ellip-soids (a = b, a > c) all data points would coincide withthe dashed diagonal plotted in the lower panel. Clearlythe majority of the data points tend to be concentratedrather along the upper panels’ diagonal than along thelower panels’ diagonal. Therefore, the clusters in our sim-ulations typically have prolate shape, in good agreementwith observations (e.g. Cooray 2000) and other CDM sim-ulation, cp. (Cole & Lacey 1996).
In the following we will use the direction of the ma-jor axis of the mass ellipsoid (the “a-axis”) as a vectormark l. Fig. 3 shows the mark correlation functions A(r)and F(r). The increased A(r) towards smaller scales in-dicates that pairs of clusters with a distance smaller than30 h−1Mpc prefer a parallel orientation of their orienta-tion axes l1 and l2. This deviation of ∼ 10% from thesignal of a purely random orientation is clearly outsidethe random fluctuations shown by the shaded region. Wedetermine these random fluctuations by repeatedly andrandomly redistributing the orientation axes among theclusters. The positions of the clusters remain fixed. Thefilamentary alignment of the orientation of the clusters l1and l2 towards the connecting vector r as quantified byF(r) is significantly stronger (up to 20% deviation fromthe signal of purely random orientation on small scales).Remarkably this signal extends out to 100 h−1Mpc. In aqualitative picture this may be explained by a large num-ber of clusters elongated in the direction of the filamentsof the large scale structures. Filaments are prominent fea-tures found in the observed galaxy distribution (Huchraet al. 1990) as well as in N -body simulations (Melott &Shandarin 1990), often with an extent up to 100 h−1Mpc.The inspection of density field of the simulation utilizedhere confirms this view (see Fig. 5).
Up to now we used the orientation of the mass ellipsoidin three dimensional space. Most observations, however,only provide the projected galaxy number density or X-ray intensity. In the following we will investigate whetherthe clear signal found in Fig. 3 will be reduced by pro-jection. In close analogy to our three dimensional analysiswe determine the orientation of the mass-ellipse of a halo
Faltenbacher et al.: Correlation in the Orientations of Galaxy Clusters 5
Fig. 2. Ratios of the length of the clusters principal axes(a ≥ b ≥ c). Upper panel: a/b versus a/c, for prolate ro-tational ellipsoids (a > b, b = c) all points would coincidewith the dashed diagonal; lower panel: b/c versus a/c, foroblate rotational ellipsoids (a = b, a > c) all data pointswould coincide with the dashed diagonal.
from the mass-density orthogonally projected onto a sideof the simulation box. We repeat our analysis with themajor axis of the mass ellipse in two-dimensions as a two-dimensional vector mark. Also the normalized direction r
is given in the plane. However, for the radial distance rwe use the three dimensional separation of the clusters.With this setting, we mimic the observational constraints,e.g. in the Reflex cluster survey. In this projected sam-ple the signal in A(r) is only visible on scales smaller than10 h−1Mpc (Fig. 4). The amplitude of the deviation fromrandom orientation (in two dimension 2/π) is reduced, aswell. But still, the filamentary alignment quantified withF(r) indicates a strong alignment of the orientation of theclusters with the connecting vector (Fig. 4). Although theamplitude is slightly reduced, this alignment is still visibleout to scales of 100 h−1Mpc, as in the three dimensionalanalysis.
The question arises, why do we find two differentregimes of the vector correlations, using either A(r) or
Fig. 3. Mark correlations using the 3D orientation of thedark matter halo, specified by the direction of the majoraxis l of the mass ellipsoid, as vector mark. The shadedarea is obtained by randomizing the orientation amongthe clusters.
F(r). The direct alignment, quantified with A(r) ex-tends out to 30 h−1Mpc, whereas the filamentary align-ment (F(r)) is visible out to 100 h−1Mpc. A glimpseon the real density distribution in Fig. 5 sheds lighton this topic. Clearly one can see filamentary structureswith sizes extending up to 100 h−1Mpc, for example thetwo pronounced filaments which end up in the knot atx ≈ 275 h−1Mpc and y ≈ 75 h−1Mpc. Generically, suchfilaments are not straight but crinkled and show a lot ofsmall branches. This implies that the coherence of the an-gles between the major axes of clusters harbored in thesefilamentary structures is lost soon. Consequently the pos-itive correlation seen with A(r) is confined to compara-tively small scales . 30 h−1Mpcs (in the case of projecteddata even to . 10 h−1Mpc). On the other hand, the sig-nal exploring the angle between orientation and connect-ing vector is not affected by the small scale disorder. ThusF(r) is tracing the filamentary alignment out to scales of100 h−1Mpc.

6 Faltenbacher et al.: Correlation in the Orientations of Galaxy Clusters
Fig. 4. Mark correlations with the normalized major axis|l| = 1 of the projected cluster-density (2D orientation) asvector mark. The shaded area is obtained by randomizingthe orientation among the clusters.
5. Angular momentum, mass and spin correlations
In a simulation we have access to the position and the ve-locity of the particles. Hence, it is easy to determine theangular momenta of our cluster sized halos. In this sectionwe use the direction of the angular momenta of galaxyclusters as vector marks and compare their correlationproperties with the alignment seen in the orientation ofthe mass distribution (Sect. 4). With scalar MCFs, usingthe absolute value of the angular momentum, the clus-ter mass and the spin parameter as scalar mark, we willsupplement the foregoing result.
It is well known that there exists a correlation betweenthe axes of the mass ellipsoid and the direction of theangular momentum in gravitationally bound N-body sys-tems (Binney & Tremaine 1987). Fig. 6 shows that themajor axis of the mass ellipsoid tends to be perpendicularto the angular momentum. Compared to the expectationfrom a purely random distribution, the minor axis favorssmaller angles with the angular momentum. Hence, usingthe direction of the angular momentum as vector mark,we are expecting to see effects comparable to the shape
Fig. 5. Projected density field of a ∼ 7.5 h−1Mpc slicethrough the simulation box. The density is calculated ona 3003 grid which corresponds to a smoothing length of∼ 1.7 h−1Mpc. The maximum value of projected densityis ≈ 1.5 × 10⁴ρ/ρmean. Gray scales are chosen accordingto log of density.
Fig. 6. Cumulative plot of the number of clusters and thecosine between the direction of the angular momentumand the major, medium and minor cluster axis, respec-tively.
orientations. The vector correlations of the directions ofthe angular momentum are shown in Fig. 7. There is noclear signal for a direct alignment of the angular momentaas traced by A(r). However, the correlation F(r) < 0.5 issmaller than for random directions (shaded area), this in-dicates that the angular momenta are preferably orientedperpendicular to the connecting vector r on scales up to

Faltenbacher et al.: Correlation in the Orientations of Galaxy Clusters 7
Fig. 7. Mark correlation functions using the normalizedangular momentum l with |l| = 1 as vector mark. Theshaded area is obtained by randomizing the orientationamong the clusters.
30 h−1Mpc. The amplitude of the deviation from the ran-dom orientation reaches approximately 5% and is clearlyoutside the fluctuations. With Fig. 6 in mind, the latterresult was expected from the correlations of the orienta-tions shown in Fig. 3: For a pair of clusters residing ina filamentary structure the connecting vector is orientedalong this filament. The major axes of the orientationstend to align with the filaments, and therefore the angularmomenta tend to stand perpendicular to the filaments. Arandom orientation of the angular momenta in the planesperpendicular to the filaments provides a simple explana-tion for the absence of any signal in A(r), still compatiblewith the strong signal in F(r).
Besides the correlations in the directions of the angu-lar momentum vectors, we are also interested in the cor-relations of their magnitudes. We investigate these corre-lations with the MCFs discussed in Sect. 3.1, using themagnitude of the angular momentum as a scalar mark.In Fig. 8 the increased km(r) shows that pairs of clusterswith separations . 50 h−1Mpc tend to have higher meanangular momentum compared to the overall mean angular
Fig. 8. Mark correlation functions with the absolute valueof the angular momentum of the cluster as scalar mark.The shaded area is obtained by randomizing the markamong the clusters.
momentum. The positive covariance up to . 15 h−1Mpcindicates that both members of close pairs tend to havesimilar angular momentum. Hence, inspecting both km
and the covariance, we see that close clusters tend to carrya similar amount of angular momentum, larger than theoverall mean angular momentum.
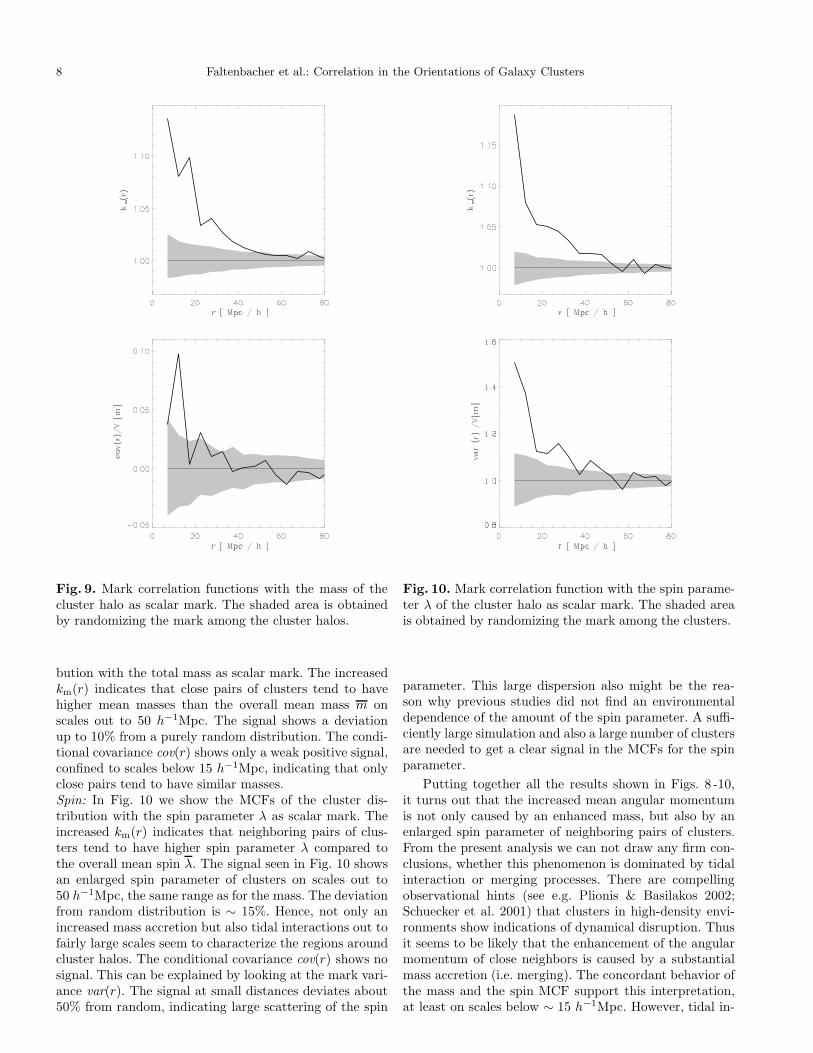
There are two possibilities to explain this behavior. Onthe one hand the mean mass of a close cluster pair couldbe enhanced, and so the absolute value of the angularmomentum would grow simply due to the fact that biggerclusters are under consideration. Indeed, Gottlober et al.(2002) found such an increase in the mean mass in closepairs (in their case traced by the maximum circular veloc-ity of the halo). Consistently Beisbart & Kerscher (2000)report an enhanced luminosity for close galaxy pairs. Onthe other hand, the rotational support of close cluster pairscould be higher, meaning that the spin parameter λ is en-hanced, cp. Eq. (1). To illustrate this further, we investi-gate the MCFs with the mass and the spin parameter asmarks:Mass: In Fig. 9 we show the MCFs of the cluster distri-
8 Faltenbacher et al.: Correlation in the Orientations of Galaxy Clusters
Fig. 9. Mark correlation functions with the mass of thecluster halo as scalar mark. The shaded area is obtainedby randomizing the mark among the cluster halos.
bution with the total mass as scalar mark. The increasedkm(r) indicates that close pairs of clusters tend to havehigher mean masses than the overall mean mass m onscales out to 50 h−1Mpc. The signal shows a deviationup to 10% from a purely random distribution. The condi-tional covariance cov(r) shows only a weak positive signal,confined to scales below 15 h−1Mpc, indicating that onlyclose pairs tend to have similar masses.Spin: In Fig. 10 we show the MCFs of the cluster dis-tribution with the spin parameter λ as scalar mark. Theincreased km(r) indicates that neighboring pairs of clus-ters tend to have higher spin parameter λ compared tothe overall mean spin λ. The signal seen in Fig. 10 showsan enlarged spin parameter of clusters on scales out to50 h−1Mpc, the same range as for the mass. The deviationfrom random distribution is ∼ 15%. Hence, not only anincreased mass accretion but also tidal interactions out tofairly large scales seem to characterize the regions aroundcluster halos. The conditional covariance cov(r) shows nosignal. This can be explained by looking at the mark vari-ance var(r). The signal at small distances deviates about50% from random, indicating large scattering of the spin
Fig. 10. Mark correlation function with the spin parame-ter λ of the cluster halo as scalar mark. The shaded areais obtained by randomizing the mark among the clusters.
parameter. This large dispersion also might be the rea-son why previous studies did not find an environmentaldependence of the amount of the spin parameter. A suffi-ciently large simulation and also a large number of clustersare needed to get a clear signal in the MCFs for the spinparameter.
Putting together all the results shown in Figs. 8 -10,it turns out that the increased mean angular momentumis not only caused by an enhanced mass, but also by anenlarged spin parameter of neighboring pairs of clusters.From the present analysis we can not draw any firm con-clusions, whether this phenomenon is dominated by tidalinteraction or merging processes. There are compellingobservational hints (see e.g. Plionis & Basilakos 2002;Schuecker et al. 2001) that clusters in high-density envi-ronments show indications of dynamical disruption. Thusit seems to be likely that the enhancement of the angularmomentum of close neighbors is caused by a substantialmass accretion (i.e. merging). The concordant behavior ofthe mass and the spin MCF support this interpretation,at least on scales below ∼ 15 h−1Mpc. However, tidal in-

Faltenbacher et al.: Correlation in the Orientations of Galaxy Clusters 9
teractions could be the cause for the correlations seen onlarge scales.
6. Summary
Whether there exist correlations in the orientations ofgalaxies or galaxy clusters has been discussed for a longtime. Binggeli (1982) reported a significant alignment ofthe observed galaxy clusters out to 50 h−1Mpc. Struble &Peebles (1985, 1986) claimed that this effect is small andprone to systematics and Ulmer et al. (1989) find no indi-cation in their investigation. Subsequently, several authorsfound, sometimes only weak, signs of alignments in thegalaxy and galaxy cluster distribution (see e.g. Djorgovski1986; Lambas et al. 1988; Fuller et al. 1999; Heavens et al.2000). As a novel statistical method we have used themark correlation functions (MCFs) to quantify the align-ment of cluster sized halos, extracted from a large scalesimulation based on a ΛCDM cosmology. Our sample with3000 cluster sized halos is bigger than the currently avail-able samples of galaxy clusters. The unambiguous signalwe obtain benefits from the large statistics in our simula-tion.
Using two different weighting functions in the con-struction of the MCFs we investigate the direct align-ment and the filamentary alignment. First we use themajor axis of the mass ellipsoid as our direction marker.The clear signal from the direct alignment A(r) extendsout ∼ 30 h−1Mpc. For the filamentary alignment F(r)we find deviations from isotropy up to ∼ 100 h−1Mpc.Considering the projected mass distribution, the signalfrom the direct alignment A(r) already vanishes at a scaleof ∼ 10 h−1Mpc. However, we find a filamentary align-ment F(r) out to scales of ∼ 100 h−1Mpc, even for theprojected data. This scale is very similar to the size ofthe large scale filaments seen in our simulation. We thinkthat the function F(r) is a powerful tool for exploringlarge scale alignment effects also in observational data.
Franx et al. (1991) showed that the angular momentumof an ellipsoidal system tends to align with the minor axisof this system. We confirm this behavior in our simulation.With the angular momentum as vector mark, F(r) showsthe expected filamentary correlations: the angular momen-tum tends to be perpendicular to the connecting line, i.e.the filament, up to separations of ∼ 40 h−1Mpc. However,we obtain no signal for the direct alignment A(r). This isin concordance with the perception that the angular mo-menta are randomly oriented in the planes perpendicularto the filaments.
With the scalar MCFs km(r) and cov(r) we have inves-tigated the correlations in the absolute value of the angu-lar momentum. Close pairs of clusters tend to have similarand also higher absolute values of the angular momentumcompared to the global average. A clear signal can be de-tected up to ∼ 50 h−1Mpc. A further analysis of the massand spin parameter distribution of the clusters with theMCFs has shown that this enhancement of the absolutevalue of the angular momentum is caused by an enhanced
mass of close pairs of clusters as well as by the stronger ro-tational support of them. This behavior should be causedby the combined action of large-scale tidal fields and thehierarchical merging of progenitor structures and mass in-flow onto the cluster. Since this mass growth follows thelarge scale filaments, tidal interactions and merger eventsare tightly connected. The mark correlation function withscalar and vector marks deliver quantitative measures ofthese effects.
Acknowledgments
M.K. was supported by the Sonderforschungsbereich 375fur Astro–Teilchenphysik der Deutschen Forschungsge-meinschaft.
References
Beisbart, C. & Kerscher, M. 2000, ApJ, 545, 6Beisbart, C., Kerscher, M., & Mecke, K. 2002, to ap-
pear in: Lecture Notes in Physics, second Wuppertalconference ”Spatial statistics and statistical physics”,physics/0201069
Binggeli, B. 1982, A&A, 107, 338Binney, J. & Silk, J. 1979, MNRAS, 188, 273Binney, J. & Tremaine, S. 1987, Galactic dynamics
(Princeton, NJ, Princeton University Press, 1987, 747p.)
Bohringer, H., Guzzo, L., Collins, C., et al. 1998, ESOMessenger, 21
Chambers, S., Melott, A., & Miller, C. 2000, ApJ, 544,104
Colberg, J. M., White, S. D. M., Yoshida, N., et al. 2000,MNRAS, 319, 209
Cole, S. & Lacey, C. 1996, MNRAS, 281, 716Collins, C., Guzzo, L., Bohringer, H., et al. 2000, MNRAS,
319, 939Cooray, A. R. 2000, MNRAS, 313, 783Couchman, H. 1991, ApJ, 368, L23Cressie, N. 1991, Statistics for spatial Data (Chichester:
John Wiley & Sons)Djorgovski, S. 1986, in Nearly Normal Galaxies, ed. S. M.
Faber, 225Doroshkevich, A. G. 1973, Ap. J. Lett., 14, 11Flin, P. 1987, MNRAS, 228, 941Fong, R., Stevenson, P., & Shanks, T. 1990, MNRAS, 242,
146Franx, M., Illingworth, G., & de Zeeuw, T. 1991, ApJ,
383, 112Fuller, T. M., West, M. J., & Bridges, T. J. 1999, ApJ,
519, 22Gottlober, S., Kerscher, M., Kravtsov, A., Faltenbacher,
A., & Muller, V. 2002, A&A, in press, astro-ph/0203148Gottlober, S., Klypin, A. A., & Kravtsov, A. V. 2001, ApJ,
546, 223Heavens, A. F., Refregier, A., & Heymans, C. 2000,
MNRAS, 319, 649

10 Faltenbacher et al.: Correlation in the Orientations of Galaxy Clusters
Huchra, J. P., Geller, M. J., De Lapparent, V., &Corwin Jr., H. G. 1990, ApJS, 72, 433
Katgert, P., Mazure, A., Perea, J., et al. 1996, A&A, 310,8
Kitayama, T. & Suto, Y. 1996, ApJ, 469, 480Knebe, A., Kravtsov, A. V., Gottlober, S., & Klypin, A. A.
2000, MNRAS, 317, 630Knebe, A. & Muller, V. 1999, A&A, 341, 1Lambas, D. G., Groth, E. J., & Peebles, P. 1988, AJ, 95,
975Martin, D., Nichol, R., Collins, C., Lumsden, S., & Guzzo,
L. 1995, MNRAS, 274, 623Melott, A. L. & Shandarin, S. F. 1990, Nature, 346, 633Onuora, L. I. & Thomas, P. A. 2000, MNRAS, 319, 614Padmanabhan, T. 1993, Structure formation in the
Universe (Cambridge: Cambridge University Press)Plionis, M. 1994, ApJS, 95, 401Plionis, M. & Basilakos, S. 2002, MNRAS, 329, L47Porciani, C., Dekel, A., & Hoffman, Y. 2002a, ApJ, 332,
325—. 2002b, ApJ, 332, 339Rhee, G. & Katgert, P. 1987, A&A, 183, 217Rhee, G. & Latour, H. 1991, A&A, 243, 38Schuecker, P., Bohringer, H., Reiprich, T. H., & Feretti,
L. 2001, AA, 378, 408Seljak, U. & Zaldarriaga, M. 1996, ApJ, 469, 437Stoyan, D. 1984, Math. Nachr., 116, 197Stoyan, D. & Stoyan, H. 1994, Fractals, Random Shapes
and Point Fields (Chichester: John Wiley & Sons)Struble, M. F. & Peebles, P. 1985, AJ, 90, 582—. 1986, AJ, 91, 1474Szapudi, I., Branchini, E., Frenk, C., Maddox, S., &
Saunders, W. 2000, MNRAS, 318, L45Ulmer, M., McMillan, S. L. W., & Kowalski, M. P. 1989,
ApJ, 338, 711van Haarlem, M. P., Frenk, C. S., & White, S. D. M. 1997,
MNRAS, 287, 817Vitvitska, M., Klypin, A., Kravtsov, A., et al. 2001, astro-
ph/0105349West, M. J. 1994, MNRAS, 268, 79White, S. D. M. 1984, ApJ, 286, 38
Copyright © 2022 FDOKUMEN